Embed Size (px)
Citation preview

RACE AND ETHNICITY OF ADULTS WHO
IDENTIFY AS TRANSGENDER IN THE UNITED STATESAndrew R. Flores, Taylor N. T. Brown, Jody L. Herman
OCTOBER 2016

RACE AND ETHNICITY OF ADULTS WHO IDENTIFY AS TRANSGENDER IN THE UNITED STATES | 2
INTRODUCTION AND SUMMARY
Data sources that describe the race and ethnicity of adults who identify as transgender in the United States are limited. National population-based surveys, like the American Community Survey, are the best sources to provide generalizable findings on the demographics of U.S. residents. Yet, these surveys have rarely included measures of gender identity that would allow researchers to identify transgender respondents. Therefore, there is limited information on the demographics of this population. However, some representative, state-level surveys do collect this information. In this report, we utilize data from state-level, population-based surveys to estimate the racial and ethnic composition of adults who identify as transgender in the United States. This report is part of a series of Williams Institute reports in which we provide new estimates about the size and basic demographic characteristics of the population of adults who identify as transgender in the U.S. and all 50 states, plus the District of Columbia.1
Existing research that has utilized non-representative samples, such as from clinical or convenience samples, have varying findings about the racial and ethnic identities of transgender individuals. The National Transgender Discrimination Survey, for example, which surveyed the largest sample of transgender individuals in the U.S., prior to the 2015 U.S. Trans Survey, found that 83% of respondents identified as White, a much larger percentage than in the U.S. general population.2 Other non-representative samples have found that transgender respondents were more likely to identify as people of color than the U.S. general population. 3,4 One of the few studies to have drawn on representative, state-level data, found that in Massachusetts adults who identify as transgender are significantly less likely to identify as White and more likely to identify as Latino or Hispanic than the non-transgender adult population.5
In this report, we utilize data from the CDC’s Behavioral Risk Factor Surveillance System (BRFSS), a national, state-administered survey, which collected data on transgender identity among adults in 19 states for the first time in 2014.6 With these data, we previously estimated that 0.6% of the U.S. adult population identifies as transgender, or 1.4 million adults.7 In this report, we find that the population of adults who identify as transgender is more racially and ethnically diverse than the U.S. general population. We estimate that, among adults who identify as transgender nationally, 55% identify as White, 16% identify as African-American or Black, 21% identify as Latino or Hispanic, and 8% identify as another race or ethnicity.8 We find that adults who are African-American or Black (0.8%), Latino or Hispanic (0.8%), and of another race or ethnicity (0.6%) are more likely than White adults (0.5%) to identify as transgender. The estimates are based on a modelling strategy and are comparable to weighted and unadjusted estimates.
Transgender-Identi�ed AdultsAdult General Population
66%
55%
12%16%
21%15%
8% 8%
White,non-Hispanic
African-American orBlack, non-Hispanic
Hispanic or Latino Other Race orEthnicity, non-Hispanic
Figure 1. Estimated Percentage of the Population by Race and Ethnicity for the Adult General Population and Trangender-Identified Adults

RACE AND ETHNICITY OF ADULTS WHO IDENTIFY AS TRANSGENDER IN THE UNITED STATES | 3
RACE AND ETHNICITY OF ADULTS WHO IDENTIFY AS TRANSGENDER IN THE UNITED STATES
In this report, we consider the racial and ethnic composition of adults who identify as transgender in two ways: the percentage of transgender adults who identify with each racial or ethnic group and the percentage out of each racial or ethnic group that identifies as transgender. In Table 1, the percentage of transgender adults who identify with each racial and ethnic category is provided alongside the general adult population for the U.S. and for each state, plus the District of Columbia. We categorized the racial and ethnic groups to be consistent across the data sources utilized in this report (i.e., BRFSS and the American Community Survey). Due to sample size limitations, several groups are combined in the “Other Race or Ethnicity, non-Hispanic” category, including people who are Asian or Pacific Islander, American Indian or Alaska Native, biracial or multiracial, and other racial and ethnic groups. Based on these estimates, we find that adults who identify as transgender are less likely to be White and more likely to be African-American or Black and Hispanic or Latino than the U.S. general population.
Table 1. Estimated Percentage of the Population by Race and Ethnicity for the Adult General Population and Transgender-Identified Adults
White, non-Hispanic African-American or Black, non-Hispanic
Hispanic or Latino Other Race or Ethnicity, non-Hispanic
State Adult General
Population
Transgender-Identified
Adults
Adult General
Population
Transgender-Identified
Adults
Adult General
Population
Transgender-Identified
Adults
Adult General
Population
Transgender-Identified
Adults
United States of America
66% 55% 12% 16% 15% 21% 8% 8%
Alabama 69% 60% 25% 32% 3% 4% 3% 3%
Alaska 67% 57% 3% 4% 5% 6% 24% 32%
Arizona 62% 51% 4% 5% 26% 35% 8% 9%
Arkansas 77% 70% 14% 19% 5% 8% 3% 4%
California 43% 32% 6% 7% 34% 45% 17% 16%
Colorado 73% 62% 4% 5% 18% 26% 5% 6%
Connecticut 73% 63% 9% 13% 12% 18% 6% 6%
Delaware 68% 59% 20% 26% 7% 10% 5% 5%
District of Columbia
39% 22% 46% 62% 9% 11% 6% 5%
Florida 60% 50% 14% 19% 22% 26% 4% 4%
Georgia 58% 48% 29% 36% 8% 10% 5% 5%
Hawaii 26% 19% 2% 2% 8% 9% 65% 70%
Idaho 86% 80% < 1% 1% 9% 14% 4% 5%
Illinois 66% 56% 14% 18% 14% 20% 6% 6%
Indiana 83% 78% 8% 11% 5% 7% 3% 3%
Iowa 90% 86% 3% 4% 4% 6% 3% 4%
Kansas 81% 73% 5% 7% 9% 13% 5% 6%

RACE AND ETHNICITY OF ADULTS WHO IDENTIFY AS TRANSGENDER IN THE UNITED STATES | 4
White, non-Hispanic African-American or Black, non-Hispanic
Hispanic or Latino Other Race or Ethnicity, non-Hispanic
State Adult General
Population
Transgender-Identified
Adults
Adult General
Population
Transgender-Identified
Adults
Adult General
Population
Transgender-Identified
Adults
Adult General
Population
Transgender-Identified
Adults
Kentucky 88% 84% 8% 10% 3% 3% 2% 3%
Louisiana 62% 52% 30% 39% 4% 5% 3% 4%
Maine 95% 94% 1% 1% 1% 1% 3% 4%
Maryland 56% 46% 28% 35% 8% 10% 8% 8%
Massachusetts 78% 70% 6% 9% 9% 13% 8% 9%
Michigan 79% 72% 13% 18% 4% 5% 5% 5%
Minnesota 85% 79% 5% 7% 4% 6% 6% 8%
Mississippi 60% 50% 35% 44% 2% 3% 2% 2%
Missouri 83% 77% 11% 15% 3% 4% 4% 4%
Montana 89% 85% < 1% < 1% 3% 4% 8% 11%
Nebraska 84% 77% 4% 6% 8% 12% 4% 5%
Nevada 57% 47% 8% 10% 23% 31% 12% 12%
New Hampshire
93% 91% 1% 1% 2% 3% 4% 4%
New Jersey 60% 51% 12% 16% 17% 23% 10% 9%
New Mexico 44% 33% 2% 2% 43% 52% 11% 13%
New York 59% 49% 14% 18% 17% 22% 10% 11%
North Carolina 68% 58% 21% 27% 7% 10% 5% 5%
North Dakota 90% 86% 1% 2% 2% 3% 7% 9%
Ohio 83% 77% 11% 16% 3% 4% 3% 4%
Oklahoma 72% 64% 7% 9% 7% 11% 14% 16%
Oregon 81% 74% 2% 2% 10% 14% 8% 9%
Pennsylvania 81% 75% 10% 14% 5% 7% 4% 4%
Rhode Island 79% 71% 5% 6% 11% 16% 6% 7%
South Carolina 67% 56% 26% 35% 4% 6% 3% 3%
South Dakota 87% 81% 1% 2% 3% 4% 10% 13%
Tennessee 77% 71% 16% 21% 4% 5% 3% 3%
Texas 49% 37% 12% 13% 34% 44% 6% 5%
Utah 82% 75% 1% 1% 12% 17% 5% 7%
Vermont 95% 93% 1% 1% 1% 2% 3% 4%
Virginia 66% 57% 19% 25% 7% 10% 8% 8%
Washington 75% 67% 3% 5% 9% 14% 12% 14%
West Virginia 94% 92% 3% 4% 1% 1% 2% 2%
Wisconsin 86% 80% 5% 8% 5% 7% 4% 5%
Wyoming 87% 82% 1% 1% 8% 11% 4% 5%

RACE AND ETHNICITY OF ADULTS WHO IDENTIFY AS TRANSGENDER IN THE UNITED STATES | 5
The following figures provide a visual representation of the percentage of transgender adults who identify as each race or ethnicity out of the total transgender-identified adult population of each state. These figures demonstrate that broader racial and ethnic demographic patterns in the U.S., such as a higher percentage of Latinos in the Southwest, are similar to the racial and ethnic demographic patterns of U.S. adults who identify as transgender.
Figure 2. Percentage of Transgender-Identified Adults who are White, non-Hispanic
90%
80%
70%
60%
50%
40%
30%
20%
Figure 3. Percentage of Transgender-Identified Adults who are African-American or Black, non-Hispanic
60%
50%
40%
30%
20%
10%

RACE AND ETHNICITY OF ADULTS WHO IDENTIFY AS TRANSGENDER IN THE UNITED STATES | 6
Figure 4. Percentage of Transgender-Identified Adults who are Latino or Hispanic
50%
40%
30%
20%
10%
0%
Figure 5. Percentage of Transgender-Identified Adults who are Other Race or Ethnicity, non-Hispanic
70%
60%
50%
40%
30%
20%
10%

RACE AND ETHNICITY OF ADULTS WHO IDENTIFY AS TRANSGENDER IN THE UNITED STATES | 7
Considering the racial and ethnic composition of the transgender population in another way, we find that there are differences in the percentage of adults who identify as transgender depending on their race or ethnicity. We estimate that 0.5% of White adults identify as transgender, as do 0.8% of African-American or Black adults, 0.8% of Latino or Hispanic adults, and 0.6 % of adults of other races and ethnicities.
Estimates of the percentage of adults who identify as transgender by race vary among the states. The percentage of White adult residents who identify as transgender ranges from 0.3% in North Dakota to 0.6% in Georgia. The percentage of African-American or Black adult residents who identify as transgender ranges from 0.4% in Montana and North Dakota to 0.9% in Georgia. The percentage of Latino or Hispanic adult residents who identify as transgender ranges from 0.4% in North Dakota to 1.0% in Georgia. The percentage of adult residents of other races or ethnicities who identify as transgender ranges from 0.4% in Iowa to 0.9% in New Mexico. The District of Columbia is notable for having the highest proportion of adult residents who identify as transgender among each racial and ethnic group represented in the report: White (1.6%), African-American or Black (3.7%), Latino or Hispanic (3.4%), and adults who identify as another race or ethnicity (2.5%).9
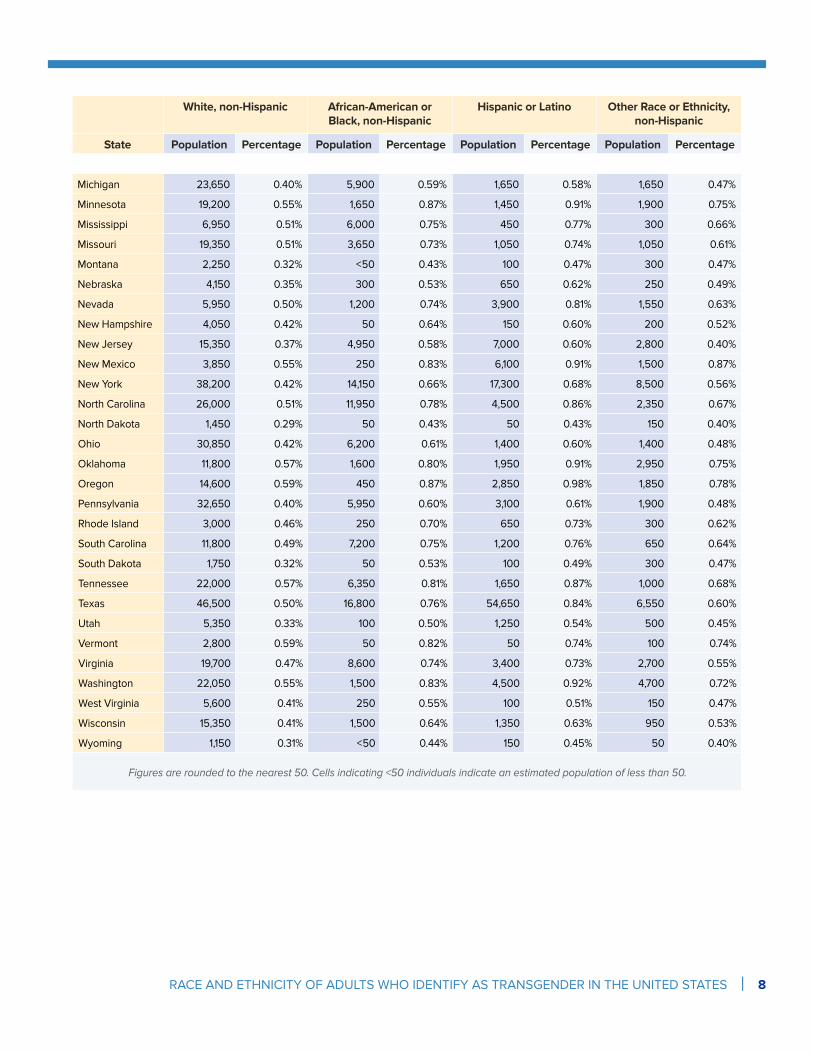
Table 2. Estimated Number and Percentage of Adults who Identify as Transgender by Race and Ethnicity
White, non-Hispanic African-American or Black, non-Hispanic
Hispanic or Latino Other Race or Ethnicity, non-Hispanic
State Population Percentage Population Percentage Population Percentage Population Percentage
United States of America
761,150 0.48% 217,800 0.77% 296,950 0.84% 115,950 0.64%
Alabama 13,550 0.53% 7,300 0.78% 1,000 0.82% 650 0.63%
Alaska 1,550 0.42% 100 0.62% 150 0.58% 850 0.66%
Arizona 15,450 0.50% 1,400 0.75% 10,700 0.84% 2,900 0.72%
Arkansas 9,350 0.54% 2,550 0.78% 1,000 0.85% 500 0.67%
California 70,200 0.56% 14,500 0.87% 97,100 1.00% 35,850 0.73%
Colorado 13,050 0.45% 1,050 0.71% 5,450 0.77% 1,300 0.62%
Connecticut 7,800 0.38% 1,600 0.62% 2,200 0.64% 700 0.46%
Delaware 2,700 0.56% 1,200 0.83% 450 0.87% 200 0.61%
District of Columbia
3,150 1.56% 9,000 3.71% 1,600 3.35% 800 2.48%
Florida 50,300 0.55% 18,650 0.86% 26,250 0.78% 4,300 0.68%
Georgia 27,100 0.63% 20,050 0.92% 5,750 1.02% 2,750 0.74%
Hawaii 1,600 0.58% 150 0.83% 750 0.88% 5,950 0.85%
Idaho 3,800 0.38% 50 0.51% 700 0.62% 250 0.51%
Illinois 27,800 0.43% 8,900 0.66% 9,700 0.71% 2,950 0.48%
Indiana 21,500 0.52% 3,150 0.75% 1,950 0.78% 950 0.61%
Iowa 6,350 0.30% 250 0.44% 450 0.48% 300 0.37%
Kansas 6,800 0.39% 700 0.59% 1,250 0.64% 550 0.51%
Kentucky 14,850 0.50% 1,750 0.70% 600 0.71% 450 0.57%
Louisiana 10,950 0.51% 8,050 0.77% 1,050 0.72% 750 0.65%
Maine 5,000 0.49% 50 0.76% 50 0.65% 200 0.66%
Maryland 10,300 0.40% 7,900 0.62% 2,300 0.66% 1,700 0.48%
Massachusetts 20,700 0.51% 2,550 0.81% 3,800 0.83% 2,650 0.66%
RACE AND ETHNICITY OF ADULTS WHO IDENTIFY AS TRANSGENDER IN THE UNITED STATES | 8
White, non-Hispanic African-American or Black, non-Hispanic
Hispanic or Latino Other Race or Ethnicity, non-Hispanic
State Population Percentage Population Percentage Population Percentage Population Percentage
Michigan 23,650 0.40% 5,900 0.59% 1,650 0.58% 1,650 0.47%
Minnesota 19,200 0.55% 1,650 0.87% 1,450 0.91% 1,900 0.75%
Mississippi 6,950 0.51% 6,000 0.75% 450 0.77% 300 0.66%
Missouri 19,350 0.51% 3,650 0.73% 1,050 0.74% 1,050 0.61%
Montana 2,250 0.32% < 50 0.43% 100 0.47% 300 0.47%
Nebraska 4,150 0.35% 300 0.53% 650 0.62% 250 0.49%
Nevada 5,950 0.50% 1,200 0.74% 3,900 0.81% 1,550 0.63%
New Hampshire 4,050 0.42% 50 0.64% 150 0.60% 200 0.52%
New Jersey 15,350 0.37% 4,950 0.58% 7,000 0.60% 2,800 0.40%
New Mexico 3,850 0.55% 250 0.83% 6,100 0.91% 1,500 0.87%
New York 38,200 0.42% 14,150 0.66% 17,300 0.68% 8,500 0.56%
North Carolina 26,000 0.51% 11,950 0.78% 4,500 0.86% 2,350 0.67%
North Dakota 1,450 0.29% 50 0.43% 50 0.43% 150 0.40%
Ohio 30,850 0.42% 6,200 0.61% 1,400 0.60% 1,400 0.48%
Oklahoma 11,800 0.57% 1,600 0.80% 1,950 0.91% 2,950 0.75%
Oregon 14,600 0.59% 450 0.87% 2,850 0.98% 1,850 0.78%
Pennsylvania 32,650 0.40% 5,950 0.60% 3,100 0.61% 1,900 0.48%
Rhode Island 3,000 0.46% 250 0.70% 650 0.73% 300 0.62%
South Carolina 11,800 0.49% 7,200 0.75% 1,200 0.76% 650 0.64%
South Dakota 1,750 0.32% 50 0.53% 100 0.49% 300 0.47%
Tennessee 22,000 0.57% 6,350 0.81% 1,650 0.87% 1,000 0.68%
Texas 46,500 0.50% 16,800 0.76% 54,650 0.84% 6,550 0.60%
Utah 5,350 0.33% 100 0.50% 1,250 0.54% 500 0.45%
Vermont 2,800 0.59% 50 0.82% 50 0.74% 100 0.74%
Virginia 19,700 0.47% 8,600 0.74% 3,400 0.73% 2,700 0.55%
Washington 22,050 0.55% 1,500 0.83% 4,500 0.92% 4,700 0.72%
West Virginia 5,600 0.41% 250 0.55% 100 0.51% 150 0.47%
Wisconsin 15,350 0.41% 1,500 0.64% 1,350 0.63% 950 0.53%
Wyoming 1,150 0.31% < 50 0.44% 150 0.45% 50 0.40%
Figures are rounded to the nearest 50. Cells indicating <50 individuals indicate an estimated population of less than 50.

RACE AND ETHNICITY OF ADULTS WHO IDENTIFY AS TRANSGENDER IN THE UNITED STATES | 9
DISCUSSION
In this report, we utilized innovative methods to estimate the racial and ethnic composition of the transgender adult population for all 50 states and the District of Columbia. We find that adults who identify as transgender are more racially and ethnically diverse than the U.S. population. Further research is needed to understand why there is more racial and ethnic diversity among those who identify as transgender.
Since 2014, additional states have included the standardized measure of transgender identity on their state BRFSS questionnaires. As data from these and other large-scale, representative surveys become available, we will be able to further develop our understanding of race and ethnicity among transgender individuals in the United States.

RACE AND ETHNICITY OF ADULTS WHO IDENTIFY AS TRANSGENDER IN THE UNITED STATES | 10
APPENDIX
METHOD NOTEThe Behavioral Risk Factor Surveillance System (BRFSS) collects state-specific data on health-related factors across the 50 states, the District of Columbia, and the territories of the United States. The survey is designed to be representative within each state. The survey is conducted by an interviewer via landline and cellular telephone. The national response rate for the 2014 BRFSS was 48.7% for landline telephones and 40.5% for cellular telephones (American Association of Public Opinion Research, Response Rate calculation 4).
The BRFSS contains optional module questionnaires in addition to its standard questionnaire for each state.10 The 2014 BRFSS had 19 optional modules that states were able to opt-into. One of the modules contained the following question:
Do you consider yourself to be transgender?
YES
NO
[If YES] Do you consider yourself to be male-to-female, female-to-male, or gender non- conforming?
If the interviewer is asked for a definition of transgender, they respond:
Some people describe themselves as transgender when they experience a different gender identity from their sex at birth. For example, a person born into a male body, but who feels female or lives as a woman would be transgender. Some transgender people change their physical appearance so that it matches their internal gender identity. Some transgender people take hormones and some have surgery. A transgender person may be of any sexual orientation – straight, gay, lesbian, or bisexual.
Since this question is included in an optional module, some states did not ask this question while others did. The 19 states that did ask this question in 2014 include: Delaware, Hawaii, Iowa, Idaho, Indiana, Kansas, Kentucky, Louisiana, Maryland, Minnesota, Montana, Nevada, New York, Ohio, Pennsylvania, Virginia, Vermont, Wisconsin, and Wyoming. In total, 0.52% of BRFSS respondents in these states identified as transgender, and 151,456 respondents answered this question.
To estimate the population by state, we relied on multilevel regression and post-stratification.11 The method fits multilevel logistic regression to the data to predict the likelihood that an individual identifies as transgender relying on demographic attributes about the respondents (e.g., race and ethnicity; age cohorts; and educational attainment). State and regional characteristics were accounted for and state-level characteristics were included to add information about how states differ from one another (e.g., racial composition, median income, percentage of households that are of same-sex couples, and percentage of the population that identifies as Evangelical). This method has been applied to measure statewide political attitudes,12 to measure Jewish populations,13 and to measure the population of individuals who identify as transgender.14 Further, the estimation strategy has undergone rigorous evaluation by other scholars, and these evaluations often show the method produces reliable and valid estimates.15 While the estimation approach is not without its criticisms,16 the method remains the best available approach to perform this estimation procedure.
We extend the application of the estimation technique by incorporating all of the states in the BRFSS, even though respondents in only 19 states received the gender identity question. By doing so, we impute the states that did not ask the gender identity question by modeling the probability that a respondent identifies as transgender. The hierarchical model still incorporates the statewide covariates to increase precision in the estimation. All
RACE AND ETHNICITY OF ADULTS WHO IDENTIFY AS TRANSGENDER IN THE UNITED STATES | 11
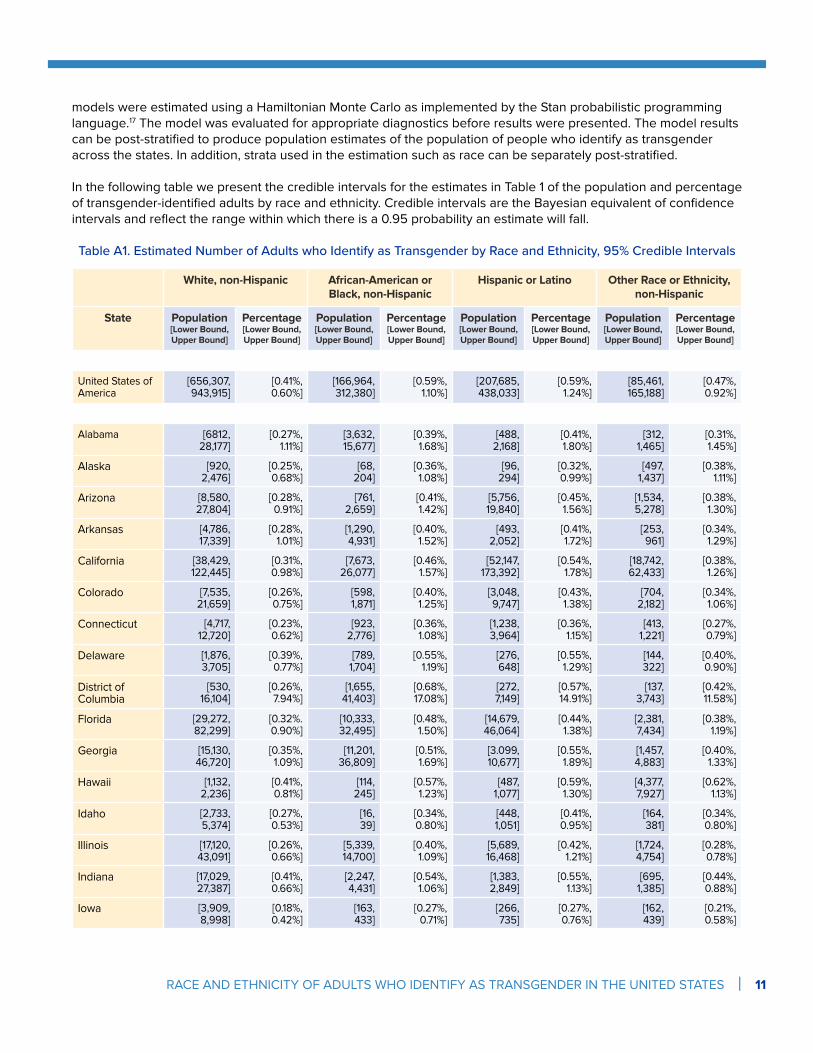
models were estimated using a Hamiltonian Monte Carlo as implemented by the Stan probabilistic programming language.17 The model was evaluated for appropriate diagnostics before results were presented. The model results can be post-stratified to produce population estimates of the population of people who identify as transgender across the states. In addition, strata used in the estimation such as race can be separately post-stratified.
In the following table we present the credible intervals for the estimates in Table 1 of the population and percentage of transgender-identified adults by race and ethnicity. Credible intervals are the Bayesian equivalent of confidence intervals and reflect the range within which there is a 0.95 probability an estimate will fall.
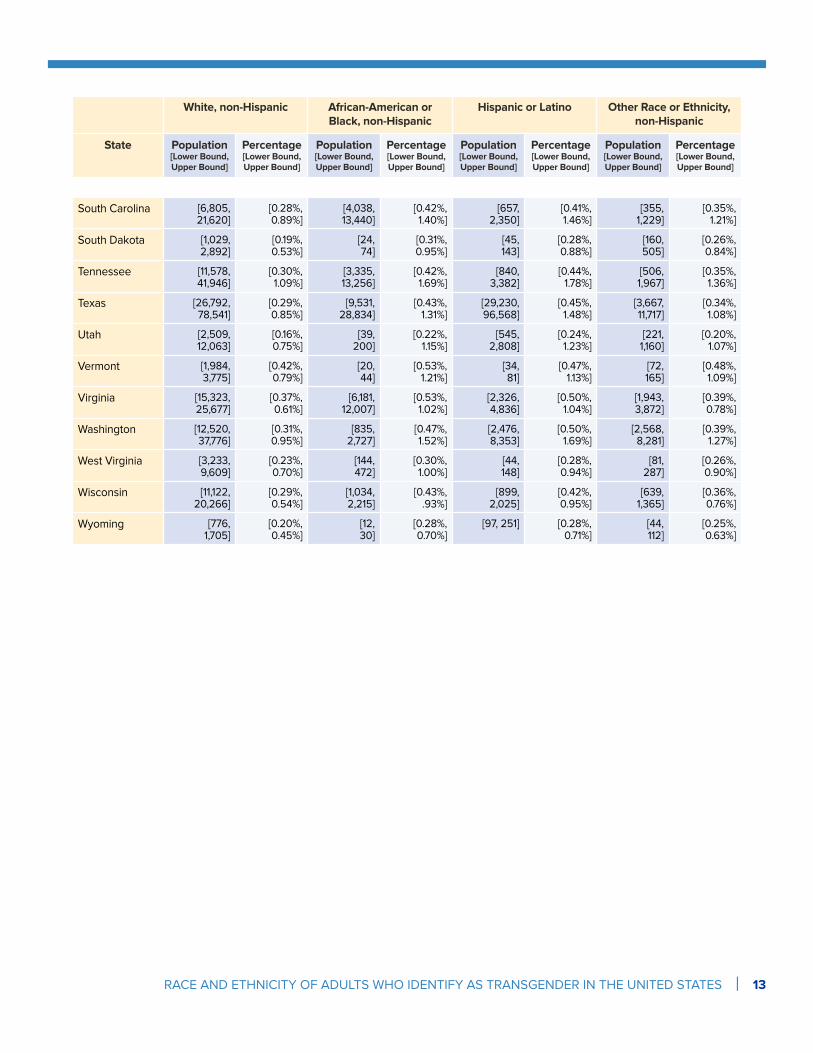
Table A1. Estimated Number of Adults who Identify as Transgender by Race and Ethnicity, 95% Credible Intervals
White, non-Hispanic African-American or Black, non-Hispanic
Hispanic or Latino Other Race or Ethnicity, non-Hispanic
State Population[Lower Bound, Upper Bound]
Percentage[Lower Bound, Upper Bound]
Population[Lower Bound, Upper Bound]
Percentage[Lower Bound, Upper Bound]
Population[Lower Bound, Upper Bound]
Percentage[Lower Bound, Upper Bound]
Population[Lower Bound, Upper Bound]
Percentage[Lower Bound, Upper Bound]
United States of America
[656,307, 943,915]
[0.41%, 0.60%]
[166,964, 312,380]
[0.59%, 1.10%]
[207,685, 438,033]
[0.59%, 1.24%]
[85,461, 165,188]
[0.47%, 0.92%]
Alabama [6812, 28,177]
[0.27%, 1.11%]
[3,632, 15,677]
[0.39%, 1.68%]
[488, 2,168]
[0.41%, 1.80%]
[312, 1,465]
[0.31%, 1.45%]
Alaska [920, 2,476]
[0.25%, 0.68%]
[68, 204]
[0.36%, 1.08%]
[96, 294]
[0.32%, 0.99%]
[497, 1,437]
[0.38%, 1.11%]
Arizona [8,580, 27,804]
[0.28%, 0.91%]
[761, 2,659]
[0.41%, 1.42%]
[5,756, 19,840]
[0.45%, 1.56%]
[1,534, 5,278]
[0.38%, 1.30%]
Arkansas [4,786, 17,339]
[0.28%, 1.01%]
[1,290, 4,931]
[0.40%, 1.52%]
[493, 2,052]
[0.41%, 1.72%]
[253, 961]
[0.34%, 1.29%]
California [38,429, 122,445]
[0.31%, 0.98%]
[7,673, 26,077]
[0.46%, 1.57%]
[52,147, 173,392]
[0.54%, 1.78%]
[18,742, 62,433]
[0.38%, 1.26%]
Colorado [7,535, 21,659]
[0.26%, 0.75%]
[598, 1,871]
[0.40%, 1.25%]
[3,048, 9,747]
[0.43%, 1.38%]
[704, 2,182]
[0.34%, 1.06%]
Connecticut [4,717, 12,720]
[0.23%, 0.62%]
[923, 2,776]
[0.36%, 1.08%]
[1,238, 3,964]
[0.36%, 1.15%]
[413, 1,221]
[0.27%, 0.79%]
Delaware [1,876, 3,705]
[0.39%, 0.77%]
[789, 1,704]
[0.55%, 1.19%]
[276, 648]
[0.55%, 1.29%]
[144, 322]
[0.40%, 0.90%]
District of Columbia
[530, 16,104]
[0.26%, 7.94%]
[1,655, 41,403]
[0.68%, 17.08%]
[272, 7,149]
[0.57%, 14.91%]
[137, 3,743]
[0.42%, 11.58%]
Florida [29,272, 82,299]
[0.32%. 0.90%]
[10,333, 32,495]
[0.48%, 1.50%]
[14,679, 46,064]
[0.44%, 1.38%]
[2,381, 7,434]
[0.38%, 1.19%]
Georgia [15,130, 46,720]
[0.35%, 1.09%]
[11,201, 36,809]
[0.51%, 1.69%]
[3.099, 10,677]
[0.55%, 1.89%]
[1,457, 4,883]
[0.40%, 1.33%]
Hawaii [1,132, 2,236]
[0.41%, 0.81%]
[114, 245]
[0.57%, 1.23%]
[487, 1,077]
[0.59%, 1.30%]
[4,377, 7,927]
[0.62%, 1.13%]
Idaho [2,733, 5,374]
[0.27%, 0.53%]
[16, 39]
[0.34%, 0.80%]
[448, 1,051]
[0.41%, 0.95%]
[164, 381]
[0.34%, 0.80%]
Illinois [17,120, 43,091]
[0.26%, 0.66%]
[5,339, 14,700]
[0.40%, 1.09%]
[5,689, 16,468]
[0.42%, 1.21%]
[1,724, 4,754]
[0.28%, 0.78%]
Indiana [17,029, 27,387]
[0.41%, 0.66%]
[2,247, 4,431]
[0.54%, 1.06%]
[1,383, 2,849]
[0.55%, 1.13%]
[695, 1,385]
[0.44%, 0.88%]
Iowa [3,909, 8,998]
[0.18%, 0.42%]
[163, 433]
[0.27%, 0.71%]
[266, 735]
[0.27%, 0.76%]
[162, 439]
[0.21%, 0.58%]

RACE AND ETHNICITY OF ADULTS WHO IDENTIFY AS TRANSGENDER IN THE UNITED STATES | 12
White, non-Hispanic African-American or Black, non-Hispanic
Hispanic or Latino Other Race or Ethnicity, non-Hispanic
State Population[Lower Bound, Upper Bound]
Percentage[Lower Bound, Upper Bound]
Population[Lower Bound, Upper Bound]
Percentage[Lower Bound, Upper Bound]
Population[Lower Bound, Upper Bound]
Percentage[Lower Bound, Upper Bound]
Population[Lower Bound, Upper Bound]
Percentage[Lower Bound, Upper Bound]
Kansas [5,237, 8,503]
[0.30%, 0.49%]
[482, 950]
[0.41%, 0.81%]
[858, 1,793]
[0.45%, 0.94%]
[402, 816]
[0.36%, 0.73%]
Kentucky [10,890, 19,372]
[0.37%, 0.66%]
[1,221, 2,513]
[0.48%, 0.99%]
[404, 908]
[0.47%, 1.05%]
[310, 661]
[0.39%, 0.83%]
Louisiana [8,058, 14,618]
[0.37%, 0.67%]
[5,791, 10,915]
[0.55%, 1.04%]
[712, 1,541]
[0.47%, 1.03%]
[509, 1,070]
[0.44%, 0.93%]
Maine [2,996, 8,281]
[0.30%, 0.82%]
[40, 124]
[0.44%, 1.38%]
[38, 122]
[0.36%, 1.16%]
[116, 363]
[0.38%, 1.18%]
Maryland [7,803, 13,194]
[0.31%, 0.52%]
[5,674, 10,801]
[0.44%, 0.84%]
[1,598, 3,312]
[0.46%, 0.95%]
[1,211, 2,403]
[0.34%, 0.67%]
Massachusetts [11,884, 34,081]
[0.29%, 0.84%]
[1,422, 4,351]
[0.45%, 1.39%]
[2,111, 6,813]
[0.46%, 1.49%]
[1,462, 4,722]
[0.36%, 1.17%]
Michigan [13,785, 37,514]
[0.23%, 0.63%]
[3,303, 9,906]
[0.33%, 0.98%]
[894, 2,835]
[0.32%, 1.00%]
[890, 2,747]
[0.26%, 0.79%]
Minnesota [15,411, 23,849]
[0.44%, 0.68%]
[1,178, 2,316]
[0.62%, 1.23%]
[1,013, 2,083]
[0.64%, 1.32%]
[1,344, 2,693]
[0.53%, 1.06%]
Mississippi [3,384, 13,464]
[0.25%, 1.00%]
[2,961, 12,563]
[0.37%, 1.59%]
[200, 917]
[0.36%, 1.64%]
[135, 569]
[0.32%, 1.34%]
Missouri [10,550, 33,523]
[0.28%, 0.88%]
[1,934, 6,764]
[0.39%, 1.36%]
[522, 1,902]
[0.37%, 1.36%]
[539, 1,896]
[0.32%, 1.12%]
Montana [1,607, 3,133]
[0.23%, 0.45%]
[5, 11]
[0.28%, 0.64%]
[62, 147]
[0.30%, 0.73%]
[191, 426]
[0.31%, 0.69%]
Nebraska [2,490, 6,268]
[0.21%, 0.53%]
[178, 497]
[0.31%, 0.87%]
[375, 1,090]
[0.35%, 1.02%]
[150, 426]
[0.29%, 0.82%]
Nevada [3,948, 8,520]
[0.33%, 0.71%]
[796, 1,822]
[0.47%, 1.11%]
[2,501, 5,927]
[0.51%, 1.22%]
[971, 2,327]
[0.40%, 0.95%]
New Hampshire [2,434, 6,689]
[0.25%, 0.69%]
[35, 104]
[0.37%, 1.10%]
[89, 270]
[0.34%, 1.04%]
[111, 347]
[0.30%, 0.92%]
New Jersey [9,112, 26,134]
[0.22%, 0.63%]
[2,838, 8,809]
[0.33%, 1.04%]
[3,980, 12,317]
[0.34%, 1.06%]
[1,611, 5,048]
[0.23%, 0.72]
New Mexico [2,180, 6,480]
[0.31%, 0.93%]
[133, 425]
[0.45%, 1.46%]
[3,282, 10,863]
[0.49%, 1.61%]
[824, 2,607] [0.48%, 1.52%]
New York [27,235, 50,945]
[0.30%, 0.56%]
[9,838, 20,318]
[0.46%, 0.95%]
[11,739, 25,421]
[0.46%, 0.99%]
[5,729, 12,162]
[0.38%, 0.81%]
North Carolina [15,076, 44,383]
[0.30%, 0.88%]
[6,902, 21,185]
[0.45%, 1.37%]
[2,435, 8,233]
[0.47%, 1.59%]
[1,333, 4,140]
[0.38%, 1.19%]
North Dakota [829, 2,382]
[0.17%, 0.48%]
[16, 52]
[0.24%, 0.79%]
[26, 89] [0.23%, 0.79%]
[82, 272]
[0.22%, 0.73%]
Ohio [23,691, 38,808]
[0.32%, 0.53%]
[4,401, 8,624]
[0.44%, 0.85%]
[974, 2,090]
[0.41%, 0.88%]
[989, 2,005]
[0.34%, 0.68%]
Oklahoma [5,733, 23,923]
[0.28%, 1.16%]
[768, 3,441]
[0.38%, 1.72%]
[919, 4,304]
[0.43%, 2.00%]
[1,416, 6,602]
[0.36%, 1.68%]
Oregon [7,918, 27,006]
[0.32%, 1.09%]
[226, 831]
[0.46%, 1.70%]
[1,516, 5,372]
[0.52%, 1.86%]
[995, 3,398]
[0.42%, 1.45%]
Pennsylvania [25,060, 42,296]
[0.31%, 0.52%]
[4,141, 8,601]
[0.42%, 0.87%]
[2,066, 4,601]
[0.41%, 0.91%]
[1,324, 2,793]
[0.33%, 0.69%]
Rhode Island [1,764, 4,977]
[0.27%, 0.76%]
[153, 464]
[0.39%, 1.20%]
[366, 1,198]
[0.40%, 1.31%]
[166, 513]
[0.35%, 1.07%]
RACE AND ETHNICITY OF ADULTS WHO IDENTIFY AS TRANSGENDER IN THE UNITED STATES | 13
White, non-Hispanic African-American or Black, non-Hispanic
Hispanic or Latino Other Race or Ethnicity, non-Hispanic
State Population[Lower Bound, Upper Bound]
Percentage[Lower Bound, Upper Bound]
Population[Lower Bound, Upper Bound]
Percentage[Lower Bound, Upper Bound]
Population[Lower Bound, Upper Bound]
Percentage[Lower Bound, Upper Bound]
Population[Lower Bound, Upper Bound]
Percentage[Lower Bound, Upper Bound]
South Carolina [6,805, 21,620]
[0.28%, 0.89%]
[4,038, 13,440]
[0.42%, 1.40%]
[657, 2,350]
[0.41%, 1.46%]
[355, 1,229]
[0.35%, 1.21%]
South Dakota [1,029, 2,892]
[0.19%, 0.53%]
[24, 74]
[0.31%, 0.95%]
[45, 143]
[0.28%, 0.88%]
[160, 505]
[0.26%, 0.84%]
Tennessee [11,578, 41,946]
[0.30%, 1.09%]
[3,335, 13,256]
[0.42%, 1.69%]
[840, 3,382]
[0.44%, 1.78%]
[506, 1,967]
[0.35%, 1.36%]
Texas [26,792, 78,541]
[0.29%, 0.85%]
[9,531, 28,834]
[0.43%, 1.31%]
[29,230, 96,568]
[0.45%, 1.48%]
[3,667, 11,717]
[0.34%, 1.08%]
Utah [2,509, 12,063]
[0.16%, 0.75%]
[39, 200]
[0.22%, 1.15%]
[545, 2,808]
[0.24%, 1.23%]
[221, 1,160]
[0.20%, 1.07%]
Vermont [1,984, 3,775]
[0.42%, 0.79%]
[20, 44]
[0.53%, 1.21%]
[34, 81]
[0.47%, 1.13%]
[72, 165]
[0.48%, 1.09%]
Virginia [15,323, 25,677]
[0.37%, 0.61%]
[6,181, 12,007]
[0.53%, 1.02%]
[2,326, 4,836]
[0.50%, 1.04%]
[1,943, 3,872]
[0.39%, 0.78%]
Washington [12,520, 37,776]
[0.31%, 0.95%]
[835, 2,727]
[0.47%, 1.52%]
[2,476, 8,353]
[0.50%, 1.69%]
[2,568, 8,281]
[0.39%, 1.27%]
West Virginia [3,233, 9,609]
[0.23%, 0.70%]
[144, 472]
[0.30%, 1.00%]
[44, 148]
[0.28%, 0.94%]
[81, 287]
[0.26%, 0.90%]
Wisconsin [11,122, 20,266]
[0.29%, 0.54%]
[1,034, 2,215]
[0.43%, .93%]
[899, 2,025]
[0.42%, 0.95%]
[639, 1,365]
[0.36%, 0.76%]
Wyoming [776, 1,705]
[0.20%, 0.45%]
[12, 30]
[0.28%, 0.70%]
[97, 251] [0.28%, 0.71%]
[44, 112]
[0.25%, 0.63%]

RACE AND ETHNICITY OF ADULTS WHO IDENTIFY AS TRANSGENDER IN THE UNITED STATES | 14
ENDNOTES
1 Flores, A. R., Herman, J. L., Gates, G. J., & Brown, T. N. T. (2016). How Many Adults Identify as Transgender in the United States? Los Angeles, CA: The Williams Institute.
2 Grant, J. M., Mottet, L. A., Tanis, J., Harrison, J., Herman, J. L., & Keisling, M. (2011). Injustice at Every Turn: A Report of the National Transgender Discrimination Survey. Washington, DC: National Center for Transgender Equality and National Gay and Lesbian Task Force.
3 Reback, C. J. & Lombardi, E. L. (2001). HIV Risk Behaviors of Male-to-Female Transgenders in a Community-based Harm Reduction Program. In W. Bockting, & S. Kirk (Eds.), Transgender and HIV: Risks, Prevention and Care (pp. 59–68). Binghamton, NY: Haworth Press, Inc.
4 Nuttbrock, L., Bockting, W., Mason, M., Hwahng, S., Rosenblum, A., Macri, M., & Becker, J. (2011). A Further Assessment of Blanchard’s Typology of Homosexual Versus Non-homosexual or Autogynephilic Gender Dysphoria. Archives of Sexual Behavior, 40(2), 247-257.
5 Conron, K. J., Scott, G., Stowell, G. S., & Landers, S. J. (2012). Transgender Health in Massachusetts: Results from a Household Probability Sample of Adults. American Journal of Public Health, 102(1), 118-122.
6 A detailed description of the methodology for this report is included in the Appendix.
7 Flores, A. R., Herman, J. L., Gates, G. J., & Brown, T. N. T. (2016). How Many Adults Identify as Transgender in the United States? Los Angeles, CA: The Williams Institute.
8 Due to sample size limitations, several groups are combined in the “Other Race or Ethnicity, non-Hispanic” category, including people who are Asian or Pacific Islander, American Indian or Alaska Native, biracial or multiracial, and other racial or ethnic groups.
9 We have chosen not to include the District of Columbia in the ranges of state proportions because of its much higher proportions for each racial or ethnic category likely due to its unique geographic (solely urban) and demographic characteristics.
10 For more detailed information on gender identity data collection in the BRFSS, see Baker, K.E. & Hughes, M. (2016). Sexual Orientation and Gender Identity Data Collection in the Behavioral Risk Factor Surveillance System. Washington, DC: The Center for American Progress, available at https://cdn.americanprogress.org/wp-content/uploads/2016/03/29090401/BRFSSdatacollect-brief-03.31.16.pdf.
11 Park, D.K., Gelman, A., & Bafumi, J. (2004). Bayesian multilevel estimation with poststratification: State-level estimates from national polls. Political Analysis, 12, 375-385.
12 Flores, A.R., & Barclay, S. (2015). Trends in public support for marriage for same-sex couples by state. Los Angeles, CA: The Williams Institute, UCLA.
13 Saxe, L., & Tighe, E. (2013). Estimating and understanding the Jewish population in the United States: A program of research. Contemporary Jewry, 33(1), 43-62; Tighe, E., Livert, D., Barnett, M., & Saxe, L. (2010). Cross-survey analysis to estimate low-incidence religious groups. Sociological Methods & Research, 39(1), 56-82.
14 Flores, A. R., Herman, J. L., Gates, G. J., & Brown, T. N. T. (2016). How Many Adults Identify as Transgender in the United States? Los Angeles, CA: The Williams Institute.
15 Lax, J.R., & Phillips, J.H. (2009). How should we estimate public opinion in the states? American Journal of Political Science, 53(1), 107-121; Warshaw, C., & Rodden, J. (2012). How should we measure district-level public opinion on individual issues? Journal of Politics, 74(1), 203-219.
16 Buttice, M.K., Highton, B. (2013). How does multilevel regression and poststratification perform with conventional national surveys? Political Analysis, 21(4), 449-467; Toshokov, D. (2015). Exploring the performance of multilevel modeling and poststratifi-cation with Eurobarometer data. Political Analysis, 23(3), 455-460.
17 Stan Development Team. (2016) RStan: The R interface to Stan, version 2.9.0. http://mc-stan.org.

RACE AND ETHNICITY OF ADULTS WHO IDENTIFY AS TRANSGENDER IN THE UNITED STATES | 15
ABOUT THE AUTHORSAndrew R. Flores, Ph.D. is an Assistant Professor of Government at Mills College. He holds a Ph.D. in Political Science from the University of California, Riverside.
Taylor N. T. Brown, M.P.P. is a Public Policy Analyst at the Williams Institute. He holds a Master of Public Policy from The University of Virginia.
Jody L. Herman, Ph.D. is a Scholar of Public Policy at the Williams Institute. She holds a Ph.D. in Public Policy and Public Administration from The George Washington University.
FOR MORE INFORMATIONThe Williams Institute, UCLA School of Law
Box 951476 Los Angeles, CA 90095-1476
(310) 267-4382
[email protected] www.williamsinstitute.law.ucla.edu
Suggested citation: Flores, A.R., Brown, T.N.T., Herman, J.L. (2016). Race and Ethnicity of Adults who Identify as Transgender in the United States. Los Angeles, CA: The Williams Institute.