Embed Size (px)
Citation preview
By Thermax Ltd.1
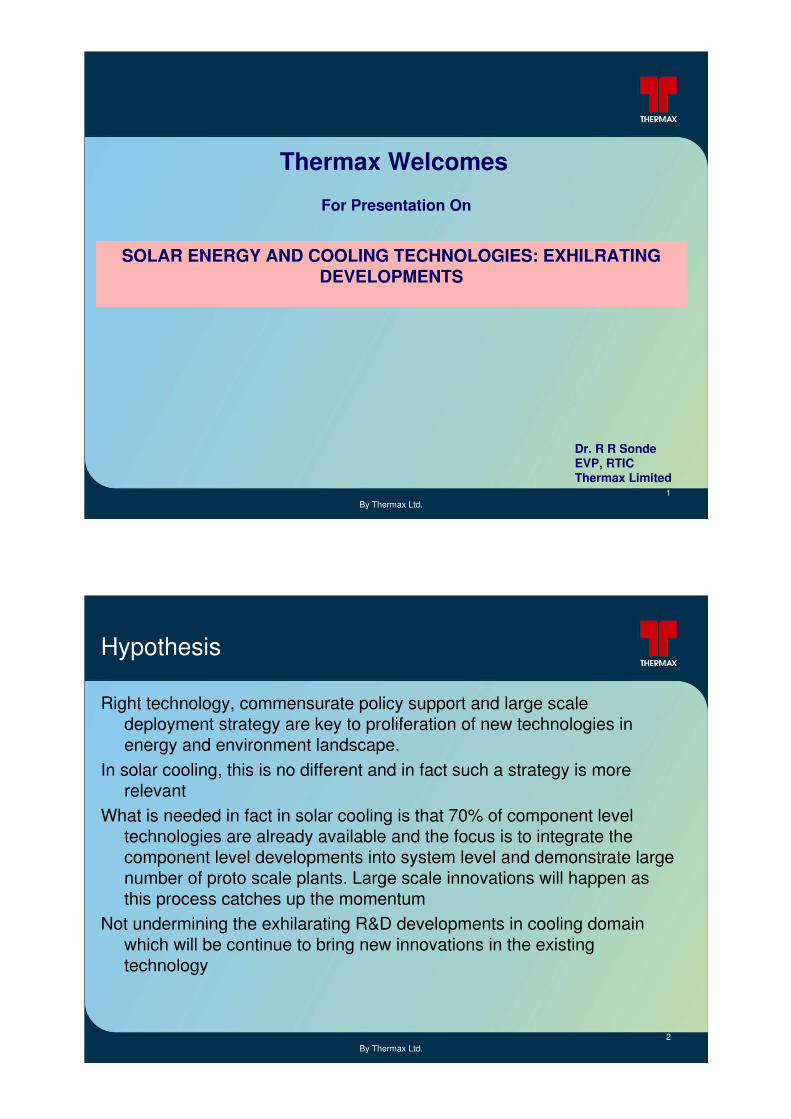
Thermax Welcomes
For Presentation On
SOLAR ENERGY AND COOLING TECHNOLOGIES: EXHILRATING DEVELOPMENTS
Dr. R R SondeEVP, RTICThermax Limited
By Thermax Ltd.2
Hypothesis
Right technology, commensurate policy support and large scale deployment strategy are key to proliferation of new technologies in energy and environment landscape.
In solar cooling, this is no different and in fact such a strategy is more relevant
What is needed in fact in solar cooling is that 70% of component level technologies are already available and the focus is to integrate the component level developments into system level and demonstrate large number of proto scale plants. Large scale innovations will happen as this process catches up the momentum
Not undermining the exhilarating R&D developments in cooling domain which will be continue to bring new innovations in the existing technology
By Thermax Ltd.3
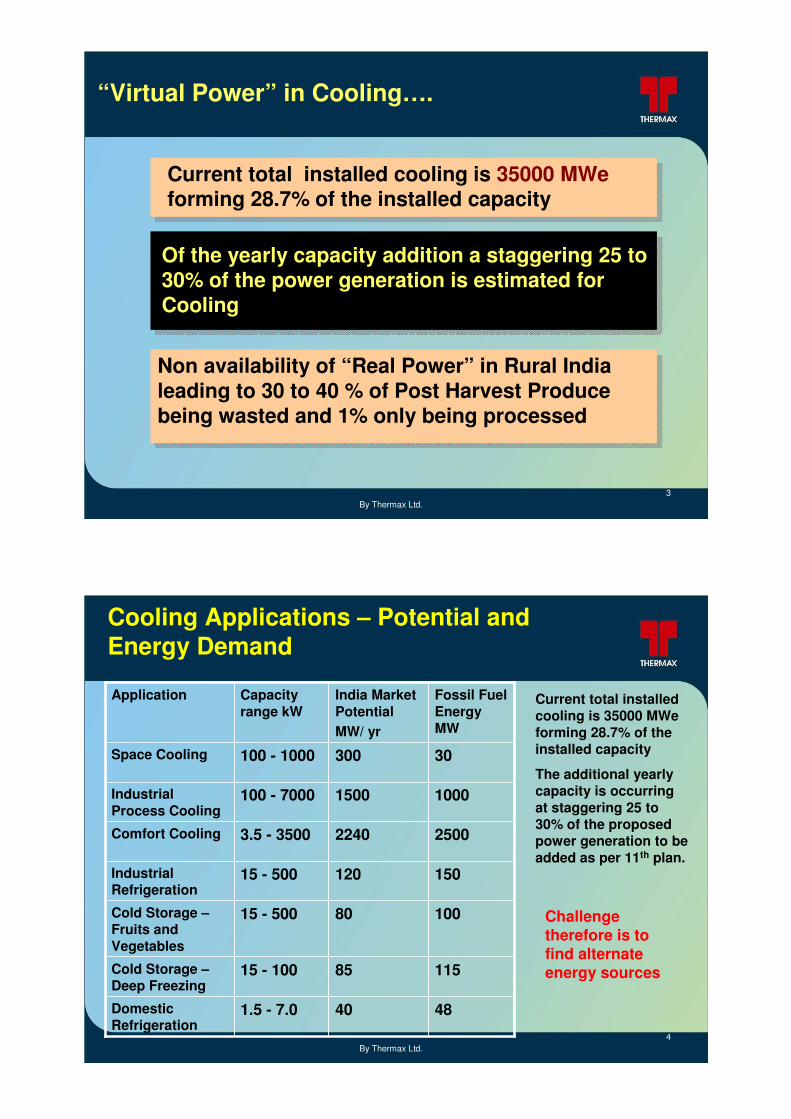
Current total installed cooling is 35000 MWeforming 28.7% of the installed capacity
Of the yearly capacity addition a staggering 25 to 30% of the power generation is estimated for Cooling
Non availability of “Real Power” in Rural India leading to 30 to 40 % of Post Harvest Produce being wasted and 1% only being processed
“Virtual Power” in Cooling….
By Thermax Ltd.4
Cooling Applications – Potential and Energy Demand
30300100 - 1000Space Cooling
48401.5 - 7.0Domestic Refrigeration
1158515 - 100Cold Storage –Deep Freezing
1008015 - 500Cold Storage –Fruits and Vegetables
15012015 - 500Industrial Refrigeration
250022403.5 - 3500Comfort Cooling
10001500100 - 7000Industrial Process Cooling
Fossil Fuel Energy MW
India Market PotentialMW/ yr
Capacity range kW
Application Current total installed cooling is 35000 MWeforming 28.7% of the installed capacity
The additional yearly capacity is occurring at staggering 25 to 30% of the proposed power generation to be added as per 11th plan.
Challenge Challenge therefore is to therefore is to find alternate find alternate energy sourcesenergy sources
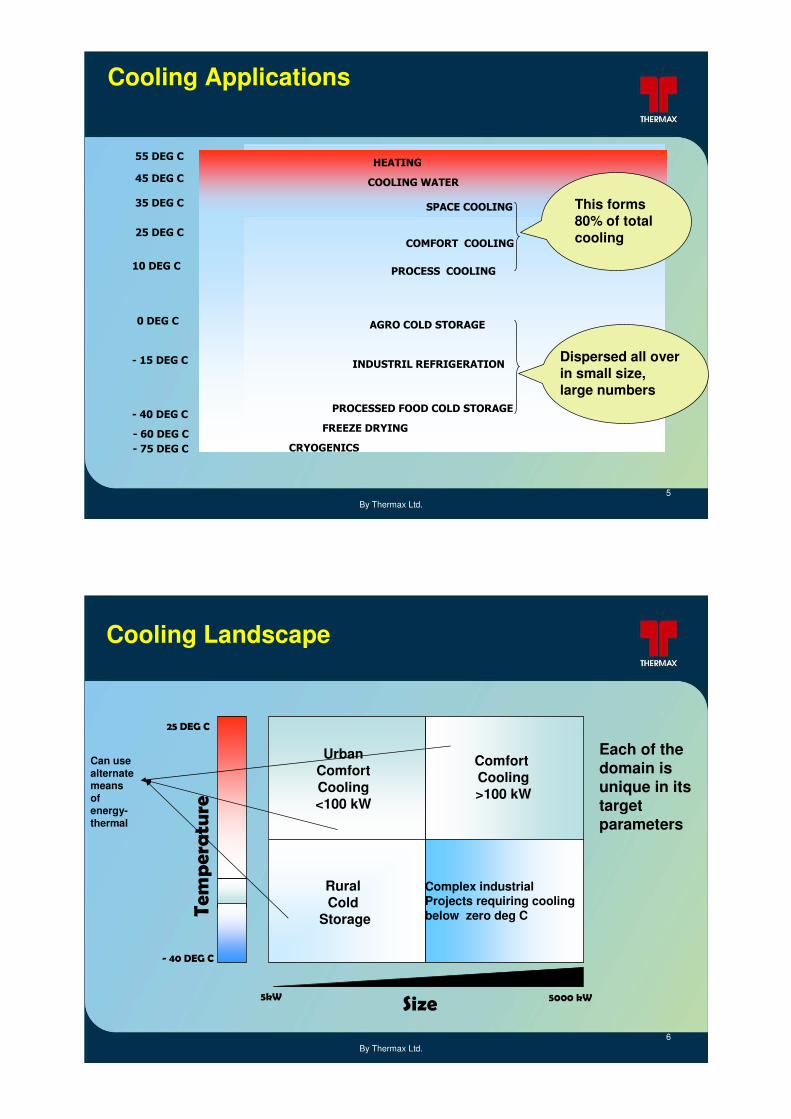
By Thermax Ltd.5
Cooling Applications
55 DEG C
35 DEG C
45 DEG C
COMFORT COOLING
PROCESS COOLING
AGRO COLD STORAGE
INDUSTRIL REFRIGERATION
PROCESSED FOOD COLD STORAGE
FREEZE DRYING
CRYOGENICS
25 DEG C
10 DEG C
0 DEG C
-15 DEG C
-60 DEG C
-75 DEG C
-40 DEG C
COOLING WATER
HEATING
SPACE COOLING This forms 80% of total cooling
Dispersed all over in small size, large numbers
By Thermax Ltd.6
Temperature
Size
Rural Cold
Storage
Complex industrialProjects requiring coolingbelow zero deg C
UrbanComfortCooling<100 kW
Comfort Cooling>100 kW
Cooling Landscape
5kW 5000 kW
25 D EG C
- 40 D EG C
Each of the domain is unique in its target parameters
Can use alternate means of energy-thermal
By Thermax Ltd.7
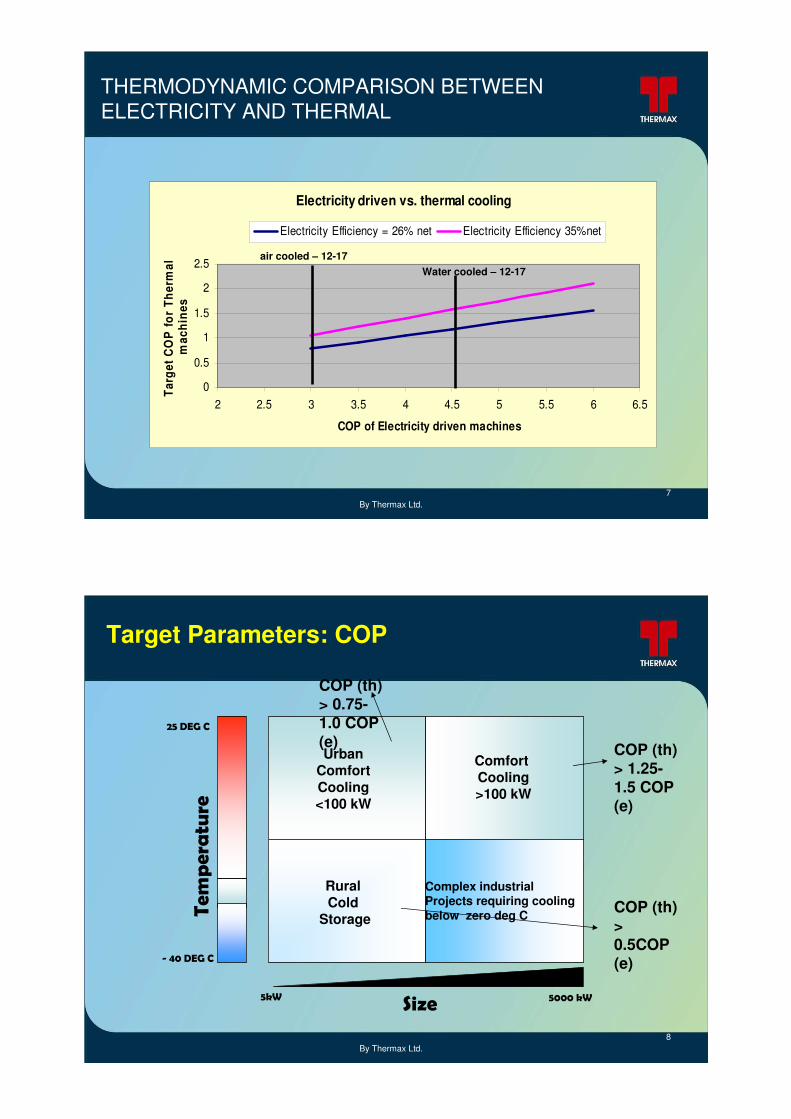
THERMODYNAMIC COMPARISON BETWEEN ELECTRICITY AND THERMAL
Electricity driven vs. thermal cooling
0
0.5
1
1.5
2
2.5
2 2.5 3 3.5 4 4.5 5 5.5 6 6.5
COP of Electricity driven machines
Targ
et C
OP
for
Ther
mal
m
achi
nes
Electricity Efficiency = 26% net Electricity Efficiency 35%net
Water cooled – 12-17air cooled – 12-17
By Thermax Ltd.8
Tem
pera
ture
Size
Rural Cold
Storage
Complex industrialProjects requiring coolingbelow zero deg C
UrbanComfortCooling<100 kW
Comfort Cooling>100 kW
Target Parameters: COP
5kW 5000 kW
25 DEG C
- 40 DEG C
COP (th) > 1.25-1.5 COP (e)
COP (th) > 0.75-1.0 COP (e)
COP (th) > 0.5COP (e)
By Thermax Ltd.9
Thermal
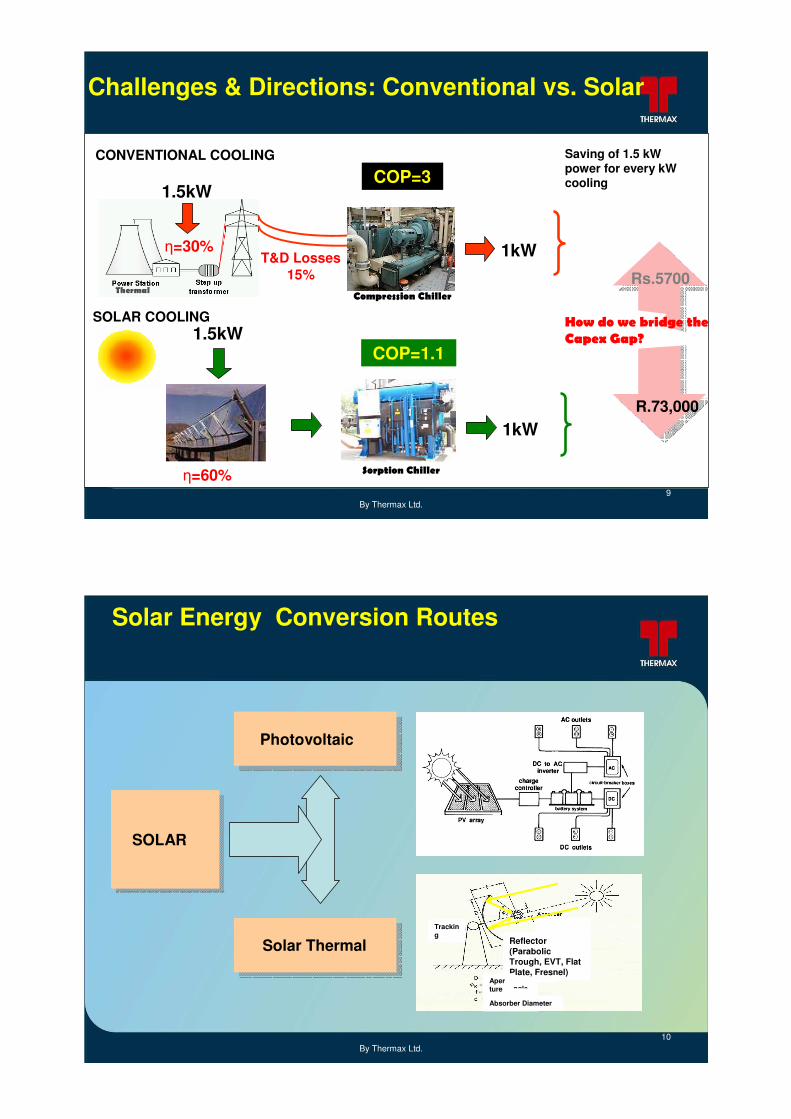
Challenges & Directions: Conventional vs. Solar
1.5kW
η=30%T&D Losses
15%Compression Chiller
1kW
CONVENTIONAL COOLING
COP=3
Rs.5700
H ow do w e bridge the
Capex G ap?
SOLAR COOLING
Sorption Chillerη=60%
1.5kW
1kW
COP=1.1
R.73,000
Rs.5700
Saving of 1.5 kW power for every kW cooling
By Thermax Ltd.10
Solar Energy Conversion Routes
SOLAR
Photovoltaic
Solar ThermalTracking
Edge AngleFocal Length Absorber Diameter
Reflector (Parabolic Trough, EVT, Flat Plate, Fresnel)
Aperture
By Thermax Ltd.11
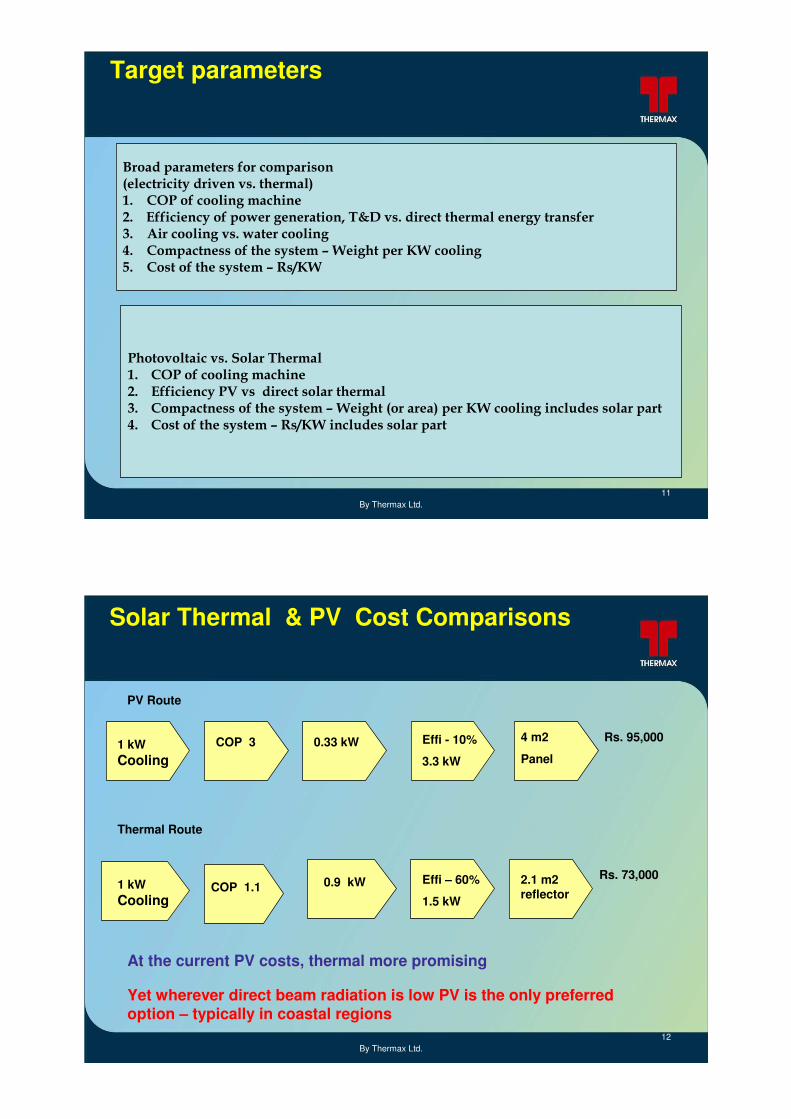
Target parameters
Broad parameters for comparison(electricity driven vs. thermal)1. COP of cooling machine 2. Efficiency of power generation, T&D vs. direct thermal energy transfer3. Air cooling vs. water cooling4. Compactness of the system –W eight per KW cooling5. Cost of the system –Rs/KW
Photovoltaic vs. Solar Thermal1. COP of cooling machine 2. Efficiency PV vs direct solar thermal3. Compactness of the system –W eight (or area) per KW cooling includes solar part4. Cost of the system –Rs/KW includes solar part
By Thermax Ltd.12
Solar Thermal & PV Cost Comparisons
At the current PV costs, thermal more promising At the current PV costs, thermal more promising
1 kW Cooling
COP 3 0.33 kW Effi - 10%
3.3 kW
PV Route
1 kW Cooling
COP 1.1 0.9 kW Effi – 60%
1.5 kW
Thermal Route
4 m2
Panel
Rs. 95,000
Rs. 73,0002.1 m2 reflector
Yet wherever direct beam radiation is low PV is the only preferrYet wherever direct beam radiation is low PV is the only preferred ed option option –– typically in coastal regionstypically in coastal regions
By Thermax Ltd.13
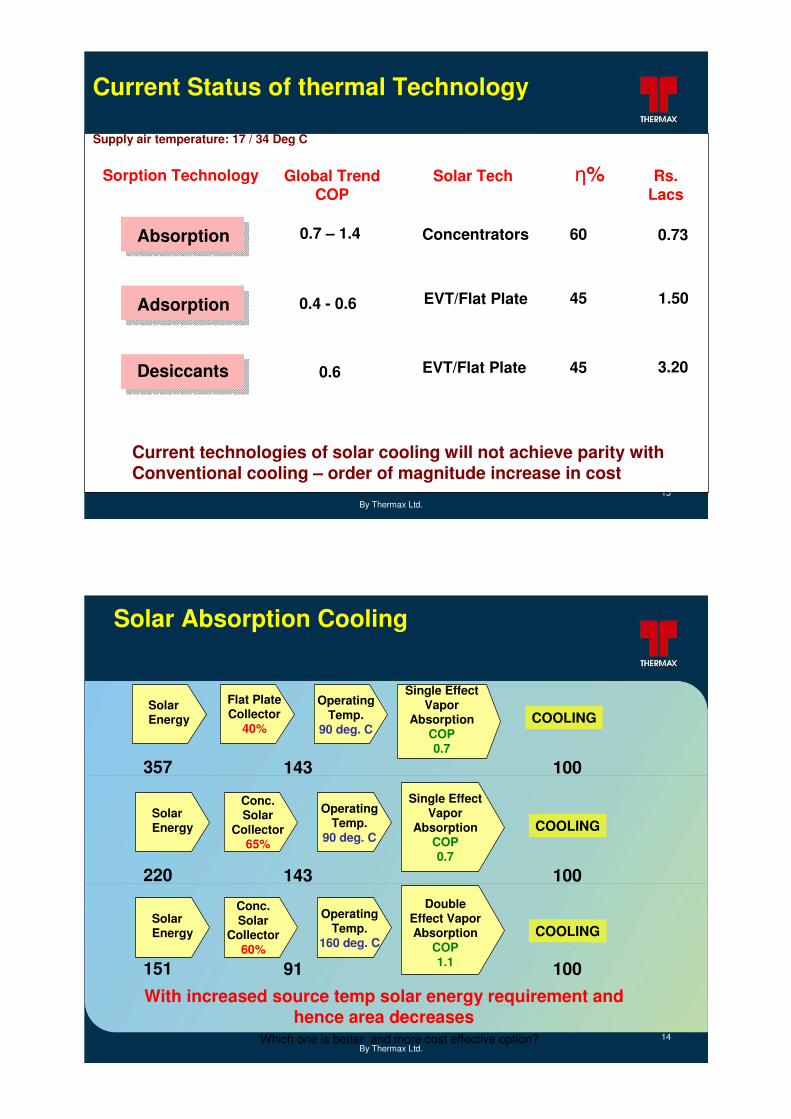
Current Status of thermal Technology
Absorption
Adsorption
Desiccants
Sorption Technology Global TrendCOP
0.7 – 1.4
0.4 - 0.6
0.6
Solar Tech Rs.Lacs
η%
Concentrators
EVT/Flat Plate
EVT/Flat Plate
60
45
45
0.73
1.50
3.20
Current technologies of solar cooling will not achieve parity withConventional cooling – order of magnitude increase in cost
Supply air temperature: 17 / 34 Deg C
By Thermax Ltd.14
Solar Absorption Cooling
Solar Energy
Flat Plate Collector
40%
Operating Temp.
90 deg. C
Single Effect Vapor
AbsorptionCOP 0.7
357 143 100
COOLING
Solar Energy
Conc. Solar
Collector65%
Operating Temp.
90 deg. C
Single Effect Vapor
AbsorptionCOP 0.7
220 143 100
COOLING
Solar Energy
Conc. Solar
Collector60%
Operating Temp.
160 deg. C
Double Effect VaporAbsorption
COP 1.1151 91 100
COOLING
Which one is better and more cost effective option?
With increased source temp solar energy requirement and hence area decreases
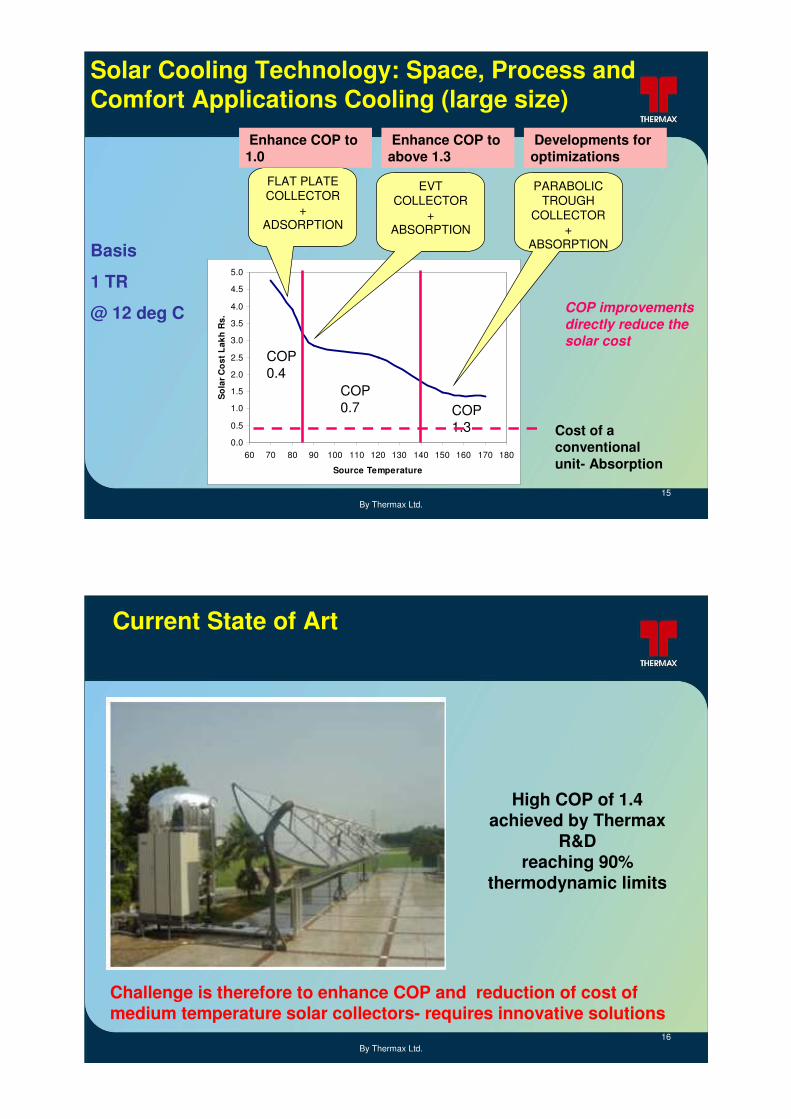
By Thermax Ltd.15
0.0
0.5
1.0
1.5
2.0
2.5
3.0
3.5
4.0
4.5
5.0
60 70 80 90 100 110 120 130 140 150 160 170 180
Source Temperature
So
lar
Co
st L
akh
Rs.
COP0.4
COP0.7 COP
1.3
Solar Cooling Technology: Space, Process and Comfort Applications Cooling (large size)
FLAT PLATE COLLECTOR
+ADSORPTION
EVT COLLECTOR
+ABSORPTION
PARABOLIC TROUGH
COLLECTOR+
ABSORPTION
Enhance COP to 1.0
Enhance COP to above 1.3
Developments for optimizations
Cost of a conventional unit- Absorption
Basis
1 TR
@ 12 deg C COP improvements directly reduce the solar cost
By Thermax Ltd.16
Current State of Art
High COP of 1.4 achieved by Thermax
R&Dreaching 90%
thermodynamic limits
Challenge is therefore to enhance COP and reduction of cost of medium temperature solar collectors- requires innovative solutions
By Thermax Ltd.17
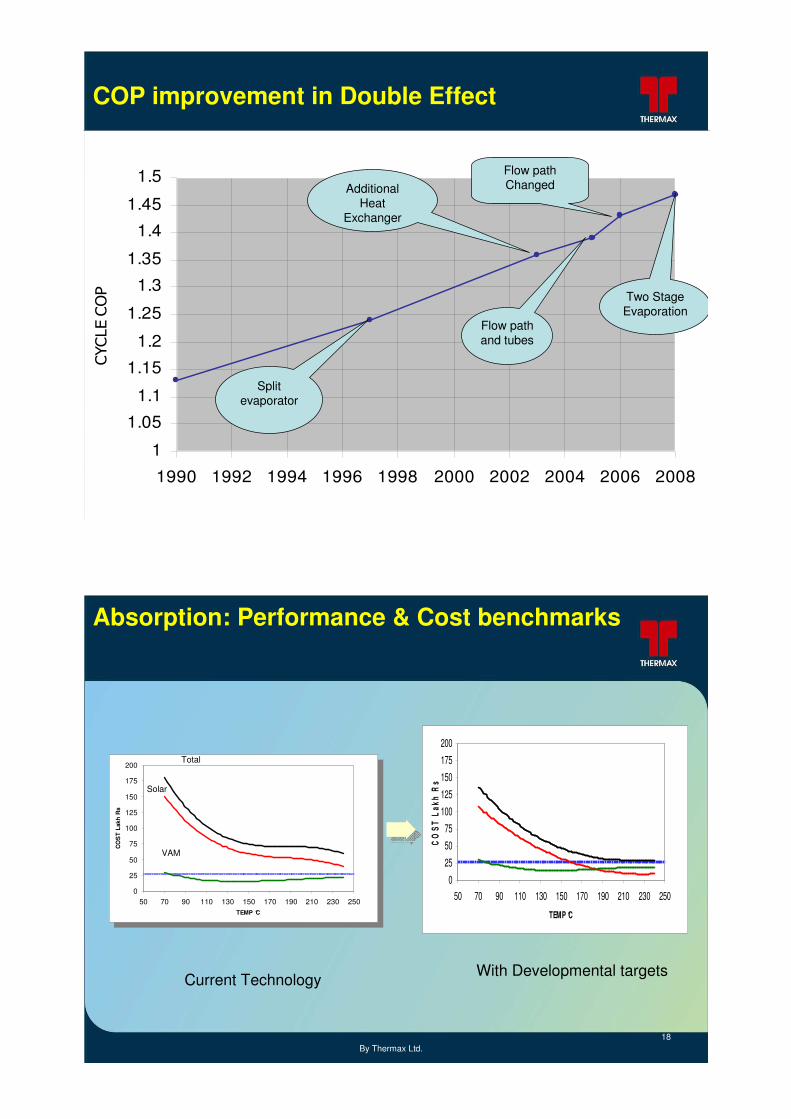
1
1.05
1.1
1.15
1.2
1.25
1.3
1.35
1.4
1.45
1.5
1990 1992 1994 1996 1998 2000 2002 2004 2006 2008
CYCLE C
OP
Flow path Changed
Flow path and tubes
Two Stage Evaporation
Additional Heat
Exchanger
Split evaporator
COP improvement in Double Effect
By Thermax Ltd.18
Absorption: Performance & Cost benchmarks
Current Technology
0
25
50
75
100
125
150
175
200
50 70 90 110 130 150 170 190 210 230 250TEMP °C
CO
ST
Lakh
Rs
0
25
50
75
100
125
150
175
200
50 70 90 110 130 150 170 190 210 230 250TEMP °C
CO
ST
Lakh
Rs
Total
Solar
VAM
With Developmental targets
0255075
100125150175200
50 70 90 110 130 150 170 190 210 230 250
TEMP °C
CO
ST
Lak
h R
s
By Thermax Ltd.19
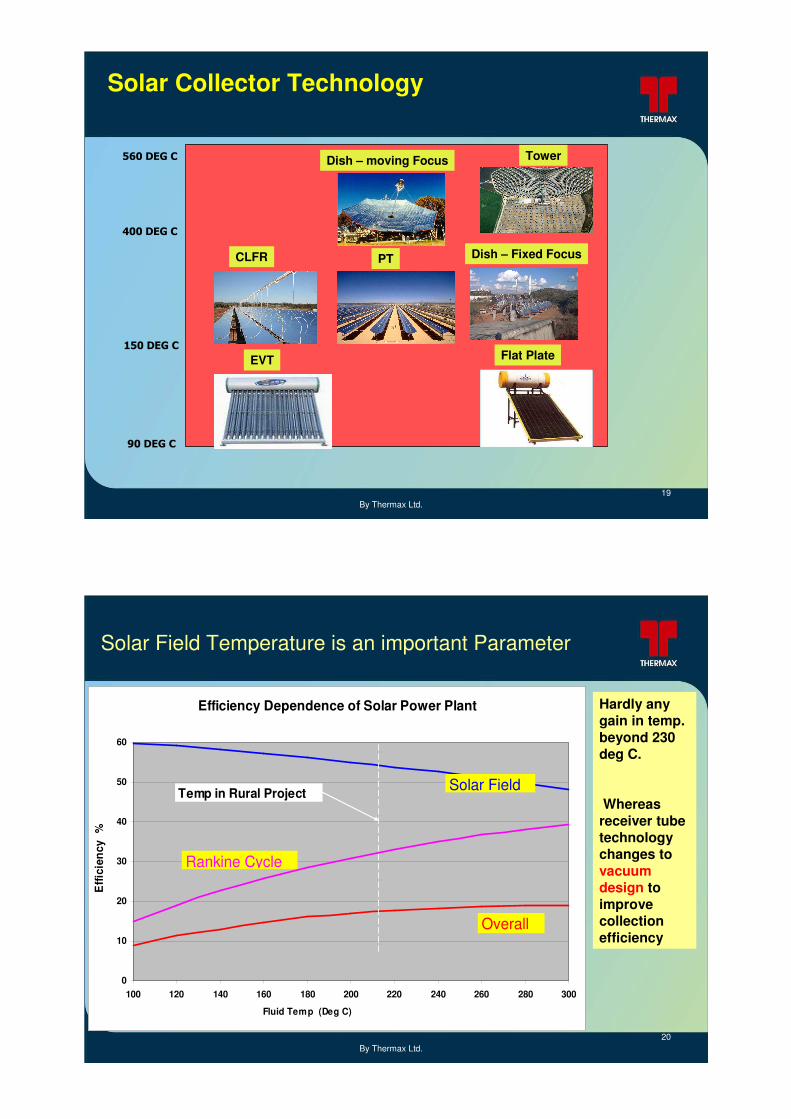
Solar Collector Technology
560 DEG C
400 DEG C
150 DEG C
90 DEG C
TowerDish – moving Focus
CLFR PT Dish – Fixed Focus
EVT Flat Plate
By Thermax Ltd.20
Solar Field Temperature is an important Parameter
Efficiency Dependence of Solar Power Plant
0
10
20
30
40
50
60
100 120 140 160 180 200 220 240 260 280 300
Fluid Temp (Deg C)
Effi
cien
cy %
Solar Field
Rankine Cycle
Overall
Temp in Rural Project
Hardly any gain in temp. beyond 230 deg C.
Whereas receiver tube technology changes to vacuum design to improve collection efficiency
By Thermax Ltd.21
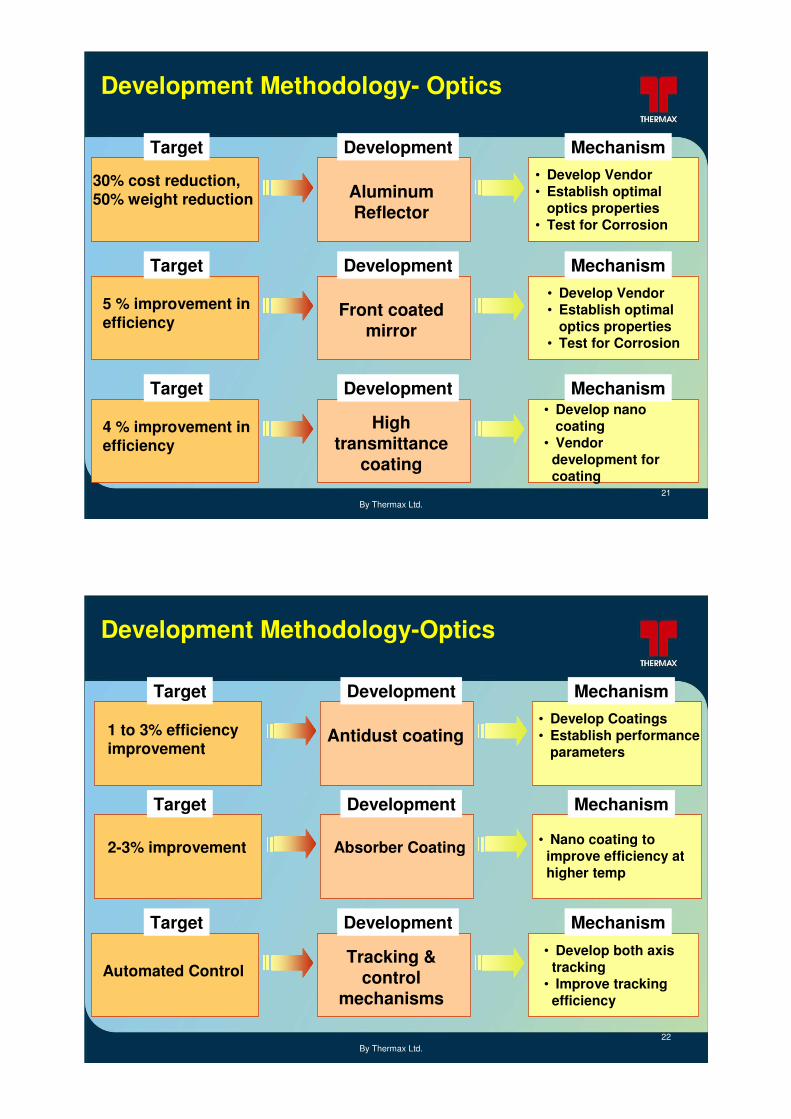
Development Methodology- Optics
30% cost reduction, 50% weight reduction
Target Development Mechanism• Develop Vendor• Establish optimal
optics properties• Test for Corrosion
Aluminum Reflector
5 % improvement in efficiency
Target Development Mechanism• Develop Vendor• Establish optimal
optics properties• Test for Corrosion
Front coated mirror
4 % improvement in efficiency
Target Development Mechanism• Develop nano
coating• Vendor
development for coating
High transmittance
coating
By Thermax Ltd.22
Development Methodology-Optics
1 to 3% efficiency improvement
Target Development Mechanism• Develop Coatings• Establish performance
parametersAntidust coating
2-3% improvement
Target Development Mechanism
• Nano coating to improve efficiency at higher temp
Absorber Coating
Automated Control
Target Development Mechanism• Develop both axis
tracking• Improve tracking
efficiency
Tracking & control
mechanisms
By Thermax Ltd.23
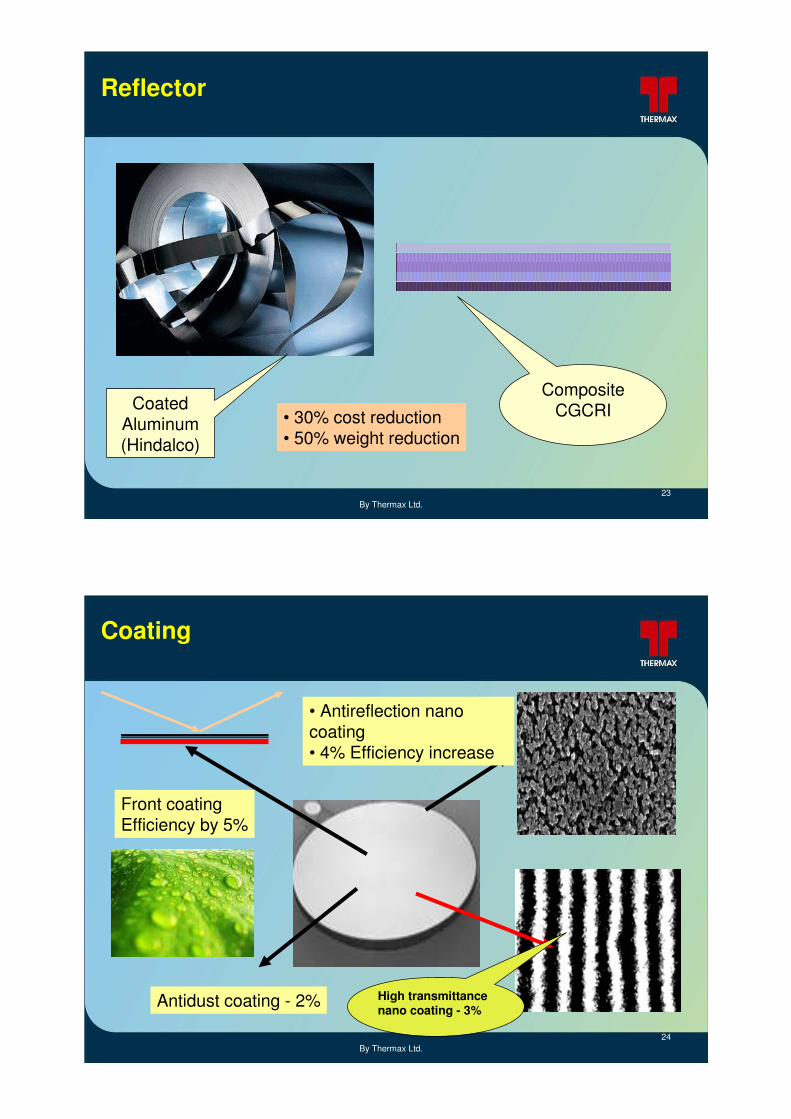
Reflector
Coated Aluminum(Hindalco)
Composite CGCRI• 30% cost reduction
• 50% weight reduction
By Thermax Ltd.24
Coating
• Antireflection nanocoating• 4% Efficiency increase
Front coatingEfficiency by 5%
Antidust coating - 2% High transmittance nano coating - 3%
By Thermax Ltd.25
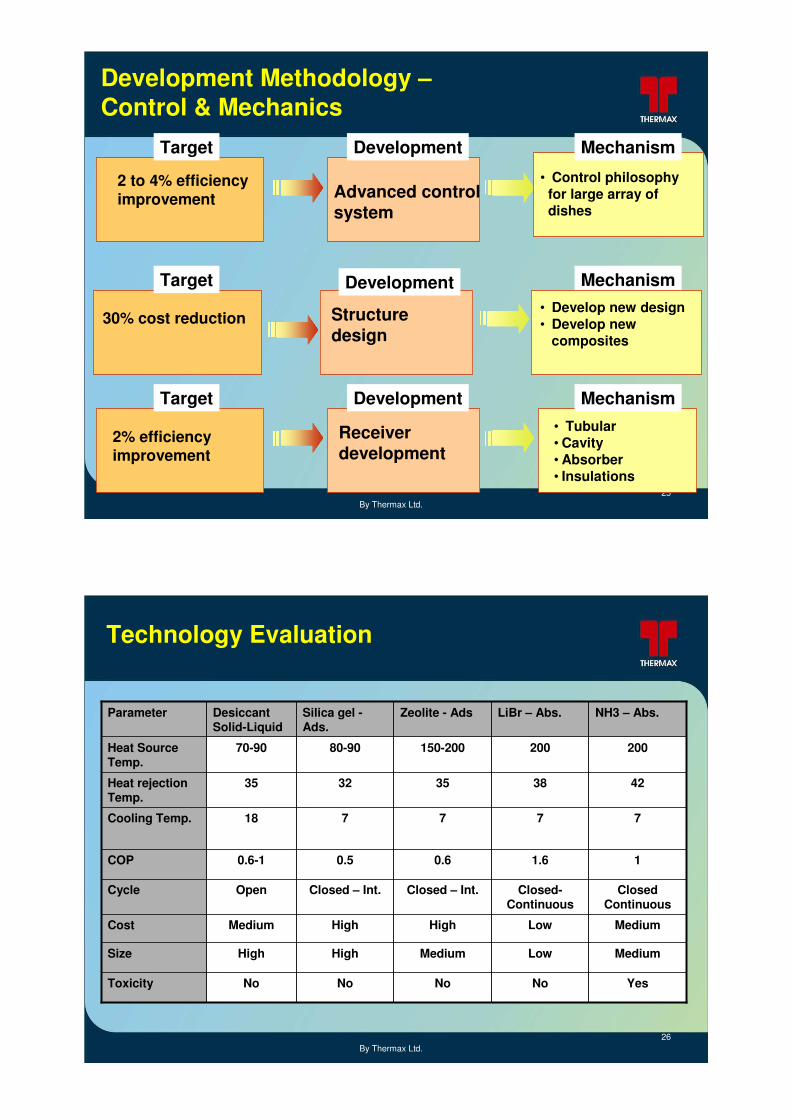
Development Methodology –Control & Mechanics
2 to 4% efficiency improvement
Target Development Mechanism
• Control philosophy for large array of dishes
Advanced control system
Mechanism
2% efficiency improvement
Target Development Mechanism• Tubular• Cavity• Absorber• Insulations
Receiver development
30% cost reduction• Develop new design• Develop new
composites
Structure design
Target Development
By Thermax Ltd.26
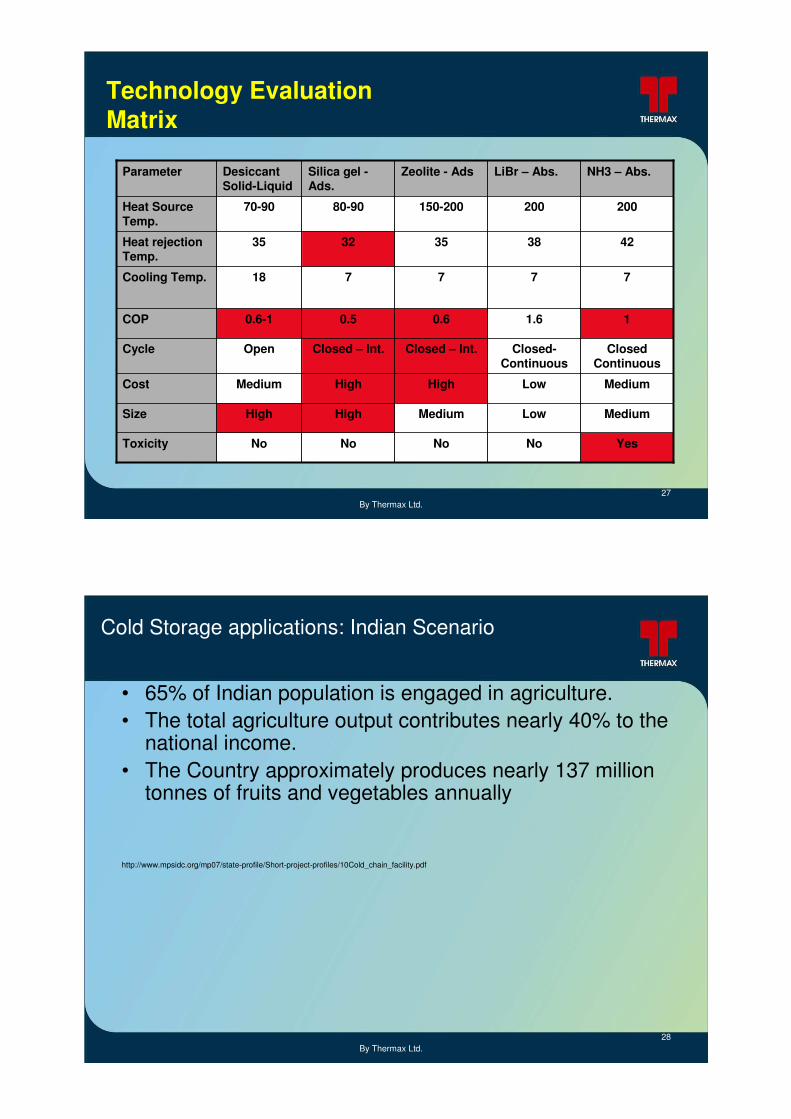
YesNoNoNoNoToxicity
MediumLowMediumHighHighSize
MediumLowHighHighMediumCost
Closed Continuous
Closed-Continuous
Closed – Int.Closed – Int.OpenCycle
11.60.60.50.6-1COP
777718Cooling Temp.
4238353235Heat rejection Temp.
200200150-20080-9070-90Heat Source Temp.
NH3 – Abs.LiBr – Abs.Zeolite - AdsSilica gel -Ads.
Desiccant Solid-Liquid
Parameter
Technology Evaluation
By Thermax Ltd.27
YesNoNoNoNoToxicity
MediumLowMediumHighHighSize
MediumLowHighHighMediumCost
Closed Continuous
Closed-Continuous
Closed – Int.Closed – Int.OpenCycle
11.60.60.50.6-1COP
777718Cooling Temp.
4238353235Heat rejection Temp.
200200150-20080-9070-90Heat Source Temp.
NH3 – Abs.LiBr – Abs.Zeolite - AdsSilica gel -Ads.
Desiccant Solid-Liquid
Parameter
Technology Evaluation Matrix
By Thermax Ltd.28
Cold Storage applications: Indian Scenario
• 65% of Indian population is engaged in agriculture.• The total agriculture output contributes nearly 40% to the
national income.• The Country approximately produces nearly 137 million
tonnes of fruits and vegetables annually
http://www.mpsidc.org/mp07/state-profile/Short-project-profiles/10Cold_chain_facility.pdf

By Thermax Ltd.29
Indian cold storage Existing Market
37%
28%
17%
18%
Above 114Above 5,001
28 to 1143,001 to 5,000
17 to 281,001 to 3,000
Less then 17Less then 1,000
Refrigeration load in TRCold Storage capacity in MT
65% of cold storages are below 50 TR requirements
By Thermax Ltd.30
Cold storage load Pattern
148
188
10792
7864
5036
22
0
20
40
60
80
100
120
140
160
180
200
Last Day ofMarch
Last Day ofApril
May to July Last Day ofJuly
Last Day ofAug
Last Day ofSept
Last Day ofOct
Last Day ofNov
Last Day ofDec
Cold Storage Operation Cycle
TR lo
ad
Product loading period,Max load due to fresh
Product & highInfiltration load
Cold Storage remains Closed as fresh product is
easily available in the market
Product goes out for sale@ 15% per month
Cold Storage remainsClosed for Jan & Feb
Maximum Load in March, April, May and June
By Thermax Ltd.31
Technology Developments
– Ammonia absorption refrigeration system having 20% higher COP using New working pair.
– Air cooled Ammonia absorption refrigeration system.• Aircooled absorber• Aircooled Condenser
– Small capacity ammonia absorption refrigeration system (15kw) development.
– Optimizing source temperature requirement– Corrosion inhibitor development for new working pair– Development of heat and mass transfer additive for new working pair– Design and development of small capacity biomass gasifier and small
capacity100% producer gas driven gas engine– Low Cost, Medium Temperature Solar Collector development
By Thermax Ltd.32
Technology Developments
• Wide Temperature Range- -1deg.C to 7deg.C (for vegetables)- 7deg.C to 10deg. C (for Potatoes and Tomatoes)…..Higher COP Cooling Machine Possible
• Short duration of storage• Different Heat load patterns – daily and seasonal • Requirement of fast Cooling
By Thermax Ltd.33
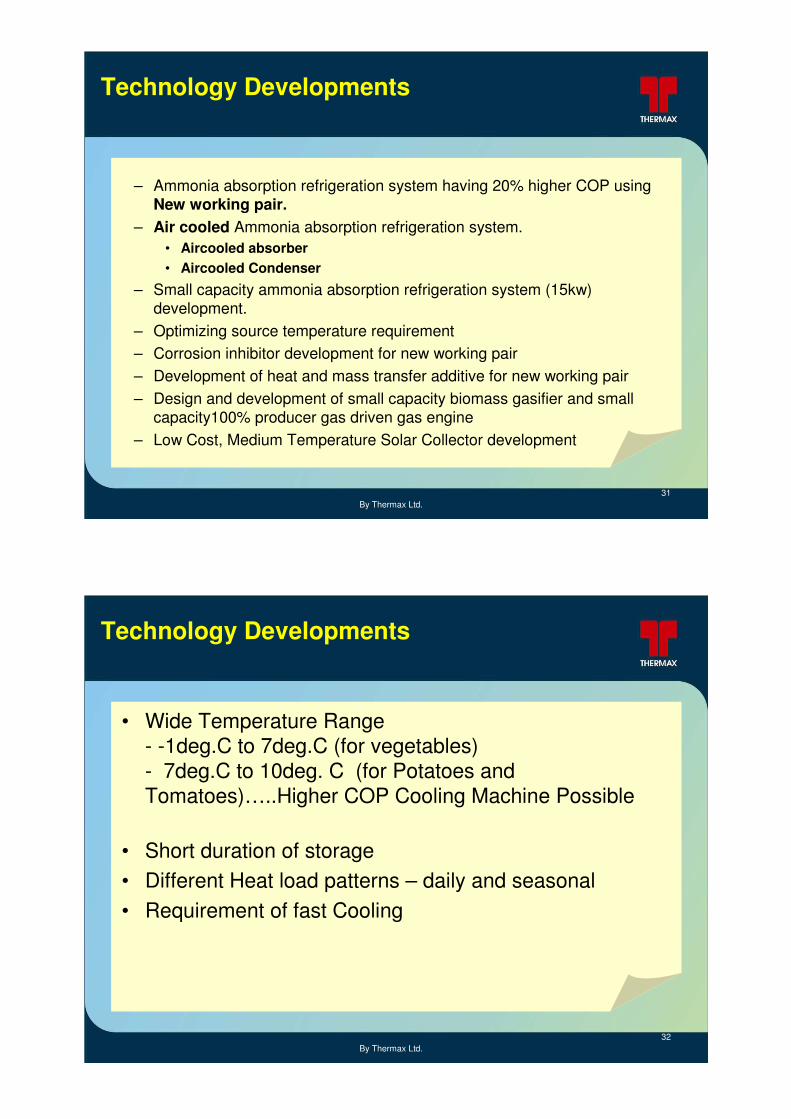
Solar – biomass hybrid Rural Cold Storage : Technology Developments
BiomassGasifier
GasEngine
Absorption Chiller
Cold Storage
15 kW
Auxillary power 5 kWe
Solar
Exhaust Gas
Power output 7 kWe
20% higher COP using New working pair
AircooledabsorberAircooledCondenser
small capacity biomass gasifierdevelopment
small capacity producer gas Engine
Low Cost, Medium Temperature Solar Collector development
Corrosion InhibitorHeat and mass transfer additive
15kW Ammonia VAM
By Thermax Ltd.34
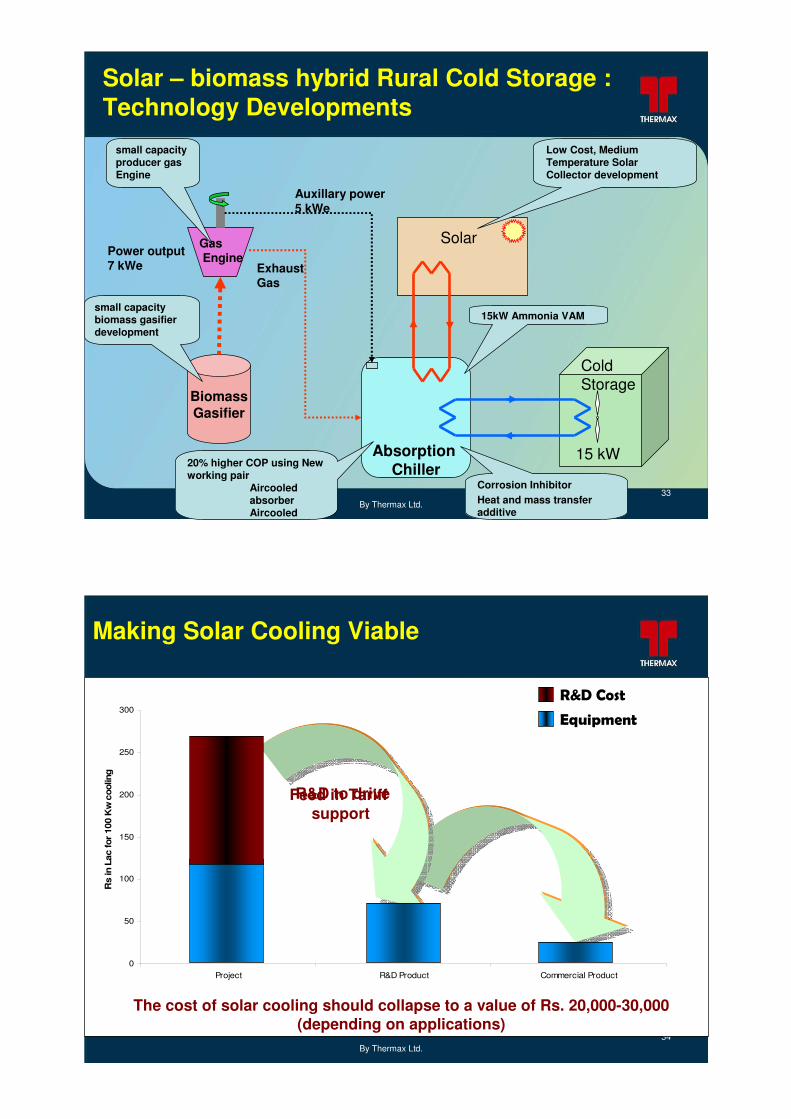
Making Solar Cooling Viable
0
50
100
150
200
250
300
Project R&D Product Commercial Product
Rs
in L
ac fo
r 10
0 K
w c
oolin
g
R&D to driveFeed in Tariff support
R&D Cost
Equipment
The cost of solar cooling should collapse to a value of Rs. 20,000-30,000 (depending on applications)
By Thermax Ltd.35
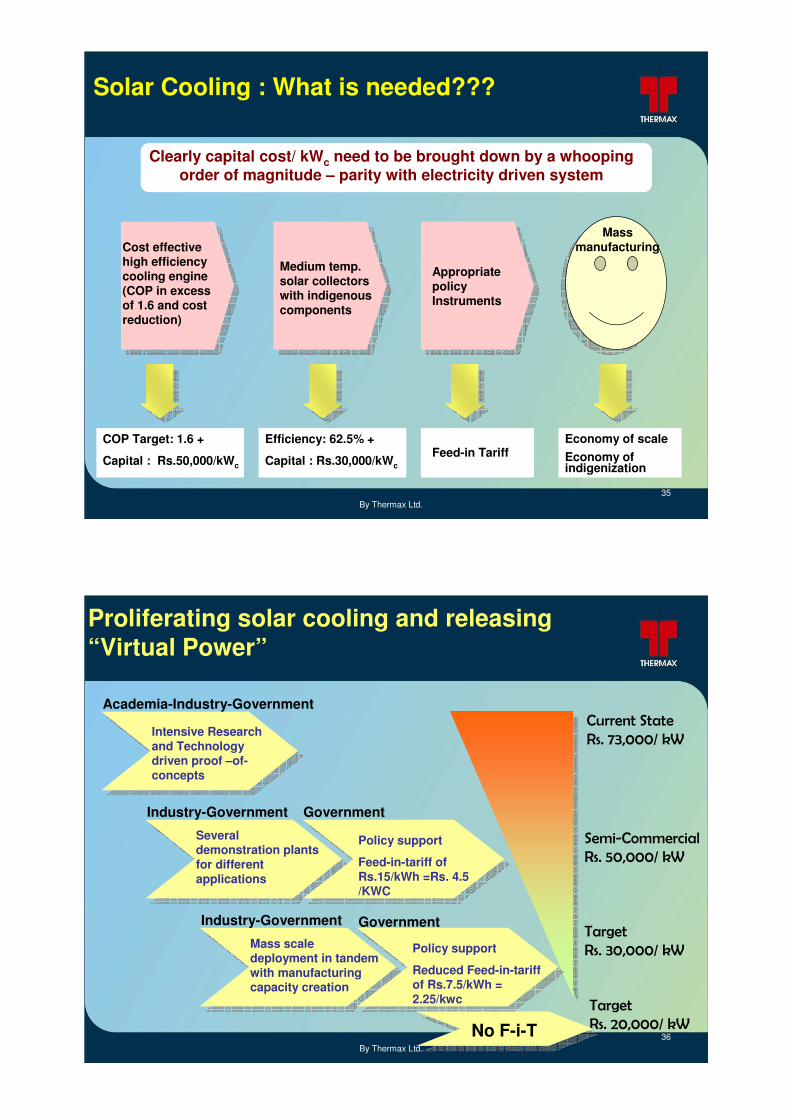
Solar Cooling : What is needed???
Clearly capital cost/ kWc need to be brought down by a whooping order of magnitude – parity with electricity driven system
Efficiency: 62.5% +
Capital : Rs.30,000/kWc
Medium temp.solar collectorswith indigenouscomponents
COP Target: 1.6 +
Capital : Rs.50,000/kWc
Cost effectivehigh efficiencycooling engine(COP in excessof 1.6 and cost reduction)
Mass manufacturing
Economy of scaleEconomy of indigenization
Appropriate policyInstruments
Feed-in Tariff
By Thermax Ltd.36
Proliferating solar cooling and releasing “Virtual Power”
Current State
Rs. 73,000/ kW
Sem i-Com m ercial
Rs. 50,000/ kW
Target
Rs. 30,000/ kW
Intensive Research and Technology driven proof –of-concepts
Several demonstration plants for different applications
Academia-Industry-Government
Industry-Government
Policy support
Feed-in-tariff of Rs.15/kWh =Rs. 4.5 /KWC
Government
Mass scale deployment in tandem with manufacturing capacity creation
Policy support
Reduced Feed-in-tariff of Rs.7.5/kWh = 2.25/kwc
Industry-Government Government
Target
Rs. 20,000/ kWNo F-i-T

By Thermax Ltd.37
Thanks