Embed Size (px)
Citation preview
Susan D. Ritenour Secretary and Treasurer and Regulatory Manager
One Energy Place Pensacola, Florida 32520-(1781
Tel850.444.6231 Fax 850.444.6026 [email protected]
POWER A SOUTHERN COMPANY
March 31,2009
Ms. Ann Cole, Commission Clerk Florida Public Service Commission 2540 Shumard Oak Boulevard Tallahassee FL 32399-0870
- =r c ?? d
w
Dear Ms. Cole:
Enclosed are an original and twenty-five copies of Gulf Power Company's 2009 Ten Year Site Plan, and it is filed pursuant to Rule No. 25-22.071.
Sincerely,
mv
Enclosures
cc: Beggs & Lane Jeffrey A. Stone, Esq.
TEN YEAR SITE PLAN 20019-201 8
FOR ELECTRIC GENERATING FACILITIES AND
ASSOCIATED TRANSMISSION LINES
APRIL 2009
A SOUTHERN COMPANY
GULF POWER COMPANY TEN YEAIR SITE PLAN
FOR ELECTRIC GENERATING FACILITIES AND
ASSOCIATED TRANSMISSION LINES
Submitted To The State of Florida
Public Service Commission
APRIIL I, 2009

TABLE OF CONTENTS
EXECUTIVE SUMMARY
CHAPTER I DESCRIPTION OF EXISTING FACILITIES
Description of Existing Facilities
Existing Generating Facilities
System Map
Schedule 1
CHAPTER II FORECAST OF ELECTRIC POWER DEMAND AND ENERGY CONISUMPTION
Schedule 2.1
Schedule 2.2
Forecasting Documentation
Overview
Assu m ption s I.
II.
Ill.
IV.
V.
VI.
VII.
Customer Forecast
Energy Sales IForecast
Peak Demand Forecast
Data Sources
Conservation Programs
Small Power F'roduction/ Renewable Eniergy
History and Forecast of Energy Consumption and Number of Customers by Customer Class
History and Forecast of Energy Consumption and Number of Customers by Customer Class
Page
1
10
11
14
16
19
22
22
44
46
47
I
Page
Schedule 2.3
Schedule 3.1
Schedule 3.2
Schedule 3.3
Schedule 4
Schedule 5
Schedule 6.1
Schedule 6.2
Schedule 6.3
History and Forecast of Energy Consumption and Number of Customers by Customer Class
History and Forecast of Summer Peak Demand
History and Forecast of Winter Peak Demand
History and Forecast of Annual Net Energy for Load
Previous Year Actual and Two-Year Forecast of Peak Demand and Net Energy for Load by Month
Fuel Requirements
Energy Sources - GWH
Energy Sources - YO of NEL
Renewable Energy Sources
CHAPTER 111 PLANNING ASSUMPTIONS AND PROCESSES
Integrated Resource Planning Process
Transmission Planning Process
Fuel Price Forecast Process
Southern (SES) Generic Fuel Forecast
Coal Price Forecast
Natural Gas Price Forecast
Natural Gas Availability
Strategic Issues
Environmental Concerns
48
49
50
51
52
53
54
55
56
57
61
63
64
65
67
68
70
73
I1

Availability of System Interchange
Off-System Sales
CHAPTER IV FORECAST OF FACILITIES REQUIREMENTS
Schedule 7.1
Schedule 7.2
Schedule 8
Schedule 9
Schedule 10
Capacity Resource Alternatives
Preferred and Potential Sites for Capacity Additions
Forecast of Capacity, Demand, and Scheduled Maintenance at Time Of Summer Peak
Forecast of Capacity, Demand, and Scheduled Maintenance at Time Of Winter Peal(
Planned and Prospective Generating Facility Additions and Changes
Status Report and Specifications of Proposed Generating Facilities
Status Report and Specifications of Directly associated Transmission Lines
Paqe
79
79
80
83
90
91
92
94
95
I11

This page is intentionally blank.

GULF POWER COMPANY
TEN-YEAR SITE PLAN
Executive Sum maw
The Gulf Power Company 2009 Ten-Year Site Plan is filed with the Florida
Public Service Commission (FPSC) in accordance with the requirements of
Chapter 186.801, Florida Statutes, as revised by the Legislature in 1995. The
revision replaced the Florida Department of Community Affairs with the FPSC as
the state agency responsible for the oversight of the Ten-Year Site Plan (TYSP).
The 2009 TYSP for Gulf Power Company (Gulf) is being filed in compliance with
the applicable FPSC rules.
Gulf‘s 2009 TYSP contains the documentation of assumptions used for
the load forecast, fuel forecasts, the planning processes, existing resources, and
future capacity needs and resources. The resource planning process utilized by
Gulf to determine its future capacity needs is coordinated within the Southern
electric system Integrated Resource Planning (IRP) process. Gulf participates in
the IRP process along with other Southern electric system retail operating
companies, Alabama Power Company, Georgia Power Company, and
Mississippi Power Company, (collectively, the “Southern electric system” or
SES), and it shares in a number of benefits gained from planning in conjunction
with a large system such as the SES. These benefits include the economic
sharing of SES generating reserves, the ability to install large, efficient
generating units, and reduced requirements for operating reserves.
1
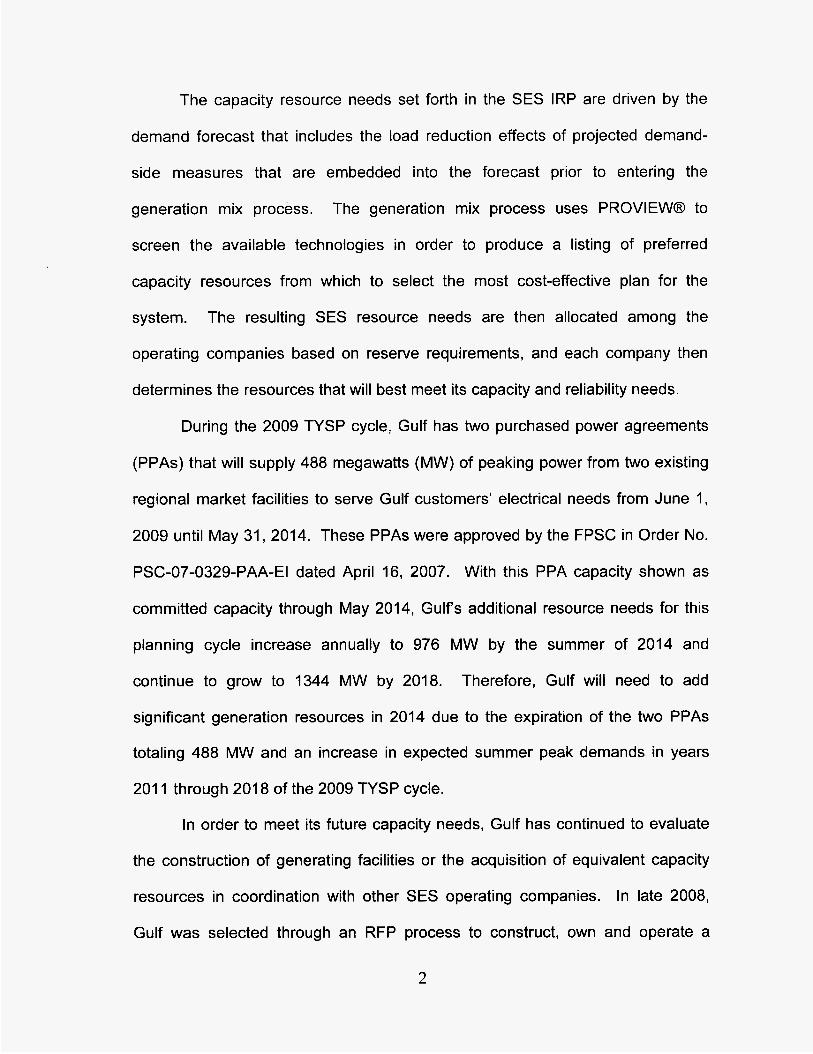
The capacity resource needs set forth in the SES IRP are driven by the
demand forecast that includes the load reduction effects of projected demand-
side measures that are embedded into the forecast prior to entering the
generation mix process. The generation mix process uses PROVIEW@ to
screen the available technologies in order to produce a listing of preferred
capacity resources from which to select the most cost-effective plan for the
system. The resulting SES resource needs are then allocated among the
operating companies based on reserve requirements, and each company then
determines the resources that will best meet its capacity and reliability needs.
During the 2009 TYSP cycle, Gulf has two purchased power agreements
(PPAs) that will supply 488 megawatts (MW) of peaking power from two existing
regional market facilities to serve Gulf customers’ electrical needs from June 1,
2009 until May 31,2014. These PPAs were approved by the FPSC in Order No.
PSC-07-0329-PAA-El dated April 16, 2007. With this PPA capacity shown as
committed capacity through May 2014, Gulfs additional resource needs for this
planning cycle increase annually to 976 MW by the summer of 2014 and
continue to grow to 1344 MW by 2018. Therefore, Gulf will need to add
significant generation resources in 2014 due to the expiration of the two PPAs
totaling 488 MW and an increase in expected summer peak demands in years
201 1 through 201 8 of the 2009 TYSP cycle.
In order to meet its future capacity needs, Gulf has continued to evaluate
the construction of generating facilities or the acquisition of equivalent capacity
resources in coordination with other SES operating companies. In late 2008,
Gulf was selected through an RFP process to construct, own and operate a
2
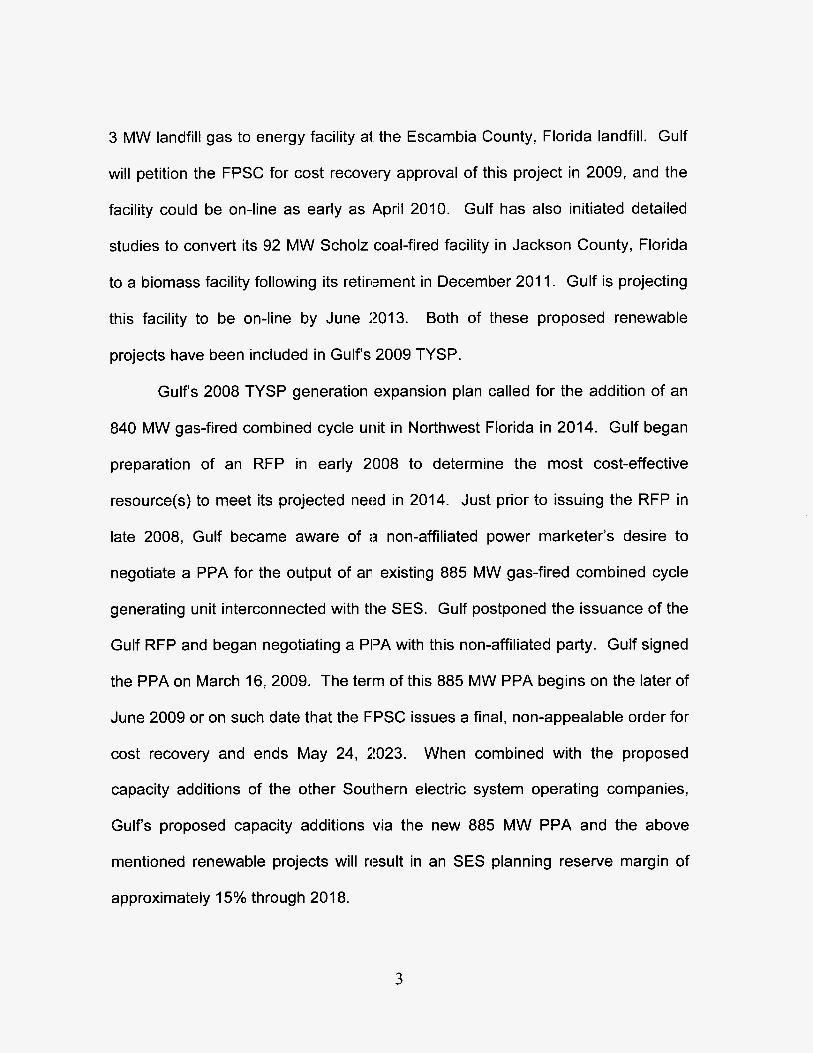
3 MW landfill gas to energy facility ai, the Escambia County, Florida landfill. Gulf
will petition the FPSC for cost recovery approval of this project in 2009, and the
facility could be on-line as early as April 2010. Gulf has also initiated detailed
studies to convert its 92 MW Scholz coal-fired facility in Jackson County, Florida
to a biomass facility following its retirement in December 201 1. Gulf is projecting
this facility to be on-line by June 2013. Both of these proposed renewable
projects have been included in Gulf's 2009 TYSP.
Gulf's 2008 TYSP generation expansion plan called for the addition of an
840 MW gas-fired combined cycle unit in Northwest Florida in 2014. Gulf began
preparation of an RFP in early 2008 to determine the most cost-effective
resource(s) to meet its projected need in 2014. Just prior to issuing the RFP in
late 2008, Gulf became aware of a non-affiliated power marketer's desire to
negotiate a PPA for the output of an1 existing 885 MW gas-fired combined cycle
generating unit interconnected with the SES. Gulf postponed the issuance of the
Gulf RFP and began negotiating a PPA with this non-affiliated party. Gulf signed
the PPA on March 16, 2009. The term of this 885 MW PPA begins on the later of
June 2009 or on such date that the FPSC issues a final, non-appealable order for
cost recovery and ends May 24, ;!023. When combined with the proposed
capacity additions of the other Southern electric system operating companies,
Gulf's proposed capacity additions via the new 885 MW PPA and the above
mentioned renewable projects will result in an SES planning reserve margin of
approximately 15% through 2018.
3

This 885 MW PPA is contingent upon receipt of a final, non-appealable
order from the FPSC for recovery of costs associated with the PPA. In the event
the PPA is not approved, Gulf will proceed with its plan to construct an 840 MW
combined cycle unit in Northwest Florida by issuing an RFP as soon as practical.
Studies to determine the latest cost and best location for this potential combined
cycle generating facility will have to be refreshed to include new economic factors
and the latest regulatory requirements, but the location of this self build project
has been narrowed to two primary sites at Gulfs existing generating facility sites
in Northwest Florida. Schedule 9 of this TYSP document contains more detailed
information on this potential combined cycle addition.
4

CHAPTER I
DESCRIPTION OF EXISTING FACILITIES


DESCRIPTION 0 f: EXIST1 NG FACl LIT1 ES
Gulf owns and operates generating facilities at four sites in Northwest
Florida (Plants Crist, Smith, Scholz, and Pea Ridge). Gulf also owns a 50%
undivided ownership interest in Unit 1 and Unit 2 at Mississippi Power
Company’s Daniel Electric Generating Facility. Gulf has a 25% ownership in Unit
3 at Georgia Power Company’s Scherer Electric Generating Facility which is
completely dedicated to wholesale unit power sale contracts. This fleet of
generating units consists of eleven fossil steam units, one combined cycle unit,
and four combustion turbines. Schedule 1 shows 930 MW of steam generation
located at the Crist Electric Generating Facility near Pensacola, Florida. The
Lansing Smith Electric Generating Facility near Panama City, Florida, includes
357 MW of steam generation, 556 MW (summer rating) of combined cycle
generation, and 32 MW (summer rating) of combustion turbine facilities. The
Scholz Electric Generating Facility, near Sneads, Florida, consists of 92 MW of
steam generation. Gulf‘s Pea Ridge Facility, in Pace, Florida, consists of three
combustion turbines associated with an existing customer’s cogeneration facility,
which adds 12 MW (summer rating) to Gulf‘s existing capacity.
Including Gulf‘s ownership interest in the Daniel fossil steam Units 1 and 2
and the Scherer fossil steam Unit 3, Gulf has a total net summer generating
capability of 2,711 MW and a total net winter generating capability of 2,750 MW.
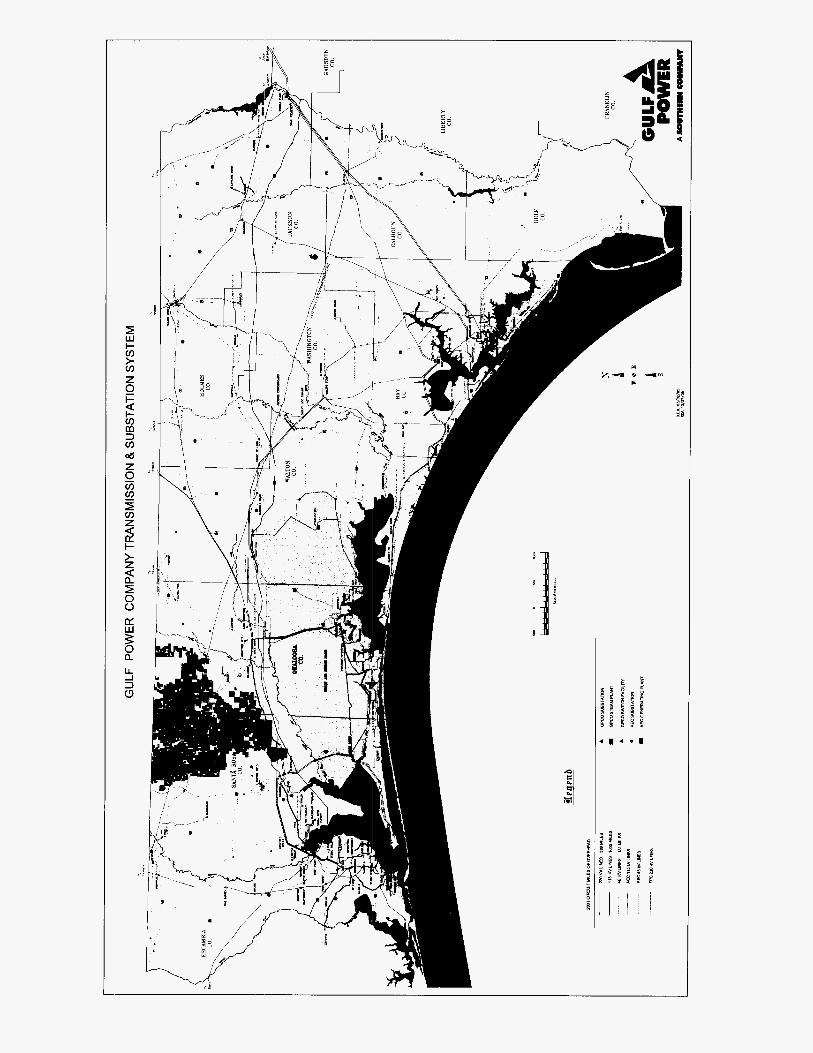
The existing Gulf system in Northwest Florida, including generating plants,
substations, transmission lines and service area, is shown on the system map on
5

page 9 of this TYSP.
presented on Schedule 1 of this TYSP.
Data regarding Gulf's existing generating facilities is
6

(1)
Plant Name
Crist
Lansing Smith
Scholz
(A) Daniel
(A) Scherer
Pea Ridge
Unit No. Location -
Escambia County 2511 N130W
4 5 6 7
Bay County 36/2S/1 5W
1 2 3 A
Jackson County 12/3N/7W
1 L
Jackson County, MS 42/5S/6W
1 L
3 Monroe County, GA
Santa Rosa County 15/1N/29W
1 2 3
(4)
Unit Type
FS FS FS FS
FS FS cc CT
FS FS
FS FS
FS
CT CT CT
GULF POWER COMPANY
SCHEDULE 1 EXISTING GENERATING FACILITIES
AS OF DECEMBER 31,2008
C C C C
C 2
NG LO
C C
C C
C
NG NG NG
(7) (8)
Fuel Transp Pri All - -
WA PL WA PL WA PL WA PL
WA --
PL -- TK --
.... v v n --
RR WA RR WA
RR TK RR TK
RR --
PL -- PL -- PL --
(10)
Com'l In- Service MoNr
7/59 616 1 5/70 8/73
6/65 61'67 4/02 517 1
3/53 10153
9/77 6/81
1 187
5/98 5/98 5/98
(11)
Exptd Retrmnt MoNr
12/24 12/26 12/35 12/38
12/30
12/37 12/17
l n l n n I L l J L
12/11 12/11
12/32 12/36
12/42
1211 8 12/18 12/18
(12)
Gen Max Nameplate
KW
1,135.250
93,750 93,750
369,750 578,000
1,001,500
149,600
619,650 41,850
Inn 1 n m IYU..tUU
98.ooo
49,000 49,000
548,250
274,125 274,125
222,750
14,250
4,750 4,750 4,750
Total Svstem
Page i of2
Net Capability Summer Winter
MW MW
930.0 930.0
78.0 78.0 78.0 78.0
302.0 302.0 472.0 472.0
945.0 981.0
162.0 162.0
556.0 584.0 32.0 40.0
- -
- -
- -
.ncn * n c n 1 Y J . U 1 Y J . U
- 92.0 92.0
46.0 46.0 46.0 46.0
- - 513.0 513.0
260.0 260.0 253.0 253.0
219.0 219.0
12.0 15.0
4.0 5.0 4.0 5.0 4.0 5.0
- -
2,711 .O 2,750.0

SCHEDULE 1
Abbreviations:
Fuel
FS - Fossil Steam CT - Combustion Turbine CC - Combined Cycle NG - Natural Gas C - Coal LO - Light Oil HO - Heavy Oil
Fuel Transportation
PL - Pipeline WA - Water TK - Truck RR - Railroad
Page 2 of 2
NOTE: (A) Unit capabilities shown represent Gulfs portion of Daniel Units 1 & 2 (50%) and Scherer Unit 3 (25%).


CHAPTER II
FORECAST OF ELECTRIC POWER DEMAND AND ENERGY CONSUMPTION


GULF POVU'ER COMPANY
LOAD FORECASTING METHODOLOGY
OVERVIEW
Gulf views the forecasting effort as a dynamic process requiring ongoing efforts
to yield results which allow informed planning and decision-making. The total
forecast is an integration of different techniques and methodologies, each applied to
the task for which it is best suited. Many of the techniques take advantage of the
extensive data made available through ,the Company's marketing efforts, which are
predicated on the philosophy of knowing and understanding the needs, perceptions
and motivations of our customers and actively promoting wise and efficient uses of
energy which satisfy customer needs. Gulf has been a pacesetter in the energy
efficiency market since the development and implementation of the Goodcents
Home program in the mid-70's. Thiis program brought customer awareness,
understanding and expectations regarding energy efficient construction standards in
Northwest Florida to levels unmatched elsewhere. Since that time, the Goodcents
Home program has seen many enhanclements, and has been widely accepted not
only by our customers, but by builders, contractors, consumers, and other electric
utilities throughout the nation, providing clear evidence that selling efficiency to
customers can be done successfully.
The Marketing Services section of Gulf's Marketing Department is responsible
for preparing forecasts of customers, energy and peak demand. A description of the
assumptions and methods used in the development of these forecasts follows.
10

I. ASSUMPTIONS
A. ECONOMIC OUTLOOK
In the months since Gulf Power produced its 2009 Budget, the national
economy was declared to be in a recession which started in December 2007. The
March 2008 economic forecast from Moody’s Economy.com, whose economics drive
the Gulf Power 2009 Budget, describes the national economy as contracting and on
its way to recession but not actually in recession. For the State of Florida, that
forecast describes the economy to be extremely weak. A primary cause for this
slowdown is the depressed housing market which was particularly severe in Florida.
The 2009 Budget forecast assumes that during 2008 real GDP growth will
slow to 1.5% but will grow by 3.5% for both 2009 and 2010 before decelerating to
2.8% in 201 1.
The March 2008 Moody’s Economy.com economic forecast predicted weak
conditions based on falling business and consumer confidence, the housing crisis, a
global financial lockdown, and high oil prices. The drop in both consumer and
business confidence is based on lost faith in a thriving economy starting in the
Summer of 2007 with the sub-prime financial crisis. Falling consumer confidence has
resulted in sluggish consumption spending. The housing crisis resulted in declining
home sales, house prices, and housing starts. Foreclosures continued to mount
signaling that the housing slump would continue. Normal credit flows in the domestic
and global financial system continued to deteriorate from rising mortgage defaults
and a flood of undervalued mortgage-backed securities. As a result, credit spreads
widened signaling the unwillingness of banks to lend. High energy prices in March
11

2008 continued to plague the economy as oil rose above $100 per barrel with higher
predictions over the summer. The high energy cost burden on consumers threatened
to erase any spending stimulus hoped for with the recent income tax rebates.
The resulting short-term outlook in the March 2008 forecast called for the
economy to struggle until the housing and mortgage markets find their footing.
Federal policies of monetary easing and increased fiscal stimulus were expected to
end a two-quarter stretch of mildly negative economic growth by mid-year, but more
fiscal stimulus would be needed to keep the recovery self-sustaining.
Over the long-run, real GDP is forlecasted to grow slightly faster while total
employment will be slightly slower compared to the 2008 Budget. These changes
were the result of studies showing slower inflation and lower labor force participation
rates. The long-term results, however, generally match last year's outlook. Real
GDP growth over the full 25 years of the forecast is predicted to rise from a 2.4%
compound annual rate in the 2008 Budget to 2.5% in the 2009 Budget. Total
employment over the 25-year long-term was forecast to grow 1.1 % in the 2008
Budget but slow to 0.7% in the 2009 Buclget. Real personal income growth remained
at 2.3% in both the 2007 Budget and 2008 Budget.
B. TERRITORIAL ECONOMIC OUTLOOK
Gulf's projections reflect the economic outlook for our service area as provided
by Moody's Economy.com, a renowned economic service provider. Gulf's forecast
assumes that service area population growth will continue to exceed the nation's
growth and slightly exceed the rate of growth for the state of Florida. Gulf's
projections incorporate electric price assumptions derived from the 2008 Gulf Power
12
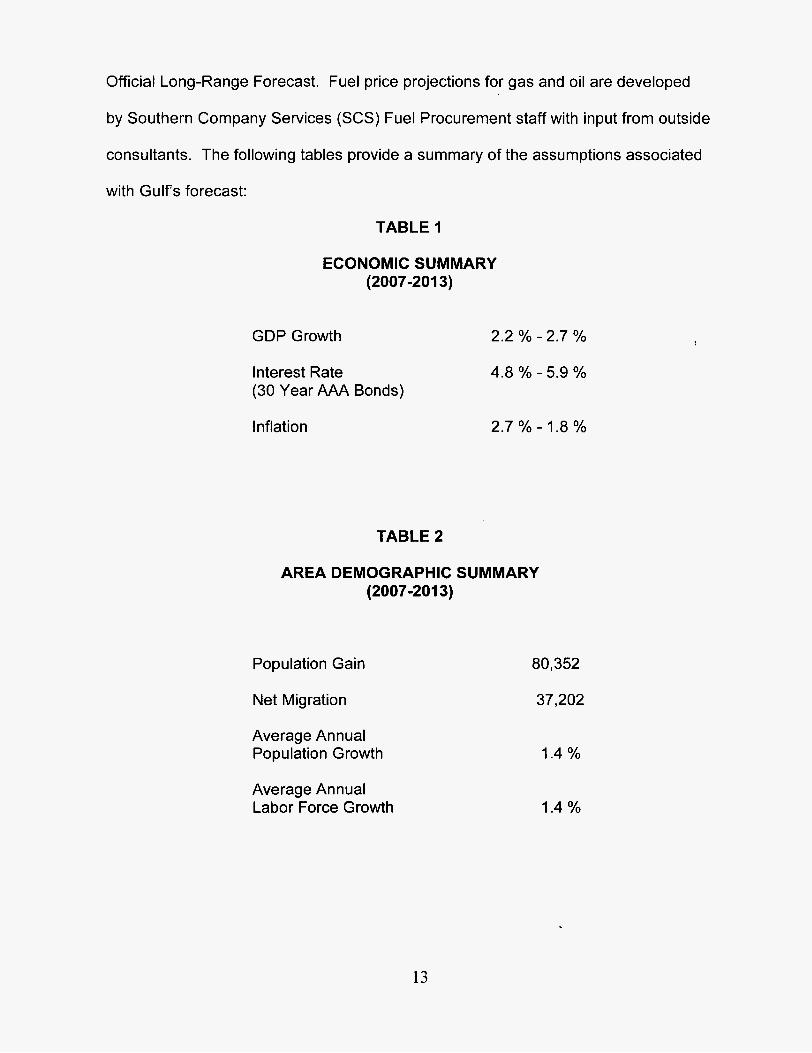
Official Long-Range Forecast. Fuel price projections for gas and oil are developed
by Southern Company Services (SCS) Fuel Procurement staff with input from outside
consultants. The following tables provide a summary of the assumptions associated
with Gulf's forecast:
TABLE I
ECONOMIC SUMMARY (2007-201 3)
GDP Growth 2.2 YO - 2.7 %
Interest Rate 4.8 Yo - 5.9 % (30 Year AAA Bonds)
Inflation 2.7 % - 1.8 %
TABLE 2
AREA DEMOGRAPHIC SUMMARY (2007-201 3)
Population Gain
Net Migration
Average Annual Population Growth
Average Annual Labor Force Growth
80,352
37,202
1.4 %
1.4 Yo
13
II. CUSTOMER FORECAST
A. RESIDENTIAL CUSTOMER FORECAST
The immediate short-term forecast (0-2 years) of customers is based
primarily on projections prepared by district personnel. Gulf district personnel
remain abreast of local market and economic conditions within their service
areas through direct contact with economic development agencies, developers,
builders, lending institutions and other key contacts. The projections prepared
by the districts are based upon reicent historical trends in customer gains and
their knowledge of locally planned construction projects from which they are
able to estimate the near-term anticipated customer gains. These projections
are then analyzed for consistency, and the incorporation of major construction
projects and business developments is reviewed for completeness and
accuracy. The end result is a near-term forecast of residential customers.
For the remaining forecast horizon (3-25 years), the Gulf Economic
Model, a competition-based econometric model developed by Moody’s
Economy.com, is used in the development of residential customer projections.
Projections of births, deaths, and population by age groups are determined by
past and projected trends. Migration is determined by economic growth relative
to surrounding areas.
The forecast of residential customers is an outcome of the final section
of the migration/demographic element of the model. The number of residential
customers Gulf expects to serve is calculated by multiplying the total number of
households located in the eight counties in which Gulf provides service by the
14
B.
percentage of customers in these eight counties for which Gulf currently
provides service.
The number of households referred to above is computed by applying a
household formation trend to the previously mentioned population by age group,
and then by summing the number of households in each of five adult age
categories. As indicated, there is a relationship between households, or
residential customers, and the age structure of the population of the area, as
well as household formation trends. The household formation trend is the
product of initial year household formation rates in the Gulf service area and
projected U.S. trends in household formation.
COMMERCIAL CUSTOMER FORECAST
The immediate short-term forecast (0-2 years) of commercial
customers, as in the residential sector, is prepared by the district personnel in
similar fashion utilizing recent historical customer gains information and their
knowledge of the local area economies and upcoming construction projects. A
review of the assumptions, techniques and results for each district is
undertaken, with special attention given to the incorporation of major
commercial development projects.
Beyond the immediate short-term period, commercial customers are
forecast as a function of residential customers, reflecting the growth of
commercial services to meet the needs of new residents. Implicit in the
commercial customer forecast is the relationship between growth in total real
disposable income and growth in the commercial sector.
15
111. ENERGY SALES FORECAST
A. RESIDENTIAL SALES FORECAST
The residential energy sales forecast is developed utilizing multiple
regression analyses. Monthly class energy use per customer per billing day is
estimated based upon recent historical data, expected normal weather and
projected price. The model output is then multiplied by the projected number of
customers and billing days by month to expand to the total residential class.
The residential sales forecast reflects the continued impacts of Gulfs
GoodCents Home program and efficiency improvements undertaken by
customers as a result of the GoodCents Energy Survey program, as well as
conversions to higher efficient outdoor lighting. The residential sales forecast
also reflects the anticipated incremental impacts of Gulf's Demand-Side
Management (DSM) Plan, approved in March 2005, designed to meet the
Commission-approved demand and energy reduction goals established in
September 2004. Additional information on the residential conservation
programs and program features are provided in the Conservation Programs
section of this document.
B. COMMERCIAL SALES FORECAST
The commercial energy sales forecast is also developed utilizing
multiple regression analyses. Monthly class energy use per customer per billing
day is estimated based upon recent historical data, expected normal weather
16

and projected price. The model output is then multiplied by the projected
number of customers and billing days by month to expand to the total
commercial class.
The commercial sales forecast reflects the continued impacts of Gulfs
Commercial Goodcents building program and efficiency improvements
undertaken by customers as a result of Commercial Energy Audits and
Technical Assistance Audits, as well as conversions to higher efficient outdoor
lighting. The commercial sales forecast also reflects the anticipated incremental
impacts of Gulf's DSM Plan, approved in March 2005, designed to meet the
Commission-approved demand and energy reduction goals established in
September 2004. Additional information on the Commercial Conservation
programs and program features are provided in the Conservation Proqrams
section of this document.
C. INDUSTRIAL SALES FORECAST
The short-term industrial energy sales forecast is developed using a
combination of on-site surveys of major industrial customers, trending
techniques, and multiple regression analyses. Gulf's largest industrial
customers are interviewed to identify load changes due to equipment addition,
replacement or changes in operating characteristics.
The short-term forecast of monthly sales to these major industrial
customers is a synthesis of the detailed survey information and historical
monthly load factor trends. The forecast of short-term sales to the remaining
17
smaller industrial customers is developed using a combination of trending
techniques and multiple regression analyses.
The long-term forecast of industrial energy sales is based on
econometric models of the chemical, pulp and paper, other manufacturing, and
non-manufacturing sectors. The industrial sales forecast also reflects the
anticipated incremental impacts of Gulf's DSM Plan, approved in March 2005,
designed to meet the Commission-approved demand and energy reduction
goals established in September 2004. Additional information on the
conservation programs and program features are provided in the Conservation
Programs section of this document.
D. STREET LIGHTING SALES FORECAST
The forecast of monthly (energy sales to street lighting customers is
based on projections of the number of fixtures in service, for each of the
available fixture types.
The projected number of fixtures by fixture type is developed from
analyses of recent historical fixture data to discern the patterns of fixture
additions and deletions. The estimated monthly kilowatt-hour consumption for
each fixture type is multiplied by the projected number of fixtures in service to
produce total monthly sales for a given type of fixture. This methodology allows
Gulf to explicitly evaluate the impacts of lighting programs, such as mercury
vapor to high pressure sodium conversions.
18

E. WHOLESALE ENERGY FORECAST
The forecast of energy sales to wholesale customers is developed
utilizing multiple regression analyses. Monthly energy purchases per day for
each of Gulf's wholesale customers are estimated based upon recent historical
data and expected normal weather. The model output is then multiplied by the
projected number of days by month to expand to the customer totals, which are
then summed to develop the class totals.
F. COMPANY USE & INTERDEPARTMENTAL ENERGY
The annual forecast for Company energy usage was based on recent
historical values, with appropriate adjustments to reflect short-term increases in
energy requirements for anticipated new Company facilities. The monthly
spreads were derived using historical relationships between monthly and annual
energy usage.
IV. PEAK DEMAND FORECAST
The peak demand forecast is prepared using the Hourly Electric Load
Model (HELM), developed by ICF, Incorporated, for EPRl under Project
RPI 955-1. The resulting output from the model is hourly electrical loads over
the forecast horizon.
The summer and winter peak demands are the maximum of the hourly
forecasted loads in July and January, respectively. Gulf's summer peak
demand typically occurs in the month of July, while Gulf's winter peak demand
typically occurs in the month of January.
19
Load shape forecasts halve always provided an important input to
traditional system planning functions. Forecasts of the pattern of demand have
acquired an added importance due to structural changes in the demand for
electricity and increased utility involvement in influencing load patterns for the
mutual benefit of the utility and its customers.
HELM represents an approach designed to better capture changes in
the underlying structure of electriciity consumption. Rapid increases in energy
prices during the 1970's and early 1980's brought about changes in the
efficiency of en erg y-usi ng eq u i p nnen t . Add it ional I y , sociode mog rap h ic and
microeconomic developments have changed the composition of electricity
consumption, including changes in fuel share, housing mix, household age and
size, construction features, mix of commercial services, and mix of industrial
products.
In addition to these naturally occurring structural changes, utilities have
become increasingly active in offering customers options which result in
modified consumption patterns. An important input to the design of such
demand-side programs is an assessment of their likely impact on utility system
loads.
HELM has been designed to forecast electric utility load shapes and to
analyze the impacts of factors such as alternative weather conditions, customer
mix changes, fuel share changes, and demand-side programs. The structural
detail of HELM provides forecasts of hourly class and system load curves by
weighting and aggregating load shalpes for individual rate level components.
20

Model inputs include rate level energy forecasts consistent with the cost
of service (COS) load shape data collected from COS load research samples as
well as individual customer load data for many of the larger customers. Inputs
are also required to reflect new technologies, rate structures and other demand-
side programs. Model outputs include hourly system and class load curves,
load duration curves, monthly system and class peaks, load factors and energy
requirements by season and rating period.
The methodology embedded in HELM may be referred to as a "bottom-
up" approach. Class and system load shapes are calculated by aggregating the
load shapes of component rates and individual large customer load shapes.
The system demand for electricity in hour i is modeled as the sum of demands
by each end-use in hour i:
Where: Li = system demand for electricity in hour i;
NR = number of residential rate class loads;
NC = number of commercial rate class loads;
NI = number of industrial rate class loads;
LR,i = demand for electricity by residential rate R in hour i;
Lc,i = demand for electricity by commercial rate C in hour i;
Ll,i = demand for electricity by industrial ratekustomer I in hour i;
Misci = other demands (wholesale, street lighting, losses, company
use) in hour i.
21
V. DATA SOURCES
Gulf utilizes Company historical customer, energy and revenue data by
rate and class, and historical hourly load data coupled with weather information
from Weather Data Viewer (WDV) and The National Oceanic and Atmospheric
Administration (NOAA) to drive the energy and demand models. Individual
customer historical data is utilized in developing the projections for Gulfs largest
commercial and industrial customers.
Gulf‘s models also utilize economic projections provided by Moody’s
Economy.com, a renowned economic services provider. Moody’s
Economy.com utilizes the Bureau of Labor Statistics for data on employment,
unemployment rate and labor force. Personal Income data is obtained from the
Bureau of Economic Analyses. Population and Population by Age Cohort,
Households and Housing Permit information is obtained from the U.S. Bureau of
Census.
VI. CONSERVATION PROGRAMS
As previously mentioned, Gulfs forecast of energy sales and peak
demand reflect the continued impacts of our conservation programs. The
following provides a listing of the current conservation programs and program
features with estimates of reductions in peak demand and net energy for load
reflected in the forecast as a result of these programs. These reductions also
reflect the anticipated impacts of these programs as submitted in Gulfs DSM
22
Plan filed December 1, 2004, modified on January 26, 2005 (Docket No.
040032-EG) and approved by the FPSC in Order No. PSC-05-0273-PAA-EG
issued March 14, 2005. By Order No. PSC-07-0455-PAA-EG issued on May
29, 2007, in Docket No. 070119-EG, the Commission approved minor
modifications to Gulf's Commercial and Residential Geothermal Heat Pump
Programs. In December 2008, the Commission approved two new pilot
programs in Order No. PSC-08-0802-PAA-EG for increased educational
emphasis of conservation and introduction of demand-side renewables in the
form of solar thermal water heating. Gulf's conservation programs were
designed to meet the incremental impacts of the Commission-approved demand
and energy reduction DSM goals established in Order No. PSC-04-0764-PAA-
EG on August 9,2004.
A. RES I D ENTl AL CONSERVATION
1. Goodcents Home/Enerqy Star
In the residential sector, Gulfs Goodcents Home/Energy Star
Program is designed to make cost-effective increases in the efficiencies of
the new home construction market. This is being achieved by placing
greater requirements on cooling and water heating equipment efficiencies,
proper HVAC sizing, increased insulation levels in walls, ceilings, and
floors, and tighter restrictions on glass area and infiltration reduction
practices. In addition, Gulf monitors proper quality installation of all the
above energy features. This program also provides the opportunity to offer
23
the Energy Star Home Program to Gulf's builders and customers and
correlates the performance of Goodcents Homes to the nationally
recognized Energy Star efficiency label. In many cases, a standard
Goodcents Home will also qualify as an Energy Star home. Approximately
69,000 new homes have been constructed to Good Cents standards under
this program resulting in an annual reduction of 79 MW of summer peak
demand and annual energy savings of 203 GWh.
2. GoodCents Energy Sunrey
Gulfs Goodcents Energy Survey Program is designed to
provide existing residential customers and individuals building new homes
with energy conservation advice that encourages the implementation of
efficiency measures and options that increase comfort and reduce energy
operating costs. This program is offered as an on-site, mail-in, or on-line
survey and in all cases the customer receives whole house
recommendations. Approximately 72,000 customers have participated in
the Energy Survey Program. These participants have implemented energy
efficiency improvements estimated to result in an annual reduction of 14
MW of summer peak demand and 40 GWh annual energy savings.
3. Geothermal Heat Pump
The Residential Geothermal Heat Pump Program reduces the
demand and energy requirements of new and existing residential
customers through the promotion and installation of advanced and
24
emerging geothermal systems. Geothermal heat pumps also provide
significant benefits to participating customers in the form of reduced
operating costs and increased comfort levels, and are superior to other
available heating and cooling technologies with respect to source efficiency
and environmental impacts. Gulf's Geothermal Heat Pump Program is
designed to overcome existing market barriers, specifically, lack of
consumer awareness, knowledge and acceptance of this technology.
Additionally, the program promotes efficiency levels well above current
market conditions. Approximately 2,200 geothermal heat pumps have
been installed in Gulf's service area resulting in an annual reduction in
summer peak demand of 4 MW and annual energy savings of 5 GWh.
4. Goodcents Select
The Goodcents Select Program, an advanced energy
management program, provides Gulf's customers with a means of
conveniently and automatically controlling and monitoring their energy
purchases in response to prices that vary during the day and by season in
relation to Gulf's cost of producing or purchasing energy. The GoodCents
Select system allows the customer to control more precisely the amount of
electricity purchased for heating, cooling, water heating, and other selected
loads and to purchase electric energy on a variable price rate, including a
critical peak price (CPP). The various components of the Goodcents
Select system installed in the customer's home, as well as the components
installed at Gulf, provide constant communication between customer and
25
utility. The combination of the GoodCents Select system and Gulf‘s
innovative variable rate concept provide consumers with the opportunity to
modify their usage of electricity in order to purchase energy at prices that
are somewhat lower to significantly lower than standard rates a majority of
the time. Further, the communication capabilities of the Goodcents Select
system allow Gulf to send a CPP signal to the customer’s premises during
extreme’peak load conditions. The signal results in a reduction attributable
to predetermined thermostat isnd relay settings chosen by the individual
participating customer. The customer’s pre-programmed instructions
regarding their desired comfort levels adjust electricity use for heating,
cooling, water heating and other appliances automatically. Therefore, the
customer’s control of their electric bill is accomplished by allowing them to
choose different comfort levels at different price levels in accordance with
their individual lifestyles. Currently, approximately 8,700 customers are
participating in this program resulting in an annual reduction of 24 MW in
summer peak demand and annual energy savings of 7 GWh.
5. Solar Thermal Water Heating (pilot)
The solar thermal water heating pilot program offers residential
customers a $1,000 rebate upon installation of a qualified solar water
heating system. Solar thermal1 water heating can reduce energy usage 50-
75% compared to conventional electric resistance water heating and also
provide summer coincident peak demand savings. This program will be
evaluated at the end of 2009 to determine customers’ acceptance of this
26

technology as well as verification of anticipated energy and demand
savings.
6. Energy Education (pilot)
The energy education program is designed to increase the
overall awareness of energy conservation opportunities across Gulf's
customer base and participation in Gulf's existing energy efficiency and
conservation programs. The program includes a broad based awareness
campaign, school-based education and teacher training, and building
contractor training on energy efficient construction practices. This program
will be evaluated at the end of 2009 to determine the impact on
conservation awareness and participation levels across Gulf's service area.
B. COMMERCIALANDUSTRIAL CONSERVATION
1. Goodcents Building
In the commercial sector, Gulfs Goodcents Building Program is
designed to make cost effective increases in efficiencies in both new and
existing commercial buildings with requirements resulting in energy
conserving investments that address the thermal efficiency of the building
envelope, interior lighting, heating and cooling equipment efficiency, and
solar glass area. Additional recommendations are made, where
applicable, on energy conserving options that include thermal storage, heat
27
recovery systems, water heating heat pumps, solar applications, energy
management systems, and high efficiency outdoor lighting. Approximately
10,500 customers under this program have achieved an annual reduction
of 105 MW in summer peak demand and annual energy savings of 211
GWh.
2. Commercial/lndustrial Energy Analyses
The Commercial/lnclustrial (C/I) Energy Analyses Program is an
interactive program that provides C/I customers assistance in identifying
energy conservation opportunities. This program is a prime tool for the
Gulf Power Company C/I IEnergy Specialist to personally introduce
customers to conservation measures including low or no-cost
improvements or new electro-technologies to replace old or inefficient
equipment. Further, this program facilitates the load factor improvement
process necessary to increase performance for both the customer and Gulf
Power Company.
The C/I Energy Anallysis Program allows the customer three
primary ways to participate. A basic Energy Analyses Audit (EAA) is
provided through either an on-site survey or a direct mail survey analysis.
Additionally, a more comprehensive analysis can be provided by
conducting a Technical Assistance Audit (TAA). Approximately 18,400
customers participating in these programs have achieved an annual
reduction of 25 MW in summer peak demand and annual energy savings of
7 GWh.
28
3. Commercial Geothermal Heat Pump
The objective of the Commercial Geothermal Heat Pump
Program is to reduce the demand and energy requirements of new and
existing Commercial/lndustriaI customers through the promotion and
installation of advanced and emerging geothermal systems. Due to the
long life of space conditioning equipment, the choices that are made over
the next decade regarding space conditioning equipment will have
important economic and environmental ramifications lasting well into the
future. Geothermal heat pumps provide significant benefits to participating
customers in the form of reduced operating costs and increased comfort
levels, and are superior to other available heating and cooling technologies
with respect to source efficiency and environmental impacts. This program
will promote efficiency levels well above current market conditions,
specifically those units with an Energy Efficiency Ratio (EER) of 13.0 or
higher.
4. Real-Time Pricing
Gulf's Real Time Pricing (RTP) program is designed to take
advantage of customer price response to achieve peak demand
reductions. Customer participation is voluntary. Due to the nature of the
pricing arrangement included in this program, there are some practical
limitations to customers' ability to participate. These limitations include the
ability to purchase energy under a pricing plan which includes price
variation and unknown future prices; the transaction costs associated with
29
receiving, evaluating, and acting on prices received on a daily basis;
customer risk management policy; and other technicaVeconomic factors.
Customers participating in this program typically exhibit approximately 50
MW of reduction in summer peak demand.
5. Enemy Services
Gulf's Energy Services Program is designed to offer advanced
energy services and energy efficient end-use equipment to meet the
individual needs of large customers. These energy services include
comprehensive audits, design, construction and financing of demand
reduction or efficiency improvement energy conservation projects. This
program has resulted in a recluction of 13 MW of summer peak demand
and 42 GWh in annual energy savings.
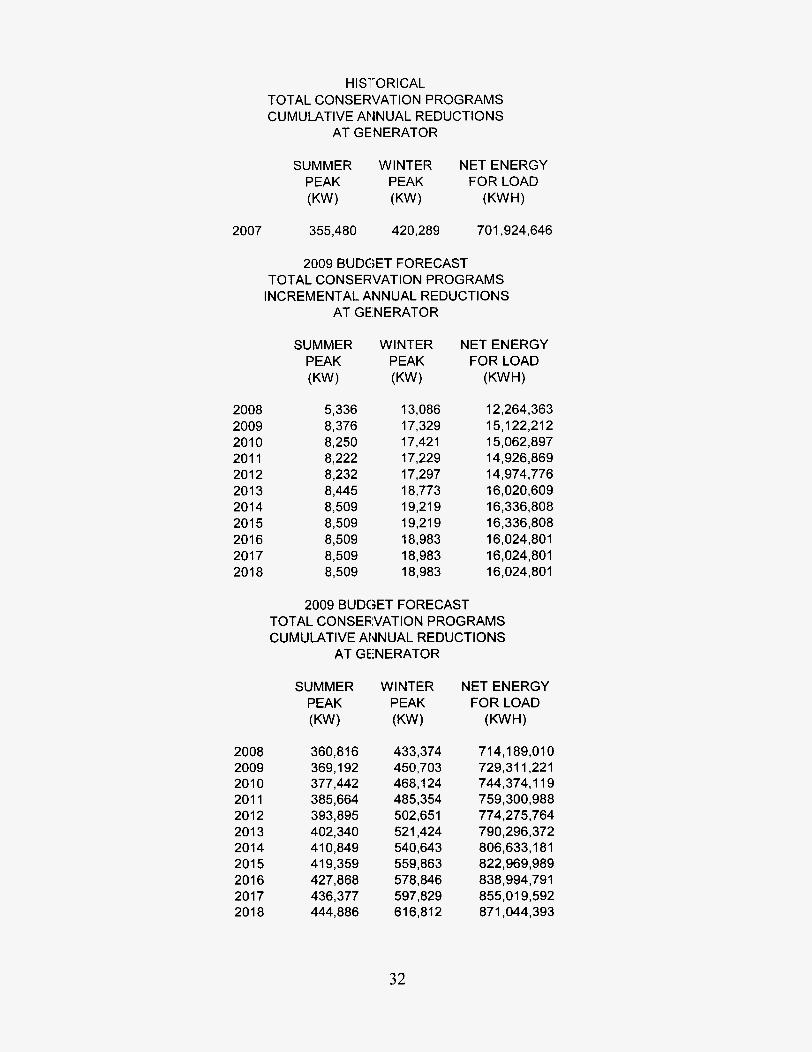
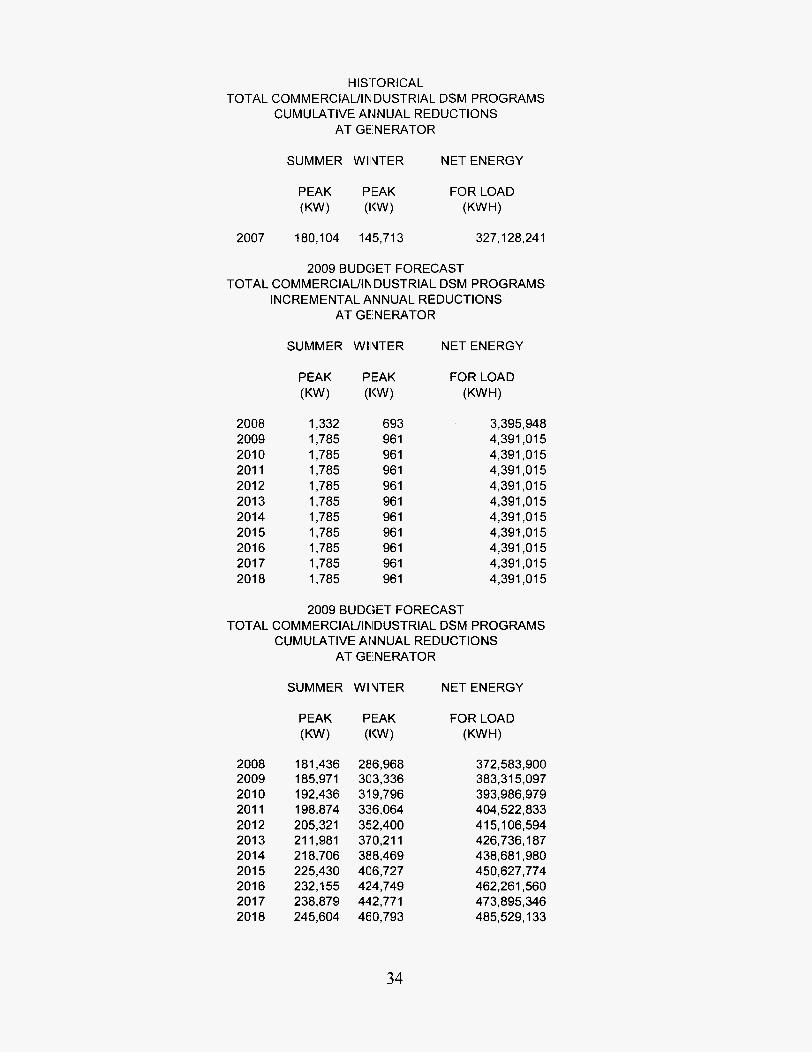
C. CONSERVATION RESULTS SUMMARY
The following tables provide direct estimates of the energy
savings (reductions in peak demand and net energy for load) realized by
Gulfs conservation programs. These reductions are verified through on-
going monitoring in place or1 Gulfs major conservation programs and
reflect estimates of conservation undertaken by customers as a result of
Gulfs involvement. The coinservation without Gulfs involvement has
contributed to further unquantifiable reductions in demand and net energy
30

for load. These unquantifiable additional reductions are captured in the
time series regressions in our demand and energy forecasts.
31
2007
HISTORICAL TOTAL CONSERVATION PROGRAMS CUMULATIVE ANNUAL REDUCTIONS
AT GENERATOR
SUMMER WINTER NET ENERGY PEAK PEAK FOR LOAD (KW) (KW) (KWH)
355,480 420,289 701,924,646
2008 2009 201 0 201 1 2012 201 3 2014 201 5 201 6 2017 201 8
2009 BUDGET FORECAST TOTAL CONSERVATION PROGRAMS
INCREMENTAL ANNUAL REDUCTIONS AT GE.NERATOR
SUMMER WINTER NET ENERGY PEAK PEAK FOR LOAD (KW) (KW) (KWH)
2008 2009 201 0 201 1 201 2 201 3 2014 201 5 201 6 201 7 201 8
5,336 8,376 8,250 8,222 8,232 8,445 8,509 8,509 8,509 8,509 8,509
13,086 17,329 17,421 17,229 17,297 18,773 1921 9 19,219 18,983 18,983 18.983
12,264,363 1 5,122,212 15,062,897 1 4,926,869 1 4,974,776 16,020,609 16,336,808 16,336,808 16,024,801 16,024,801 16,024,801
2009 BUDGET FORECAST TOTAL CONSEFilVATlON PROGRAMS CUMULATIVE ANNUAL REDUCTIONS
AT GEiNERATOR
SUMMER WINTER NET ENERGY PEAK PEAK FOR LOAD (KW) (KW) (KWH)
360,816 369,192 377,442 385,664 393,895 402,340 410,849 419,359 427,868 436,377 444,886
433,374 450,703 468,124 485,354 502,651 521,424 540,643 559,863 578,846 597,829 616,812
714,189,010 729,311,221 744,374,119 759,300,988 774,275,764 790,296,372 806,633,181 822,969,989 838,994,791 855,019,592 871,044,393
32

HISTORICAL TOTAL RESIDENTIAL CONSERVATION CUMULATIVE ANNUAL REDUCTIONS
AT GENERATOR
SUMMER WINTER NET ENERGY
PEAK (KW)
PEAK (KW)
2007 175,376 274,575 363,715,485
2009 BUDGET FORECAST TOTAL RESIDENTIAL CONSERVATION I N C RE M E NTAL ANNUAL REDUCTIONS
AT GENERATOR
2008 2009 2010 201 1 2012 2013 2014 201 5 201 6 201 7 201 8
SUMMER
PEAK (KW)
4,004 6,591 6,465 6,437 6,447 6,660 6,725 6,725 6,725 6,725 6,725
WINTER
PEAK (KW)
12,393 16,368 16,460 16,268 16,336 17,812 18,258 18,258 18,022 18,022 18,022
NET ENERGY
FOR LOAD (KWH)
8,868,415 10,731,197 10,671,882 10,535,854 10,583,761 11,629,594 11,945,793 11,945,793 11,633,786 11,633,786 11,633,786
2009 BUDGET FORECAST TOTAL RESIDENTIAL CONSERVATION CUMULATIVE ANNUAL REDUCTIONS
AT GENERATOR
SUMMER WINTER NET ENERGY
2008 2009 2010 201 1 2012 201 3 2014 2015 2016 2017 2018
PEAK (KW)
179,380 185,971 192,436 198,874 205,321 21 1,981 218,706 225,430 232,155 238,879 245,604
PEAK (KW)
286,968 303,336 31 9,796 336,064 352,400 370,211 388,469 406,727 424,749 442,771 460,793
372,583,900 383,315,097 393,986,979 404,522,833 4 1 5,106,594 426,736,187 438,681,980 450,627,774 462,261,560 473,895,346 485,529,133
33
H ISTO Rl CAL TOTAL COMMERCIAL/IN'DUSTRIAL DSM PROGRAMS
CUMULATIVE ANNUAL REDUCTIONS AT GElNERATOR
SUMMER WllVTER NET ENERGY
2007 180,104 145,713 327,128,241
2009 BUDGET FORECAST TOTAL COMMERCIALANIDUSTRIAL DSM PROGRAMS
INCREMENTAL ANNUAL REDUCTIONS AT GEiNERATOR
SUMMER WllVTER NET ENERGY
2008 2009 201 0 201 1 201 2 201 3 2014 201 5 2016 2017 201 8
1,332 1,785 1,785 1,785 1,785 1,785 1,785 1,785 1,785 1,785 1,785
693 96 1 96 1 96 1 96 1 96 1 96 1 96 1 96 1 96 1 96 1
3,395,948 4,391,015 4,391,015 4,391,015 4,391,015 4,391,015 4,391,015 4,391,015 4,391,015 4,391,015 4,391,015
2009 BUDGET FORECAST TOTAL COMMERCIAL/lhlDUSTRIAL DSM PROGRAMS
CUMULATIVE ANNUAL REDUCTIONS AT GENERATOR
SUMMER WIINTER NET ENERGY
2008 2009 201 0 201 1 201 2 201 3 2014 201 5 201 6 201 7 201 8
181,436 185,971 192,436 198,874 205,321 21 1,981 21 8,706 225,430 232,155 238,879 245,604
286,968 303,336 319,796 336,064 352,400 370,211 388,469 406,727 424,749 442,771 460,793
372,583,900 383.31 5,097 393,986,979 404,522,833 415,106,594 426,736,187 438,681,980 450,627,774 462,261,560 473,895,346 485,529,133
34
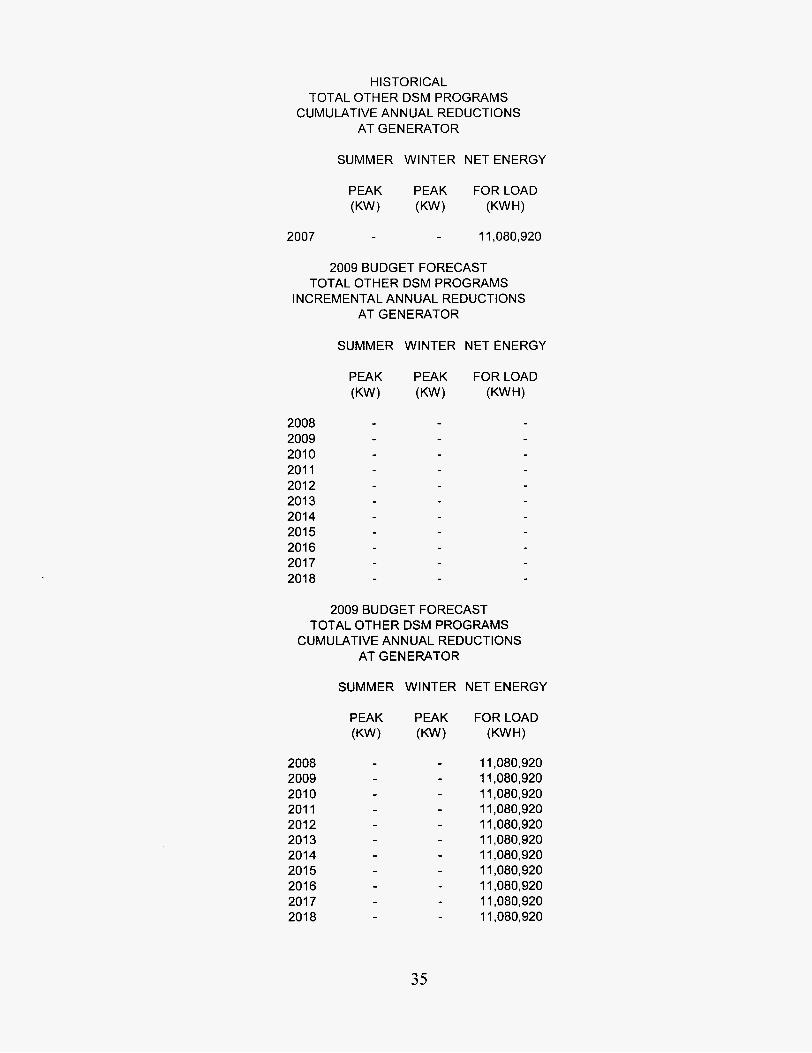
H I STORl CAL TOTAL OTHER DSM PROGRAMS
CUMULATIVE ANNUAL REDUCTIONS AT GENERATOR
SUMMER WINTER NET ENERGY
2007 11,080,920
2009 BUDGET FORECAST TOTAL OTHER DSM PROGRAMS
INCREMENTAL ANNUAL REDUCTIONS AT GENERATOR
SUMMER WINTER NET ENERGY
2008 2009 201 0 201 1 2012 2013 2014 2015 201 6 2017 201 8
2009 BUDGET FORECAST TOTAL OTHER DSM PROGRAMS
CUMULATIVE ANNUAL REDUCTIONS AT GENERATOR
SUMMER WINTER NET ENERGY
2008 2009 201 0 201 1 2012 201 3 2014 201 5 2016 201 7 201 8
11,080,920 1 1,080,920 11,080,920 11,080,920 11,080,920 11,080,920 11,080,920 11,080,920 11,080,920 11,080,920 11,080,920
35

HISTORICAL TOTAL EXlSTlhIG DSM PROGRAMS
CUMULATIVE ANN U AL RED U CTI 0 N S AT GEINERATOR
SUMMER WINTER NET ENERGY
PEAK PEAK FORLOAD (KW) (KW) (KWH)
2007 234,989 299,964 561,046,095
2009 BUDGET FORECAST TOTAL EXlSTlhlG DSM PROGRAMS
INCREMENTAL ANNUAL REDUCTIONS AT GEiNERATOR
SUMMER WINTER NET ENERGY
PEAK PEAK FORLOAD (KW) (KW) (KWH)
2008 1,127 8,385 5,673,680 2009 1,246 9,207 6,256,208 2010 1,248 9,221 6,266,575 201 1 1,220 9,030 6,130,547 2012 1,230 9,097 6,178,454 201 3 1,443 10,573 7,224,287 2014 1,507 11,020 7,540,486 2015 1,507 11,020 7,540,486 2016 1,507 11,020 7,540,486 2017 1,507 11,020 7,540,486 201 8 1,507 11,020 7,540,486
2009 BUDGET FORECAST TOTAL EXISTING DSM PROGRAMS
CUMULATIVE ANNUAL REDUCTIONS AT GEINERATOR
SUMMER WINTER NET ENERGY
2008 2009 201 0 201 1 201 2 2013 2014 201 5 2016 201 7 201 8
236,116 237,362 238,610 239,830 241,060 242,503 244,011 245,518 247,026 248,533 250,040
308,349 317,556 326,777 335,807 344,904 355,477 366,497 37751 6 388,536 399,555 41 0,575
566,719,775 572,975,983 579,242,558 585,373,105 591,551,559 598,775,846 606,316,332 613,856,818 621,397,304 628,937,791 636,478,277
36
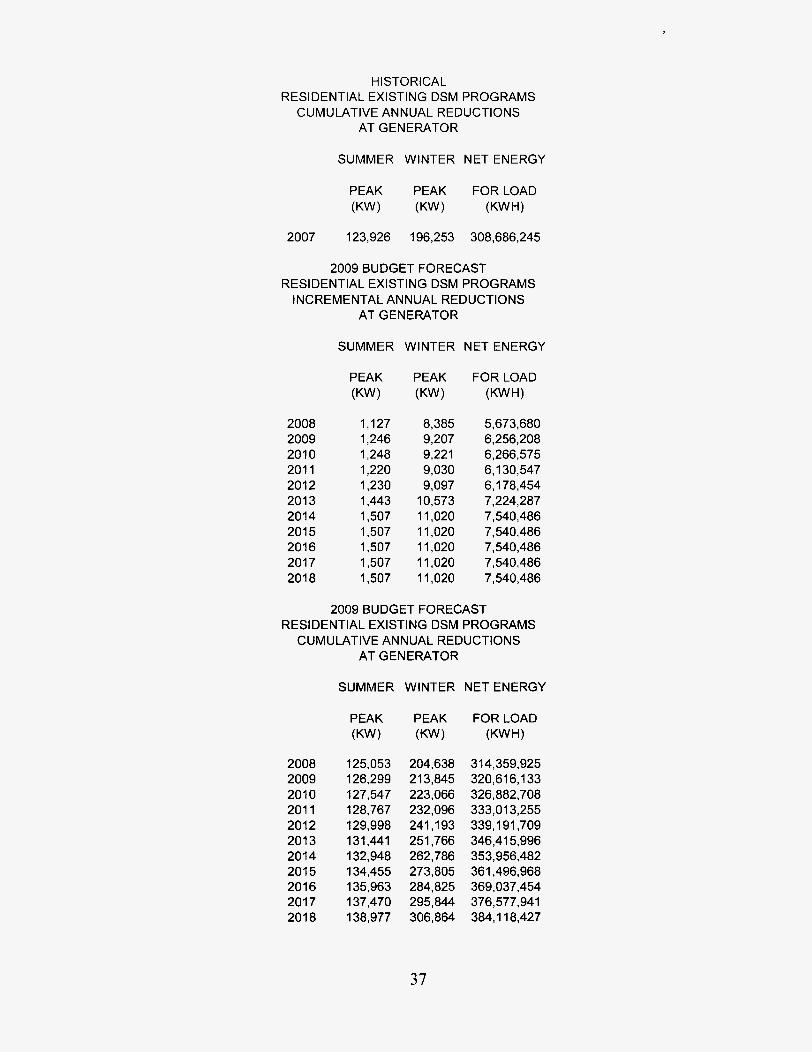
HISTORICAL RESIDENTIAL EXISTING DSM PROGRAMS
CUMULATIVE ANNUAL REDUCTIONS AT GENERATOR
SUMMER WINTER NET ENERGY
PEAK (KW)
PEAK (KW)
2007 123,926 196,253 308,686,245
2009 BUDGET FORECAST RESIDENTIAL EXISTING DSM PROGRAMS
INCREMENTAL ANNUAL REDUCTIONS AT GENERATOR
2008 2009 2010 201 1 2012 201 3 2014 201 5 2016 201 7 201 8
SUMMER
PEAK (KW)
1,127 1,246 1,248 1,220 1,230 1,443 1,507 1,507 1,507 1,507 1,507
WINTER NET ENERGY
PEAK (KW)
8,385 9,207 9,221 9,030 9,097
10,573 11,020 11,020 11,020 11,020 11,020
5,673,680 6,256,208 6,266,575 6,130,547 6,178,454 7,224,287 7,540,486 7,540,486 7,540,486 7,540,486 7,540,486
2009 BUDGET FORECAST RESIDENTIAL EXISTING DSM PROGRAMS
CUMULATIVE ANNUAL REDUCTIONS AT GENERATOR
SUMMER WINTER NET ENERGY
2008 2009 201 0 201 1 201 2 201 3 2014 201 5 2016 201 7 201 8
PEAK (KW)
125,053 126,299 127,547 128,767 129,998 131,441 132,948 134,455 135,963 137,470 138,977
PEAK (KW)
204,638 213,845 223,066 232,096 241,193 251,766 262,786 273,805 284,825 295,844 306,864
31 4,359,925 320,616,133 326,882,708 333,013,255 339,191,709 346,415,996 353,956,482 361,496,968 369,037,454 376,577,941 384,118,427
37
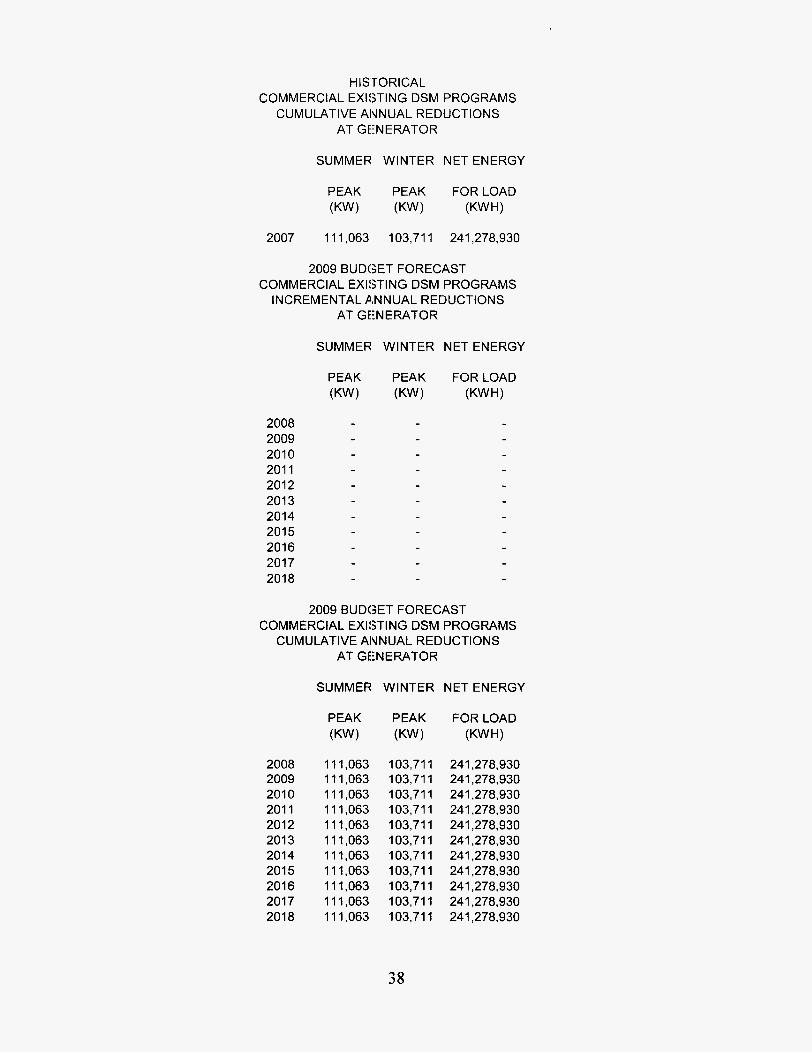
H I S'TORI CAL COMMERCIAL EXISTING DSM PROGRAMS
CUMULATIVE ANNUAL REDUCTIONS AT GEiNERATOR
SUMMER WINTER NET ENERGY
2007 11 1,063 103,711 241,278,930
2009 BUDGET FORECAST COMMERCIAL EXISTING DSM PROGRAMS
AT GEiNERATOR INCREMENTAL ANNUAL REDUCTIONS
SUMMER WINTER NET ENERGY
2008 2009 201 0 201 1 2012 201 3 2014 2015 2016 201 7 2018
2009 BUDGET FORECAST COMMERCIAL EXISTING DSM PROGRAMS
CUMULATIVE ANNUAL REDUCTIONS AT GEiNERATOR
SUMMER WINTER NET ENERGY
2008 2009 201 0 201 1 201 2 201 3 2014 201 5 201 6 201 7 201 8
111,063 1 11,063 11 1,063 11 1,063 111,063 11 1,063 111,063 111,063 111,063 111,063 11 1,063
103,711 103,711 103,711 103,711 103,711 103,711 103,711 103,711 103,711 103,711 103,711
241,278,930 241,278,930 241,278,930 241,278,930 241,278,930 241,278,930 241,278,930 241,278,930 241,278,930 241,278,930 241,278,930
38

H ISTORI CAL OTHER EXISTING DSM PROGRAMS CUM U LATl VE ANNUAL RE DUCT1 ON S
AT GENERATOR
SUMMER WINTER NET ENERGY
2007
PEAK (KW)
PEAK (KW)
11,080,920
2009 BUDGET FORECAST OTHER EXISTING DSM PROGRAMS
INCREMENTAL ANNUAL REDUCTIONS AT GENERATOR
SUMMER WINTER NET ENERGY
2008 2009 201 0 201 1 2012 201 3 2014 201 5 2016 2017 2018
PEAK (KW)
PEAK (KW)
2009 BUDGET FORECAST OTHER EXISTING DSM PROGRAMS CUMULATIVE ANNUAL REDUCTIONS
AT GENERATOR
SUMMER WINTER NET ENERGY
2008 2009 201 0 201 1 201 2 201 3 2014 201 5 2016 2017 201 8
PEAK (KW)
PEAK (KW)
FOR LOAD (KWW
11,080,920 11,080,920 11,080,920 11,080,920 11,080,920 11,080,920 11,080,920 11,080,920 11,080,920 11,080,920 11,080,920
39
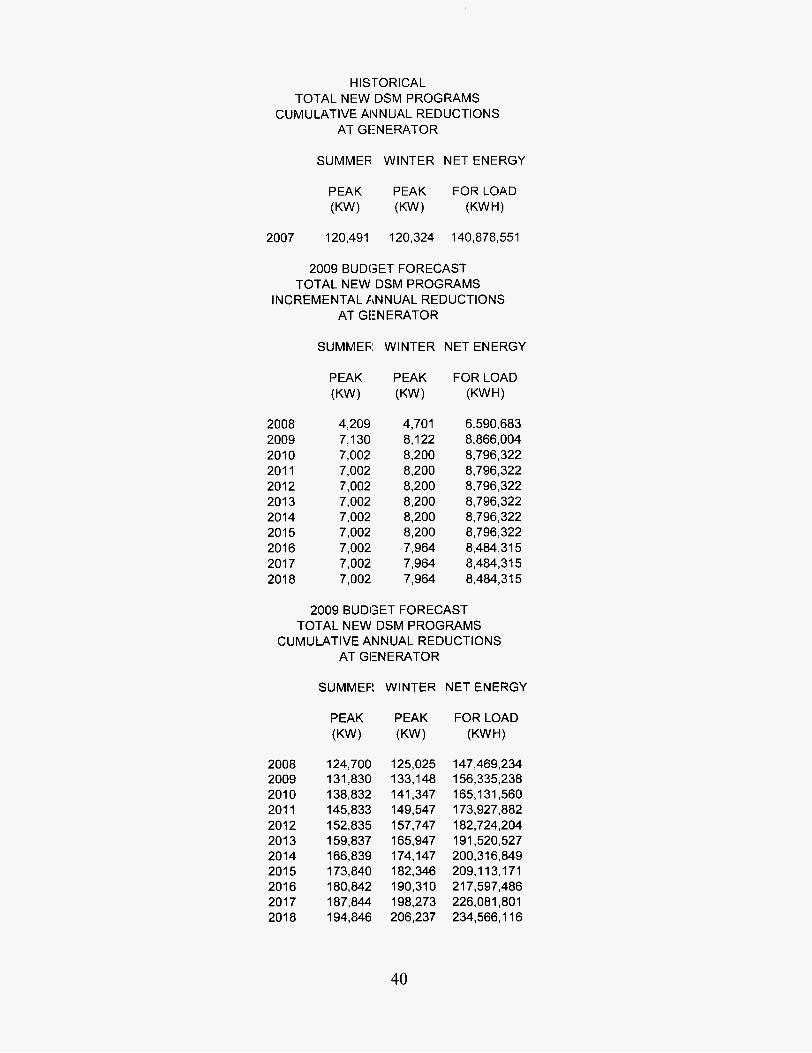
H IS TORICAL TOTAL NEW DSM PROGRAMS
CUMULATIVE ANNUAL REDUCTIONS AT GEiNERATOR
SUMMER WINTER NET ENERGY
2007 120,491 120,324 140,878,551
2009 BUDGET FORECAST TOTAL NEW DSM PROGRAMS
I N C REMENTAL ANN U AL REDUCTIONS AT GENERATOR
SUMMEF! WINTER NET ENERGY
2008 2009 201 0 201 1 2012 201 3 2014 2015 2016 2017 201 8
4,209 7,130 7,002 7,002 7,002 7,002 7,002 7,002 7,002 7,002 7,002
4,701 8,122 8,200 8,200 8,200 8,200 8,200 8,200 7,964 7,964 7,964
6,590,683 8,866,004 8,796,322 8,796,322 8,796,322 8,796,322 8,796,322 8,796,322 8,484,315 8,484,315 8,484,315
2009 BUDGET FORECAST TOTAL NEW DSM PROGRAMS
CUMULATIVE ANNUAL REDUCTIONS AT GENERATOR
SUMMEF! WINTER NET ENERGY
2008 2009 201 0 201 1 2012 2013 2014 201 5 2016 201 7 201 8
124,700 131,830 138,832 145,833 152,835 159,837 166,839 173,840 180,842 187,844 194,846
125,025 1 33,148 141,347 149,547 157,747 165,947 174,147 1 82,346 190,310 198,273 206,237
147,469,234 156,335,238 165,131,560 173,927,882 182,724,204 191,520,527 200,316,849 209,113,171 217,597,486 226,081,801 234,566,116
40
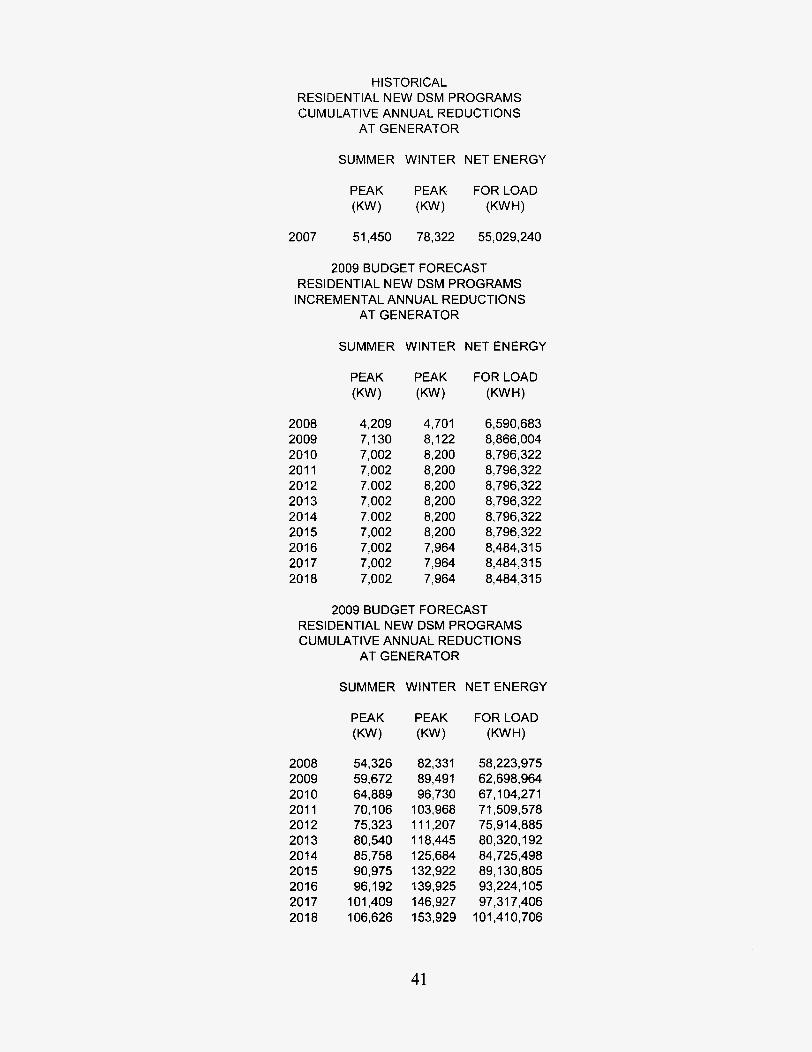
HISTORICAL RESIDENTIAL NEW DSM PROGRAMS C UMU LATl VE ANNUAL REDUCTIONS
AT GENERATOR
SUMMER WINTER NET ENERGY
PEAK (KW)
PEAK (KW)
2007 51,450 78,322 55,029,240
2009 BUDGET FORECAST RESIDENTIAL NEW DSM PROGRAMS INCREMENTAL ANNUAL REDUCTIONS
AT GENERATOR
2008 2009 201 0 201 1 2012 201 3 2014 201 5 2016 2017 201 8
SUMMER
PEAK (KW)
4,209 7,130 7,002 7,002 7,002 7,002 7,002 7,002 7,002 7,002 7,002
WINTER NET ENERGY
PEAK (KW)
4,701 8,122 8,200 8,200 8,200 8,200 8,200 8,200 7,964 7,964 7,964
6,590,683 8,866,004 8,796,322 8,796,322 8,796,322 8,796,322 8,796,322 8,796,322 8,484,315 8,484,315 8,484,315
2009 BUDGET FORECAST RESIDENTIAL NEW DSM PROGRAMS CUMULATIVE ANNUAL REDUCTIONS
AT GENERATOR
SUMMER WINTER NET ENERGY
2008 2009 201 0 201 1 2012 2013 2014 201 5 2016 2017 201 8
PEAK (KW)
54,326 59,672 64,889 70'1 06 75,323 80,540 85,758 90,975 96,192
101,409 106,626
PEAK (KW)
82,331 89,491 96,730
103,968 11 1,207 1 18,445 125,684 132,922 139,925 146,927 153,929
58,223,975 62,698,964 67,104,271 71,509,578 7591 4,885 80,320,192 84,725,498 89,130,805 93,224,105 97,317,406
101,410,706
41
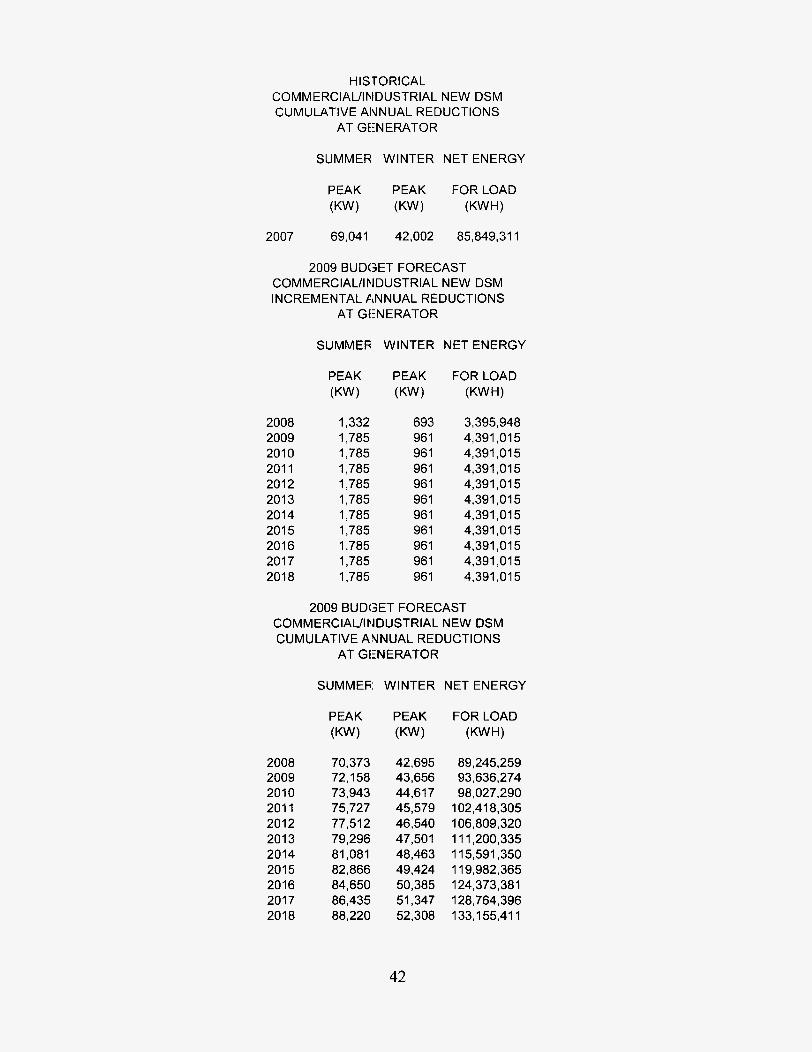
HIS'TORICAL COMMERCIAL/INDUSTRIAL NEW DSM CUMULATIVE ANNUAL REDUCTIONS
AT GEENERATOR
SUMMER WINTER NET ENERGY
PEAK PEAK FORLOAD (KW) (KW) (KWH)
69,041 42,002 85,849,311
2009 BUDGET FORECAST COMMERCIAUINDUSTRIAL NEW DSM INCREMENTAL ANNUAL REDUCTIONS
AT GE!NERATOR
2007
2008 2009 201 0 201 1 201 2 201 3 2014 201 5 201 6 2017 2018
SUMMER
PEAK (KW)
1,332 1,785 1,785 1,785 1,785 1,785 1,785 1,785 1,785 1,785 1,785
WINTER NET ENERGY
PEAK (KW)
693 96 1 96 1 96 1 96 1 96 1 96 1 961 961 961 961
3,395,948 4,391,015 4,391,015 4,391,015 4,391,015 4,391,015 4,391,015 4,391,015 4,391,015 4,391,015 4,391,015
2009 BUDGET FORECAST COMMERCIAL/INDUSTRIAL NEW DSM CUMULATIVE AINNUAL REDUCTIONS
AT GENERATOR
2008 2009 2010 201 1 2012 201 3 2014 2015 2016 2017 2018
SUMMER:
PEAK (KW)
70,373 72,158 73,943 75,727 77,512 79,296 81,081 82,866 84,650 86,435 88,220
WINTER NET ENERGY
PEAK (KW)
42,695 43,656 44,617 45,579 46,540 47,501 48,463 49,424 50,385 51,347 52,308
89,245,259 93,636,274 98,027,290
102,418,305 106,809,320 11 1,200,335 115,591,350 119,982,365 124,373,381 1 28,764,396 133,155,411
42

HISTORICAL OTHER NEW DSM PROGRAMS
CUMULATIVE ANNUAL REDUCTIONS AT GENERATOR
2007
SUMMER WINTER NET ENERGY
PEAK PEAK FOR LOAD
(KW) (KW) (KWH1
2009 BUDGET FORECAST OTHER NEW DSM PROGRAMS
INCREMENTAL ANNUAL REDUCTIONS AT GENERATOR
SUMMER WINTER NET ENERGY
PEAK PEAK FOR LOAD
(KW) (KW) (KWH)
2008 2009 201 0 201 1 201 2 201 3 2014 201 5 201 6 201 7 201 8
2009 BUDGET FORECAST OTHER NEW DSM PROGRAMS
CUMULATIVE ANNUAL REDUCTIONS AT GENERATOR
SUMMER WINTER NET ENERGY
PEAK PEAK FOR LOAD
(KW) (KW) (KWH)
2008 2009 201 0 201 1 2012 201 3 2014 201 5 201 6 201 7 201 8
43

VII. SMALL POWER PRODUCTION I RENEWABLE ENERGY
The current forecasts also consider Gulfs active position in the
promotion of renewable energy resources. Gulf initiated implementation of a
renewable energy program, Solar for Schools, to obtain funding for the
installation of solar technologies in participating school facilities combined with
energy conservation education of students. Initial solicitation began in
September 1996 and has resulted in participation of approximately 208
customers contributing $73,800 through December, 2008. Four small solar
photovoltaic (PV) demonstration systems have been installed throughout
Northwest Florida as part of this program.
Gulf customers also now have the opportunity to participate in a FPSC-
approved ”green pricing” alternative. Rate Rider PV gives customers an
opportunity to help pay for the construction of a photovoltaic generating facility.
This project is a Southern Company-wide effort; with Gulf and her sister
company Alabama Power Company the first to roll out their programs. The
facility will be built within Southern Company’s service area or the power will be
purchased from other photovoltaic generating facilities. Approximately 10,000
customers are initially needed to sign up in order to begin construction of a one
MW generating facility. As of December, 2008, 57 customers have pledged to
purchase a total of 73 hundred-watl. blocks of generation at a monthly rate of $6
per block. The time frame for potential construction will be determined as
participation levels increase.
44

Please refer to the Capacity Resource Alternatives section of this TYSP
for additional information concerning Gulf's efforts to promote and develop
renewable energy resources.
45

- Year 1999 2000 2001 2002 2003 2004 2005 2006 2007
Q\ 2008
2009 201 0 201 1 201 2 201 3 2014 201 5 2016 2017 2018
CAAG 99-08 08-1 3 08-1 8
GULF POWER COMPANY
Schedule 2.1 History and Forecast of Energy Consumption and
Number of Customers by Customer Class
(2) (3) (4) (5) (6)
Rural and Residential Average KWH
PoDulation 812,993 828,849 844,139 860,642 879,011 896,851 909,608 937,329 964,349 969,757
984,111 997,130
1,015,404 1,034,738 1,055,254 1,076,192 1,098,065 1 , I 1 9,994 1,145,674 1,166,713
2.0% 1.7% 1.9%
Members Per
Household 2.60 2.59 2.59 2.60 2.60 2.60 2.60 2.60 2.60 2.59
2.58 2.57 2.56 2.55 2.54 2.53 2.52 2.51 2.51 2.50
-0.1% -0.4% -0.3%
GWH 4,471 4,790 4,716 5,144 5,101 5,215 5,320 5,425 5,477 5,349
5,676 5,842 6,063 6,243 6,423 6,579 6,737 6,934 7,161 7,392
2.0% 3.7% 3.3%
Average No. of
Customers 312,283 319,506 325,343 331,637 338,631 345,467 350,404 360,y3u
371,213 374,709
381,719 388,248 396,873 405,979 415,621 425,504 435,835 446,270 456,472 466,676
2.0% 2.1% 2.2%
Consumption Per Customer
14,318 14,992 14,497 15,510 15,064 15,096 15,181 i 5,032 14,755 14,274
14,868 15,048 15,276 15,377 15,453 15,461 15,458 15,537 15,687 15,839
0.0% 1.6% 1 .O%
Commercial Average KWH
GWH 3,223 3,379 3,417 3,553 3,614 3,695 3,736 3,843 3,971 3,961
3,962 4,054 4,213 4,336 4,457 4,560 4,663 4,797 4,960 5,125
2.3% 2.4% 2.6%
Average No. of
Customers 47,294 47,584 48,482 49,139 50,419 51,981 52,916 53,479 53,791 53,810
54,572 55,448 56,597 57,806 59,080 60,387 61,749 63,130 64,491 65,860
1.4% 1.9% 2.0%
Consumption Per Customer
68,138 71,020 70,490 72,304 71,684 71,093 70,599 1-1 ,UOL
73,821 73.610
^^^
72,594 73,115 74,442 75,014 75,436 75,508 75,511 3 75,984 76,917 77,823
0.9% 0.5% 0.6%
* Historical and projected figures include portions of Escambia, Santa Rosa, Okaloosa, Bay,

GULF POWER COMPANY
Schedule 2.2 History and Forecast of Energy Consumption and
Number of Customers by Customer Class
(3) (7) (4)
Industrial Average Average KWH
No. of Consumption Customers Per Customer
249 7,409,647 269 7,141,925 277 7,290,329 272 7,552,563 285 7,526,577 279 7,569,053 295 7,332,898 294 7,260,626 303 6,769,670 291 7,592,204
Street & Highway Lighting GWH
18 18 21 21 22 23 23 24 24 23
Other Sales to Public
Authorities GWH
0 0 0 0 0 0 0 0 0 0
Total Sales to Ultimate Consumers
GWH 9,558 10,112 10,173 10,772 10,885 11,046 11,239 11,429 11,521 11,543
Railroads and Railways
GWH 0 0 0 0 0 0 0 0 0 0
- Year 1999 2000 2001 2002 2003 2004 2005 2006 2007 2008
GWH 1,846 1,925 2,018 2,054 2,147 2,113 2,161 2,136 2,048 2,211
P 4
2009 201 0 201 1 2012 201 3 2014 201 5 2016 2017 2018
2,147 2,183 2,195 2,185 2,172 2,162 2,150 2,137 2,130 2,141
307 312 317 32 1 324 328 331 336 340 343
6,996,432 6,992,47 1 6,934,888 6,814,562 6,711,904 6,593,011 6,485,449 6,367,537 6,263,425 6,233,940
0 0 0 0 0 0 0 0 0 0
24 25 26 28 29 30 31 33 34 36
11,809 12,105 12,498 12,791 13,080 13,330 13,581 13,901 14,286 14.695
0 0 0 0 0 0 0 0 0 0
CAAG 99-08 08-1 3 08-1 8
2.0% -0.3% -0.3%
1.7% 2.1% 1.7%
0.3% -2.4% -2.0%
0.0% 0.0% 0.0%
2.6% 4.4% 4.5%
0.0% 0.0% 0.0%
2.1% 2.5% 2.4%
GULF POWER COMPANY
P 00
Year 1999 2000 2001 2002 2003 2004 2005 2006
2008
clnn7 LUU I
2009 2010 201 1 2012 201 3 2014 201 5 2016 2017 2018
CAAG 99-08 08-1 3 08-1 8
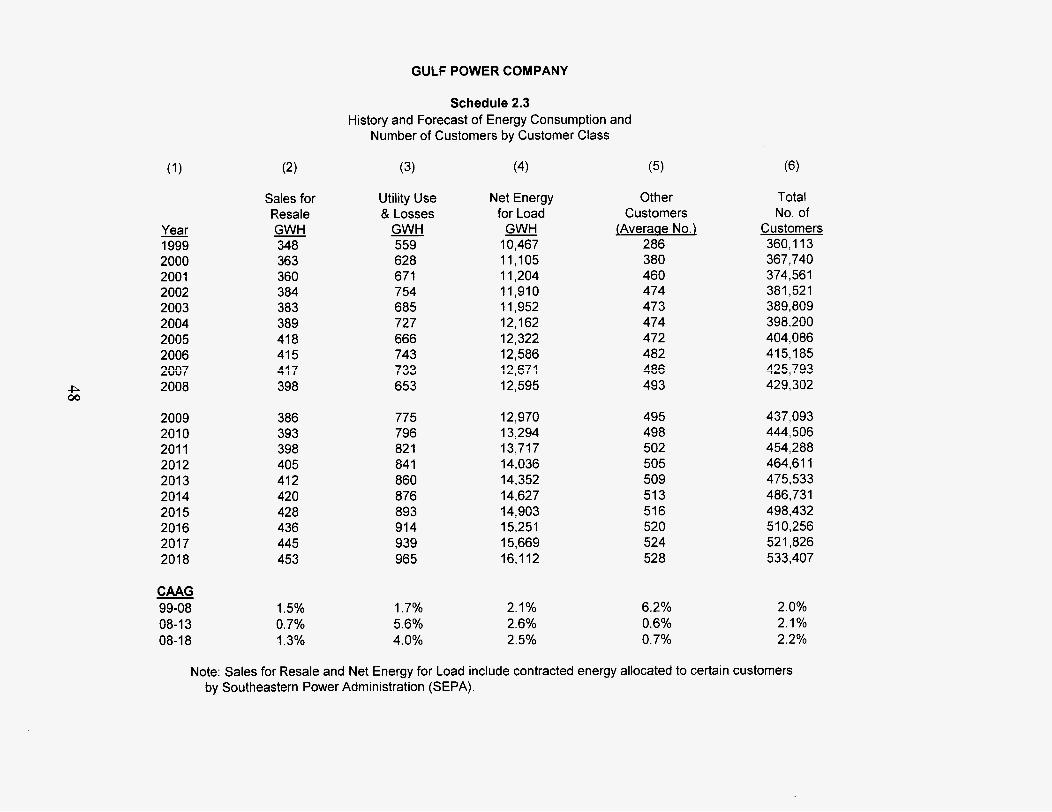
Sales for Resale GWH 348 363 360 384 383 389 41 8 41 5
398 A 4 7 I t l l
386 393 398 405 412 420 428 436 445 453
1.5% 0.7% 1.3%
Schedule 2.3 History and Forecast of Energy Consumption and
Number of Customers by Customer Class
(3)
Utility Use & Losses
GWH 559 628 671 754 685 727 666 743 733 653
775 796 82 1 84 1 860 876 893 914 939 965
1.7% 5.6% 4.0%
(4)
Net Energy for Load
GWH 10,467 11,105 11,204 11,910 11,952 12,162 12,322 12,586 12,671 12,595
12,970 13,294 13,717 14,036 14,352 14,627 14,903 15,251 15,669 16,112
2.1% 2.6% 2.5%
(5)
Other Customers
{Average No.) 286 380 460 474 473 474 472 482
493 A QC: 7""
495 498 502 505 509 51 3 516 520 524 528
6.2% 0.6% 0.7%
Total No. of
Customers 360,113 367,740 374,56 1 381,521 389,809 398,200 404,086 41 5,185 425,793 429.302
437,093 444,506 454,288 464,611 475,533 486,731 498,432 51 0,256 52 1 ,826 533,407
2.0% 2.1% 2.2%
Note: Sales for Resale and Net Energy for Load include contracted energy allocated to certain customers by Southeastern Power Administration (SEPA).
GULF POWER COMPANY
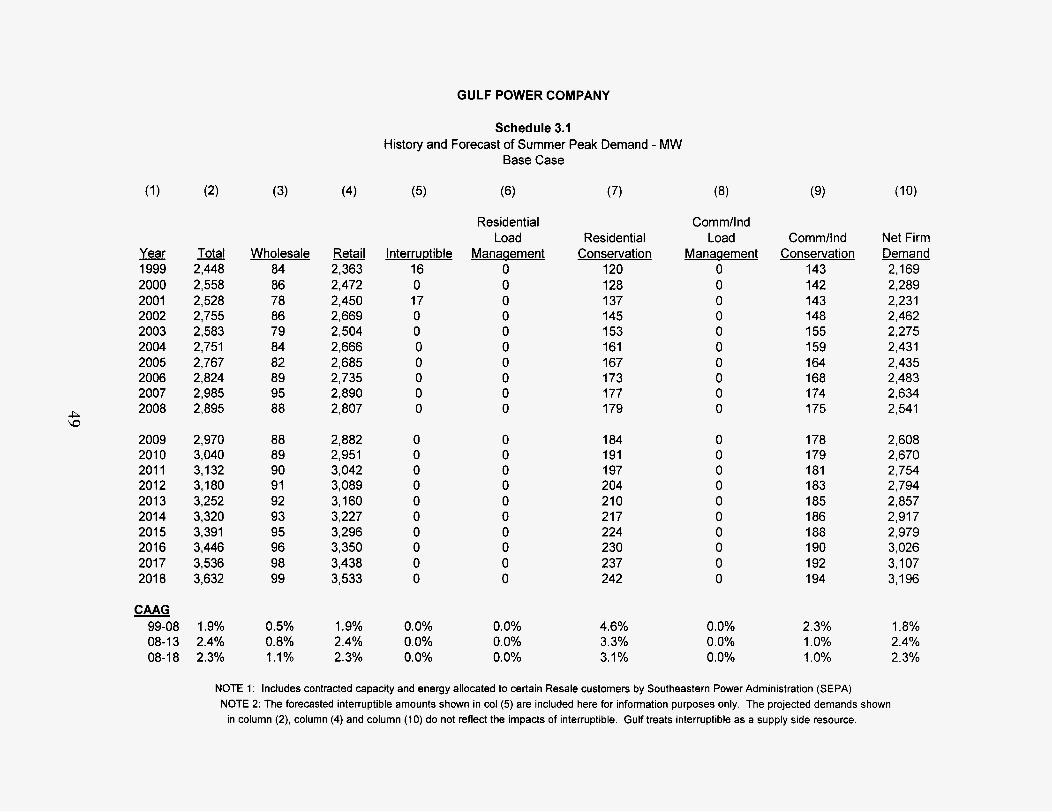
Schedule 3.1 History and Forecast of Summer Peak Demand - MW
Base Case
(3) (4) (7) (9)
Residential Load
Manaaement 0 0 0 0 0 0 0 0 0 0
Comm/l nd Load
Manaqement 0 0 0 0 0 0 0 0 0 0
Residential Conservation
120 128 137 145 153 161 167 173 177 179
Commllnd Conservation
143 142 143 148 155 159 164 168 174 175
Net Firm Demand 2,169 2,289 2,231 2,462 2,275 2,431 2,435 2,483 2,634 2,541
- Year 1999 2000 2001 2002 2003 2004 2005 2006 2007 2008
2009 201 0 201 1 2012 201 3 2014 201 5 2016 201 7 201 8
- Total 2,448 2,558 2,528 2,755 2,583 2,751 2,767 2,824 2,985 2,895
2,970 3,040 3,132 3,180 3,252 3,320 3,391 3,446 3,536 3,632
Wholesale 84 86 78 86 79 84 82 89 95 88
88 89 90 91 92 93 95 96 98 99
Retail 2,363 2,472 2,450 2,669 2,504 2,666 2,685 2,735 2,890 2,807
lnterrwtible 16 0 17 0 0 0 0 0 0 0
2,882 2,951 3,042 3,089 3,160 3,227 3,296 3,350 3,438 3,533
0 0 0 0 0 0 0 0 0 0
0 0 0 0 0 0 0 0 0 0
1 84 191 197 204 21 0 21 7 224 230 237 242
0 0 0 0 0 0 0 0 0 0
178 179 181 183 185 186 188 190 192 1 94
2,608 2,670 2,754 2,794 2,857 2,917 2,979 3,026 3,107 3,196
CAAG 99-08 1.9% 08-13 2.4% 08-18 2.3%
1.9% 2.4% 2.3%
0.0% 0.0% 0.0%
0.0% 0.0% 0.0%
4.6% 3.3% 3.1%
0.0% 0.0% 0.0%
2.3% 1 .O% 1 .O%
1.8% 2.4% 2.3%
0.5% 0.8% 1.1%
NOTE 1 : Includes contracted capacity and energy allocated to certain Resale customers by Southeastern Power Administration (SEPA) NOTE 2: The forecasted interruptible amounts shown in col (5) are included here for information purposes only. The projected demands shown
in column (2), column (4) and column ( I O ) do not reflect the impacts of interruptible. Gulf treats interruptible as a supply side resource.

GULF POWER COMPANY
- Year Total 98-99 2,392 99-00 2,225 00-01 2,486 01-02 2,530 02-03 2,857 03-04 2,445 04-05 2,518 05-06 2,475 06-07 2,643 07-08 2,791
08-09 2,759 09-10 2,856 10-11 2,953 11-12 3,036 12-13 3,121 13-14 3,183 14-15 3,242 15-16 3,325 16-17 3,426 17-18 3,505 18-19 3,593 CAAG 99-08 1.7% 08-13 2.3% 08-18 2.3%
(3)
Wholesale 79 75 86 85 92 76 89 89
94
81 82 83 74 75 76 77 79 80 85 86
1.9% -4.3% -1 .O%
Q K "V
(4)
Retail 2,313 2,150 2,401 2,445 2,766 2,369 2,428 2,386 2,558 2,698
2,678 2,774 2,870 2,962 3,046 3,107 3,165 3,246 3,346 3,420 3,507
1.7% 2.5% 2.4%
Schedule 3.2 History and Forecast of Winter Peak Demand - MW
Base Case
InterruDti ble 0 0 0 0 0 0 0 0 c! 0
0 0 0 0 0 0 0 0 0 0 0
0.0% 0.0% 0.0%
(6)
Residential Load
Manaaement 0 0 0 0 0 0 0 0 c! 0
0 0 0 0 0 0 0 0 0 0 0
0.0% 0.0% 0.0%
(7)
Residential Conservation
177 188 200 21 1 225 240 250 263 276 277
294 31 0 327 343 361 379 397 41 5 433 440 447
5.1% 5.4% 4.7%
Commllnd Load
Manaaement 0 0 0 0 0 0 0 0 n 0
0 0 0 0 0 0 0 0 0 0 0
0.0% 0.0% 0.0%
(9)
Commllnd Conservation
122 126 126 129 133 134 137 140 I 4 3 144
145 146 147 148 149 150 151 152 153 154 155
1.8% 0.7% 0.7%
Net Firm Demand 2,093 1,911 2,160 2,190 2,500 2,070 2,130 2,072 2,224 2,370
2,320 2,399 2,479 2,545 2,611 2,654 2,694 2,758 2,840 2,911 2,991
1.4% 2.0% 2.1%
NOTE 1 : Includes contracted capacity and energy allocated to certain Resale customers by Southeastern Power Administration (SEPA) NOTE 2: The forecasted interruptible amounts shown in col (5) are included here for information purposes only. The projected demands shown
in column (2), column (4) and column ( I O ) do not reflect the impacts of interruptible. Gulf treats interruptible as a supply side resource.

GULF POWER COMPANY
Schedule 3.3 History and Forecast of Annual Net Energy for Load - GWH
Base Case
(3) (4) (5) (7) (9)
Residential Conservation
297 305 314 323 335 348 357 366 376 379
390 400 41 1 42 1 433 445 457 469 480 484
Comm/lnd Conservation
2 74 280 284 288 297 303 31 9 325 329 333
338 342 347 351 355 360 364 368 373 377
Utility Use & Losses
559 628 671 754 685 727 666 743 733 653
Net Energy for Load 10,467 11,105 11,204 11,910 11,952 12,162 12,322 12,586 12,671 12,595
Load Factor %
55.1 % 55.2% 57.3% 55.2% 60.0% 57.0% 57.8% 57.9% 54.9% 56.4%
Year 1999 2000 2001 2002 2003 2004 2005 2006 2007 2008
2009 201 0 201 1 2012 201 3 2014 2015 2016 201 7 201 8
CAAG - 99-08 08-1 3 08-1 8
j%taJ 11,038 11,690
Retail 9,559 10,113
Wholesale 348 363 360 384 383 389 41 8 41 5 41 7 398
386 393 398 405 412 420 428 436 445 453
1,801 2,520 2,584 2,813 2,998 3,277
13,377 13,307
13,697 14,036 14,475 14,809 15,141 15,432 15,724 16,088 16,522 16.974
0,173 0,772 0,885 1,046 1,239 1,429
11,521 11,543
11,809 12,105 12,498 12,791 13,080 13,330 13,581 13,901 14,286 14.695
56.8% 56.8% 56.9% 57.2% 57.3% 57.2% 57.1% 57.4% 57.6% 57.6%
775 796 82 1 84 1 860 876 893 914 939 965
12,970 13,294 13,717 14,036 14,352 14,627 14,903 15,251 15,669 16,112
2.1% 2.6% 2.5%
2.7% 2.7% 2.5%
2.2% 1.3% 1.3%
2.1% 2.5% 2.4%
1.5% 0.7% 1.3%
1.7% 5.6% 4.0%
2.1% 2.6% 2.5%
0.3% 0.3% 0.2%
NOTE: Wholesale and total columns include contracted capacity and energy allocated to certain Resale customers by Southeastern Power Administration (SEPA).
GULF POWER COMPANY
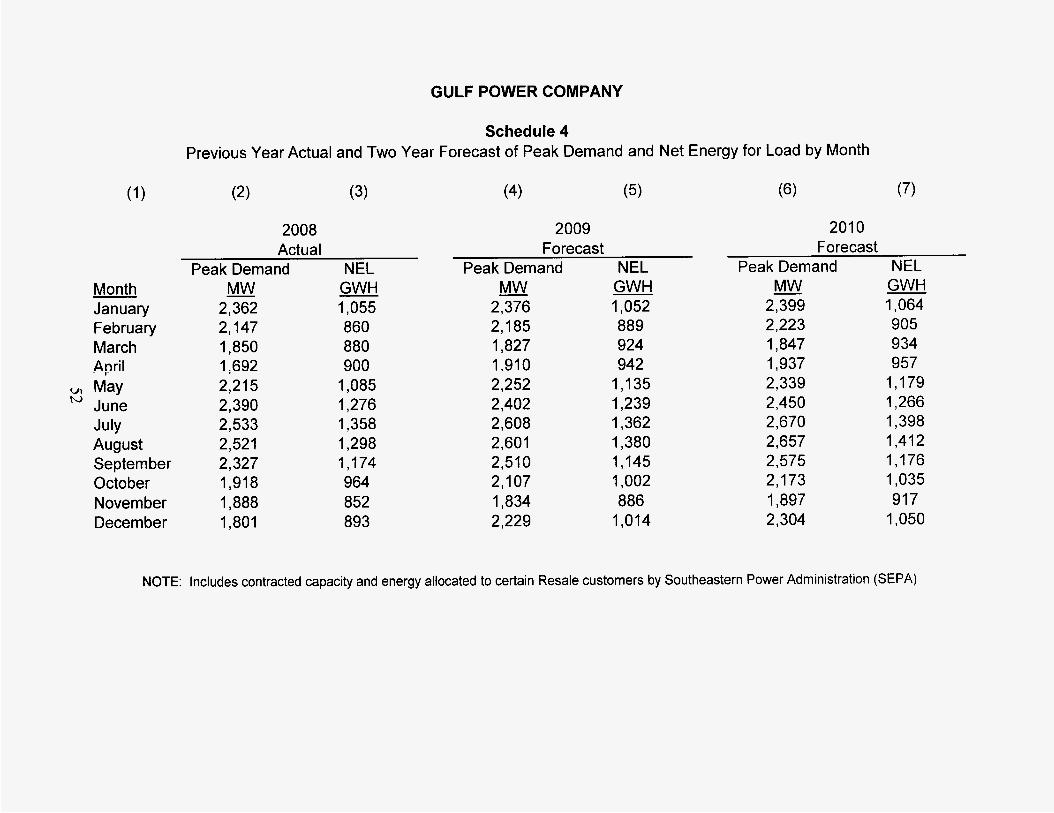
Schedule 4 Previous Year Actual and Two Year Forecast of Peak Demand and Net Energy for Load by Month
Month January February March April
June July August September October N ovem be r December
VI May h,
2008 Actual
Peak Demand NEL - MW
2,362 2,147 1,850 1 ;692 2,215 2 , 390 2,533 2,521 2,327 1,918 1,888 1,801
GWH 1,055 860 880 900
1,085 1,276 1,358 1,298 1,174 964 852 893
2009 Forecast
Peak Demand NEL MW
2,376 2,185 1,827 1.910 2,252 2,402 2,608 2,601 2,510 2,107 1,834 2,229
GWH 1,052 889 924 942
1,135 1,239 1,362 1,380 1,145 1,002 886
1,014
201 0 Forecast
Peak Demand NEL - MW GWH
2,399 1,064 2,223 905 1,847 934 1,937 957 2,339 1,179 2,450 1,266 2,670 1,398 2,657 1,412 2,575 1,176 2,173 1,035 1,897 917 2 , 304 1,050
NOTE: includes contracted capacity and energy allocated to certain Resale customers by Southeastern Power Administration (SEPA)
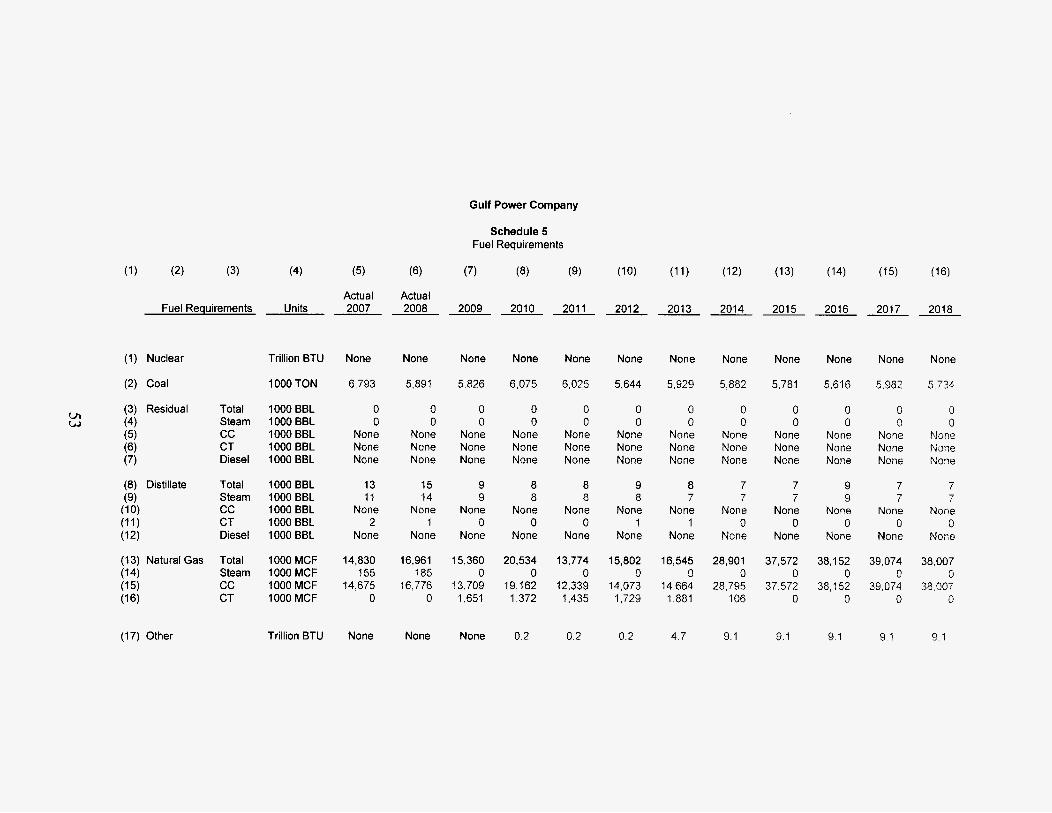
Gulf Power Company
Schedule 5 Fuel Requirements
(3) (4) (5) (7) (9)
Actual Actual Fuel Requirements Units 2007 2008 2009 2010 2011 2012 2013 2014 2015 2016 2017 2018
(1) Nuclear
(2) Coal
(3) Residual (4) (5) (6) (7)
(17) Other
Total Steam cc CT Diesel
Total Steam cc CT Diesel
Total Steam cc CT
Trillion BTU
1000 TON
1000 BBL 1000 BBL 1000 BBL 1000 BBL 1000 BBL
1000 BBL 1000 BBL 1000 BBL 1000 BBL 1000 BBL
1000 MCF 1000 MCF 1000 MCF 1000 MCF
Trillion BTU
None
6.793
0 0
None None None
13 11
None 2
None
14,830 155
14,675 0
None
None
5,891
0 0
None None None
15 14
None 1
None
16,961 185
16,776 0
None
None
5,826
0 0
None None None
9 9
None 0
None
15,360 0
13,709 1,651
None
None
6.075
0 0
None None None
8 8
None 0
None
20,534 0
19.162 1.372
0.2
None
6,025
0 0
None None None
8 8
None 0
None
13,774 0
12,339 1,435
0.2
None
5,644
0 0
None None None
9 8
None 1
None
15,802 0
14,073 1,729
0.2
None
5,929
0 0
None None None
8 7
None 1
None
16,545 0
14,664 1,881
4.7
None
5,882
0 0
None None None
7 7
None 0
None
28,901 0
28.795 106
9.1
None
5,781
0 0
None None None
7 7
None 0
None
37,572 0
37,572 0
9.1
None
5,616
0 0
None None None
9 9
None 0
None
38,152 0
38,152 0
9 1
None
5,982
0 0
None None None
7
None 0
None
39,074 0
39,074 0
7
9 1
None
5 734
0 0
None None None
7
Nane 0
None
38,007 0
38.007 0
7
9 1

Utility: Gulf Power Company
Schedule 6.1 Energy Sources
(7) (8) (9) (3) (4) (6)
Actual 2008
(2,209)
None
(5)
Actual 2007
(4,043)
None
2009 2010 2011
(2,620) (3,555) (I ,974)
--- 2017 2018 -- 201 5
(4,407)
None
12.932
201 6
(3,765)
None
12,552
201 3
(1,792)
None
2014
(3,612)
None
EnerQy Sources
(1) Annual Firm Interchange
(2) Nuclear
(3) Coal
(4) Residual Total (5) Steam (6) (7) (8)
(9) Distillate Total (10) Steam (11) cc
CT Diesel
(12) (13)
(14) Natural Gas Total (1 5) Steam
(17) CT
(18) NUGs
(1 9) Net Energy for Load
cc CT Diesel
(1 6) cc
Units
GWH
GWH
(4,316) (3,153)
None None
13,382 12 799
0 0 0 0
None None None None None None
None None None None
GWH 14,281 12.334 13:427 13,783 13,626
0 0 0 0 0 0
None None None None None None None None None
12,826 13,385
0 0
None None None
13.169
0 0
None None None
0 0
None None None
0 None None
0 None
0 0
None None None
0 Nons None
0 None
0 0
None None None
0 None None
0 None
GWH GWH GWH GWH GWH
0 0
None None None
0 0
None None None
wl P
0 0 None None None None
0 0 None None
GWH GWH GWH GWH GWH
GWH GWH GWH GWH
1 None None
None 1
1 None None
None 1
0 0 0 None None None None None None
0 0 0 None None None
1 None None
None 1
1 None None
None 1
2,374 10
2.31 5 49
2,428
2,373 47
a 2,111 2,998 1,988
0 0 0 1,958 2,758 1,742 153 240 246
2,242 0
1,970 272
2,336 0
2,050 286
422
4,324 0
4.202 122
746
5,658 0
5,545 113
5,741 0
5,628 113
5,878 5,737 0 0
5765 5624 113 3 13
720 723 725 729 GWH 53 41 52 68 77
12,970 13.294 13.717
73
14,036 14,352 14,627 14,903 15,251 15.569 16,l 12 GWH 12,671 12,595
NOTE: Line (1 8) includes energy purchased from Non-Renewable and Renewable resources, as well as energy from Gulf-owned Renewable resources shown on Schedule 8 .
VI VI
(3)
Energy Sources
(1) Annual Firm Interchange
(2) Nuclear
(3) Coal
(18) NUGs
(1 9) Net Energy for Load
Total Steam cc CT Diesel
Total Steam cc CT Diesel
Total Steam cc CT
(4)
Units
%
%
%
% % % % %
% Yo % % %
% % % %
%
%
(5)
Actual 2007
(31.91)
None
112.71
0.00 0.00 None None None
0.01 None None 0.01 None
18.74 0.08
18.27 0.39
0.46
100.00
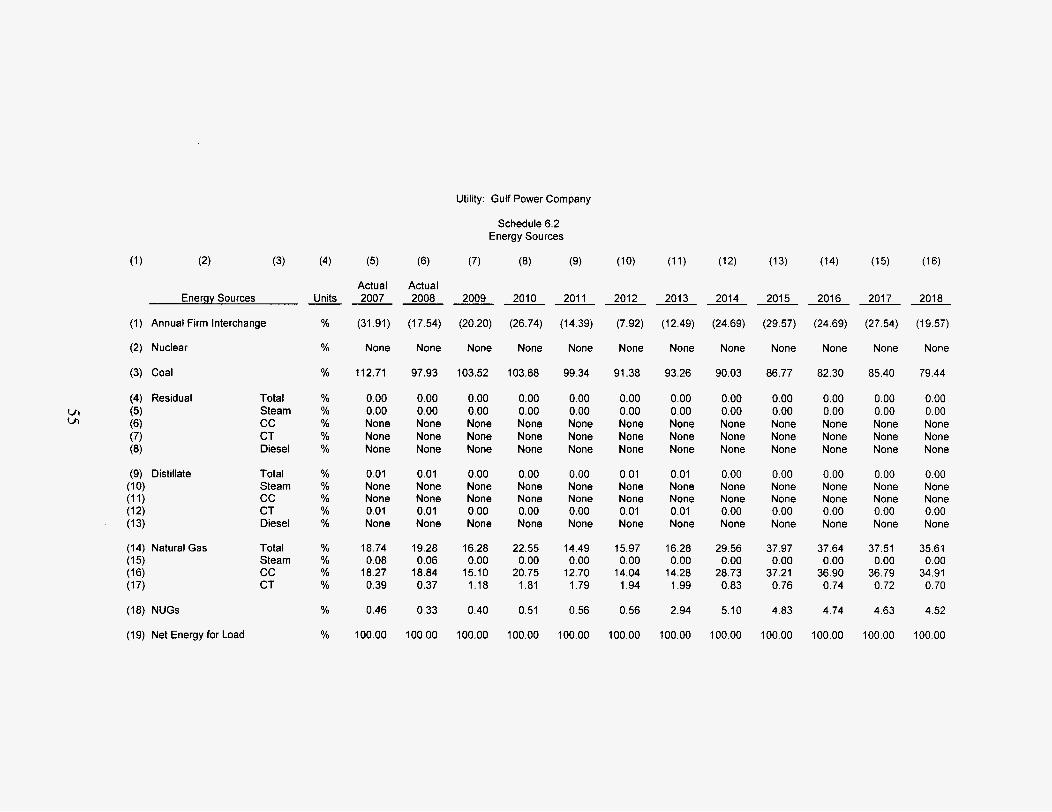
Utility: Gulf Power Company
Schedule 6.2 Energy Sources
(6) (7) (8) (9)
Actual 2008 2009 2010 2011 - - ~ -
(17.54)
None
97.93
0.00 0.00 None None None
0.01 None None 0.01 None
19.28 0.06
18.84 0.37
0.33
100.00
(20.20)
None
103.52
0.00 0.00 None None None
0.00 None None 0.00 None
16.28 0.00
15.10 1.18
0.40
100.00
(26.74)
None
103.68
0.00 0.00 None None None
0.00 None None 0.00 None
22.55 0.00
20.75 1.81
0.51
100.00
(14.39)
None
99.34
0.00 0.00 None None None
0.00 None None 0.00 None
14.49 0.00
12.70 1.79
0.56
100.00
(1 0)
2012
(7.92)
None
91.38
0.00 0.00 None None None
0.01 None None 0.01 None
15.97 0.00
14.04 1.94
0.56
100.00
(11)
201 3
(12.49)
None
93.26
0.00 0.00 None None None
0.01 None None 0.01 None
16.28 0.00
14.28 1.99
2.94
100.00
(12)
2014
(24.69)
None
90.03
0.00 0.00 None None None
0.00 None None 0.00 None
29.56 0.00
28.73 0.83
5.10
100.00
(1 3)
201 5
(29.57)
None
86.77
0.00 0.00 None None None
0.00 None None 0.00 None
37.97 0.00
37.21 0.76
4.83
100.00
(14)
2016
(24.69)
None
82.30
0.00 0.00 None None None
0.00 None None 0.00 None
37.64 0.00
36.90 0.74
4.74
100.00
(15)
201 7
(27.54)
None
85.40
0.00 0.00 None None None
0.00 None None 0.00 None
37.51 0.00
36.79 0.72
4.63
100.00
(1 6)
2018
(19.57)
None
79.44
0.00 0.00 None None None
0.00 None None 0.00 None
35.61 0.00
34.91 0.70
4.52
100.00

Utility: Gulf Power Company Schedule 6.3
Renewable Energy Sources
(2) (3) (4) (5) (6) (7) (8) (9) (10) (11) (12) (1 3) Actuals
(1)
Renewable Energy Sources (A) 2008 2009 2010 2011 2012 2013 2014 2015 2016 2017 2018 (1) Renewable Generating Capacity
MW 0 0 3 3 3 95 95 95 95 95 95 MWh 37,244 48,180 63,510 71,832 71,832 414,348 736,789 708,684 708,684 708,684 708,684
% of Capacity Mix nla nla < I < I < I 3.0 2.7 2.7 2.7 2.7 2.7 %ofNEL < I < I < I < I e l 3.1 5.4 5.1 4.9 4.8 4.7
% of Fuel Mix 1 < I < I < I < I 2.6 4.0 3.7 3.7 3.5 3.7
(2) Self-service Generation By Renewable Generation MW 68 68 68 68 68 68 68 68 68 68 68
MWh (B) varies varies varies varies varies varies varies varies varies varies varies
(A) Owned andlor Purchased by Gulf. (B) Energy produced by these customers' generators varies depending on demand for their product.

This page is intentionally blank.
CHAPTER 111
PLANNING ASSUMPTIONS AND PROCESSES

THE INTEGRATED RElSOURCE PLANNING PROCESS
As previously mentioned, Gulf participates in the SES IRP process. This
process begins with a team of experts from within and outside the SES that
meets to discuss current and historical economic trends and conditions, as well
as future expected economic conditiolns which would impact the SES's business
over the next twenty to twenty-five years. This economic panel determines the
various escalation and inflation rates that will impact the financial condition of the
SES. This determination acts as a basis for developing the general inflation and
escalation assumptions that will affect fuel costs, construction costs, labor rates
and variable O&M.
In addition to the work of the economic panel, there are a number of
activities that are conducted in parallel with one another in the IRP process.
These activities include energy and demand forecasting, fuel price forecasting,
technology screening analysis and evaluation, engineering cost estimation
modeling, evaluation of active and passive demand-side options, and other
miscellaneous issues. The SES operating companies have also remained active
in offering customers programs and ciptions which result in modified consumption
patterns. An important input into the design of such demand-side programs is an
assessment of their likely impact on system loads.
Gulf's forecast of energy sales and peak demand reflects the continued
impacts of its conservation program:;. Furthermore, an update of demand-side
57

measure cost and benefits is conducted in order to perform cost-effectiveness
evaluations against the selected supply-side technologies from the IRP process.
A number of existing generating units on the SES are also evaluated with
respect to their currently planned retirement dates, as well as the economics and
appropriateness of possible repowering over the planning horizon. These
evaluations are extremely important in order to maximize the benefit of existing
investment from both a capital and an operations and maintenance expense
perspective.
Additionally, the market for potential power purchases is analyzed in order
to determine its cost-effectiveness in comparison to the available supply-side and
demand-side options. Power purchases are evaluated on both a near-term and
long-term basis as a possible means of meeting the system’s demand
requirements. These power purchases can be procured from utility sources as
well as from non-utility generators.
The supply side of the IRP process focuses on the SES as a whole, which
has as its planning criterion a 15% reserve margin target for the year 2012 and
beyond. This reserve margin is the optimum economic point at which the system
can meet its energy and demand requirements after accounting for load forecast
error, abnormal weather conditions, and unit-forced outage conditions. It also
balances the cost of adding additional generation with the societal cost of not
serving all the energy requirements of the customer.
Once the above mentioned planning assumptions are determined,
generating unit technologies are screened to determine the most acceptable
58
candidates, the necessary planning inputs are defined and the generation mix
analysis is initiated. The main optimization tool used in the generation mix
analysis is the PROVIEWO model. The supply-side technology candidates are
input into PROVIEWO in specific MMI block sizes for selection over the planning
horizon for the entire SES. Although this model uses many data inputs and
assumptions in the process of optimiizing system generation additions, the key
assumptions are load forecasts, demand-side options, candidate units, reserve
margin requirements, cost of capital, ;and escalation rates.
PROVIEWO uses a dynamic programming technique to develop the
optimum resource mix. This technique allows PROVIEWO to evaluate for every
year all the many combinations of generation additions that satisfy the reserve
margin constraint. Annual system operating costs are simulated and are added
to the construction costs required to build each combination of resource
additions. A least cost resource addition schedule is developed by evaluating
each year sequentially and comparing the results of each combination. A least
cost resource plan is developed only after reviewing many construction options.
PROVIEW@ produces a number of different combinations over the
planning horizon, evaluating both the capital cost components for unit additions
as well as the operating and maintenance cost of existing and future supply
option additions. The program produces a report which ranks all of the different
combinations with respect to the taltal net present value cost over the entire
twenty-year planning horizon. The leading combinations from the program are
then evaluated for reasonableness and validity. Once again, it is important to
59
note that supply option additions from the PROVIEWB program output are for the
entire SES and are reflective of the various technology candidates selected.
After the SES results are verified, each individual operating company’s
specific needs over the planning horizon are evaluated. Each company is
involved in recommending the type and timing of its unit additions. When all
companies are satisfied with their capacity additions, and the sum of these
additions matches the system need, the system base supply-side plan is
complete. The result is an individual operating company supply plan that fits
within the SES planning criteria.
Once the individual operating company supply plans are determined, it is
necessary to evaluate demand-side options as a cost-effective alternative to the
supply plan additions. After the incorporation of the cost effective demand-side
impacts, a final integrated resource plan is produced.
Finally, a financial analysis of the impact of the plan is performed. The
plan is analyzed for changes in load forecast and fuel price variations in order to
assess the impact on the system’s cost. Once the plan has proven to be robust
and financially feasible, it is reviewed with and presented for approval to
executive management.
In summary, the SES IRP process involves a significant amount of
manpower and computer resources in order to produce a truly least-cost,
integrated demand-side and supply-side resource plan. During the entire
process, the SES is continually looking at a broad range of alternatives in order
to meet the SES’s projected demand and energy requirements. The SES
60
updates its IRP each year to account for the changes in the demand and energy
forecast, as well as the other major assumptions previously mentioned in this
section. A remix is then performed tci insure that the IRP is the most economical
and cost-effective plan. The resultiiig product of the SES IRP process is an
integrated plan which meets the needs of the SES’s customers in a cost-effective
and reliable manner.
TRANSMISSION PLAN N I N G PRO C ES S
The transmission system is not studied as a part of the IRP process, but it
is studied, nonetheless, for reliability purposes. Commonly, a transmission
system is viewed as a medium uised to transport electric power from its
generation source to the point of its conversion to distribution voltages under a
number of system conditions known as contingencies. The results of the IRP are
factored into transmission studies in order to determine the impacts of various
generation site options upon the transmission system. The transmission system
is studied under different contingencies for various load levels to insure that the
system can operate adequately without exceeding conductor thermal and system
voltage limits.
When the study reveals a potential problem with the transmission system
that warrants the consideration of correction in order to maintain or restore
reliability, a number of possible solutions are identified. These solutions and their
costs are evaluated to determine which is the most cost-effective. Once a
solution is chosen to correct the problem, a capital budget expenditure request is
61

prepared for executive approval. It should be noted that not all thermal overloads
or voltage limit violations warrant correction. This may be due to the small
magnitude of the problem or because the probability of occurrence is insufficient
to justify the capital investment of the solution.
In prior years, Gulf has entered into a series of purchased power
agreements to meet its needs, and it will continue this practice in the future when
economically attractive opportunities are available. The planned transmission
has proven adequate to handle these purchased power transactions during the
periods when Gulf has needed additional capacity. It has been and will continue
to be Gulf's practice to perform a transmission analysis of viable purchased
power proposals to determine any transmission constraints. Gulf will formulate a
plan, if needed, to resolve any transmission issues in a reasonable, cost effective
manner prior to proceeding with negotiations for purchased power agreements.
62
FUEL PRICE FORECAST PROCESS
FUEL PRICE FORECASTS
Fuel price forecasts are used for a variety of purposes within the Southern
Electric System (SES), including such diverse uses as long-term generation
planning and short-term fuel budgeting. The SES fuel price forecasting process
is designed to support these various uses.
The delivered price of any fuel consists of a variety of components. The
main components are commodity price and transportation cost. Coal commodity
domestic prices are forecast on either a mine-mouth basis or freight on board
(FOB) barge basis, while import coals are forecast on an FOB ship basis at the
port of export. Natural gas prices are forecast at the Henry Hub, Louisiana
benchmark delivery point. Because mine-mouth coal prices vary by source,
sulfur content, and Btu level, the SES prepares commodity price forecasts for
fifteen different coal classifications used on the SES. Because natural gas does
not possess the same quality variaitions as coal, the SES prepares a single
commodity price forecast for gas at Henry Hub, and applies a historical basis
differential between Henry Hub and the various pipelines serving SES plants.
Four price forecasts are developed for oil, based on grade of oil, sulfur, and heat
content
The level of detail with which transportation costs are projected depends
on the purpose for which the forecast will be used. Generic transportation costs,
reflecting an average cost for delivery within the SES service area, are used in
the delivered price forecast when modeling generic unit additions in the IRP
63

process. Site-specific transportation costs are developed for existing units to
produce delivered price forecasts for both the IRP process and the fuel budget
process. Similarly, when site-specific unit additions are under consideration, site-
specific transportation costs are developed for each option.
SES GENERIC FUEL FORECAST
Each year, SES develops a fuel price forecast for coal, oil, and natural gas
which extends through the Company’s IO-year planning horizon. This forecast is
developed by Southern Company Services (SCS) Fuel Procurement staff with
input from outside consultants. The forecast is approved by the fuel procurement
managers at each of the SES operating companies responsible for the fuel
programs at that company.
The fuel price forecast process begins with an annual Fossil Fuel Price
Workshop that is held with representatives from recognized leaders in energy-
related economic forecasting and transportation-related industries. Presenters at
the 2008 Fuel Price Workshop included representatives from Energy Ventures
Analysis, ICF Consulting, McCloskey Coal, Cambridge Energy Research
Associates, Criton Corp, Simpson Spence and Young, and PlRA Energy Group.
During the Fossil Fuel Price Workshop, each fuel representative presents
their “base case” forecast and assumptions. High and low fuel price scenarios
are also presented.
After the workshop, the SCS Fuel Procurement staff references the
outside consultant forecasts and identifies any major assumption differences.
The Fuel Procurement staff then consolidates both the internal and external
64

forecasts and assumptions to develop a commodity forecast for each type of fuel.
Fuel Procurement’s 2008 commodity price forecasts for bituminous 1 .O% sulfur
coal, natural gas and low sulfur #2 oil are included in the table below.
SES GENERIC FUEL PRICE FORECAST ($r’M M Btu)
2009
201 0
201 1
2012
201 3
2014
201 5
201 6
201 7
201 8
COAL*
4.583
4.167
3.750
3.333
2.91 7
2.880
2.958
3.041
3.125
3.233
NAT. GAS**
11.500
10.750
10.500
11.390
12.280
12.567
13.106
13.165
13.387
13.641
0 I L***
21.917
28.295
27.102
25.909
24.71 6
24.240
23.733
24.805
25.914
27.067
*Central Appalachia CSX, 12000 Btu/lb., 1% Sulfur
**Henry Hub
***U.S. Gulf Coast LS No.2 Oil, 0.05%, Sulfur
COAL PRICE FORECAST
In 2008, coal production in the United States reached 1,172 million short
tons, a 2.25% increase over year 2007 production levels. The Central
Appalachian region in the U.S. experienced a 3.7% increase in production.
Unlike the Central Appalachian region, the Interior region of the U.S. recorded a
65

15.8% decrease in production. The Western U.S. region, however, experienced
an 11 5% increase in production.
Total U.S. coal stockpiles increased during the year, as electric generators
built their stockpiles mainly in the second half of 2008 on milder weather and
improved rail transportation from the prior year as well as decreased demand
due to the global recession. At the same time, during the first half of 2008 the
expanding global economy (mainly driven by China) helped to increase the
demand for coal in the electric power sector during the year. There were no
significant delivery issues experienced in the U.S. market in 2008. In the world
market, China’s economic boom, coupled with production issues in Australia,
placed upward pressure on world coal pricing during the first half of 2008.
The coal industry continues to experience pricing pressure from
environmental and legal challenges, labor and mining cost increases, and more
recently, from a global recession. The increase in U.S coal market prices during
the first half of 2008 was primarily caused by world events, not U.S coal market
fundamentals. During the second half of 2008, world demand dropped as the
global recession grew in the summer and the financial collapse accelerated
events in September. Bituminous coal prices in the U.S. increased in real terms
through 1980 then declined in real terms through year 2000, after which real
price increases occurred through the first half of 2008. Sub-bituminous coal
prices declined in real terms through 2001 and have increased through the first
half of 2008. Spot market prices, during the first half of 2008, were relatively high
in nominal terms from the flat levels experienced in 2007 but then decreased
66
during the second half of 2008. The Central Appalachian, the Powder River
Basin, and the Western Colorado-U1:ah markets all saw price increases during
the first half of 2008 and price decreases during the second half, again due to the
global recession. Like its counterparts, import coal pricing into the U.S. from
Colombia saw the same pricing trend!; in 2008.
The generic coal prices used in the IRP process are based on an average
expectation of coal commodity costs combined with average transportation fees.
These generic coal prices are used in conjunction with plant-specific
transportation fees and plant-specific contract coal prices to develop the existing
fuel price projection for the SES annual budget process.
NATURAL GAS PRICE FORECAST
Counter to the trend of the last few years, supply has outpaced demand in
the 2008 gas market. Actual prices in the first half of 2008 tracked above the
forecast prepared in September ZOO;', then decreased rapidly during the second
half of 2008 and tracked below the forecast. Prices diverged from the forecast
during the second half of 2008 as a result of the combination of milder summer
weather, healthy levels of natural gas in storage, excess natural gas production
and declining demand due to the global economic slowdown. Gas-fired
generation increased slightly in the second half of 2008 as some natural gas
displaced coal, but the combination of high level of natural gas in storage and
decreasing demand resulted in lower natural gas prices towards the end of the
year. Despite the significant reduction in import volume of Liquefied Natural Gas
67

(LNG) from the previous year, the presence of LNG in the market offered a small
contribution towards the downward price pressure of natural gas.
Forward gas prices and analysts’ long-term price forecasts available
during the budget preparation for 2008 had shifted slightly downward from the
previous year The forward prices and forecasts showed an upward-sloping trend
in gas prices with the expectation that demand would continue to exceed supply.
The SES budget forecast anticipated stronger oil prices in both the near and
long-term due to strong, although slowing, worldwide economic growth and
continued tightening of capacity by OPEC. These forecasts did not assume any
impact from potential carbon legislation.
NATURAL GAS AVAILABILITY
Overall, domestic production is expected to decrease in the short term.
The global economic recession has caused natural gas demand to decline, but
the effect of increased production resulting from last year’s high natural gas
prices is still lingering. As producers reduced capital expenditures for 2009 by
shutting down drilling rigs, an eventual gas price increase in the 2009-2010
timeframe is foreseen. At present there is about 4 to 5 BCFD of excess supply in
the market, and several analysts are predicting near-term gas prices to average
in the $4.00-$5.00 range. Most of the oversupply is coming from unconventional
gas plays. Pipeline additions from these new gas plays are being developed and
are expected to be operational by the 2009 - 2010 timeframe. Adding to the
current oversupply situation is LNG imports. Total U.S. LNG imports were
68

estimated to have increased from 0.6 Bcfd in 2002 to approximately 1.8 Bcfd in
2004, were slightly reduced in 2005 and 2006, increased to an estimated 2.1
Bcfd in 2007, and then fell off to 0.9 Bcfd in 2008. A notable decrease in U.S.
LNG imports was observed in 2008 i3S strong global competition pulled cargoes
away from the U.S. market. However, due to the global economic downturn,
LNG imports are expected to increase in 2009, contributing to the current
oversupply situation. In the short run, LNG supply will continue to grow with new
liquefaction projects in Trinidad, Qatar, Norway, West Africa and elsewhere, but
substantial increases in LNG imports are not expected until the 2010 timeframe
or after due to delays in several of the overseas facilities becoming fully
operational.
Due to lower demand caused by the economic downturn and increases in
gas production, sufficient gas supply remains available to meet operating needs.
Pricing will remain soft in the near term as a result of the oversupply of gas
relative to demand. However, gas prices may increase due to a reduction in
drilling activity and the market’s reaction to weather events.
69

STRATEGIC ISSUES
Gulf has executed two PPAs that provide supply side flexibility and
diversity that will allow Gulf to react quickly to changing market conditions without
negative financial impacts to the Company and its customers. These PPAs will
supply firm dual-fuel fired peaking capacity to serve system load from June 2009
through May 2014.
Gulf's latest generation expansion plan, developed in conjunction with
other SES operating company planned capacity additions, indicates the need to
build or contract for new combined cycle (CC) generating capacity with an in-
service date of June 2014 in order to reliably meet Gulfs projected load growth.
On March 16, 2009, Gulf signed a PPA with a non-affiliated power marketer for
capacity and energy from an existing 885 MW gas-fired combined cycle
generating unit that is interconnected with the SES. This PPA is contingent upon
receipt of a final, non-appealable order from the FPSC for recovery of costs
associated with the PPA. This PPA, if approved by the FPSC, will secure a
resource to meet Gulf capacity needs in 2014 through the end of the 2009 TYSP
planning cycle.
The above-mentioned strategy of supplementing Gulf's development of
long-term capacity resources with shorter-term power purchases has proven
successful over the years, and Gulf will continue to follow this strategy when
appropriate and cost-effective to do so in the future.
70

Another important strategic adlvantage for Gulf is its association with the
SES as it relates to integrated planning and operations. Drawing on the planning
resources of Southern Company Services (SCS) to perform coordinated planning
and having the capacity resources of the SES available to Gulf through the
Intercompany Interchange Contract’s (IIC) reserve sharing mechanism in times
when Gulf is temporarily short of reserves are key benefits that Gulf and its
customers realize through its association with the SES. In addition, the SES’s
generation organization actively pursues firm energy market products at prices
that can lead to significant savings to the SES and its customers.
Over the next decade, Gulf will face significant challenges in developing a
generation expansion plan that serves not only its customers’ load growth but its
existing base need for capacity. As discussed in the Environmental Concerns
section of this TYSP, compliance with new environmental regulations,
particularily any that may be issued to require lower C02 emissions from power
plants, may lead to accelerated retirements of Gulf‘s existing coal units and the
addition of new gas-fired and nucllear units to replace this capacity. Gulf
continues to monitor the developmerit of state and national policy in the area of
C02 regulation and will consider its options for compliance with the resulting
regulations while still fulfilling its obligation to serve the energy needs of its retail
customers in Northwest Florida with reliable and reasonably priced electricity. If
approved by the FPSC, the addition (of the PPA for 885 MW of gas-fired CC that
Gulf has discussed in this TYSP will meet Gulf‘s future load requirements
71

regardless of which, if any, of the currently proposed state and federal carbon
emission standards ultimately become effective.
72
ENVIRONMENTAL CONCERNS
Gulf will continue to take all necessary actions to fully comply with all
environmental laws and regulations as they apply to the operation of Gulf's
existing generation facilities and the installation of new generation. In the event
that Gulf's recently signed 885 MW PPA does not receive FPSC approval, the
Company's next potential generating unit addition, an 840 megawatt "G" class
combined cycle would be on-line by *June 2014. If needed, this combined cycle
unit will be designed and constructed to comply with all applicable environmental
laws and regulations. Gulf has developed and routinely updates its
environmental compliance strategy to serve as a road map for a reasonable,
least-cost compliance plan. This road map establishes general direction, but
allows for individual decisions to be made based on specific information available
at the time. This approach is an absolute necessity in maintaining the flexibility
to match a dynamic regulatory environment with the variety of available
co m p I ia n ce opt ions .
Gulf updates or reviews its environmental compliance strategy on an
annual basis unless significant events dictate otherwise. The focus of the
strategy updates has, to date, ceintered on compliance with the acid rain
requirements, while considering other significant clean air requirements and
potential new requirements. There are a number of issues associated with future
regulatory requirements that could significantly impact both the scope and cost of
compliance over the next decade. The following is a summary of Gulf's actions
73

taken, or to be taken to comply with each major area of existing and emerging
environmental law and regulations.
Clean Air Act Amendments of 1990
In 1990, Congress passed major revisions to the Clean Air Act requiring
existing coal-fired generating plants to substantially reduce air emissions of sulfur
dioxide (S02) and nitrogen oxides (NOx) by 50 percent by the end of 2000.
Compliance actions for SO2 have included fuel switching to lower sulfur coals
coupled with the use of banked emission allowances and the acquisition of
additional allowances for future year compliance. In addition to reducing SO2
emissions, Gulf has installed low NOx burners on all but two of its coal-fired units
and installed an additional post-combustion NOx control on its largest coal-fired
unit. The Company utilizes a system-wide NOx emissions averaging plan to
meet the requirements of the Act.
Air Quality Standards for Ozone
In 1997, the Environmental Protection Agency (EPA) announced a
stringent new eight hour National Ambient Air Quality Standard (NAAQS) for
ozone based on an eight-hour average. In 2002, Gulf entered into an agreement
with the Florida Department of Environmental Protection (FDEP) to reduce NOx
emissions at Plant Crist in order to help ensure that the new ozone standard is
attained in the Pensacola area. Gulf installed Selective Catalytic Reduction
(SCR) controls on Crist Unit 7 in May 2005. In addition to the SCR control on
Unit 7, the Company installed Selective Non-Catalytic Controls (SNCR) and over-
fire air on Crist Unit 6 in February 2006 and SNCR controls on Crist Unit 4 and
74

Unit 5 in April 2006. These controls have achieved the overall plant-wide NOx
emissions overage of 0.20 Ibs/mmbtu as outlined in the FDEP Agreement. Gulf
also retired Crist Unit 1 in March 2003 and Crist Units 2 and 3 in May 2006.
All Florida counties currently meet the new standard, however in March
2008, the EPA issued new rules lowering the eight hour ozone standard. Based
on data from 2005-2007, counties within Gulf's service area would be designated
non-attainment under the new standard. However, controls that have been
recently installed or that are planned in response to EPA's Clean Air Interstate
Rule may achieve compliance without additional measures. States are required
to recommend designations to EPA by March 2009, and EPA will officially
designate non-attainment areas by March 201 0. States must then submit
revisions to their State Implementation Plans by March 201 3.
Clean Air Interstate Rule
The EPA issued the final Clean Air Interstate Rule in March 2005. This
cap-and-trade rule addresses power plant SO;! and NOx emissions that were
found to contribute to non-attainment of the eight-hour ozone and fine particulate
matter standards in downwind states. Twenty-eight eastern states, including
Florida and Mississippi, are subject to the requirements of the rule. The rule calls
for additional reductions of NOx and/or SO2 to be achieved in two phases,
2009/2010 and 2015, respectively. Compliance with this rule will be
accomplished by the installation of 'additional emission controls at Gulf's coal-
fired facilities and by the purchase of supplemental emission allowances through
a cap-and-trade program.
75
Clean Air Visibility Rule
The Clean Air Visibility Rule (formerly called the Regional Haze Rule) was
finalized in July 2005. The goal of this rule is to restore natural visibility
conditions in certain areas (primarily national parks and wilderness areas) by
2064. The rule involves the application of Best Available Retrofit Technology
(BART) requirements and, beginning in 2018, a review each decade and
implementation of the additional emissions reductions necessary to continue
making reasonable progress toward the goal of natural visibility. BART requires
that certain BART-eligible sources that contribute to visibility impairment
implement additional emission reductions to address these contributions. For
power plants, the Clean Air Visibility Rule allows states to determine that the
Clean Air Interstate Rule satisfies BART requirements for SOs and NOx but not
particulate matter, which requires a separate BART analysis. In addition to
BART controls, additional requirements could be imposed to achieve progress
toward the long-term goal. Florida has submitted a State Implementation Plan
(SIP) to EPA that contains emission reduction strategies for implementing BART
requirements and for achieving sufficient and reasonable progress toward the
goal. If Florida’s SIP is approved by EPA, Gulfs generating facilities will not be
impacted by the early phases of the Clean Air Visibility Rule.
Clean Air Mercury Rule
In March 2005, the EPA announced the final Clean Air Mercury Rule, a cap-and-
trade program for the reduction of mercury emissions from coal-fired power
plants. The rule sets caps on mercury emissions to be implemented in two
76

phases, 201 0 and 201 8, respectively, and provides for an emissions allowance
trading market. Florida submitted state rules intended to implement the Clean Air
Mercury Rule to EPA in December 2006. In February 2008, however, the U.S.
Court of Appeals for the District of Columbia Circuit vacated the federal Clean Air
Mercury Rule. The vacatur became effective with the issuance of the court’s
mandate on March 14, 2008. With CAMR voided, electric generating facilities
are no longer required to install mercuiry controls to meet the CAMR cap and
trade emission limits. Pursuant to the vacatur, EPA is expected to initiate new
mercury rulemaking proceedings to develop Maximum Achievable Control
Technologies (MACT) standards for power plants; however, this process could
take multiple years to complete. Development of new MACT mercury standards
could require substantial capital expenditures or affect the timing of current
budgeted capital expenditures that cannot be determined at this time.
Global Climate Issues
In April 2007, the U.S. Supreme Court ruled that the EPA has authority
under the Clean Air Act to regulate greenhouse gas emissions from new motor
vehicles. The EPA is currently developing its response to this decision.
Regulatory decisions that will follow from this response may have implications for
both new and existing stationary soiirces, such as power plants. The ultimate
outcome of these rulemaking activities cannot be determined at this time;
however, as with the current legislative proposals, mandatory restrictions on the
Company’s greenhouse gas emissions could result in significant additional
compliance costs that could affect future unit retirement and replacement
decisions.
77

On July 13, 2007, the Governor of the State of Florida signed three
executive orders addressing the reduction of greenhouse gas emissions within
the state, including statewide emission reduction targets beginning in 201 7.
Included in the orders is a directive to the Florida Secretary of Environmental
Protection to develop rules adopting maximum allowable emissions levels of
greenhouse gases for electric utilities, consistent with the statewide emission
reduction targets, and a request to the Florida Public Service Commission to
initiate rulemaking requiring utilities to produce at least 20% of their electricity
from renewable sources. The impact of these orders on the Company will
depend on the development, adoption, and implementation of any rules
governing greenhouse gas emissions, and the ultimate outcome cannot be
determined at this time.
Gulf will continue its involvement in the development of strategies to
address any future clean air requirements in order to minimize the uncertainty
related to the scope and cost of compliance. As new clean air initiatives emerge,
Gulf will support any proposal that would help it meet environmental goals and
objectives in a logical and cost effective way, provided that the standards are
based on sound science and economics which allow for adequate time to comply
without compromising the safe, reliable and affordable supply of electricity to
Gulf's customers.
78
AVAILABILITY OF SYSTEM INTERCHANGE
Gulf coordinates its operations with the other operating companies of the
SES: Alabama Power Company, Georgia Power Company, Mississippi Power
Company, and Southern Power Company. In any year, an individual operating
company may have a temporary surplus or deficit in generating capacity,
depending on the relationship of its (generating capacity to its load and reserve
responsibility. Each SES operating company either buys or sells its temporary
deficit or surplus capacity from or .to the pool in order to satisfy its reserve
responsibility requirement. This is accomplished through the reserve sharing
provisions of the SES Intercompany Interchange Contract (IIC) that is reviewed
and updated annually.
OFF-SYSTEM SALES
Gulf and other SES operating companies have negotiated the sale of
capacity and energy to several utilities outside the SES. The terms of the
existing contracts began prior to 2005 and extend into 2010. In addition, three
new contracts have been finalized, and are scheduled to be in effect beginning in
the summer of 2010. Two of the contracts end in December 2015, while the
other contract will end in May 2019. Gulfs share of the capacity and energy
sales is reflected in the reserves on Schedules 7.1 and 7.2 and the energy and
fuel use on Schedules 5 and 6.1.
79

This page is intentionally blank.

CHAPTER IV
FORECAST OF FACILITIES REQUIREMENTS

CAPACITY RESOURCE ALTERNATIVES
POWER PURCHASES
Gulf's use of purchased power arrangements in previous years has
proven to be a successful approach to meeting its reliability needs. In order to
meet its future need for capacity in 2014 and beyond, longer-term purchased
power from the market will be factored into expansion studies in order to evaluate
its effect on supply flexibility and reduced commitment risk during periods in
which environmental regulations (with considerable economic impacts) and
legislative initiatives focusing on generation additions are in various stages of
development.
Gulf will continue to utilize both short-term and longer-term purchased
power in the future to balance its approach to supply side resource development.
In efforts to further diversify its generation fuel mix, Gulf has developed a RFP for
the supply of capacity and energy froin renewable resources. Gulf issued its first
renewables RFP in 2008, and will be prepared to do so in the future. If future
solicitations ultimately result in proposals that are competitive with resources that
Gulf would otherwise develop, the Company will secure this renewable capacity
and energy through a PPA.
Another avenue for the purchase of renewable energy is through Gulf's
Renewable Standard Offer Contract I(RSOC) that is on file with the FPSC and is
continually available to developers of renewable resources. This contract offers
to purchase renewable capacity and (energy at the Company's avoided cost of its
80
next planned generating unit additions as shown in its current TYSP. Finally, per
FPSC rules related to renewable energy procurement, Gulf may negotiate a PPA
with a renewable energy supplier if the terms and conditions of the RSOC are not
suitable for a particular renewable project.
CAPACITY ADDITIONS
In conjunction with the SES, Gulf will conduct economic evaluations of its
potential supply options in order to determine the most cost-effective means of
meeting its future capacity obligations. Gulf will evaluate its internal construction
options versus external development of capacity resources in order to determine
how to best meet its future capacity obligations. All commercially available
generating technologies such as gas combustion turbine and combined cycle,
conventional pulverized coal, and nuclear will be included in future SES IRP mix
studies. In addition, emerging integrated gasification combined cycle (IGCC)
technologies, such as air blown IGCC, will be added to the future generation mix
studies so that their potential economic and technical viabilities may be
evaluated. While there is only limited operational experience that aids in
approximating the economic and performance characteristics of full-scale air
blown IGCC facilities, the potential benefits of the technology include greater
efficiency and lower environmental emissions.
If subsequent mix studies or RFPs identify alternative power supply
technologies or purchased power options that are more economical or that
deliver more desirable results, Gulf will modify its expansion plan to reflect the
81

proposed procurement of these resources. Gulf will continue to review all
available capacity resource possibilities in order to serve the energy needs of its
retail customers in Northwest Floriida with reliable and reasonably priced
electricity.
82

PREFERRED AND POTENTIAL SITES FOR CAPACITY ADDITIONS
Studies to determine a preferred site for the construction of the 2014 CC
unit identified on Schedule 9 of this TYSP were essentially completed in late Fall
of 2008, showing the Plant Crist site to be a more cost effective location for this
unit over the next best site, Plant Smith. However, the analysis will have to be
revisited to reflect new information related to construction and fuel supplies if
Gulf's 885 MW PPA is not approved by the FPSC. Therefore, given the possible
impacts on conclusion of the site location study due to new information, Gulf is
showing both the Plant Crist site in Escambia County, Florida and the Plant
Smith site in Bay County, Florida as potential sites being considered for locating
Gulf's next planned generating unit in Northwest Florida: Each of these potential
sites has unique characteristics that offer construction and/or operational
advantages related to the potential installation of natural gas-fired CCs. Site
selection for Gulf's next planned generating unit is based on existing
infrastructure, available acreage and land use, transmission, fuel facilities,
environmental factors including evolving ozone standards, and overall project
economics .
The required environmental and land use information for each potential
site is set forth below. The estimated peak water usage for the proposed CC
should be identical for each site mentioned below. Gulf projects that
approximately 5000 gallons per minute (gpm) would be required for industrial
83

cooling water needs, while 250 gpm would be required for domestic, irrigation,
and other potable and non-potable Walter uses.
84

Potential Site #I: Plant Crist, Escambia County
The project site would be located on Gulf's existing Plant Crist property in
Escambia County, Florida. If a future project is ultimately located on this
property, detailed studies must first be completed to determine the exact size and
location of the project site within the plant property's boundaries in order to meet
Gulf's needs while insuring full compliance with local, state, and federal
requirements. The plant property, approximately 10 miles north of Pensacola,
Florida, can be accessed via county roads from nearby U. S. Highway 29. As
shown on Schedule 1, the existing Plant Crist facility consists of 930 MW of
steam generation.
U. S. Geological Survey (USGS) Map
A USGS map showing the general location of the Plant Crist property is
found on page 88 of this chapter.
Land Uses and Environmental Features
The Plant Crist property is dedicated to industrial use. The land adjacent
to the property is currently being used for residential, commercial, and
industrial purposes. General environmental features of the undeveloped
portion of the property include mixed scrub, mixed hardwood/pine forest,
and some open grassy areas. This property is located on the Escambia
River. There are no unique or significant environmental features on the
property that would substantially affect project development.
85

Water Supply Sources
For industrial processing, cooling, and other water needs, Gulf would likely
use a combination of groundwater from on-site wells, available surface
water, and potential reclaimed water sources.
Potential Site #2: Plant Smith, Bay County
The project site would be located on Gulf's existing Plant Smith property in
Bay County, Florida. If a future project is ultimately located on this property,
detailed studies must first be completed to determine the exact size and location
of the project site within the plant property's boundaries in order to meet Gulf's
needs while insuring full compliance with local, state, and federal requirements.
The plant property, approximately 10 miles northwest of Panama City, Florida, is
located on North Bay and can be accessed via a county road from nearby State
Road 77. As shown on Schedule 1, the existing Plant Smith facility consists of
357 MW of steam generation, 556 IWW of combined cycle generation, and 32
MW of CT generation.
U. S. Geological Survev (USGS) Map
A USGS map showing the general location of the Plant Smith property is
found on page 89 of this chapter.
Land Uses and Environmental Features
The Plant Smith property is dedicated to industrial use. The land adjacent
to the property is rural and consists of planted pine plantations. General
environmental features of the property include a mixture of upland and
86

wetland areas. This property is located on North Bay, which connects to
St. Andrews Bay. The property has no unique or significant environmental
features that would substantially affect project development.
Water Supply Sources
For industrial processing, cooling, and other water needs, Gulf would likely
use a combination of groundwater from on-site wells and available surface
water.
87

' . ,
. . - , I '
' I
- . . . . . . .
! '
88

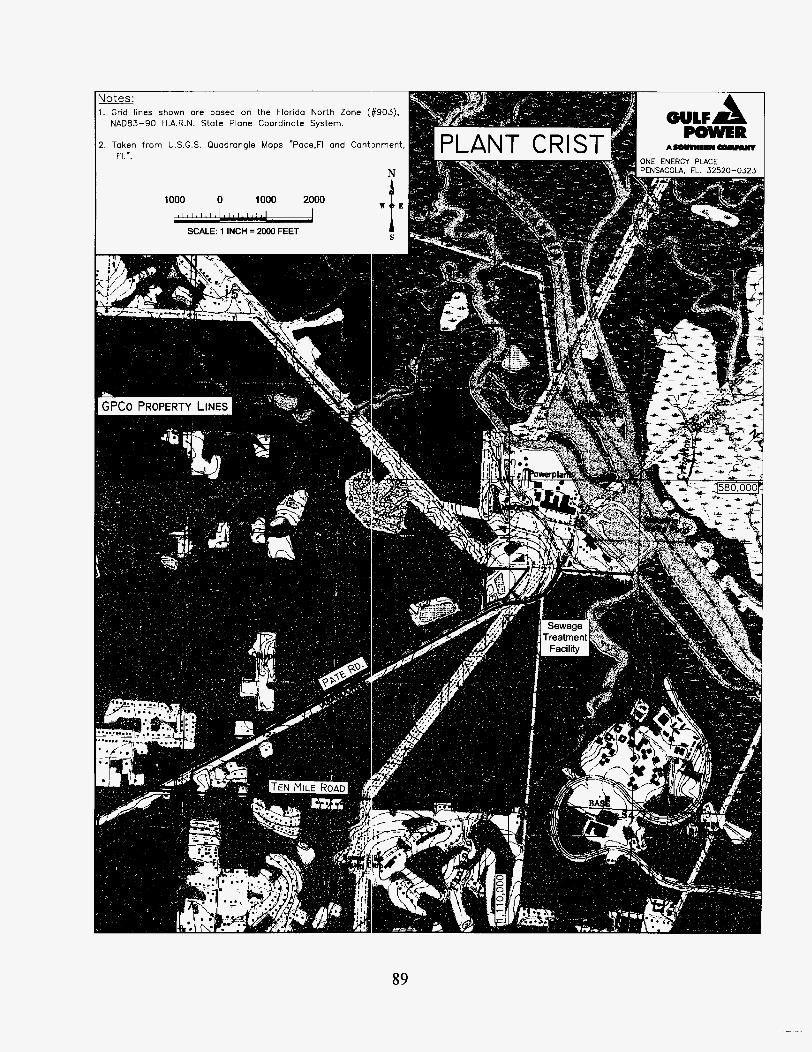
- Notes. 1 Grid lines shown ore based on the Florida North Zone (#903),
NAD83-90 H A R N State Plane Coordinate System
2 raken from U S G S Quadrangle Maps "Pace,FI and Cantmnent , AIOVIIII.II-
ONE ENERGY PLACE FI "
1000 0 1000 2000 - SCALE: 1 INCH = 2000 FEET
89


GULF POWER COMPANY
SCHEDULE 7.1 FORECAST OF CAPACITY, DEMAND, AND SCHEDULED MAINTENANCE AT TIME OF SUMMER PEAK (A)
(4) (5) (6) (7)
FIRM TOTAL FIR!
RES E RVE MARGIN BEFORE
MAINTENANCE INSTALLED CAPACITY CAPACITY CAPACITY PEAK SCHEDULED CAPACITY IMPORT EXPORT NUG AVAILABLE DEMAND % MAINTENANCE
YEAR MW (6) MW MW MW MW MW OF PEAK MW MW - 2009 201 0 201 1 2012
2014 \o 0 201 5
2016 201 7 201 8
-n..Y LU Id
2.703 2,673 2.671 2.566
2.648 2.638 2.638 2.638 2,606
c) cco L.UdU
488 48% 488 488
885 885 885 885 885
A Q Q TU"
0 0 0 0 c! 0 0 0 0 0
2,980 2,950 2,948 2,843 - 7,awi I--
3,322 3,312 3,312 3,312 3,280
2 608 372 2.670 280 2 754 194 2.794 49 2 857 78 2 917 405 2 979 333 3.026 286 3 107 205 3 196 84
14.3% NONE 10.5% 7.0% 1.8% 2.7%
13.9% 11.2% 9.5% 6.6% 2.6%
RES E RVE MARGIN AFTER MAINTENANCE
Y O
MW OF PEAK
372 14.3% 280 10.5% 194 7.0% 49 1.8% 78 2.7%
405 13.9% 333 11.2% 286 9.5% 205 6.6%
84 2.6%
NOTE: (A) CAPACITY ALLOCATIONS AND CHANGES MUST BE MADE BY JUNE 30 TO BE CONSIDERED IN EFFECT AT THE TIME OF THE SUMMER PEAK. ALL VALUES ARE SUMMER NET MW.
(8) 840 MW CC SHOWN ON SCHEDULE 9 FOR 2014 IN-SERVICE REPLACED BY 885 MW PPA SHOWN IN COLUMN (3).

GULF POWER COMPANY
SCHEDULE 7.2 FORECAST OF CAPACITY, DEMAND, AND SCHEDULED MAINTENANCE AT TIME OF WINTER PEAK
(2) (3) (4) (5) (6) (7) (8) (9) (1 0)
RES E RVE MARGIN BEFORE
TOTAL FIRM FIRM TOTAL FIRM MAINTENANCE INSTALLED CAPACITY CAPACITY CAPACITY PEAK SCHEDULED CAPACITY IMPORT EXPORT NUG AVAILABLE DEMAND % MAINTENANCE
YEAR MW (A) MW MW MW MW MW MW OF PEAK MW
2008-09 2,750 0 (211) 0 2,539 2,320 219 9.4% NONE 2009-1 0 2,742 488 (211) 0 3,019 2,399 620 25.8% 2010-1 1 2,712 488 (211) 0 2,989 2,479 510 20.6% 2011-12 2,618 488 (21 11 0 2,895 2,545 350 13.8% 201 2-1 3 2,605 488 (211) 0 2,882 2,611 271 10.4%
2014-15 2,687 885 (211) 0 3,361 2,694 667 24.8%
2016-17 2,677 885 (211) 0 3,351 2,840 511 18.0% 201 7-1 8 2,637 885 (211) 0 3,311 2,911 400 13.7%
2013-14 2,697 488 (211) 0 2,974 2,654 320 12.1%
2015-16 2,677 885 (211) 0 3,351 2,758 593 21.5%
NOTE: (A) 840 MW CC SHOWN ON SCHEDULE 9 FOR 2014 IN-SERVICE REPLACED BY 885 MW PPA SHOWN IN COLUMN (3).
(11) (1 2)
RESERVE MARGIN AFTER MAINTENANCE
% MW OF PEAK
219 9.4% 620 25.8% 510 20.6% 350 13.8% 271 10.4% 320 12.1% 667 24.8% 593 21.5% 51 1 18.0% 400 13.7%
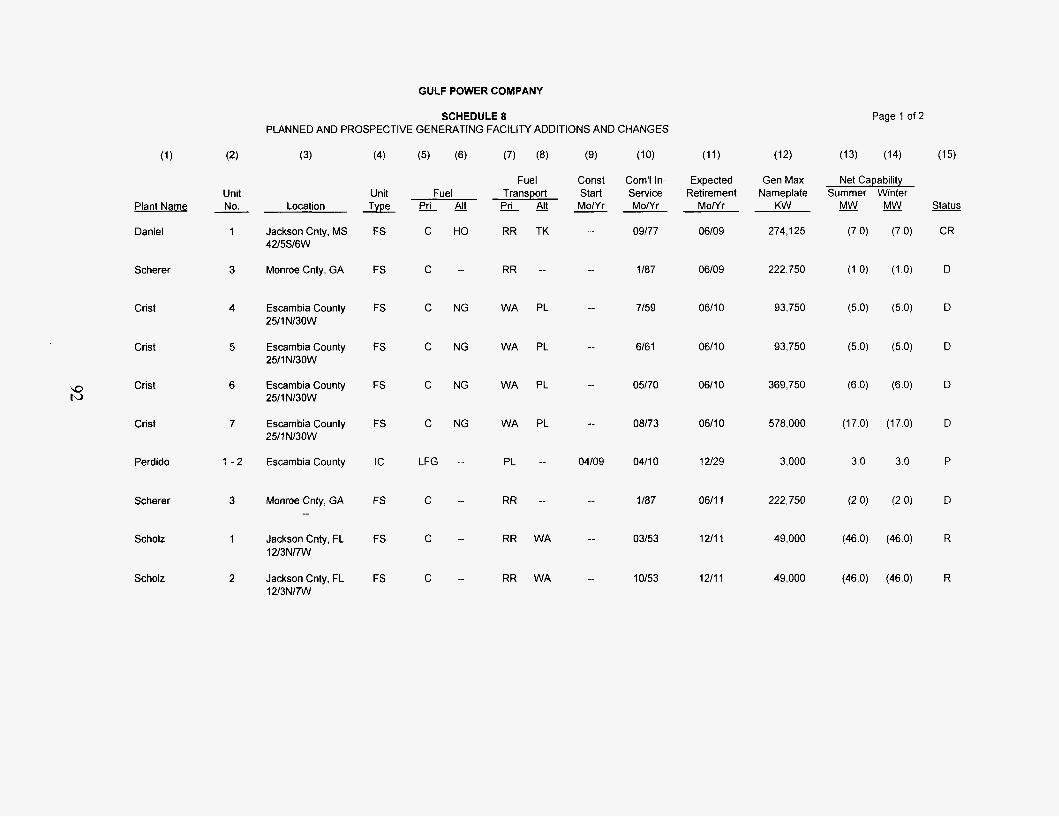
GULF POWER COMPANY
SCHEDULE a PLANNED AND PROSPECTIVE GENERATING FACILITY ADDITIONS AND CHANGES
Page ! of2
(3) (4) (9)
Fuel Const Com'l In- Expected Gen Max Net Capability Unit Unit Fuel Transport Start Service Retirement Nameplate Summer Winter
Plant Name No. Location Type Pri &It - Pri !lJ MoNr MoNr MoNr KW - MW MW Status
Daniel 1 Jackson Cnty, MS 4215Sl6W
FS C HO RR TK 09/77 06/09 274,125 (7.0) (7.0) CR
Scherer
Crist
Crist
Crist
Crist
Monroe Cnty, GA FS
FS
FS
FS
FS
c --
C NG
C NG
C NG
C NG
RR --
WA PL
WA PL
WA PL
WA PL
1 I87
7/59
616 1
05/70
08173
06/09
06/10
06/10
0611 0
0611 0
222,750
93,750
93,750
369,750
578,000
3,000
(1.0) (1.0)
(5.0) (5.0)
(5.0) (5.0)
(6.0) (6.0)
(17.0) (17.0)
3 0 3.0
Escambia County 2511 N130W
Escambia County 25/1 N130W
Escambia County 2511 N130W
Escambia County 2511 N/30W
Perdido 1 - 2 IC LFG -- PL -- 04/09 0411 0 12/29 P Escambia County
Scherer 3 Monroe Cnty, GA __
FS c -- RR -- 1/87 0611 1 222,750 (2.0) (2.0) D
Scholz 1 Jackson Cnty, FL 12/3N17W
FS c -- RR WA 03/53 12/11 49,000 (46.0) (46.0) R
Scholz 2 Jackson Cnty, FL 1213N17W
FS c -- RR WA 10153 1211 1 49,000 (46.0) (46.0) R

GULF POWER COMPANY
SCHEDULE 8 PLANNED AND PROSPECTIVE GENERATING FACILITY ADDITIONS AND CHANGES
Page 2 of 2
(3) (4) (5)
Fuel Const Com'l In- Expected Gen Max Net Capability Unit Unit Fuel Transport Start Service Retirement Nameplate Summer Winter
MW MW Status MoNr KW - Plant Name No. Location Type Pri @ - Pri - Alt MoNr MoNr
Crist 6 EscambiaCounty FS C NG WA PL _ _ 05/70 0611 2 369,750 (13.0) (13.0) D 2511 N130W
Scholz S WDS -- TK RR 01/12 06/13 12/42 49,000 46.0 46.0 P 1 Jackson Cnty, FL 12/3N/7W
Scholz 2 Jackson Cnty, FL 12/3N17W
S WDS -- TK RR 01/12 06/13 12/42 49,000 46.0 46.0 P
Daniel
Daniel
Daniel
Daniel
Smith
1 Jackson Cnty, MS 42/5S/6W
FS
FS
FS
FS
CT
C HO
C HO
C HO
C HO
LO --
RR TK
RR TK
RR TK
RR TK
TK --
_ _ 09/77
_- 0618 1
_ _ 09/77
__ 06/81
_ _ 05/71
06/14
0611 4
0611 5
0611 5
1211 7
274,125 (5.0) (5.0) D
2 Jackson Cnty, MS 42/5S/6W
274,125
274,125
274,125
41.850
(5.0) (5.0)
(5.0) (5.0)
(5.0) (5.0)
(32.0) (40.0)
1 Jackson Cnty, MS 42/5S/6W
2 Jackson Cnty, MS 4215S16W
A Bay County, FL 36/2S/15W
Abbreviations: - Fuel Unit TvDe Fuel TransDortation
FS - Fossil Steam
CT - Combustion Turbine CC - Combined Cycle IC - Internal Combustion
S - Steam C - Coal
NG - Natural Gas LO - Light Oil HO - Heavy Oil LFG - Landfill Gas WDS -Wood Waste Solid
CR - Certified Rating change D - Environmental derate P - Planned, but not authorized by utility R - To be retired V - Under construction, more than 50% complete
PL - Pipeline TK - Truck RR - Railroad WA - Water
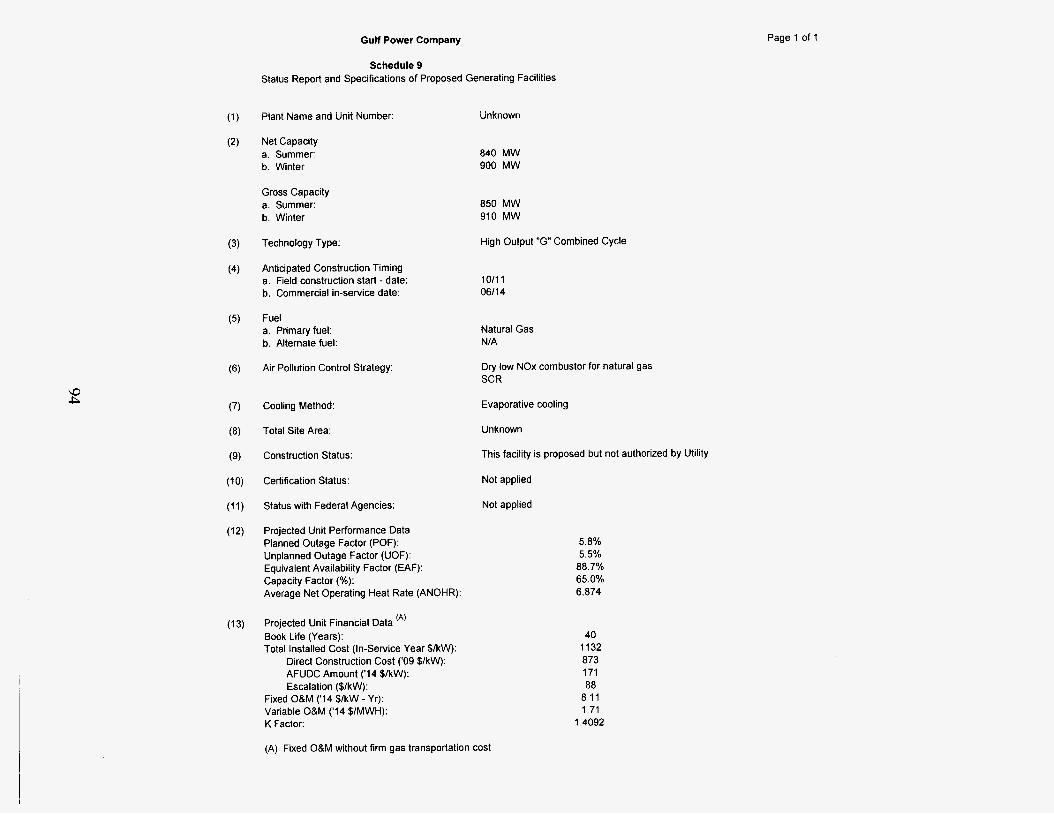
Gulf Power Company Page 1 of 1
Schedule 9 Status Report and Specifications of Proposed Generating Facilities
(i j Piani Name and tinit Number:
(2) Net Capacity a. Summer: b. Winter
Gross Capacity a. Summer: b. Winter
(3) Technology Type:
(4) Anticipated Construction Timing a. Field construction start - date: b. Commercial in-service date:
(5) Fuel a. Primary fuel: b. Alternate fuel:
(6) Air Pollution Control Strategy:
(7) Cooling Method:
(8) Total Site Area:
(9) Construction Status:
( I O ) Certification Status:
(11) Status with Federal Agencies:
(12) Projected Unit Performance Data Planned Outage Factor (POF): Unplanned Outage Factor (UOF): Equivalent Availability Factor (EAF): Capacity Factor (%): Average Net Operating Heat Rate (ANOHR):
(13) Projected Unit Financial Data (A)
Book Life (Years): Total Installed Cost (In-Service Year $IkW):
Direct Construction Cost ('09 $IkW): AFUDC Amount ('14 $/kW): Escalation ($/kW):
Fixed O&M ('14 $/kW - Yr): Variable 0&M ('14 $IMWH): K Factor:
iinknown
840 MW 900 MW
850 MW 910 MW
High Output "G" Combined Cycle
1011 1 0611 4
Natural Gas NIA
Dry low NOx combustor for natural gas SCR
Evaporative cooling
Unknown
(A) Fixed O&M without firm gas transportation cost
This facility is proposed but not authorized by Utility
Not applied
Not applied
5.8% 5.5%
88.7% 65.0% 6,874
40 1132 873 171 88
8.1 1 1.71
1.4092

C 0 cn cn .- .- 5 C E l-
W C m t: 0 Q
2
C
2 C Y C 3
W C 0 C cn .- .- 6 Y- 0 * C 0 .- a h
7 v
C C C C
C C C 0 0 0 C C C C Y Y Y Y Y Y Y C C C C C C K S
3 3 3
3 3 3 3 3 3 3 2
Y- O 5 E z
a 3
h
CL
g ul C a, J a, C A .- h
2L
bj cn m CI - P
5
95


![Diamond Williams - psc.state.fl.us · 000121A-TP AT&T Florida's Update to SQM Plan for EBTNECTA Diamond Williams Page 1 of 1 From: WOODS, VlCKlE (Legal) [vfl979@att.com] Sent: To:](https://img.pdfslide.us/doc/110x75/60190f99825a494c700594f6/diamond-williams-pscstateflus-000121a-tp-att-floridas-update-to-sqm-plan.jpg)