Embed Size (px)
Citation preview
REPORT OF PESTICIDE HOTSPOTS IN
BANGLADESH
by
CRAIG MEISNER
DEVELOPMENT ECONOMICS RESEARCH GROUP INFRASTRUCTURE AND ENVIRONMENT DEPARTMENT
THE WORLD BANK
SEPTEMBER, 2004
I. Introduction:
The agricultural sector in Bangladesh faces many challenges in the coming years. Owing
to its rapid population growth and food security needs, land scarcity and agricultural
intensification are quickly becoming issues of pressing importance. Combined with the
severe agro-climatic conditions (for example, annual flooding), agricultural production
will have further difficulty in meeting future demands. As a direct consequence of these
difficult conditions, agriculture has been highly susceptible to crop pest attacks and
diseases. Conservative estimates of annual crop losses are in the range of 10-15%
without any direct intervention. In their defense, farmers have begun to use more toxic
chemicals for pest control that have reputations of speed and effectiveness. The
Government of Bangladesh also promotes the use of pesticides to expand its agricultural
frontiers and increase output per acre of land.1 As a result, pesticide use in general is
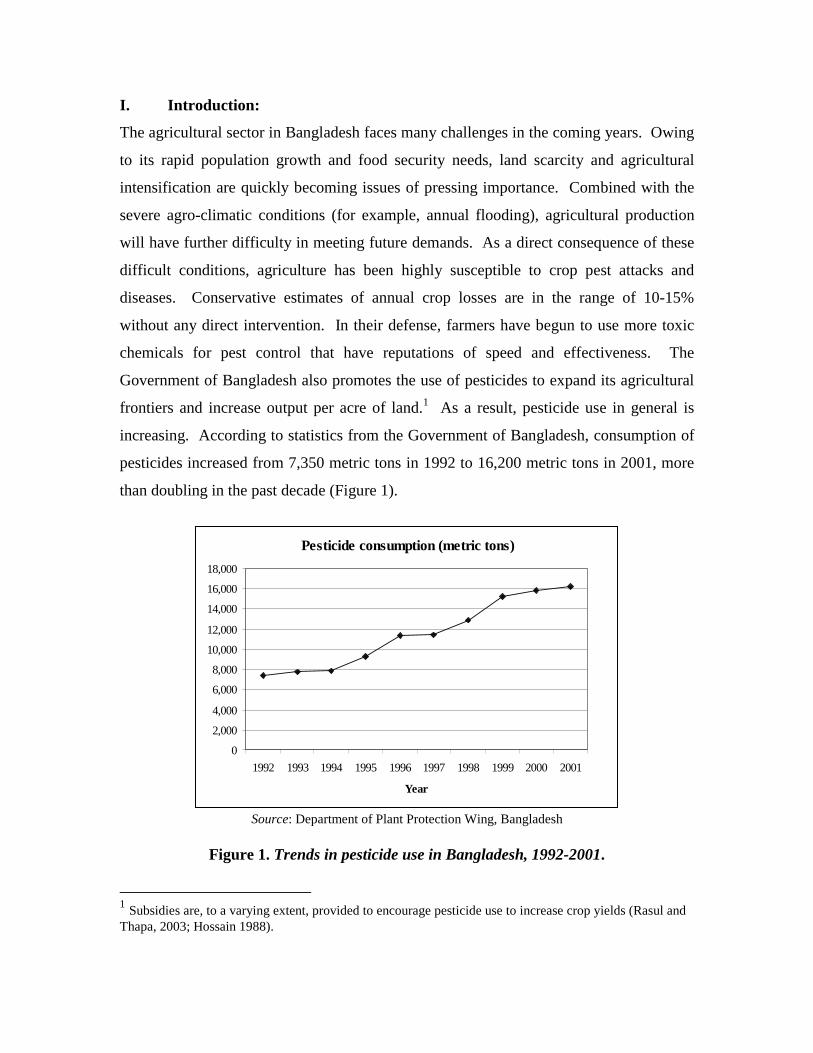
increasing. According to statistics from the Government of Bangladesh, consumption of
pesticides increased from 7,350 metric tons in 1992 to 16,200 metric tons in 2001, more
than doubling in the past decade (Figure 1).
Source: Department of Plant Protection Wing, Bangladesh
Figure 1. Trends in pesticide use in Bangladesh, 1992-2001.
1 Subsidies are, to a varying extent, provided to encourage pesticide use to increase crop yields (Rasul and Thapa, 2003; Hossain 1988).
Pesticide consumption (metric tons)
0
2,000
4,000
6,000
8,000
10,000
12,000
14,000
16,000
18,000
1992 1993 1994 1995 1996 1997 1998 1999 2000 2001
Year

Perhaps of even greater concern than the absolute quantity of pesticides is the trend in the
composition of pesticides currently in use in Bangladesh. Insecticides and fungicides
account for 97% of pesticide use and have registered a steady increase over the years. An
FAO analysis of active ingredients has revealed high shares of carbamates and
organophosphates in insecticides and dithiocarbamates and inorganics in fungicides (see
Table 2, Appendix I for details). Epidemiological studies have found carbamates and
organophosphates to be carcinogenic (producing cancer), mutagenic (causing genetic
damage), teratogenic (damaging to the fetus) or allergenic (Zahm, Ward and Blair, 1997).
Many pesticides in use are also banned or restricted under international agreements
(NOVIB, 1993; SUNS, 1998; SOS-arsenic.net, 2004). Several studies of farmers have
shown that inadequate product labeling and farmers’ lack of information have led to
widespread overuse or misuse of dangerous pesticides. A substantial body of anecdotal
evidence also suggests that pesticide poisonings and ecological damage have become
commonplace in Bangladesh (Ramaswamy, 1992; Jackson 1991).
Current projections suggest that the agricultural output of Bangladesh needs to grow
several times during the next several decades, as the population of Bangladesh continues
to grow and incomes increase. Bangladesh will have to increase yields from the land
currently under cultivation in order to serve this increased demand. Given both the
formal and informal evidence to date, pesticide use warrants a careful assessment of the
current situation as well as experimentation with feasible alternative production systems
such as Integrated Pest Management/ and organic farming techniques. However, in order
to effectively implement such programs, one first needs to identify the hotspot areas
where pesticide use is high, and where farmers may benefit the most.
As in many developing countries, Bangladesh lacks sufficient information on pesticide
use, even at the regional level. Given this informational gap, the purpose of this report is
to present the results of a exercise that combines recent farm-level pesticide use data and
Bangladesh agricultural production data to estimate pesticide use “hotspots” or pesticide-
intensive areas at the district level. The identification of such areas can aid policymakers
and extension agents in targeting potential areas for education and training programs

aimed at reducing the dependence on toxic pesticides. The report is structured as follows.
The next section describes the methodology adopted for the hotspot analysis and in
Section IIII the results are presented in the form of maps along with some brief
commentary. In Section IV, we discuss the findings and conclude.
II. Simulation methodology2
In the absence of detailed information on pesticide use at the farm level for all areas of
Bangladesh, we make use of a recent World Bank farm-level pesticide survey conducted
in 2003.3 Structured questionnaires were used to collect information on crop yield,
inputs, pesticide use and practices, applicator precautions and averting behavior, health
effects (if any) and environmental effects. For the purposes of this report only the
information on crop inputs and outputs were used (e.g. crop production and pesticide
use). Specific crops included rice (Boro), potatoes, green beans, cabbage, eggplant and
mango production all of which are well-known pesticide users (Figure 2).
Figure 2. Crop composition of the World Bank survey, 2003.
2 For a detailed explanation of the simulation methodology, see the learning module “Identifying Pesticide
Hotspots: The case of Bangladesh” by Meisner and Dasgupta, 2004. 3 The survey was conducted by the Development Economics Research Group, Infrastructure and
Environment Department of the World Bank in the summer of 2003.
Crop composition of the survey
846
430
748
355311
149
0
100
200
300
400
500
600
700
800
900
Boro Beans Eggplant Cabbage Potato Mango
Crop
Num
ber
of fa
rms

The survey sample was also distributed among several districts to capture any possible
differences in production or pesticide use. The survey covered the following districts:
Bogra, Chapainawabgunj, Rajshahi and Rangpur (Rajshahi division); Chittagong and
Comilla (Chittagong division); Jessore (Khulna division); and Kishoreganj, Munshiganj,
Narsingdi and Mymensingh (Dhaka division) (see Figure 3).4
Figure 3. Geographical distribution of the survey (sample size indicated).
Among the various production and input information collected, the survey contained
information on the type and application amounts of pesticides used for each crop. Using
this information, pesticide use intensities (measured as kg of pesticide per kg of crop
output) were calculated for each crop. The intensities were then multiplied by actual
agricultural production data obtained from the Agricultural Census of Bangladesh for the
years 1994-1995 and 1999-2000 (see diagram in Figure 4). Summing across all crops in
each district, the estimates yielded pesticide use loads for each district. As the number of
4 Note that the selection of each district is according to the new district classification of 64 districts.

crops were limited to only those considered as major crops (from above), these estimates
should be interpreted as underestimates of the true extent of pesticide use in each district.
Figure 4. Pesticide Intensity Calculation.
By simply summing all pesticides (measured as kg of active ingredient) used in crop
production, this implicitly assumes that all pesticides are alike in terms of their toxicity.
However, to better gauge the relative hazardousness one would account for the
pesticide’s relative toxicity. To do this, we constructed risk-weighted measures by
defining risk as the relative toxicity or lethality of each active ingredient. Risk-weighted
measures place a greater weight on more toxic substances and provide a more convenient
measure of comparing the use of one pesticide over another from a health-hazard
perspective. To gauge the relative toxicity of each active ingredient, a measure called the
LD50 (or lethal dose 50%) is used. LD50 is a statistical estimate of the number of
milligrams (mg) of toxicant per kilogram (kg) of bodyweight required to kill 50% of a
large population of test animals. Pesticides with a lower LD50 value are more toxic, thus
in the calculations used for this exercise, each pesticide load was multiplied by 1/LD50 to
account for its relative toxicity and giving greater weight to more toxic substances. All of
the results presented below are risk-weighted unless specifically indicated.
Crop Production Data Agricultural Census, 1994 & 1999
(8 major crops in 23 districts)
Survey data on pesticide use The World Bank, 2003
(1072 farmers in 11 districts)
Pesticide Use Intensities - by crop, area, chemical class, etc.

III. Results
Comparison of pesticide use in 1994-1995 versus 1999-2000
As indicated earlier, pesticide use is on the rise in Bangladesh, and further evidence of
this trend is provided below in Figures 5 and 6. In particular, several districts where
pesticide use was high in 1994-95, including Dhaka, Rajshahi and Rangpur, have
intensified in terms of overall (absolute) pesticide use by 1999-2000. The district of
Rangamati experienced a decrease during the same comparative time interval.
Figure 5. Pesticide use (un-weighted), 1994-1995. Figure 6. Pesticide use (un-weighted), 1999-2000.
As discussed above, although un-weighted pesticide amounts are useful in terms of
overall country regulatory policy (e.g. trade), in terms of health hazards, it is more useful
to weight these estimates by the relative risk of each pesticide used. Below in Figures 7
and 8, we compare the un-weighted and risk-weighted measures for 1999-2000.
Although Dhaka, Rajshahi and Rangpur remain high on the list in terms of riskier
pesticide use, the districts of Comilla and Barisal fall with respect to the others, while
Jessore rises in terms of risk-weighted pesticide use.

Figure 7. Pesticide use (un-weighted), 1999-2000. Figure 8. Risk-weighted pesticide use, 1999-2000.
Pesticide use by WHO classification
Developing on the estimates of risk-weighted pesticide use, a convenient categorical
method has been developed by the World Health Organization (WHO) based on the LD50
measure.5 Pesticides are divided into 4 major hazard groups: Category Ia & Ib
(extremely hazardous), Category II (moderately hazardous), Category III (slightly
hazardous), and Category U (least hazardous or unlikely to present acute hazard under
normal use). Field evidence suggests that human poisonings correlate reasonably well
with these toxicity ratings (Levine and Davies, 1982).
From our simulation results, we can categorize pesticides according to the WHO
classification system. In Table 1. we see that in among the pesticides selected by farmers
in the World Bank survey, 19% were Class Ia or Ib, and in terms of the amount that was
applied to crops nearly 6% were Ia or Ib. Using the agricultural census data for 1999-
5 The WHO toxicity rating is based on the lowest published oral LD50, typically tested on rats. While
WHO ratings generally reflect acute toxicity, they also take into account other toxic effects such as reproductive and developmental toxicity (WHO, 2002).

2000, we see that geographically the distribution of Ia & Ib use is concentrated in the
districts of Dhaka, Jessore, Rajshahi and Rangpur (Figure 9).
Table 1. Frequency of pesticide applications by WHO classification
Classification By farmer application frequency (%)
By farmer application dose or load (%)
Class Ia & Ib 19.12 5.71 Class II 58.58 41.51 Class III 7.50 15.01 Class U 14.80 37.70 Total 100.00 100.0
Note: Based on 51 active ingredients and 161 formulations (commercial names).
Figure 9. WHO classified Ia & Ib pesticides, 1999-2000.

Pesticide use by chemical class
As noted earlier, epidemiological evidence has suggested that specific chemical classes
are associated with acute health and chronic disease problems. In particular, carbamates,
organophosphates and organochlorines have been identified as priority classes for
monitoring and evaluation. By categorizing pesticides into these constituent classes, we
estimated the amount of risk-weighted pesticides that fall into these chemical classes. In
Figures 10 through 12 below, we see a noticeable pattern for Rajshahi and Rangpur as
consistent top priority districts with respect to all three chemical classes, Dhaka and
Comilla for organochlorines, Kustia and Jessore for carbamates and Kishoreganj for
organophosphates.
Figure 10. Carbamate use, 1999-2000. Figure 11. Organochlorine use, 1999-2000. Figure 12. Organophosphate use, 1999-2000.
Prevalence of Persistent Organic Pollutants (POPs)
Yet another broad class of pesticides receiving widespread international attention are
persistent organic pollutants or POPs. POPs pose a severe long-run threat because they
can accumulate in the environment over time.6 Whatever the source of POPs, air and
water dispersion makes their toxic impact potentially global. Near the top of the food
6 Epidemiological studies have been conducted associating human exposure to specific POPs or classes of
POPs with cancers and tumors at multiple sites; neurobehavioral impairment including learning disorders, reduced performance on standardized tests and changes in temperament; immune system changes; reproductive deficits and sex-linked disorders; a shortened period of lactation in nursing mothers; and diseases such as endometriosis, increased incidence of diabetes, and others.

chain, POP accumulations have become extremely hazardous in some species of
mammals, birds and fish. Recognizing these growing concerns, the United Nations has
recently sponsored several rounds of international negotiation to address the global
contamination by twelve particular POPs.7 During the survey conducted by the World
Bank in 2003, the use of two POPs were encountered, heptachlor and endrin. As can be
seen in Figure 13 below, the presence of POPs were found in the districts of Comilla,
Chittagong, Dhaka, Rajshahi and Mymensingh.
Figure 13. Prevalence of Persistent Organic Pollutants, 1999-2000.
7 The twelve initially targeted are: Aldrin, DDT, Dieldrin, Endrin, Chlordane, Heptachlor,
Hexachlorobenzene, Mirex, Toxaphene, PCBs, PCDDs and PCDFs. For a detailed discussion, see UNEP (1997).

WHO class Ia & Ib pesticide use by major crop from the Agricultural Census
Among the major crops covered by the Agricultural Census, below we present the maps
for banana, bean, cabbage, eggplant, potato, rice and sugar. We present only these major
crops since these were also the only major crops covered by the World Bank survey. Due
to the geographic variation in cropping patterns in Bangladesh, pesticide use in that
particular crop will vary widely across districts. However, one common finding is that
the location of the largest production tends to coincide with the largest in terms of overall
and WHO Ia & Ib pesticide use for that particular crop. For example, according to the
census for the period 1999-2000, rice production was largest in the districts of Rangpur,
Kishoreganj, Rajshahi and Comilla. These were also identified as being the highest in
terms of highly toxic, as well as overall, pesticide use.
Figure 14. Pesticide use in bananas, 1999-2000. Figure 15. Pesticide use in beans, 1999-2000.
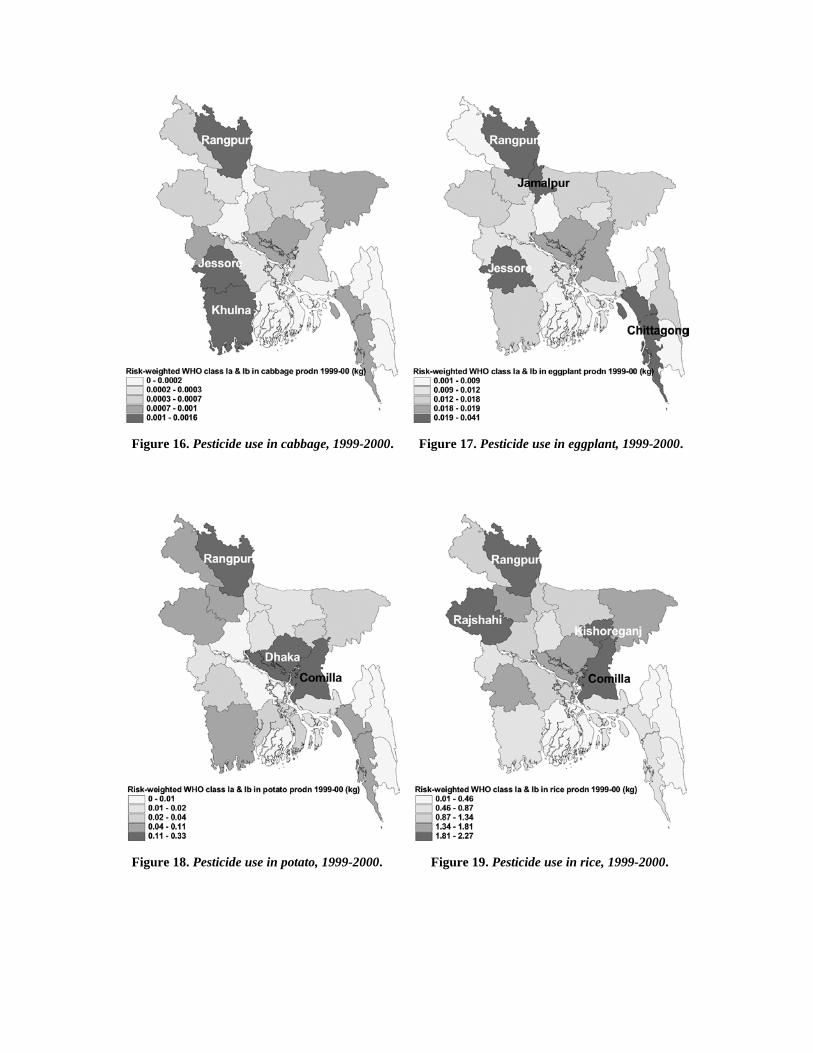
Figure 16. Pesticide use in cabbage, 1999-2000. Figure 17. Pesticide use in eggplant, 1999-2000.
Figure 18. Pesticide use in potato, 1999-2000. Figure 19. Pesticide use in rice, 1999-2000.

Figure 20. Pesticide use in sugarcane, 1999-2000.
IV. Discussion and conclusions
This report has presented a relatively current snapshot of pesticide use in Bangladesh for
a number of major crops. As detailed, dis-aggregated, information on pesticide use is not
currently available, the findings of this report attempts to cast some light on the overall
extent of pesticide use in Bangladesh, as well as, highlight areas where particularly toxic
pesticides are concentrated.
The methodology combined information from a recent World Bank farm-level pesticide
use survey and Agricultural Census data from the Government of Bangladesh to estimate
absolute and risk-weighted pesticide use for each of the 23 districts. The estimates were
then grouped into several categories to highlight areas of high relative toxicity according
to WHO Ia & Ib pesticides and by high priority chemical classes. The findings suggest
that policymakers may focus their efforts in a select number of districts, depending on
what their priorities might dictate. For example, if the immediate priority is to substitute
out the most highly hazardous pesticides, directed interventions towards areas where
WHO class Ia & Ib pesticides are still in high use might be considered. After addressing
more short-term objectives, longer-term strategies may involve decreasing overall

pesticide use, and shifting agricultural production towards, say, IPM adoption. In this
case, efforts may be directed towards areas that are more dependent on high quantities.
In sum, policymakers may use this information for a variety of targeted interventions
from the monitoring of particularly toxic pesticides (e.g. for the implementation of bans
or restrictions) to developing programs of pesticide awareness (e.g. health considerations,
protective measures, or IPM adoption).

References
Hossain, M. (1988) Nature and Impact of the Green Revolution in Bangladesh. Research
Report No. 67. International Food Policy Research Institute, Washington, DC. Jackson, G. J. (1991) Agrochemical Usage in Asia Region: A Reference Compendium.
Mimeo. Levine, R.S., and J.E. Davies (1982) Pesticide Toxicity and Mode of Action. In J.E.
Davies, V.H. Freed, and F.W.Whittemore (eds.), An Agromedical Approach to Pesticide Management: Some Health and Environmental Considerations. Miami, Fla., USA: University of Miami School of Medicine in cooperation with the Agency for International Development (USAID) and Consortium of International Crop Protection.
Meisner, C. M. and S. Dasgupta (2004) Identifying Pesticide Hotspots: The Case of
Bangladesh. Mimeo. Available at: http://www.worldbank/nipr. NOVIB (1993) Pesticides Misuse in Bangladesh. The Pesticides News, No. 22, Dec.
1993. The Pesticides Trust. London, U.K. Ramaswamy, S. (1992) Pest Control and Environment. Notes for discussion at a seminar
on environment and agriculture. Agriculturalist Association of Bangladesh, Dhaka, p.19.
Rasul, G. and G. Thapa (2003) Sustainability Analysis of Ecological and Conventional
Agricultural Systems in Bangladesh. World Development, 31(10): 1721-1741. SOS-Arsenic.net (2004) Agrochemicals: Imported Pollutants in Bangladesh. Available
at: http://www.sos-arsenic.net/index.html. SUNS (1998) Pesticide Overuse Takes Serious Turn in Bangladesh. Monday, Jan. 24,
(Dhaka, Jan. 23 IPS/Tabibul Islam). UNEP (United Nations Environmental Programme) (1997) Decisions Adopted by The
Governing Council at its Nineteenth Session: 13C. International Action to Protect Human Health and the Environment Through Measures Which Will Reduce and/or Eliminate Emissions and Discharges of Persistent Organic Pollutants, Including the Development of an International Legally Binding Instrument, Geneva.
World Development Report (2002) Building Institutions for Markets, World Bank:
Washington, DC. WHO (World Health Organization) (2002) The WHO Recommended Classification of
Pesticides by Hazard and Guidelines to Classification 2000-2002, Geneva, World Health Organization. Available at:
http://www.who.int/ipcs/publications/pesticides_hazard/en/

Zahm, S. H., M. H. Ward and A. Blair (1997) Pesticides and Cancer. In: Occupational
Medicine: State of the Art Reviews. Vol. 12: Pesticides (Keifer, M., ed). Philadelphia: Hanley and Belfus, Inc., 269-289.

Appendix I Table 2: Active Ingredients Used (sold) in the Agricultural Sector, Bangladesh
Consumption (million tons) Year Insecticides 1990 1991 1992 1994 1993 1995 1996 1997 1998
Carbamate Insecticides 170 182 202 - 210 250 270 290 300
Chlorinated Hydrocarbons 30 24 32 - 28 35 15 1 -
Organophosphates 720 751 821 - 855 810 950 980 1,020
Pyrethroids 9 9 14 - 13 14 15 5 15
Other Insecticides 26 26 33 - 18 45 50 50 30
Total Insecticides 955 992 1102 - 1124 1154 1300 1326 1365
Herbicides Bipiridils - - - - - 12 20 20 19
Phenoxy Hormone Products 9 10 10 - 6 32 30 30 28
Other Herbicides 26 25 23 - 27 22 13 13 15
Total Herbicides 35 35 33 - 33 66 63 63 62
Fungicides Benzimidazoles - - 1 - 1 7 5 5 7
Diazines, Morpholines - - 1 - 1 5 4 4 2
Dithiocarbamates 130 125 131 - 120 132 155 170 320
Other Fungicides 4 5 3 - 6 6 5 5 23
Inorganics 142 130 175 - 200 320 375 410 350
Triazoles, Diazoles 276 260 1 - 1 5 6 4 6
Fungicide &Bacterial & Seed Treatment 276 260 312 - 329 475 550 598 708
Rodenticides Anticoagulants - - 1 - 1 2 2 1 2
Other Rodenticides - - 5 - - 5 4 5 4
Total Rodenticides - - 6 - 1 7 6 6 6 Source: FAO


![[Maurice Meisner] Mao's China and After a History(Bookos.org)](https://img.pdfslide.us/doc/110x75/55cf9d3f550346d033acdb16/maurice-meisner-maos-china-and-after-a-historybookosorg.jpg)