Embed Size (px)
Citation preview
1
wmvdidth
sogup9gp
flflstMobeac
Js
1
N. P. Costae-mail: [email protected]
R. Maiae-mail: [email protected]
M. F. Proençae-mail: [email protected]
Departamento de Engenharia Civil,Faculdade de Engenharia da Universidade do
Porto,Rua Dr. Roberto Frias,
4200-465 Porto,Portugal
F. T. Pinho1
Centro de Estudos de Fenómenos de Transporte,Faculdade de Engenharia da Universidade do
Porto,Rua Dr. Roberto Frias,
4200- 465 Porto,Portugal
andUniversidade do Minho, Largo do Paço, 4704-
553 Braga, Portugale-mail: [email protected]
Edge Effects on the FlowCharacteristics in a 90 degTee JunctionMeasurements of pressure drop were carried out for the flow of a Newtonian fluid in90 deg tee junctions with sharp and round corners. Rounding the corners reduced theenergy losses by between 10 and 20%, depending on the flow rate ratio, due to thereduction in the branching flow loss coefficient, whereas the straight flow basically re-mained unaffected. The corresponding detailed measurements of mean and turbulentvelocities for a Reynolds number of 31,000 and flowrate ratio of 50% showed thatrounding the corner lead to an increase in turbulence in the branch pipe. The increasedturbulence diffused momentum more efficiently thus reducing the length of the recircula-tion by 25% with its width and strength also decreasing in magnitude. The overall effectof the increased dissipation due to turbulence and reduced dissipation due to mean flowirreversibilities in the recirculation was a decrease in the corresponding loss coefficient.�DOI: 10.1115/1.2354524�
IntroductionTee junctions are frequently present in industrial systems and
ater distribution networks where there is the need to separate orerge flows. Disturbances from a condition of straight fully de-
eloped flow, such as those created by fittings and accessories,issipate extra energy �1�, which is directly proportional to thentensity of the disturbance. Since 90 deg tee junctions are veryisturbing accessories that lead to separated and reverse flowshey account for large energy losses if present in large quantities,ence improvements are welcome to reduce the energy bill.
Rounding the corner can help reduce pressure losses, but theeparating point becomes dependent on the outlet flowrate ratio,utlet to inlet pipe diameter ratio, pipe roughness, and flow re-ime. The extent and magnitude of these changes are still poorlynderstood and documented and constitute the motivation for theresent study. Here, the diverging turbulent Newtonian flow in a0 deg tee junction with sharp corners is experimentally investi-ated in detail and its flow characteristics are compared with thoseertaining to a similar junction with rounded corners.
The amount of available information on 90 deg T-junctionows is rather limited or old and consequently less accurate. Theow is highly complex and three-dimensional and is not acces-ible to any simplified theoretical analysis. The first series of sys-ematic experimental work in this geometry was carried out in
unich by Vogel �2�, who investigated the division and mergingf flows in nonsymmetric bifurcations, analyzing the effects ofranch pipe diameter and edge radius. Gardel �3,4� included theffects of area ratio, branch angle, and curvature of the junctionnd derived semi-empirical expressions for the local loss coeffi-ients.
1Corresponding author.Contributed by the Fluids Engineering Division of ASME for publication in the
OURNAL OF FLUIDS ENGINEERING. Manuscript received September 9, 2005; final manu-
cript received May 7, 2006. Assoc. Editor: Timothy J. O’Hern.204 / Vol. 128, NOVEMBER 2006 Copyright ©
In the 1960s various researchers attempted to justify theoreti-cally the semi-empirical formulas �5�. A theoretical definition ofthe streamlines and wall pressure distribution in the 90 deg teewas carried out by Iwanami et al. �6� based on the potential flowtheory to help understand the mechanisms of pressure loss. Theyconsidered the straight pressure loss similar to that in a suddenenlargement whereas the branch pressure loss was modeled as thesum of the loss in a contraction followed by a sudden enlarge-ment. Other investigations in the nineteen sixties and seventieswere aimed at confirming and extending results of previous re-search �7�.
More recently, Maia �7� concluded that the traditional pressurefield characterization was no longer enough to improve the designof pipe accessories, but required a deeper knowledge of the rela-tionship between flow geometry, pressure field, and flow kinemat-ics. Sierra Espinosa et al. �8,9� investigated round-edge tees andcompared a limited set of measurements with simulations by thestandard k−� model, the renormalization group theory �RNG�k−� model and the standard Reynolds stress �RSM� turbulencemodels. These models were able to predict the mean flow quali-tatively, but the comparisons involving the standard k−� andRNG models were poor except on the approach flow. Downstreamof the T-junction, the RSM could not predict the mean flow aswell it overpredicted significantly the extent of the recirculationregion in the branch pipe, but it reproduced well the anisotropy ofthe Reynolds stress tensor. However, careful inspection shows thatnone of these models did a good job. Recently, Páal et al. �10�used an RSM and the shear stress transport �SST� k−� model ofMenter �11� to calculate the flow in a 90 deg tee junction withsharp edges; they were able to predict the mean flow reasonablywell, but k was significantly under-predicted. The good perfor-mance of the SST model was due to its improved ability to dealwith separated and rapidly strained flows.
Systematic investigations on the effects of rounding the corner
were initially carried out by Boldy �12� and Ito and Imai �13�,2006 by ASME Transactions of the ASME

wfiA
omag�stflbeu�gphppt
adagtspaR
ieth
2
mTetodsa
F„
st
J
hich became the basis of the standard data on energy loss coef-cients for tee junctions of the British Hydromechanics Researchssociation �BHRA� �14�.Today, there is renewed interest on tee junction flows because
f the usefulness of diverging flows as separating devices forulti-phase systems found in chemical and power plants �15–17�
nd the presence of a large number of bifurcations in living or-anisms even though here the bifurcation angle is less severe21–25�. In general, in two-phase flow bifurcations there is phaseeparation with dramatic effects on the pressure differences, andhis strongly depends on the geometry, its orientation and type ofuid. Expressions for pressure drop were developed, commonlyased on single-phase loss coefficients, taking into account theffects of branch orientation, flow direction �horizontal or vertical,pward, or downward� and its interaction with phase separation15–17�. More recent research developed split models for annularas/ liquid separation and measured in detail such flows and inarticular the position of the interface �18,19�. Numerical methodsave also been developed to deal with gas-liquid and liquid-liquidhase separation in T-junctions; Issa and Oliveira �20� used aressure-volume fraction velocity correction scheme in a conven-ional seggregated two fluid approach finite volume method.
In living organisms, bifurcations are present in the respiratorynd the circulatory system. Here, the approach flow is never fullyeveloped, the pipe is tapered, the flow is time-dependent and thengle of bifurcation is usually well below 90 deg. These investi-ations are usually in the laminar flow regime �21�, very oftenransient �22�, fluids are non-Newtonian �23� and geometries haveimilarities to true arteries �24�, i.e., consecutive junctions in ta-ered ducts and transient flow. Less often, but equally important,re investigations in the convergent flow as carried out byavensbergen et al. �25�, amongst others.The present contribution is aimed at experimentally character-
zing and comparing the flows in two similar tees having differentdges at the junction: One has a sharp-edged connection betweenhe branch pipe and the main straight pipes whereas the second teeas round edges.
Test Rig and InstrumentationThe experiments were carried out in the closed loop rig sche-atically shown in Fig. 1. The test section was made of two parts:he three 2 m long pipes �pipe test section� and the correspondingxtension forming the tee junction test section. The pipe test sec-ions were manufactured from drawn tube with internal diametersf 30.8 mm±45 �m. To reduce optical refraction of laser beams,uring the laser-Doppler anemometry measurements, the tee testection was carefully machined from rectangular blocks of
ig. 1 Schematic representation of the experimental set-up:1… Tee test section „flow field characterization…, „2… pipe testection „pressure field characterization…, „3… flowmeter, „4…ank, „5… pump, „6… valve, „7… pulsation dampener
crylic. It is comprised of the bifurcation piece and the three ad-
ournal of Fluids Engineering
joining straight pipes, each of these with 19–26 diameters of over-all length for the straight and branch pipes, respectively.
For the sharp-edge tee bifurcation the pipes were drilled from asingle block of acrylic to diameters of 30.1 mm±20 �m. Theround-edge tee, which had a ratio of edge radius of curvature topipe diameter equal to 0.1, was manufactured from two blocks ofacrylic using a high precision CAD-CAM system. Then, the twohalves were closed and the internal pipe was carefully polished toremove any internal steps/ seams. The internal diameters werechecked by means of precision gauges and found to be equal to30.06 mm±10 �m. Figure 2�a� compares the geometries of thesharp �left side� and round-edge �right side� tees, whereas Fig.2�b� shows the coordinate system, the location of some measuringplanes and the terminology used throughout this work. The squareouter cross-sections of both tees and of the leading pipes mini-mized refraction of laser beams.
The water flow was continuous and was driven by a volumetricMohno pump supplied by a constant head tank. A variable speedcontroller operated the pump and three valves controlled the flowdistribution to the two outflow pipes. Pulsation dampeners werealso located after the pump to ensure that the flow was continuous.For the detailed velocity measurements the inlet pipe Reynoldsnumber was equal to 32,000 and the flowrate partition to the
Fig. 2 Test section drawings and co-ordinate system: „a… Bi-furcation piece: Comparison between sharp-edge tee „left… androunded-edge tee „right…. Dimensions in †mm‡; „b… coordinatesystem, position of some diametric measuring planes andterminology.
straight and branch outlet pipes was 50%/50%. For the pressure
NOVEMBER 2006, Vol. 128 / 1205
m30
obtutw9vt
tetftpdwpf=rmwu
Tfscmwu
w�td
wLma3bomtcT
ctqfctvvq
1
easurements the inlet Reynolds number varied from 5000 to2,000 while the volumetric flowrate ratio Q1 /Q3 was varied fromto 1 �branch flow rate over inlet flow rate�.The flow rates were monitored by three magnetic flowmeters,
ne in each pipe, and the temperature of the water was monitoredy means of a PTC100 sensor located in the open tank. The wateremperature variation during each test run was within the sensorncertainty of ±0.5°C, because of the large volume of water inhe rig, but varied along the year. Its influence on the viscosityas taken into account to maintain the inlet flow conditions. The5% confidence level uncertainties of the flowrate measurementsaried between 2.5% and 0.6% at low and high flowrates, respec-ively.
Pressure measurements were carried out along the pipes to ob-ain the loss coefficients for the straight and branched flows. Onach pipe there were seven measuring planes in the 2 m nearer tohe bifurcation and in each of these measuring planes there wereour pressure taps uniformly distributed around the perimeter ofhe pipe and connected to each other. The pressure from eachressure section was connected to a differential pressure trans-ucer via a valve switchboard. The differential pressure transduceras a Rosemount, model 3051C, and was interfaced with a com-uter via an AD converter. The uncertainties of the pressure dif-erences were of 6.7% at Re=15,000, decreasing to 1.2% at Re40,000. These uncertainties were estimated following the square
oot of the sum of squares procedure explained in detail in Cole-an and Steele �26�. Here, the total relative uncertainty �E�p /�p�as calculated from the total systematic �B�p� and precision �P�p�ncertainties following Eq. �1�:
E�p
�p=��B�p
�p�2
+ �P�p
�p�2
�1�
he total systematic uncertainties included contributions from theossilized uncertainty of the transducer, its resolution and the fos-ilized total uncertainty from the calibration procedure. Duringalibration, the pressure transducer ports could be switched toeasure the pressure difference between two independently filledater columns, their heights measured by electrodes positionedsing two verniers. The precision uncertainty was given by
P�p = tS�p
�N�2�
here S�p is the standard deviation of the sample of N readingsN=1000 pressure readings� and t=2 since the sample was largerhan 10 �as recommended by Coleman and Steele �26��. Moreetails of the uncertainty analysis are given in Costa �27�.
Mean and turbulent velocity measurements in the pipes and teesere carried out by means of laser-Doppler anemometry. TheDA used was a miniaturized fiber optics system from INVENT,odel DFLDA, similar to that described in detail by Stieglmeier
nd Tropea �28�, with a 120 mm front lens mounted onto the0 mm diameter probe �probe S30�. Scattered light was collectedy a photodiode in the forward- and backscatter modes, dependingn optical access. In particular, in the T-junction test section theeasurements could only be done in backscatter mode, because of
he size of the supports of the ducts and the bulky receiving opti-al unit. The main characteristics of the anemometer are listed inable 1.The signal from the photodiode was processed by a TSI 1990 C
ounter, which contained the filters required to remove the pedes-al. It operated in the single measurement per burst mode, fre-uency validation was set at 1% and 16 signal cycles were usedor each valid measurement. The counter was interfaced with aomputer via a DOSTEK 1400A card, which provided the statis-ical quantities. To measure the three components of the velocityector with a 1D LDA we followed standard procedures. For allelocity components Snell’s law �29� was taken into account to
uantify the effects of curvature of the pipe walls in positioning206 / Vol. 128, NOVEMBER 2006
the LDA measuring volume, in the value of the LDA conversionfactors and in determining the orientation of the velocity compo-nent being measured at the control volume. For the streamwisevelocity the plane of laser beams was diametric and the controlvolume was traversed radially along the laser light direction fromwall to wall. To measure the tangential and radial velocity com-ponents the plane containing the laser beams was perpendicular tothe pipe axis. The control volume was traversed radially along thelaser light direction to measure the tangential velocity. Radial tra-versing the control volume along the direction perpendicular tothe direction of the LDA measured a combination of the radial andtangential velocity components that required post-processing.
The maximum uncertainties in the streamwise mean and rmsvelocities at a 95% confidence level are of 0.9% and 2.5% in lowturbulence regions and of 1.5% and 5.5% in high turbulence re-gions close to walls, respectively. The uncertainty in the measure-ments of the cross-stream mean and rms velocity components is1.4% and 6.0% in low and high turbulence regions, respectively.To estimate the uncertainties in the LDA measurements we fol-lowed Durst et al. �30� and Albrecht et al. �29�, and took intoaccount the specificities of the system used, which are describedin detail by Stieglmeier and Tropea �28�. The total uncertainties ofthe mean and rms velocities were estimated on the basis of fol-lowing contributions: Statistics �5000 data samples�, clock accu-racy and number of fringe effects, averaging process, beam align-ment relative to geometry, effect of small scale fluctuations, andvelocity gradient broadening. No corrections to gradient broaden-ing were applied to the measured data and the broadening due tothe number of fringes was always well below 0.4%, because thenumber of static fringes was six, the number of periods in signalprocessing was 16, the fringe spacing was 6.31 �m, the counterused had a clock frequency of 500 MHz, the shift frequency was1 MHz, and the velocities measured corresponded to Doppler fre-quencies less than 0.3 MHz. Measurements could be performed towithin 200 �m of the wall.
The anemometer was mounted on a milling machine withmovement in the three coordinate directions and the positionaluncertainty was ±100 �m in all three directions.
3 Experimental Results and Discussion
3.1 Sharp-Edge Tee
3.1.1 Pressure-Field Characterization. According to the flowconfiguration of Fig. 2, the energy equations for the two flowpaths are given by
p3 +1
2�3�U3
2 = p1 +1
2�1�U1
2 + f3L3
D3�
U32
2+ f1
L1
D1�
U12
2+ �p3−1
Table 1 Main characteristics of the laser-Doppler system„more characteristics in Table 1 of Stieglmeier and Tropea †28‡…
Laser wavelength 820 nmLaser power 100 mWLaser diameter 3.5 mmMeasured half-angle of beams in air 3.81 degSize of measuring volume in water �e−2�minor axis 37 �mmajor axis 550 �mFringe spacing in air 6.31 �mFrequency shift 1.0 MHz
�3�
Transactions of the ASME
fstvdvltateFrftfl
bcta
vnwFcbbiorb
4comr0at
ocpaplpwsc5
J
p3 +1
2�3�U3
2 = p2 +1
2�2�U2
2 + f3L3
D3�
U32
2+ f2
L2
D2�
U22
2+ �p3−2
�4�
or the branched and the straight flows, respectively. The sub-cripts 1–3 refer to the branch pipe, the straight outlet pipe, andhe inlet pipe, respectively. The static pressure is p, U is the bulkelocity �in the absence of subscript U represents U3�, � is theensity of the fluid, f is Darcy’s friction coefficient for fully de-eloped flow in a pipe of diameter D, and the length is L. Theength of a pipe is measured from the position of the pressure tapo the intersection of the three pipes. The pressure losses associ-ted with the tee are given by �p3−j in the trajectory from pipe 3o pipe j. The energy shape factors ��� are taken to be 1, the usualngineering practice in calculations when the flow is turbulent.rom the pressure measurements taken along the straight pipes, inegions of fully developed flow, the values of the Darcy frictionactors were determined for each pipe. The pressure losses in theee were subsequently evaluated from the measured pressure dif-erences and application of Eqs. �3� and �4�. The correspondingocal loss coefficients are defined as
K31 ��p3−1
1
2�U3
2
�5�
K32 ��p3−2
1
2�U3
2
�6�
It is important to note at this stage that the inlet Reynolds num-ers �Re3� of the measured flows are low for a turbulent flow. Inontrast, some data from the literature shown in Figs. 3–5, pertaino high Reynolds number flows where the loss coefficients arelready independent of the Reynolds number.
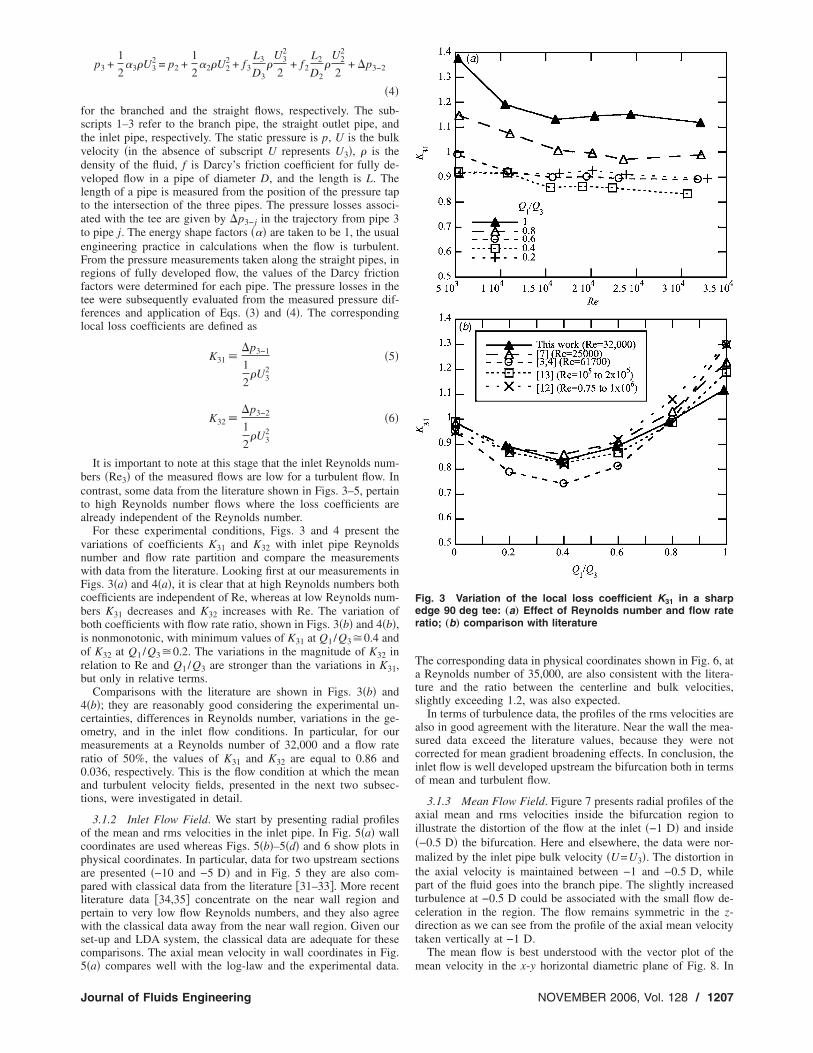
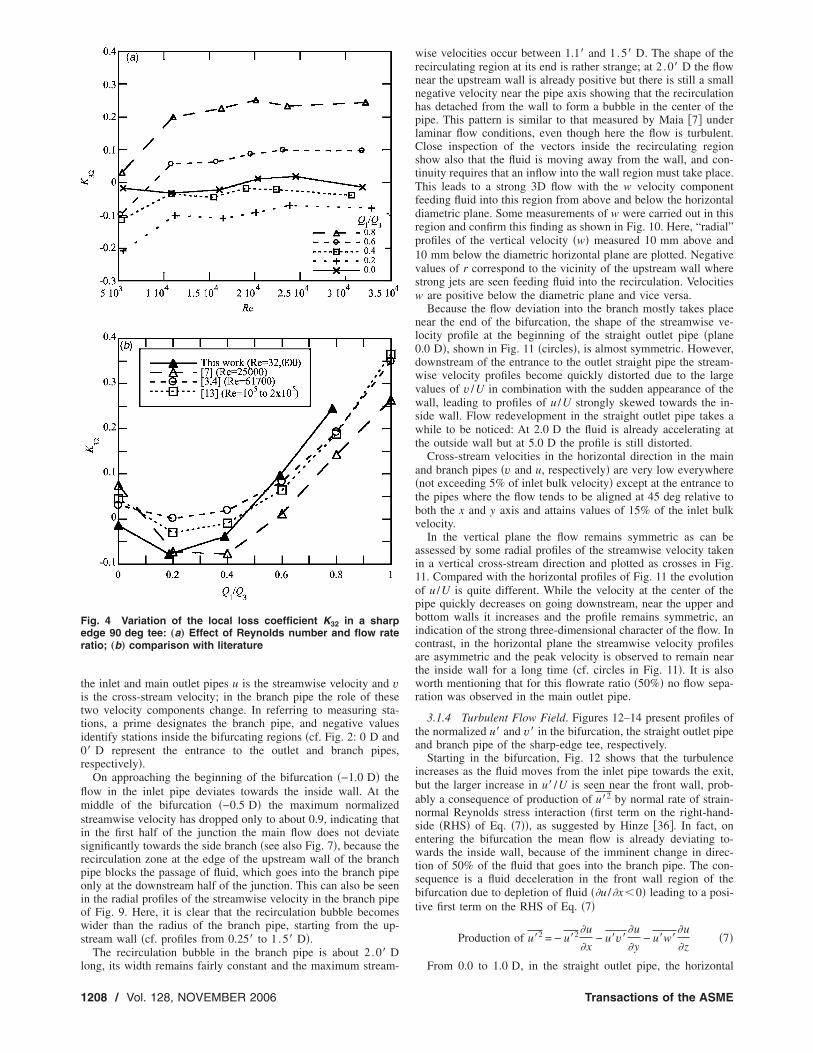
For these experimental conditions, Figs. 3 and 4 present theariations of coefficients K31 and K32 with inlet pipe Reynoldsumber and flow rate partition and compare the measurementsith data from the literature. Looking first at our measurements inigs. 3�a� and 4�a�, it is clear that at high Reynolds numbers bothoefficients are independent of Re, whereas at low Reynolds num-ers K31 decreases and K32 increases with Re. The variation ofoth coefficients with flow rate ratio, shown in Figs. 3�b� and 4�b�,s nonmonotonic, with minimum values of K31 at Q1 /Q30.4 andf K32 at Q1 /Q30.2. The variations in the magnitude of K32 inelation to Re and Q1 /Q3 are stronger than the variations in K31,ut only in relative terms.
Comparisons with the literature are shown in Figs. 3�b� and�b�; they are reasonably good considering the experimental un-ertainties, differences in Reynolds number, variations in the ge-metry, and in the inlet flow conditions. In particular, for oureasurements at a Reynolds number of 32,000 and a flow rate
atio of 50%, the values of K31 and K32 are equal to 0.86 and.036, respectively. This is the flow condition at which the meannd turbulent velocity fields, presented in the next two subsec-ions, were investigated in detail.
3.1.2 Inlet Flow Field. We start by presenting radial profilesf the mean and rms velocities in the inlet pipe. In Fig. 5�a� walloordinates are used whereas Figs. 5�b�–5�d� and 6 show plots inhysical coordinates. In particular, data for two upstream sectionsre presented �−10 and −5 D� and in Fig. 5 they are also com-ared with classical data from the literature �31–33�. More recentiterature data �34,35� concentrate on the near wall region andertain to very low flow Reynolds numbers, and they also agreeith the classical data away from the near wall region. Given our
et-up and LDA system, the classical data are adequate for theseomparisons. The axial mean velocity in wall coordinates in Fig.
�a� compares well with the log-law and the experimental data.ournal of Fluids Engineering
The corresponding data in physical coordinates shown in Fig. 6, ata Reynolds number of 35,000, are also consistent with the litera-ture and the ratio between the centerline and bulk velocities,slightly exceeding 1.2, was also expected.
In terms of turbulence data, the profiles of the rms velocities arealso in good agreement with the literature. Near the wall the mea-sured data exceed the literature values, because they were notcorrected for mean gradient broadening effects. In conclusion, theinlet flow is well developed upstream the bifurcation both in termsof mean and turbulent flow.
3.1.3 Mean Flow Field. Figure 7 presents radial profiles of theaxial mean and rms velocities inside the bifurcation region toillustrate the distortion of the flow at the inlet �−1 D� and inside�−0.5 D� the bifurcation. Here and elsewhere, the data were nor-malized by the inlet pipe bulk velocity �U=U3�. The distortion inthe axial velocity is maintained between −1 and −0.5 D, whilepart of the fluid goes into the branch pipe. The slightly increasedturbulence at −0.5 D could be associated with the small flow de-celeration in the region. The flow remains symmetric in the z-direction as we can see from the profile of the axial mean velocitytaken vertically at −1 D.
The mean flow is best understood with the vector plot of the
Fig. 3 Variation of the local loss coefficient K31 in a sharpedge 90 deg tee: „a… Effect of Reynolds number and flow rateratio; „b… comparison with literature
mean velocity in the x-y horizontal diametric plane of Fig. 8. In
NOVEMBER 2006, Vol. 128 / 1207
titti0r
flmsisrpoiows
l
Fer
1
he inlet and main outlet pipes u is the streamwise velocity and vs the cross-stream velocity; in the branch pipe the role of thesewo velocity components change. In referring to measuring sta-ions, a prime designates the branch pipe, and negative valuesdentify stations inside the bifurcating regions �cf. Fig. 2: 0 D and� D represent the entrance to the outlet and branch pipes,espectively�.
On approaching the beginning of the bifurcation �−1.0 D� theow in the inlet pipe deviates towards the inside wall. At theiddle of the bifurcation �−0.5 D� the maximum normalized
treamwise velocity has dropped only to about 0.9, indicating thatn the first half of the junction the main flow does not deviateignificantly towards the side branch �see also Fig. 7�, because theecirculation zone at the edge of the upstream wall of the branchipe blocks the passage of fluid, which goes into the branch pipenly at the downstream half of the junction. This can also be seenn the radial profiles of the streamwise velocity in the branch pipef Fig. 9. Here, it is clear that the recirculation bubble becomesider than the radius of the branch pipe, starting from the up-
tream wall �cf. profiles from 0.25� to 1 .5� D�.The recirculation bubble in the branch pipe is about 2 .0� D
ig. 4 Variation of the local loss coefficient K32 in a sharpdge 90 deg tee: „a… Effect of Reynolds number and flow rateatio; „b… comparison with literature
ong, its width remains fairly constant and the maximum stream-
208 / Vol. 128, NOVEMBER 2006
wise velocities occur between 1.1� and 1.5� D. The shape of therecirculating region at its end is rather strange; at 2 .0� D the flownear the upstream wall is already positive but there is still a smallnegative velocity near the pipe axis showing that the recirculationhas detached from the wall to form a bubble in the center of thepipe. This pattern is similar to that measured by Maia �7� underlaminar flow conditions, even though here the flow is turbulent.Close inspection of the vectors inside the recirculating regionshow also that the fluid is moving away from the wall, and con-tinuity requires that an inflow into the wall region must take place.This leads to a strong 3D flow with the w velocity componentfeeding fluid into this region from above and below the horizontaldiametric plane. Some measurements of w were carried out in thisregion and confirm this finding as shown in Fig. 10. Here, “radial”profiles of the vertical velocity �w� measured 10 mm above and10 mm below the diametric horizontal plane are plotted. Negativevalues of r correspond to the vicinity of the upstream wall wherestrong jets are seen feeding fluid into the recirculation. Velocitiesw are positive below the diametric plane and vice versa.
Because the flow deviation into the branch mostly takes placenear the end of the bifurcation, the shape of the streamwise ve-locity profile at the beginning of the straight outlet pipe �plane0.0 D�, shown in Fig. 11 �circles�, is almost symmetric. However,downstream of the entrance to the outlet straight pipe the stream-wise velocity profiles become quickly distorted due to the largevalues of v /U in combination with the sudden appearance of thewall, leading to profiles of u /U strongly skewed towards the in-side wall. Flow redevelopment in the straight outlet pipe takes awhile to be noticed: At 2.0 D the fluid is already accelerating atthe outside wall but at 5.0 D the profile is still distorted.
Cross-stream velocities in the horizontal direction in the mainand branch pipes �v and u, respectively� are very low everywhere�not exceeding 5% of inlet bulk velocity� except at the entrance tothe pipes where the flow tends to be aligned at 45 deg relative toboth the x and y axis and attains values of 15% of the inlet bulkvelocity.
In the vertical plane the flow remains symmetric as can beassessed by some radial profiles of the streamwise velocity takenin a vertical cross-stream direction and plotted as crosses in Fig.11. Compared with the horizontal profiles of Fig. 11 the evolutionof u /U is quite different. While the velocity at the center of thepipe quickly decreases on going downstream, near the upper andbottom walls it increases and the profile remains symmetric, anindication of the strong three-dimensional character of the flow. Incontrast, in the horizontal plane the streamwise velocity profilesare asymmetric and the peak velocity is observed to remain nearthe inside wall for a long time �cf. circles in Fig. 11�. It is alsoworth mentioning that for this flowrate ratio �50%� no flow sepa-ration was observed in the main outlet pipe.
3.1.4 Turbulent Flow Field. Figures 12–14 present profiles ofthe normalized u� and v� in the bifurcation, the straight outlet pipeand branch pipe of the sharp-edge tee, respectively.
Starting in the bifurcation, Fig. 12 shows that the turbulenceincreases as the fluid moves from the inlet pipe towards the exit,but the larger increase in u� /U is seen near the front wall, prob-ably a consequence of production of u�2 by normal rate of strain-normal Reynolds stress interaction �first term on the right-hand-side �RHS� of Eq. �7��, as suggested by Hinze �36�. In fact, onentering the bifurcation the mean flow is already deviating to-wards the inside wall, because of the imminent change in direc-tion of 50% of the fluid that goes into the branch pipe. The con-sequence is a fluid deceleration in the front wall region of thebifurcation due to depletion of fluid ��u /�x�0� leading to a posi-tive first term on the RHS of Eq. �7�
Production of u�2 = − u�2�u
�x− u�v�
�u
�y− u�w�
�u
�z�7�
From 0.0 to 1.0 D, in the straight outlet pipe, the horizontal
Transactions of the ASME

prtsdi
Fs
J
rofiles in Fig. 13�a� show that u� /U decreases in the front wallegion �r�0� and increases in the inside wall region �r�0�. Inhe former region the boundary layer is weak �circles in Fig. 11how a low shear rate�, because this region has been previouslyepleted of fluid and so the turbulence production by shear veloc-ty gradient and shear Reynolds stress interaction �the second term
Fig. 5 Comparison between the literature and measured veAxial velocity „in wall coordinates…; „b… axial rms velocity; „c…
ig. 6 Radial profiles of the normalized axial mean flow up-
tream of the tee junction „−10 and −5 D… at Re=35,000ournal of Fluids Engineering
on the RHS of Eq. �7�� will be smaller than at the equivalentregion in the inlet pipe. Also, fluid with lower turbulence is beingadvected from the inside wall region of the outlet pipe into thefront wall region, thus decreasing turbulence by fluid mixing as
ity profiles upstream of the tee junction „−10 and −5 D…: „a…dial rms velocity; „d… tangential rms velocity
Fig. 7 Radial profiles of mean „closed symbols… and rms axialvelocity „open symbols… in the bifurcation region of the sharp-edge tee: −1 D „�…, −0.5 D „�…; vertical cross-stream profile at
locra
−1 D „�…
NOVEMBER 2006, Vol. 128 / 1209

wircLufit
at
FmRu
Fp
1
ell as by fluid acceleration in the front wall region ��u /�x�0mplies −u�2�u /�x�0 in Eq. �7��. Conversely, in the inside wallegion turbulence increases for the opposite reasons. Since weannot measure the Reynolds shear stresses in a pipe with a 1DDA system �unless a refractive index matching technique issed�, the two shear contributions to Eq. �7� could not be quanti-ed and the above interpretation is merely qualitative, but never-
heless it is in agreement with the specialized literature �36,37�.In the outlet pipe, the profiles of rms velocities are symmetric
long the vertical cross-stream direction and also show decreasingurbulence near the walls on moving downstream.
ig. 8 Vector plot of the mean velocity in the horizontal dia-etric plane x-y of the bifurcation of the sharp-edge tee fore=32,000 and Q1 /Q3=50%. The scale vector corresponds to/U=1.
ig. 9 Radial profiles of streamwise velocity in the branch
ipe of the sharp-edge tee for Re=32,000 and Q1 /Q3=50%210 / Vol. 128, NOVEMBER 2006
To analyze the turbulence in the branch pipe it is convenient towrite down the expression for the production of the correspondingstreamwise normal Reynolds stress, in Eq. �8�
Production of − v�2 = − u�v��v�x
− v�2�v�y
− v�w��v�z
�8�
As seen in Fig. 9, there is a very strong shear layer in the centerof the branch pipe, between the attached recirculating region andthe jet along the downstream wall of the tee. Here, there will beproduction of v�2 by shear interactions �first term on the right-
Fig. 10 “Radial” profiles of w /U „� , � … and w� /U„� , + … mea-sured 10 mm above „� , à … and 10 mm below „� , + … the diamet-ric horizontal plane at 2.0� D for the sharp edge tee flow atRe=32,000 and Q1 /Q3=50%
Fig. 11 Radial profiles of streamwise velocity in the outlet pipeof sharp edge tee for Re=32,000 and Q1 /Q3=50%:�—measurements in horizontal plane; �—measurements in
vertical plane „full and half profiles…Transactions of the ASME

hia1
awd
Fst
J
and-side �RHS� of Eq. �8�� and consequently there is a maximumn the profiles of v� /U near the pipe center �at r /R−0.25, +0.1,nd +0.2 in stations x=0.1� D, 0.25� D, 0.5� D, and until.5� D� shown in the horizontal radial plots in Fig. 14�a�.Large streamwise mean velocity gradients �v /�y are found
long the downstream wall of the branch pipe due to the strongall jet �initially positive �fluid acceleration�, later negative �fluideceleration��. This will contribute to initially decrease �at r /R1, from stations x=0.0�–0.5� D�, and later increase �at r /R
ig. 12 Radial profiles of u�/U in the junction region of theharp-edge tee for Re=32,000 and Q1 /Q3=50%, measured be-ween the axis and the front wall
Fig. 13 Radial profiles of u� /U and v� /U in the outlet straigh
u� /U „�: Horizontal cross-stream profile; �: Vertical cross-streaournal of Fluids Engineering
1, for stations x1.1� D� the values of v� in this region via thesecond term on the RHS of Eq. �8�. There is also an increase inturbulence within the recirculation �near the wall for r /R�0�, buthere there will also certainly be important contributions from tur-bulent diffusion and advection. The advective transport of turbu-lence into this recirculating region includes contributions of fluidfrom above and below the horizontal diametric plane, which hasturbulence of the order of 0.2U �cf. w� data above/below diamet-ric plane in Fig. 10�. This level of turbulence is in excess of whatis found at the early stages of the recirculation �see profiles of v�at 0.0� to 0 .25� D in Fig. 14�a��. Further downstream, all turbu-lence components decrease as the flow starts to redevelop.
Horizontal radial traverses of u�, not shown here for concise-ness, also show the turbulence increase in the center of the branchpipe when moving from 0.0� to 1 .1� D, followed by a decrease,but near the walls u� always remains low, even inside the recircu-lation. Vertical cross-stream profiles of v� and u� are plotted inFigs. 14�a� and 14�b�, respectively, and also show well the in-crease in turbulence in the center of the branch pipe up to 1 .1� D,associated with the presence of the shear layer bordering the re-circulation, and its decrease on going further downstream. Notethat in the branch pipe the variations of v� are more intense be-cause this is the velocity component that is being directly pro-duced �for fully developed flow in the branch pipe, production ofu�2 is zero and this normal Reynolds stress acquires its energy viapressure strain redistribution�.
3.2 Round-Edge Tee: Comparison With the Sharp Edge
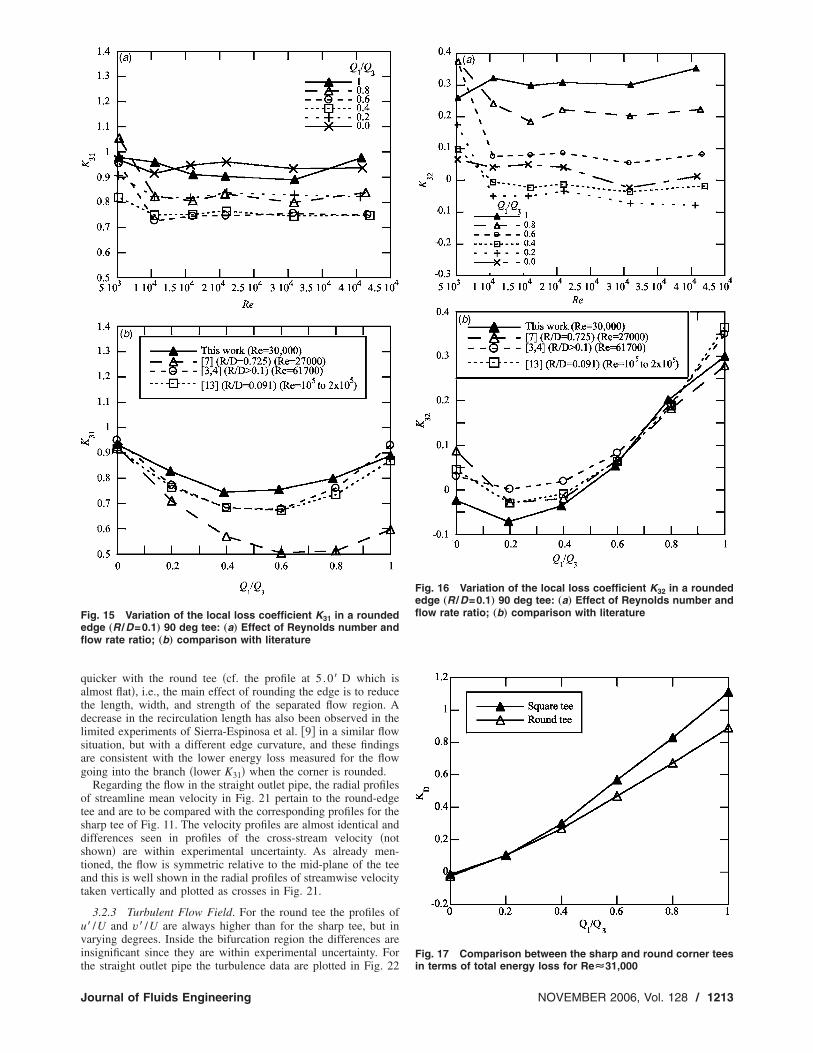
3.2.1 Pressure Field Characterization. The variations of thelocal loss coefficients for the straigth �K32� and branched pipes�K31� are presented in Figs. 15 and 16 as a function of the inletReynolds number and flowrate ratio. The figures include datafrom the literature and show variations which are similar to those
pe of the sharp-edge tee for Re=32,000 and Q1 /Q3=50%. „a…
t pi m profile…; „b… v� /U „vertical cross-stream profile….NOVEMBER 2006, Vol. 128 / 1211

snl
tprtrwaabm��cv
nKtpwbRtc�tcn
ncl
nt…
1
een in Figs. 3 and 4 for the sharp edge tee, but now taking lowerumerical values especially for coefficient K31 on account of theess severe conditions due to a round edge.
Careful inspection of these figures and direct comparison be-ween Figs. 3 and 15 show that rounding the corner reduces theressure loss for the branched flow especially at high flow rateatios, i.e., when a higher proportion of fluid is forced to gohrough the branch pipe: For Q1 /Q3=1 and Re�15,000 there is aeduction in K31 from about 1.1 to 0.9, whereas at Q1 /Q3=0.4,hen K31 goes through a minimum, the decrease is from 0.85 to
bout 0.75 and at Q1 /Q3=0.2 the difference is even smaller. Thisgrees with the literature, although more pronounced effects maye found there for more rounded corners. As a matter of fact oureasurements pertain to a less rounded corner than those of Maia
7�, but correspond to Reynolds numbers of the same magnitude27,000 against our 30,000� leading to higher values for the lossoefficients: At Q1 /Q3=0.8 we measured K310.8 against aalue of around 0.52 measured by Maia �7�.
At low Reynolds number, the variation of K32 with the Rey-olds number is opposite to that seen for the sharp tee: Whereas32 increases with Re for the sharp tee, it decreases for the round
ee. At high Reynolds numbers the straight flow is basically un-erturbed by the shape of the corner and the differences in K32 areithin experimental uncertainty, as shown by a direct comparisonetween Figs. 4�b� and 16�b� for Re31,000. However, as theeynolds number is reduced the pressure loss becomes lower for
he sharp edge tee, i.e., there is no advantage in rounding theorner as far as K32 is concerned. This has also been seen by Maia7� at a Reynolds number of 26,000 �with a smoother edge curva-ure�, who also stated that the curves for K32 in the literature areonsidered universal, i.e., independent of R /D, when the Rey-olds number is high.
The comparison between the round and sharp-edge tees shouldot be made simply by looking at individual flow paths and lossoefficients. Rounding the corner affects differently the two local
Fig. 14 Radial profiles of v� /U and u� /U in the branch piv� /U „�—horizontal measurement; �—vertical measureme
oss coefficients, therefore, it is advantageous to compare the per-
212 / Vol. 128, NOVEMBER 2006
formance of both tees by looking at the total energy loss. This isachieved defining a total loss coefficient �KD� accounting for allthe energy dissipated in the tee as
KD =Q1
Q3K31 +
Q2
Q3K32 �9�
For both tees, the variation of KD with the flow rate ratio at aconstant Reynolds number of around 31,000 is shown in Fig. 17from where it becomes clear the advantage of the round-edge tee.At low flow rate ratios there is basically no difference, but forQ1 /Q3 of around 0.4 the difference is already of 10% and rising to20% at higher flow partitions.
3.2.2 Mean Flow Field. The general features of the mean floware similar to those seen with the sharp edge tee, the few differ-ences requiring a detailed inspection of the mean flow field. Start-ing at the bifurcation region, profiles of the stream-wise meanvelocity at −1 and −0.5 D are plotted in Fig. 18; at the inside wallregion the velocities are consistently higher by 5–10% than forthe sharp edge tee �compare with Fig. 7�, because the flow entersmore easily into the branch pipe when the corner is round. De-tailed inspection of the vector plot in Fig. 19 show also importantdifferences relative to the flow in the sharp edge tee inside thebranch pipe of Fig. 8: For the round tee at 1 .5� D the velocityvectors inside the recirculation are less negative whereas at2 .0� D they are already positive, suggesting a shorter recircula-tion than for the sharp tee.
The radial profiles of the streamwise velocity inside the branchpipe plotted in Fig. 20 are directly comparable to those for thesharp tee in Fig. 9. They confirm that for the round tee the at-tached recirculation ends at around 1.5� D �for the sharp tee thathappens at around 2.0� D�, even though there is still a recircula-tion separated from the wall in the center of the pipe, the velocityin the downstream wall jet peaks at 1 .1� D, rather than at 1 .5� Das in the sharp tee, and the velocities within the recirculation are
of the sharp-edge tee for Re=32,000 and Q1 /Q3=50%. „a…; „b… u� /U „vertical cross-stream profile….
pe
less negative than for the sharp tee. Flow redevelopment is also
Transactions of the ASME
qatdlsag
otsdstat
uvit
Fefl
J
uicker with the round tee �cf. the profile at 5 .0� D which islmost flat�, i.e., the main effect of rounding the edge is to reducehe length, width, and strength of the separated flow region. Aecrease in the recirculation length has also been observed in theimited experiments of Sierra-Espinosa et al. �9� in a similar flowituation, but with a different edge curvature, and these findingsre consistent with the lower energy loss measured for the flowoing into the branch �lower K31� when the corner is rounded.
Regarding the flow in the straight outlet pipe, the radial profilesf streamline mean velocity in Fig. 21 pertain to the round-edgeee and are to be compared with the corresponding profiles for theharp tee of Fig. 11. The velocity profiles are almost identical andifferences seen in profiles of the cross-stream velocity �nothown� are within experimental uncertainty. As already men-ioned, the flow is symmetric relative to the mid-plane of the teend this is well shown in the radial profiles of streamwise velocityaken vertically and plotted as crosses in Fig. 21.
3.2.3 Turbulent Flow Field. For the round tee the profiles of� /U and v� /U are always higher than for the sharp tee, but inarying degrees. Inside the bifurcation region the differences arensignificant since they are within experimental uncertainty. For
ig. 15 Variation of the local loss coefficient K31 in a roundeddge „R /D=0.1… 90 deg tee: „a… Effect of Reynolds number andow rate ratio; „b… comparison with literature
he straight outlet pipe the turbulence data are plotted in Fig. 22
ournal of Fluids Engineering
Fig. 16 Variation of the local loss coefficient K32 in a roundededge „R /D=0.1… 90 deg tee: „a… Effect of Reynolds number andflow rate ratio; „b… comparison with literature
Fig. 17 Comparison between the sharp and round corner tees
in terms of total energy loss for ReÉ31,000NOVEMBER 2006, Vol. 128 / 1213

a1rcah
fc1
Fr„
1
nd although the differences relative to the sharp tee data in Fig.3 are larger than in the bifurcation region, these differences inms velocities are too close to the measurement uncertainty andlearly insufficient to have a measurable impact on the mean flow,nd by consequence on the loss coefficient K32 at this medium/igh Reynolds number.
In the branch pipe the mean flow showed a shorter recirculationor the round edge tee and the rms velocities in Fig. 23, and theiromparison with the corresponding results for the sharp tee of Fig.4, are consistent with these findings. Looking at the turbulence
ig. 18 Radial profiles of mean axial velocity in the bifurcationegion of the round tee for Re=32,000 and Q1 /Q3=50%: −1 D�…, −0.5 D„�…; Vertical cross-stream profile at −1 D „�…
Fig. 19 Vector plot of the mean velocithe rounded corner tee junction for R
corresponds to u /U=1.214 / Vol. 128, NOVEMBER 2006
profiles, and especially at the streamwise component �v� /U�, thefollowing sequence of events is observed: At the beginning of thebranch pipe �0.0�–0.5� D� the levels of turbulence in both the
n the horizontal diametric plane x-y of32,000 and Q1 /Q3=50%. Vector scale
Fig. 20 Radial profiles of the longitudinal velocity in thebranch pipe of the round edge tee flow for Re=32,000 andQ1 /Q3=50%
ty ie=
Transactions of the ASME

srtd
Fp�v
FvR
J
quare and round tees are similar. At 1 .1� D the turbulence in theegion −0.5r /R�1 for the round tee is clearly higher than forhe sharp tee. At this plane �1.1� D� the peak velocities in theownstream wall jet were also seen for the round tee geometry �in
ig. 21 Radial profiles of streamwise velocity in the outletipe of the round-edge tee for Re=32,000 and Q1 /Q3=50%:—measurements in horizontal plane; �—measurements inertical plane
ig. 22 Horizontal cross-stream profiles of u� /U „�… and� /U „�… velocities in the outlet pipe of the round-edge tee for
e=32,000 and Q1 /Q3=50%ournal of Fluids Engineering
Sec. 3.2.2�. The higher turbulence enhances flow mixing and re-duces the size of the recirculating flow, as is typical in other situ-ations with separated flow such as in sudden expansion flows �38�.At 1 .5� D the levels of turbulence in the region −1�r /R+0.5 are similar for both geometries, but higher elsewhere for theround tee. Note that the length of the attached recirculation for theround tee is around 1.5� D and that for the sharp tee is 2 .0� D.Henceforth, the flow along the upstream wall becomes attachedfor the round tee and the turbulence decreases on going down-stream during flow redevelopment, whereas for the sharp tee tur-bulence continues to increase until 2 .0� D, when the recirculationregion separates from the upstream wall. This is obvious whencomparing the profiles measured at 2 .0� D, where the round teehas everywhere a lower turbulence than the sharp tee, and alsofurther downstream at 3 .5� D.
The recirculation in the branch pipe is the main flow character-istic responsible for the dissipation of energy in the tee, hence itsdecrease in size and strength, due to the higher levels of turbu-lence in the branch pipe, has a positive effect in the reportedreduction of K31.
4 ConclusionsDetailed measurements of pressure variation, mean, and turbu-
lent velocities were carried out for the flow of water in two 90 degtee junctions with sharp and rounded edges. The detailed meanand turbulent velocity fields were measured for a flow rate ratio of50% and inlet Reynolds numbers of 32,000 and 30,000, respec-tively. In both geometries, the loss coefficient of the branchedflow was higher than for the straight flow, as expected, because offlow separation in the branch pipe and the absence of separation inthe main outlet duct. Rounding the edge of the junction �r /R=0.1� lead to higher turbulence in the branch pipe which resultedin a shorter, thinner, and weaker recirculation bubble region, thusreducing the loss coefficient of the branched flow.
Rounding the corner also did not affect the characteristics of theflow going into the outlet straight pipe at Re31,000, expressingthe current behavior of common turbulent flows. Moreover, theincrease in dissipation in the branched flow coefficient and interms of the total energy loss �KD� is enough to justify that therounded tee is obviously more efficient for all the investigatedReynolds numbers.
AcknowledgmentThe authors are grateful to JNICT who funded this work
through project PBIC/C/CEG/2440/95 and are also thankful to A.Schulte who carried out some of the initial measurements andhelped to set-up the rig.
NomenclatureBT � systematic uncertainty of variable T
D1 ,D2 ,D3 � diameters of pipes 1, 2, and 3ET � total uncertainty of variable T
f1 , f2 , f3 � Darcy friction factor for fully developed pipeflow in pipes 1, 2, and 3
k � turbulent kinetic energyK31 � loss coefficient in tee flow from the inlet to the
branch pipe, Eq. �5�K32 � loss coefficient in tee flow from the inlet to the
straight outlet pipe, Eq. �6�KD � total loss coefficient of bifurcation, Eq. �9�
L1 ,L2 ,L3 � lengths of pipes 1, 2, and 3p � pressure
PT � precision uncertainty of variable TQ1 ,Q2 ,Q3 � flowrate in pipes 1, 2, and 3
Re � Reynolds number based on inlet pipe diameter
and bulk velocityNOVEMBER 2006, Vol. 128 / 1215

G
S
R
1
u � local mean �time-average� velocity in x direc-tion �streamwise direction for inlet and straightoutlet pipes and radial direction, at horizontaldiametric plane, for branch pipe�
u� � local rms velocity in x direction �streamwisedirection for inlet and straight outlet pipes andradial direction, at horizontal diametric plane,for branch pipe�
u�2 � normal Reynolds stress in x directionU � bulk velocityv � local mean �time-average� velocity in y direc-
tion �radial direction at horizontal diametricplane for the inlet and straight outlet pipes andstreamwise direction for branch pipe�
v� � local rms velocity in y direction �radial direc-tion at horizontal diametric plane for the inletand straight outlet pipes and streamwise direc-tion for branch pipe�
v�2 � normal Reynolds stress in y directionw � local mean velocity in z direction
w� � local rms velocity in z directionw�2 � normal Reynolds stress in z direction
reek� � energy shape factor� � rate of dissipation of k
�p � pressure difference� � fluid density
ubscripts1 � refers to outlet branch pipe2 � refers to outlet straight pipe3 � refers to inlet pipe
eferences�1� White, F. M., 1999, Fluid Mechanics, 4th ed., McGraw-Hill, New York.�2� Vogel, G., 1926, 1928, “Investigation of the Loss in Right-Angled Pipe
Fig. 23 Radial profiles of v� /U and u� /U in the branch piv� /U „�—horizontal profile; �—vertical profile…; „b… u� /U „
Branches,” Mitt. Hydraulischen Instituts der Tech. Hoschul. Munchen, n. 1,
216 / Vol. 128, NOVEMBER 2006
75-90 �1926�, n. 2, 61-64 �1928� �translation by Voetsch, C. Technical Memo-randum n. 299, US Bureau of Reclamation, 1932�.
�3� Gardel, A., 1957, “Les Pertes de Charge Daus les Écoulements au Travers deBranchements en Té,” Bull. Tech. Suisse Romande, 9�4�, pp. 123–130.
�4� Gardel, A., 1957, “Les Pertes de Charge Dansles Écoulements au Travers deBranchements en Té,” Bull. Tech. Suisse Romande, 10�5�, pp. 143–148.
�5� Katz, S., 1967, “Mechanical Potencial Drops at a Fluid Branch,” Trans ASME,paper 67, pp. 732–736.
�6� Iwanami, S., Suu, T., and Kato, H., 1969, “Study on Flow Characteristics inRight-Angled Pipe Fittings,” Bull. Jpn. Soc. Mech. Eng., 12�53�, pp. 1041–1050.
�7� Maia, R. J., 1992, “Numerical and Experimental Investigations of the Effect ofLocal Losses in Piping Systems. Methods and Techniques for its SystematicInvestigation. The Specific Case of the Flow in a 90 deg Tee Junction �inPortuguese�,” PhD thesis, University of Porto, Portugal.
�8� Sierra- Espinosa, F. Z., Bates, C. J., and O’Doherty, T., 2000a, “TurbulentFlow in a 90 deg Pipe Junction. Part 1: Decay of Fluctuations Upstream theFlow Bifurcation,” Comput. Fluids, 29, pp. 197–213.
�9� Sierra- Espinosa, F. Z., Bates, C. J., and O’Doherty, T., 2000b, “TurbulentFlow in a 90 deg Pipe Junction. Part 2: Reverse Flow at the Branch Exit,”Comput. Fluids, 29, pp. 215–233.
�10� Páal, G., Maia, R., and Pinho, F. T., 2003, “Numerical Predictions of TurbulentFlow in a 90 deg Tee Junction,” Proc. 12th Int. Conf. on Modeling Fluid Flow.Budapest, Hungary, 3–6 September, paper IFO-31, pp. 573–580.
�11� Menter, F., 1994, “Two-Equation Eddy Viscosity Turbulence Models for En-gineering,” AIAA J., 32, pp. 1598–1605.
�12� Boldy, A. P., 1970, “Performance of Dividing and Combining Tees,” BHRATechnical Report 1061.
�13� Ito, H., and Imai, K., 1973, “Energy Losses at 90 deg Pipe Junctions,” Journalof The Hydraulics Division, Proceedings of ASCE, 99, HY9.
�14� Miller, D. S., 1986, Internal Flow Systems. BHRA Fluid Engineering, Cran-field, UK, 3rd ed.
�15� Katsaounis, A., Aust, E., Fürst, H. D., and Schultheiss, G. F., 1983, “PressureDrop in Tee-Junctions with Liquids and Gas-Liquids,” Proc. 21st NationalHeat Transfer Conference, Seattle, pp. 139–146.
�16� Reimann, J., and Seeger, W., 1986, “Two-Phase Flow in a Tee-Junction With aHorizontal Inlet, Part II: Pressure Differences,” Int. J. Multiphase Flow, 12,pp. 587–608.
�17� Seeger, W., Reimann, J., and Müller, U., 1985, “Phase-Separation in aT-Junction With a Horizontal Inlet,” 2nd Int. Conference on multi-phase flow,paper A2, London.
�18� Azzopardi, B. J., and Rea, S., 1999, “Modeling the Split of Horizontal AnnularFlow at a T-Junction,” Chem. Eng. Res. Des., 77�A8�, pp. 713–720.
�19� Azzopardi, B. J., and Rea, S., 2001, “The Split of Horizontal Stratified Flow ata Large Diameter T-Junction,” Chem. Eng. Res. Des., 79�A4�, pp. 470–476.
�20� Issa, R. I., and Oliveira, P. J., 1994, “Numerical Prediction of Phase Separation
of the round-edge tee for Re=32,000 and Q1 /Q3=50%. „a…tical cross-stream profile….
pever
in Two-Phase Flow Through T-Junctions,” Comput. Fluids, 23, pp. 347–372.
Transactions of the ASME
J
�21� Carr, R. T., and Kotha, S. L., 1995, “Separation Surfaces for Laminar Flow inBranching Tubes — Effect of Reynolds Number and Geometry,” J. Biomech.Eng., 117, pp. 442–447.
�22� Khodadadi, J. M., 1990, “Wall Pressure and Shear Stress Variations in a90 deg Bifurcation During Pulsatile Laminar Flow,” J. Fluids Eng., 113, pp.111–115.
�23� Moravec, S., and Liepsch, D., 1983, “Flow Investigations in a Model of aThree-Dimensional Human Artery with Newtonian and non-NewtonianFluids— Part I,” Biorheology, 20, pp. 745–759.
�24� Rindt, C. C. M., and van Steenhoven, A. A., 1996, “Unsteady Flow in a Rigid3D Model of the Carotid Artery Bifurcation,” ASME J. Biomech. Eng., 118,pp. 90–96.
�25� Ravensbergen, J., Krijger, J. K. B., Hillen, B., and Hoogstraten, H. W., 1995,“Merging Flows in an Arterial Confluence: The Vertebro-Basilar Junction,” J.Fluid Mech., 304, pp. 119–141.
�26� Coleman, H. W., and Steele, W. G., 1999, Experimentation and uncertaintyanalysis for engineers, 2nd ed., Wiley, New York.
�27� Costa, N. F. P., 2003, “Pressure Losses in Tee-Junctions: The 60 deg Bifurca-tion,” �in Portuguese�, MSc thesis, FEUP, University of Porto.
�28� Stieglmeier, M., and Tropea, C., 1992, “A Miniaturized, Mobile Laser-Doppler
Anemometer,” Appl. Opt., 31�21�, pp. 4096–4105.ournal of Fluids Engineering
�29� Albrecht, H. E., Borys, M., Damaschke, N., and Tropea, C., 2003, Laser-Doppler and Phase-Doppler Measurement Techniques, Springer-Verlag, Ber-lin.
�30� Durst, F., Melling, A., and Whitelaw, J. H., 1981, Principles and Practice ofLaser-Doppler Anemometry, 2nd ed., Academic, London.
�31� Laufer, J., 1954, “The Structure of Turbulence in Fully Developed Pipe Flow,”National Bureau of Standards, Report 1154.
�32� Lawn, C. J., 1971, “The Determination of the Rate of Dissipation in TurbulentPipe Flow,” J. Fluid Mech., 48, pp. 477–505.
�33� Townes, H. W., Gow, J. L., Powe, R. E., and Weber, N., 1972, “TurbulentFlow in Smooth and Rough Pipes,” J. Basic Eng., 94, pp. 353–362.
�34� Wei, T., and Willmarth, W. W., 1989, “Reynolds Number Effects on the Struc-ture of a Turbulent Channel Flow,” J. Fluid Mech., 204, pp. 57–95.
�35� Durst, F., Jovanovic, J., and Sender, J., 1995, “LDA Measurements in the NearWall Region of a Turbulent Flow,” J. Fluid Mech., 295, pp. 305–335.
�36� Hinze, J. O., 1975, Turbulence, 2nd ed., McGraw-Hill, New York.�37� Heitor, M. V., Taylor, A. M. K. P., and Whitelaw, J. H., 1987, “The Interaction
of Turbulence and Pressure-Gradients in a Baffle-Stabilized Premixed Flame,”J. Fluid Mech., 181, pp. 387–413.
�38� Castro, O. S., and Pinho, F. T., 1995, “Turbulent Expansion Flow of Low
Molecular Weight Shear—Thinning Solutions,” Exp. Fluids, 20, pp. 42–55.NOVEMBER 2006, Vol. 128 / 1217