Embed Size (px)
Citation preview
R Lab (II)
Zechun
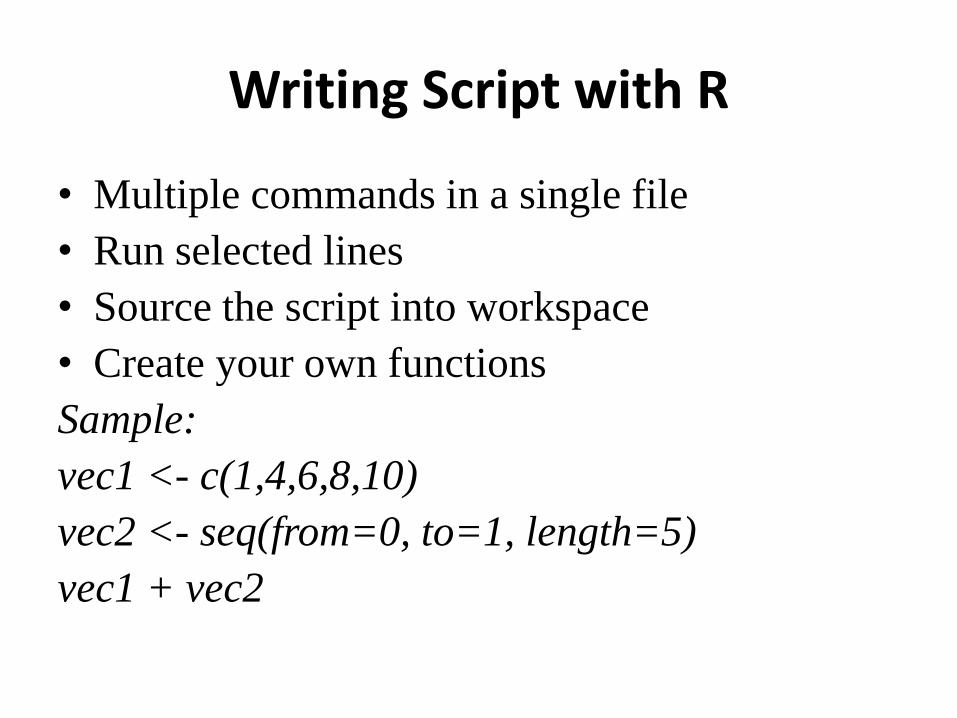
Writing Script with R
• Multiple commands in a single file
• Run selected lines
• Source the script into workspace
• Create your own functions
Sample:
vec1 <- c(1,4,6,8,10)
vec2 <- seq(from=0, to=1, length=5)
vec1 + vec2
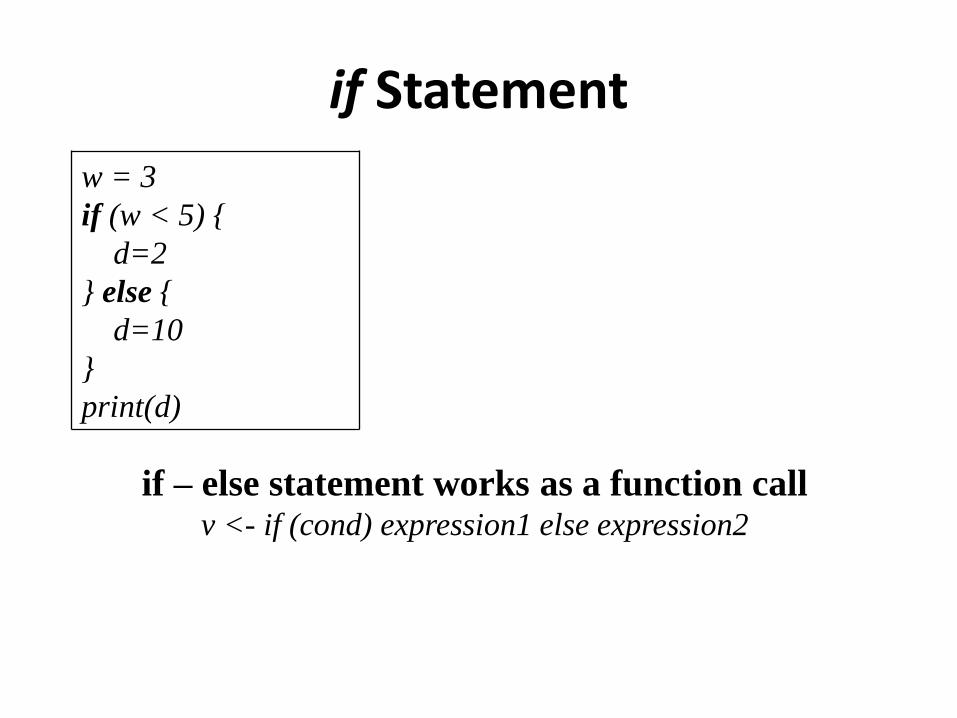
if Statement
w = 3
if (w < 5) {
d=2
} else {
d=10
}
print(d)
if – else statement works as a function call v <- if (cond) expression1 else expression2
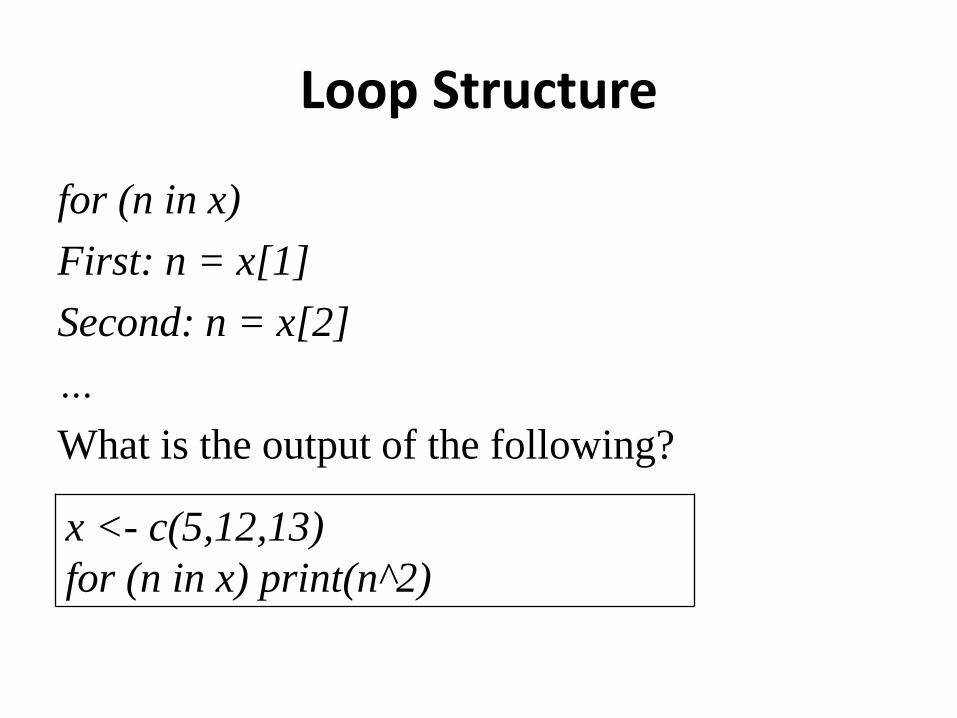
Loop Structure
for (n in x)
First: n = x[1]
Second: n = x[2]
…
What is the output of the following?
x <- c(5,12,13)
for (n in x) print(n^2)
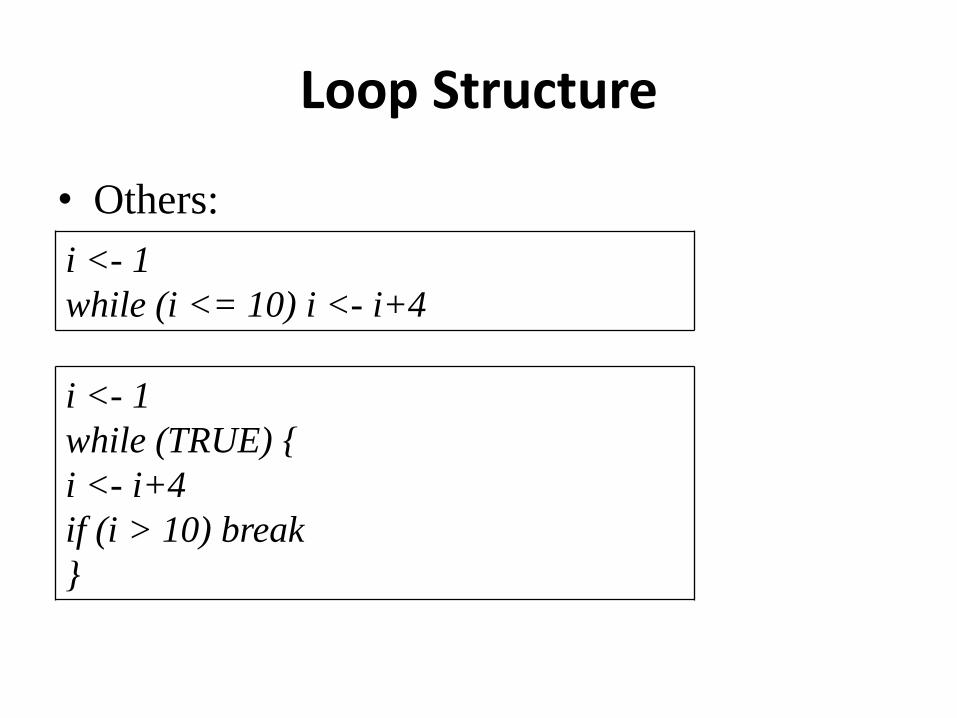
Loop Structure
• Others:
i <- 1
while (i <= 10) i <- i+4
i <- 1
while (TRUE) {
i <- i+4
if (i > 10) break
}
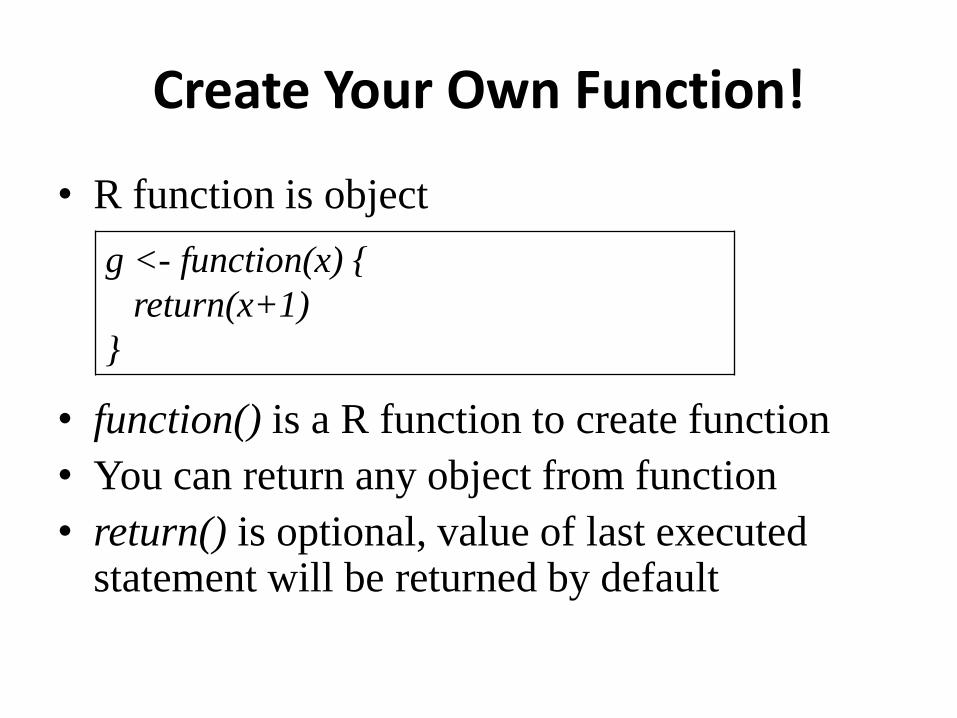
Create Your Own Function!
• R function is object
• function() is a R function to create function
• You can return any object from function
• return() is optional, value of last executed statement will be returned by default
g <- function(x) {
return(x+1)
}
Exercise
• Try to create a function that counts the number
of odd numbers in a vector.
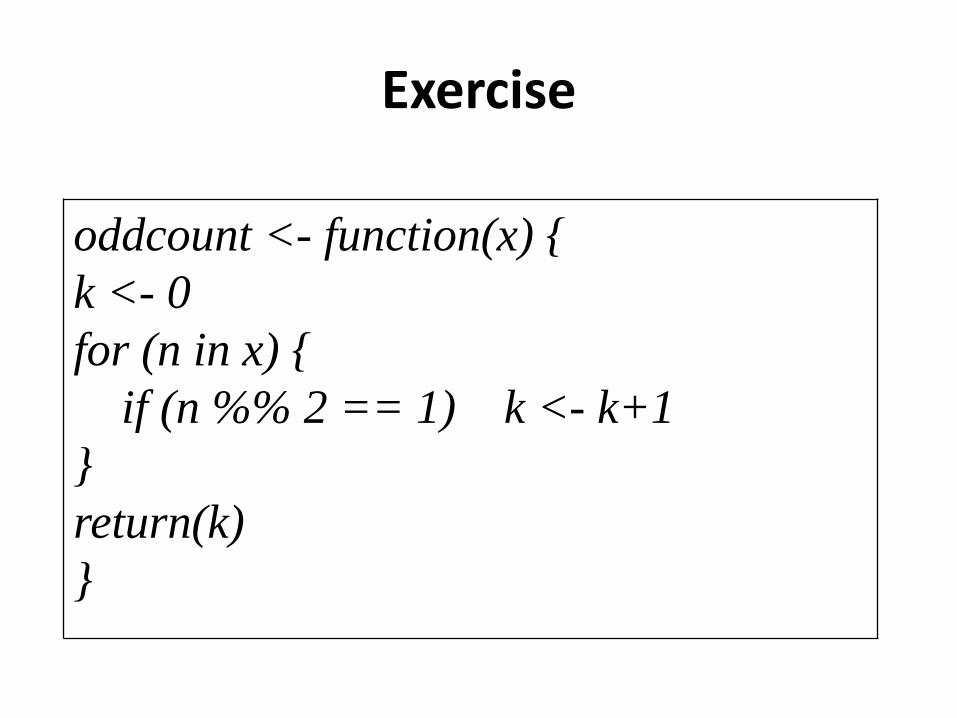
Exercise
oddcount <- function(x) {
k <- 0
for (n in x) {
if (n %% 2 == 1) k <- k+1
}
return(k)
}
R and Data Mining
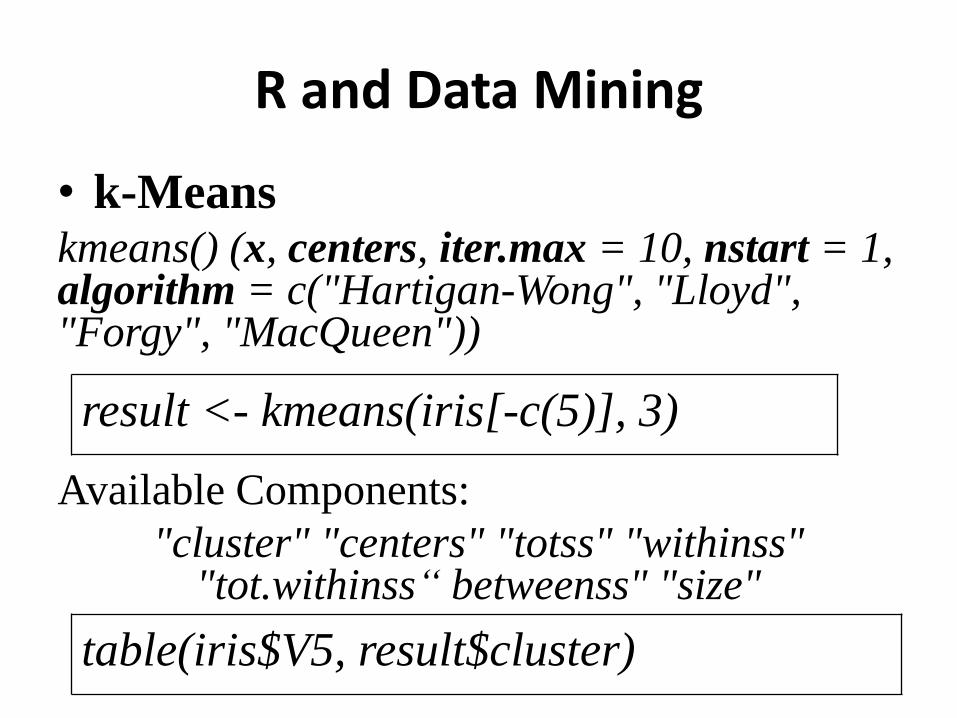
• k-Means kmeans() (x, centers, iter.max = 10, nstart = 1, algorithm = c("Hartigan-Wong", "Lloyd", "Forgy", "MacQueen"))
Available Components:
"cluster" "centers" "totss" "withinss" "tot.withinss“ betweenss" "size"
result <- kmeans(iris[-c(5)], 3)
table(iris$V5, result$cluster)
R and Data Mining
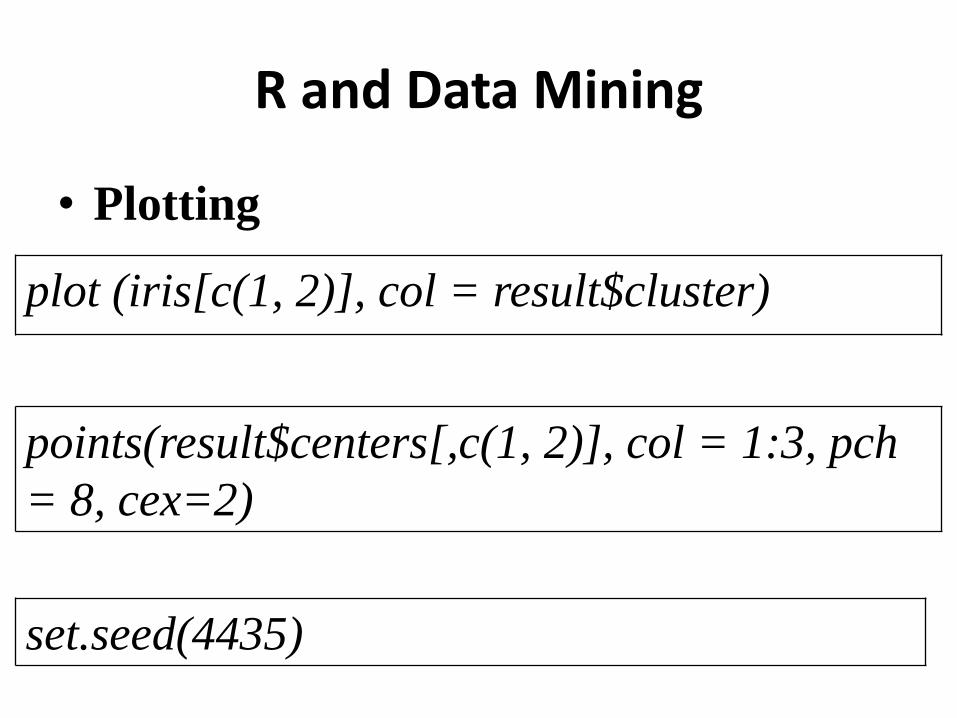
• Plotting
plot (iris[c(1, 2)], col = result$cluster)
points(result$centers[,c(1, 2)], col = 1:3, pch
= 8, cex=2)
set.seed(4435)
R and Data Mining
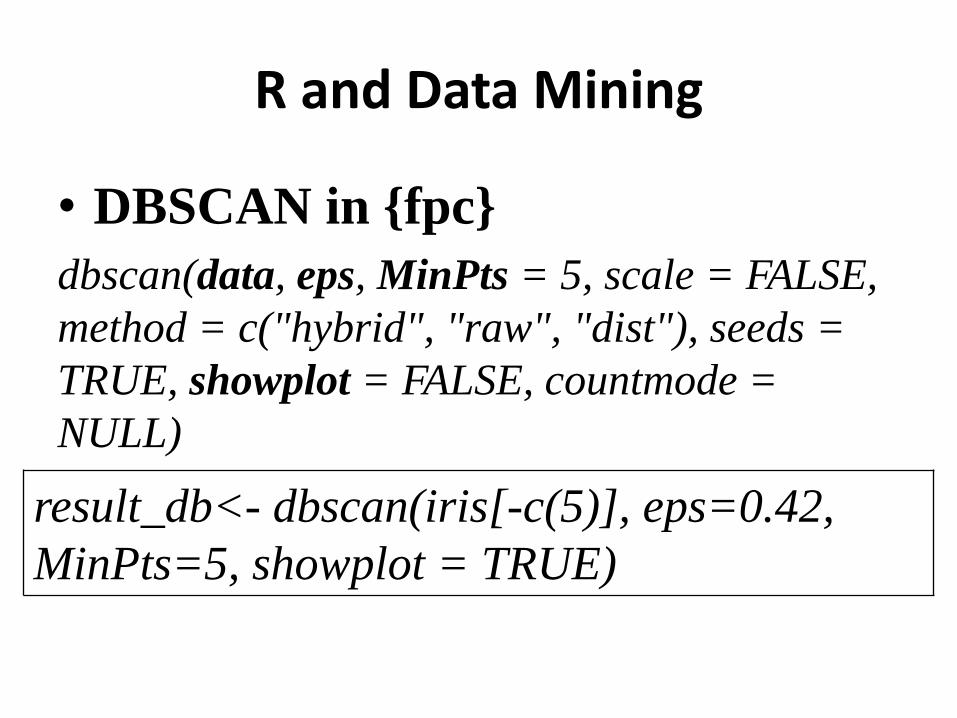
• DBSCAN in {fpc}
dbscan(data, eps, MinPts = 5, scale = FALSE,
method = c("hybrid", "raw", "dist"), seeds =
TRUE, showplot = FALSE, countmode =
NULL)
result_db<- dbscan(iris[-c(5)], eps=0.42,
MinPts=5, showplot = TRUE)
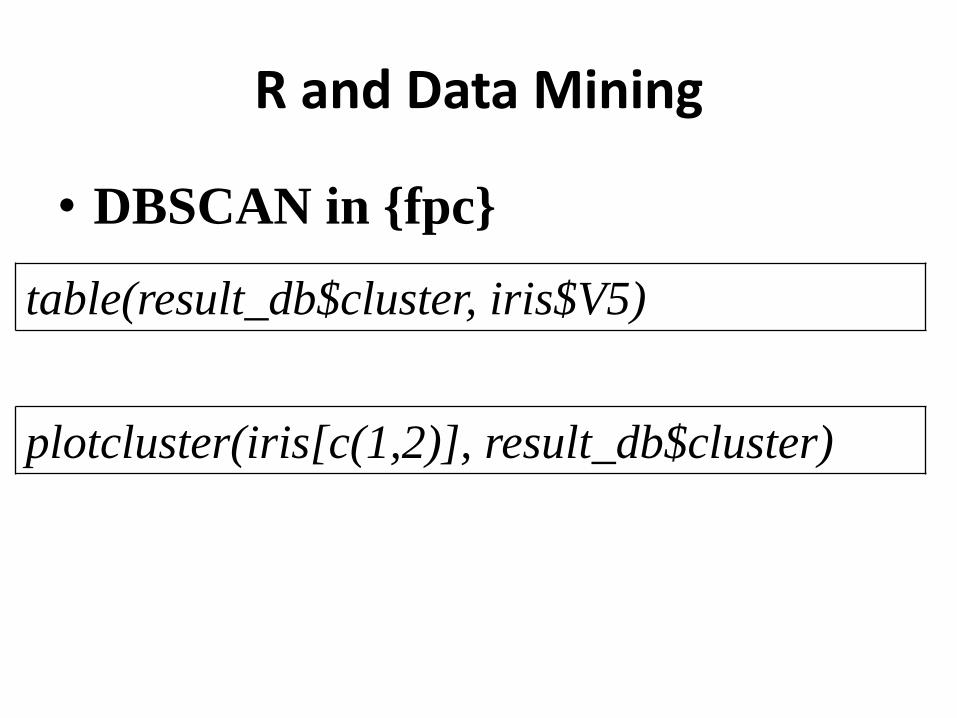
R and Data Mining
• DBSCAN in {fpc}
table(result_db$cluster, iris$V5)
plotcluster(iris[c(1,2)], result_db$cluster)


![A CASE STUDY IN COLLABORATIVE INNOVATIONdev.guidewellinnovation.com/sites/all/themes/custom/guidewell/ima… · Collaborative Innovation [ kuh-lab-uh-rey-tiv, in-uh-vey-shuh n ] noun](https://img.pdfslide.us/doc/110x75/604354815c16182aad41ba48/a-case-study-in-collaborative-collaborative-innovation-kuh-lab-uh-rey-tiv-in-uh-vey-shuh.jpg)


![Lab Fica II [Lab 6] Fotometria](https://img.pdfslide.us/doc/110x75/5571fd204979599169987db3/lab-fica-ii-lab-6-fotometria.jpg)