Embed Size (px)
Citation preview
OuTs
AEDC-TR-71-26 '*y APR 2 0 1971
MAY 2 5 1971
EXPERIMENTAL INVESTIGATION OF WATER
EJECTION FROM A WEDGE MODEL AT
MACH NUMBER 6
R. K. Matthews
ARO, Inc.
April 1971
Approved for public release; distribution unlimited.
VON KÄRMÄN GAS DYNAMICS FACILITY
ARNOLD ENGINEERING DEVELOPMENT CENTER
AIR FORCE SYSTEMS COMMAND
ARNOLD AIR FORCE STATION, TENNESSEE
T>T>. 1JSRS?>7US AIR FORCE
I-MCCüO- ?l-C-0002
mim When U. S. Government drawings specifications, or other data are used for any purpose other than a definitely related Government procurement operation, the Government thereby incurs no responsibility nor any obligation whatsoever, and the fact that the Government may have formulated, furnished, or in any way supplied the said drawings, specifications, or other data, is not to be regarded by implication or otherwise, or in any manner licensing the holder or any other person or corporation, or conveying any rights or permission to manufacture, use, or sell any patented invention that may in any way be related thereto.
Qualified users may obtain copies of this report from the Defense Documentation Center. I
References to named commercial products in this report are not to be considered in any sense as an endorsement of the product by the United States Air Force or the Government.
AEDC-TR-71-26
EXPERIMENTAL INVESTIGATION OF WATER
EJECTION FROM A WEDGE MODEL AT
MACH NUMBER 6
R. K. Matthews
ARO, Inc.
Approved for public release; distribution unlimited.
AEDC-TR-71-26
FOREWORD
The work reported herein was done at the request of the Air Force Materials Laboratory (AFML), Air Force Systems Command (AFSC), for the AVCO Corporation, Wilmington, Massachusetts, under Program Element 62102F, Project 7381.
The results presented herein were obtained by ARO, Inc. (a sub- sidiary of Sverdrup & Parcel and Associates, Inc. ), contract operator of the Arnold Engineering Development Center (AEDC), AFSC, Arnold Air Force Station, Tennessee, under contract F40600-71-C-0002. The tests were conducted during the period from June 15 to October 8, 19 70, under ARO Project No. VB0059, and the manuscript was submitted for publication on December 8, 1970.
This technical report has been reviewed and is approved.
EmmettA. Niblack, Jr. Joseph R. Henry Lt Colonel, USAF Colonel, USA F * AF Representative, VKF Director of Test Directorate of Test
li
AEDC-TR-71-26
ABSTRACT
Tests were conducted at Mach number 6 to investigate the inter- action between an ejected liquid (water) and a two-dimensional, zero pressure gradient boundary layer. Heat-transfer rates, static pres- sure levels, pitot pressure surveys, and photographic data were obtained on a 33. 65-deg wedge model over a Reynolds number range, based on the distance to the ejector, from 0. 26 x 10^ to 3. 44 x 10^. The water mass flow range was from 0. 013 to 0. 064 lbm/sec for both a porous panel and a slot-type ejector. Water ejection at 0.064 lbm/sec increased the boundary-layer thickness about 15 percent, and for all mass flow rates the model surface temperatures were equal to the water temperature ( = 75°F). The primary data consisted of backlighted photo- graphs of dyed water flowing over a glass plate on the wedge surface. Analysis of these photographs is not presented in this report.
in

AEDC-TR-71-26
CONTENTS
Pag?
ABSTRACT iii NOMENCLATURE vi
I. INTRODUCTION 1 II. APPARATUS
2. 1 Model 2 2. 2 Instrumentation 3 2. 3 Wind Tunnel 5
in. PROCEDURE 3. 1 Test Conditions 5 3. 2 Test Procedure 5 3. 3 Data Reduction 7 3. 4 Data Precision 7
IV. RESULTS AND DISCUSSION 8 V. CONCLUSIONS 10
REFERENCES 11
APPENDIXES
I. ILLUSTRATIONS
Figure
1. Photographs of Test Apparatus Illustrating Testing Techniques 15
2. Basic Configuration (Config. 100) Installed in Tunnel B 16
3. Photograph of Instrumentation Insert Plates 17
4. Model Details 18
5. Schematic Diagram of Water Ejection and Purge System 20
6. Mass Flow System Calibration Apparatus 21
7. Effect of Model Span on Wedge Pressure Distribution . . 22
8. Investigation of Flow Two-Dimensionality on Wedge Model with 17-in. Span and R. 0-in. Leading-Edge Extension (Config. 222) 23
AEDC-TR-71-26
Figure Page
9. Pitot Pressure Surveys at x = 14. 5 on Config. 222, Ree = 3.44 x 10⁶ 24
10. Ejector Performance in Terms of Plenum Chamber Pressure 24
11. Average Model Wall Temperatures for m i 0 24
12. Model Centerline Heat-Transfer Distributions for m = 0 25
13. Effect of Cooling on Wedge Surface Heat-Transfer Rates 26
14. Typical Shadowgraphs 27
15. Laser-Lighted Photographs of Config. 222 at Ree = 3.44 x 10⁶ 30
16. Backlighted Photographs of Dyed Water Flowing over Glass Plate at Various Reynolds Numbers; Porous Ejector, m = 0. 064 lbm/sec 36
17. Backlighted Photographs of Dyed Water Flowing over Glass Plate at Various Mass Flow Rates; Porous Ejector, Ree = 3.44x 10⁶, Config. 222 37
18. Backlighted Photographs of Dyed Water Flowing over Glass Plate at Various Mass Flow Rates; Slot Ejector, Ree = 3.44x 10⁶, Config. 221 ' 38
II. TABLE
I. Test Matrix 39
NOMENCLATURE
b Model span, in.
H Enthalpy, Btu/lbm
Mm Free-stream Mach number
m Mass flow rate from ejectors, lbm/sec
p Pressure, psia
p ' Stagnation pressure downstream of a normal shock, psia o >
VI
AEDC-TR-71-26
q Heat-transfer rate, Btu/ft^sec
Ree Reynolds number based on the streamwise distance to the ejector and free-stream conditions
Rex Reynolds number based on the streamwise distance from the model leading edge and free-stream conditions
Re,,, Free-stream unit Reynolds number, in."*
St, Stanton number, q/p.V^H,-, - Hw)
T Temperature, °R or °F as noted
V,,, Free-stream velocity, ft/sec
x Distance from model leading edge, positive downstream, in.
xe Distance from model leading, edge to ejector, in.
y Distance normal to model surface, in.
z Lateral distance from model centerline, positive toward right looking upstream, in.
pm Free-stream density, lbm/ft3
SUBSCRIPTS
aw Adiabatic wall
in Inviscid wedge conditions
o Tunnel stilling chamber conditions
PL Ejector plenum chamber conditions
p Impact probe conditions
w Model wall conditions
Vll
AEDC-TR-71-26
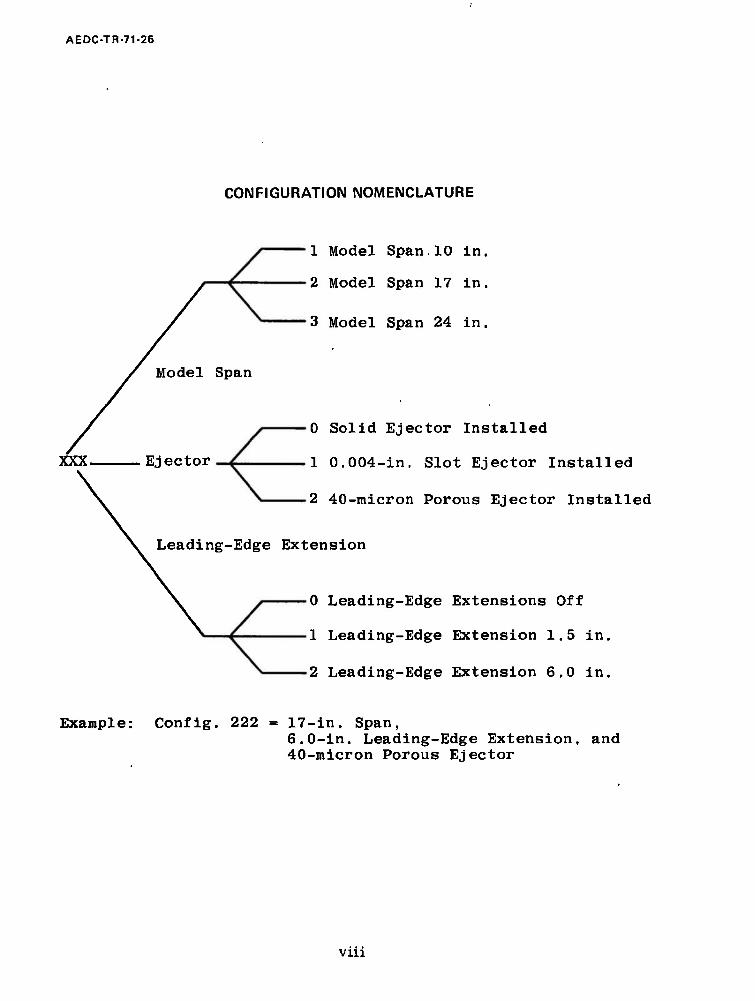
CONFIGURATION NOMENCLATURE
1 Model Span.10 in.
2 Model Span 17 in.
3 Model Span 24 in.
Model Span
XXX. Ejector
0 Solid Ejector Installed
1 0.004-in. Slot Ejector Installed
2 40-micron Porous Ejector Installed
Leading-Edge Extension
0 Leading-Edge Extensions Off
1 Leading-Edge Extension 1.5 in.
2 Leading-Edge Extension 6.0 in.
Example: Config. 222 = 17-in. Span, 6.0-in. Leading-Edge Extension, and 40-micron Porous Ejector
Vlll
AEDC-TR-71-26
SECTION I INTRODUCTION
Ablation during reentry changes the nose shape and therefore the aerodynamic characteristics of a vehicle. To avoid this ablation, nose- tip cooling by the ejection of a fluid has been proposed and investigated (Refs. 1 through 4). Rannie (Ref. 1) and Crocco (Ref. 2) stressed the desirability of maintaining a liquid film on the vehicle surface, and Persson (Ref. 3) concluded that the film efficiency was very dependent on the stability of the film. If the film is unstable, unevaporated liquid from the liquid-gas interface will be swept into the high velocity gas flow, severely reducing the film cooling efficiency.
The purpose of the present experimental study was to systematically investigate the interaction between an ejected liquid (water) and a two- • dimensional, zero pressure gradient boundary layer. Tests were con- ducted in the Hypersonic Wind Tunnel (B) of the von Karman Gas Dynamics Facility (VKF) at a free-stream Mach number of 6, and at free-stream Reynolds numbers, based on the distance to the water ejector, from 0. 26 x 106 to 3. 44 x 106.
A 33. 65-deg wedge model was selected to provide a local Mach number of 2 and a zero pressure gradient flow. The primary area of investigation was restricted to a 3-in. -wide region centered on the 17-in, -wide wedge which provided the desired two-dimensionality. The Reynolds number range was varied to provide laminar, transitional, and turbulent boundary layers approaching the ejector. A thin slot and a porous metal ejector were used with water mass flows ranging from 0. 013 to 0. 064 lbm/sec.
The primary data consisted of backlighted photographs of dyed water flowing over a glass plate on the wedge surface. It was anticipated that the thickness of the water film could be correlated with the amount of light absorbed by the dyed water. Analysis of these data will be docu- mented by the AVCO Corporation, Wilmington, Massachusetts. Addi- tional photographs were obtained by directing a laser beam across the model surface, and a limited number of pitot pressure surveys were also obtained. The effectiveness of transpiration cooling was illustrated by comparing heat-transfer rates with and without water ejection.
Because of the many unique aspects of this test, two tunnel entries were required. The first entry was used to evaluate the mass flow and photographic systems under operating conditions as well as to provide wedge surface pressure and heat-transfer distributions. During this
AEDC-TR-71-26
entry the ejectors failed to function properly; however, the pressure and heat-transfer distributions were obtained for the zero mass flow case. Before the second entry the test apparatus was modified to avoid the problems encountered during the first entry and, in general, the second entry was free from operational problems.
SECTION II APPARATUS
2.1 MODEL
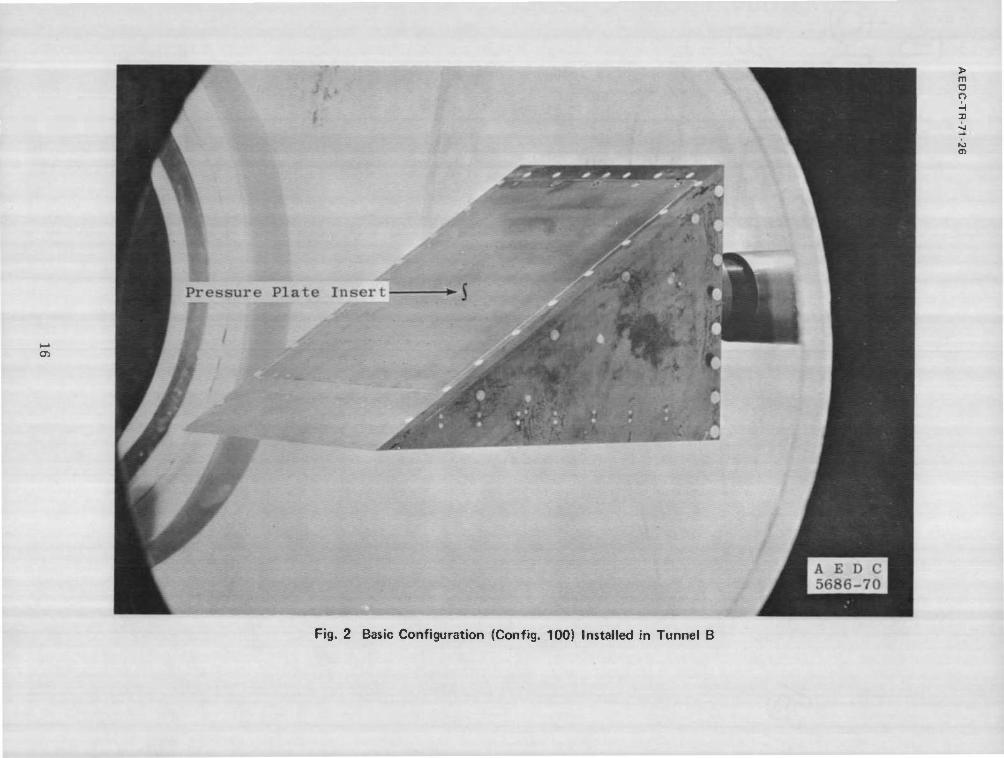
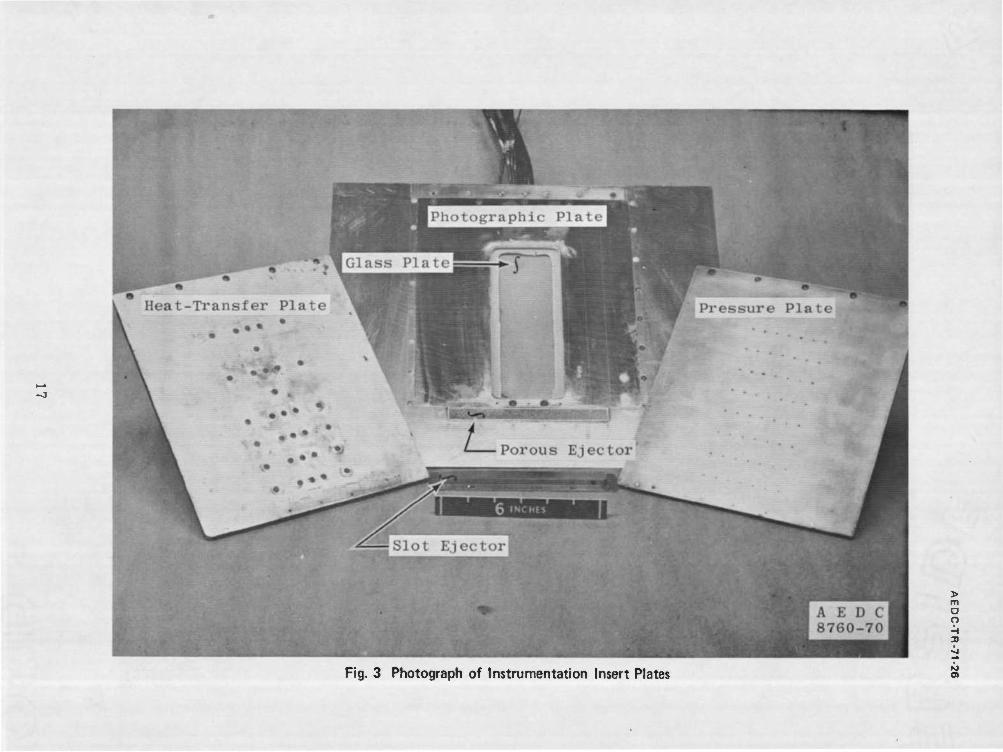
Photographs showing the general test apparatus are presented in Fig. 1 (Appendix I). The basic model was a 33. 65-deg wedge with three instrumentation insert plates and several interchangeable water ejection panels. An installation photograph of this model with the pressure in- strumentation plate inserted is presented in Fig. 2. The two other in- sert plates provided heat-transfer and photographic data, respectively, and can be seen in Fig. 3.
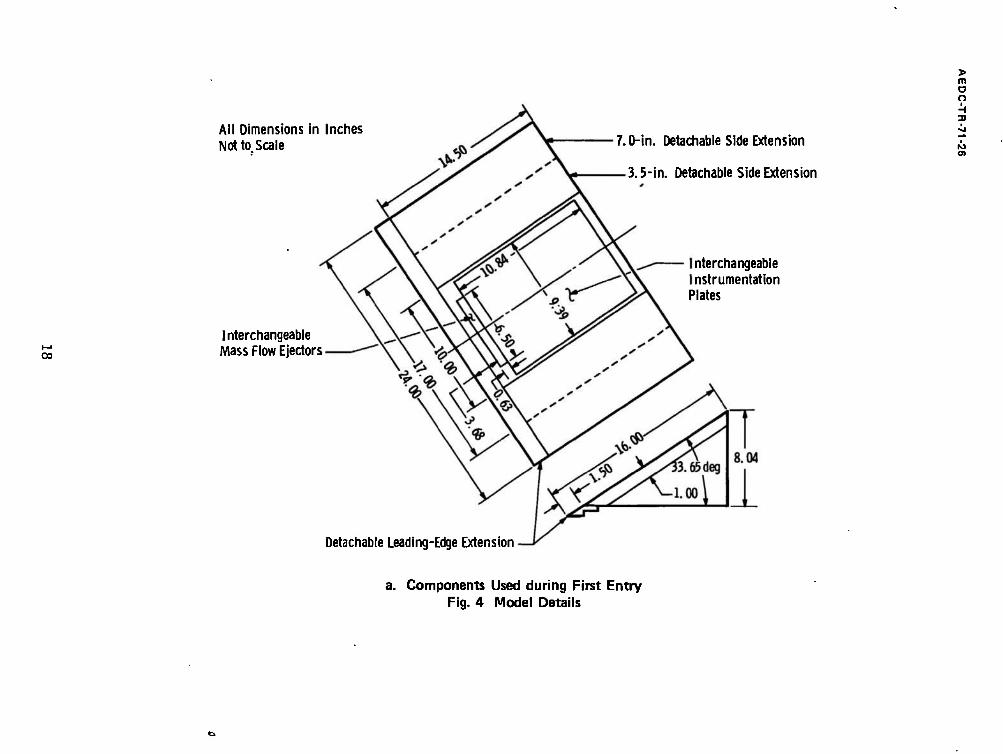
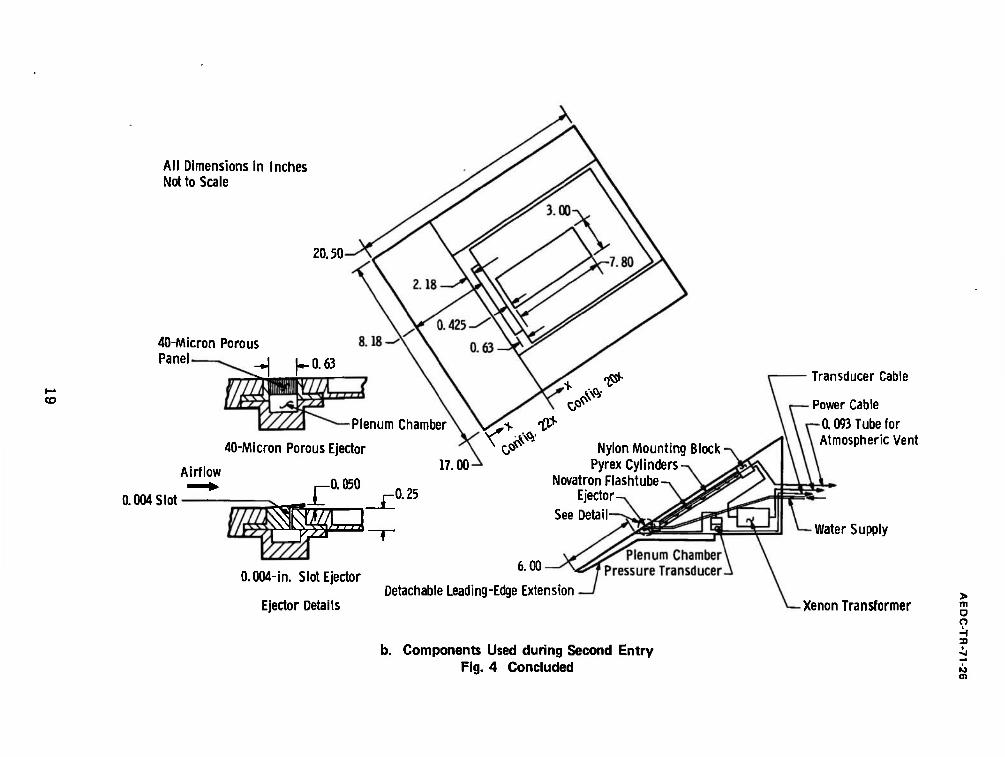
Attachments to the basic model included 3. 5- and 7. 0-in. side extensions which increased the model span to 17 and 24 in., respectively. Of course, by increasing the span larger regions of two-dimensional flow were obtained. Leading-edge extensions were also attached to the basic model to move transition upstream relative to the location of water ejection. During the first entry a 1. 5-in. leading-edge extension was used; however, this extension was found to be too short and a 6-in. ex- tension was used during the second entry. Details of the configurations tested during the first and second entry are shown in Figs. 4a and b, respectively. The 3. 5-in. side extensions provided sufficient two- dimensional flow and were used exclusively during the second entry.
The two types of water ejectors (designated slot and porous panel) are sketched in Fig. 4b. During the first entry neither type of ejector performed satisfactorily. The slot ejector spanwise distributions were highly nonuniform, and the porous panels either had severe leaks along the ejector edge or became clogged. The ejectors were redesigned so that the slot ejectors protruded above the wedge surface and ejected the water tangential to the wedge surface, which was not the case in the original design. A series of pins was used to maintain a constant slot width. The redesign of the porous panels increased the particle reten- tion size from 1 to 40 microns.
Also shown in Fig. 4b is a schematic illustration of the flash sys- tem required for the backlighted photographs. This light source
AEDC-TR-71-26
consisted of two xenon Novatron® flashtubes (182 A with a 6-in. arc length). Each flashtube was installed inside a Pyrex® cylinder and these cylinders were restrained by special nylon end supports. An atmospheric pressure environment inside the Pyrex cylinders was provided by feeding a tube through the sting system and outside the wind tunnel. The transformer and connections were encased in thermo- plastic because of arcing problems experienced during the first entry. This entire assembly was mounted inside the model cavity.. The special power supply and control system required for this test were developed and supplied by AVCO/SD as were the model components and the water ejection system.
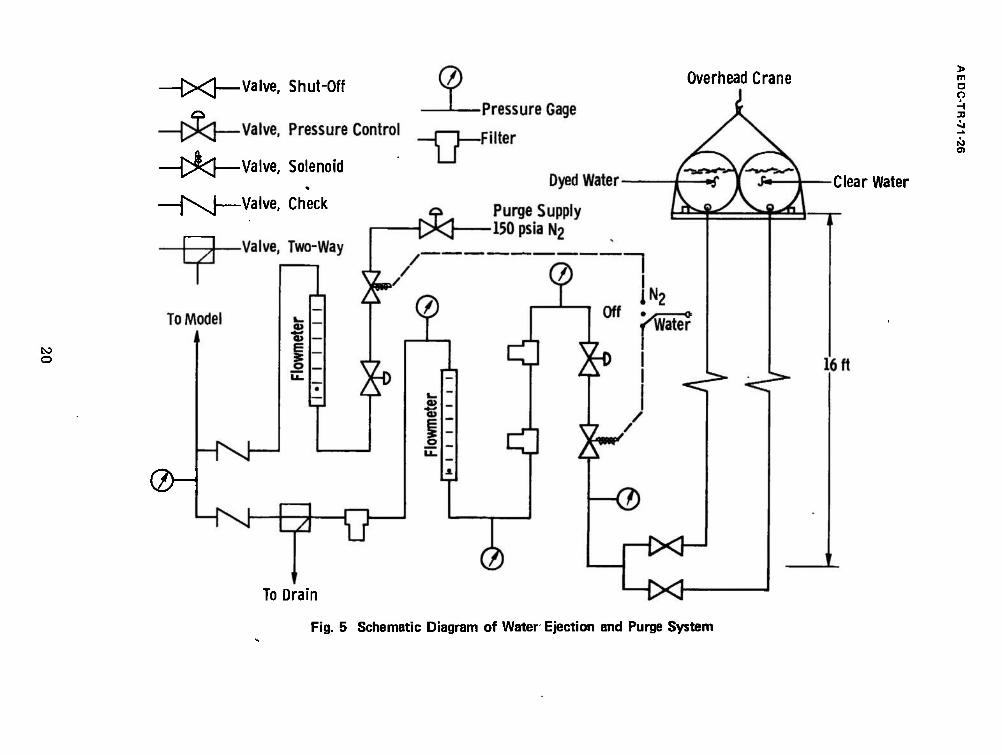
A schematic of the water ejection system is presented in Fig. 5. The water supply consisted of two Teflon®-lined 55-gal drums suspended from an overhead crane approximately 16 ft above the control panel. This provided relatively large quantities of both clear and dyed water in a noncorrosive, unpressurized container and proved to be superior to a pressurized tank.
A gaseous-nitrogen purge system was provided for the water flow system because of potential freezing in the model supply lines and ejector. A selector switch operated solenoid valves allowing selection of either water ejection or nitrogen purging. Clear or dyed water was selected by manual operation of shut-off valves. The dyed water con- sisted of one gram of Pontacyl® Black-A dye per 100 milliliters of distilled, deionized water.
2.2 INSTRUMENTATION
2.2.1 Pressure Phase
The purpose of the pressure plate insert (Fig. 3) was to provide spanwise pressure distributions so that the two-dimensionality of the flow could be investigated. Fifty-six pressures were measured in a 3- by 7-in. area just downstream of the ejectors. These model pres- sures were measured with the standard Tunnel B pressure system which consists of 15-psid transducers referenced to a near vacuum. The pressure plate was used during the first entry only.
In addition to the model surface pressures the ejector plenum cham- ber pressure and temperature were also measured. A 50-psid pressure transducer was installed in the model cavity to measure the water pres- sure in the ejector plenum chamber, and a thermocouple was spot- welded on the outside of the plenum chamber to measure the water temperature.
AEDC-TR-71-26
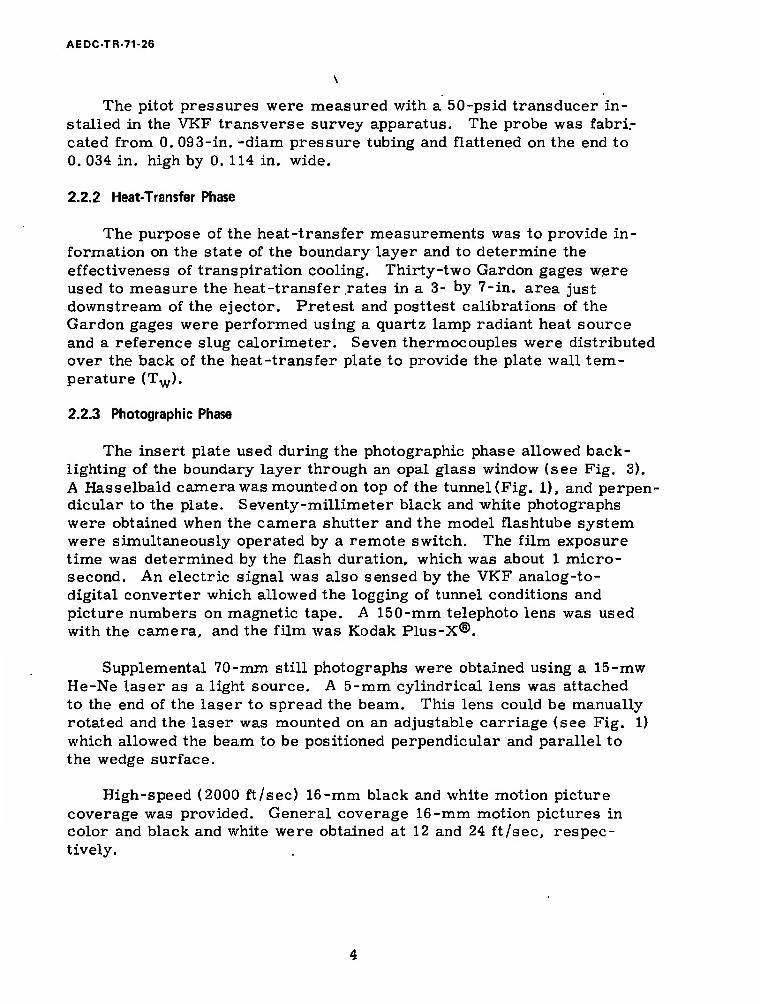
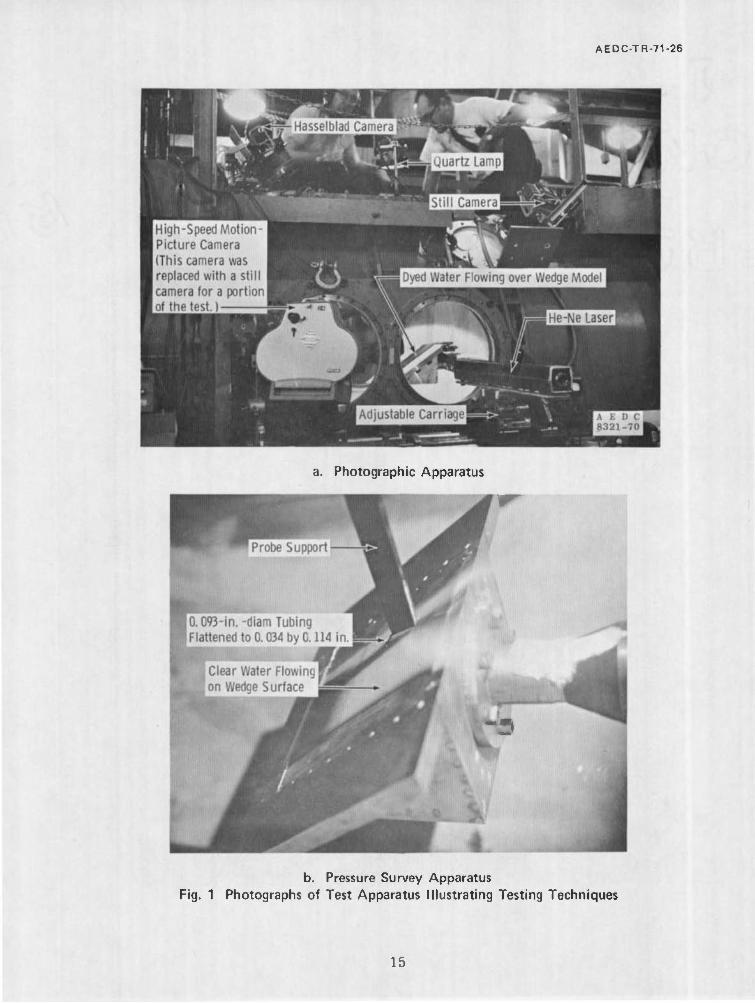
The pitot pressures were measured with a 50-psid transducer in- stalled in the VKF transverse survey apparatus. The probe was fabri- cated from 0. 093-in. -diam pressure tubing and flattened on the end to 0. 034 in. high by 0. 114 in. wide.
2.2.2 Heat-Transfer Phase
The purpose of the heat-transfer measurements was to provide in- formation on the state of the boundary layer and to determine the effectiveness of transpiration cooling. Thirty-two Gardon gages were used to measure the heat-transfer .rates in a 3- by 7-in. area just downstream of the ejector. Pretest and posttest calibrations of the Gardon gages were performed using a quartz lamp radiant heat source and a reference slug calorimeter. Seven thermocouples were distributed over the back of the heat-transfer plate to provide the plate wall tem- perature (Tw).
2.2.3 Photographic Phase
The insert plate used during the photographic phase allowed back- lighting of the boundary layer through an opal glass window (see Fig. 3). A Hasselbald camera was mounted on top of the tunnel (Fig. 1), and perpen- dicular to the plate. Seventy-millimeter black and white photographs were obtained when the camera shutter and the model flashtube system were simultaneously operated by a remote switch. The film exposure time was determined by the flash duration, which was about 1 micro- second. An electric signal was also sensed by the VKF analog-to- digital converter which allowed the logging of tunnel conditions and picture numbers on magnetic tape. A 150-mm telephoto lens was used with the camera, and the film was Kodak Plus-X®.
Supplemental 70-mm still photographs were obtained using a 15-mw He-Ne laser as a light source. A 5-mm cylindrical lens was attached to the end of the laser to spread the beam. This lens could be manually rotated and the laser was mounted on an adjustable carriage (see Fig. 1) which allowed the beam to be positioned perpendicular and parallel to the wedge surface.
High-speed (2000 ft/sec) 16-mm black and white motion picture coverage was provided. General coverage 16-mm motion pictures in color and black and white were obtained at 12 and 24 ft/sec, respec- tively.
AEDCTR.71-26
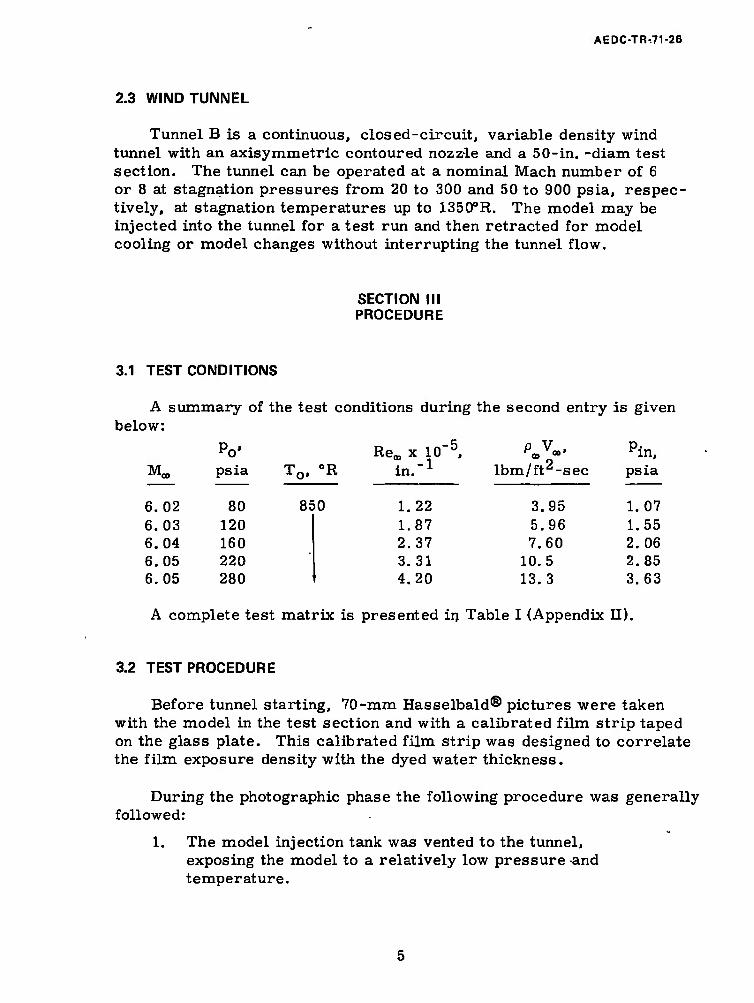
2.3 WIND TUNNEL
Tunnel B is a continuous, closed-circuit, variable density wind tunnel with an axisymmetric contoured nozz-le and a 50-in. -diam test section. The tunnel can be operated at a nominal Mach number of 6 or 8 at stagnation pressures from 20 to 300 and 50 to 900 psia, respec- tively, at stagnation temperatures up to 1350°R. The model may be injected into the tunnel for a test run and then retracted for model cooling or model changes without interrupting the tunnel flow.
SECTION III PROCEDURE
3.1 TEST CONDITIONS
A summary of the test conditions during the second entry is given below:
Po* Re«, x 10"5, '•>• Pin,
M. psia T0, °R ir, "I in. lbm/ft2-sec
3.95
psia
6.02 80 850 1.22 1.07 6.03 120 1.87 5.96 1.55 6.04 160 2. 37 7.60 2.06 6. 05 220 3. 31 10.5 2.85 6.05 280 4.20 13.3 3.63
A complete test matrix is presented in Table I {Appendix II).
3.2 TEST PROCEDURE
Before tunnel starting, 70-mm Hasselbald® pictures were taken with the model in the test section and with a calibrated film strip taped on the glass plate. This calibrated film strip was designed to correlate the film exposure density with the dyed water thickness.
During the photographic phase the following procedure was generally followed:
1. The model injection tank was vented to the tunnel, exposing the model to a relatively low pressure and temperature.
AEDC-TR-71-26
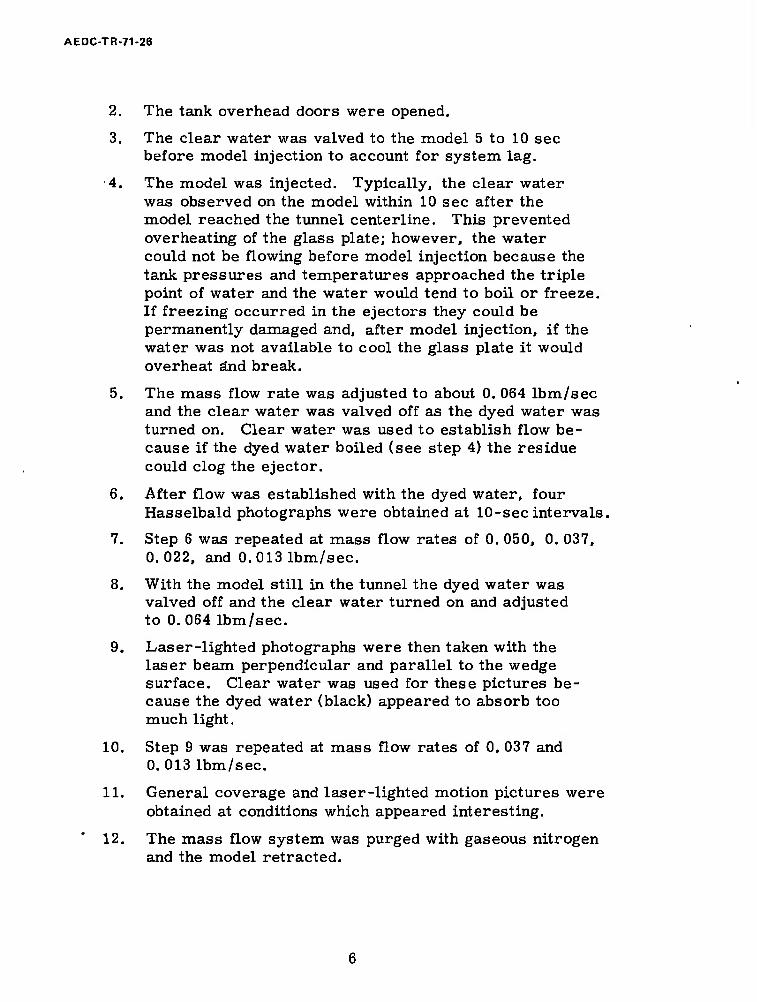
2. The tank overhead doors were opened.
3. The clear water was valved to the model 5 to 10 sec before model injection to account for system lag.
4. The model was injected. Typically, the clear water was observed on the model within 10 sec after the model reached the tunnel centerline. This prevented overheating of the glass plate; however, the water could not be flowing before model injection because the tank pressures and temperatures approached the triple point of water and the water would tend to boil or freeze. If freezing occurred in the ejectors they could be permanently damaged and, after model injection, if the water was not available to cool the glass plate it would overheat and break.
5. The mass flow rate was adjusted to about 0. 064 lbm/sec and the clear water was valved off as the dyed water was turned on. Clear water was used to establish flow be- cause if the dyed water boiled (see step 4) the residue could clog the ejector.
6. After flow was established with the dyed water, four Hasselbald photographs were obtained at 10-sec intervals.
7. Step 6 was repeated at mass flow rates of 0. 050, 0. 037, 0.022, and 0.013 lbm/sec.
8. With the model still in the tunnel the dyed water was valved off and the clear water turned on and adjusted to 0.064 lbm/sec.
9. Las er-lighted photographs were then taken with the laser beam perpendicular and parallel to the wedge surface. Clear water was used for these pictures be- cause the dyed water (black) appeared to absorb too much light.
10. Step 9 was repeated at mass flow rates of 0. 037 and 0.013 lbm/sec.
11. General coverage and laser-lighted motion pictures were obtained at conditions which appeared interesting.
12. The mass flow system was purged with gaseous nitrogen and the model retracted.
AEDC-TR-71-26
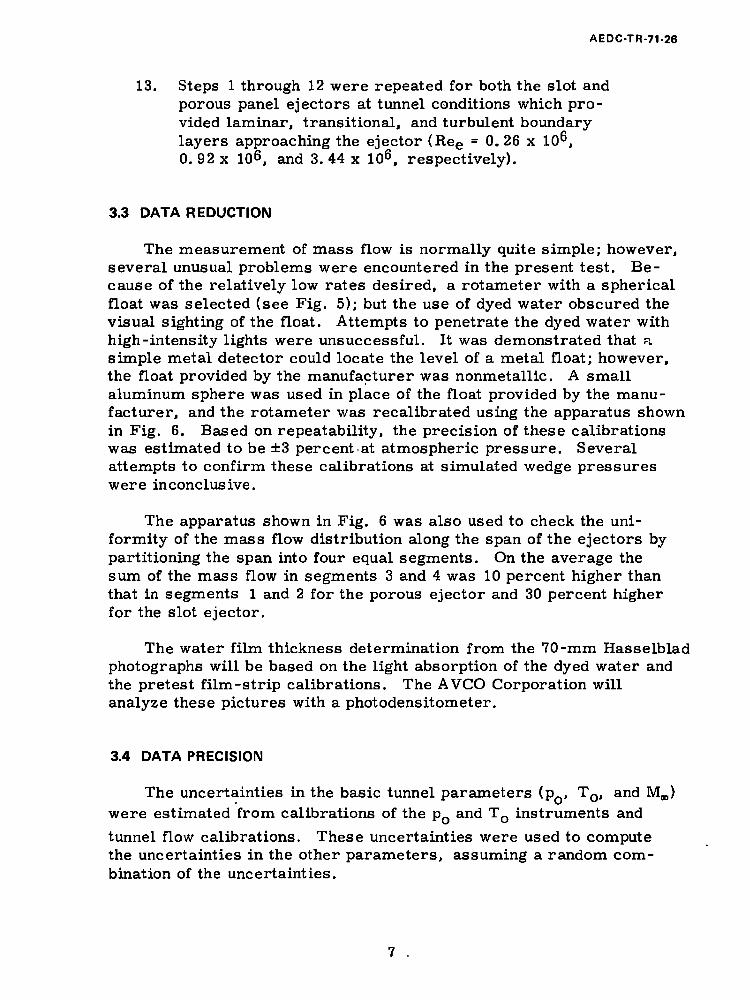
13. Steps 1 through 12 were repeated for both the slot and porous panel ejectors at tunnel conditions which pro- vided laminar, transitional, and turbulent boundary layers approaching the ejector (Ree = 0. 26 x 10", 0.92x 10⁶, and 3.44 x 10⁶, respectively).
3.3 DATA REDUCTION
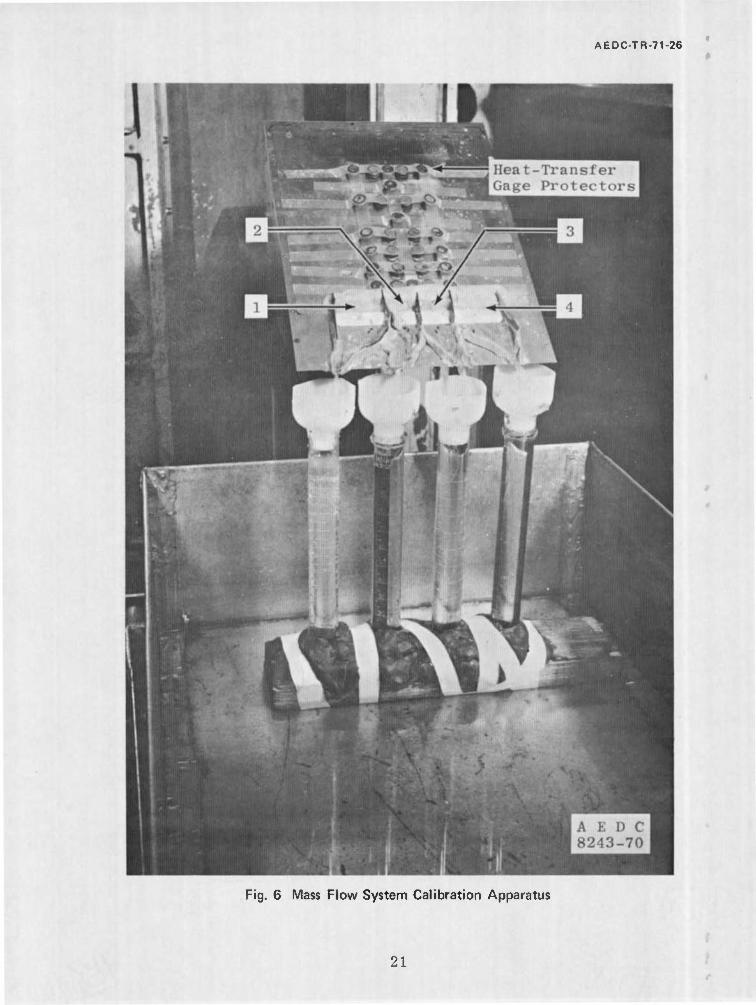
The measurement of mass flow is normally quite simple; however, several unusual problems were encountered in the present test. Be- cause of the relatively low rates desired, a rotameter with a spherical float was selected (see Fig. 5); but the use of dyed water obscured the visual sighting of the float. Attempts to penetrate the dyed water with high-intensity lights were unsuccessful. It was demonstrated that fi simple metal detector could locate the level of a metal float; however, the float provided by the manufacturer was nonmetallic. A small aluminum sphere was used in place of the float provided by the manu- facturer, and the rotameter was recalibrated using the apparatus shown in Fig. 6. Based on repeatability, the precision of these calibrations was estimated to be ±3 percent at atmospheric pressure. Several attempts to confirm these calibrations at simulated wedge pressures were inconclusive.
The apparatus shown in Fig. 6 was also used to check the uni- formity of the mass flow distribution along the span of the ejectors by partitioning the span into four equal segments. On the average the sum of the mass flow in segments 3 and 4 was 10 percent higher than that in segments 1 and 2 for the porous ejector and 30 percent higher for the slot ejector.
The water film thickness determination from the 70-mm Hasselblad photographs will be based on the light absorption of the dyed water and the pretest film-strip calibrations. The AVCO Corporation will analyze these pictures with a photodensitometer.
3.4 DATA PRECISION
The uncertainties in the basic tunnel parameters (p , T0, and M,,,) were estimated from calibrations of the p_ and TQ instruments and tunnel flow calibrations. These uncertainties were used to compute the uncertainties in the other parameters, assuming a random com- bination of the uncertainties.
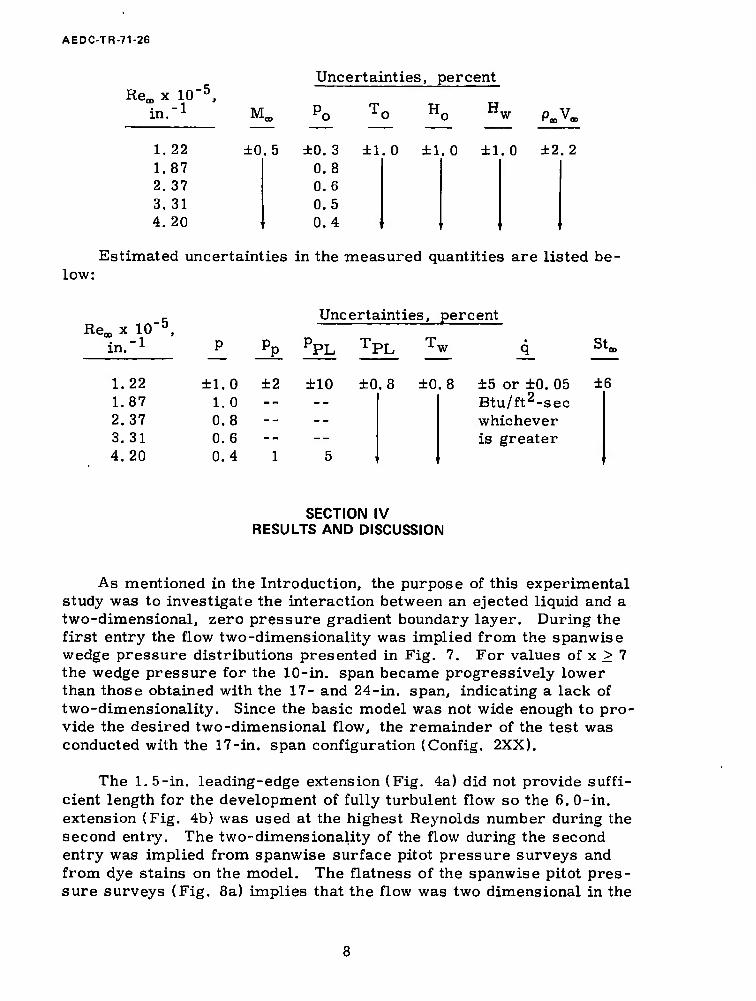
AEDC-TR-71-26
Uncertainties, percent Re» x 10-5,
■ -1 in. 1 M
±0
„ Po To H0 Hw
.5 ±0.3 ±1.0 ±1.0 ±1.0
o V
1. 22 ±2. 2 1.87 0.8 2. 37 0.6 3. 31 0.5 4.20 0. 4 1 r ■
Estimated uncertainties in the measured quantities are listed be- low:
Re«, x 10"5, in.-1 P
±1.0
PP
±2
Uncertainties, per
PPL TPL Tw
±10 ±0.8 ±0.8
cent
• q
1.22 ±5 or ±0. 05 1.87 1.0 -- -- Btu/ft2-sec 2.37 0.8 -- -- whichever 3.31 4.20
0.6 0.4 1 5 ■
■
is greater
St.
±6
SECTION IV RESULTS AND DISCUSSION
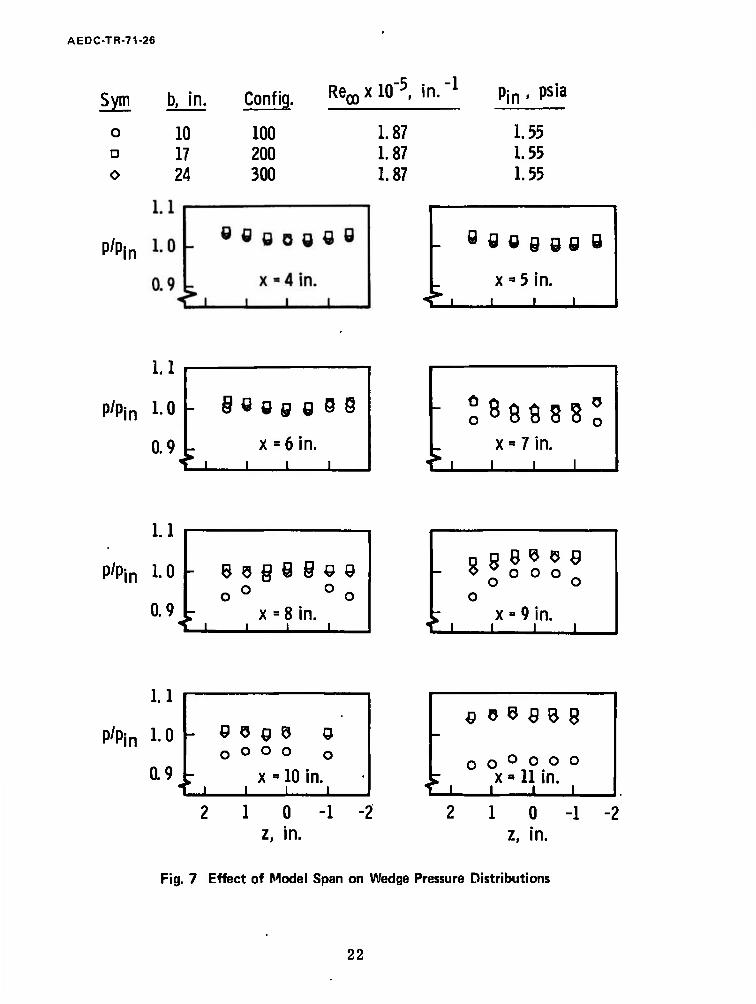
As mentioned in the Introduction, the purpose of this experimental study was to investigate the interaction between an ejected liquid and a two-dimensional, zero pressure gradient boundary layer. During the first entry the flow two-dimensionality was implied from the spanwise wedge pressure distributions presented in Fig. 7. For values of x > 7 the wedge pressure for the 10-in. span became progressively lower than those obtained with the 17- and 24-in. span, indicating a lack of two-dimensionality. Since the basic model was not wide enough to pro- vide the desired two-dimensional flow, the remainder of the test was conducted with the 17-in. span configuration (Config. 2XX).
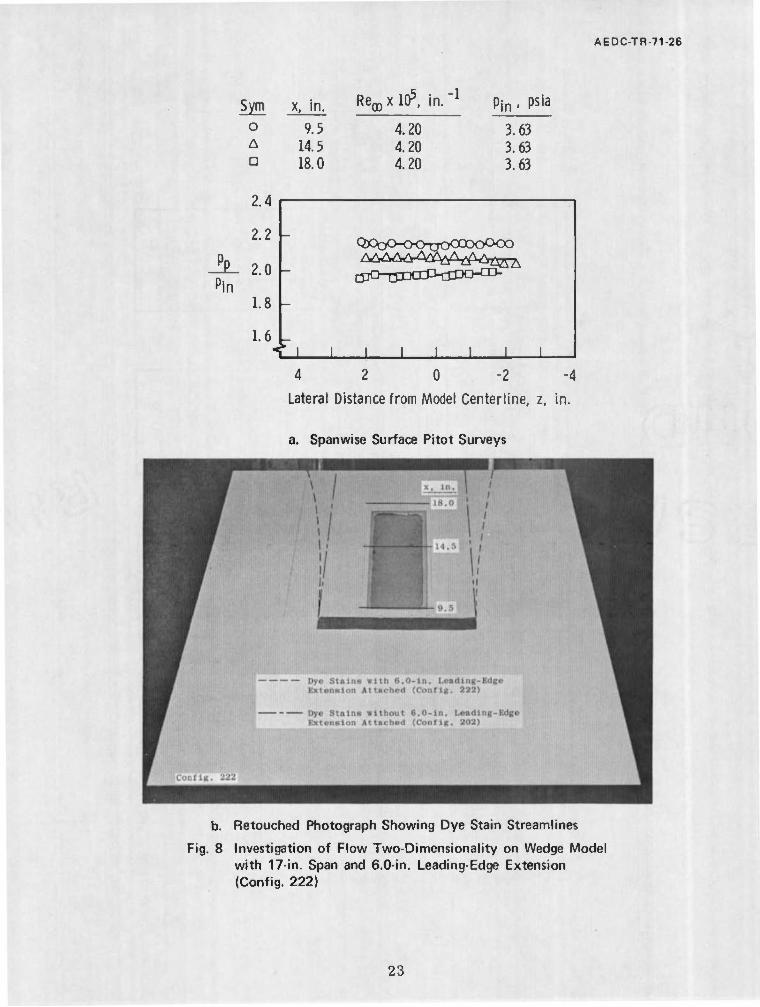
The 1.5-in. leading-edge extension (Fig. 4a) did not provide suffi- cient length for the development of fully turbulent flow so the 6. 0-in. extension (Fig. 4b) was used at the highest Reynolds number during the second entry. The two-dimensionality of the flow during the second entry was implied from spanwise surface pitot pressure surveys and from dye stains on the model. The flatness of the spanwise pitot pres- sure surveys (Fig. 8a) implies that the flow was two dimensional in the
8
AEDC-TR-71-26
region of interest (area of the glass plate); however, the dye stains shown in Fig. 8b indicate that the water flow was more divergent when the 6. 0-in. leading-edge extension was attached.
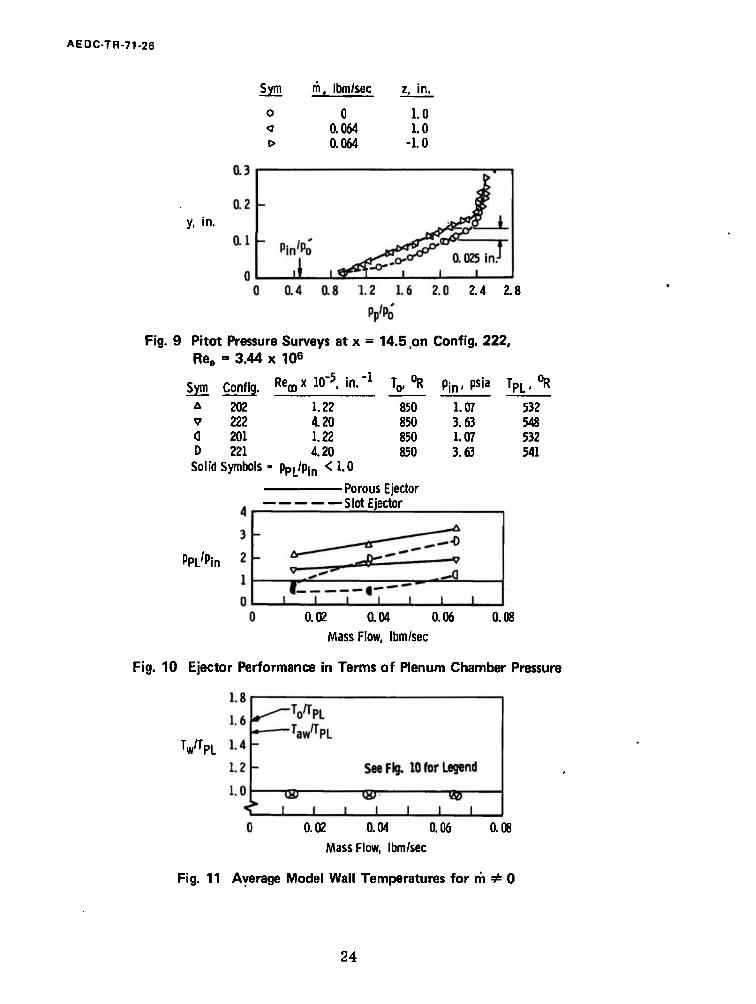
Typical boundary-layer pitot pressure surveys with and without water ejection from the porous ejector are presented in Fig. 9. Water ejection increased the apparent boundary-layer thickness 0. 025 in. which corresponds to about 15 percent. When one considers that the m ^ 0 surveys were obtained in a two-phase flow, the general agreement between the m = 0 and m $ 0 surveys is somewhat surprising.
The ratios of ejector plenum chamber pressures to inviscid wedge pressures are presented in Fig. 10. As can be seen the ratio Ppj_,/Pin
for the porous ejector was always greater than 1. 0, whereas this ratio was less than 1. 0 for the slot ejector in some cases (solid symbols). When the plenum pressure was less than the wedge pressure one might expect the water flow to pulsate, and this was observed.
The ratios of average model wall temperatures on the heat-transfer insert to the measured plenum chamber temperature (TW/TPL) are presented in Fig. 11 as a function of mass flow. In all cases the wall temperature was essentially equal to the measured plenum chamber temperature and was independent of time. This clearly illustrates the effectiveness of the water cooling for these test conditions.
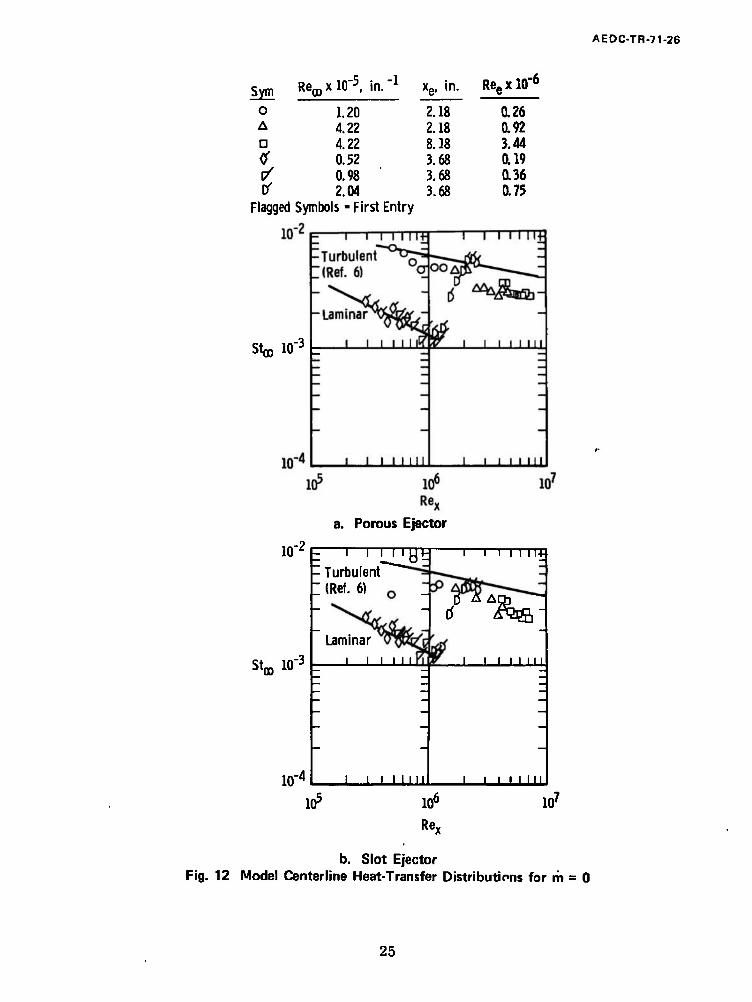
Comparisons are presented in Fig. 12 of experimental and theo- retical (Ref. 5) Stanton number distributions (m = 0) with both ejectors installed. Figure 12 also includes data obtained during the first entry, and comparisons of these data with the theory indicate that the flow was laminar at the lower free-stream Reynolds, numbers as would be ex- pected. However, the data obtained during the second entry agreed with the trends of the turbulent theory for all free-stream Reynolds numbers. The implication is that the modifications to the ejectors pro- duced disturbances which were sufficient to trip the boundary layer. Based on the data from the first entry, the state of the boundary layer approaching the ejector is believed to have been laminar, transitional, and turbulent for Ree = 0. 26 x 10s, 0. 92 x 106, and 3. 44 x 106, respec- tively.
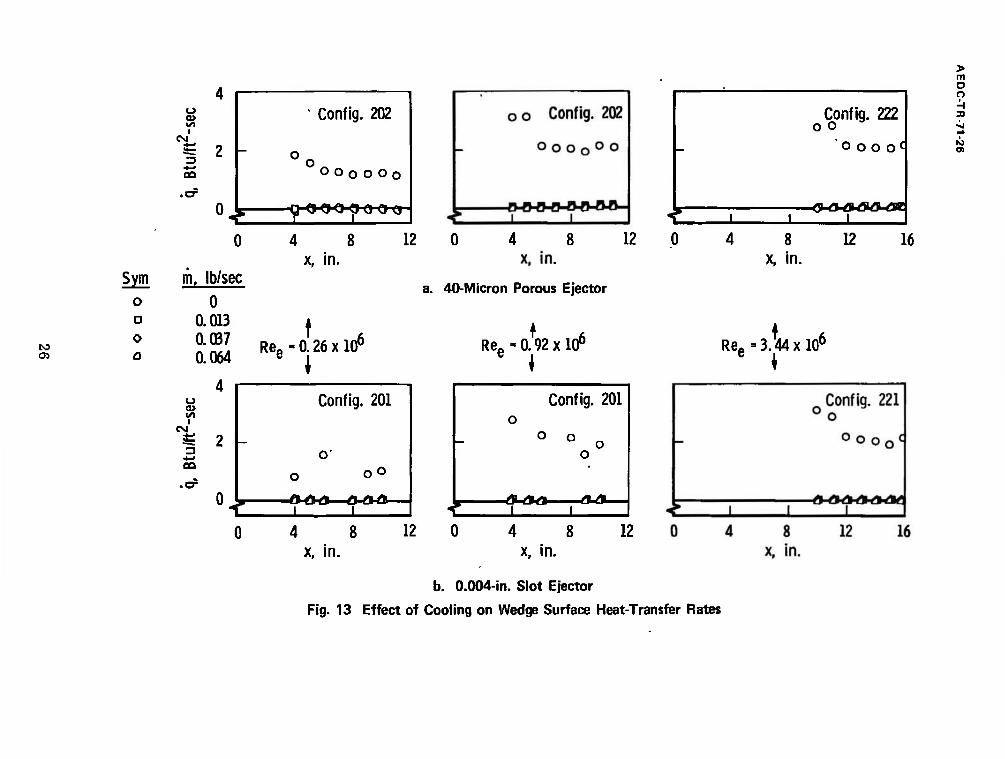
The effectiveness of the cooling is again illustrated in Fig. 13 which shows that the heat-transfer rates (q) were essentially zero whenever the water was ejected.
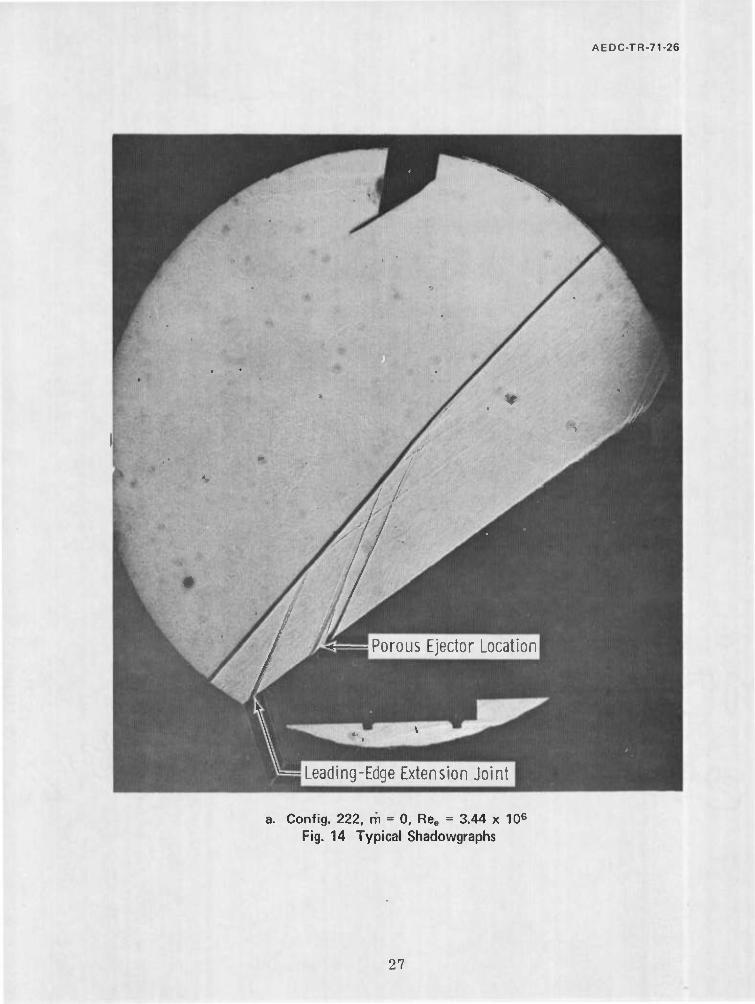
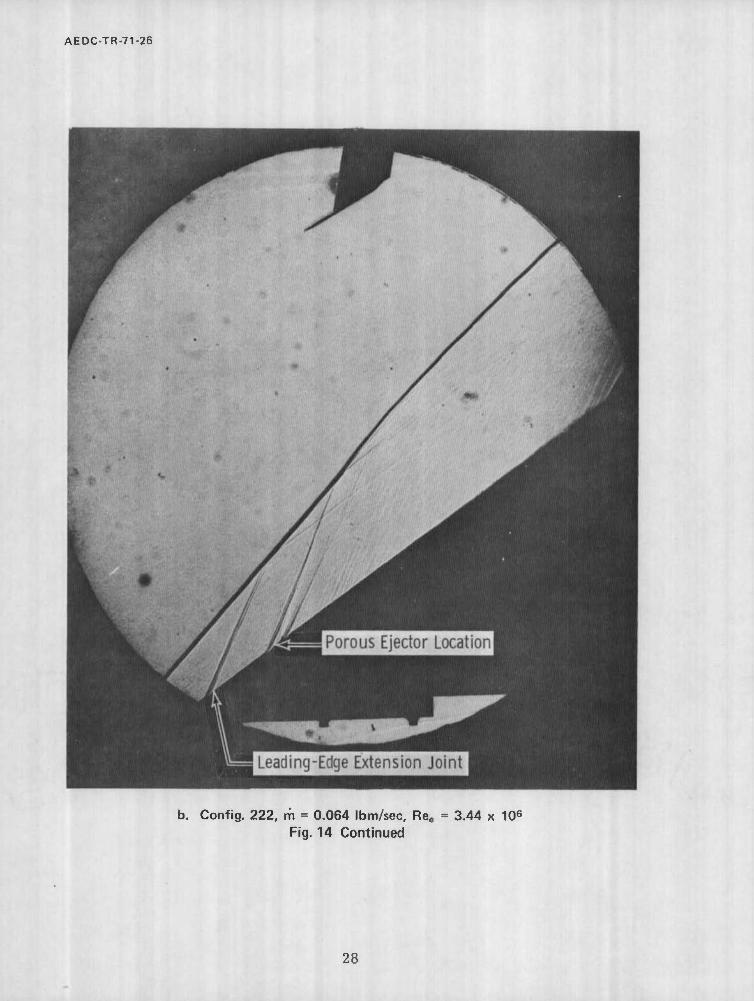
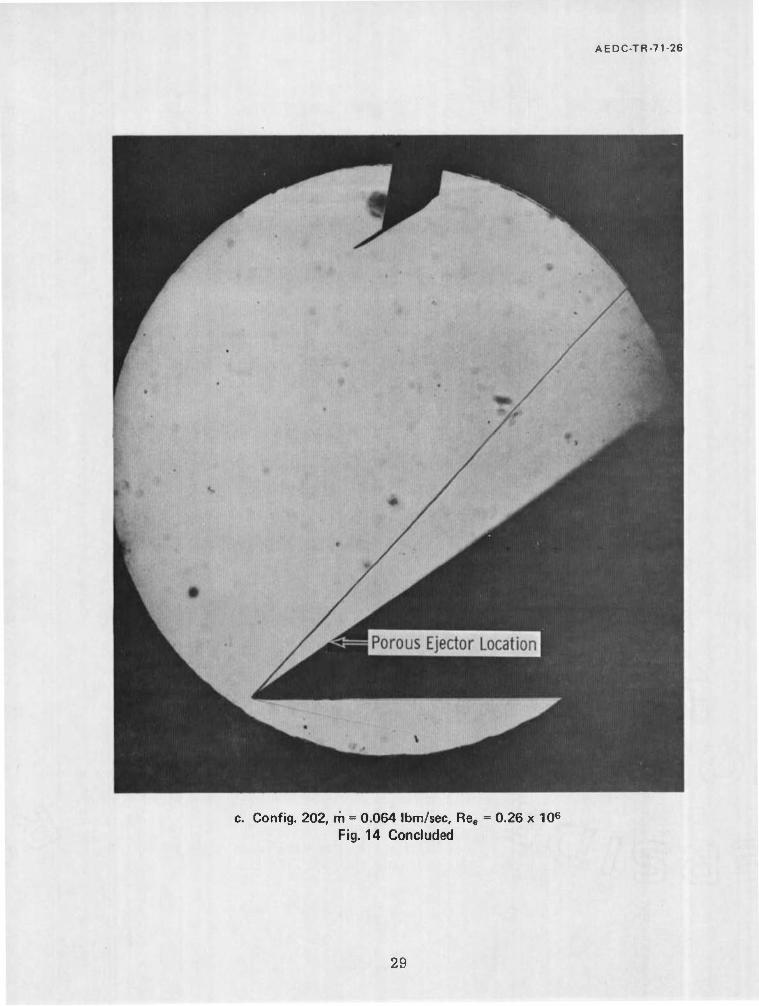
Typical shadowgraphs with and without water ejection are presented in Fig. 14, and, as can be seen, disturbances were produced in the
AEDC-TR-71-26
region of the ejectors even at m = 0 which would aid in tripping the boundary layer. Comparison of photographs at m = 0 (Fig. 14a) and at m = 0. 064 lbm/sec (Fig. 14b) does not reveal any significant difference, and therefore the shadowgraph pictures were of little value in evaluating the water ejection-boundary layer interaction.
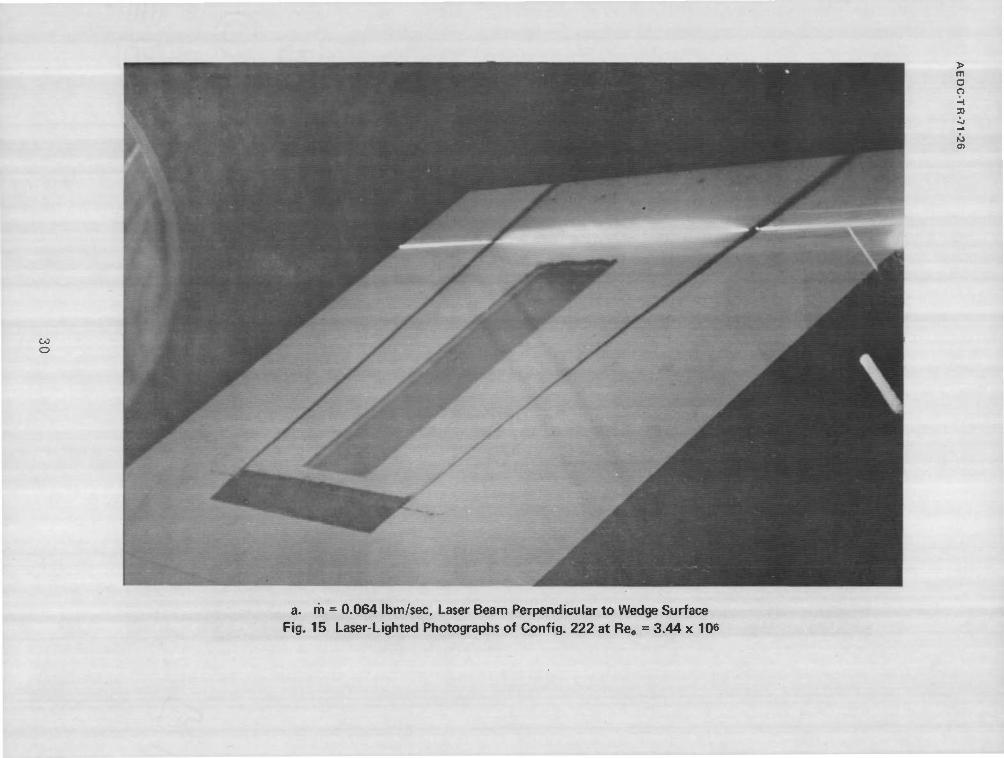
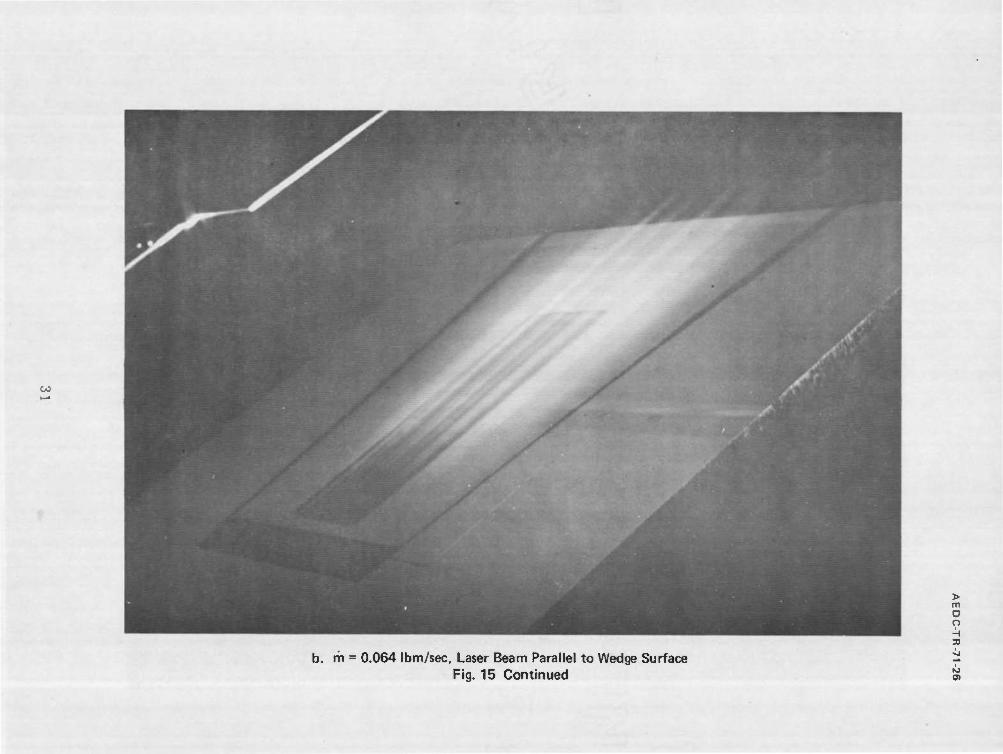
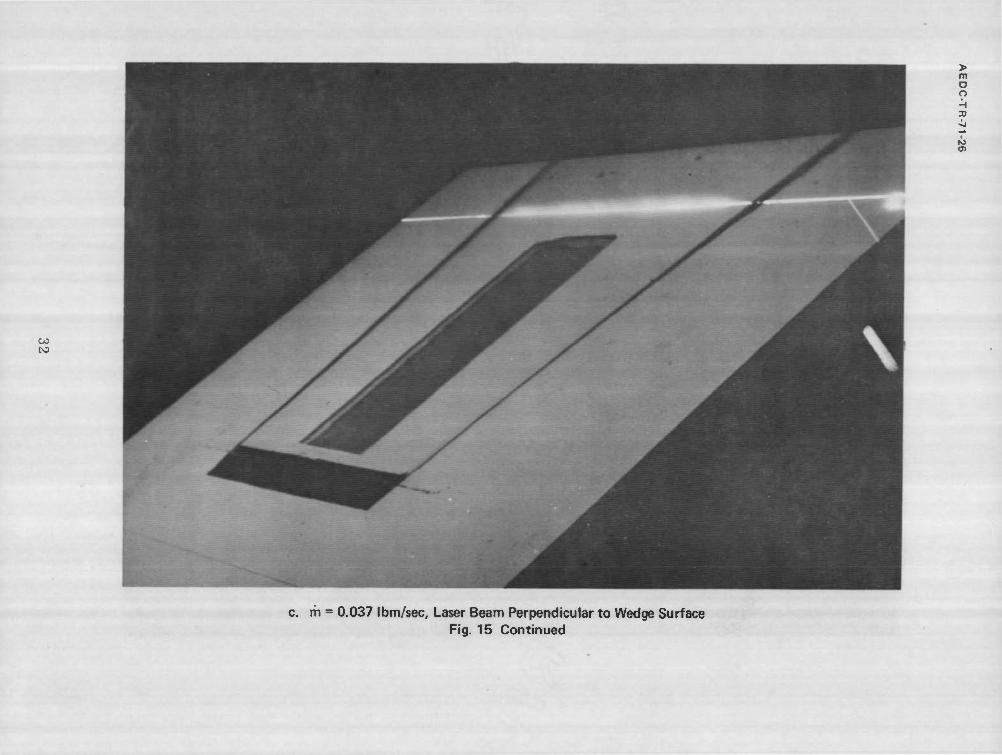
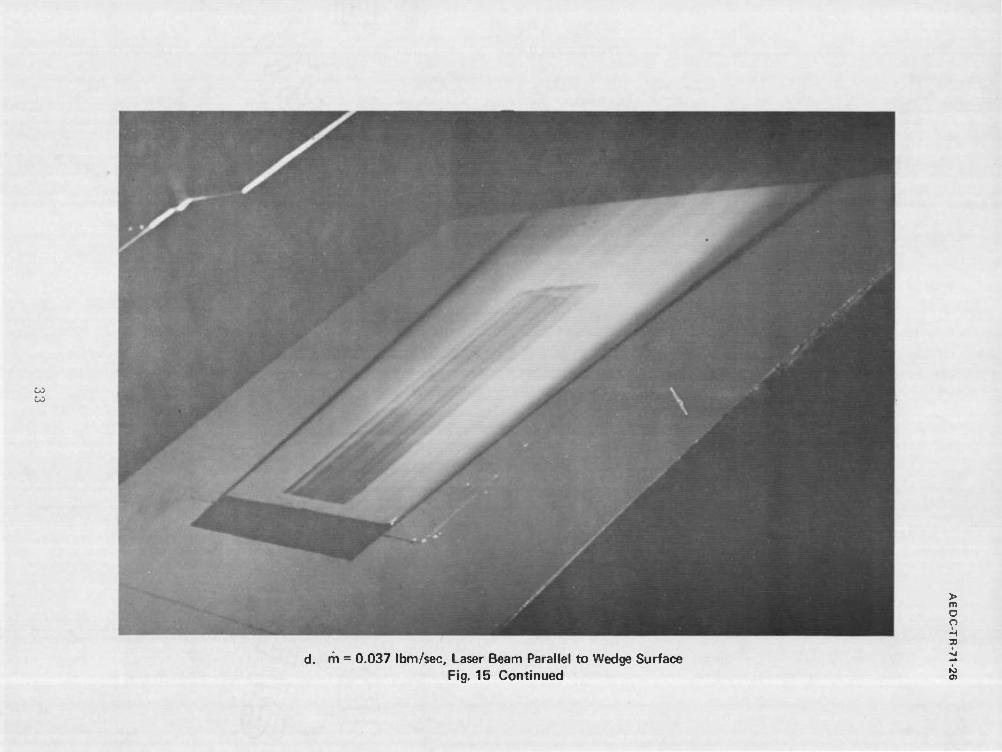
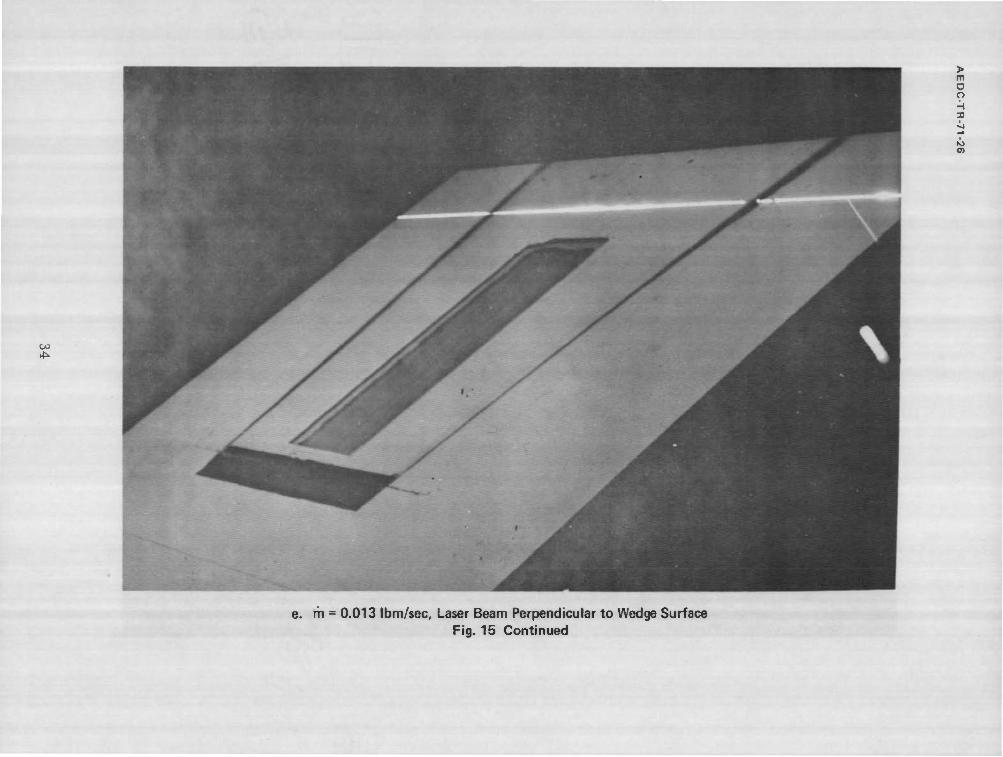
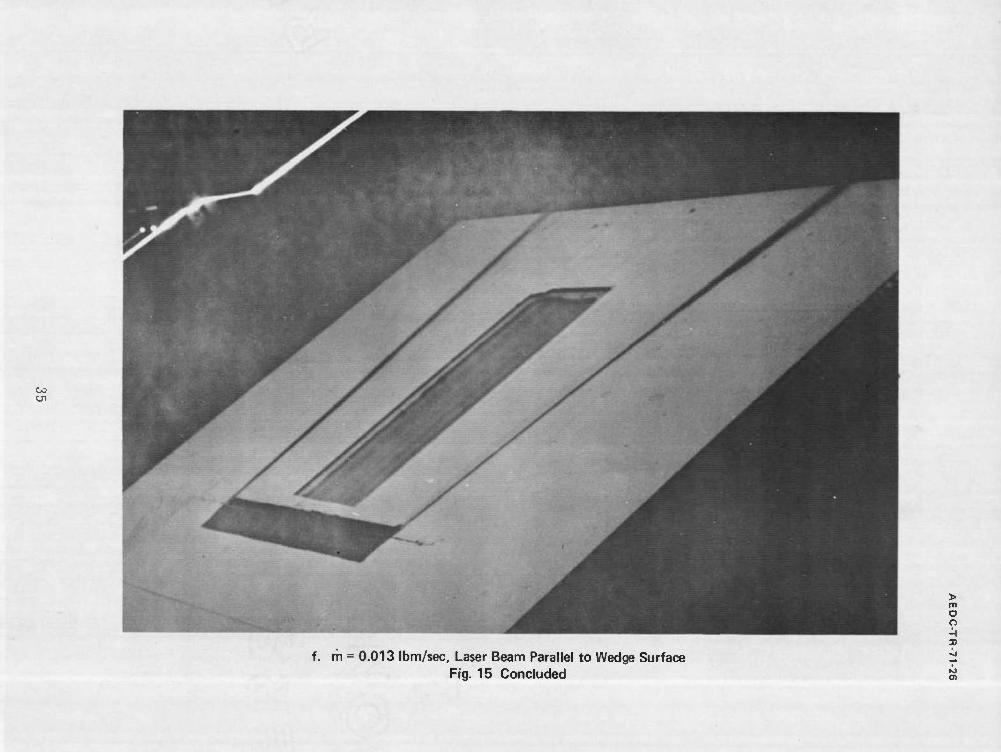
Interpretation of the laser-lighted photographs shown in Fig. 15 is based on the premise that water droplets will reflect light whereas the tunnel airflow will not. These pictures illustrate the degree of water penetration into the boundary layer and the decrease in penetration as the mass flow decreased. The structure (i. e., film, spray, or vapor) of the water cannot be determined from these photographs; however, close scrutiny does reveal streaks in the water flow.
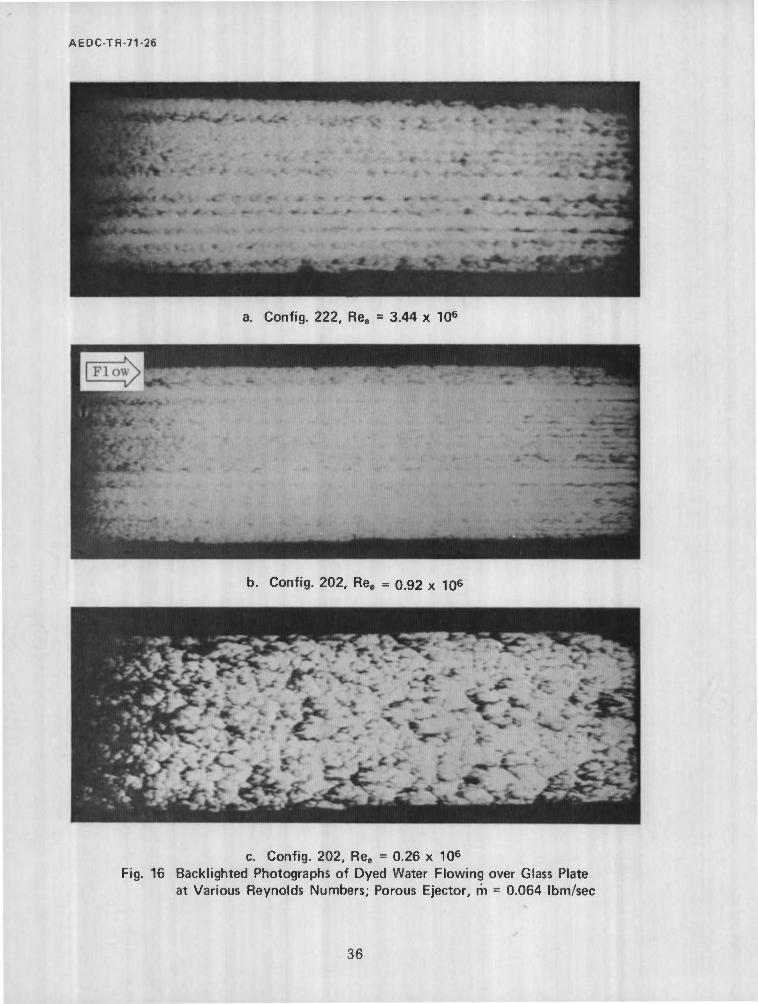
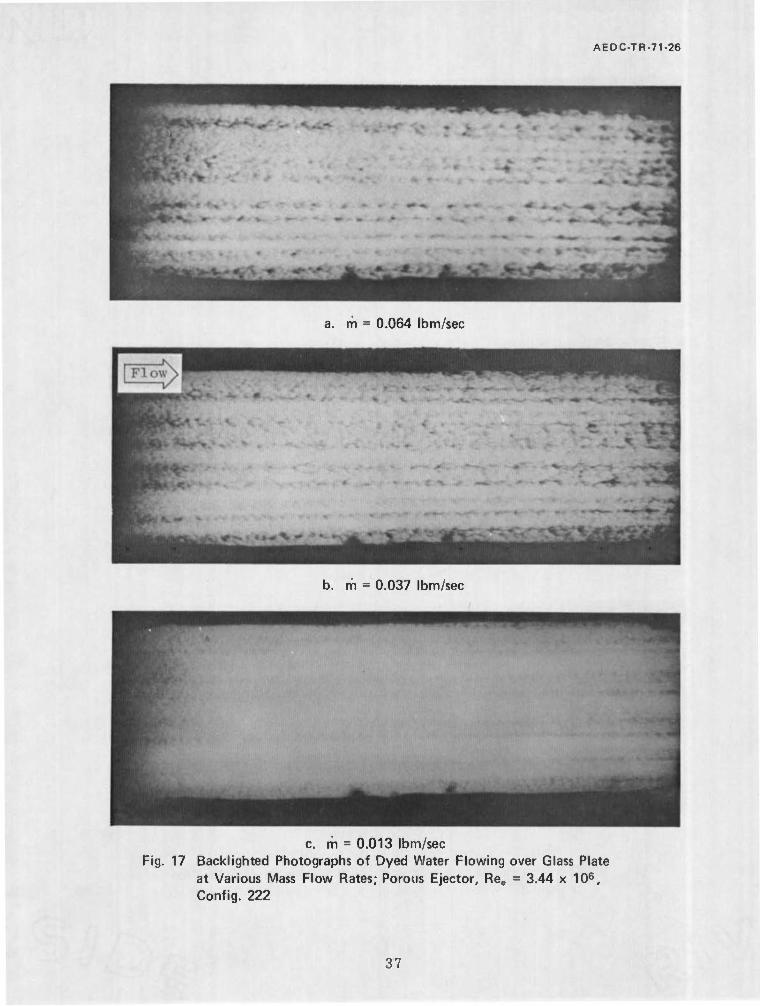
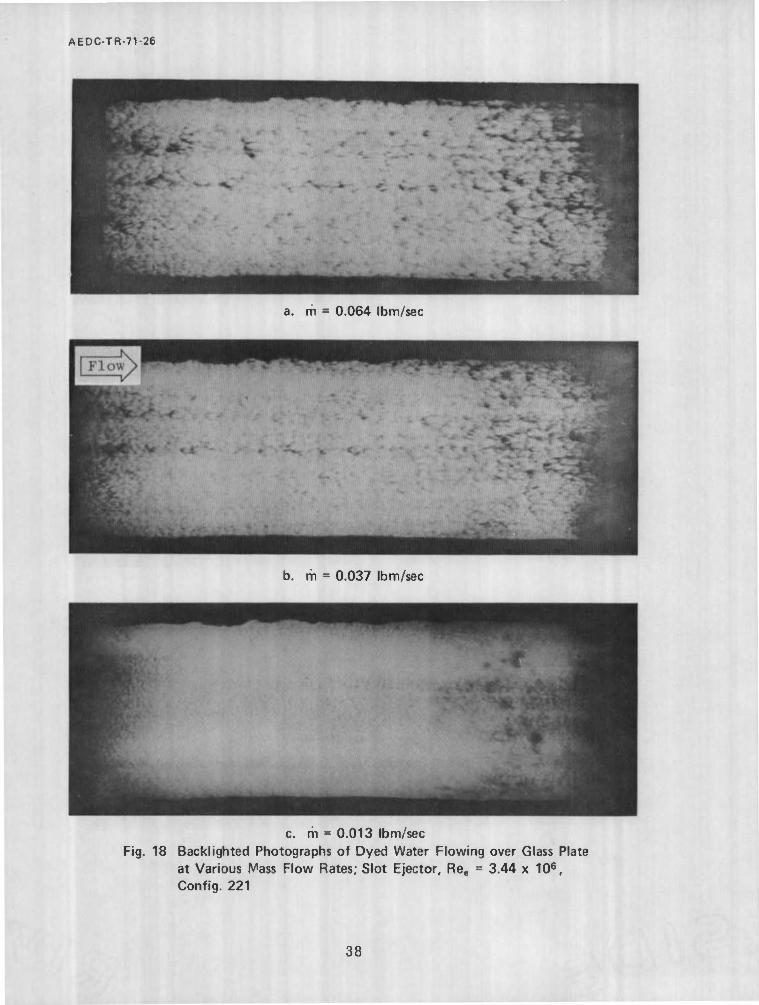
Examples of the primary data obtained during this test are presented in Figs. 16, 17, and 18. The interpretation of these photographs is obviously difficult, but some general observations can be made. Com- parison of the bottom picture (Ree = 0. 26 x 10^) in Fig. 16 with the other two clearly shows that Reynolds number was a significant param- eter. As expected, changes in water ejection rate were also discernible as illustrated in Fig. 17. The streaks in Fig. 17 are believed to be attributable to the porous ejector since they were not as pronounced when the slot ejector was used (Fig. 18).
SECTION V CONCLUSIONS
Tests were conducted at Mach number 6 to investigate the inter- action between an ejected liquid (water) and a two-dimensional, zero pressure gradient boundary layer. Heat-transfer, pitot pressure sur- veys, and photographic data were obtained over a Reynolds number range from 0. 26 x 10^ to 3. 44 x 10^, based on the distance to the ejector. The water mass flow range was from 0. 013 to 0. 064 lbm/sec for both a porous panel and a slot ejector. Some of the results are summarized below:
1. Spanwise pressure distributions indicated the flow was ' two dimensional in the region of interest.
2. Water ejection at the maximum rate (0. 064 lbm/sec) increased the boundary-layer thickness about 15 per- cent based on pitot pressure surveys.
10
AEDC-TR-71-26
3. For all nonzero mass flow rates the model surface temperatures were equal to the water temperature {'<■ 75°F) and the heat-transfer rates were zero.
4. Laser-lighted photographs clearly illustrated the degree of water penetration into the boundary layer and the decrease in penetration as the mass flow decreased.
REFERENCES
1. Rannie, W. D. "A Simplified Theory of Porous Wall Cooling. " JPL Progress Report No. 4-50, California Institute of Tech- nology, Pasadena, November 1947.
2. Crocco, L. "An Approximate Theory of Porous, Sweat, or Film Cooling with Reactive Fluids." ARS Journal, Vol. 22, 1952, pp. 331-338.
3. Persson, L. "Water Film Cooling of Aerodynamically Heated Bodies." Proceedings of IVth International Congress of the Aeronautical Sciences, MacMillan and Co., New York, New York, 1965, pp. 1001-1013.
4. Gold, H., DiCristina, V., and Pallone, A. J. "Nosetip Cooling by Discrete Fluid Injection. " Paper Number 68-1141, Presented at the AIAA Entry Vehicle Systems and Technology Meeting, Williams burg, Virginia, December 1968.
5. Harms, R. J., Schmidt, C. M., Hanawalt, A. J. , and Schmitt, D. A. "A Manual for Determining Aerodynamic Heating of High-Speed Aircraft. " Bell Aircraft Corporation, Report No. 7006-3352- 001 (AD229434), June 1959.
11
AEDC-TR-71-26
APPENDIXES
I. ILLUSTRATIONS II. TABLE
13
AEDC-TR-71-26
a. Photographic Apparatus
-•l
b. Pressure Survey Apparatus
Fig. 1 Photographs of Test Apparatus Illustrating Testing Techniques
15
Oi
O o H 9
Fig. 2 Basic Configuration (Config. 100) Installed in Tunnel B
> m O O
Fig. 3 Photograph of Instrumentation Insert Plates
oo
All Dimensions in Inches Not to Scale
I nterchangeable Mass Flow Ejectors
7.0-in. Detachable Side Extension
3.5-in. Detachable Side Extension
nterchangeable nstrumentation
Plates
o o
3)
Detachable Leading-Edge Extension
a. Components Used during First Entry Fig. 4 Model Details
CO
All Dimensions in Inches Not to Scale
20.50
40-Micron Porous Panel Hh 0.63
-Plenum Chamber
40-Micron Porous Ejector
Airflow 17.00
0.004 Slot r0050 Eo.s gten; 0.004-in. Slot Ejector
Ejector Details
6.00
Detachable Leading-Edge Extension
b. Components Used during Second Entry Fig. 4 Concluded
Nylon Mounting Block- Pyrex Cylinders -
Novatron Flashtube ■ Ejector -
See Detail-
Transducer Cable
Power Cable
0.093 Tube for Atmospheric Vent
Water Supply
Xenon Transformer > m o n i -I 3J i
CO o
—|X]—Valve, Shut-Off
-Valve, Pressure Control
—£&]—Valve, Solenoid
—f\|—Valve, Check
-Valve, Two-Way
Overhead Crane
0-
> m o o ■H 3J
IO 0>
Clear Water
To Drain
Fig. 5 Schematic Diagram of Water Ejection and Purge System
AEDC-TR-71-26
Fig. 6 Mass Flow System Calibration Apparatus
21
AEDC-TR-71-26
Sym b, in.
10
Config.
100
Re<x> x 10"5, in. -1 Pin . Psia
o 1.87 1.55 D 17 200 1.87 1.55 o 24 300 1.87 1.55
P'Pin - e 0 Ö 8 00 B
x - 5 in.
1.1
P/Pin 1.0 'in
0.9 -
- 8 0 o 9 g 5 8
f 1 x =6 in.
i i i
- o88888
x = 7 in. o
1.1
0.9
p/Pjn 1.0 - 89§6899 o ° ° o
x =8 in. i i i_
- 8 8 O 0 o o o o
f 1 X = 9 in.
_, i i
1.1
P'Pin 1.0
0.9 -
5959 0 o o o o 0
•rl x ■ 10 in.
i i i
1 0 z, in.
HM&8
«* 1
0 o ° o o o x ■ 11 in.
i i i
1 0 -1 z, in.
Fig. 7 Effect of Model Span on Wedge Pressure Distributions
22
AEDC-TR-71-26
Sym o A D
2.4
2.2
JL 2.0 k Pin
x, in.
9.5 14.5 18.0
Re^x 105, in.
4.20 4.20 4.20
Pin ■ PS'a
3.63 3.63 3.63
1.8
1.6
Q»cK><K>aoooooOoo
<L± J L
4 2 0-2-4
Lateral Distance from Model Centerline, z, in.
a. Spanwise Surface Pitot Surveys
b. Retouched Photograph Showing Dye Stain Streamlines
Fig. 8 Investigation of Flow Two-Dimensionality on Wedge Model with 17-in. Span and 6.0-in. Leading-Edge Extension (Config. 222)
23
AEDC-TR-71-26
Sym m, Ibm/sec z, in.
o
o
0 0.064 0.064
1.0 1.0
-1.0
y, m.
2.4 2.8
Fig. 9 Pitot Pressure Surveys at x = 14.5 on Config. 222,
Ree = 3.44 x 10⁶
Sym Config. Remx 10"3> i"-"1 V °R Pin, psia TPl, °R
0 D
202 222 201 221
1.22 4.20 1.22 4.20
850 850 850 850
1.07 3.63 1.07 3.63
532 548 532 541
Solid Symbols - Pp|_/P;n < 1-0
Porous Ejector •Slot Ejector
Ppi/Pi in
0.02 0.04 0.06
Mass Flow, Ibm/sec
0.08
Fig. 10 Ejector Performance in Terms of Plenum Chamber Pressure
yTPL
0.02 0.04 0.06
Mass Flow, Ibm/sec
0.08
Fig. 11 Average Model Wall Temperatures for m ^ 0
24
AEDC-TR-71-26
ym Re^ x 10"5, in.-1 Xg, in.
2.18
Reexl0'6
o 1.20 a 26 A 4.22 2.18 0.92 a 4.22 8.18 3.44 0 0.52 3.68 0.19 / 0.98 3.68 a 36 V 2.04 3.68 0.75
Flagged Symbols ■ First Entry
Sto, 10"3 -
a. Porous Ejector
w E—■—i i i iyt Turbulent (Ref. 6)
Sto, 10-
10 -4
Laminar
i i i i 11
T 1 I I I IN
J
J I I I Mill I ■ ■ i i in
IG5 106
Rev
10'
b. Slot Ejector Fig. 12 Model Centerline Heat-Transfer Distributions for m = 0
25
Sym
o D
O a
o a> to
CM
I 2
1 Config. 202
°o0 o o0
2 <KfO<KJ-9*9-
4 8 x, in.
t
m, lb/sec
0 0.013
u a> i/i i
CM
Config. 201
- o
o
"
oo
1
Config. 201 o
— ° ° o o
—, /%-/ < i - .
4 8 x, in.
12 4 8 x, in.
12
12 0 4 8 12 0
a. 40-Micron Porous Ejector
Rep=0.92xl06
*
Config. 222
o o O Oc
8 x, in.
12 16
Refl=3.44xl06
b. 0.004-in. Slot Ejector
Fig. 13 Effect of Cooling on Wedge Surface Heat-Transfer Rates
> m □ O
AEDC-TR-71-26
S
» /
Is. •
1 ^^ 1 Porous Ejector Locationl
1 Leading-Edge Extension Joint |
a. Config. 222, m = 0, Ree = 3.44 x 10G
Fig. 14 Typical Shadowgraphs
27
AEDC-TR-71-26
b. Config. 222, m = 0.064 Ibm/sec, Ree = 3.44 x 10⁶
Fig. 14 Continued
28
AEDC-TR-71-26
c. Config. 202, m = 0.064 Ibm/sec, Re, = 0.26 x 10⁶
Fig. 14 Concluded
29
00 o
> m O o
M 0)
a. rh = 0.064 Ibm/sec, Laser Beam Perpendicular to Wedge Surface Fig. 15 Laser-Lighted Photographs of Config. 222 at Ree = 3.44 x 10⁶
00
o o
m = 0.064 Ibm/sec, Laser Beam Parallel to Wedge Surface Fig. 15 Continued 0>
ts3
> m O o
ro 0)
m = 0.037 Ibm/sec, Laser Beam Perpendicular to Wedge Surface Fig. 15 Continued
w CO
m = 0.037 Ibm/sec, Laser Beam Parallel to Wedge Surface Fig. 15 Continued
o
H
s
CO
> m O o
ro
e. m = 0.013 Ibm/sec, Laser Beam Perpendicular to Wedge Surface Fig. 15 Continued
00
m ■ 0.013 Ibm/sec, Laser Beam Parallel to Wedge Surface Fig. 15 Concluded
o
X
O)
AEDC-TR-71-26
a. Config. 222, ReB = 3.44 x 10⁶
b. Config. 202, Ree = Q.92 X 106
c. Config. 202, Ree = 0.26 x 10^ Fig. 16 Backlighted Photographs of Dyed Water Flowing over Glass Plate
at Various Reynolds Numbers; Porous Ejector, m ■ 0.064 Ibm/sec
36
AEDC-TR-71-26
a. rft = 0.064 Ibm/sec
b. m = 0.037 Ibm/sec
c. m = 0.013 Ibm/sec Fig. 17 Backlighted Photographs of Dyed Water Flowing over Glass Plate
at Various Mass Flow Rates; Porous Ejector, Ree = 3.44 x 10⁶, Config. 222
37
AEDC-TR-71-26
a. m = 0.064 Ibm/sec
b. m = 0.037 Ibm/sec
c. m = 0.013 Ibm/sec Fig. 18 Backlighted Photographs of Dyed Water Flowing over Glass Plate
at Various Mass Flow Rates; Slot Ejector, Ree = 3.44 x 10⁶, Config. 221
38
AEDC-TR-71-26
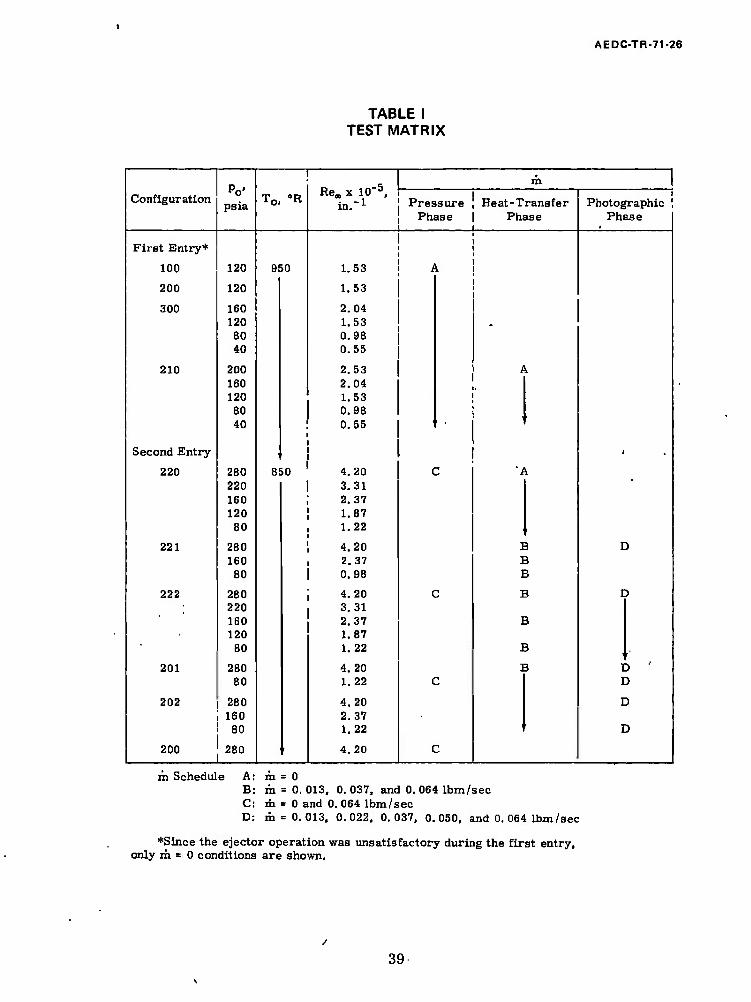
TABLE I TEST MATRIX
Configuration Po-
ps ia
m
T0l °R Re,, x 10 5,
Pressure Phase
Heat-Transfer Phase
i
Photographic ! Phase
First Entry*
100 120 950 1.53 A
200 120 1.53
300 160 120 80 40
2.04 1.53 0.98 0.55
-
210 200 160 120 80
40
2.53 2.04 1.53 0.98 0.55 ,
A
•
Second Entry j .
220 280
220 160 120 80
8! >0 4.20 3.31 2.37 1.87 1.22
C '1 i
221 280 160 80
4.20 2.37 0.98
B B B
D
222 280 220 160 120
80
4.20 3.31 2.37 1.87 1.22
C B
B
B
D
■'
201 280 80
4.20 1.22 C
] 3 D ' D
202 280 160 80
4.20 2.37 1.22
r
D
D
200 280 ' 4.20 C
m Schedule A: m = 0 B: m = 0.013, 0.037, and 0. 064 lbm/sec C: m = 0 and 0. 064 lbm/sec D: m= 0.013, 0.022, 0.037, 0.050, and 0. 064 lbm/sec
*Since the ejector operation was unsatisfactory during the first entry, only m = 0 conditions are shown.
39
UNCLASSIFIED Security Classification
DOCUMENT CONTROL DATA -R&D (Security classification of Ulla, body of abstract and indexing annotation must be entered when the overall report Is classified)
1. ORIGINATING ACTIVITY (Corporate author)
Arnold Engineering Development Center ARO, Inc., Operating Contractor Arnold Air Force Station, Tennessee 37389
2a. REPORT SECURITY CLASSIFICATION
UNCLASSIFIED 2b. GROUP
N/A 3. REPORT TITLE
EXPERIMENTAL INVESTIGATION OF WATER EJECTION FROM A WEDGE MODEL AT MACH NUMBER 6
4. DESCRIPTIVE NOTES (Type ot report and Inclusive dates)
Final Report, June 15 to October 8, 1970 s. AUTHOR(S) (First name, middle Initial, last name)
R. K. Matthews, ARO, Inc.
6. REPORT DATE
April 1971 7«. TOTAL NO. OP PAGES
47 7b. NO. OF REFS
8a. CONTRACT OR GRANT NO. F40600-71-C-0002
9a. ORIGINATOR'S REPORT NUMBERISI
b. PROJECT NO.
7381 <=• Program Element 62102F
AEDC-TR-71-26
d.
ab. OTHER REPORT NOIS1 (Any other numbers that may be assigned this report)
ARO-VKF-TR-70-328 10. DISTRIBUTION STATEMENT
Approved for public release; distribution unlimited.
II. SUPPLEMENTARY NOTES
Available in DDC,
12. SPONSORING MILITARY ACTIVITY
Air Force Materials Laboratory (MAAS), Wright-Patterson AFB, Ohio 45433
13. ABSTRACT
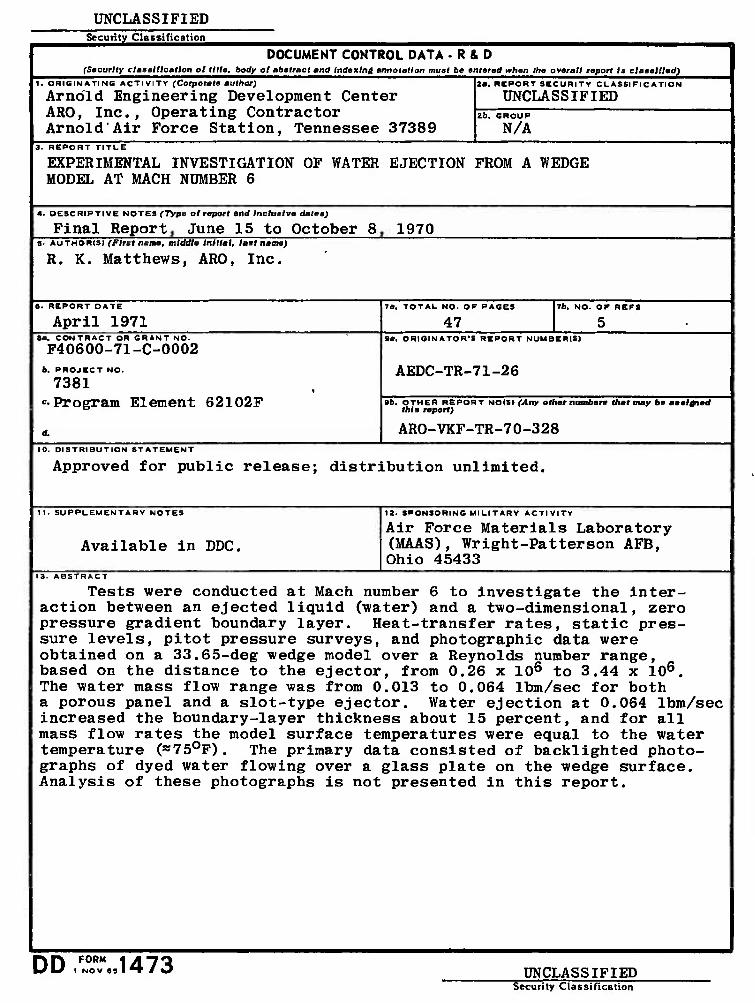
Tests were conducted at Mach number 6 to investigate the inter- action between an ejected liquid (water) and a two-dimensional, zero pressure gradient boundary layer. Heat-transfer rates, static pres- sure levels, pitot pressure surveys, and photographic data were obtained on a 33.65-deg wedge model over a Reynolds number range, based on the distance to the ejector, from 0.26 x 10⁶ to 3.44 x 10⁶. The water mass flow range was from 0.013 to 0.064 lbm/sec for both a porous panel and a slot-type ejector. Water ejection at 0.064 lbm/sec increased the boundary-layer thickness about 15 percent, and for all mass flow rates the model surface temperatures were equal to the water temperature («75°F). The primary data consisted of backlighted photo- graphs of dyed water flowing over a glass plate on the wedge surface. Analysis of these photographs is not presented in this report.
DD FORM ,1473 UNCLASSIFIED Security Classification
UNCLASSIFIED Security Classification
14. KEY WORDS
LINK A
ROLE WT
LINK B LINK C
ROLE
wedges
aerodynamic configurations
heat transfer
pressure
boundary layer
water injection
transpiration
cooling systems
UNCLASSIFIED Security Classification


![[ARO]Nursing Process](https://img.pdfslide.us/doc/110x75/551cedf74979595f198b464e/aronursing-process.jpg)