Embed Size (px)
Citation preview
5/11/2018 R Islam 2010 Jobless Growth Occasional_Paper - slidepdf.com
http://slidepdf.com/reader/full/r-islam-2010-jobless-growth-occasionalpaper 1/47
5/11/2018 R Islam 2010 Jobless Growth Occasional_Paper - slidepdf.com
http://slidepdf.com/reader/full/r-islam-2010-jobless-growth-occasionalpaper 2/47
5/11/2018 R Islam 2010 Jobless Growth Occasional_Paper - slidepdf.com
http://slidepdf.com/reader/full/r-islam-2010-jobless-growth-occasionalpaper 3/47
5/11/2018 R Islam 2010 Jobless Growth Occasional_Paper - slidepdf.com
http://slidepdf.com/reader/full/r-islam-2010-jobless-growth-occasionalpaper 4/47
5/11/2018 R Islam 2010 Jobless Growth Occasional_Paper - slidepdf.com
http://slidepdf.com/reader/full/r-islam-2010-jobless-growth-occasionalpaper 5/47
5/11/2018 R Islam 2010 Jobless Growth Occasional_Paper - slidepdf.com
http://slidepdf.com/reader/full/r-islam-2010-jobless-growth-occasionalpaper 6/47
5/11/2018 R Islam 2010 Jobless Growth Occasional_Paper - slidepdf.com
http://slidepdf.com/reader/full/r-islam-2010-jobless-growth-occasionalpaper 7/47
5/11/2018 R Islam 2010 Jobless Growth Occasional_Paper - slidepdf.com
http://slidepdf.com/reader/full/r-islam-2010-jobless-growth-occasionalpaper 8/47
5/11/2018 R Islam 2010 Jobless Growth Occasional_Paper - slidepdf.com
http://slidepdf.com/reader/full/r-islam-2010-jobless-growth-occasionalpaper 9/47
1 Introduction
The conventional view about poverty
reduction is that if a country attains a
sufficiently high rate of growth, it will take
care of poverty automatically. High rate of
economic growth is, of course, a necessary
condition for rapid poverty reduction on a
sustained basis. However, recent research has
demonstrated that this is not a sufficient
condition, and that the relationship between
economic growth and poverty reduction is not
invariant. Similar rates of economic growth
have been found to be associated with
different rates of poverty reduction. And one
of the variables that have been found to be
significant in explaining the variation in the
rate of poverty reduction is the employment
intensity of economic growth (Islam 2006a).
Recent research1 has also shown that theemployment intensity of economic growth in
many developing countries has been rather
low and declining despite the existence of
surplus labour. That has given rise to the
concern that many countries are experiencing
“jobless growth.” While the work mentioned
above has drawn the attention of the research
community to the issue of employment
intensity of economic growth, a number of related questions are also arising. The first
relates to the term jobless growth itself. Can
there be growth of output without the growth
of employment? Second, would not the
pursuit of employment intensive growth
result in a compromise with productivity and
efficiency? Third, how does one explain the
phenomenon of low and declining
employment intensity of growth and what are
the real constraints on employment growth?
The basic purpose of the present study is to
address these questions.
The study is organised as follows. Some
analytical and conceptual issues relating to
jobless growth and the possibility of
trade-off between employment and
productivity are discussed in Section 2. In
Section 3, cross-country data on economic
growth and employment growth are
examined in order to examine whethergrowth was indeed jobless. The issue of
possible trade-off between productivity and
employment growth is taken up in Section 4.
Constraints on the growth of employment
are examined in Section 5, and concluding
observations are made in Section 6.
*At the ILO, Ms Irmine Iroko provided valuable
assistance in compiling and processing data from
various sources, including UNIDO. During November
2009 and February 2010, the author was a Visiting
Research Scholar at the Bangladesh Institute of
Development Studies (BIDS). Research facilities made
available by the Institute is gratefully acknowledged.
Mr. Shanker C. Saha of the Institute assisted in
undertaking the regression exercise with data from the
Bangladesh Household Income and Expenditure
Survey. Ms. Nusaybah Yusuf also provided assistance
in compiling necessary data. Comments made by the
researchers of BIDS during seminars held there helped
shape up the present paper. The usual disclaimer
naturally applies.
1See, for example, Khan (2007) and the country studies
referred to in that report as well as ADB (2005).
5/11/2018 R Islam 2010 Jobless Growth Occasional_Paper - slidepdf.com
http://slidepdf.com/reader/full/r-islam-2010-jobless-growth-occasionalpaper 10/47
2
2 Conceptual and Analytical Issues
2.1 Interpreting the Notion of Jobless
Growth
Before the global economy went into
recession in 2008, healthy growth was
achieved for quite some years. And yet, the
employment situation did not improve in
many countries, especially in the developing
ones.2 Indeed, in some of them, employment
growth lagged far behind overall economic
growth rates.3 The phenomenon was
particularly noticeable in the formal sectors
of the economies. The term “jobless growth”
came back into currency in that context.4 But
several questions arise in that context. First,
what is meant by the term jobless growth? In
other words, can there at all be output growth
without any growth of jobs? Or, for that
matter, does jobless growth imply, in a literal
sense, output growth without any
employment growth? Second, from the point
of view of moving towards the goal of full
employment, is employment growth
irrespective of output growth a desirable
outcome? In other words, when one talks
about the desirability of job-rich (oremployment-intensive) growth what is really
meant? Some clarifications on these questions
may be useful before embarking on a
discussion in this important field.
While looking for a definition of the term
jobless growth, it is found that although the
term has been widely used, especially at the
level of international agencies, there is not
much by way of a carefully articulated
definition. One of the early uses of the termand some indication of a definition is found
in UNDP’s Human Development Report of
1993 (UNDP 1993) which says: “Many parts
of the world are witnessing a new
phenomenon— jobless growth. Even when
output increases, increase in employment lags
way behind” (p.36). From this description, it
appears that to the UNDP, jobless growth
means employment growth lagging
substantially behind output growth. AnotherUNDP report (UNDP 1996) uses low
employment growth relative to output growth
as an illustration of jobless growth. This kind
of definition has the problem that it does not
specify any quantitative indicator of how far
employment has to lag behind output growth
in order for growth to be called jobless.
2ILO's Global Employment Trends Brief 2006 noted
that there was an increase in unemployment in 2005
compared to 2001 although the global economy
achieved a growth of 4.3 per cent. Likewise, in 2006
also, robust economic growth failed to translate into
significant reductions in unemployment, and global
unemployment in 2006 was higher than in 2005. See
ILO (2006, 2007).
3Data in this regard will be presented in Section 3.
4It is difficult to say how and when this term came into
use in the literature on growth and development.However, it seems that the term "jobless recovery" was
being used in USA in the early 1990s to describe the
situation where the economy was emerging from
recovery and yet the labour market was not responding
by creating sufficient number of new jobs. Rifkin
(1996) pointed to the situation where human labour is
being systematically eliminated from the economic
process.
5/11/2018 R Islam 2010 Jobless Growth Occasional_Paper - slidepdf.com
http://slidepdf.com/reader/full/r-islam-2010-jobless-growth-occasionalpaper 11/47
Conceptual and Analytical Issues
ILO’s World Employment Report
2004-05 (ILO, 2005) talks about jobless
growth specifically in the context of
economic recovery in the USA from the
recession in 2001, and points out not only thelag with which employment growth followed
economic growth but also the sluggishness of
employment growth till 2004. This seems to
imply that the term jobless growth was used
in the same sense as the UNDP—to imply a
situation where employment growth was
much lower than output growth.
Of course, the term jobless growth can
be interpreted in other ways as well, forexample, by comparing employment growth
with that of labour force growth, and by
looking at the overall employment/
unemployment situation of a country in
relation to its economic growth rate. Using
this approach, Bhorat and Oosthuizen (2006)
suggested three different “tests” of jobless
growth: (i) positive economic growth
associated with zero or negative employment
growth; (ii) positive economic growth
associated with employment growth lagging
behind labour force growth and hence rising
unemployment; and (iii) positive output
growth associated with employment growth
below a “satisfactory level.” A comparison of
employment growth with that of labour force
is extremely important from the point of view
of policies and measures for moving towards
full employment; but it may be easy to pass
the test of non-zero and non-negative
employment growth, and yet employment
growth may be very slow compared to
economic growth. As for the second test,
employment growth could be less than the
growth of labour force even with positive
economic growth if growth is very low; and
in that kind of a situation, it is not simply low
employment growth but also low economic
growth itself that is the main problem. The
same observation would apply about the third
test if economic growth is low; even with a
“satisfactory” level of employment growth,the overall rate of employment may be
insufficient to achieve a significant
improvement in the employment situation or
prevent its deterioration. The upshot of this
discussion is that from the point of achieving
full employment, it would be important to
simultaneously achieve high rates of
economic as well as employment growth. The
point may be clarified by using a simple
diagram as in Figure 1 where a stylisedpicture of various possible combinations of
output and employment growth is presented.
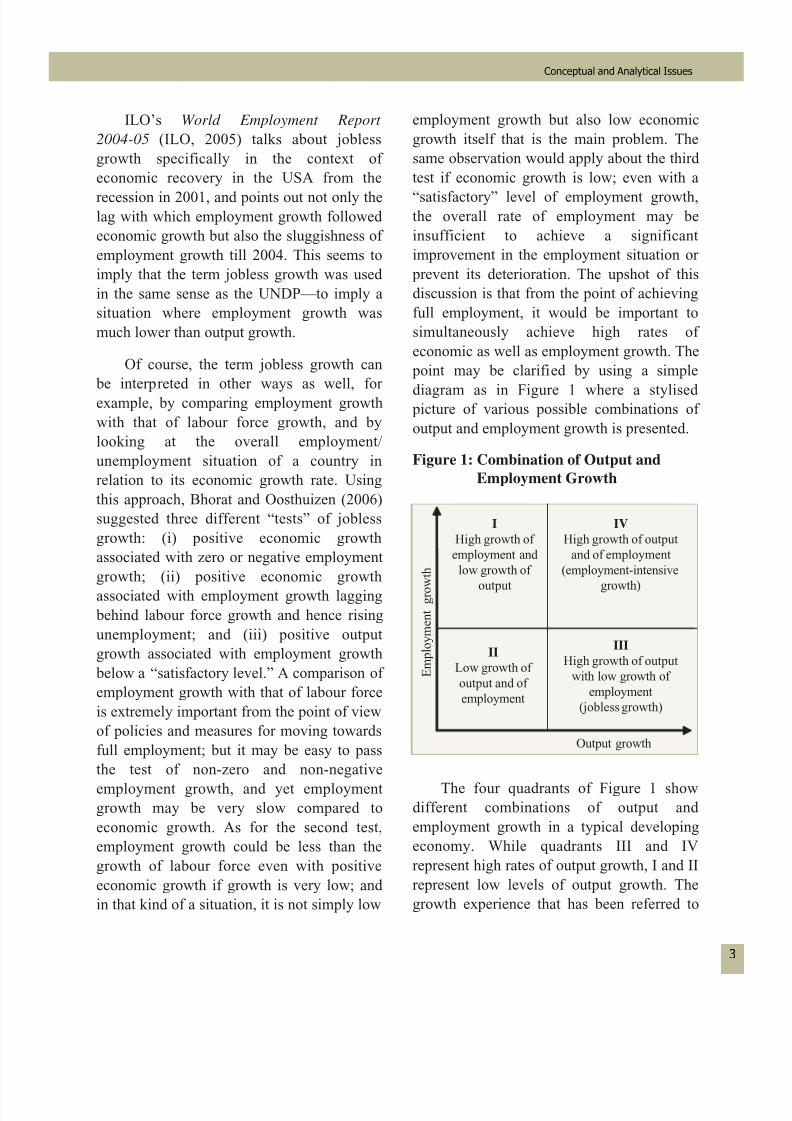
Figure 1: Combination of Output and
Employment Growth
The four quadrants of Figure 1 show
different combinations of output and
employment growth in a typical developing
economy. While quadrants III and IV
represent high rates of output growth, I and II
represent low levels of output growth. The
growth experience that has been referred to
E m p l o y m e n t g r o w t h
Output growth
I
High growth of
employment and
low growth of
output
IV
High growth of output
and of employment
(employment-intensive
growth)
III
High growth of output
with low growth of
employment
(jobless growth)
II
Low growth of
output and of
employment
5/11/2018 R Islam 2010 Jobless Growth Occasional_Paper - slidepdf.com
http://slidepdf.com/reader/full/r-islam-2010-jobless-growth-occasionalpaper 12/47
4
The Challenge of Jobless Growth in Developing Countries
above, viz., one of high output growth
accompanied by low growth of employment
growth, is represented by quadrant III. It may
be noted that observations in this quadrant
need not be literally on the x-axis denotingzero employment growth with positive and
high output growth. Observations inside the
quadrant also represent situations that are not
helpful from the point of view of achieving
full employment, and are perhaps being
referred to as indicating “jobless growth.”
On the other hand, it is conceivable to
find countries where despite low output
growth, employment growth may be high if employment is driven by a supply push and
people find jobs in low productivity activities
of a residual nature. Such a situation would
reflect distress and employment of last resort
where the alternative is unemployment and
starvation (in the absence of any social
protection measures). Quadrant I of Figure 1
could depict other types of situations, e.g.,
public sector enterprises creating jobs without
regard to output growth or even private
enterprises “hoarding labour” during a period
of economic downturn in the hope of a quick
recovery. In an empirical exercise involving
estimation of the elasticity of employment
growth with respect to output growth,
observations in quadrant I will demonstrate
high values. In such a situation, if
employment elasticity alone is used as an
indicator of whether growth in an economy
has been employment-intensive and hence
good from the point of view of achieving full
employment and accelerating poverty
reduction, it will provide misleading signals.
Quadrant IV represents situations where
high growth of employment goes together
with high growth of output. This naturally
would be the desirable outcome of economic
growth in situations where growth is expected
to be the means for achieving the goals of full
employment and rapid rate of poverty
reduction using the employment route. Hence,
from a policy point of view, the goal wouldhave to be to move a country towards
quadrant IV, wherever it is currently placed.
And when one talks about employment-
intensive (or job-rich) growth, it should be
interpreted as referring to a growth scenario
depicted in quadrant IV (not in quadrant I).
2.2 Employment-intensive Growth and
Labour Productivity
5
Mention has already been made above of
the inverse relationship between employment
elasticity and labour productivity which
implies the possibility of a trade-off between
employment growth and labour productivity.
In reality, however, this trade-off does not
have to be very serious. One can see this
easily if one remembers that in an accounting
framework, both the quantity of labour input
and labour productivity contribute to outputgrowth. Depending on the policies pursued, a
country may be able to achieve a balanced
contribution of both these elements towards
output growth. This proposition is explained
further below.
For an economy as a whole, output is
equal to the product of the labour force
employed and labour productivity. This can
be expressed through the following identity:
Y = L × Y/L, (1)
where Y and L stand respectively for output
and employment.
5The term labour productivity has been distinguished
by Khan (2002) from output per worker. In the present
paper, the term is used in the sense of output per
worker.
5/11/2018 R Islam 2010 Jobless Growth Occasional_Paper - slidepdf.com
http://slidepdf.com/reader/full/r-islam-2010-jobless-growth-occasionalpaper 13/47
Conceptual and Analytical Issues
For small changes, one can write the
above as
Y = L + (Y/L), (2)
where indicates growth rate.
Expression (2) implies that growth in
output is the sum of the growth of employed
labour force and growth of labour
productivity. Thus, both employment in
quantitative terms and labour productivity can
potentially contribute to output growth.
Indeed, if output growth is sufficiently high,
there could be scope for substantial increases
in both employment and productivity
growth.6 And that has been the experience of
East and South East Asian economies like
those of Rep of Korea, Taiwan, China,
Malaysia, and to a lesser extent in Indonesia
and Thailand (especially before they were hit
by the East Asian economic crisis in
1997-98).
6Equation (2) above which can be used for a
decomposition exercise basically provides anaccounting framework, and does not imply anything
about the existence or absence of an inter-linkage
between the two terms on the right hand side, viz.,
employment and labour productivity. These two are
obviously related; growth in labour productivity may
have an employment displacing as well as an
employment creating effect, and the net effect will
depend on the relative magnitudes of the two effects.
5/11/2018 R Islam 2010 Jobless Growth Occasional_Paper - slidepdf.com
http://slidepdf.com/reader/full/r-islam-2010-jobless-growth-occasionalpaper 14/47
6
3 Jobless Growth in the Developing World:Some Empirical Evidence
3.1. Employment and Output Growth in
Manufacturing Industries in
Developing Countries
It needs to be noted that employment growth
in developing countries cannot often be taken
as a reflection of labour demand because for a
variety of reasons employment growth may
reflect both demand and supply of labourforce. However, for the organised sectors,
e.g., manufacturing, employment would
perhaps reflect the demand side more closely
than overall employment, and hence it may
be more meaningful to look at the
relationship between employment and output
growth for such sectors. Figures 2a and 2b
present such data for selected developing
countries for two periods—1980s and 1990s.
The countries and the periods covered bythese figures are dictated by the availability
of data. However, these two figures bring out
interesting points concerning the relationship
between employment and output growth.
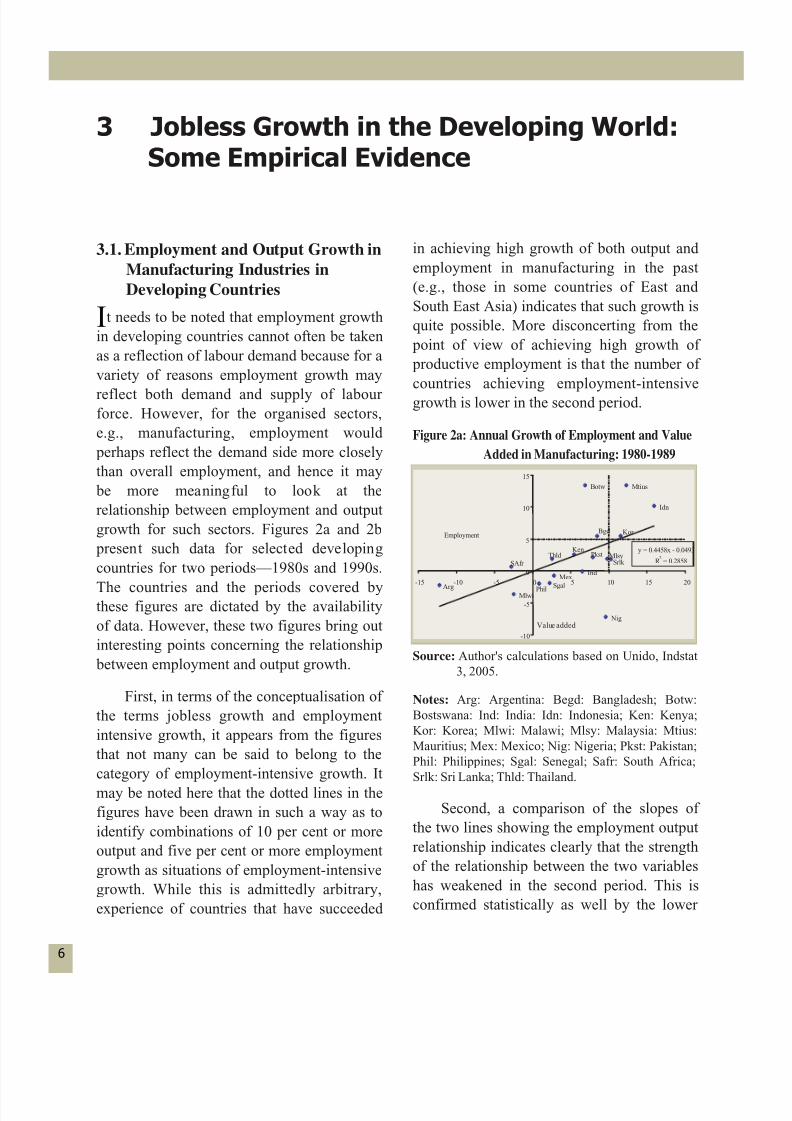
First, in terms of the conceptualisation of
the terms jobless growth and employment
intensive growth, it appears from the figures
that not many can be said to belong to the
category of employment-intensive growth. It
may be noted here that the dotted lines in the
figures have been drawn in such a way as to
identify combinations of 10 per cent or more
output and five per cent or more employment
growth as situations of employment-intensive
growth. While this is admittedly arbitrary,
experience of countries that have succeeded
in achieving high growth of both output and
employment in manufacturing in the past
(e.g., those in some countries of East and
South East Asia) indicates that such growth is
quite possible. More disconcerting from the
point of view of achieving high growth of
productive employment is that the number of
countries achieving employment-intensivegrowth is lower in the second period.
Figure 2a: Annual Growth of Employment and Value
Added in Manufacturing: 1980-1989
Source: Author's calculations based on Unido, Indstat
3, 2005.
Notes: Arg: Argentina: Begd: Bangladesh; Botw:
Bostswana: Ind: India: Idn: Indonesia; Ken: Kenya;
Kor: Korea; Mlwi: Malawi; Mlsy: Malaysia: Mtius:
Mauritius; Mex: Mexico; Nig: Nigeria; Pkst: Pakistan;
Phil: Philippines; Sgal: Senegal; Safr: South Africa;
Srlk: Sri Lanka; Thld: Thailand.
Second, a comparison of the slopes of
the two lines showing the employment output
relationship indicates clearly that the strength
of the relationship between the two variables
has weakened in the second period. This is
confirmed statistically as well by the lower
Mlwi
Nig
Phil Sgal
MexInd
Arg
SAfr
ThldKen
Pkst MlsySrlk
Bgd Kor
Botw Mtius
Idn
y = 0.4458x - 0.0493
R2
= 0.2858
-10
-5
0
5
10
15
-15 -10 -5 0 5 10 15 20
Value added
Employment
5/11/2018 R Islam 2010 Jobless Growth Occasional_Paper - slidepdf.com
http://slidepdf.com/reader/full/r-islam-2010-jobless-growth-occasionalpaper 15/47
Jobless Growth in the Developing World
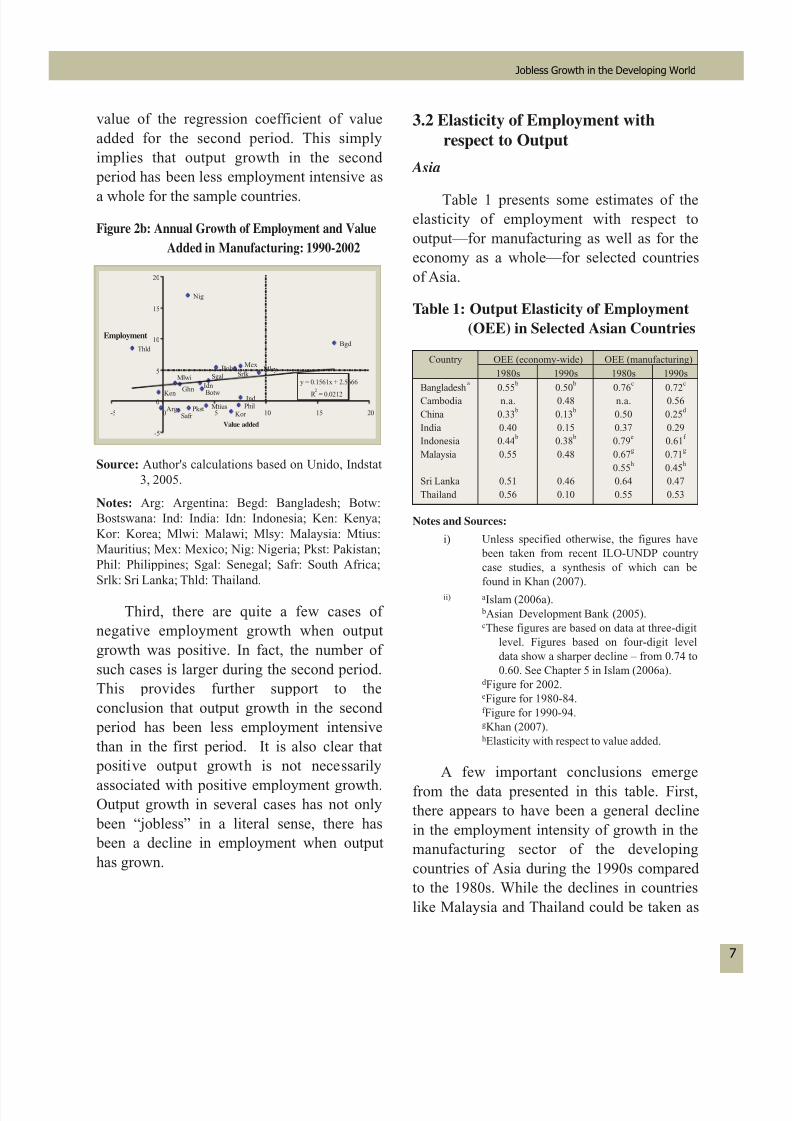
value of the regression coefficient of value
added for the second period. This simply
implies that output growth in the second
period has been less employment intensive as
a whole for the sample countries.
Figure 2b: Annual Growth of Employment and Value
Added in Manufacturing: 1990-2002
Source: Author's calculations based on Unido, Indstat
3, 2005.
Notes: Arg: Argentina: Begd: Bangladesh; Botw:
Bostswana: Ind: India: Idn: Indonesia; Ken: Kenya;
Kor: Korea; Mlwi: Malawi; Mlsy: Malaysia: Mtius:
Mauritius; Mex: Mexico; Nig: Nigeria; Pkst: Pakistan;
Phil: Philippines; Sgal: Senegal; Safr: South Africa;
Srlk: Sri Lanka; Thld: Thailand.
Third, there are quite a few cases of
negative employment growth when output
growth was positive. In fact, the number of
such cases is larger during the second period.
This provides further support to the
conclusion that output growth in the second
period has been less employment intensive
than in the first period. It is also clear that
positive output growth is not necessarily
associated with positive employment growth.Output growth in several cases has not only
been “jobless” in a literal sense, there has
been a decline in employment when output
has grown.
3.2 Elasticity of Employment with
respect to Output
Asia
Table 1 presents some estimates of the
elasticity of employment with respect to
output—for manufacturing as well as for the
economy as a whole—for selected countries
of Asia.
Table 1: Output Elasticity of Employment
(OEE) in Selected Asian Countries
Notes and Sources:
i) Unless specified otherwise, the figures have
been taken from recent ILO-UNDP country
case studies, a synthesis of which can be
found in Khan (2007).ii) aIslam (2006a).
bAsian Development Bank (2005).cThese figures are based on data at three-digit
level. Figures based on four-digit level
data show a sharper decline – from 0.74 to
0.60. See Chapter 5 in Islam (2006a).dFigure for 2002.eFigure for 1980-84.f Figure for 1990-94.gKhan (2007).hElasticity with respect to value added.
A few important conclusions emerge
from the data presented in this table. First,
there appears to have been a general decline
in the employment intensity of growth in the
manufacturing sector of the developing
countries of Asia during the 1990s compared
to the 1980s. While the declines in countries
like Malaysia and Thailand could be taken as
Nig
ThldBgd
BolvMex
Srlk Mlsy
Ken
Mlwi
Ghn
Idn
Botw
Sgal
Ind
ArgSafr
Pkst MtiusKor
Phil
y = 0.1561x + 2.5666
R2 = 0.0212
-5
0
5
10
15
20
-5 0 5 10 15 20
Value added
Employment
Bangladesh
a
Cambodia
China
India
Indonesia
Malaysia
Sri Lanka
Thailand
Country OEE (economy-wide) OEE (manufacturing)
1980s 1990s 1980s 1990s
0.55
b
n.a.
0.33b
0.40
0.44b
0.55
0.51
0.56
0.50
b
0.48
0.13b
0.15
0.38b
0.48
0.46
0.10
0.76
c
n.a.
0.50
0.37
0.79e
0.67g
0.55h
0.64
0.55
0.72
c
0.56
0.25d
0.29
0.61f
0.71g
0.45h
0.47
0.53
5/11/2018 R Islam 2010 Jobless Growth Occasional_Paper - slidepdf.com
http://slidepdf.com/reader/full/r-islam-2010-jobless-growth-occasionalpaper 16/47
8
The Challenge of Jobless Growth in Developing Countries
reflecting the tightening of their labour
markets, the same cannot be said about other
countries which are still characterised by
surplus labour. Second, during the 1980s, the
level of employment intensity inmanufacturing in some countries (e.g.,
Cambodia, China, and India) was rather low
in relation to their factor endowment. Indeed,
those levels appear quite conspicuous if
compared with the levels in Korea and
Malaysia during their early stages of
industrialisation when their economies still
had surplus labour. Third, the degree of
employment intensity seems to have declined
further from such low levels. Fourth,although for reasons mentioned earlier, we
prefer to look at employment elasticity
figures for the economy as a whole with more
caution, the figures presented in Table 1 tend
to go along the same line as those on
manufacturing. They generally point to a
trend towards falling employment intensity of
economic growth as a whole.
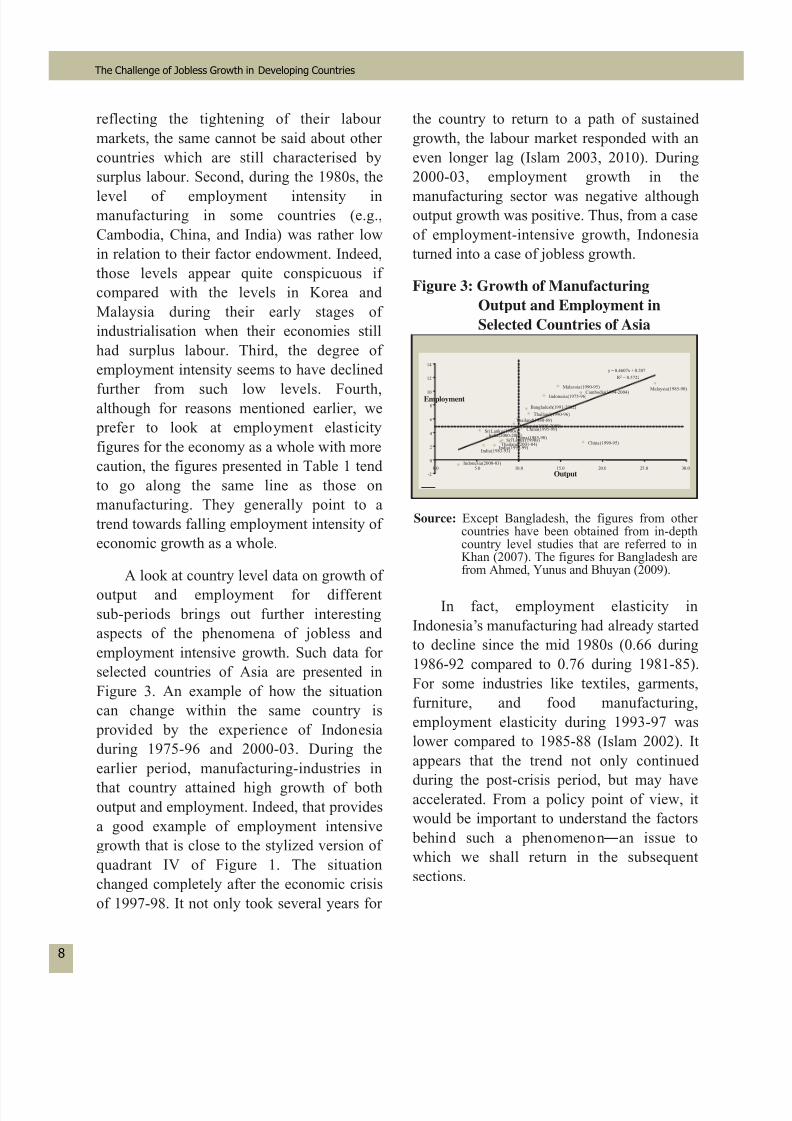
A look at country level data on growth of
output and employment for different
sub-periods brings out further interesting
aspects of the phenomena of jobless and
employment intensive growth. Such data for
selected countries of Asia are presented in
Figure 3. An example of how the situation
can change within the same country is
provided by the experience of Indonesia
during 1975-96 and 2000-03. During the
earlier period, manufacturing-industries in
that country attained high growth of both
output and employment. Indeed, that provides
a good example of employment intensive
growth that is close to the stylized version of
quadrant IV of Figure 1. The situation
changed completely after the economic crisis
of 1997-98. It not only took several years for
the country to return to a path of sustained
growth, the labour market responded with an
even longer lag (Islam 2003, 2010). During
2000-03, employment growth in the
manufacturing sector was negative althoughoutput growth was positive. Thus, from a case
of employment-intensive growth, Indonesia
turned into a case of jobless growth.
Figure 3: Growth of Manufacturing
Output and Employment in
Selected Countries of Asia
Source: Except Bangladesh, the figures from othercountries have been obtained from in-depthcountry level studies that are referred to inKhan (2007). The figures for Bangladesh arefrom Ahmed, Yunus and Bhuyan (2009).
In fact, employment elasticity in
Indonesia’s manufacturing had already started
to decline since the mid 1980s (0.66 during
1986-92 compared to 0.76 during 1981-85).
For some industries like textiles, garments,
furniture, and food manufacturing,
employment elasticity during 1993-97 was
lower compared to 1985-88 (Islam 2002). It
appears that the trend not only continued
during the post-crisis period, but may haveaccelerated. From a policy point of view, it
would be important to understand the factors
behind such a phenomenon —an issue to
which we shall return in the subsequent
sections.
Malaysia (1985-90)Malaysia (1990-95)
Cambodia (1994-2004)Indonesia (1975-96)
Bangladesh (1991-2002)
Thailand (1990-96)
Thailand (1980-89)
Malaysia (1995-2000)China (1995-99)Sri Lanka (1980s)
India (2000-2005)
India (1983-93)
Sri Lanka (1990s)China (1985-90)
Thailand (2001-04)India (1993-99)
China (1990-95)
Indonesia (2000-03)
y = 0.4607x + 0.207
R2 = 0.5722
-2
0
2
4
6
8
10
12
14
0.0 5.0 10.0 15.0 20.0 25.0 30.0
Output
Employment
5/11/2018 R Islam 2010 Jobless Growth Occasional_Paper - slidepdf.com
http://slidepdf.com/reader/full/r-islam-2010-jobless-growth-occasionalpaper 17/47
Jobless Growth in the Developing World
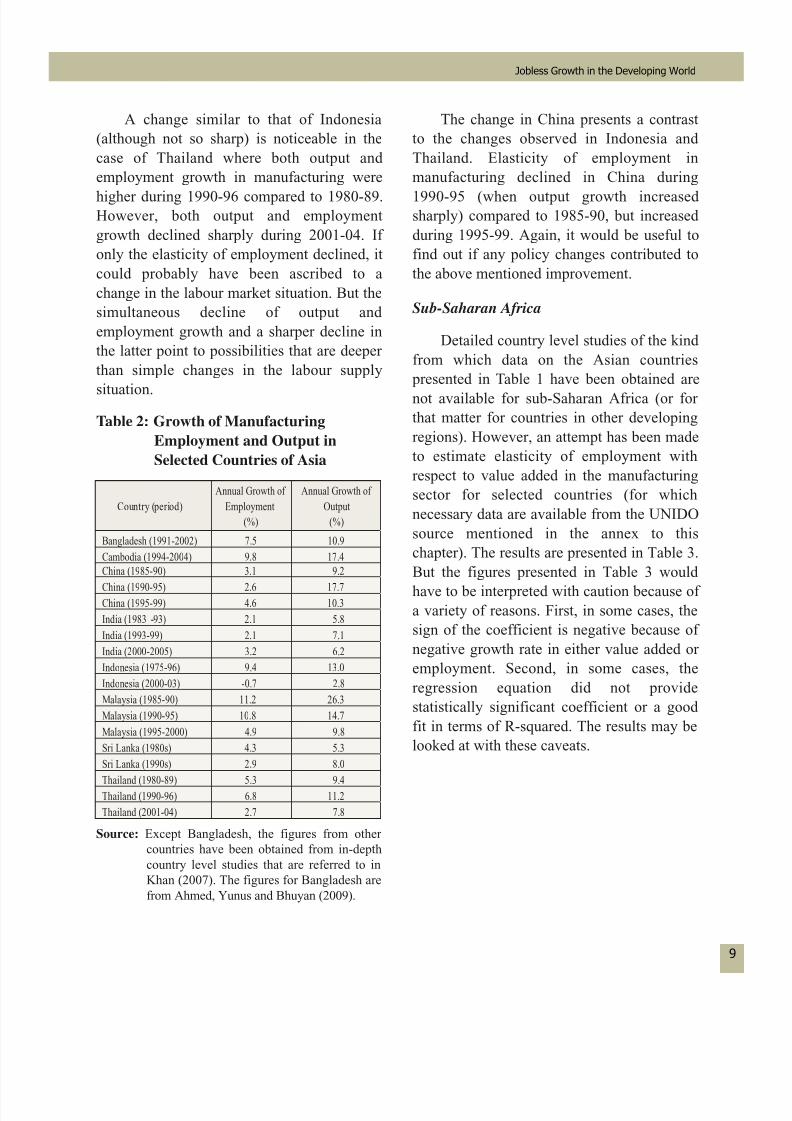
A change similar to that of Indonesia
(although not so sharp) is noticeable in the
case of Thailand where both output and
employment growth in manufacturing were
higher during 1990-96 compared to 1980-89.However, both output and employment
growth declined sharply during 2001-04. If
only the elasticity of employment declined, it
could probably have been ascribed to a
change in the labour market situation. But the
simultaneous decline of output and
employment growth and a sharper decline in
the latter point to possibilities that are deeper
than simple changes in the labour supply
situation.
Table 2: Growth of Manufacturing
Employment and Output in
Selected Countries of Asia
Source: Except Bangladesh, the figures from other
countries have been obtained from in-depth
country level studies that are referred to in
Khan (2007). The figures for Bangladesh are
from Ahmed, Yunus and Bhuyan (2009).
The change in China presents a contrast
to the changes observed in Indonesia and
Thailand. Elasticity of employment in
manufacturing declined in China during
1990-95 (when output growth increasedsharply) compared to 1985-90, but increased
during 1995-99. Again, it would be useful to
find out if any policy changes contributed to
the above mentioned improvement.
Sub-Saharan Africa
Detailed country level studies of the kind
from which data on the Asian countries
presented in Table 1 have been obtained are
not available for sub-Saharan Africa (or for
that matter for countries in other developing
regions). However, an attempt has been made
to estimate elasticity of employment with
respect to value added in the manufacturing
sector for selected countries (for which
necessary data are available from the UNIDO
source mentioned in the annex to this
chapter). The results are presented in Table 3.
But the figures presented in Table 3 would
have to be interpreted with caution because of a variety of reasons. First, in some cases, the
sign of the coefficient is negative because of
negative growth rate in either value added or
employment. Second, in some cases, the
regression equation did not provide
statistically significant coefficient or a good
fit in terms of R-squared. The results may be
looked at with these caveats.
Country (period)
Annual Growth of
Employment
(%)
Annual Growth of
Output
(%)
China (1985-90) 3.1 9.2
China (1990-95) 2.6 17.7China (1995-99) 4.6 10.3
India (1983 -93) 2.1 5.8
India (1993-99) 2.1 7.1
India (2000-2005) 3.2 6.2
Indonesia (1975-96) 9.4 13.0
Indonesia (2000-03) -0.7 2.8
Malaysia (1985-90) 11.2 26.3
Malaysia (1990-95) 10.8 14.7
Malaysia (1995-2000) 4.9 9.8
Sri Lanka (1980s) 4.3 5.3
Sri Lanka (1990s) 2.9 8.0
Thailand (1980-89) 5.3 9.4Thailand (1990-96) 6.8 11.2
Thailand (2001-04) 2.7 7.8
Bangladesh (1991-2002) 7.5 10.9
Cambodia (1994-2004) 9.8 17.4
5/11/2018 R Islam 2010 Jobless Growth Occasional_Paper - slidepdf.com
http://slidepdf.com/reader/full/r-islam-2010-jobless-growth-occasionalpaper 18/47
10
The Challenge of Jobless Growth in Developing Countries
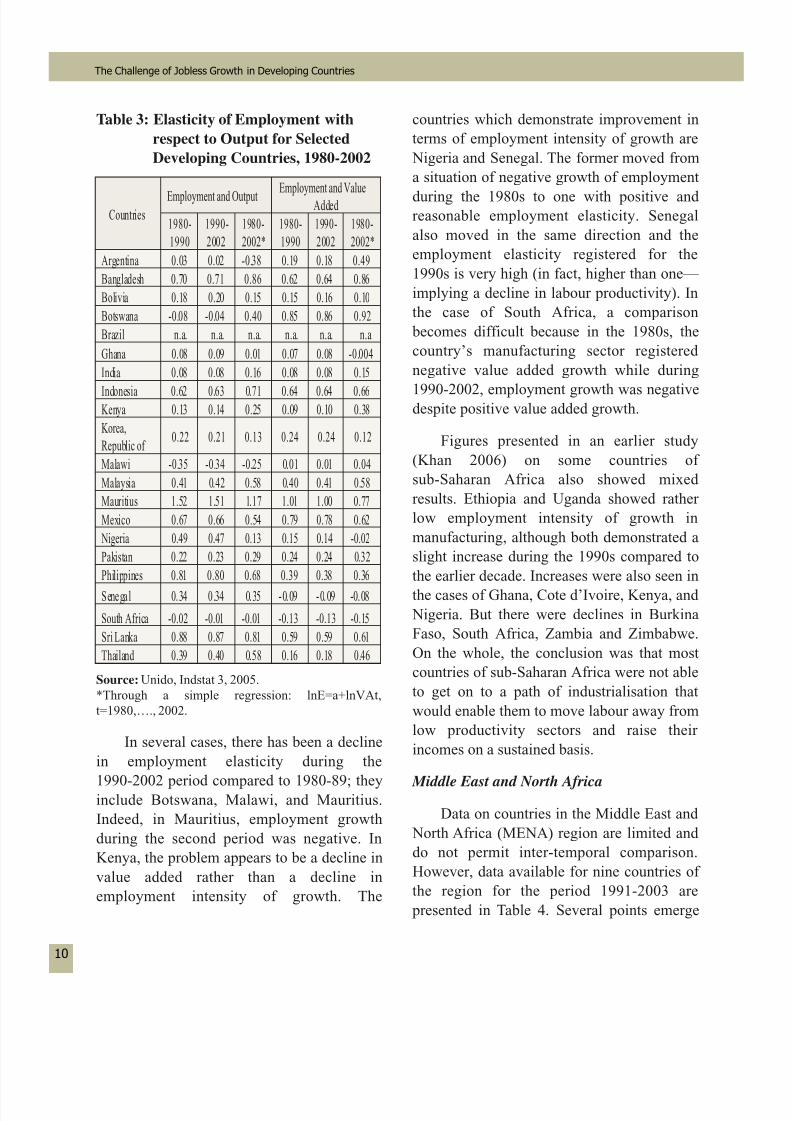
Table 3: Elasticity of Employment with
respect to Output for Selected
Developing Countries, 1980-2002
Source: Unido, Indstat 3, 2005.
*Through a simple regression: lnE=a+lnVAt,
t=1980,…., 2002.
In several cases, there has been a decline
in employment elasticity during the
1990-2002 period compared to 1980-89; theyinclude Botswana, Malawi, and Mauritius.
Indeed, in Mauritius, employment growth
during the second period was negative. In
Kenya, the problem appears to be a decline in
value added rather than a decline in
employment intensity of growth. The
countries which demonstrate improvement in
terms of employment intensity of growth are
Nigeria and Senegal. The former moved from
a situation of negative growth of employment
during the 1980s to one with positive andreasonable employment elasticity. Senegal
also moved in the same direction and the
employment elasticity registered for the
1990s is very high (in fact, higher than one—
implying a decline in labour productivity). In
the case of South Africa, a comparison
becomes difficult because in the 1980s, the
country’s manufacturing sector registered
negative value added growth while during
1990-2002, employment growth was negativedespite positive value added growth.
Figures presented in an earlier study
(Khan 2006) on some countries of
sub-Saharan Africa also showed mixed
results. Ethiopia and Uganda showed rather
low employment intensity of growth in
manufacturing, although both demonstrated a
slight increase during the 1990s compared to
the earlier decade. Increases were also seen in
the cases of Ghana, Cote d’Ivoire, Kenya, and
Nigeria. But there were declines in Burkina
Faso, South Africa, Zambia and Zimbabwe.
On the whole, the conclusion was that most
countries of sub-Saharan Africa were not able
to get on to a path of industrialisation that
would enable them to move labour away from
low productivity sectors and raise their
incomes on a sustained basis.
Middle East and North Africa
Data on countries in the Middle East and
North Africa (MENA) region are limited and
do not permit inter-temporal comparison.
However, data available for nine countries of
the region for the period 1991-2003 are
presented in Table 4. Several points emerge
Malaysia 0.41 0.42 0.58 0.40 0.41 0.58
Mauritius 1.52 1.51 1.17 1.01 1.00 0.77
Mexico 0.67 0.66 0.54 0.79 0.78 0.62
Nigeria 0.49 0.47 0.13 0.15 0.14 -0.02
Pakistan 0.22 0.23 0.29 0.24 0.24 0.32
Philippines 0.81 0.80 0.68 0.39 0.38 0.36
Senegal 0.34 0.34 0.35 -0.09 -0.09 -0.08
South Africa -0.02 -0.01 -0.01 -0.13 -0.13 -0.15
Sri Lanka 0.88 0.87 0.81 0.59 0.59 0.61
Thailand 0.39 0.40 0.58 0.16 0.18 0.46
CountriesEmployment and Output Employment and ValueAdded
1980-
1990
1990-
2002
1980-
2002*
1980-
1990
1990-
2002
1980-
2002*
Argentina 0.03 0.02 -0.38 0.19 0.18 0.49
Bangladesh 0.70 0.71 0.86 0.62 0.64 0.86
Bolivia 0.18 0.20 0.15 0.15 0.16 0.10
Botswana -0.08 -0.04 0.40 0.85 0.86 0.92
Brazil n.a. n.a. n.a. n.a. n.a. n.a
Ghana 0.08 0.09 0.01 0.07 0.08 -0.004
India 0.08 0.08 0.16 0.08 0.08 0.15
Indonesia 0.62 0.63 0.71 0.64 0.64 0.66Kenya 0.13 0.14 0.25 0.09 0.10 0.38
Korea,
Republic of 0.22 0.21 0.13 0.24 0.24 0.12
Malawi -0.35 -0.34 -0.25 0.01 0.01 0.04
5/11/2018 R Islam 2010 Jobless Growth Occasional_Paper - slidepdf.com
http://slidepdf.com/reader/full/r-islam-2010-jobless-growth-occasionalpaper 19/47
Jobless Growth in the Developing World
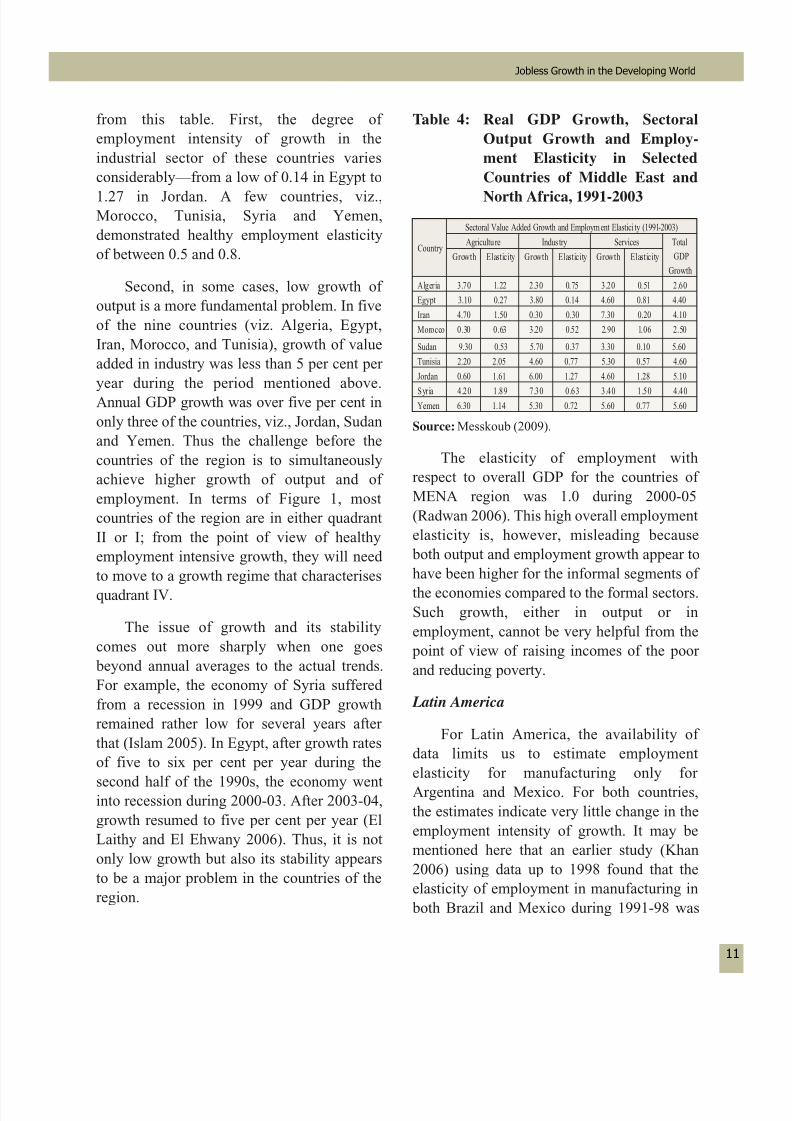
from this table. First, the degree of
employment intensity of growth in the
industrial sector of these countries varies
considerably—from a low of 0.14 in Egypt to
1.27 in Jordan. A few countries, viz.,Morocco, Tunisia, Syria and Yemen,
demonstrated healthy employment elasticity
of between 0.5 and 0.8.
Second, in some cases, low growth of
output is a more fundamental problem. In five
of the nine countries (viz. Algeria, Egypt,
Iran, Morocco, and Tunisia), growth of value
added in industry was less than 5 per cent per
year during the period mentioned above.
Annual GDP growth was over five per cent in
only three of the countries, viz., Jordan, Sudan
and Yemen. Thus the challenge before the
countries of the region is to simultaneously
achieve higher growth of output and of
employment. In terms of Figure 1, most
countries of the region are in either quadrant
II or I; from the point of view of healthy
employment intensive growth, they will need
to move to a growth regime that characterises
quadrant IV.
The issue of growth and its stability
comes out more sharply when one goes
beyond annual averages to the actual trends.
For example, the economy of Syria suffered
from a recession in 1999 and GDP growth
remained rather low for several years after
that (Islam 2005). In Egypt, after growth rates
of five to six per cent per year during the
second half of the 1990s, the economy wentinto recession during 2000-03. After 2003-04,
growth resumed to five per cent per year (El
Laithy and El Ehwany 2006). Thus, it is not
only low growth but also its stability appears
to be a major problem in the countries of the
region.
Table 4: Real GDP Growth, Sectoral
Output Growth and Employ-
ment Elasticity in Selected
Countries of Middle East and
North Africa, 1991-2003
Source: Messkoub (2009).
The elasticity of employment with
respect to overall GDP for the countries of
MENA region was 1.0 during 2000-05
(Radwan 2006). This high overall employment
elasticity is, however, misleading because
both output and employment growth appear to
have been higher for the informal segments of
the economies compared to the formal sectors.
Such growth, either in output or in
employment, cannot be very helpful from the
point of view of raising incomes of the poor
and reducing poverty.
Latin America
For Latin America, the availability of
data limits us to estimate employment
elasticity for manufacturing only for
Argentina and Mexico. For both countries,
the estimates indicate very little change in the
employment intensity of growth. It may be
mentioned here that an earlier study (Khan
2006) using data up to 1998 found that the
elasticity of employment in manufacturing in
both Brazil and Mexico during 1991-98 was
Country
Sectoral Value Added Growth and Employment Elasticity (1991-2003)
Agriculture Indus try Services Total
GDP
Growth
Growth Elasticity Growth Elasticity Growth Elasticity
Algeria 3.70 1.22 2.30 0.75 3.20 0.51 2.60
Egypt 3.10 0.27 3.80 0.14 4.60 0.81 4.40
Iran 4.70 1.50 0.30 0.30 7.30 0.20 4.10
Morocco 0.30 0.63 3.20 0.52 2.90 1.06 2.50
Sudan 9.30 0.53 5.70 0.37 3.30 0.10 5.60
Tunisia 2.20 2.05 4.60 0.77 5.30 0.57 4.60
Jordan 0.60 1.61 6.00 1.27 4.60 1.28 5.10
Syria 4.20 1.89 7.30 0.63 3.40 1.50 4.40Yemen 6.30 1.14 5.30 0.72 5.60 0.77 5.60
5/11/2018 R Islam 2010 Jobless Growth Occasional_Paper - slidepdf.com
http://slidepdf.com/reader/full/r-islam-2010-jobless-growth-occasionalpaper 20/47
12
The Challenge of Jobless Growth in Developing Countries
lower than during 1981-90. It thus appears
that there has been a reversal from the trend
observed earlier.
Summing up
A few observations may be made by way
of summing up the findings and discussions
of the present section. First, there is a clear
trend towards declining employment outcome
of output growth, although there are
exceptions (in terms of countries as well as
periods within countries). Second, there are
countries whose growth experience changed
from employment intensive to jobless type.
Third, there is at least one case (viz., China)
of a change in the opposite direction. Fourth,
there are countries that are characterised by
high elasticity of employment with respect to
output, but growth is dominated by theinformal sector. So, mere high elasticity of
employment should not be the goal of
policies for achieving full employment; the
type and quality of employment are important
considerations. High elasticity of employment
can be achieved with a regime of low and
unstable output growth. In such cases, the
goal should be to move towards a regime of
high growth of output associated with high
employment growth.
5/11/2018 R Islam 2010 Jobless Growth Occasional_Paper - slidepdf.com
http://slidepdf.com/reader/full/r-islam-2010-jobless-growth-occasionalpaper 21/47
4 Contribution of Labour Productivity andEmployment to Output Growth
From the point of view of the impact of the
pattern of growth on employment and the
possibility of a trade-off between productivity
and employment, it is important to identify
the relative contribution of labour
productivity and the quantity of labour input
to output growth. Here, we shall do that for
selected countries of Asia, with a particular
focus on possible difference between East andSouth East Asian (ESEA) countries on the
one hand and the countries of South Asia on
the other. The reason for taking this
comparative perspective is that the former
group of countries is by now regarded as
having been more successful in achieving
more employment-intensive growth
compared to the countries of South Asia.
The pattern of economic growth that
unfolded in the countries of ESEA has been
widely debated. But that debate focused
mainly on the relative contribution of capital
accumulation and total factor productivity
(the latter being used as an indicator
disembodied technological progress) in
explaining the impressive growth
performance of those countries. While the
well-known World Bank study of 1993
(World Bank 1993) argued that East Asia’s
superior economic performance was mainlycaused by rapid technological progress, there
are many (especially, Kim and Lau 1994,
Krugman 1994, and Young 1995) who
challenged this view and argued (on the basis
of alternative empirical analysis) that the
contribution of total factor productivity (TFP)
7Khan (2002) appears to take the view that TFP was an
important source of growth for the countries of East Asia.
Helpman (2004) makes the point that there is a problem
of interpreting causality in the TFP estimates because
high investment rates are at least partly in response to
high productivity growth. And that would further weaken
the position taken by Krugman and others.
growth to East Asia’s labour productivity
growth has been relatively small.7
Storm and Naastepad (2005) undertook a
decomposition exercise of output growth into
productivity and employment growth for
some countries of the ESEA region and came
to the conclusion that “labour productivity
growth has been the major source of East
Asian per capita income growth” (p.1062).
However, in an empirical analysis (using
cross-country data on 24 developing
countries) of the relationship between labour
productivity growth and employment growth,
they find East Asian countries to be
“outliers.” And on the basis of that, they
conclude that “East Asia managed to escape
the trade-off between labour productivity
growth and employment growth.” The
apparent contradiction between these two sets
of findings could probably be explained by
the employment creating effect of labour
productivity growth exceeding the
employment displacing effect. Be that as it
may, it appears from Storm and Naastepad
(2005) that the pattern of growth in East Asia
enabled them to combine high growth of
employment and productivity. How do the
countries of South Asia compare with those
of ESEA in this respect?
5/11/2018 R Islam 2010 Jobless Growth Occasional_Paper - slidepdf.com
http://slidepdf.com/reader/full/r-islam-2010-jobless-growth-occasionalpaper 22/47
14
The Challenge of Jobless Growth in Developing Countries
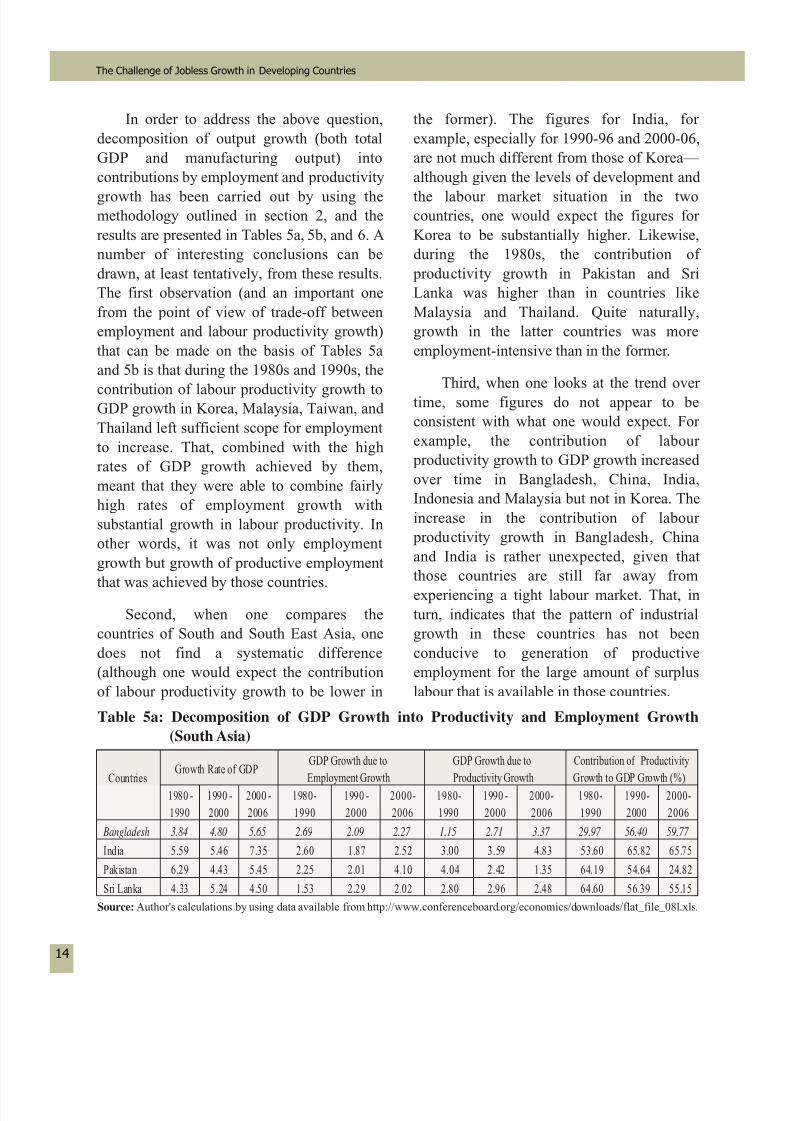
In order to address the above question,
decomposition of output growth (both total
GDP and manufacturing output) into
contributions by employment and productivity
growth has been carried out by using themethodology outlined in section 2, and the
results are presented in Tables 5a, 5b, and 6. A
number of interesting conclusions can be
drawn, at least tentatively, from these results.
The first observation (and an important one
from the point of view of trade-off between
employment and labour productivity growth)
that can be made on the basis of Tables 5a
and 5b is that during the 1980s and 1990s, the
contribution of labour productivity growth toGDP growth in Korea, Malaysia, Taiwan, and
Thailand left sufficient scope for employment
to increase. That, combined with the high
rates of GDP growth achieved by them,
meant that they were able to combine fairly
high rates of employment growth with
substantial growth in labour productivity. In
other words, it was not only employment
growth but growth of productive employment
that was achieved by those countries.
Second, when one compares the
countries of South and South East Asia, one
does not find a systematic difference
(although one would expect the contribution
of labour productivity growth to be lower in
the former). The figures for India, for
example, especially for 1990-96 and 2000-06,
are not much different from those of Korea—
although given the levels of development and
the labour market situation in the twocountries, one would expect the figures for
Korea to be substantially higher. Likewise,
during the 1980s, the contribution of
productivity growth in Pakistan and Sri
Lanka was higher than in countries like
Malaysia and Thailand. Quite naturally,
growth in the latter countries was more
employment-intensive than in the former.
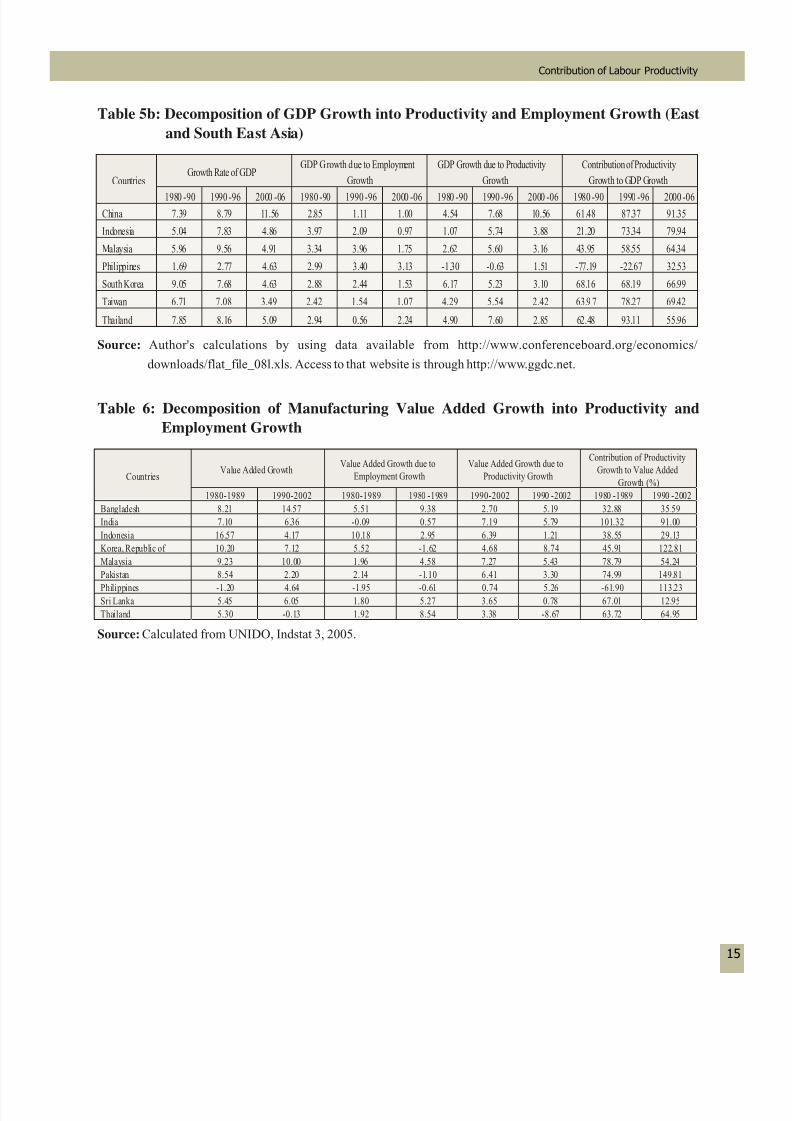
Third, when one looks at the trend over
time, some figures do not appear to be
consistent with what one would expect. For
example, the contribution of labour
productivity growth to GDP growth increased
over time in Bangladesh, China, India,
Indonesia and Malaysia but not in Korea. The
increase in the contribution of labour
productivity growth in Bangladesh, China
and India is rather unexpected, given that
those countries are still far away from
experiencing a tight labour market. That, in
turn, indicates that the pattern of industrial
growth in these countries has not been
conducive to generation of productive
employment for the large amount of surplus
labour that is available in those countries.
Countries
Growth Rate of GDPGDP Growth due to
Employment Growth
GDP Growth due to
Productivity Growth
Contribution of Productivity
Growth to GDP Growth (%)1980 -
1990
1990 -
2000
2000 -
2006
1980-
1990
1990 -
2000
2000-
2006
1980-
1990
1990 -
2000
2000-
2006
1980-
1990
1990-
2000
2000-
2006
Bangladesh 3.84 4.80 5.65 2.69 2.09 2.27 1.15 2.71 3.37 29.97 56.40 59.77
India 5.59 5.46 7.35 2.60 1.87 2.52 3.00 3.59 4.83 53.60 65.82 65.75
Pakistan 6.29 4.43 5.45 2.25 2.01 4.10 4.04 2.42 1.35 64.19 54.64 24.82
Sri Lanka 4.33 5.24 4.50 1.53 2.29 2.02 2.80 2.96 2.48 64.60 56.39 55.15
Table 5a: Decomposition of GDP Growth into Productivity and Employment Growth
(South Asia)
Source: Author's calculations by using data available from http://www.conferenceboard.org/economics/downloads/flat_file_08l.xls.
5/11/2018 R Islam 2010 Jobless Growth Occasional_Paper - slidepdf.com
http://slidepdf.com/reader/full/r-islam-2010-jobless-growth-occasionalpaper 23/47
Contribution of Labour Productivity
Table 5b: Decomposition of GDP Growth into Productivity and Employment Growth (East
and South East Asia)
Source: Author's calculations by using data available from http://www.conferenceboard.org/economics/
downloads/flat_file_08l.xls. Access to that website is through http://www.ggdc.net.
Table 6: Decomposition of Manufacturing Value Added Growth into Productivity and
Employment Growth
Source: Calculated from UNIDO, Indstat 3, 2005.
CountriesGrowth Rate of GDP
GDP Growth due to Employment
Growth
GDP Growth due to Productivity
Growth
Contribution of Productivity
Growth to GDP Growth
1980 -90 1990 -96 2000 -06 1980 -90 1990 -96 2000 -06 1980 -90 1990 -96 2000 -06 1980 -90 1990 -96 2000 -06
China 7.39 8.79 11.56 2.85 1.11 1.00 4.54 7.68 10.56 61.48 87.37 91.35
Indonesia 5.04 7.83 4.86 3.97 2.09 0.97 1.07 5.74 3.88 21.20 73.34 79.94
Malaysia 5.96 9.56 4.91 3.34 3.96 1.75 2.62 5.60 3.16 43.95 58.55 64.34
Philippines 1.69 2.77 4.63 2.99 3.40 3.13 -1.30 -0.63 1.51 -77.19 -22.67 32.53
South Korea 9.05 7.68 4.63 2.88 2.44 1.53 6.17 5.23 3.10 68.16 68.19 66.99
Taiwan 6.71 7.08 3.49 2.42 1.54 1.07 4.29 5.54 2.42 63.9 7 78.27 69.42
Thailand 7.85 8.16 5.09 2.94 0.56 2.24 4.90 7.60 2.85 62.48 93.11 55.96
CountriesValue Added Growth
Value Added Growth due to
Employment Growth
Value Added Growth due to
Productivity Growth
Contribution of Productivity
Growth to Value Added
Growth (%)
1980-1989 1990-2002 1980-1989 1980 -1989 1990-2002 1990 -2002 1980 -1989 1990 -2002
Bangladesh 8.21 14.57 5.51 9.38 2.70 5.19 32.88 35.59
India 7.10 6.36 -0.09 0.57 7.19 5.79 101.32 91.00
Indonesia 16.57 4.17 10.18 2.95 6.39 1.21 38.55 29.13
Korea, Republic of 10.20 7.12 5.52 -1.62 4.68 8.74 45.91 122.81
Malaysia 9.23 10.00 1.96 4.58 7.27 5.43 78.79 54.24
Pakistan 8.54 2.20 2.14 -1.10 6.41 3.30 74.99 149.81
Philippines -1.20 4.64 -1.95 -0.61 0.74 5.26 -61.90 113.23Sri Lanka 5.45 6.05 1.80 5.27 3.65 0.78 67.01 12.95
Thailand 5.30 -0.13 1.92 8.54 3.38 -8.67 63.72 64.95
5/11/2018 R Islam 2010 Jobless Growth Occasional_Paper - slidepdf.com
http://slidepdf.com/reader/full/r-islam-2010-jobless-growth-occasionalpaper 24/47
16
5 Constraints on Employment Growth andthe Pattern of Growth
5.1 The Basic Premise and the
Framework
The notion of employment growth is often
treated as synonymous with employment
creation, especially by the government,
through special programmes. As a result, it
gets associated with the perception of
welfare. It needs to be recognised, however,
that employment growth can play an
important role in shaping up the pattern of
income distribution and effective demand,
which, in turn, can be important from the
point of view of sustaining economic growth.8
Hence, the present study does not regard
employment growth simply as a welfare
proposition, and as synonymous with
employment creation, although employment
programmes by governments should not be
ruled out as a means of enhancing
employment growth.9 It is concerned with
growth of employment that is associated with
that of output.
From the point of view of using
employment as a route to poverty reduction
and a mechanism for improving (or at least,
preventing a worsening of) the distribution of
income, the goal would be to achieve highrates of both output and employment growth.
However, the recent experience with
economic growth in many developing
countries shows (ref Section 3 of the present
paper) that high rate of output growth may be
associated with different rates of employment
growth. From the point of view of
employment policy, it would, therefore, be
important to identify the factors that constrainemployment growth when output is growing
at high (or reasonably high) rate.
The framework of employment growth
that is linked to output growth would involve
recognising the key elements that
determine/influence the employment outcome
associated with output growth. The broad
elements are: (i) growth of output, (ii) labour
market policies and institutions, (iii) the
sector and sub-sector composition of output,and (iv) technology used. In any particular
situation, there could be a variety of factors
hindering employment growth; and policy
interventions may not be able to focus
simultaneously on all of them. From that
point of view, it may be useful to narrow
them down to a small number (say, two or
three) that may be the “binding constraints,”10
and gear policies towards addressing them
effectively rather than diluting efforts invarious directions.
8Indeed, employment itself is an important
macroeconomic variable, especially in the Keynesian
framework.
9Such programmes can play an important role in
sustaining effective demand in low-income economies.
10The term "binding constraints" has been used by
Hausman, Rodrik and Velasco (2005) in the context of
identifying constraints on output growth. More on this
will be said shortly.
5/11/2018 R Islam 2010 Jobless Growth Occasional_Paper - slidepdf.com
http://slidepdf.com/reader/full/r-islam-2010-jobless-growth-occasionalpaper 25/47
Constraints on Employment Growth
Growth of output
That employment growth would be
influenced by the growth of output is to say
the obvious. A good deal of work has beenundertaken to identify the constraints on
output growth. One line of work—referred to
as the “growth diagnostics” analysis, à la
Hausmann, Rodrik and Velasco, 2005—tries
to identify what are called “binding
constraints” on growth. The other line which
tries to link employment to output (e.g., Heintz
2006) categorises the constraints broadly as
“demand constraint” and “capital constraint.”
The basic idea behind the diagnostic approach
outlined by Hausmann, Rodrik and Velasco
(viz. Identifying the distortion whose removal
would give the highest marginal welfare
benefit) may be useful in the context of
identifying constraints on employment growth.
But in examining the role of the growth factor
in employment growth, it would be important
to relax the assumption of constant labour
productivity. Output growth is the sum of thegrowth of labour productivity and of
employment. Hence, from the point of view of
raising employment growth, the division of
output growth between productivity and
employment growth would be critical (ref.
Section 2 above). And it would be necessary to
understand the factors that can help achieve an
optimum combination of productivity and
employment growth. It may be noted here that
the assumption of constant labour productivity
is not realistic for economies with
unemployment and underemployment. The
experience of the East and South East Asian
countries demonstrates that high rates of
economic growth may be associated with a
good mix of labour productivity and
employment growth11 (although there is
controversy as to how much of the growth can
be ascribed to total factor productivity and
how much to mere increases in inputs).
Labour market policies and institutions
According to the standard neoclassical
theory, output growth is supposed to lead to
employment growth, and interventions in the
labour market, e.g., through labour laws, trade
unions, or minimum wages, distort the labour
market and prevent it from producing the
optimal outcome in terms of employment. It isargued on the basis of that theory that
employment growth, especially in developing
countries, is constrained by restrictive labour
laws and trade union interventions that create
rigidities in the labour market. However, the
debate on this issue is far from settled; and
available evidence does not lend support to
this hypothesis. For example, it remains to be
established whether greater flexibility in the
labour markets does indeed result in higher
employment growth.
There are studies pointing out that labour
market institutions do not necessarily hinder
the growth of employment (Auer and Islam
2006, Kapsos 2005, Bean 1994, Forteza and
Rama 2002, Nickel 1997, for example). On
Europe, a widely cited article by Bean (1994)
argues that the available evidence do not showthat the existence of generous unemployment
benefits was the cause of persistent
unemployment. Nickel (1997:72) also shows11Section 4 above presented a comparative decomposition
exercise showing the contribution of productivity and
employment growth in overall and manufacturing output growth
for selected countries of East and South East Asia on the one
hand and South Asia on the other.
5/11/2018 R Islam 2010 Jobless Growth Occasional_Paper - slidepdf.com
http://slidepdf.com/reader/full/r-islam-2010-jobless-growth-occasionalpaper 26/47
18
The Challenge of Jobless Growth in Developing Countries
that all types of labour market rigidities do not
have an adverse effect on unemployment rates.
He concludes:
Labour market rigidities that do notappear to have serious implications for
average levels of unemployment include the
following: 1) strict employment protection
legislation and general legislation on labour
market standards; 2) generous levels of
unemployment benefits, so long as these are
accompanied by pressures on the unemployed
to take jobs by, for example, fixing the
duration of benefit and providing resources to
raise the ability/willingness of the unemployedto take jobs; and 3) high levels of unionisation
and union coverage, so long as they are offset
by high levels of coordination in wage
bargaining, particularly among employers.
A study by Forteza and Rama (2002)
covering 119 countries (i.e. both developed
and developing) shows that minimum wages
and mandated benefits do not hinder economic
growth. They argue that curtailing social
security benefits might not contribute much toeconomic performance. An econometric
exercise undertaken by Kapsos (2005)
demonstrates that rigidities in the labour
market do not have a negative effect on
employment elasticity. In his cross- section
analysis with data from 100 countries, he uses
the World Bank’s “employment rigidity index”
(which is the average of three indices, viz.,
difficulty of hiring, difficulty of firing, and
rigidity of hours) and finds that there is nostatistically significant relation between
employment elasticity and employment
rigidity index. Moreover, the sign of the
coefficient is not in the expected direction.
What, then, constrains employment
growth?
Technology
In response to the above question, one
may be tempted to cite the choice of
technology to be the major factor. Indeed, oncethe product composition of a country is
determined, the employment outcome would
depend, to a large extent, on the technology
that is used in producing the given products.
Premature capital deepening and the adoption
of technology that is not in line with the factor
endowment of a particular country could be a
cause of slow employment growth. But the
choice of technology may be limited due to a
variety of reasons. First, the shelf of availabletechnologies may indeed be limited. Second,
even when there is a choice, there may be a
tendency towards the use of the most modern
(which often is the most capital-intensive)
technology. This may, of course, be justified
from the point of competitiveness and
efficiency which are important considerations
in the current environment of growing
globalisation and liberalisation. In such an
environment, producers may try to use the best
available technology, irrespective of whether
the product is intended for the domestic or the
external market. However, even within such an
environment, some choice of alternatives may
be available. And whether the choice would be
exercised would depend on a variety of
factors, e.g., relative factor prices, access to
the entire shelf of available technologies, level
of skills, management, etc. It would, therefore,
be important to examine the availability of
alternative technologies as well as factors that
influence decisions concerning the type of
technology that is used.
The pattern of growth
In the circumstances mentioned above,
the search for factors responsible for slow
5/11/2018 R Islam 2010 Jobless Growth Occasional_Paper - slidepdf.com
http://slidepdf.com/reader/full/r-islam-2010-jobless-growth-occasionalpaper 27/47
Constraints on Employment Growth
employment growth may lead one back to
output growth. It has been demonstrated
earlier that similar output growth can be
obtained through different combinations of
employment and labour productivity growth.The particular combination that would prevail
in a particular country would depend on a
variety of factors which in turn are influenced
by the overall development strategy pursued
by the country. If a country with surplus labour
consciously pursues a development strategy
that focuses on optimal utilisation of its
abundant factor (viz., labour), that may be
reflected in the relative contribution of
employment and labour productivity growth tooverall growth of output. This was already
examined in section 4 of the present paper, and
it was found that the pattern of growth is
indeed important from the point of view of the
employment outcome of growth. One
particular element in the pattern of growth is
the sector and sub-sector composition of
output.
Sector and sub-sector composition of output
Studies that have attempted to identify the
binding constraints on employment growth
(e.g., Heintz 2006) remain limited to linking
aggregate employment to total output, and do
not take into account the possibility of a
variation in the employment outcome that may
result from a variation in product-mix. Total
demand may be an important constraint on the
growth of output. But the pattern of demand is
important in shaping up the pattern of growth,which, in turn, can influence the employment
outcome of growth. In fact, the product-mix
(or sector-composition) of an economy is also
linked to demand, but the pattern of demand
and income elasticity of demand for various
products are important here. And that brings
one to the consideration of the composition of
output.
As indicated above, the amount of
employment associated with a given amountof output would be influenced by what is
being produced. Recent research (e.g., Islam
2006a, Auer and Islam 2006, Islam 2010)
argues that the overall employment intensity
of output growth would depend on the sector
composition of output. At the level of broad
sectors of an economy, manufacturing,
construction and services usually demonstrate
higher employment elasticity compared to
sectors like agriculture, mining, utilities, etc.In the Kaldorian framework, manufacturing
should serve as the engine of growth, and it is
high growth in that sector (in relation to
sectors like agriculture) that helps an economy
move on to increasingly higher growth path
and creates conditions for a gradual transfer of
labour away from low productivity activities.
It needs to be noted, however, that growth of
manufacturing would not automatically enable
an economy to absorb surplus labour from the
traditional sectors; the sub-sector composition
of manufacturing would also be important in
that regard. At the initial stages of
development, higher growth of labour-
intensive industries is essential from the point
of view of transferring labour to higher
productivity activities. In that context, it may
be useful to look at the experience of Asian
developing countries. Data presented in Tables
7 and 8 are intended to throw some light on
the issue of sector and sub-sector composition
of growth. In order to examine the Kaldorian
issue of the role of the manufacturing sector in
overall economic growth, data on growth of
GDP and of manufacturing output for selected
countries of Asia are presented in Table 7.
5/11/2018 R Islam 2010 Jobless Growth Occasional_Paper - slidepdf.com
http://slidepdf.com/reader/full/r-islam-2010-jobless-growth-occasionalpaper 28/47
20
The Challenge of Jobless Growth in Developing Countries
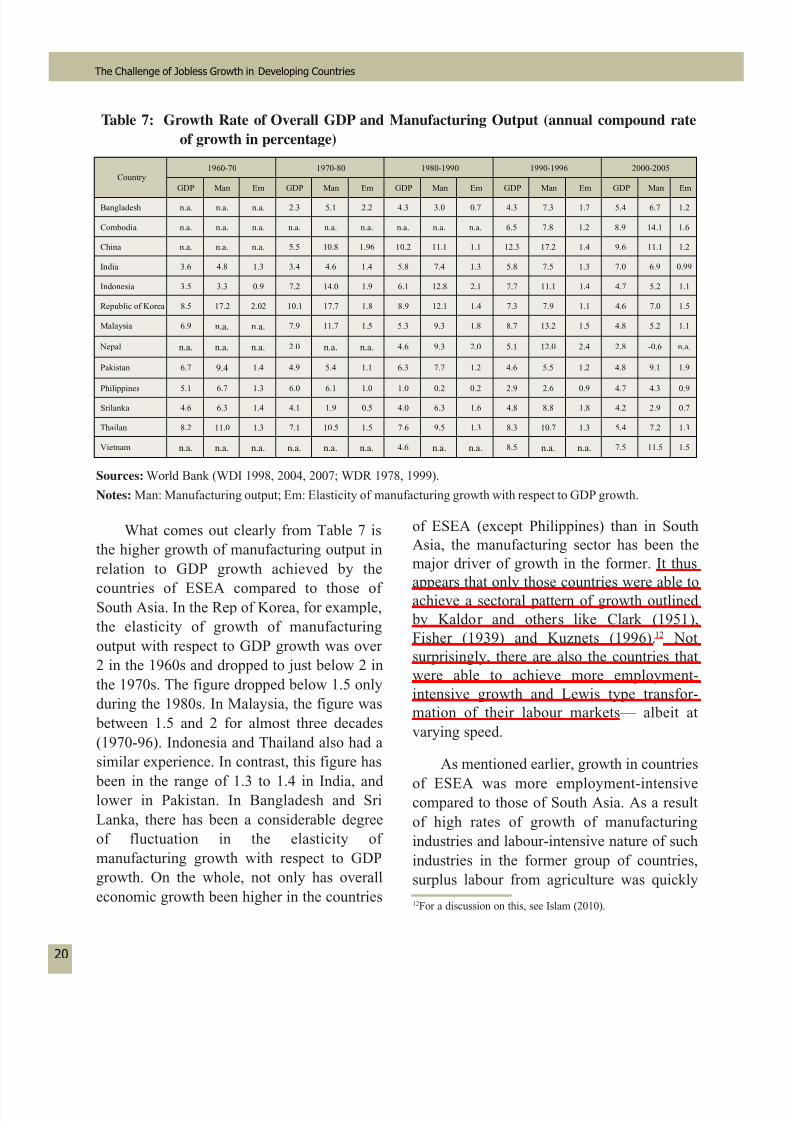
Table 7: Growth Rate of Overall GDP and Manufacturing Output (annual compound rate
of growth in percentage)
Sources: World Bank (WDI 1998, 2004, 2007; WDR 1978, 1999).
Notes: Man: Manufacturing output; Em: Elasticity of manufacturing growth with respect to GDP growth.
12For a discussion on this, see Islam (2010).
Country1960-70 1970-80 1980-1990 1990-1996 2000-2005
GDP Man Em GDP Man Em GDP Man Em GDP Man Em GDP Man Em
Bangladesh n.a. n.a. n.a. 2.3 5.1 2.2 4.3 3.0 0.7 4.3 7.3 1.7 5.4 6.7 1.2
Combodia n.a. n.a. n.a. n.a. n.a. n.a. n.a. n.a. n.a. 6.5 7.8 1.2 8.9 14.1 1.6
China n.a. n.a. n.a. 5.5 10.8 1.96 10.2 11.1 1.1 12.3 17.2 1.4 9.6 11.1 1.2
India 3.6 4.8 1.3 3.4 4.6 1.4 5.8 7.4 1.3 5.8 7.5 1.3 7.0 6.9 0.99
Indonesia 3.5 3.3 0.9 7.2 14.0 1.9 6.1 12.8 2.1 7.7 11.1 1.4 4.7 5.2 1.1
Republic of Korea 8.5 17.2 2.02 10.1 17.7 1.8 8.9 12.1 1.4 7.3 7.9 1.1 4.6 7.0 1.5
Malaysia 6.9 n.a. n.a. 7.9 11.7 1.5 5.3 9.3 1.8 8.7 13.2 1.5 4.8 5.2 1.1
Nepal n.a. n.a. n.a. 2.0 n.a. n.a. 4.6 9.3 2.0 5.1 12.0 2.4 2.8 -0.6 n.a.
Pakistan 6.7 9.4 1.4 4.9 5.4 1.1 6.3 7.7 1.2 4.6 5.5 1.2 4.8 9.1 1.9
Philippines 5.1 6.7 1.3 6.0 6.1 1.0 1.0 0.2 0.2 2.9 2.6 0.9 4.7 4.3 0.9
Srilanka 4.6 6.3 1.4 4.1 1.9 0.5 4.0 6.3 1.6 4.8 8.8 1.8 4.2 2.9 0.7
Thailan 8.2 11.0 1.3 7.1 10.5 1.5 7.6 9.5 1.3 8.3 10.7 1.3 5.4 7.2 1.3
Vietnam n.a. n.a. n.a. n.a. n.a. n.a. 4.6 n.a. n.a. 8.5 n.a. n.a. 7.5 11.5 1.5
What comes out clearly from Table 7 is
the higher growth of manufacturing output in
relation to GDP growth achieved by the
countries of ESEA compared to those of South Asia. In the Rep of Korea, for example,
the elasticity of growth of manufacturing
output with respect to GDP growth was over
2 in the 1960s and dropped to just below 2 in
the 1970s. The figure dropped below 1.5 only
during the 1980s. In Malaysia, the figure was
between 1.5 and 2 for almost three decades
(1970-96). Indonesia and Thailand also had a
similar experience. In contrast, this figure has
been in the range of 1.3 to 1.4 in India, andlower in Pakistan. In Bangladesh and Sri
Lanka, there has been a considerable degree
of fluctuation in the elasticity of
manufacturing growth with respect to GDP
growth. On the whole, not only has overall
economic growth been higher in the countries
of ESEA (except Philippines) than in South
Asia, the manufacturing sector has been the
major driver of growth in the former. It thus
appears that only those countries were able toachieve a sectoral pattern of growth outlined
by Kaldor and others like Clark (1951),
Fisher (1939) and Kuznets (1996).12 Not
surprisingly, there are also the countries that
were able to achieve more employment-
intensive growth and Lewis type transfor-
mation of their labour markets— albeit at
varying speed.
As mentioned earlier, growth in countries
of ESEA was more employment-intensivecompared to those of South Asia. As a result
of high rates of growth of manufacturing
industries and labour-intensive nature of such
industries in the former group of countries,
surplus labour from agriculture was quickly
5/11/2018 R Islam 2010 Jobless Growth Occasional_Paper - slidepdf.com
http://slidepdf.com/reader/full/r-islam-2010-jobless-growth-occasionalpaper 29/47
Constraints on Employment Growth
13See Islam (2009a) for an analysis of that aspect.
14A brief description of this data has been put in the appendix to
this paper.
15The names of the industries are not mentioned in Table 8 in
order to keep it simple. However, the names have been
examined carefully to see if there are cases of factor intensity
reversal (i.e. the same industry appearing as labour intensive in
one country and as capital-intensive in another or changing
factor intensity over time in the same country). The only such
transferred to the modern manufacturing
sector. Republic of Korea was able to achieve
the so-called Lewis turning point by the
mid-1970s, and Malaysia followed during the
1980s. Indeed, apart from Korea and Taiwan,Malaysia and Thailand are the only other
countries of developing Asia that appear to
have used up their surplus labour in
agriculture. Indonesia was on its way towards
that stage, but her journey was disrupted by
the Asian economic crisis of 1997-98. The
countries of South Asia (e.g., Bangladesh,
India, Nepal, Pakistan and Sri Lanka) are still
quite distant from that point.13
In order to get further insight into the
sectoral pattern of economic growth, it would
be useful to look at the composition of the
manufacturing sector. Using UNIDO data
(Indstat 3, 2005),14 an attempt has been made
to rank sub-sectors of manufacturing
industries (at the three-digit level) of various
countries according to their capital-labour
ratios. Based on such rankings, five most
labour-intensive and five most
capital-intensive industries for each countrywere identified for 1980, 1990 and 2002. The
shares of the five most labour-intensive and
five most capital-intensive industries in total
manufacturing value added were then
calculated. These shares are presented in
Table 8.15 The idea behind this exercise is to
see whether there has been a systematic
change in the sector composition of the
manufacturing sector in either direction.
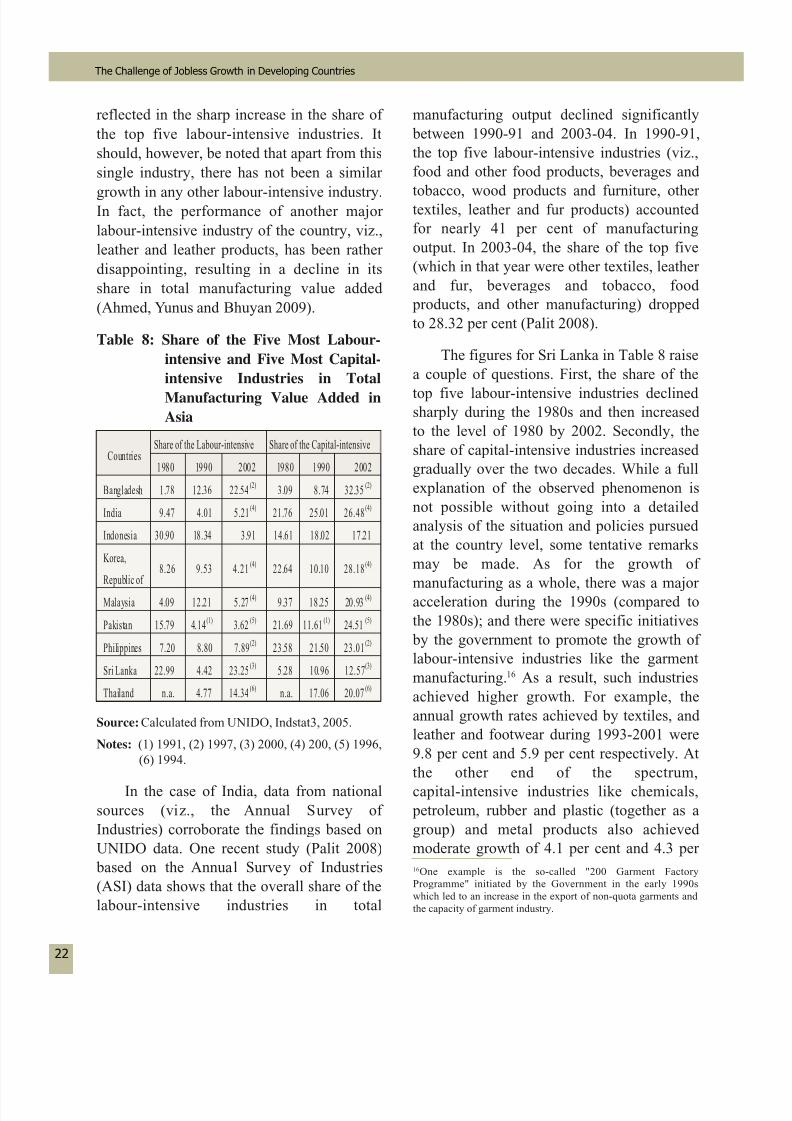
Data presented in Table 8 point out a few
interesting aspects of the sectoral pattern of
industrialisation in the selected countries of
Asia. First, both Rep of Korea and Malaysia
show an increase in the share of labour-intensive industries up to 1990 and a
decline thereafter. Korea also experienced a
fall in the share of capital-intensive industries
till 1990 and a rise thereafter. In Malaysia, on
the other hand, the share of such industries in
1990 was already higher than in 1980,
although there was a slight decline after that.
The above figures indicate that while Korea
provides a classic example of
labour-intensive industrialisation in its earlyphase of development, Malaysia comes close
to that. Thailand also witnessed a rise in the
share of labour-intensive industries between
1990 and 2002. In contrast, India witnessed a
gradual decline in the share of
labour-intensive industries and a rise in the
share of capital-intensive industries. Pakistan
and Sri Lanka also show similar trends,
although not so clearly.
The figures for Bangladesh presented inTable 8 need to be interpreted with caution.
They indicate a substantial rise in the shares
of both top five labour-intensive and top five
capital-intensive industries. These figures
themselves are not implausible, and might
indicate growth taking place at two ends of
the spectrum. Indeed, there has been very
rapid growth of one labour-intensive industry,
viz., readymade garments, which may be
case that could be noted is tobacco which appeared amongst the
top five capital-intensive industries in Korea in 1980 but
changed to become the 3rd most labour-intensive industry in
1990, only to change position again in 2001. Apart from this
case, industries like wearing apparel, footwear, leather products,
wood products, and furniture rank as labour-intensive in all the
selected countries. On the other hand, petroleum products,
chemicals, iron and steel, metal products, and paper and paper
products generally appear as capital-intensive.
5/11/2018 R Islam 2010 Jobless Growth Occasional_Paper - slidepdf.com
http://slidepdf.com/reader/full/r-islam-2010-jobless-growth-occasionalpaper 30/47
22
The Challenge of Jobless Growth in Developing Countries
16One example is the so-called "200 Garment Factory
Programme" initiated by the Government in the early 1990s
which led to an increase in the export of non-quota garments and
the capacity of garment industry.
reflected in the sharp increase in the share of
the top five labour-intensive industries. It
should, however, be noted that apart from this
single industry, there has not been a similar
growth in any other labour-intensive industry.In fact, the performance of another major
labour-intensive industry of the country, viz.,
leather and leather products, has been rather
disappointing, resulting in a decline in its
share in total manufacturing value added
(Ahmed, Yunus and Bhuyan 2009).
Table 8: Share of the Five Most Labour-
intensive and Five Most Capital-
intensive Industries in Total
Manufacturing Value Added in
Asia
Source: Calculated from UNIDO, Indstat3, 2005.
Notes: (1) 1991, (2) 1997, (3) 2000, (4) 200, (5) 1996,
(6) 1994.
In the case of India, data from national
sources (viz., the Annual Survey of
Industries) corroborate the findings based on
UNIDO data. One recent study (Palit 2008)
based on the Annual Survey of Industries
(ASI) data shows that the overall share of the
labour-intensive industries in total
CountriesShare of the Labour-intensive Share of the Capital-inte nsive
1980 1990 2002 1980 1990 2002
Bangladesh 1.78 12.36 22.54(2)
3.09 8.74 32.35(2)
India 9.47 4.01 5.21(4)
21.76 25.01 26.48(4)
Indonesia 30.90 18.34 3.91 14.61 18.02 17.21
Korea,
Republic of 8.26 9.53 4.21
(4)22.64 10.10 28.18
(4)
Malaysia 4.09 12.21 5.27(4)
9.37 18.25 20.93(4)
Pakistan 15.79 4.14(1)
3.62(5)
21.69 11.61(1)
24.51(5)
Philippines 7.20 8.80 7.89(2)
23.58 21.50 23.01(2)
Sri Lanka 22.99 4.42 23.25(3)
5.28 10.96 12.57(3)
Thailand n.a. 4.77 14.34(6)
n.a. 17.06 20.07(6)
manufacturing output declined significantly
between 1990-91 and 2003-04. In 1990-91,
the top five labour-intensive industries (viz.,
food and other food products, beverages and
tobacco, wood products and furniture, othertextiles, leather and fur products) accounted
for nearly 41 per cent of manufacturing
output. In 2003-04, the share of the top five
(which in that year were other textiles, leather
and fur, beverages and tobacco, food
products, and other manufacturing) dropped
to 28.32 per cent (Palit 2008).
The figures for Sri Lanka in Table 8 raise
a couple of questions. First, the share of the
top five labour-intensive industries declinedsharply during the 1980s and then increased
to the level of 1980 by 2002. Secondly, the
share of capital-intensive industries increased
gradually over the two decades. While a full
explanation of the observed phenomenon is
not possible without going into a detailed
analysis of the situation and policies pursued
at the country level, some tentative remarks
may be made. As for the growth of
manufacturing as a whole, there was a majoracceleration during the 1990s (compared to
the 1980s); and there were specific initiatives
by the government to promote the growth of
labour-intensive industries like the garment
manufacturing.16 As a result, such industries
achieved higher growth. For example, the
annual growth rates achieved by textiles, and
leather and footwear during 1993-2001 were
9.8 per cent and 5.9 per cent respectively. At
the other end of the spectrum,
capital-intensive industries like chemicals,
petroleum, rubber and plastic (together as a
group) and metal products also achieved
moderate growth of 4.1 per cent and 4.3 per
5/11/2018 R Islam 2010 Jobless Growth Occasional_Paper - slidepdf.com
http://slidepdf.com/reader/full/r-islam-2010-jobless-growth-occasionalpaper 31/47
Constraints on Employment Growth
17Data and information presented in this paragraph are
from Tilakaratna, Jayawardena and Kumara (2006).
cent per year during the same period.17 That
may explain the steady rise in the share of
capital-intensive industries.
5.2 Employment Implications of Alternative Sector Composition
of Output: Methodologies and
Illustrations
Once the relevance of the pattern of
economic growth is recognised, it would be
necessary to monitor the sector and
sub-sector composition on a periodic basis at
the country level. At the broad sector level, it
would be useful to first examine which
sectors are characterised by higher
employment intensity of growth. In a
developing economy, manufacturing, trade,
transport and construction and some service
sectors are expected to be more employment
intensive than agriculture, mining, utilities,
etc. If that is found to be the case, an
employment focused strategy would involve
strategies to achieve higher growth in such
sectors and a transfer of labour from
traditional sectors like agriculture to thesesectors.
Within the manufacturing sector, an
attempt should be made to identify
sub-sectors that are more employment
intensive. In order for such an exercise to be
useful from an operational point of view, it
should be done at a disaggregated level (at
least at three-digit level). Once
employment-intensive sub-sectors are
identified, their growth performance should
be monitored on a regular basis. In addition,
the policy environment having a bearing on
their growth should be analysed and
strategies and policies should be based on
such analysis. The analysis of the policy
environment faced by the employment
intensive sub-sectors should be carried out
from the point of view of identifying factors
that may be constraining their growth.
An example of the kind of exercise
mentioned above is provided by a recent
study on Bangladesh (Ahmed, Yunus and
Bhuyan 2009) which starts from empirically
examining the growth performance of
employment intensive manufacturing
industries and goes on to analyse the policy
environment faced by selected industries of
growth), but also attempts to identify
constraints that the selected sub-sectors face.Based on the analysis, the study provides
useful policy guidelines for promoting higher
growth of those sub-sectors.
In India, a study on manufacturing
industries (Palit 2008) shows that during
1990-91 to 2003-04, the structure of
manufacturing industries has not shown any
change towards labour-intensive industries
although economic and trade liberalisation
undertaken in the country since 1991 was
expected to engender a process of labour-
intensive industrialisation. In fact, that study
shows that the overall share of the
labour-intensive industries in total
manufacturing output declined significantly
between 1990-91 and 2003-04. In 1990-91,
the top five labour-intensive industries (viz.,
food and other food products, beverages and
tobacco, wood products and furniture, other
textiles, leather and fur products) accountedfor nearly 41 per cent of manufacturing
output. In 2003-04, the share of the top five
(which in that year were other textiles, leather
and fur, beverages and tobacco, food
products, and other manufacturing) dropped
to 28.32 per cent (Palit 2008).
5/11/2018 R Islam 2010 Jobless Growth Occasional_Paper - slidepdf.com
http://slidepdf.com/reader/full/r-islam-2010-jobless-growth-occasionalpaper 32/47
24
The Challenge of Jobless Growth in Developing Countries
18The methodology and the illustration described here are
based on Papola (2008) and ILO ((2009b).
As mentioned earlier, Islam (2010)
shows that the composition of growth in
terms of contribution of various sectors plays
a key role in rendering growth more or less
employment-intensive. However, for drawingoperational implications of this proposition, it
is necessary to assess the relative
employment content of sectors and
sub-sectors of economic activity at such a
disaggregated level that is relevant for policy
and programme application. In other words, it
is necessary to broadly quantify the amount
of employment that would be generated in
producing a given quantum of output in
different lines of activities so as to identify
sectors whose fast growth would make a goodcontribution to employment. However, such
quantification at broad aggregated level may
not be adequate because the policy actions
that may be utilised to facilitate higher
growth of some lines of production than
others could only be applied at the level of
sub-sectors and individual commodities.
Thus, prioritising agriculture for employment
generation may, in fact, imply emphasising
sub-sectors like horticulture, animal
husbandry and fisheries. In the case of
industry, it may imply specially promoting
growth of labour-intensive industries
generally, and textiles, light engineering,
agro-based product, etc. specifically.
Assessment of the employment impact at the
appropriate level of disaggregation of
economic sectors is, therefore, required for
determining the output structure of growth
and evolving suitable policy intervention to
ensure its realisation, in order to bringemployment into focus in growth strategy.
Employment impact analysis (EIA)18
involves not only an assessment of changes in
the employment numbers resulting from a
given expansion of output in a particular
sector/industry, but also the indirect and
induced employment effects19 such expansion
produces in each of the other sectors and
industries through backward and forwardlinkages. It involves an analytical framework
to assess the direction and magnitude of
impact on employment and also identify the
transmission channels due to a change in
policy at macro and/or sectoral level. To
undertake EIA, various tools are used such as
Time Series and Cross-Sectional Analysis,
Location Quotient, Shift-Share Analysis, and
Economic Modelling. Economic Modelling
encompasses a variety of analytic approaches,
such as input-output analysis and economicsimulation. Input-output analysis is among
the most direct and relatively simple tool to
undertake EIA. Besides the direct effects, it
enables measurement of the effects from
suppliers of inputs (raw materials, etc.) and
thus gives a measure of the total effect of the
activity in question. For example, direct
employment in manufacturing activities of X
product is seen as the first link in a chain of
employment effects. Secondary links are
employment associated with the production
of components and raw materials used in the
production of X. The ratio of the total
employment generated in all linked sectors
together as a result of a unit of
investment/increase in output in the reference
sector is also referred to as its employment
multiplier. What one actually requires to
19 Direct effect represents the first round changes in output,
employment and value added (e.g. change in output
which directly affects employment and value added) for a
given industry as a consequence in change in final
demand. Indirect effects are the output, employment and
value-added changes in inter-industry purchases as they
respond to the new demands of the directly affected
industries. Induced effects represent the response by all
local industries caused by the expenditures of new
household income generated by direct and indirect effects
due to the changes in final demand for a given industry.
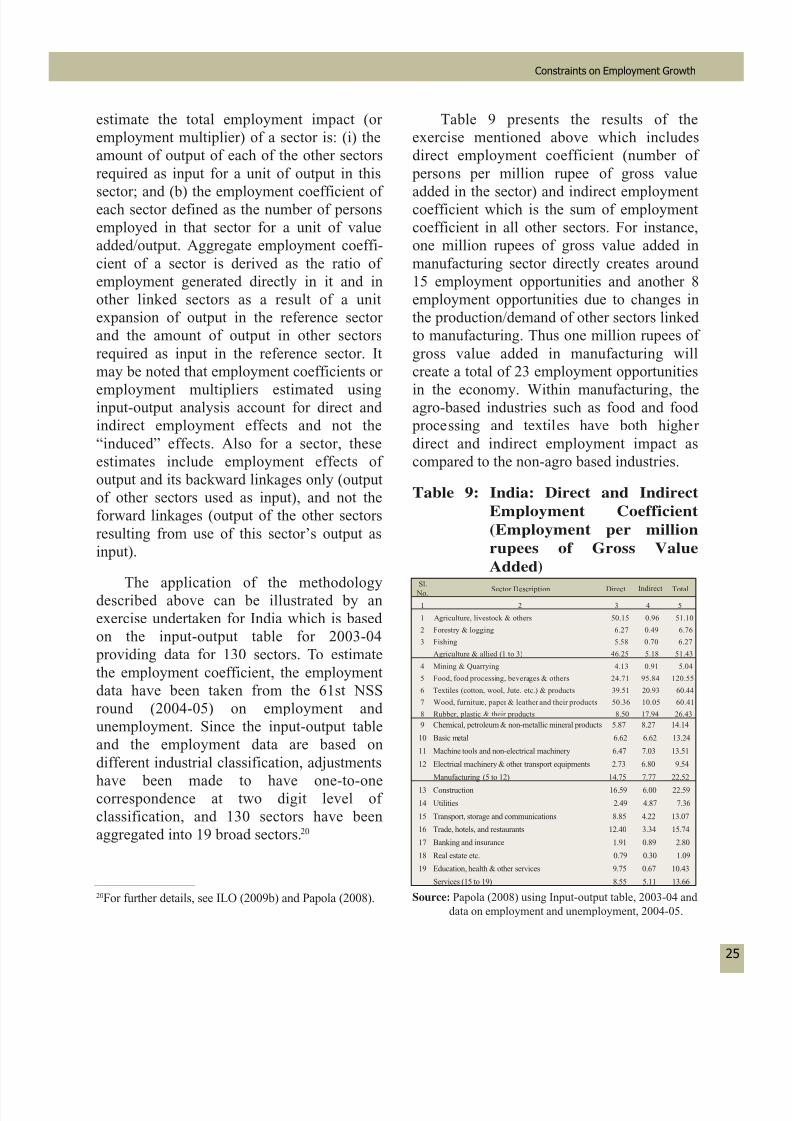
5/11/2018 R Islam 2010 Jobless Growth Occasional_Paper - slidepdf.com
http://slidepdf.com/reader/full/r-islam-2010-jobless-growth-occasionalpaper 33/47
Constraints on Employment Growth
estimate the total employment impact (or
employment multiplier) of a sector is: (i) the
amount of output of each of the other sectors
required as input for a unit of output in this
sector; and (b) the employment coefficient of each sector defined as the number of persons
employed in that sector for a unit of value
added/output. Aggregate employment coeffi-
cient of a sector is derived as the ratio of
employment generated directly in it and in
other linked sectors as a result of a unit
expansion of output in the reference sector
and the amount of output in other sectors
required as input in the reference sector. It
may be noted that employment coefficients or
employment multipliers estimated usinginput-output analysis account for direct and
indirect employment effects and not the
“induced” effects. Also for a sector, these
estimates include employment effects of
output and its backward linkages only (output
of other sectors used as input), and not the
forward linkages (output of the other sectors
resulting from use of this sector’s output as
input).
The application of the methodologydescribed above can be illustrated by an
exercise undertaken for India which is based
on the input-output table for 2003-04
providing data for 130 sectors. To estimate
the employment coefficient, the employment
data have been taken from the 61st NSS
round (2004-05) on employment and
unemployment. Since the input-output table
and the employment data are based on
different industrial classification, adjustments
have been made to have one-to-onecorrespondence at two digit level of
classification, and 130 sectors have been
aggregated into 19 broad sectors.20
Table 9 presents the results of the
exercise mentioned above which includes
direct employment coefficient (number of
persons per million rupee of gross value
added in the sector) and indirect employmentcoefficient which is the sum of employment
coefficient in all other sectors. For instance,
one million rupees of gross value added in
manufacturing sector directly creates around
15 employment opportunities and another 8
employment opportunities due to changes in
the production/demand of other sectors linked
to manufacturing. Thus one million rupees of
gross value added in manufacturing will
create a total of 23 employment opportunities
in the economy. Within manufacturing, theagro-based industries such as food and food
processing and textiles have both higher
direct and indirect employment impact as
compared to the non-agro based industries.
Table 9: India: Direct and Indirect
Employment Coefficient
(Employment per million
rupees of Gross Value
Added)
Source: Papola (2008) using Input-output table, 2003-04 and
data on employment and unemployment, 2004-05.
20For further details, see ILO (2009b) and Papola (2008).
Sl.No. Sector Description Direct Indirect Total
1 2 3 4 5
1 Agriculture, livestock & others 50.15 0.96 51.10
2 Forestry & logging 6.27 0.49 6.76
3 Fishing 5.58 0.70 6.27
Agriculture & allied (1 to 3) 46.25 5.18 51.43
4 Mining & Quarrying 4.13 0.91 5.04
5 Food, food processing, beverages & others 24.71 95.84 120.55
6 Textiles (cotton, wool, Jute. etc.) & products 39.51 20.93 60.44
7 Wood, furniture, paper & leather and their products 50.36 10.05 60.41
8 Rubber, plastic & their products 8.50 17.94 26.43
9 Chemical, petroleum & non-metallic mineral products 5.87 8.27 14.14
10 Basic metal 6.62 6.62 13.24
11 Machine tools and non-electrical machinery 6.47 7.03 13.51
12 Electrical machinery & other transport equipments 2.73 6.80 9.54
Manufacturing (5 to 12) 14.75 7.77 22.52
13 Construction 16.59 6.00 22.59
14 Utilities 2.49 4.87 7.36
15 Transport, storage and communications 8.85 4.22 13.07
16 Trade, hotels, and restaurants 12.40 3.34 15.74
17 Banking and insurance 1.91 0.89 2.80
18 Real estate etc. 0.79 0.30 1.09
19 Education, health & other services 9.75 0.67 10.43
Services (15 to 19) 8.55 5.11 13.66
5/11/2018 R Islam 2010 Jobless Growth Occasional_Paper - slidepdf.com
http://slidepdf.com/reader/full/r-islam-2010-jobless-growth-occasionalpaper 34/47
26
The Challenge of Jobless Growth in Developing Countries
Unlike many sub-sectors of
manufacturing, the indirect employment
effects in service sector are very low. Among
the 19 sectors, food products, textiles, and
wood and paper products top the list withover 60 jobs created directly and indirectly
for each million of rupee of value added,
while real estate, banking and insurance,
mining and quarrying figure at the bottom
with only five or less jobs for similar value
added. Based on future growth scenarios,
these employment coefficients can be used to
forecast corresponding employment growth
for the whole economy as well as for various
sectors.
Social Accounting Matrices (SAMs) may
also be used to analyse the total impact on
employment (i.e. taking into account both
direct and indirect effects) of a particular
measure, and thus could be applied to identify
sectors or sub-sectors that could yield the
maximum impact on employment. Indeed, a
SAM is a powerful tool to investigate the
distributional and employment implications
of given structures of production in an
economy and the way they are affected by
policy interventions.21 An illustration of how
SAMs can be applied to work out the
employment implications of the growth of
various sector of an economy (taking into
account the direct employment in a sector as
well as employment created through linkage
effects on other sectors of the economy) is
provided by a recent exercise on South Africa
by Capaldo (2007). That exercise divides the
economy into 26 sectors that include
agriculture, mining, sub-sectors within
manufacturing and a number of service
sectors. The results obtained from the
exercise indicate that within the
manufacturing sector, food, textiles, and
paper have the highest impact on
employment, while commercial equipment,transport equipment and machinery have low
employment impact. Among the other sectors,
agriculture, construction, and most of the
services are found to be highly employment
intensive.
5.3 Identifying Constraints on the
Growth of Employment-intensive
Sectors/sub-sectors
Constraints on the growth of
labour-intensive sectors/sub-sectors may arise
from both demand and supply sides. On the
demand side, both domestic and external
demand will have to be considered, while on
the supply side, a range of issues starting
from the policy environment to factors
operating at the sector and enterprise level
would be important.
Domestic demand
Domestic demand depends on the level as
well as the distribution of income. With an
unequal distribution of income and rising
inequality, the pattern of demand may shift
towards more capital intensive and imported
goods, which, in turn, may have an adverse
employment implication. An analysis of the
income elasticity of demand for various
products would, therefore, be an important
element in the identification of constraints on
employment growth. However, a literature
search indicates that such studies on an up to
date basis are not readily available. But early
studies on the topic (e.g., ILO (1970) on
Colombia, Sinha, Pearson, Kadekodi and
Gregory (1979) on India and Islam (1976) on
21SAM models were first introduced more than three
decades ago by Stone (1978), and Pyatt and Round
(1979).
5/11/2018 R Islam 2010 Jobless Growth Occasional_Paper - slidepdf.com
http://slidepdf.com/reader/full/r-islam-2010-jobless-growth-occasionalpaper 35/47
Constraints on Employment Growth
Bangladesh) do provide some useful insight.22
The study on India, for example, shows that
expenditure elasticity of demand for products of
labour intensive sectors like cotton textiles and
footwear are much higher for lower and middleincome groups than for higher income groups.
More recent studies on India indicate
significant changes in the consumption pattern
that have taken place in country. However, the
differences in the pattern of consumption
between the rich and the poor continue to
remain. For example, the difference in average
expenditure on consumer durables is much
more marked than that in the case of food and
other basic items (Shukla and Kakar 2007).
And as income inequality widens, the
consumption pattern (and hence the pattern of
domestic demand) is getting tilted more
towards consumer durables which are more
capital-intensive by nature.23
Some illustrative estimates (presented in
Table 10) of income elasticity of demand for
selected consumer goods in Bangladesh
indicate a pattern similar to that observed inIndia. For example, some items like Gur and
firewood clearly emerge as inferior goods at
high levels of income (top 10% of households),
implying that an increase in income at that level
leads to a decline in the amount spent on these
items. And it is quite well known that these
items are more labour-intensive compared to
similar products (for example, gur compared to
sugar, firewood compared to gas and
electricity). Second, for some items which use
labour-intensive techniques in their production
(e.g., lungi, furniture, shirt and pant, leather
shoes, etc.), the income elasticity of demand at
high income level (viz., the top 10% of households) is lower than for households as a
whole. This implies that an increase in income
at the topmost level would increase the demand
for such items by smaller amounts than if
income increases at lower income levels. Third,
for items like refrigerators, pressure cookers,
etc. (which not only involve the use of
capital-intensive technology in their production
but are mostly imported in Bangladesh), the
income elasticity of demand is much higher forthe top 10% of the households comared to the
overall sample. So, an increase in the demand
for such products is unlikely to create much
employment within the country (except perhaps
in the sales of such items).
The pattern of consumer demand (which in
turn has its roots in the pattern of income
distribution) mentioned above has implications
for the growth of sectors that are more
employment intensive. An early study on India
(Gupta 1977), for example demonstrates that a
redistribution of private consumption
expenditure in favour of the poorer classes of
population would change the output-mix in
India in such a way that the average annual
growth rate of employment would register an
increase of eleven per cent (year of reference
was early 1970s). A study on Bangladesh
(Islam 1976) also found positive employment
impact of a redistribution of income from upperto lower income groups, although the
magnitude was much less notable. One could
thus conclude, at least tentatively, that an
unequal income distribution and increase in
inequality poses a constraint on the growth of
sectors that are employment intensive in nature.
22In fact, studies carried out during the 1970s under the
auspices of the ILO pointed out the importance of income
distribution in influencing the mix of products that is
produced in a country as the income elasticity of demand
for various consumer goods varies between income/
expenditure classes.
23Chandrasekhar and Ghosh (2008) note such a shift in
the pattern of consumer demand.
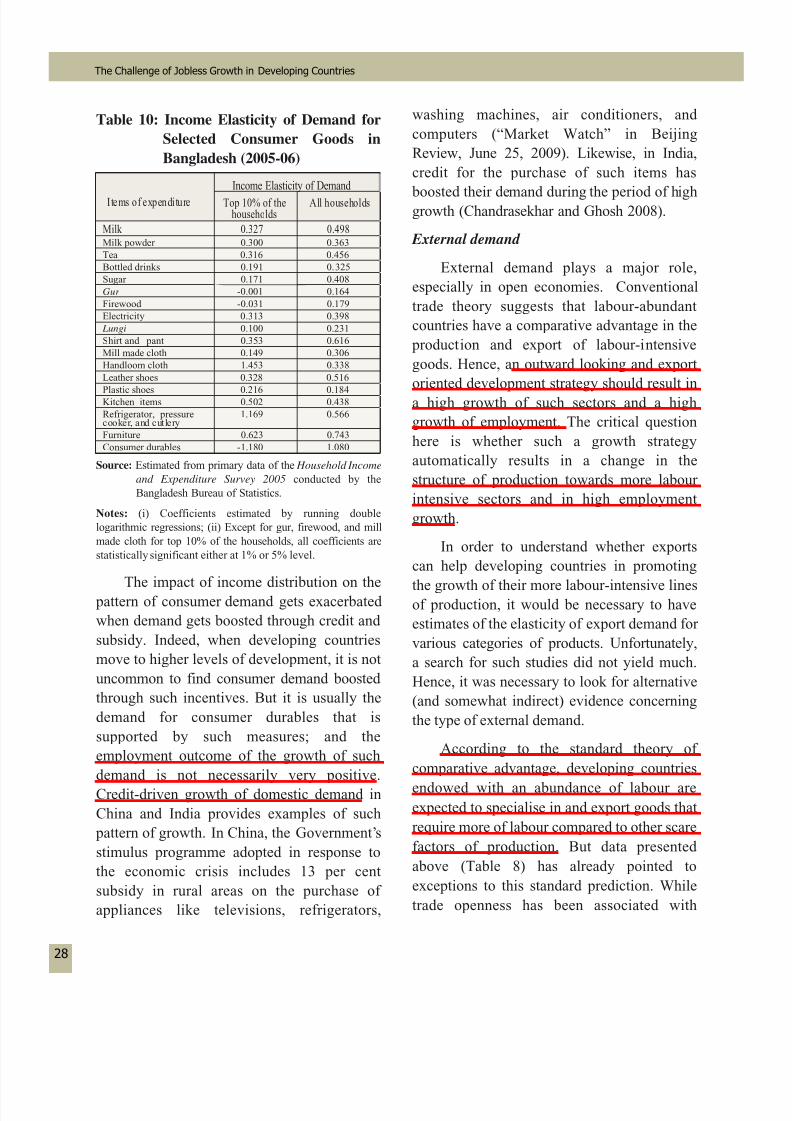
5/11/2018 R Islam 2010 Jobless Growth Occasional_Paper - slidepdf.com
http://slidepdf.com/reader/full/r-islam-2010-jobless-growth-occasionalpaper 36/47
28
The Challenge of Jobless Growth in Developing Countries
Table 10: Income Elasticity of Demand for
Selected Consumer Goods in
Bangladesh (2005-06)
Source: Estimated from primary data of the Household Income
and Expenditure Survey 2005 conducted by the
Bangladesh Bureau of Statistics.
Notes: (i) Coefficients estimated by running double
logarithmic regressions; (ii) Except for gur, firewood, and mill
made cloth for top 10% of the households, all coefficients are
statistically significant either at 1% or 5% level.
The impact of income distribution on thepattern of consumer demand gets exacerbated
when demand gets boosted through credit and
subsidy. Indeed, when developing countries
move to higher levels of development, it is not
uncommon to find consumer demand boosted
through such incentives. But it is usually the
demand for consumer durables that is
supported by such measures; and the
employment outcome of the growth of such
demand is not necessarily very positive.
Credit-driven growth of domestic demand in
China and India provides examples of such
pattern of growth. In China, the Government’s
stimulus programme adopted in response to
the economic crisis includes 13 per cent
subsidy in rural areas on the purchase of
appliances like televisions, refrigerators,
Milk powder 0.300 0.363
Tea 0.316 0.456
Bottled drinks 0.191 0.325
Sugar 0.171 0.408
Gur -0.001 0.164
Firewood -0.031 0.179
Electricity 0.313 0.398
Lungi 0.100 0.231
Shirt and pant 0.353 0.616
Mill made cloth 0.149 0.306
Handloom cloth 1.453 0.338
Leather shoes 0.328 0.516
Plastic shoes 0.216 0.184Kitchen items 0.502 0.438
Refrigerator, pressurecooker, and cutlery
1.169 0.566
Furniture 0.623 0.743
Consumer durables -1.180 1.080
Items of expenditure
Income Elasticity of Demand
Top 10% of thehouseholds
All households
Milk 0.327 0.498
washing machines, air conditioners, and
computers (“Market Watch” in Beijing
Review, June 25, 2009). Likewise, in India,
credit for the purchase of such items has
boosted their demand during the period of highgrowth (Chandrasekhar and Ghosh 2008).
External demand
External demand plays a major role,
especially in open economies. Conventional
trade theory suggests that labour-abundant
countries have a comparative advantage in the
production and export of labour-intensive
goods. Hence, an outward looking and export
oriented development strategy should result ina high growth of such sectors and a high
growth of employment. The critical question
here is whether such a growth strategy
automatically results in a change in the
structure of production towards more labour
intensive sectors and in high employment
growth.
In order to understand whether exports
can help developing countries in promoting
the growth of their more labour-intensive linesof production, it would be necessary to have
estimates of the elasticity of export demand for
various categories of products. Unfortunately,
a search for such studies did not yield much.
Hence, it was necessary to look for alternative
(and somewhat indirect) evidence concerning
the type of external demand.
According to the standard theory of
comparative advantage, developing countries
endowed with an abundance of labour are
expected to specialise in and export goods that
require more of labour compared to other scare
factors of production. But data presented
above (Table 8) has already pointed to
exceptions to this standard prediction. While
trade openness has been associated with
5/11/2018 R Islam 2010 Jobless Growth Occasional_Paper - slidepdf.com
http://slidepdf.com/reader/full/r-islam-2010-jobless-growth-occasionalpaper 37/47
Constraints on Employment Growth
specialisation in and export of labour intensive
manufactures in some countries, there are
exceptions, e.g., India. In the latter case,
exports are found at both the labour-intensive
and the capital-intensive ends of the spectrumof manufacturing industries. How does one
explain this?
It needs to be noted in the context of the
question raised above that developing
countries may export goods to both developed
and developing countries. While the standard
prediction based on the theory of comparative
advantage may apply to the former, it does not
necessarily apply to the latter. Indeed, there is
evidence to show that the latter category of
exports may include goods, e.g., metal
products, machinery, chemicals, transport
equipments, etc. (Murakami 1968)—which
may not fit into the conventional description of
labour-intensive items. The importance of such
goods in total exports may, of course, vary
depending on the level of development
achieved and the strategy of industrialisation
pursued by a developing country. But in
reality, it is possible that the weight of such
goods in total exports and production may be
quite substantial, and their share may not
change much (or may increase) even when an
open trade regime is introduced. And as a
result, the emerging pattern of industrialisation
may not be very employment-intensive. While
the case of India has already been mentioned
above, a look at Pakistan’s export structure
also indicates a similar pattern.
In India, the shares of labour-intensive
manufactures like garments and leather in total
exports have not registered a significant
increase after the economic reforms and
liberalisation were introduced in 1991. For
example, the share of readymade garments
was 12.3 per cent in 1990-91 and actually
declined to 11.1 per cent in 1997-98, and
thereafter increased to 12.5 per cent in
2000-01, which implies a return to the level of
1990-91 (Reserve Bank of India 2008). Theshare of leather and leather products declined
substantially from 7.9 per cent to 4.7 per cent
during the same period. On the other hand, the
shares of chemical and allied products and
engineering products increased respectively
from 7.2 per cent to 9 per cent and from 12.4
per cent to 15.2 per cent (Sharma 2000). A
more recent study (Burange and Chaddha
2008) found that India enjoys comparative
advantage in the exports of labour-intensiveitems like textiles as well as in scale-intensive
items such as chemicals, and iron and steel
(the latter belonging to the capital-intensive
category).
In Pakistan, a study (Ansari 2007)
undertaken for the Export Promotion Bureau
shows that the growth rates of exports of
labour-intensive items like garments and
leather witnessed notable escalation during
1999-2005 compared to 1993-98 (from 2.66
and -1.74 per cent respectively during 1993-98
to 11.19 and 10.45 per cent during
1999-2005). But in terms of the structure of
exports, the shares of chemicals and
pharmaceuticals, petroleum products and
engineering goods registered significant
increases (from 0.56, 0.82, and 0.41 per cent
respectively to 1.33, 1.83, and 1.65 per cent
respectively between the two periods
mentioned above), thus demonstrating the
growth in the exports of both labour-intensive
and capital-intensive goods. In fact, average
growth rates registered by the latter mentioned
industries were several times higher than those
of the labour-intensive goods mentioned
above.
5/11/2018 R Islam 2010 Jobless Growth Occasional_Paper - slidepdf.com
http://slidepdf.com/reader/full/r-islam-2010-jobless-growth-occasionalpaper 38/47
30
The Challenge of Jobless Growth in Developing Countries
The upshot of the findings reported above
may be summarised as follows. Greater trade
openness may help labour-abundant countries
to achieve accelerated growth of
labour-intensive industries. But a divergencefrom this standard prediction may occur, and
countries may indeed export goods that are at
the capital-intensive end of the production
spectrum. Such a divergence can act as a
constraint on employment growth.
Supply side constraints
Supply side constraints can arise from a
variety of sources, e.g., the supply of needed
raw materials, and the availability of specific
skills that may be required. The price structure
of inputs in relation to that of outputs may
affect the profitability of industries, and thus,
act as a constraint on its growth. A study on
Bangladesh (Ahmed, Yunus and Bhuyan 2009)
brings out these constraints in the context of
specific labour-intensive industries like food
products, furniture, and leather products. For
example, in the case of food manufacturing,
weak technological base resulting in an
inability of enterprises to meet the health and
sanitary conditions of export markets is found
to be an important constraint. For leather and
leather products, low level of technology, lack
of appropriate skills, shortage of raw
materials, low level of entrepreneurial skill,
etc. are found to be important constraints on
the growth of the sector. Likewise, in the case
of furniture, scarcity of raw material, high
customs duty on imported inputs, and shortage
of skills are found to be the major constraints.
Frequent changes in policy that result in an
uncertain business environment are also
regarded as a problem. This kind of sector
focused study that revealed the constraints
mentioned above is important in identifying
the constraints that specific industries face.
The policy environment
The policy environment prevailing in an
economy may affect the growth of a sector
from both the demand and supply sides. For
example, the pattern of domestic demand may
be the outcome of the way in which income is
distributed which in turn may be due to the
overall development strategy and policies
pursued. Likewise, macroeconomic and sector
level policies are critical in determining the
relative prices of factors and other inputs that
are important in the production of various
goods and services in an economy. An
important question to address in this context is
whether relative factor prices of the key factorsof production (viz., capital and labour) reflect
their true scarcities. Another key question is
whether there is anything in the policy
environment (e.g., those relating to taxes and
tariffs on inputs and competing imports) that go
against the profitability and competitiveness of
the employment-intensive sectors/sub-sectors.
For example, there are studies on India
(e.g., Palit 2008, and Chandrasekhar 2008)
demonstrating the existence of a number of elements in the country’s policy framework
that have led to a cheapening of capital which
is the relatively scarce factor of production. On
the other hand, there is nothing in the policy
environment to encourage the use of labour. As
a result, the relative factor prices do not reflect
their true scarcities, and the growth of
employment has been lower than what it
should have been in a country with surplus
labour. This appears to be consistent with the
findings mentioned earlier (viz., Palit 2008) of
a sectoral pattern of growth characterised by an
increase in the share of capital-intensive
sectors and a decline in the share of
labour-intensive ones. This, clearly, is an area
for further investigation and possible policy
intervention.
5/11/2018 R Islam 2010 Jobless Growth Occasional_Paper - slidepdf.com
http://slidepdf.com/reader/full/r-islam-2010-jobless-growth-occasionalpaper 39/47
The present paper starts by providing
clarifications regarding the concept and
terminology of jobless growth, and points out
that the term need not be interpreted in a
literal sense. The term is used to capture
situations of low growth of employment in
relation to output growth in countries that are
still characterised by surplus labour. It is
pointed out that the term employment
intensive growth does not imply employment
creation without output growth. Indeed, this
term is used to describe a situation where
high output growth is associated with high
employment growth. The conceptual part of
the paper also points out that in a growing
economy, there should be room for growth of
both employment and labour productivity,
and that it should be possible to avoid a trade
off between the two.
By using cross-country data on
manufacturing industries in developing
countries, the paper shows that the
relationship between employment and output
growth has weakened during the 1990s
compared to the 1980s. In addition, there are
countries where positive output growth has
been found to be associated with zero or
negative employment growth, thus pointingto situations of jobless growth in a literal
sense. For a number of Asian countries for
which estimates of elasticity of employment
with respect to output growth in
manufacturing could be found for the 1990s
and the 1980s, the figures for the 1990s were
found to be lower, thus indicating a decline in
the employment intensity of growth in the
sector. Interestingly, those are the countries
where surplus labour continues to exist, so
that a decline in the employment intensity of
growth cannot be explained by the labour
market situation.
The present paper points out that it is
important to go beyond estimates of employment elasticity and look at actual
figures on output and employment growth.
By doing so, it is found that there are
countries (in the Middle East and north Africa
region, for example) where the problem is not
only one of low employment growth but also
one of low growth of output. In such
situations, the policy concern would be how
to raise both output and employment growth.
But there are countries (e.g., China, India andother South Asian countries) where
employment growth has been low despite
high or moderate output growth. The policy
concern in such situations would be to raise
employment growth.
A decomposition of output growth into
employment and productivity growth (see
section 4 of the present paper) shows that the
trade-off between the two is not inevitable.
There are countries (e.g., Republic of Korea,
Malaysia, Indonesia and Thailand) which
have been able to combine employment
growth with productivity growth. On the
other hand, there are countries (e.g.,
Bangladesh, China and India) where the
contribution of labour productivity to total
6 Concluding Observations
5/11/2018 R Islam 2010 Jobless Growth Occasional_Paper - slidepdf.com
http://slidepdf.com/reader/full/r-islam-2010-jobless-growth-occasionalpaper 40/47
32
The Challenge of Jobless Growth in Developing Countries
output growth has not only been high
(especially considering the fact these
economies are still characterised by the
existence of surplus labour), but has also been
increasing. These findings point towards apattern of growth in those countries that has
not been conducive to the growth of
employment.
The present paper argues that the pattern
of economic growth in terms of the sector and
sub-sector composition of output is important
in determining the employment outcome of
growth. In that context, a high rate of growth
of manufacturing in relation to overall GDP
growth would be important because such a
pattern of growth is potentially conducive to a
high rate of employment growth. High rate of
growth of manufacturing at the initial stage of
development is necessary for creating
conditions for transfer of surplus labour from
sectors characterised by low labour
productivity to those with higher productivity.
However, for that process to succeed, it is
also important for more labour-intensive
sub-sectors of manufacturing to grow at highrates–at least at the initial stages of
development.
It is by now well known that a few
countries of East and South East Asia (ESEA,
especially, Rep of Korea and Malaysia, and
Indonesia and Thailand, to some extent) were
able to achieve the kind of growth pattern
mentioned above. In general, the countries of
ESEA not only had higher growthmanufacturing in relation to overall GDP
growth, the sector composition of the
manufacturing sector was also more
labour-intensive (at least during the initial
stages of their growth) than in countries of
South Asia. As a result, the employment
intensity of growth during the initial stages of
their development was also higher than in the
latter.
The present paper outlines alternative
methodologies (e.g., those based on
input-output analysis and SAMs) for
assessing the direct as well as the total impact
on employment of alternative sectoral
patterns of growth. The application of such
methodologies is illustrated with examples
from India and South Africa.
The paper demonstrates how constraints
on the growth of employment-intensive
sectors can arise from demand and supply
sides. In the course of that analysis, it ispointed out that the pattern of income
distribution can have significant influence on
domestic demand for various products, and
hence, on the sectoral pattern of output
growth. An important point that has come out
is that greater trade openness does not
necessarily lead labour-abundant countries to
specialise and export only labour-intensive
goods. Depending on the level of
development and the strategy of industrialisation pursued, a developing
country may have in its export basket both
labour-intensive and capital-intensive goods.
The pattern of external demand thus could be
an important factor in explaining the low
employment intensity of output growth.
The findings and analysis of the present
study have important implications for
countries that need to make economic growth
more employment-intensive. If it is found that
the sectoral pattern of growth is such that
there is room for higher growth of
labour-intensive industries and growth of
additional labour-intensive lines of
production than at present, the next step from
a policy point of view would be to examine
5/11/2018 R Islam 2010 Jobless Growth Occasional_Paper - slidepdf.com
http://slidepdf.com/reader/full/r-islam-2010-jobless-growth-occasionalpaper 41/47
Concluding Observations
the factors responsible for the observed
pattern. In fact, one study mentioned above
(Palit 2008) already points out that the sector
composition of India’s manufacturing sector
has changed towards more capital-intensiveindustries rather than labour-intensive ones.
As mentioned above, the sector composition
could be a reflection of the pattern of demand
in an economy which in turn is influenced by
the level and distribution of income. On the
other hand, it could also be due to distortions
in the incentive structure created by the
policy environment prevailing in the
economy. In the latter case, it should be
possible to identify appropriate reforms inpolicies that would modify the policy
environment and make it more conducive for
higher growth of labour-intensive sectors.
Distortions in the incentive structure
could also be created in the process of
implementing the so-called stimulus
programmes that are being implemented by
various countries in response to the economic
crisis. In Indonesia, for example, the stimulus
package includes subsidies for the purchase
of machinery under the Machinery
Revitalisation Programme (Hailu 2009). In
China, the industries that are benefiting from
government support include steel,
automobiles, machinery, shipbuilding,
textiles, electronics, and petrochemicals
(Riskin 2010). It is quite clear that apart from
textiles and electronics, the others in this list
are at the capital-intensive end of the
spectrum.
While capital is being made cheaper than
it would otherwise have been, in none of the
countries whose examples are cited above
(viz., China, India, and Indonesia) there is
any measure to encourage the use of labour in
industries. Thus, relative factor prices may
not often reflect the true scarcities of the
factors of production and may not be
conducive to employment-intensive growth.
The analysis and overview of the present
paper also bring out a number of gaps in the
literature relating to the sector composition of
output and point to what needs to be done if
an employment diagnostic exercise were to
be carried out in a particular country. The
starting point of such an exercise has to be an
assessment of the direct as well as the total
employment impact of alternative sectoral
growth scenarios. That kind of exercise
would require input-output table or SAM on
an up to date basis at a disaggregated level.
While there has been a good deal of
improvement in this respect in many
developing countries, the availability of up to
date data at an appropriate level of
disaggregation is often a problem. Once the
employment impact has been assessed, the
next step would be an analysis of the pattern
of demand—both domestic and external—for
the products of various sectors. This is where
the real data gap lies. And this also is an
important issue because demand is one of the
major factors that influences the sectoral
pattern of output growth. Once the demand
pattern is known, the next step would be to
examine the policy environment that prevails
in the country at the macro, sector as well as
sub-sector level and identify reforms that are
needed in that sphere from the point of view
of promoting the growth of
sectors/sub-sectors, the products of which are
characterised by high income/price elasticity
of demand, and growth is constrained more
by factors in the policy environment than by
demand.
5/11/2018 R Islam 2010 Jobless Growth Occasional_Paper - slidepdf.com
http://slidepdf.com/reader/full/r-islam-2010-jobless-growth-occasionalpaper 42/47
34
REFERENCES
Ahmed, Nazneen, Mohammad Yunus and Harunur
Rashid Bhuyan. 2009. “Promoting
Employment-Intensive Growth inBangladesh: Policy Analysis of the
Manufacturing and Service Sectors,”
Employment Sector Working Paper. ILO,
Geneva.
Ansari, Javed. 2007. “Structural Change in
Pakistani Exports 1992-2005,” Market
Forces, 3(2), July.
Asian Development Bank (ADB). 2005. Labour
Markets in Asia: Promoting Full,
Productive and Decent Employment.
Manila: Asian Development Bank.
______.2007. Key Indicators of Developing Asian
and Pacific Countries.
http://www.adb.org/Documents/Books/K
ey_Indiactors/2008
Auer, Peter and Rizwanul Islam. 2006. “Economic
Growth, Employment, Competitiveness
and Labour Market Institutions.” In
World Economic Forum: The Global
Competitiveness Report 2006-07 .
Geneva: WEF.
Banerjee, Lopamudra, Anirban Dasgupta, and
Rizwanul Islam (eds.). 2010.
Development, Equity and Poverty: Essays
in Honour of Azizur Rahman Khan. New
Delhi: Macmillan India.
Bean, Charles.1994. “European Unemployment: A
Survey.” Journal of Economic Literature,
32.
Bhorat, Haroon and Oosthuizen. 2006. “Evolution
of the Labour Market 1995-2002.” In
Haroon Bhorat and Ravi Kanboor, eds.,
Poverty and Policy in Post-Apartheid
South Africa. Cape Town: Human Science
Research Council.
Burange, L.G. and Sheetal J. Chaddha. 2008.
“India’s Revealed Comparative
Advantage in Merchandise Trade.” Artha
Vijnana, L (4): 332-63.
Capaldo, Jeronim. 2007. “Employment Impact
Assessment with Social Accounting
Matrices.” Levy Economics Institute.
Clark, C. 1951. The Conditions of Economic
Progress. London: Macmillan.Chandrasekhar, C.P. 2008. “Re-visiting the Policy
Environment for Engendering
Employment Intensive Economic
Growth.” Draft paper, International
Labour Office, Geneva.
Chandrasekhar, C.P. and Jayati Ghosh. 2008.
“Employment and the Pattern of Growth.”
In Raj Kapila and Uma Kapila, eds.,
Economic Developments in India. Delhi:
Academic Foundation.
Economist Intelligence Unit.2009. World Dataonline.
El Laithy, Heba and Naglaa El Ehwany. 2006.
“Employment-Poverty Linkages towards
a Pro-poor Employment Policy
Framework in Egypt.” Geneva: ILO.
Unpublished paper.
Fisher, A.G.B. 1939. “Production, Primary,
Secondary and Tertiary.” The Economic
Journal, Vol. XV, 1939.
Forteza, Alvaro and Martin Rama.2002. “Labour
Market ‘Rigidity’ and the Success of
Economic Reforms Across More than One
Hundred Countries.” Reported in ADB
(2005).
Groningen database on: www.ggdc.net.
Gupta, Anand P. 1977. Fiscal Policy for
Employment Generation in India. New
Delhi: Tata-McGraw Hill Publishing
Company Limited.
Hailu, Degol. 2009. “The Indonesian Response to
the Financial and Economic Crisis: Is theDevelopmental State Back?” One Pager ,
86l.
Hausmann, R., D. Rodrik, and A. Velasco. 2005.
“Growth Diagnostics.” John F. Kennedy
School of Government, Harvard
University, Cambridge.
5/11/2018 R Islam 2010 Jobless Growth Occasional_Paper - slidepdf.com
http://slidepdf.com/reader/full/r-islam-2010-jobless-growth-occasionalpaper 43/47
References
Heintz, James. 2006. “Growth, Employment and
Poverty Reduction.” Paper presented at a
workshop on Growth, Employment and
Poverty Reduction Organised by the
Department for International
Development, U.K.
Helpman, Elhanan. 2004. The Mystery of
Economic Growth. Belknap/Harvard.
International Labour Office (ILO). 1970. Towards
Full Employment: A Programme for
Colombia. Geneva: ILO.
______.2005. World Employment Report . Geneva:
ILO.
______.2006. Key Indicators of Labour Markets
(KILM). 4th edition, Geneva: ILO.
______.2007. KILM, 5th edition. Geneva: ILO.
______.2009a. Global Employment
Trends-Update. Geneva: ILO.
______.2009b. Towards an Employment Strategy
for India. (Forthcoming), Delhi and
Geneva: ILO.
International Monetary Fund (IMF).2009a. World
Economic Outlook Database (April
2009). Washington, D.C.: IMF.
______.2009b. World Economic Outlook: Crisis
and Recovery. Washington, D.C.: IMF.Islam, Iyanatul. 2002. “Poverty, Employment and
Wages: An Indonesian Perspective” in
ILO (2002).
______.2005. “Managing without Growth:
Challenges Confronting the Syria Labour
Market.” Unpublished paper for UNDP,
Beirut.
Islam, Rizwanul. 1976. Factor Intensity and
Labour Absorption in Manufacturing
Industries: The Case of Bangladesh.
Unpublished Ph.D. dissertation, LondonSchool of Economics and Political
Science, London.
_______.2003. “Labour Market Policies,
Economic Growth and Poverty
Reduction: Lessons and Non-lessons
from the Comparative Experience of East,
South-East and South Asia.” Issues in
Employment and Poverty Discussion
Paper 8. Recovery and Reconstruction
Department, ILO, Geneva.
______. 2006a. “The Nexus of Economic Growth,
Employment and Poverty Reduction: An
Empirical Analysis.” In Rizwanul Islam.
______ ed. 2006b. Fighting Poverty: The
Development-employment Link . Boulder
and London: Lynn Rienner.
______.2009a. “Has Development and
Employment through Labour-intensive
Induistrialization Become History?” In
Basu, Kaushik and Ravi Kanbur (eds):
Arguments for a Better World: Essays in
Honour of Amartya Sen (Vol.II, Society,
Institutions, and Development). OxfordUniversity Press.
______ .2009b. “What Kind of Economic Growth
is Bangladesh Attaining?” In Quazi
Shahabuddin and Rushidan Islam
Rahman (eds.) (2009): Development
Experience and Emerging Challenges:
Bangladesh. Dhaka: Bangladesh Institute
of Development Studies and the
University Press Limited.
______ .2009c. “Addressing the Challenge of
Jobless Growth in DevelopingCountries,” Unpublished draft, ILO,
Geneva.
______ .2010. “Pattern of Economic Growth and
its Implication for Employment.” In
Lopamudra Banerjee, Anirban Dasgupta
and Rizwanul Islam (eds.) (2010),
Development, Equity and Poverty: Essays
in Honour of Azizur Rahman Khan. Delhi
and New York: Macmillan India and
UNDP.
Kapsos, Steve. 2005. “The Employment Intensity
of Growth: Trends and Macroeconomic
Determinants.” Employment Strategy
Papers, 2005/12. International Labour
Office, Geneva.
Khan, A.R. 2002. “Employment, Productivity and
Poverty Reduction in Developing
Countries: A background document for
5/11/2018 R Islam 2010 Jobless Growth Occasional_Paper - slidepdf.com
http://slidepdf.com/reader/full/r-islam-2010-jobless-growth-occasionalpaper 44/47
36
The Challenge of Jobless Growth in Developing Countries
the World Employment Report 2003.”
Draft paper. Geneva: ILO.
______.2006. “ Employment Policies for Poverty
Reduction.” In Islam (2006b).
______.2007. “Asian Experience on Growth,Employment and Poverty: An Overview
with Special Reference to the Findings of
Some Recent Case Studies.” Geneva and
Colombo: ILO and UNDP.
Kim. Jong-Il and Lawrence J. Lau. 1994. “The
Sources of Economic Growth in the East
Asian Newly Industrializing Countries.”
Journal of the Japanese and International
Economic Economics, 8(3): 235-71.
Krugman, Paul. 1994. “The Myth of Asia’s
Miracle.” Foreign Affairs,November/December: 62-78.
Kuznets, S. 1996. Modern Economic Growth:
Rate, Structure and Speed . Oxford
University Press, Delhi.
Malaysia Department of Statistics .2009.
http://www.bnm.gov.my/files/publicatins/
msb/2009/2/xls/7.6.xls
Messkoub, Mahmood. 2009. “Economic Growth,
Employment and Poverty in the Middle
East and North Africa.” Employment
Sector Working Paper No.19. ILO,Geneva.
Murakami, Atsushi. 1968. “Two Aspects of the
Export of Manufacturing Goods from
Developing Countries.” The Developing
Economies, 6(3): 261-83.
Nickel, Stephen.1997. “Unemployment and
Labour Market Rigidities: Europe versus
North America.” Journal of Economic
Perspectives, XI.
Palit, A. 2008. “Policies Responsible for Excessive
Use of Capital Relative to Labour in
India’s Manufacturing Industries.” Draft
paper, International Labour Office,
Geneva.
Papola, T.S. 2008. “Mainstreaming Employment
in Economic Policy Making.”
Unpublished draft, ILO, Geneva.
Pyatt, G. and J.I. Round. 1979. “Accounting and
Fixed Price Multipliers in a Social
Accounting Matrix Framework.”
Economic Journal, 89 (December):
850-73.
Radwan, S. 2006. “Economic Growth,
Employment and Poverty Reduction:
Linkages, Challenges and Policies in the
MENA Region.” Presentation at the
ILO-UNDP seminar on “Economic
Growth, Employment and Poverty in
Middle East and North Africa,” Cairo,
20-21 November.
Reserve Bank of India. 2008. Handbook of Statistics on Indian Economy, 2008.http://rbidocs.rbi.org.in/rdocs/Publication
s/Docs/87513.xlsRifkin, J. 1996. The End of Work: The Decline of
the Global Labour Force and the Dawn of the Post-Market Era. New York: Penguin.
Riskin, Carl.2010. “Inequality and EconomicCrisis in China.” In Lopamudra Banerjee,Anirban Dasgupta and Rizwanul Islam(eds.) (2010): Development, Equity and Poverty: Essays in Honour of Azizur Rahman Khan. New Delhi and New York:Macmillan Publishers India Ltd andUNDP.
Sharma, Kishor. 2000. “Export Growth in India:Has FDI Played a Role?” EconomicGrowth Center Yale UniversityDiscussion Paper No. 816. Connecticut.
Shukla, Rajesh and Preeti Kakar. 2007.“Consumption Level Up as India Shines.”The Economic Times, 9 February.
Sinha, R., Peter Pearson, Gopal Kadekodi andMary Gregory. 1979. Income Distribution, Growth and Basic Needs in India. London: Croom Helm.
Stone, J.R. N. 1978. “The Disaggregation of theHousehold Sector in the NationalAccounts.” Paper presented at the WorldBank Conference on Social AccountingMethods in Development Planning.Cambridge, U.K., 16-21 April.
Storm, S. & C.W.M. Naastepad. 2005. “StrategicFactors in Economic Development: EastAsian Industrialization 1950-2003.”
5/11/2018 R Islam 2010 Jobless Growth Occasional_Paper - slidepdf.com
http://slidepdf.com/reader/full/r-islam-2010-jobless-growth-occasionalpaper 45/47
References
Development and Change, 36(6):1059-94.
The Economist , 31 January- 6 February 2009.
Tilakaratna, Ganga, Priyanka Jayawardena andTushitha Kumara.2006. “EconomicGrowth, Employment and PovertyReduction in Sri Lanka.” Unpublishedstudy, ILO, Geneva.
United Nations Development Programme. 1993. Human Development Report 1993. NewYork: UNDP.
______.1996. Human Development Report 1996:
Economic Growth and Human
Development . New York: UNDP.
United Nations Industrial Development
Organization.2005. Industrial Statistics
Data (Indstat 3), electronic version.
UNIDO, Vienna.
World Bank. 1978. World Development Report
1978. World Bank, Washington, D.C.
______.1993. The East Asian Miracle: Economic
Growth and Public Policy. New York:
Oxford University Press.
______.1998. World Development Indicators
1998. Washington D.C: World Bank.
______.1999. World Development Report 1999.
Washington D.C: World Bank.
______.2004. World Development Indicators
2004. Online
______.2007. World Development Indicators
2007 . Online
Young, Alwyn. 1995. “The Tyranny of Numbers:
Confronting the Statistical Realities of the
East Asian Growth Experience.”
Quarterly Journal of Economics, 110(3):
641-80.
www.bps.go.id.
www.global.factiva.com/aa/default.aspx?pp=Print
&hc=Publication
5/11/2018 R Islam 2010 Jobless Growth Occasional_Paper - slidepdf.com
http://slidepdf.com/reader/full/r-islam-2010-jobless-growth-occasionalpaper 46/47
38
The Challenge of Jobless Growth in Developing Countries
Appendix: A Brief Description of the Data
Used
1. UNIDO data
UNIDO brings out industrial statistics on a
periodic basis; “Indstat 3 rev 2” brought out in
2005 is the latest available in that series. Data
pertaining to manufacturing industries classified at
the three-digit level of ISIC are presented by coun-
try, industry and year. Following items are covered
by this data set: number of establishments,
employment, wages and salaries, output, value
added, gross fixed capital formation, number of
female employees, and index number of industrial
production.
The data cover 28 industries. The period
covered ends in 2003, but the latest year for most
of the data is 2002. Moreover, the coverage differs
across countries and variables; and there are
important gaps for a number of countries.
While data from the OECD member countries
are first collected by OECD and then provided to
the UNIDO, data for non-OECD countries are
collected by the UNIDO directly from the national
statistical offices of the respective countries.
The data are originally stored national
currency values at current prices. The system
allows conversion of values from national
currency into US Dollars using the average period
exchange rates as given in the International Finan-
cial Statistics. For purposes of the present paper,all values (both value added and values of fixed
assets have been converted into constant prices by
using a deflator for the manufacturing sector
calculated from data available in World Develop-
ment Indicators (online).
2. Data used for decomposition of GDP
Data used in Tables 3a and 3b for decompos-
ing GDP growth into productivity and employment
growth has been obtained from the databaseprovided by the Groningen Growth and Develop-
ment Centre and the Conference Board. That
database which covers 125 countries of the world
is available online at http://www.ggdc.net. The
data included in that database are compiled from a
variety of well-known international sources, e.g.,
the World Bank, the regional development banks
(like the Asian Development Bank), and the Inter-
national Labour Organisation.

5/11/2018 R Islam 2010 Jobless Growth Occasional_Paper - slidepdf.com
http://slidepdf.com/reader/full/r-islam-2010-jobless-growth-occasionalpaper 47/47