Embed Size (px)
Citation preview
INVESTORPRESENTATION
Malindo Feedmill
I N V E S T O
R RE L A T I O
N
May 7, 2018 1
CompanyBackground
2May 7, 2018
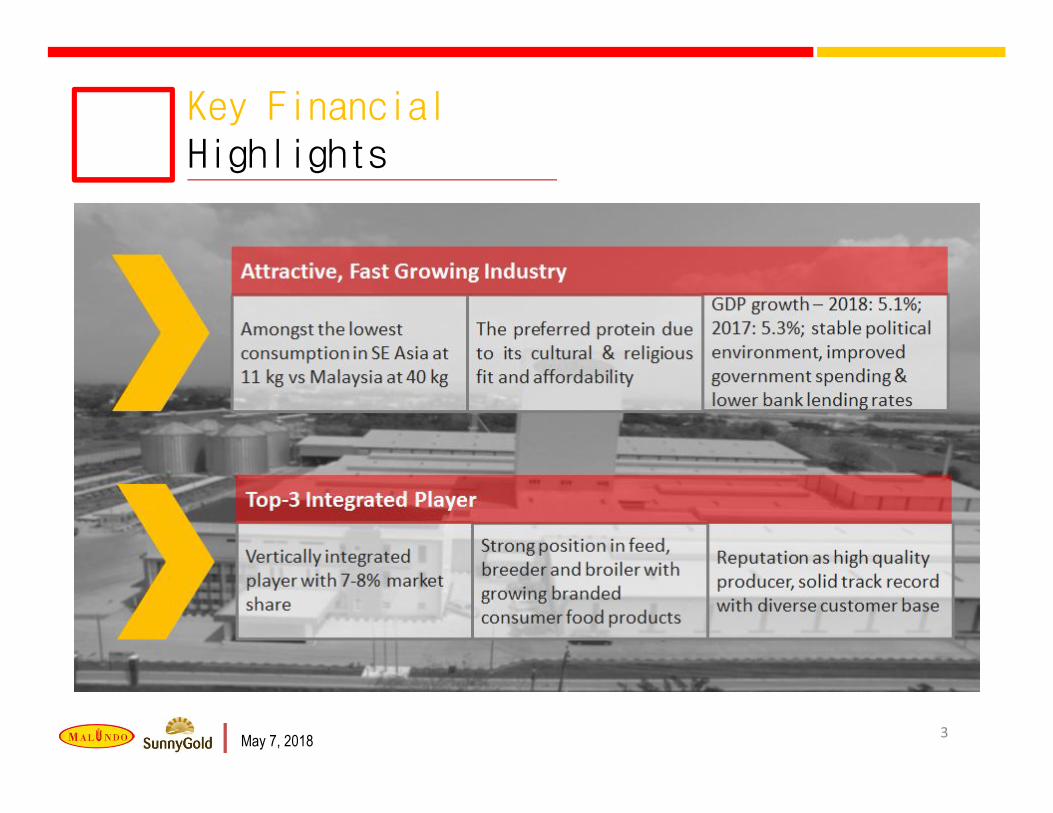
Key FinancialHighlights
3May 7, 2018
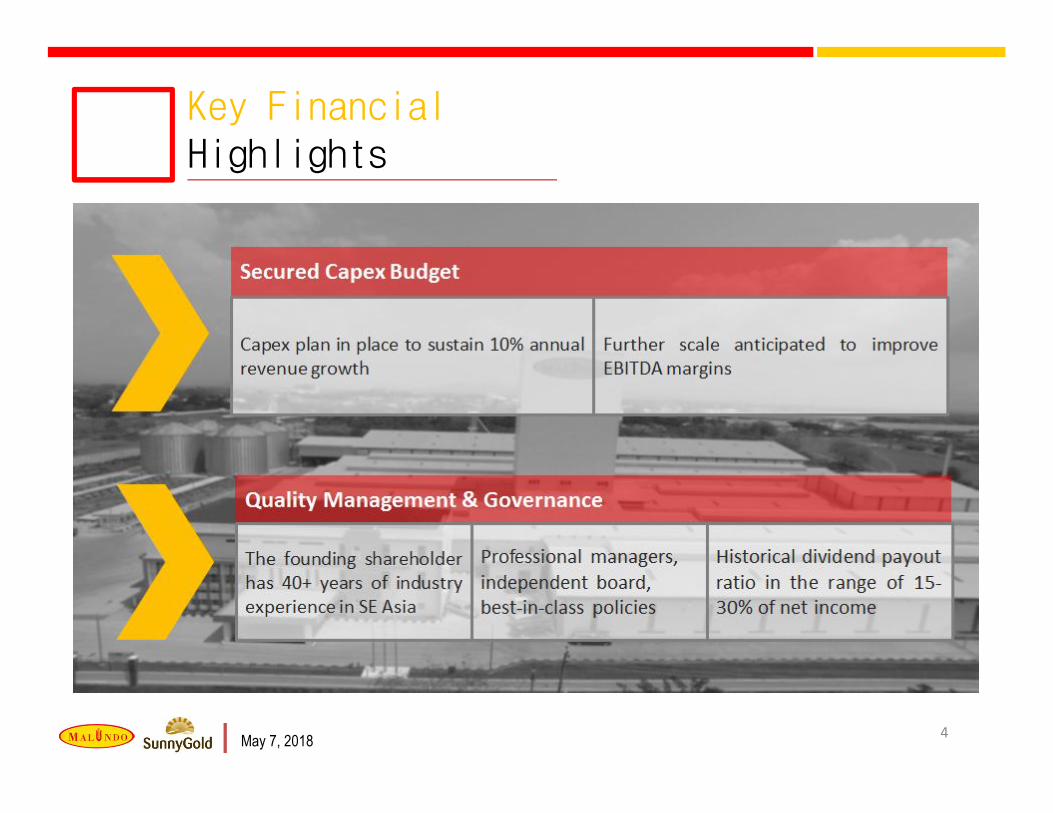
Key FinancialHighlights
4May 7, 2018
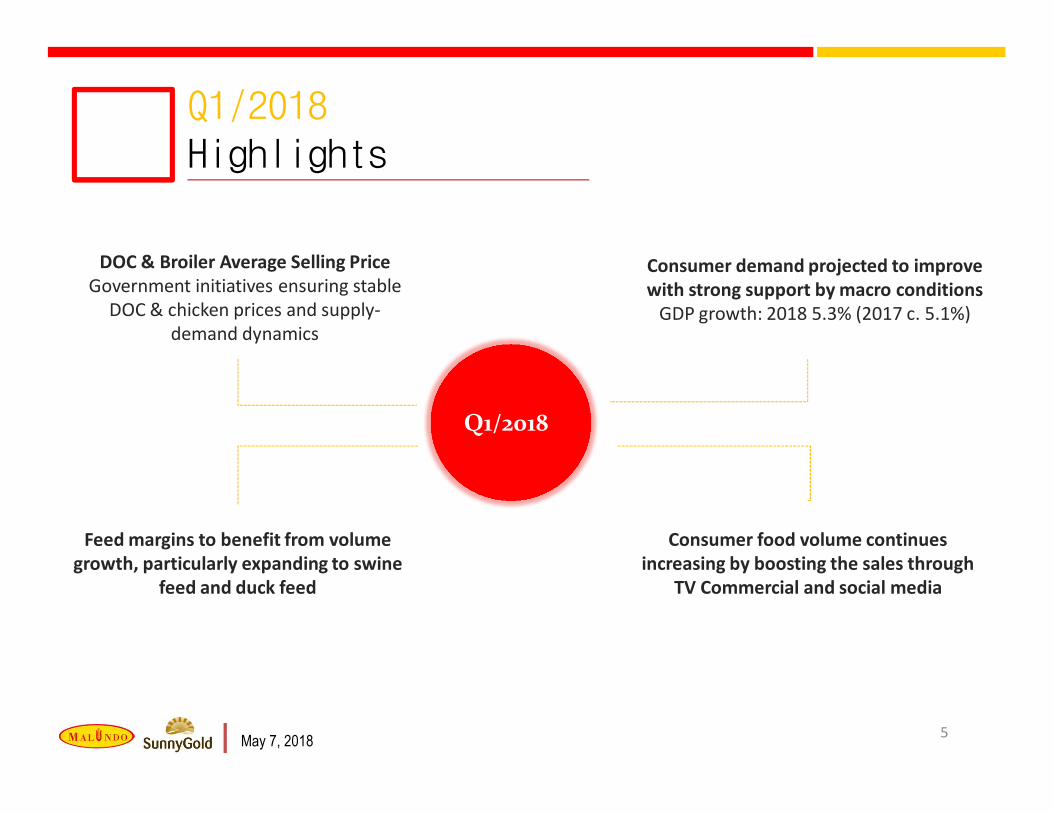
Q1/2018Highlights
DOC & Broiler Average Selling PriceGovernment initiatives ensuring stable
DOC & chicken prices and supply-demand dynamics
Q1/2018
Consumer demand projected to improve with strong support by macro conditions
GDP growth: 2018 5.3% (2017 c. 5.1%)
Feed margins to benefit from volume growth, particularly expanding to swine
feed and duck feed
Consumer food volume continues increasing by boosting the sales through
TV Commercial and social media
5May 7, 2018
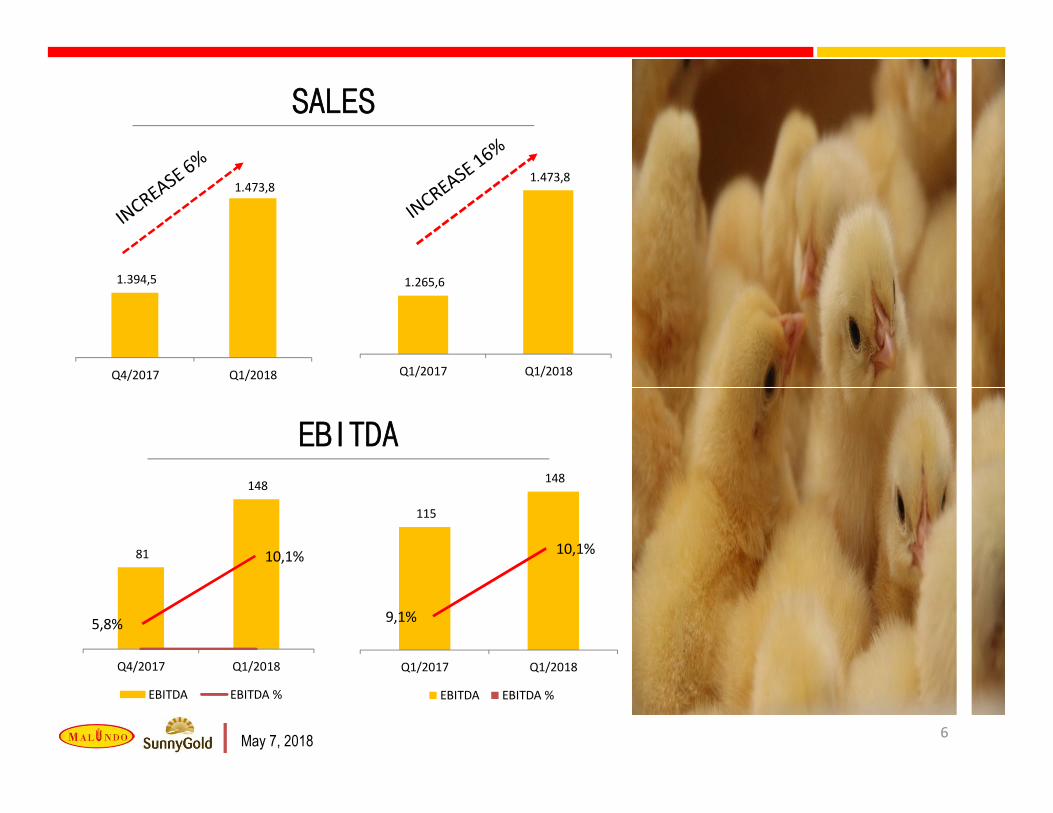
6
1.394,5
1.473,8
Q4/2017 Q1/2018
SALES
1.265,6
1.473,8
Q1/2017 Q1/2018
81
148
Q4/2017 Q1/2018
EBITDA EBITDA %
5,8%
10,1%
115
148
Q1/2017 Q1/2018
EBITDA EBITDA %
9,1%
10,1%
EBITDA
May 7, 2018
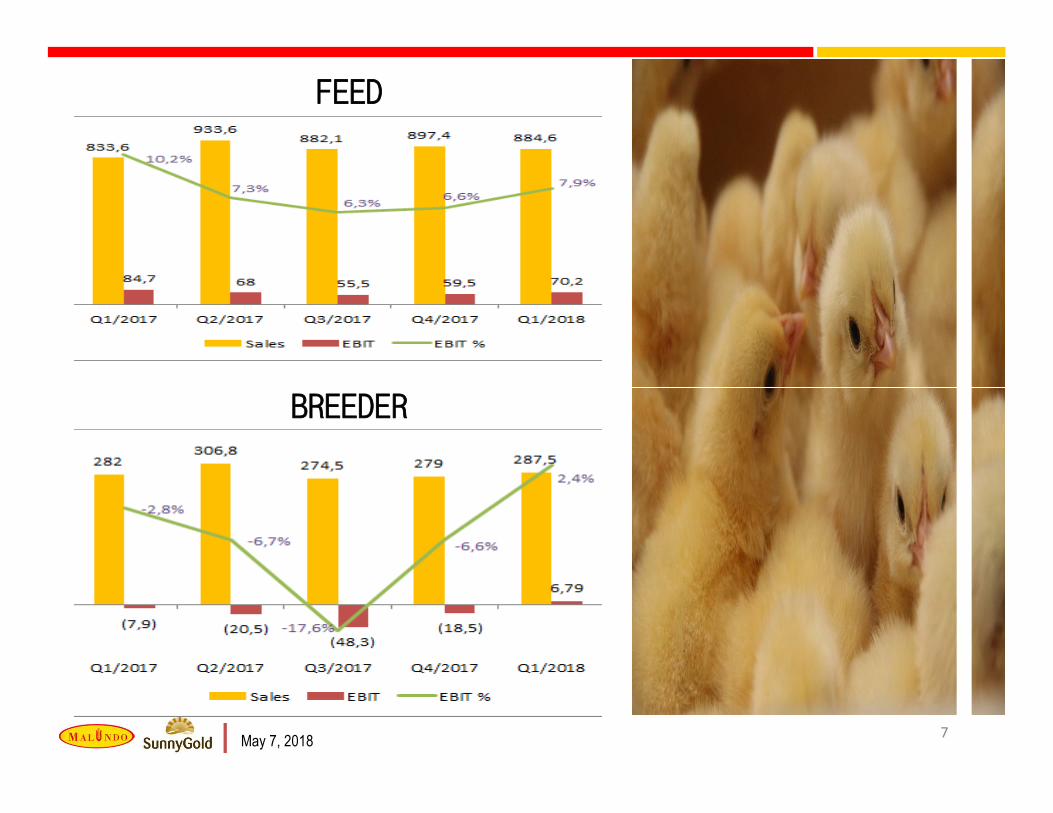
7
FEED
BREEDER
May 7, 2018
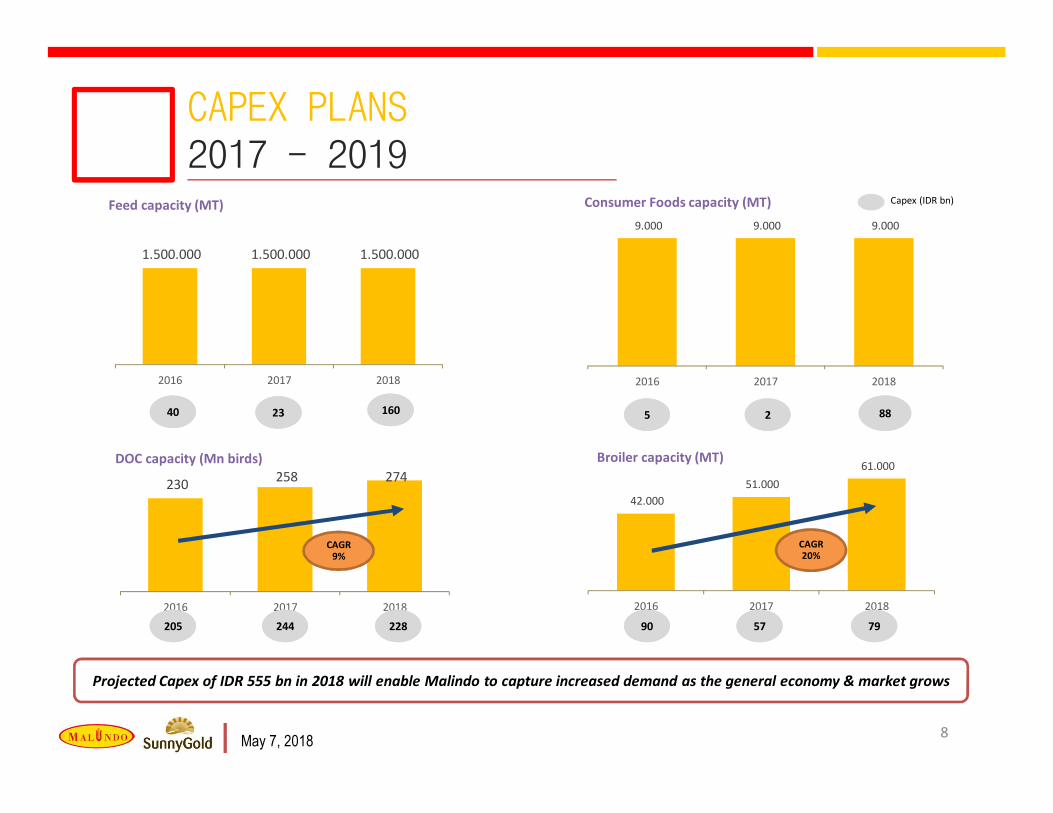
230 258 274
2016 2017 2018
CAPEX PLANS2017 - 2019
8
42.000 51.000
61.000
2016 2017 2018
Broiler capacity (MT)DOC capacity (Mn birds)
Consumer Foods capacity (MT)Feed capacity (MT)
Projected Capex of IDR 555 bn in 2018 will enable Malindo to capture increased demand as the general economy & market grows
57 79244 228 90205
Capex (IDR bn)
88223 160 540
CAGR9%
CAGR20%
9.000 9.000 9.000
2016 2017 2018
1.500.000 1.500.000 1.500.000
2016 2017 2018
May 7, 2018
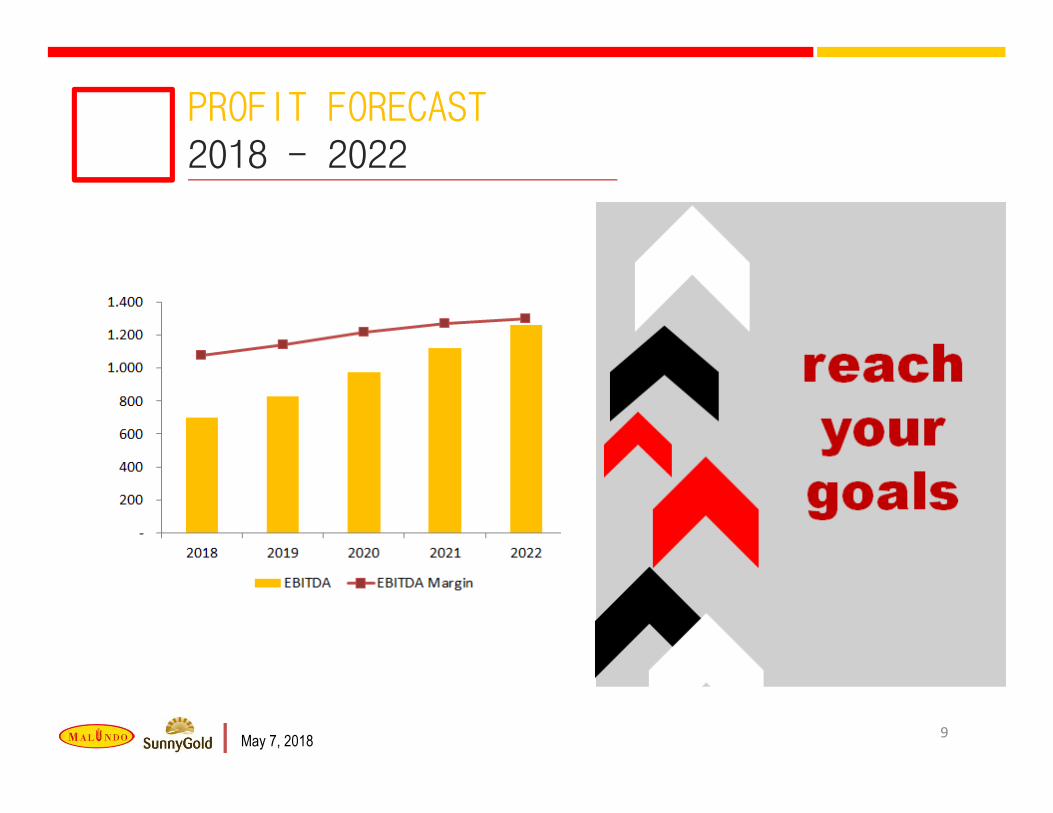
PROFIT FORECAST2018 - 2022
9May 7, 2018
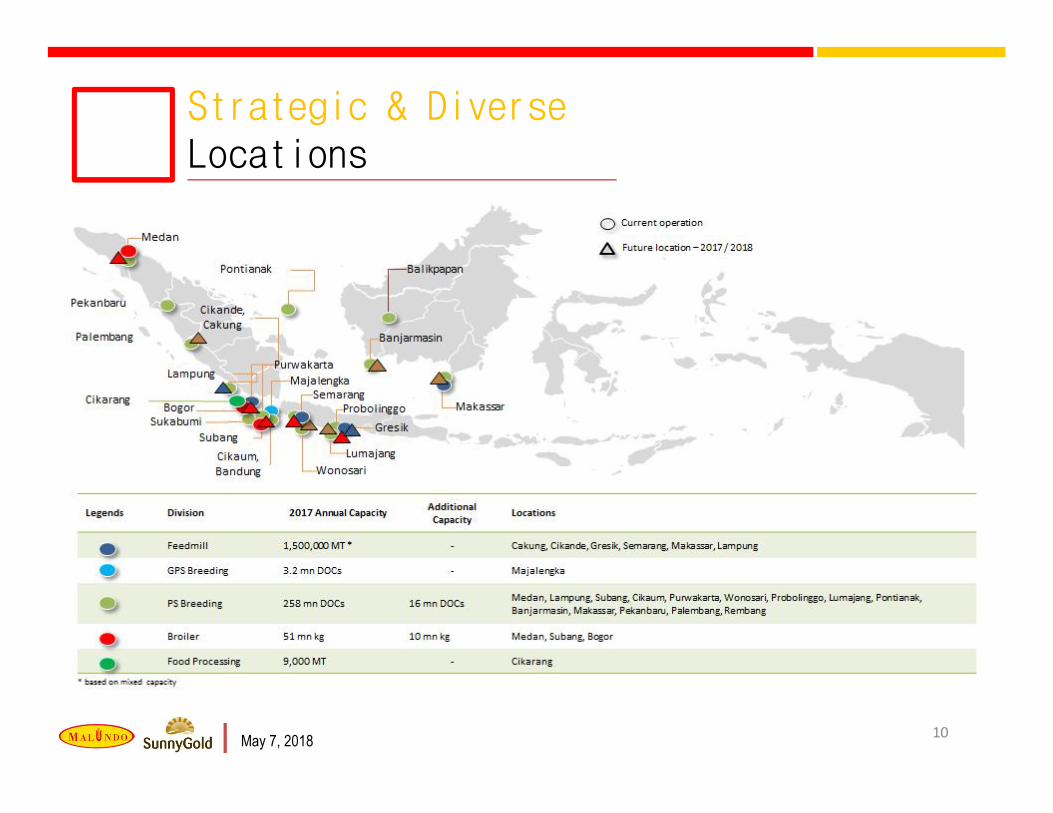
Strategic & Diverse Locations
10May 7, 2018
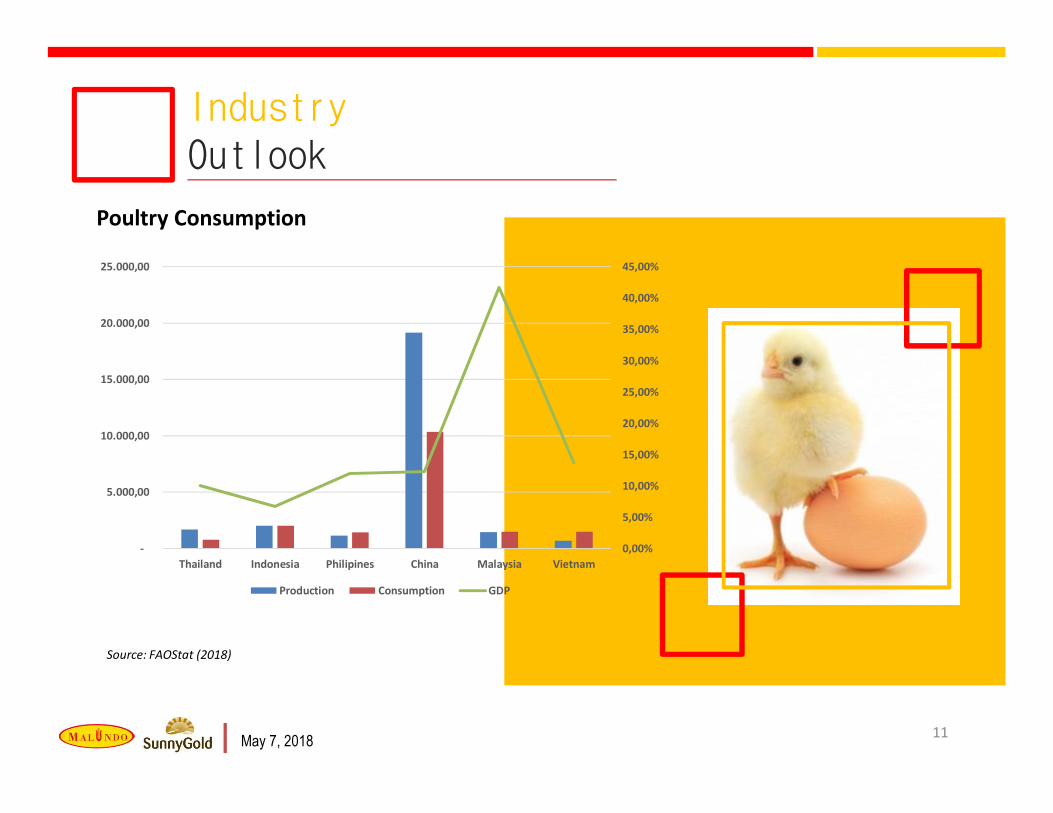
IndustryOutlook
11
Source: FAOStat (2018)
Poultry Consumption
0,00%
5,00%
10,00%
15,00%
20,00%
25,00%
30,00%
35,00%
40,00%
45,00%
-
5.000,00
10.000,00
15.000,00
20.000,00
25.000,00
Thailand Indonesia Philipines China Malaysia Vietnam
Production Consumption GDP
May 7, 2018
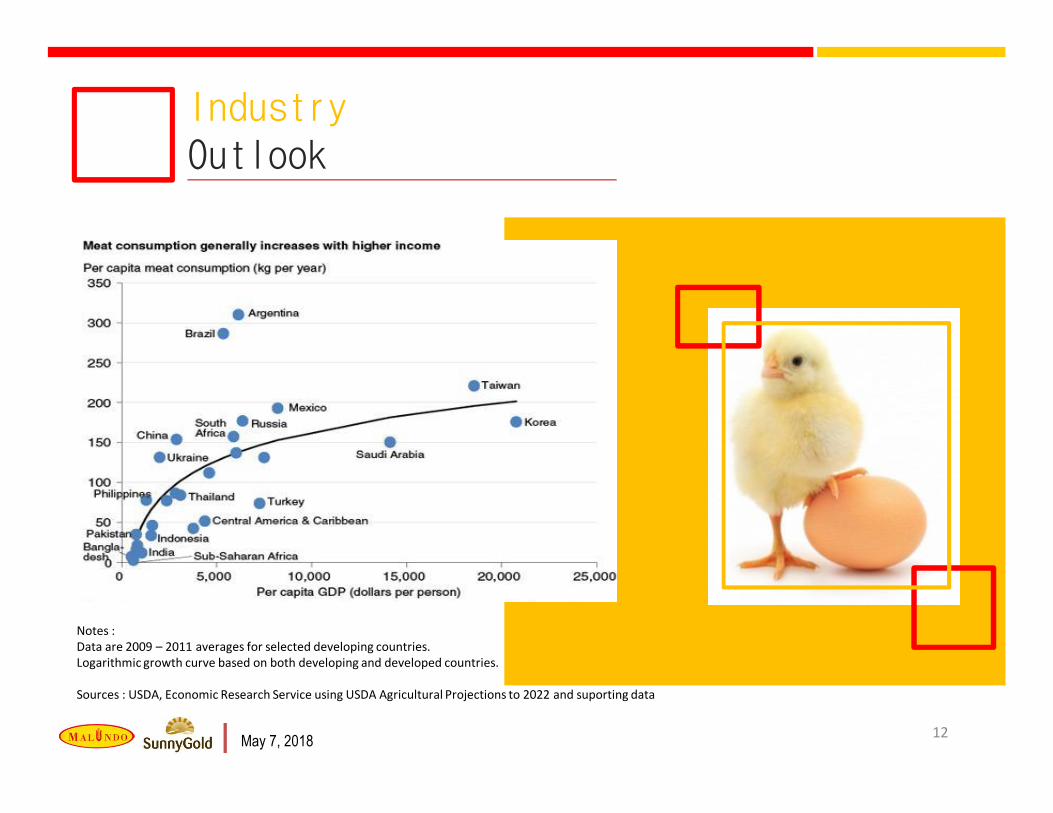
IndustryOutlook
12
Notes : Data are 2009 – 2011 averages for selected developing countries.Logarithmic growth curve based on both developing and developed countries.
Sources : USDA, Economic Research Service using USDA Agricultural Projections to 2022 and suporting data
May 7, 2018
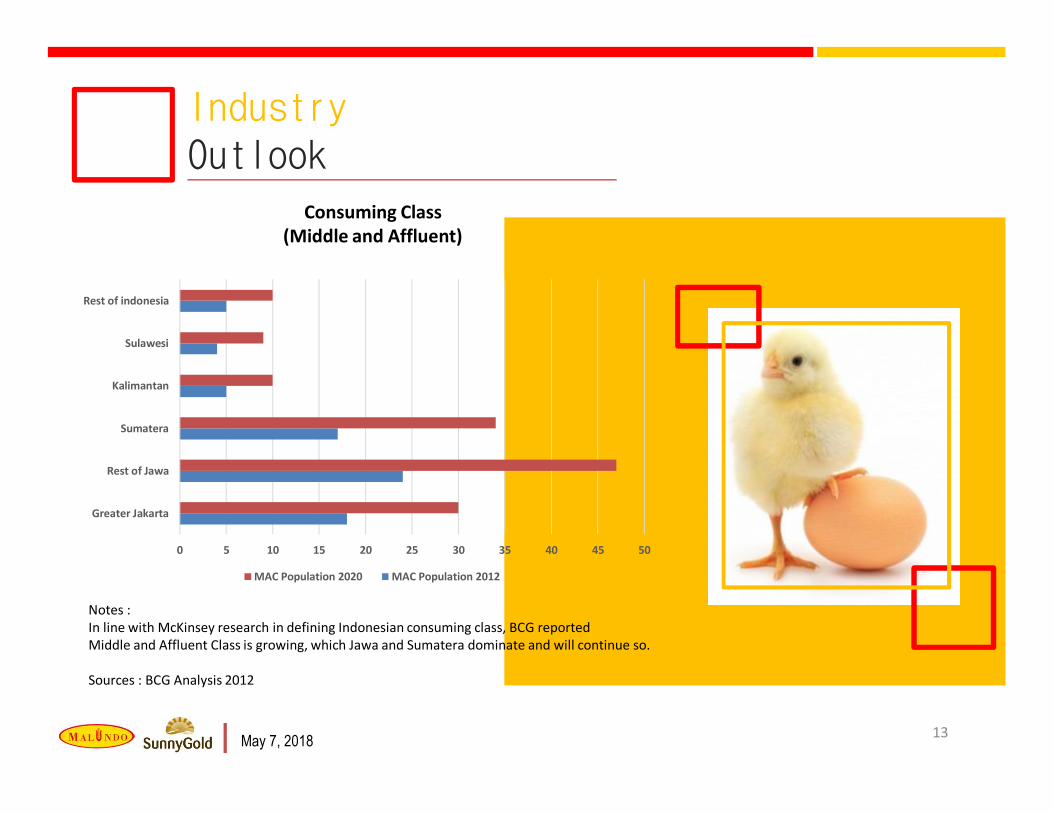
IndustryOutlook
13
Consuming Class(Middle and Affluent)
Notes : In line with McKinsey research in defining Indonesian consuming class, BCG reportedMiddle and Affluent Class is growing, which Jawa and Sumatera dominate and will continue so.
Sources : BCG Analysis 2012
0 5 10 15 20 25 30 35 40 45 50
Greater Jakarta
Rest of Jawa
Sumatera
Kalimantan
Sulawesi
Rest of indonesia
MAC Population 2020 MAC Population 2012
May 7, 2018
BusinessLines
14
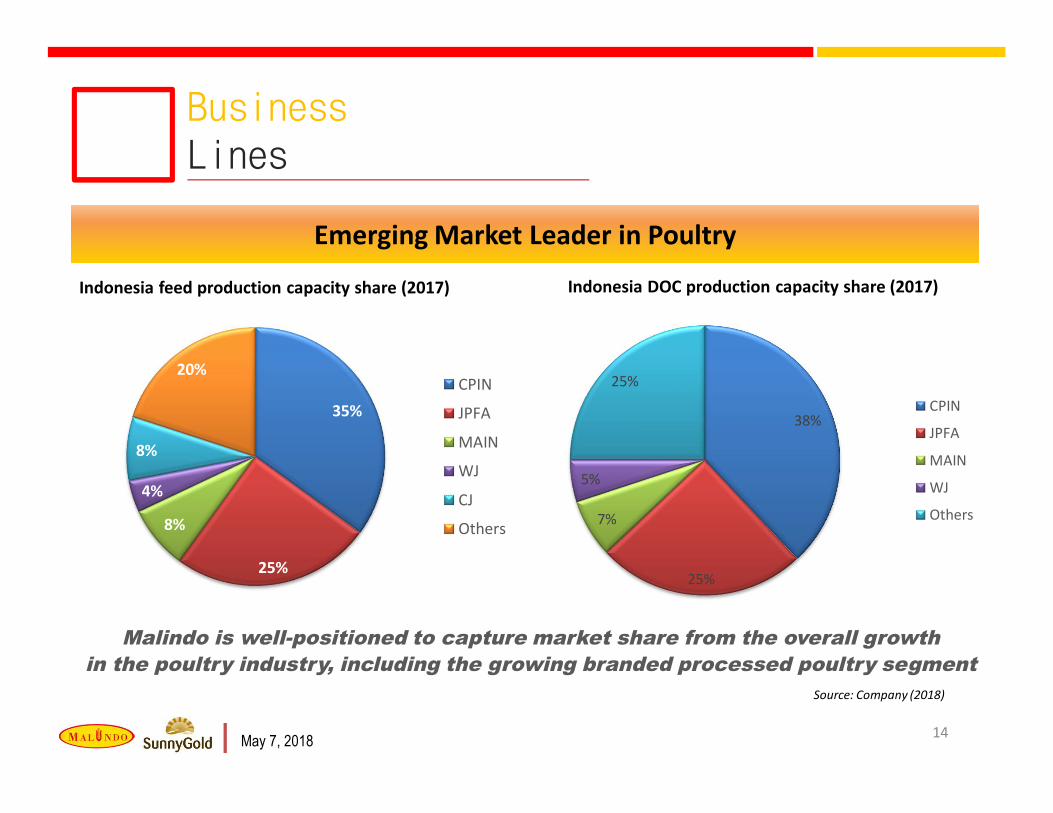
Emerging Market Leader in Poultry
Indonesia feed production capacity share (2017)
35%
25%
8%
4%
8%
20%CPIN
JPFA
MAIN
WJ
CJ
Others
Indonesia DOC production capacity share (2017)
38%
25%
7%
5%
25%CPIN
JPFA
MAIN
WJ
Others
Malindo is well-positioned to capture market share from the overall growthin the poultry industry, including the growing branded processed poultry segment
Source: Company (2018)
May 7, 2018
FeedUpdates
15
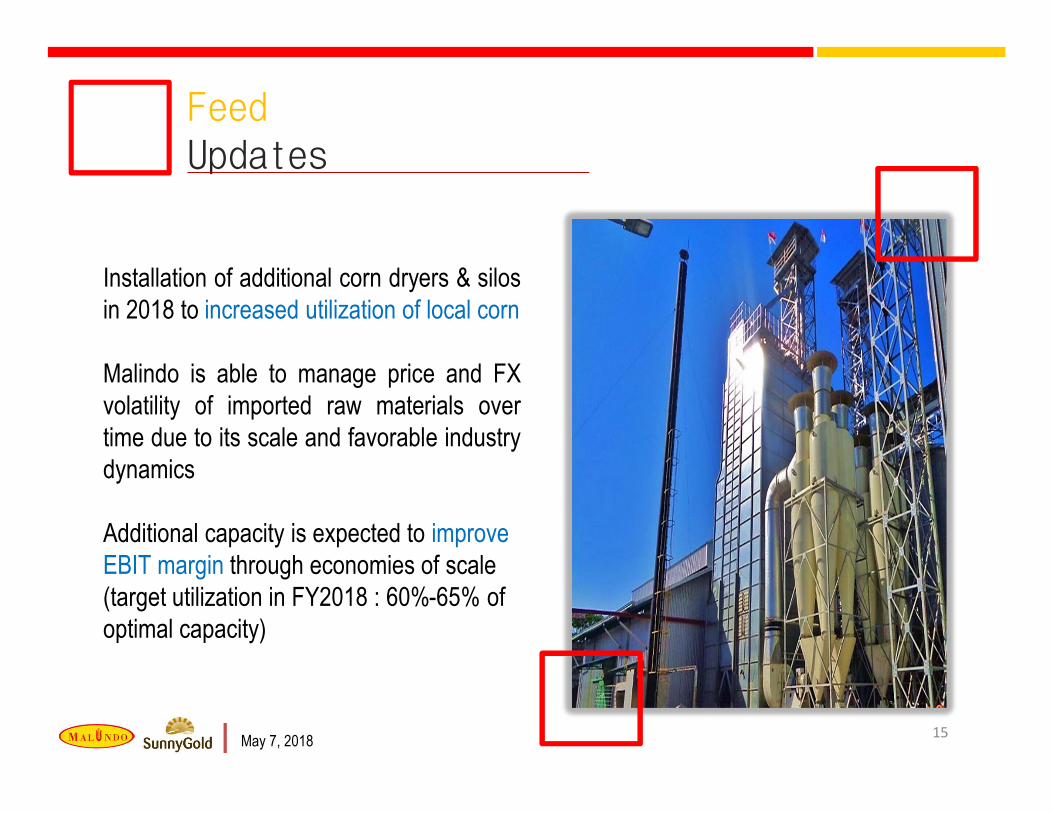
Installation of additional corn dryers & silosin 2018 to increased utilization of local corn
Malindo is able to manage price and FXvolatility of imported raw materials overtime due to its scale and favorable industrydynamics
Additional capacity is expected to improve EBIT margin through economies of scale(target utilization in FY2018 : 60%-65% of optimal capacity)
May 7, 2018
BreederUpdates
16May 7, 2018
BreederUpdates
17May 7, 2018
BroilerUpdates
18
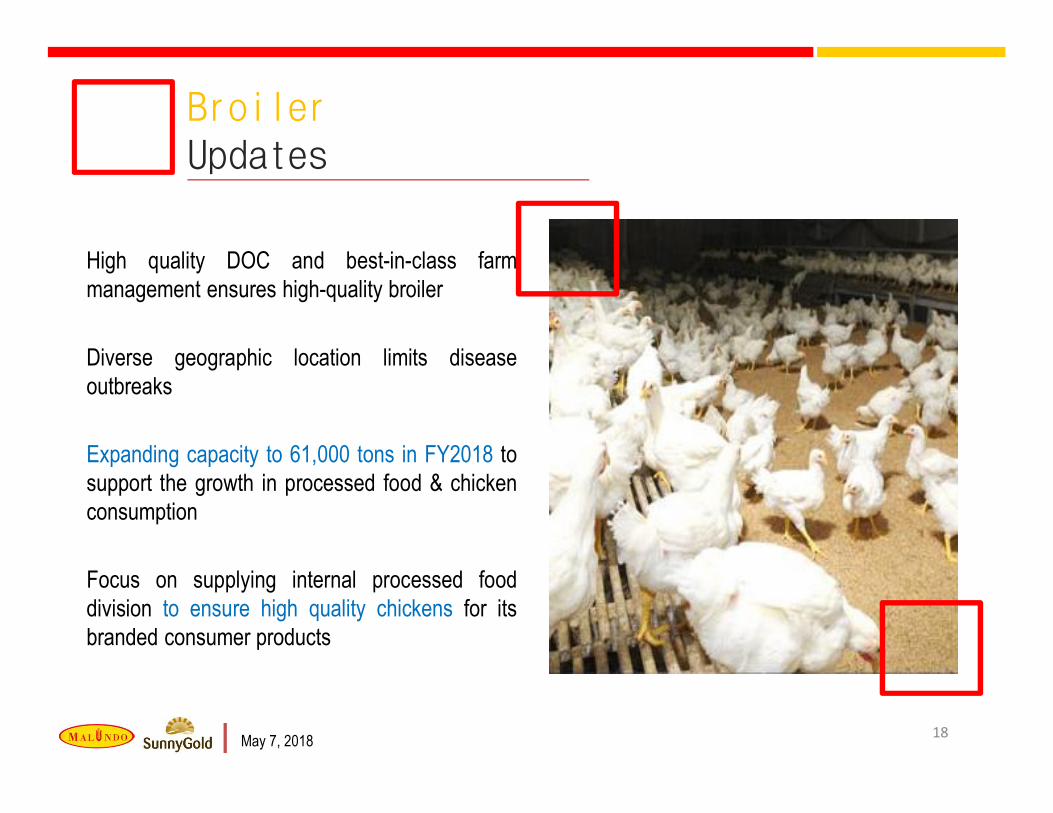
High quality DOC and best-in-class farmmanagement ensures high-quality broiler
Diverse geographic location limits diseaseoutbreaks
Expanding capacity to 61,000 tons in FY2018 tosupport the growth in processed food & chickenconsumption
Focus on supplying internal processed fooddivision to ensure high quality chickens for itsbranded consumer products
May 7, 2018
Processed FoodUpdates
19
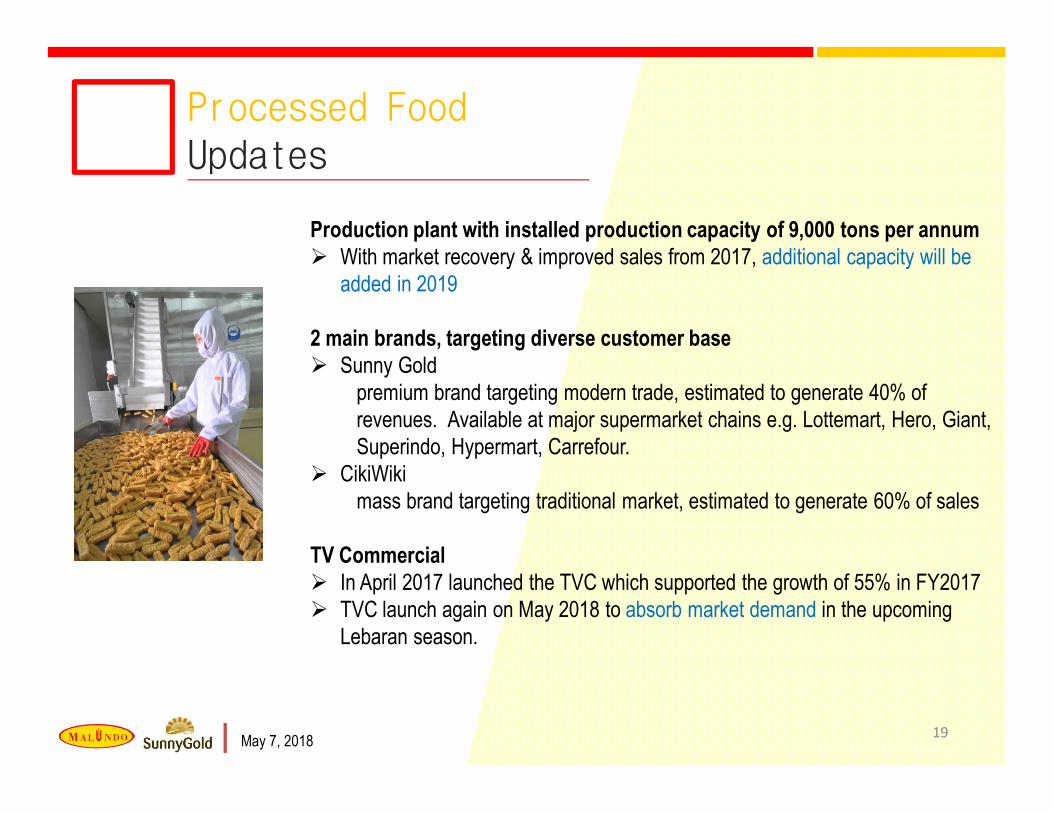
Production plant with installed production capacity of 9,000 tons per annum With market recovery & improved sales from 2017, additional capacity will be
added in 2019
2 main brands, targeting diverse customer base Sunny Gold
premium brand targeting modern trade, estimated to generate 40% of revenues. Available at major supermarket chains e.g. Lottemart, Hero, Giant, Superindo, Hypermart, Carrefour.
CikiWikimass brand targeting traditional market, estimated to generate 60% of sales
TV Commercial In April 2017 launched the TVC which supported the growth of 55% in FY2017 TVC launch again on May 2018 to absorb market demand in the upcoming
Lebaran season.
May 7, 2018