Embed Size (px)
Citation preview

(
I ..... -...
r .............................................. AGARD-CP-558 •
L
0:) III III
I
D. o I
Q
~ ADVISORY GROUP FOR AEROSPACE RESEARCH & DEVELOPMENT
~ 7 RUE ANCELLE, 92200 NEUILL Y-SUR-SEINE, FRANCE
__________________ -=1
l
AGARD CONFERENCE PROCEEDINGS 558
Erosion, Corrosion and Foreign Object Damage Effects in Gas Turbines (Les consequences de l' endommagement des turbines a gaz par erosion, corrosion et objets etrangers)
Papers presented at the PropuLsion and Energetics PaneL (PEP) Symposium heLd in Rotterdam, The Netherlands, 25-28 ApriL 1994 .
I
-~+~ - NORTH ATLANTIC TREATY ORGANIZATION
Published November 1994
Distribution and Availability on Back Cover
_J
I
https://ntrs.nasa.gov/search.jsp?R=19950013267 2018-06-24T17:56:59+00:00Z

( . . -----~----
36-1
RESISTANCE OF SILICON NITRIDE TURBINE COMPONENTS TO EROSION AND HOT CORROSION/OXIDATION ATTACK
Thomas E. Strangman AlliedSignal Engines
Phoenix, Arizona, USA
Dennis S. Fox NASA Lewis Research Center
Cleveland, Ohio, USA
1 SUMMARY
Silicon nitride turbine components are under intensive development by AlliedSignal to enable a new generation of higher power density auxiliary power systems. In order to be viable in the intended applications, silicon nitride turbine airfoils must be designed for survival in aggressive oxidizing combustion gas environments. Erosive and corrosive damage to ceramic airfoils from ingested sand and sea salt must be avoided.
Recent engine test experience demonstrated that NT154 silicon nitride turbine vanes have exceptional resistance to sand erosion, relative to superalloys used in production engines. Similarly, NTl54 silicon nitride has excellent resistance to oxidation in the temperature range of interest - up to 1400C.
Hot corrosion attack of superalloy gas turbine components is well documented. While hot corrosion from ingested sea salt will attack silicon nitride substantially less than the superalloys being replaced in initial engine applications, this degradation has the potential to limit component lives in advanced engine applications. Hot corrosion adversely affects the strength of silicon nitride in the 850 to 1300C range.
Since unacceptable reductions in strength must be rapidly identified and avoided, AlliedSignal and the NASA Lewis Research Center have pioneered the development of an environmental life prediction model for silicon nitride turbine components. Strength retention in flexure specimens following I to 3300 hour exposures to high temperature oxidation and hot corrosion has been measured and used to calibrate the life prediction model. Predicted component life is dependent upon engine de-
sign (stress, temperature, pressure, fuel/air ratio, gas velocity, and inlet air filtration), mission usage (fuel sulfur content, location [salt in air], and times at duty cycle power points), and material parameters.
Preliminary analyses indicate that the hot corrosion resistance of NT154 silicon nitride is adequate for AlliedSignal's initial engine applications. Protective coatings and/or inlet air filtration may be required to achieve required ceramic component lives in more aggressive environments.
2 Introduction
Silicon nitride ceramics are under intensive development for advanced gas turbine applications. In order to be viable, silicon nitride turbine airfoils must be designed for survival in aggressive erosive, oxidizing combustion gas environments. This paper reviews the stability of silicon nitride in aggressive environments and describes the status of environmental life prediction for gas turbine applications.
3 Experimental Procedure
The NTl54 silicon nitride used for this study was manufactured by Norton Advanced Cera mic s (Northboro, MA). This commercially available hot isostatically pressed (HIPped) silicon nitride material contains 4 weight percent yttria added as the densification aid.
Billets for flexure specimens were cold isostatically pressed from the powder and then HIPed to full density. Turbine vanes used in the erosion tests were produced by slip casting the vane to near-net-shape and HIPing to
Paper presented at the Propulsion and Energetics Panel (PEP) Symposium held in Rotterdam, The Netherlands, in April 1994.
'~l
/' (
I 36-2
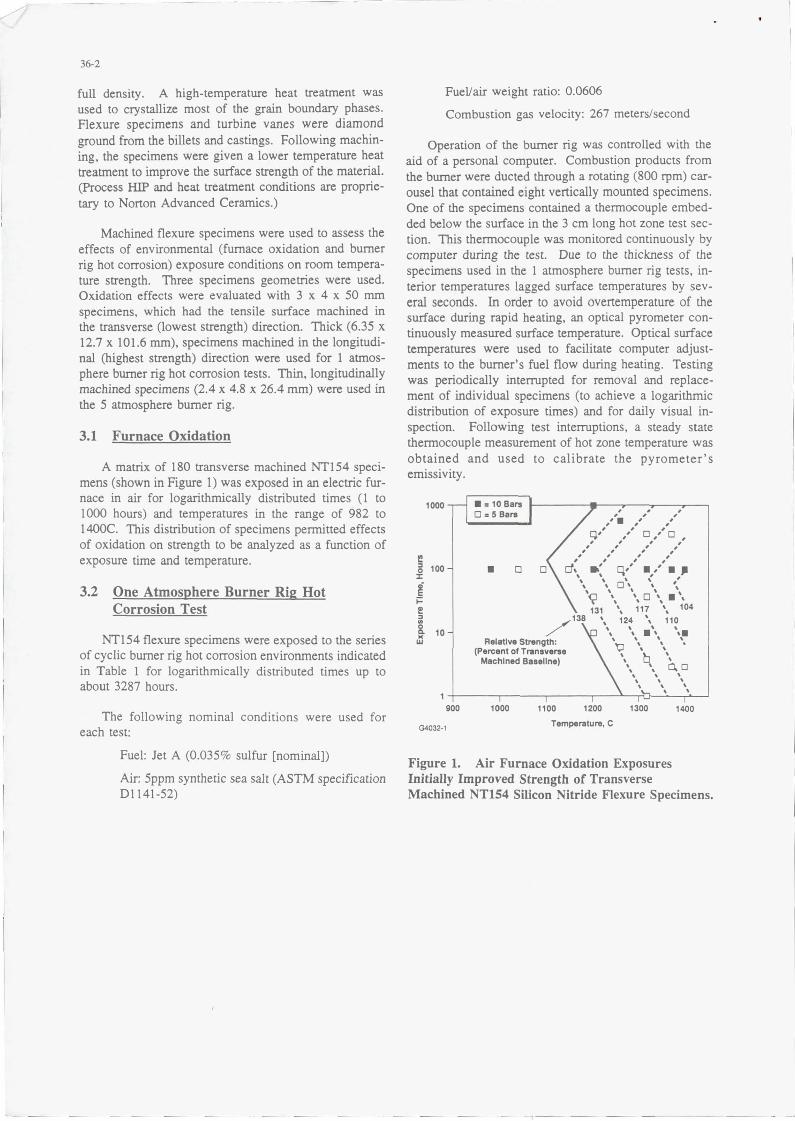
full density. A high-temperature heat treatment was used to crystallize most of the grain boundary phases. Flexure specimens and turbine vanes were diamond ground from the billets and castings. Following machining, the specimens were given a lower temperature heat treatment to improve the surface strength of the material. (Process HIP and heat treatment conditions are proprietary to Norton Advanced Ceramics.)
Machined flexure specimens were used to assess the effects of environmental (furnace oxidation and burner rig hot corrosion) exposure conditions on room temperature strength. Three specimens geometries were used. Oxidation effects were evaluated with 3 x 4 x 50 mm specimens, which had the tensile surface machined in the transverse (lowest strength) direction. Thick (6.35 x 12.7 x 101.6 mm), specimens machined in the longitudinal (highest strength) direction were used for 1 atmosphere burner rig hot corrosion tests. Thin, longitudinally machined specimens (2.4 x 4.8 x 26.4 mm) were used in the 5 atmosphere burner rig.
3.1 Furnace Oxidation
A matrix of 180 transverse machined NT154 specimens (shown in Figure 1) was exposed in an electric furnace in air for logarithmically distributed times (1 to 1000 hours) and temperatures in the range of 982 to 1400C. This distribution of specimens permitted effects of oxidation on strength to be analyzed as a function of exposure time and temperature.
3.2 One Atmosphere Burner Rig Hot Corrosion Test
NT154 flexure specimens were exposed to the series of cyclic burner rig hot corrosion environments indicated in Table 1 for logarithmically distributed times up to about 3287 hours.
The following nominal conditions were used for each test:
Fuel: Jet A (0.035% sulfur [nominal])
Air: 5ppm synthetic sea salt (ASTM specification DI141-52)
FueUair weight ratio: 0.0606
Combustion gas velocity: 267 meters/second
Operation of the burner rig was controlled with the aid of a personal computer. Combustion products from the burner were ducted through a rotating (800 rpm) carousel that contained eight vertically mounted specimens. One of the specimens contained a thermocouple embedded below the surface in the 3 cm long hot zone test section. This thermocouple was monitored continuously by computer during the test. Due to the thickness of the specimens used in the I atmosphere burner rig tests, interior temperatures lagged surface temperatures by several seconds. In order to avoid overtemperature of the surface during rapid heating, an optical pyrometer continuously measured surface temperature. Optical surface temperatures were used to facilitate computer adjustments to the burner's fuel flow during heating. Testing was periodically interrupted for removal and replacement of individual specimens (to achieve a logarithmic distribution of exposure times) and for daily visual inspection. Following test interruptions, a steady state thermocouple measurement of hot zone temperature was obtained and used to calibrate the pyrometer's emissivity.
1000
e 5 100 J::
g i= e :l
[ 10 >C W
, , , , , , ,'.,' "
,I' 0 ,,' 0 , , , , , , , , , , , " " " • 0 [j...' q,' .,'. II \.' " \. \. 0\ \. '" , \ , , \
\l \. \0\_, 131 '. 117 '. 104
/138 '. 124 '. 110
./" \. \..\ \. \ , , \.
Relative Strength: '0 '. '. (Percent 01 Transverse • b •
Machined Baseline) '.. ~ 0 , , '-' , , . . , . , . . 1~----~------,-----.---~-rb--'~-r'~
900 1000 1100 1200 1300
G4032-' Temperature, C
Figure 1. Air Furnace Oxidation Exposures Initially Improved Strength of Transverse
1400
Machined NT154 Silicon Nitride Flexure Specimens.
-- -- ,-- - - ---
r ---------.---- ---
36-3
Table 1. Atmospheric Burner Rig Cyclic Hot Corrosion Environments.
Test Cycle Test Duration 1 860C/27 minutes + air cool/3 minutes 3287 hours 2 890C/27 minutes + air cool/3 minutes 600 hours 3 954C/27 minutes + air cool/3 minutes 600 hours 4 982C/27 minutes + air cool/3 minutes 400 hours 5 1052C/27 minutes + air cool/3 minutes 300 hours 6 1121 C/27 minutes + air cool/3 minutes 300 hours 7 1218C/27 minutes + air cool/3 minutes 300 hours 8 968C/3min + 1218C/24min + air cool/3m in 600 hours 9 968C/3min + 1288C/24min + air cool/3min 300 hours
ASTM synthetic sea salt was added to the combustion air at a concentration of Sppm (weight) by injecting an air atomized salt spray solution through a hole in the combustor's liner. Chemical analysis of the ASTM sea salt is provided in Table 2.
Table 2. Composition of Synthetic Sea Salt Used In Burner Rig Hot Corrosion Tests.
Salt Constituent Weight %
NaCI 58.49 MgC12-6H20 26.46 Na2S04 9.75 CaCI2 2.765 KCI 1.45 NaHC02 0.477 KBr 0.238 H3B03 0.071 SrC12-6H20 0.095 NaF 0.007
Following exposure to the above environments, flexure specimens were water washed to remove any unreacted salt and photographed to document the extent of corrosion as a function of exposure time in the test.
3.3 Five atmosphere burner rig test
Gas turbine engines operate at internal pressures greater than one atmosphere. For this reason, a NASA Lewis Research Center burner rig that can be pressurized up to five atmospheres was also used in this study. Hot corrosion occurs in a temperature range between the melting point of the salt and the dew point.[l] An increase in the rig pressure increases the dew point, thereby widening the temperature range in which corrosion will occur. The 5-atmosphere burner rig has been used previously to study the sodium sulfate hot corrosion of silicon nitride and silicon carbide.[2-4] In those studies, which were focused on identification of corrosion
mechanisms and effect of corrosion on strength, the four experimental variables (exposure time, exposure temperature, rig pressure, and salt concentration) were fixed.
The current study is different in that another salt (ASTM D1141-S2 synthetic sea salt) is used, and measured effects of pressure (1, 3 and 5 atmospheres), salt concentration in the combustion air (2, S and 10 ppm), and exposure time are obtained to facilitate development and validation of a life prediction model. A series of short (2 hour) S atmosphere burner rig tests was conducted at higher temperatures with 5 ppm sea salt to experimentally establish the dew point for salt deposition.
The NASA rig consists of a standard Mach 0.3 burner [2] with the samples enclosed in a flame tunnel. Pressure is increased by closing an exhaust control valve.[3] Groups of specimens were exposed for up to
75 hours in a 980C five-atmosphere burner rig (and subsequently flexure tested at room temperature). In the 5 atmosphere tests Jet A fuel was burned at a fueVair weight ratio of 0.025, and the combustion gas velocity was 53 mlsec. A total of eight samples were tested at each of the five exposure times. Sample size was 2.64 x 0.48 x 0.24 cm. The samples (four per run) were positioned horizontally with their thicknesses facing the flow. The sample ends were held in aluminosilicate (grade A lava) holders. The temperature was monitored with two type R thermocouples positioned between the specimens in the gas stream.[3] The salt was added by aspirating a salt water solution into the flame.
3.4 Flexure test
Exposed specimens were broken at room temperature in four-point flexure to quantify the effect of the environment on the swface strength of the NT154 silicon nitride. To facilitate testing of specimens exposed to hot corrosion conditions, silicate reaction products were re-
36-4
moved from the loading pin locations. Specimens exposed for long times in the one-atmosphere burner rig required a combination of abrasive grinding (240 grit) and dilute HF acid etching. Cleaning of the tensile surface of the specimens was limited to water washing. Loading pin locations on specimens exposed in the fiveatmosphere burner rig were cleaned by abrasive grinding with 180 grit. Specimens exposed in a furnace air oxidation environment received no post-exposure cleaning prior to testing.
Specimen geometries and room-temperature fourpoint bend flexure test conditions used to characterize effects of prior oxidation and hot corrosion environments are provided in Table 3.
3.5 Erosion test
Sand erosion tests were conducted using a GTCP85 auxiliary power unit. The test was conducted with a hybrid turbine nozzle consisting of 17 silicon nitride vanes and 6 superalloy vanes. The test was conducted for 9 hours at the maximum power setting. During this 9 hour period, AC coarse silica sand (0 to 200 ~ particle diameter) was injected into the combustor at a rate of 0.34 kilograms/hour.
3.6 Post-test analysis
All flexure specimens were examined visually at a minimum lOX magnification in order to identify the fracture origin. Selected specimens were also examined under the SEM to further characterize the fracture origin and oxidation/hot corrosion microstructures. EDX and WDX spectroscopy were used during the SEM analyses to characterize elements present in the corrosion products.
Engine tested vanes were examined visually and with fluorescent penetrant for evidence of erosion and cracking.
- ----- -
4 Results and Discussion
4.1 Oxidation
Effect of oxidation on flexure strength
Following exposure in the static air furnace, the specimens were tested in four-point bending at room temperature. Test results are shown as lines of relative strength in Figure 1. Test data and failure origin locations for individual specimens are documented in Reference 5.
Unexpectedly, exposure to the oxidation environment increased strength, relative to as-received specimens, which had the standard Norton pre-oxidation heat treatment. Exposures in the 980 to 1200C range provided the largest improvement (up to a 38% increase) in strength. For longer exposure times (up to 100 hours) in the 1100C to 1400C temperature range, specimen strength decreased, but still remained above as-received values.
Figure 1 also illustrates unusual behavior for exposures longer than 100 hours in the 1100 to 1400C temperature range; the average specimen strength increased with additional exposure time. This behavior was unexpected since it was not observed in an earlier evaluation of NT154 specimens oxidized in a cyclic 1260C Mach 0.3 burner rig environment.[6] Following exposure to this cyclic burner rig test environment, which more closely simulates conditions within gas turbines, measured room temperature flexure strength continued to decline for exposures up to 1000 hours. The rate of strength reduction during 1000 hours in the burner rig environment was consistent with that of furnace exposed specimens for times up to 100 hours.
, I
---'

-- --- ~ - -- - ---
36-5
Table 3. Four-Point Flexure Tests Were Used to Quantity the Effects ot Environment on the Surface Strength ot NT154 Silicon Nitride.
Type ot Test Oxidation 1 atm burner rig 5 atm burner rig
Specimen Geometry 3 x 4 x 50mm
6.35x12.7x101.6mm 2.4 x 4.8x 26.4mm
Post-exposure room temperature flexure strength was modeled as a function of exposure time and temperature, using data with exposures less than or equal to 100 hours. In this time range, constant strength lines in Figure 1 have constant values of T + 33.33*ln[t], where T is the temperature in degrees C and t is the time in hours. Strengths for the 145 specimens with exposure times up to 100 hours was described with the following equation:
average flexure = 1690 - 0.614* (T + 33.33*Ln[t)) > 925 MPa strength G471JO.74
Fractures in the as-received specimens, which were pre-oxidation heat treated by Norton, typically initiated in the chamfered edge of the specimen. Only seven percent of the as-received transverse machined specimens failed on the tensile surface. This result implies that machining damage was more severe on the chamfer than on the transverse machined surface.
Exposure to the high-temperature oxidizing environment reduced the severity of chamfer damage; i.e., over eighty percent of the environmentally exposed specimens failed on the tensile surface. When specimens associated with chamfer failure are eliminated from the database , scatter in the data is reduced, as shown in Figure 2.
Oxidation Affected Surface Layer
Although specimen weights were measured before and after exposure to the furnace air environment, weight changes were trivial -- within measurement error. Therefore, fracture surfaces were examined on the SEM to determine the thickness of the oxidation-affected layer. In this analysis, it was found that growth of the oxidation-affected layer of these specimens appeared to follow logarithmic instead of expected parabolic growth behavior. Wavelength dispersive X-ray CWDX) maps from fracture surfaces indicated that an oxygen gradient
Flexure Test Parameters
Inner/outer Spans Crosshead Speed
20/40 mm 0.5 mmfminute 19/38 mm 9.Sf19 mm
0.25 mm/minute 0.5 mm/minute
existed in the surface layer of the silicon nitride. WDX analysis also indicated that the concentration of nitrogen in the oxygen-affected zone remained high -- almost to
the level present below the oxygen-affected zone.
Applicability of logarithmic or parabolic growth kinetics in NTl54 is the subject of an on-going investigation. At this time the kinetics remain ambiguous in a 1300C air environment. Parabolic growth was documented in a 1300C oxygen environment.
Discussion
Oxidation at temperatures below 1400C strengthened the surface of NT154 and reduced the severity of machining induced surface flaws. It is speculated that the increase in flexure strength is a consequence of oxidation induced compressive stresses. Examination of fracture surfaces indicated that oxidation in this temperature range did not occur as a plane front process; i.e., an oxygen gradient exists below the surface, which is thought to imply preferential oxidation within grain boundaries (and machining microcracks). Compressive stresses are expected when the volume expansion associ-
"i ... 1200 ~-----------------~< .<;c.> g>§ 1000 t!!U) Uj.5 t!! e 800 ::J ::J )(C/I
£ ~ 600
Oxidized for 100 Hours In Static Air
= . I
t····~: · · · ., 0 D . ---' 0
o o I!!IU
~ g 400 § 8. ~ As-Received
~ ~ 200 I Solid Symbols: Failure Initiated on Tensile Surface 1 i ~ Open Symbols: Failure Initiated on Chamfer
~ O r I 800 1000 1200 1400
G4032-2 Exposure Temperature, C
Figure 2. Oxidation Increased Flexure Strength of Transverse Machined Specimens and Reduced Incidence of Chamfer Initiated Failures.
--- - - - - - -- -'

r 36-6
ated with oxidation (conversion of silicon nitride to silicon oxynitride) in grain boundaries and microcracks is constrained by unoxidized silicon nitride grains. Maximum strength is anticipated when oxidation induced stresses aren't relaxed by deformation in the oxynitride grain boundary phase. At higher temperatures, stress relaxation in the oxynitride grain boundaries (e.g., by extrusion of grain boundary material to the free surface) may be responsible for the decreasing benefit of oxidation at temperatures in the 1200 to 1400C range. (Following exposure to 1371 C oxidation, yttrium disilicate crystals were observed on specimen surfaces. Yttrium in these crystals was initially present in the grain boundaries.) At this time the above expiation for strengthening remains speculative; i.e., compressive surface stresses in oxidized specimens has not been confmned.
4.2 Hot Corrosion
In contrast with oxidation behavior, reaction between salt deposits and NTI54 resulted in significant reduction in room temperature flexure strength. For tests conducted at 893C and above, the most severe loss in strength occurred during the initial hour(s) of exposure (Figure 3). The rate of strength loss then slowed significantly as exposure time increased.
During exposure to 860C burner rig combustion environment, salt deposited on the specimen, but remained virtually unmelted. EDX examination of salt deposits removed from specimens indicated that Na, K, Mg, Ca, and S were present. With the exception of isolated areas, salt deposits were easily removed by water washing. Visual examination confirmed that surface reaction with salt deposits was minimal. In contrast with other tests discussed below, strength reduction was minimal following exposure to the 860C hot corrosion.
Room temperature flexure strength data obtained following exposure of specimens to a range of 982C burner rig environments are illustrated in Figure 4. This figure shows that the surface strength is reduced by 30 to 40 percent during the first few hours of exposure to the hot corrosion environment. Following the initial 50 hours of exposure, room temperature strength decreased gradually -- even though the surface became roughened. Reducing the concentration of salt ingested into the burner results in a predictable increase in strength retention. Similar strength retention was predicted and ob-
---- -- -----------
served for tests conducted at 1, 3 and 5 atmospheres; this result occurred because the product of salt deposition (increased by pressure) times salt basicity (reduced by pressure) remained constant.
The initial reduction in strength coincides with the initial formation of a glassy silicate layer by reaction between deposited salt and the silicon nitride. Glassy silicate reaction products on several specimens were qualitatively analyzed using the EDX and WDX spectroscopy capabilities of the SEM; results of these analyses indicated that the glassy silicates on the surface contain Na, K, Mg, Ca, Si, Y, ° and N. Co, Ni, and Fe were also present in small concentrations in some spectrographs; these elements are present in the burner rig system.
It is speculated that the initial rapid reduction in strength may be attributed to relaxation of pre-oxidation strengthening (e.g., by elimination of compressive preoxidation stresses). Although the average depth of reaction during the initial hour(s) of exposure is minimal (less than I micron), reaction with the salt can transform the refractory yttrium silicon oxynitride grain boundary phases at the surface to a viscous (Na, K, Mg, Ca, Y, Si, 0, N) glass.
Longer exposures result in surface roughening, which is associated with small variations in the corrosion rate of the NT154 silicon nitride and large variations in the distribution of the viscous silicate scale, which flows under the influence of impinging high-velocity combustion gases. Flow induced roughening of the surface of specimens exposed at 982C is shown in Figure 5. Despite the size and thickness of the silicate deposits, there was no obvious correlation between deposit thickness and the fracture origin. This result is attributable to the high level of gas porosity within the silicate scale, which reduces its strength and effectiveness as a stress raiser.
Surface recession was minimal (less than 25 microns) during exposure to 1 atmosphere burner rig hot corrosion at or below 982C. Above this temperature, surface recession was more rapid and may be life limiting. Surface recession (thickness loss) rates were approximately linear with time. Recession rate as a function of temperature are illustrated in Figure 6. Corrosion penetration is sufficiently rapid above IOOOC to be life limiting for thin-walled (e.g., 625 microns [0.025 inch) thick) components.
---I I
I
I
I
- ---, ____ J

50
25
o
• • <>v·. • <>attJl. .. . ~ .
•• ~ J'dI. • ~ <>0 0 O. Q9 •
o o
d3
500
•
1000 1500 2000
36-7
• 860C,1 aIm
• 89OC, 1 aim
• 954C, 1 aim
• 982C, 1 aim o 982C, 1 aim (NASA)
o 982C, 3 aIm (NASA)
Il. 982C, 5 aim (NASA)
<> 1052C,1 81m
a 1121C,1 81m
~ 1218C, 1 aim
o 968-1218C,1 aIm • • 968-1288C,1 aIm
• • • •
2500 3000 3500
Exp<>.unt In HoI Corroalon Environment, Hours
Figure 3. Exposure to a Hot Corrosion Environment Reduced the Surface Strength of NT154 Silicon Nitride.
0 1 aim, 5 ppm Sail
0 5 atm, 5 ppm Sail
100 A 5 atm, 2 ppm Sail
0 5 atm, 10 ppm Sail
l!!" 0 - - 1 atm, 5 ppm Sail Model
::18 - - - - - 5 atm, 2 ppm Sail Model ea; _._.- 5 aim, 5 ppm Sail Model X. Cl._
E:5 A -- 5 atm, 10 ppm Sail 'Aodel
t!= 80 e
E$ 8~ a:.c:; l!!c. ::Ie 014>
~ ~! 80 ':'::1 01"
i.~
0 0
o 50 100 150 200 250 300 350 400
G4032-4 Exposure Time, Hours
Figure 4. Surface Strength Reduction is Sensitive to Exposure Time and the Severity of the Corrosive 982C Burner Rig Environment.
Calculated dew points for the evaporation of sodium sulfate are approximately 950 and 1030C, respectively, for the 1 and 5 atmosphere test conditions used in this investigation. Consequently, a narrow temperature range for hot corrosion was initially expected. However, corrosive sodium rich silicate scales were unexpectedly present in the hot zones of specimens exposed 1050 and 1121 C in the 1 atmosphere burner rig. Inspection of the specimens exposed in the 1218C test indicated that the actual dew point for a sodium-free surface was near 1200C at 1 atmosphere. In a series of short (2 hour) 5 atmosphere burner rig tests conducted with 5 ppm sea salt, the dew point was near 1290C. Reasons for the unexpectedly high dew point for sodium deposits are under investigation.
Multi-temperature I atmosphere hot corrosion exposure conditions (tests 8 and 9 in Table I) more closely simulate idle and max power conditions anticipated for advanced gas turbines. In the multi-temperature tests, salt deposition occurred when the specimen was held at 968C for 3 minutes. Glassy silicates and severe surface recession were observed in the test with a 1218C maximum temperature. In contrast. exposure in the cycle

36-&
5 10 25 50 100 220 400
Hours In Burner Rig 121414-9
• 982C (1800F) Mach 0.3, 1 stm Burner Rig
• 5 ppm Sea Salt In Combust1on Air
• Jet A Fuel • Cycle: 27 min Hot + min Forced Air Cool
G4032-5
Figure 5. Glassy Silicate Layer Roughened the Surface of NT154 Specimens During Exposure to 982C Burner Rig Hot Corrosion Environment.
with a higher maximum temperature (1288C) promoted sodium-salt evaporation and inhibited formation of sodium silicate.
Surface recession ceased when the maximum test temperature inhibited sodium-salt deposition. A thin layer rich in magnesia, calcia, and silica was present on the hot zone surface of specimens exposed in tests 7 and 9 (Table 1). Reaction between the silica rich surface of NT154 and deposited Ca and Mg oxides roughened the interface. Small pits (about 25 microns deep), which containing trace amounts of sodium oxide, were observed on the fracture surfaces of a few specimens.
4.3 Erosion
Engine tested NT154 silicon nitride exhibited superior resistance to sand erosion. As illustrated in Figure 7, ceramic vanes exhibited negligible damage in this erosion test. In contrast, all of the nickel-base superalloy vanes exhibited severe erosion of trailing edges. Based on these test results, particulate erosion will not be a significant damage mode for silicon nitride airfoils.
5 Life Prediction
While oxidation and hot corrosion from ingested sea salt attack silicon nitride substantially less than the superalloys being replaced in initial engine applications, this mode of degradation has the potential to limit component lives in advanced engine applications. Hot corrosion adversely affects the strength of silicon nitride in the 850 to 1300C range. Since unacceptable reductions in strength must be rapidly identified and avoided, we have pursued the development of an environmental life prediction model for silicon nitride turbine components. The following paragraphs provide a summary of model development.
The approach to modeling is similar to that used for predicting environmental lives of turbine airfoil coatings [7]. Overall, the rate of environmental (hot corrosion) degradation is modeled as the product of the severity of the environment (salt deposition times salt corrosiveness [basicity]) times stress dependent degradation mechanism (surface strength reduction and thickness loss in-
-------~

1--..
---~.~--
10~~~~~~~~----------------_, Multi-Temperature Cycle:
900
3 Min at 988C Plus 24 Min at Tmax Plus 3 Min Air Cool
\--r-----
1000
Isothermal Cycle: 27 Min atTmu
Plus 3 Min Air Cool
1100 1200
Maximum Burner Rig Test Temperature, C 'Hour of Time at Tmax G4032-8
1300
--- --
Figure 6. Surface Recession Rates Were High in NTlS4 Flexure Specimens Exposed to Hot Corrosion at Temperatures Above 982C.
Eroded Area
Ceramic Metal Ceramic
• 8 Metal Nozzles and 17 Ceramic Nozzles • 9 Hours at Maximum Power • 0.34 kg/hr AC Coarse Silica Injected Into Combustor • No Power Loss • All Ceramic Nozzles Showed No Wear
G4032-7 • All Metal Nozzles Showed Wear
Figure 7. Erosion Testing Demonstrated Superior Ceramic Capability.
---~
36-9
duced rupture) functions. Operative temperature ranges for the degradation modes are illustrated in Figure 8.
In order to be a useful design tool, the environmental life prediction model has been fonnulated to utilize parameters recognized by those designing and operating the engine. Therefore, the model predicts the time for
surface strength retention as functions of engine design (stress, temperature, pressure, fuel/air ratio, gas velocity, and inlet air filtration), mission usage (fuel sulfur content, location [salt in air], and times at duty cycle power points), and material parameters. Effects of design stress and inlet air filtration on the predicted life of NT154 silicon nitride components in a 10 atmosphere turbine

r---I 36-10
o leoth.nn81 Oata, 414 MPa (110 ksl)
o Multl-TemlMratura Oata, 414 MPa 100,000 ~--"I-----i __ 1 atm, laothennel Model, 414 MPa, 835 Micron Sactlon -
\ ••••• 1 atm, Multi-Temperatura Modal, 414 MPa, 635 MIcron Sactlon
\ Isothermal Cycle: 27 min at Tmax 10,000.., \ +3 min Air Cool
5 ppm Salt In Air,
\ S rf W k ed Jet A Fuel, Evaporation
by Sodium Silicatea Sulfates 1,000 -: Solid \ Reaction Products and Oxides
{NOn-ReactIV;;---O--'t/P".-:-O Sodium Rich \ Sulf.te Salt •• ~ Sillcata Reaction
Surface Roughened byCa, Mg Silicate
~ .~d ~~~gh-:n: )1 Atmosphere of Sodium
Deposits ". Products and R~~ • .:--.... Surface Rece .. lon .",.c1" , ••••• Or.
,,~::: :::-::.-:=:=] ... ,,' 100 ..,
10..,
800
G4032~
Multi-Temperature Cycle: 3 min at 988C +24 min at Tmax +3 min Air Cool 5 ppm Sail In Air, Jet A Fuel, 1 Atmoaphere
I I I 1000 1100 1200
Temperature, C
1300
Figure 8. A Mechanistic Model Predicts the Environmental (Strength Retention) Life of NT154 Silicon Nitride.
operating at a coastal location are indicated in Figure 9 and Figure 10 illustrate the current capabilities of the model. These preliminary results indicate a need for protective (salt resistant) coatings to facilitate use of silicon nitride turbine components in high temperature, corrosive combustion environments.
Hot corrosion attack significantly reduces the strength of NT154 silicon nitride in the 850 to 1300c range.
A mechanistic model was developed to predict the strength retention life of silicon nitride turbine components.
Conclusions
Silicon nitride has superior resistance to sand erosion in a gas turbine environment.
Oxidation of NT154 in the 1000 to 1400C range is very slow and significantly increases room temperature flexure strength.
The predicted environmental life of a component is dependent on engine design (stress, temperature, pressure, fuel/air ratio, gas velocity , air filtration effiCiency), mission usage (fuel[sulfur content] , location(salt in air], time at duty cycle power points). and material system parameters.

r- ---
PnlSaUre at Max Power: 10 atm TIme at Max Power. 90% Preaaure at Idle: 5 aim TIm. at Idle: 1~ Idle Temp. Max Power Temp ",90OC Idle Temp. 900c for Mu Power Temp >900C
Fual: Jet A (0.035% S) FueVAIr. 0.02 Ou Velocity: 8SO ttlsec Location: Coa.t Altitude: Sea Level Air Filtration: None
SectIon Thlckn_: 0.025 Inch
100,000 .".----,rT""""T"-------------, C>
e" 8; r;j 10,000 ~3 -g~ a;S 00 i£ 1,000 .=gt =>C>
l~ ~ MPa (SO ksl) ! § 100 ih: o=>
~ o~ 10 !!8,.
l~
G4032-g
800 900 1000 1100
Maximum Temperature, C
1200 1300
Figure 9. Predicted Environmental Lives of NT154 Silicon Nitride Components are Dependent on Design Stress and Temperature.
REFERENCES
1. Jacobson, N.S., "Sodium sulfate: deposition and dissolution of silica," Oxidation of Metals, 31 [1-2] 91-103 (1989).
2.
3.
4.
Jacobson, N.S., "Corrosion of silicon-based ceramics in combustion environments," J. Am. ceram. Soc., 76 [1] 3-28 (1993).
Fox, D.S. and Smialek, J.L., "Burner rig hot corrosion of silicon carbide and silicon nitride," J. Am. Cerarn. Soc., 73 [2] 303-11 (1990).
Jacobson, N.S, Stearns, C.A., and Smialek, J.L., "Burner rig hot corrosion of SiC at 1000C," Adv. Ceramic Materials, 1 [2] 154-161 (1986).
- --~ -----.---~
Pressure at Max Power: 10 atm TIm. at Max Power: 90% Pressure at Idle: 5 atm TIme at Idle: 1~ Idle Temp. Max Power Temp ",9OOC Idle Temp. 900C for Max Power Temp >9OOC
36-11
Fuel: Jet A (0.0350/0 S) Fuel/Air: 0.02 Oas Velocity: 850 ttlsec Location: Coast Altllude: Sea Level
SectIon Thlckne .. : 0.025 Inch
1,000
100
10
14---r--r--~-.--~-,--_.--Tr--r~ 800 900 1000 1100 1200 1300
G4032-10 Maximum Temperature, C
Figure 10. Air Filtration Increases Predicted Environmental Lives of NT154 Silicon Nitride Components.
5.
6.
7.
Cuccio, J.S., et al., "Life Prediction Methodology for Ceramic Components of Advanced Heat Engines - Final Report," Department of Energy Contract 86X-SC674C, submitted for publication in 1993.
Lindberg, L.J., • 'Cyclic oxidation of advanced silicon nitrides," pp. 79-86 in Proceedings of the Annual Automotive Technology Development Contractors' Coordination Meeting (Dearborn, Michigan), published by Society of Automotive Engineers, Warrendale, PA, 1991.
Strangman, T.E., "Turbine coating life prediction model," pp. II-35 to II-43 in Proceedings of the 1990 Coatings for Advanced Heat Engines Workshop (Castine, Maine), U.S. Department of Energy Publication CONF-9008151, 1990.
-- ---.-.-!