Embed Size (px)
Citation preview
r Ab-AO95 308 FOREIGN TECHNOLOGY DIV WRIGHT-PATTERSON AFB OH F/6 20/2
STUDY OF THE GROWTH OF VACUUM CONDENSED AU PARTICLES ONTO THE (--ETC(U)
JAN 81 M I GIRJEGA, V TOPA. V TEODORESCU
UNCLASSIFIED FTD ID(RTI.AGSGG -
FTD-ID(RS)T-1685-80
FOREIGN TECHNOLOGY DIVISION
STUDY OF THE GROWTH OF VACUUM CONDENSED Au PARTICLESONTO THE (100) SURFACES OF KBr, KC1 AND NaC1
SUBSTRATES WITH COLLOIDAL CENTRES
by
M. I. Birjega, V. Topa and V. Teodorescu
___ DT[O* %ELECTE
P FEB 2 0 1981
Approved for public release;distribution unlimited.
~ I6 070
FTD ID(RST1685.80
EDITED TRANSLATION
FTD-ID(RS)T-1685-8o 7 January 1981
MICROFICHE NR: FTD-80-C-001250
STUDY OF THE GROWTH OF VACUUM CONDENSED AuPARTICLES ONTO THE (100) SURFACES OF KBr,KCl AND NaC]. SUBSTRATES WITH COLLOIDAL CENTRES
By: 1A. I. Birjegp, V. Topa and V. Teodorescu
English pages: 28
Source: Studli si Cercetari de Fizica, Vol. 30,Nr. 2, 1978, pp. 179-188 plus 4unnumbered pages, 189-190
Country of' origin: Romania Aceion orA
Translated by: SCITRAN DTIC TA&
F33657-78-D-0619 Unnnu cedRequester: FTD/TQTD JsApproved ffor public release; distribution Justi ictan -unlimited B y
rDistribut ton/Avai lability Codes
Avail and/orD1st Special
THIS TRANSLATION IS A RENDITION OF THE ORIGI. PEAE YNAL FOREIGN TEXT WITHOUT ANY ANALYTICAL OR
ADVOCATED OR IMPLIED ARE THOSE OF THE SOURCEAND DO NOT NECESSARILY REFLECT THE POSITION TRANSLATION DIVISION
OR OPINION OF THE FOREIGN TECHNOLOGY DI. FOREIGN TECHNOLOGY DIVISION
FTD -ID(RS)T-1685-80 Date 7 jan 1981
I UDY OF THE Q0Th OF ACUUH SONDENSED AU -EARTICLESu '41 THE ( URFACb-S OF r C AND Nae'i SUBSTRATES
C0LL0DA ACENTRES
tudiul kormarii regatelor de Au _Condensate in vidje jiuprafata (100) a §vbstratelor de
KrKC1 and iaCl cu cetrii coloidaloi,
m. I./.'3irjega,, V. Topa 2e-V. teodorescu
St. Cerc. Fiz., Vol. 30(2),pp. 179-196, 1978
A
1. Introduction
A series of deposits of Au with thinness equivalent t, of 4.5, 6.0,0
9.0 and 12 A was carried out under high vacuum conditions at substrateS. -1
temperatures of 290, 260 and 170C and at a deposit rate of 0.3 and 0.1 A s
on the surface (100) of crystals of KBr (7.7 * 109 cm- 2 Cu colloids), KC1
(8.4 1 10 cm-2 Pb colloids), NaCI (1.2 101 0 cm-2 Cu colloids), gaCl-2 .. 10 2(5.2" 10 cm Cu colloids) and NaC1 (3.6 1010 cm- Ag colloids).
Electron microscope images of the deposits made it possible to determine, as
a function of size, their equivalent t, the specific density n of the
aggregates, the proportion of S100 and Sil oriented aggregates, the degree
of surface coverage with Kaggregates, and the mean diameter D of the
aggregate distribution.
Histograms of the aggregate distribution on a standard area A were
plotted for all of the deposits made for the purpose of producing evidence
on the processes of growth, coalescence and secondary nucleation of the Au
aggregates as a function of diameter interval.
2. Experimental Methodology and Data Calculation
2.1. Experimental Conditions for Achieving Au Deposits
Deposits of Au with equivalent thicknesses of 4.5, 6.0, 9.0 and 12
were made simultaneously in a high vacuum (2 * 10-6 mm Hg) on (100) surfaces
of KBr, KCI and NaCl, cleaved in air and heated to 290, 260 or 170°C. Contami-
nation of the alkali halide surfaces because of cleavage in the environmental
atmosphere was improved to a great degree by applying the desorption process
of Rossow, Kotze and Henning [1]. Regardless of the temperature at which the
Au deposition was made, the substrates were maintained for an hour in a vacuum
of 2 10-6 mm Hg at a temperature of 300 0C.
rW
tCrystals of Oir, KC1 and NaC1, grown by Kyropoulos' method, were treated and
dyed electrolytically in order to obtain Cu, Pb or Ag colloids [2].
Au aggregates were formed with continuous flux (C) at a deposition rate
of 0.3 A ' s or 0.1 i , s .
In order to preserve their crystallographic shape and orientation, the Au
aggregates were covered with a thin carbon layer approximately 200 A thick.
The Au particles covered with the carbon layer were precipitated on the
alkali halide substrates by immersion in water distilled twice and collected
on a special copper grid. The study of the specimens prepared in this way was
conducted with a JEM-120 microscope.
2.2. Methodology of Determining the Characteristic Magnitudes of the
Nucleation Process
Electron microscope images, made at a magnification of 100,000, in a zone
without any coloration effects, constituted the source of data necessary to
determine the characteristic magnitudes of the processes of formation and
growth of Au aggregates. The Au aggregates were counted by photographing the
electron microscope images, enlarged 4 times over the original magnification
(x 400,000) as a function of
-- their dimensions by diameter intervals (up to 25 A, 25 to 50 A, 50 to
75 X and so on);
-- their morphology (square, triangular and of other shapes).
7 "2The aggregates were counted according to total area A, at 2 * 10 A2. In
studying the nucleation kinetics of Au on a NaCl substrate, Donohoe and
7 '2Robins [3] considered aggregates formed on areas from 1.12 10 A to
2.24 * 107 A2 while Schmeisser [4] considered an area of 1.4 107 2 In
order to make a quantitative estimate of the uniformity of the nucleation
process [5], the total area was divided into 20 squares of 1,000 A on each
2
1?- ...k .. .. _ . .... . A
side. This formed the elementary surface on which the aggregates were counted
as a function of size and shape. Table 1 presents the way in which the data
mentioned were taken from electron microscope images in the case of some Au
particles on a KCl substrate with Pb colloids.
Microscopic and electron diffraction research on the Au aggregates formed
by vacuum deposition on (100) cleavage surfaces of some ionic crystals conducted
in a series of laboratory tests [6-121 demonstrated the existence of the
following types of aggregates:
-- aggregates square or rectangular in orientation (100);
- aggregates triangular in orientation (111);
-- multiple twin-crystal aggregates or multiple twin-crystal particles
(PMM), pentagonal, hexagonal or rhomboid with specific contrast effects. The
types mentioned should be further increased by a series of aggregates which do
not exhibit any definite geometric shape. This category includes very small
aggregates which had not reached a phase of equilibrium and very large
aggregates due to coalescence processes.
2.2.1. Specific Density n of the Aggregates
I The specific density n of the aggregates was obtained as a result ofx
counting the aggregates visible in all 20 elementary areas, and applying the
equation
"' -- .. (1)
The standard deviation in all 20 series of measurements was obtained from
the equation
(2)
~I? 3-'-'-
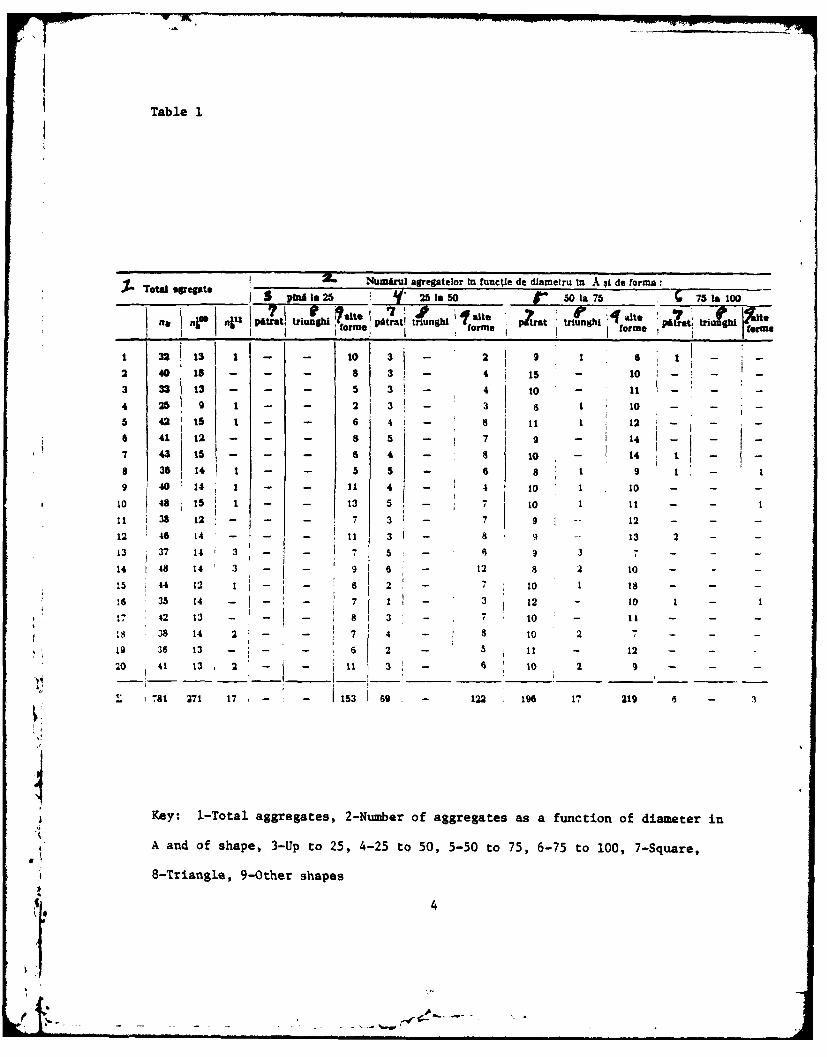
Table 1
Ta. Numarul agregatelor tn tunctle de dlametru tn A 0i de forma:
?alto alto z t-. i. b y1 alto to
32 1311 - - 10 - 2 9 1 -
2 40 18 - - - 8 3 - 4 15 - 10 -
3 33 13 -- - 5 3 - 4 to - it
4 25 9 1 - - 2 3 -3 6 10 - - -5 42 15 1 - - 6 4 8- -
6 41 12 - - & 5 - 7 9 - - -
7 43 is 6 4 - 8 10 - L4 t - -8 36 14 1 - - 5 5 -- 68 1 9 1 1
9 40 14 1 - - 11 4 - 4 10 1 10 - - -
10 48 15 1 - - 13 5 - 7 tO 11 - - 1
11i 38 12:- - - 7 3 - 7 9 -- 12 - - -
12 46 14 - - - i 3 - 8 q -- 13 2 - -
13 37 14 3 -- - 7
14 48 14 3' 9 - - -
15 44 12 1 - - 6 2 - 7 10 1 i8 - - -
16 35 14 - - - 7 7 - 3 12 - 10 1 - I17 42 13 - - - 81 3 - 10 - 11 - - -
8 38 14 2 - - 7 4 - 8 10 2 7 - - -
19 36 13 - - - 6 2 - 5 11 - 12 - -
20 41 13 2 - - il 3 -t o 0 2 9 - - -
. 781 271 17 - - 153 69 122 196 17 219 8 -
Key: 1-Total aggregates, 2-Number of aggregates as a function of diameter in
A and of shape, 3-Up to 25, 4-25 to 50, 5-50 to 75, 6-75 to 100, 7-Square,
8-Triangle, 9-Other shapes
4
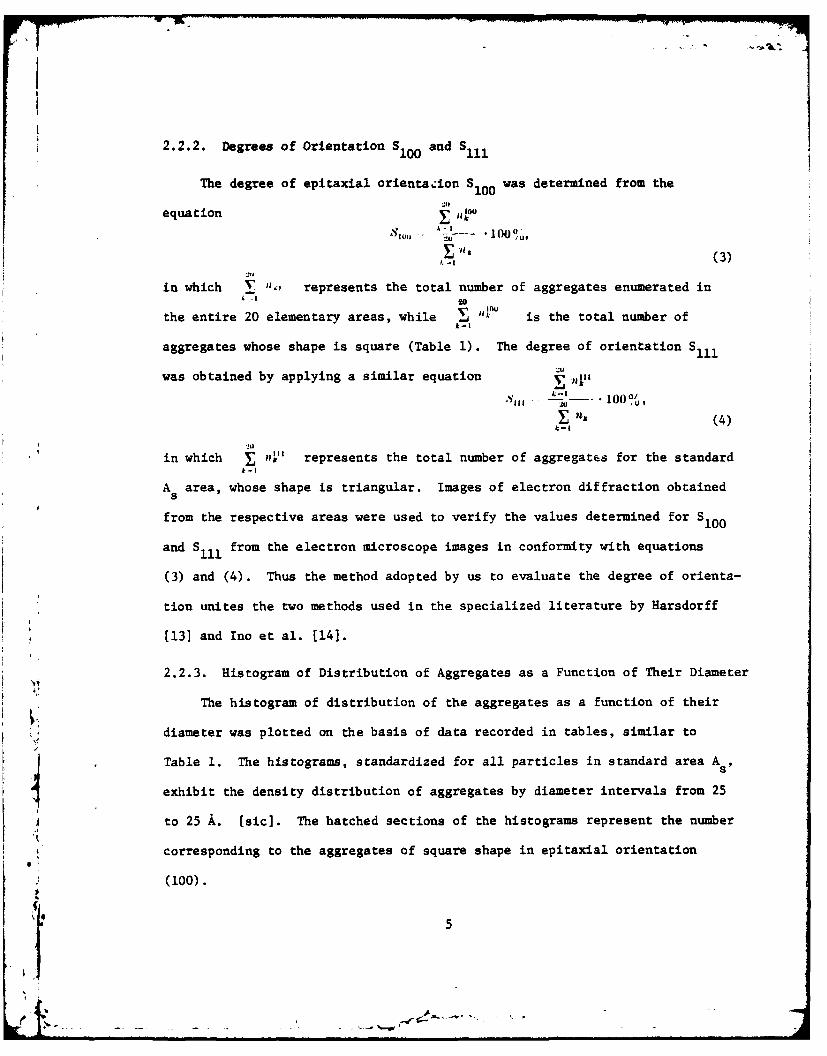
2.2.2. Degrees of Orientation S10 0 and Sill
The degree of epitaxial orientazion Slo0 was determined from the
equation ,I.o100 0%,
li (3)
in which ",, represents the total number of aggregates enumerated inA -to
the entire 20 elementary areas, while k U is the total number ofk-I
aggregates whose shape is square (Table 1). The degree of orientation S
was obtained by applying a similar equation it l, ,u"l| --u - '100?U1
n" (4)
in which P ," represents the total number of aggregates for the standardk-I
A area, whose shape is triangular. Images of electron diffraction obtained
from the respective areas were used to verify the values determined for S100
and Sil from the electron microscope images in conformity with equations
(3) and (4). Thus the method adopted by us to evaluate the degree of orienta-
tion unites the two methods used in the specialized literature by Harsdorff
[13] and Ino et al. [14].
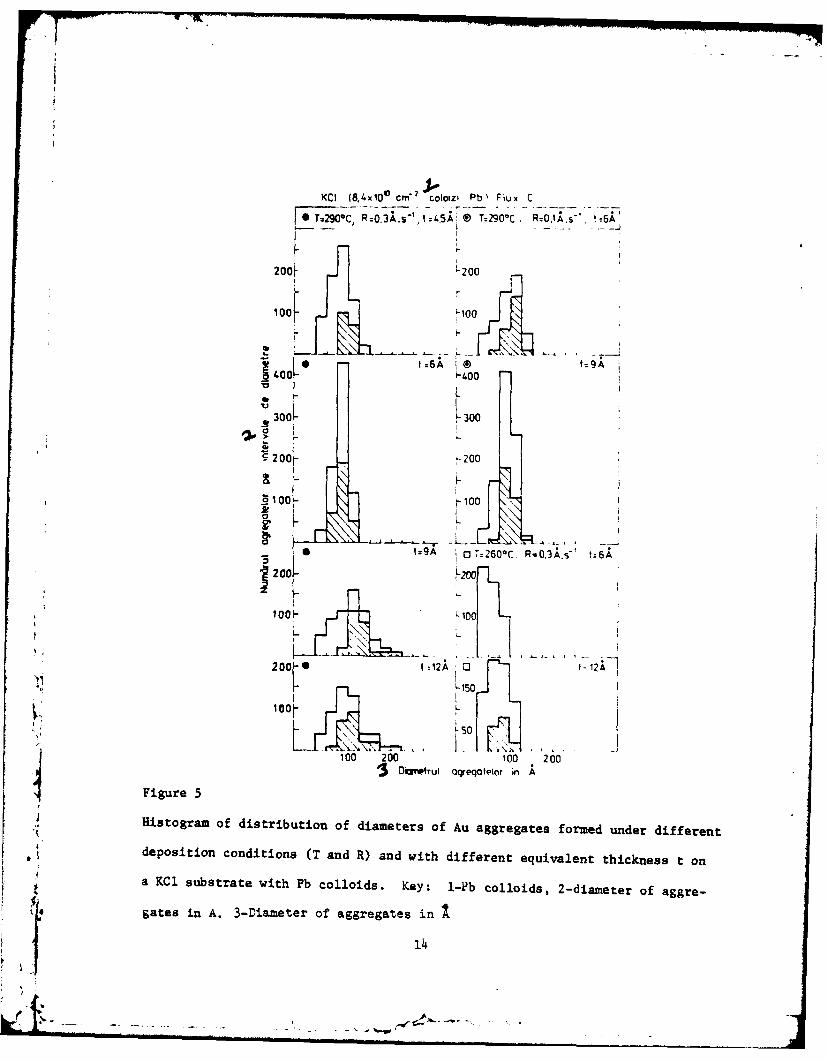
2.2.3. Histogram of Distribution of Aggregates as a Function of Their Diameter
The histogram of distribution of the aggregates as a function of their
diameter was plotted on the basis of data recorded in tables, similar to
J Table 1. The histograms, standardized for all particles in standard area A8,
exhibit the density distribution of aggregates by diameter intervals from 25
to 25 A. [sic]. The hatched sections of the histograms represent the number
corresponding to the aggregates of square shape in epitaxial orientation
(100).
1i5
2.2.4. The Degree of Z Coverage of the Substrate with Aggregates
Making an approximate consideration that all of the aggregates have the
shape of a spherical cap [151, the degree of Z (%) coverage of the surface
with aggregates was determined from the equation
Z (5)la
A
in which ni represents the number of aggregates in a diameter interval on a
histogram, while ai is the area of aggregates corresponding to the maximum
diameter of the interval.
2.2.5. Mean Diameter D of the Aggregates
In a corresponding way the mean diameter of the aggregates was obtained
from the equation
'J. ,1. (6)
3. Experimental Results
A compilation of the experimental data obtained by processing electron
microscope images and electron diffraction of the Au aggregates on alkali
halide substrates with colloidal centers is contained in Tables 2 and 3. The
tables indicate the substrates with their content and type of defects,
equivalent thickness of particles (t), formation period of aggregates,
deposition conditions (substrate temperature T, deposition rate R) and values4 obtained for the parameters which characterize the process of Au aggregate
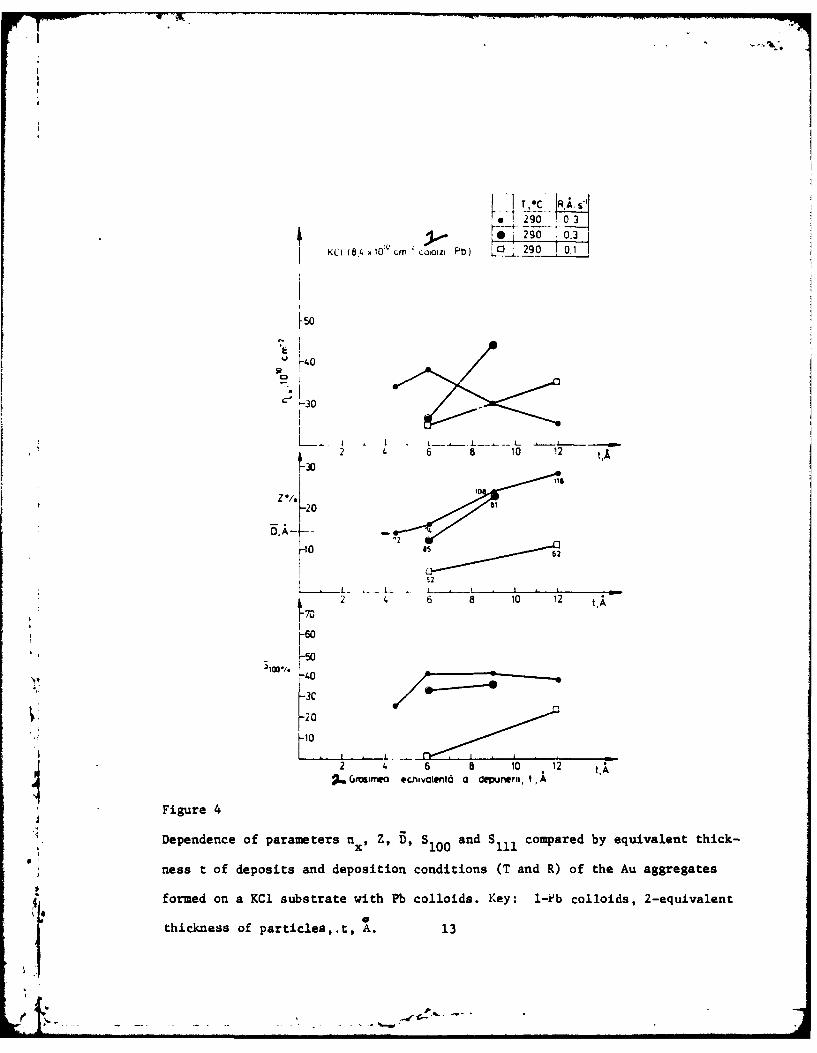
formation (nx, Z, D, DSO 0 and Slll). Figures 1, 4 and 7 graphically represent
the dependence of the magnitudes n, Z, D and S for the KBr, KCI and NaClx 100
substrates with respect to equivalent thickness t of particles and deposition
conditions (T and R). The histograms in Figures 2, 5 and 8 present the
6
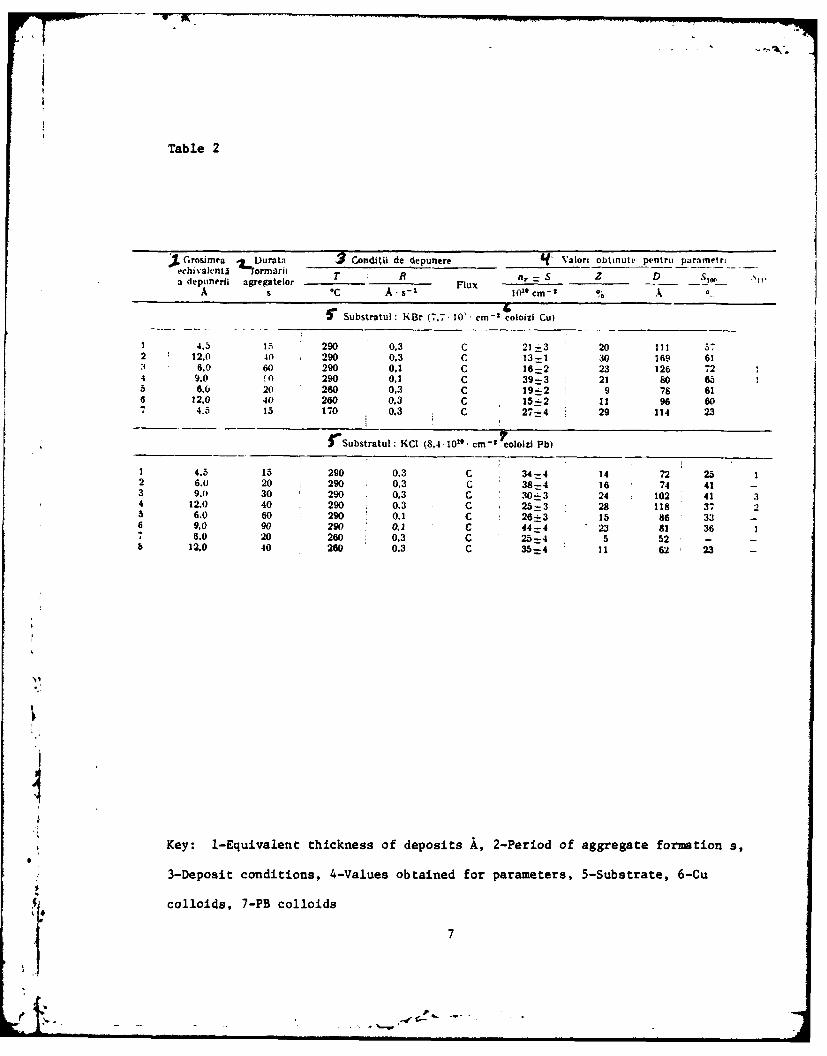
Table 2
Grosimea .. Durata 3q Conditii de depunere g. Valori obtinut, pentru parametriehivahntu formrii R S z Da depuneri agregatelor FluxS D o
s A•s-1 Fux cm
-2 A
Substratul: KBr (7.7, C0'u cm- ) -oloizi Cu)
1 4.5 15 290 0.3 C 21 -3 20 l 11 5-2 12.0 40 290 0,3 C 13=1 30 169 613 6.0 60 290 0.1 C 16-2 23 126 724 9.0 f 290 0.1 C 39=3 21 80 655 6.0 20 260 0.3 C 19 - 2 9 78 616 12.0 40 260 0.3 C 15 - 2 11 96 60
4.5 13 170 0.3 C 27j4 29 114 23
SoSubstratul: KC1 (8,4-1010. cm- 2 cooizi Pb)
1 4.5 15 290 0.3 C 34=4 14 72 25 12 6.u 20 1 290 0,3 C 38-4 16 74 41 -3 9.0 30 290 0,3 C 30-3 24 102 41 34 12.0 40 290 0.3 C 25=3 28 118 37 25 6.0 60 290 0.1 C 26--3 15 86 33 -6 9.0 90 290 0,1 C 44=4 23 81 36 11 6.0 20 260 0.3 C 25=4 5 52 - -b 12.0 40 260 0.3 C 35=4 11 62 23 -
Key: 1-Equivalent thickness of deposits A, 2-Period of aggregate formation s,
3-Deposit conditions, 4-Values obtained for parameters, 5-Substrate, 6-Cu
colloids, 7-PB colloids
,S.'.. ..'7
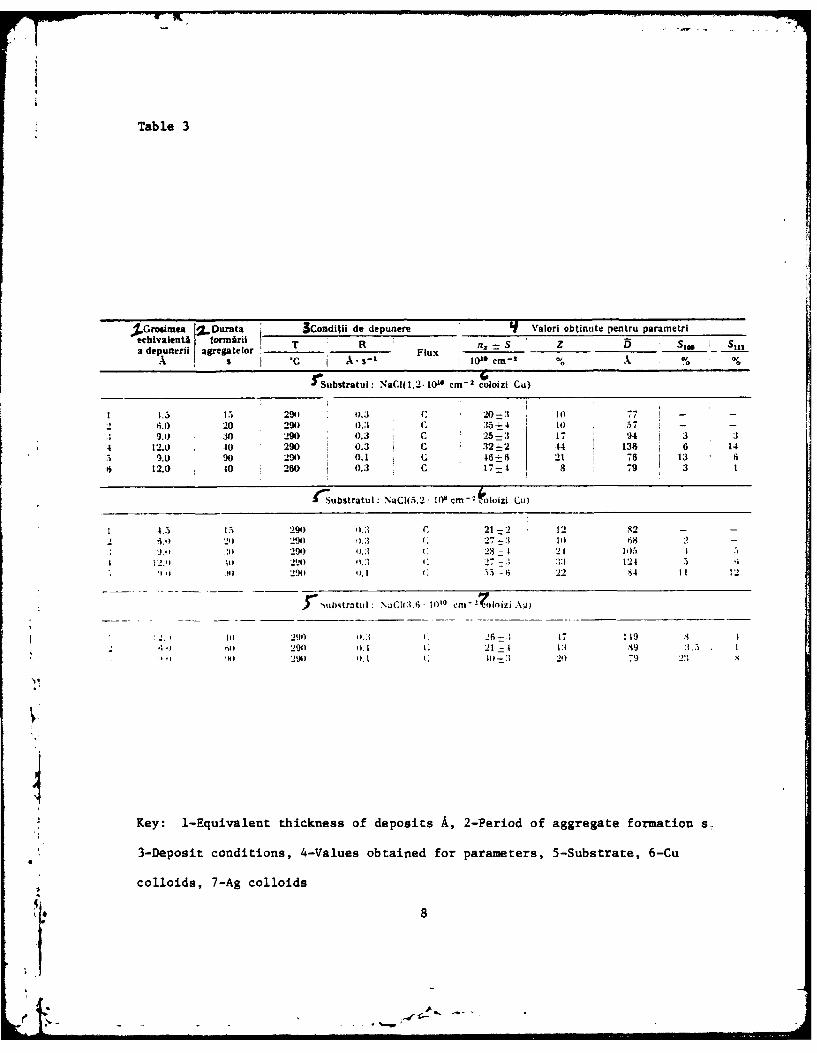
Table 3
%.Grhimea 2[Durata 3Conditii de depunere Valori obtinute pentru parametriaetj TrR= S Z ________ ST S11,
aa
adepunerii. agregatelor stil Si-l-llx ~ m-
,,
-Substratul: NaCIf 1,2. 10"' cm -2 coaloizi Cu)
I l.3 15 2941 4)3 C 0- L 0 77 - -
2 6.0 20 290 )3 C :15-4 14) - -9.1) 30 290 0.3 C 25-3 17 94 3 "3
4 12.0 40 290 0.3 C 32-2 14 136 6 149.0 90 2940 .1 C 46-6 21 76 6
12.0 10 260 0.3 C 17- A 8 79 3 1
'S1ubstratul: NaCI(5.2 I0' cm-k oloizi Cup
4 .5 15 290 0.3 C 21 -2 12 ,42 - -
S 6.0 2, 290 0.3 27:3 II 68 ") -S 9 ., .I 29) .:1 : 21) . 1 2 1 105 1
4 "2.1 it 21) ,l.i 2W "27 -.A 33 124 ,l ,I 2944 oI 1 5,5 I6 22 .64 11 12
"ubhtratul: NaCI(3. I1 ° crIWO - lloizi A,)
S2. , II 2 0 .; 26 -- 17 119 34- ".p ,i- 29) '). 4. 21 - 4:1 .49 1.5 1
'41 2941 III 14 4:-Io 21) 79 2:: S
Key: 1-Equivalent thickness of deposits A, 2-Period of aggregate formation s.
3-Deposit conditions, 4-Values obtained for parameters, 5-Substrate, 6-Cu
colloids, 7-Ag colloids
1* 8
wA
distribution of the Au aggregate diameters as a function of their size in the
3 alkali halide substrates formed under different deposition conditions and
aggregate growth phases.
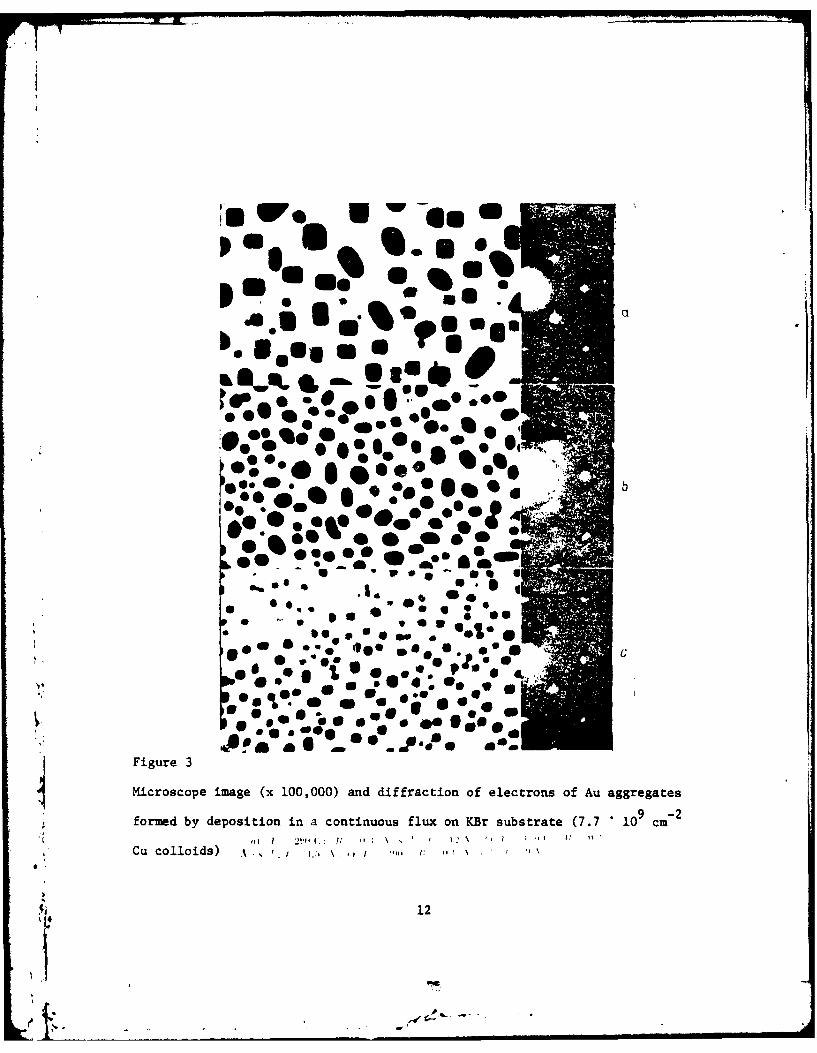
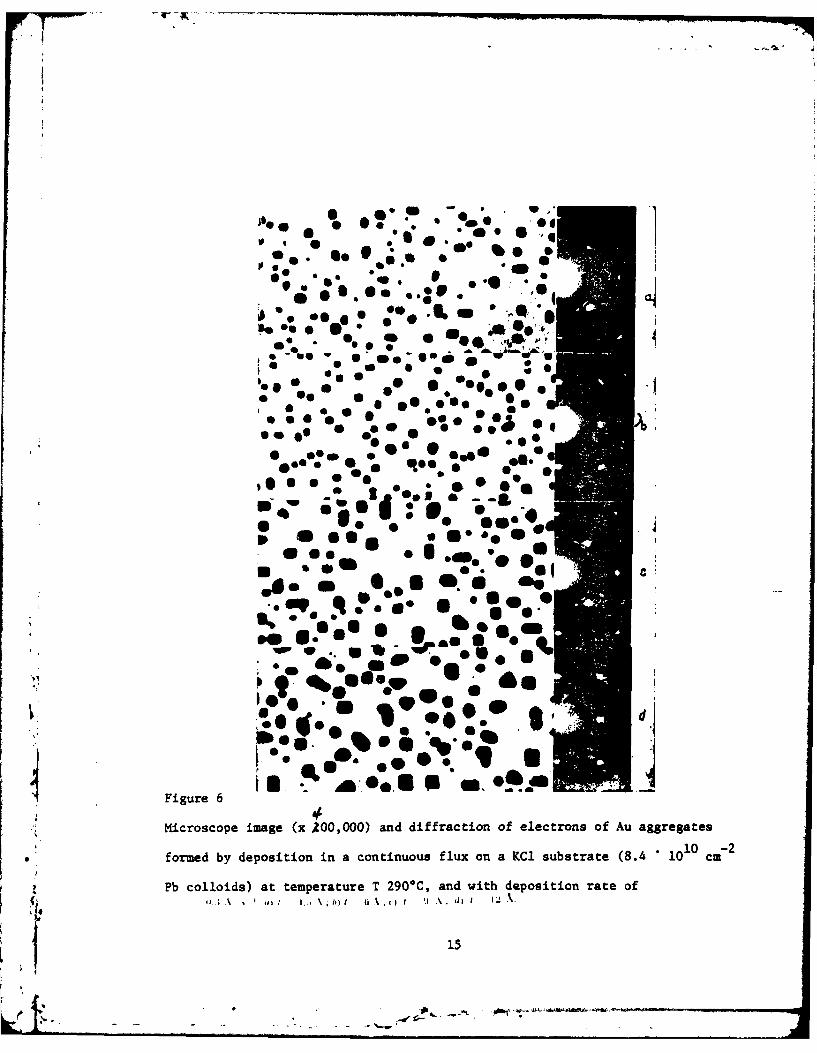
The electron microscope images and the electron diffraction in Figures
3, 6 and 9 illustrate the different aspects associated with the morphology and
kinetics of Au aggregate growth.
f.3. KBr Substrate (7.7 "109 cm- 2 Cu Colloids)
The results obtained for Au deposition on the KBr substrate with Cu
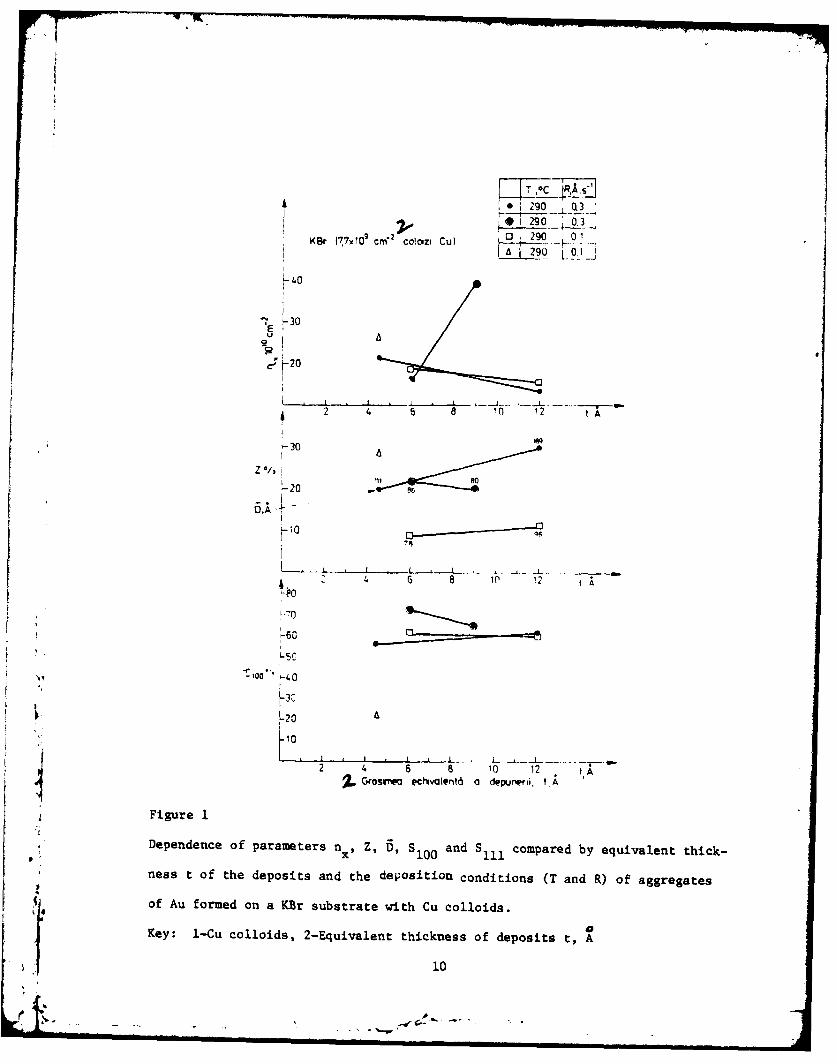
colloids are presented in Table 2 and Figures 1, 2 and 3. The aggregates
formed at 290 and 260*C at a deposition rate of 0.3 A" s reveal a drop in
their nx value in the value interval corresponding to some equivalent thick-
nesses from 4.5 to 12 A (Figure 1). This can be explained by the fact that
under these deposition conditions the maximum saturation density of NS0
aggregates, occurring at equivalent thicknesses smaller than 4.5 A, and the later
reduction in aggregate density at the same time as the growth of the equivalent
thickness of the particles can be attributed only to the colascence processes
(Figures 2 and 3). The percentage of aggregates of epitaxial orientation Sl00
reaches the value of approximately 60% of the aggregates formed at substrate* -1
temperature of 290 and 260*C with a deposition rate of 0.3 A - s , and remains
practically constant within the interval of equivalent thickness from 4.5 to
12 A (Table 2 and Figure 1). For Au aggregates formed at the temperature of
300*C with continuous flux from 13.8 ' 1013 atoms * cm-2 . s-1 on a KBr sub-
strate cleaved in an extremely high vacuum Puskeppel and Harsdorff [16] obtained
a 60% degree of epitaxial orientation S Despite this, for deposition made100-
at substrate temperature of 290 and 260 0C at a deposition rate of 0.3 A " s
the parameters nx and 00 have approximately the same value in the interval
9
T _
i0 i 290 0 .3K<Br 17 7 xI0 9 cme2 colorz CU) 02 01
40
E -30
1a
2 4 6 8 10 12 t A
z U I
307
-20
4 6 8 10 12 t A
-0
L20
I. _ L, i. • 2
2 t 6 8 10 12;L Grosvwwa echvaientd a depunen, tA
Figure 1
Dependence of parameters n,9 Z, D, S 100 and S1ill compared by equivalent thick-
ness t of the deposits and the dePOsitionl conditions (T and R) of aggregates
of Au formed on a KBr substrate with Cu colloids.
fa i
Key: 1-Cu colloids, 2-Equivalent thickness of deposits t, A
10
KBr (7,7A1L(9rf cm2~olozi Cuj Flux;C
L T2900C Rz0.3A.s'
100'
T 0T2600C R =0.3 A.sC2001 t=6A t-1
Z10-
~ 1 0 50
A T 1700C RuO.1A.t-A2400[ =6
300h r 300
2001 -200
100 20 00 00 30 0
'3Diametrul agvqatetor in A
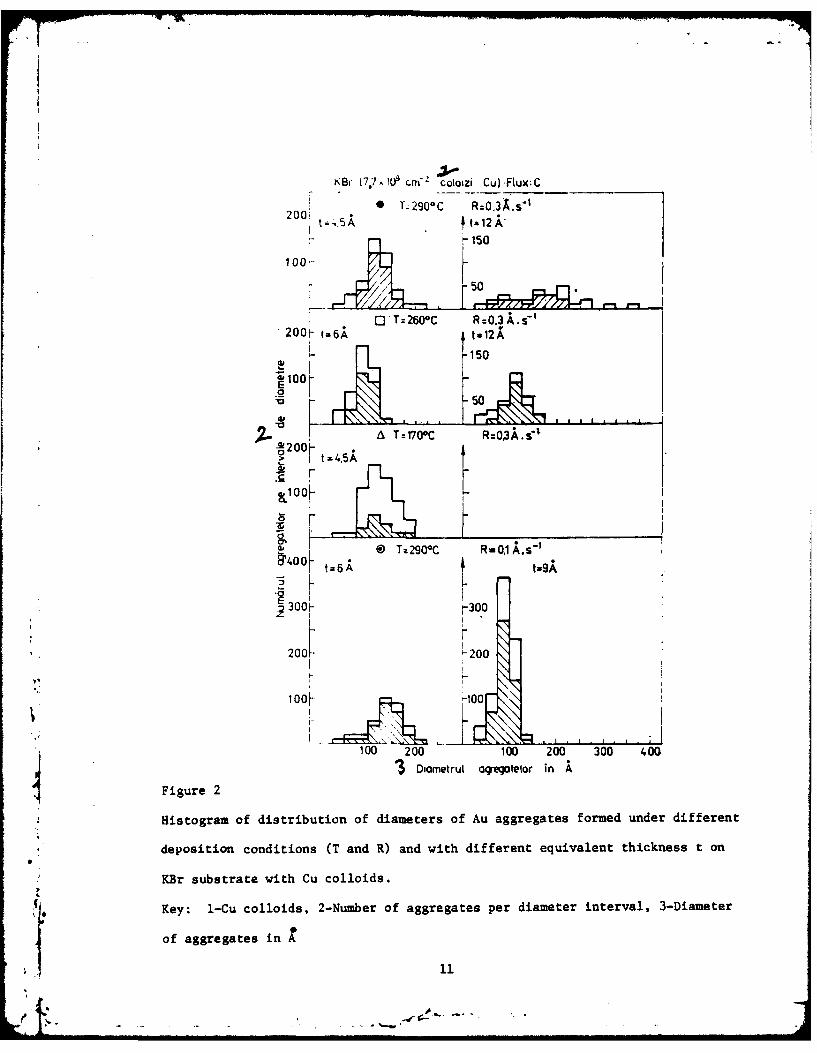
Figure 2
Histogram of distribution of diameters of Au aggregates formed under different
deposition conditions (T and R) and with different equivalent thickness t on
KBr substrate with Cu colloids.
Key: 1-Cu colloids, 2-Number of aggregates per diameter interval, 3-Diameter1* of aggregates in A 1
31=E:
1W1
$single o
*. gone* ?seea se
* a *6 *S@00
0 ISO.. 0
0~* 0 I. * !0 * 0
Mirocoe mae 0 00) and0 difato of. elcrn ofA bggeae
Il- - ~- !' *4S
K I (8 4 x l0O c m LOo Iz I P b ) O 9 i L
-50
2 . 6 8 10 12 t
290 0 3
2 6 10 12 t,
1 0
C - o
L L
2 4 6 8 10 *12
Depedec o pa 1urate with Zb collo0iad s 11 compare by id-equivalent ik03
thickness of partiles,,t, A. 13
IIla
* ~f'*~*~-20
KCI 18,400 cm coloizi Pb Flux CKCII8410e I -T=2g0C, R0&.A.i" ,t4.5A! 0 T2900 C, R=0,1A.s" !=64'
200h 1.200
100k p.1100
- t - ... tt90• ' °- I.,o I -'E 400 r 400
L300- L 300
I 12 0 0 - L200
, loo o10 1Ao00CR.3&s
100
100 200 100 200
Diw l~nfrul agregolteor in A
Figure 5
, Histogram of distribution of diameters of Au aggregates formed under different
deposition conditions (T and R) and with different equivalent thickness t on
a KCI substrate with Pb colloids. Key: 1-Pb colloids, 2-diameter of aggre-
• sates in A. 3-Diameter of aggregates in
14
I 6 .
0I
*. a
0.. A*
. we 00
I *a 0 6 ea *SOe
*e**. ;..04*
.0 0.0
*w
go" Gemsee
Figure 6
Microscope image (x .200,000) and diffraction of electrons of Au aggregates
*formed by deposition in a continuous flux on a KCl substrate (8.4 10 10cm -
Pb colloids) at temperature T 290*C, and with deposition rate of
S2 i03
NOCI -2x 10¹⁰ c 290 Q3.
290 0.1
-30
-20
, 2 4 6 8 0 136 t A-40
-30
Z On20 S
S77 57
-3
* I J. I -
2 1. 6 8 10 12 tA
,S10% -30
-20
10
2 4 6 5 10 12 I,A
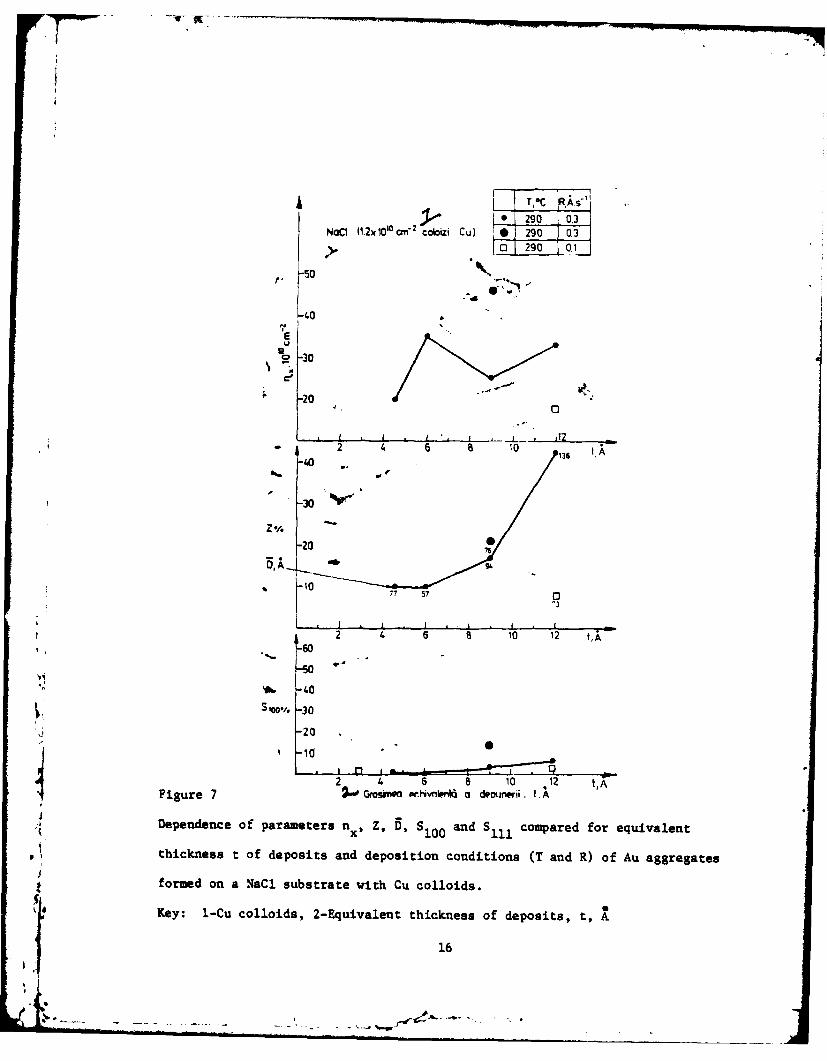
Figure 7 26o Gmsin w. ,,,n a deounerii. f.
Dependence of parameters nx. Z9 D, S10 0 and S compared for equivalent
thickness t of deposits and deposition conditions (T and R) of Au aggregates
formed on a NaCI substrate with Cu colloids.
Key: 1-Cu colloids, 2-Equivalent thickness of deposits, t, A
16
..NuCt I . .' cm coloizi Cu FLux C
R -r9 0C .3 A !z9 (D @Tz 29C R=O, IAs tz9A
200h
1001-
*0tz6A
Wu 00- -4002
3 30 0.- 300
A~ r
a; 2W-020
t9A . - ..0.3 4 .s 12A00 0 0
10
100F 100 _ __ __
100 200 100 200
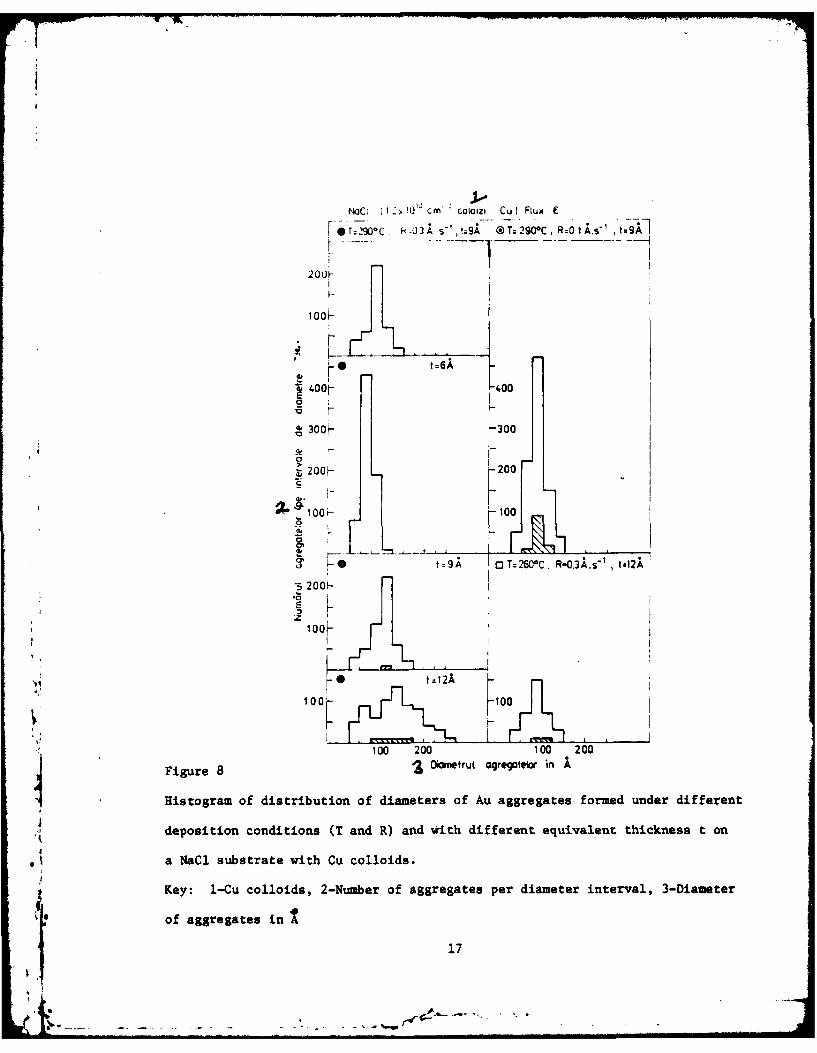
Figure 8 3 iOmtrul aregatefr in A
Histogram of distribution of diameters of Au aggregates formed under different
deposition conditions (T and R) and with different equivalent thickness t on
a NaCi substrate with Cu colloids.
Key: 1-Cu colloids, 2-Number of aggregates per diameter interval, 3-Diameter
of aggregates in1' 17
00 0.0 0 *0
0 * ** 0* 60 0
0.0
04.00
womb Ab . 0 A
VPe Is w~
00 0*is l
%410
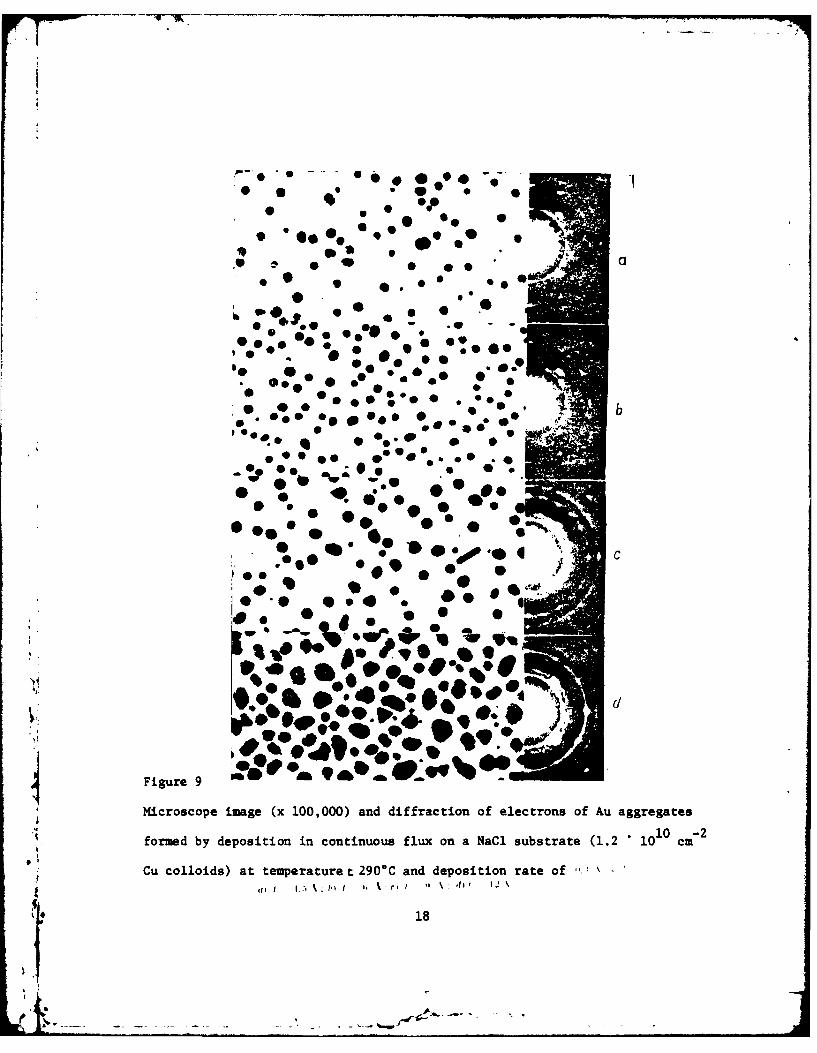
Fiur 9 Om it *bb
Microscope image (x 100,000) and diffraction of electrons of Au aggregates
formed by deposition in continuous flux on a NaCi substrate (1.2 100c -2
Cu colloids) at temperature t 290% and deposition rate of
18
qI
of equivalent thickness from 4.5 to 12 A, values corresponding to the degree
of Z coverage of the surface with aggregates, to the mean diameter D and
varied frequency in the coalescence processes (Table 2, Figures 1, 2 and 3).
The Au aggregates with equivalent thickness of 4.5 1, formed at the sub-
strate temperature of 290*C, have a Z coverage degree of 20% and a mean
diameter of ill A, while aggregates formed at a substrate temperature of
260*C, while they have an equivalent thickness of 6 X, have a 9% coverage9
degree and a mean diameter of 78 A.
The histogram (Figure 2) indicates to us a greater density of Au aggregates
in orientation (100) with diameters in the interval from 50 to 100 X on
deposition with an equivalent thickness of 6 A, formed at a substrate tempera-
ture of 260*C, compared to those of 4.5 X formed at a substrate temperature
of 290*C. On the other hand, deposition with an equivalent thickness of 4.5 1,
formed at 290*C, have a greater aggregate density in orientation (100) with
diameters in the intervals from 100 to 175 A. Very intense coalescence of
the aggregates with an equivalent thickness of 12 A, formed at a substrate
temperature of 290 0C and deposition rate of 0.3 A s- , appearing to be
secondary nucleation, does not modify degree of epitaxial orientation S 0
(Figure 2 and Figure 3a). Under these deposition conditions a degree of
coverage of the surface with aggregates Z of 30% and a mean diameter of
of the aggregates of 169 A are obtained (Figure 1), but the distribution of
J the diameter values of the aggregates is very great (Figure 2). The 12
deposition made at a substrate temperature of 260*C leads to growth of the
I mean diameter B of the aggregates to a value of 96 A, instead of 78 1, and
the degree of coverage of the surface with aggregates Z of 11% instead of
92, which takes place in growth of the equivalent deposit thickness from
6 A to 12 Z (Table 2 and Figure 1) which is due in large degree to the growth
19
in the size of the aggregates because of the diffusion process of the donor
atoms. As the histogram in Figure 2 indicates to us, the number of coalescent
actions is very reduced. It should also be mentioned that, under these growth
conditions, the percentage S100 of aggregates in the orientation (100) remains
practically constant.
The Au aggregates, formed at a substrate temperature of 170*C, correspond-
ing to an equivalent thickness of 4.5 A, exhibit greater values for the
specific density nx, the degree of coverage Z and the mean diameter D in
comparison with the aggregates formed at the substrate temperatures of 260 and
290*C, and the same deposition rate of 0.3 A " s - 1 (Table 2 and Figure 1).
The percentage of aggregates in orientation (100) S10 0 of 20% is thus much
smaller than that of the aggregates formed at higher temperatures. The
reduced number of Au aggregates in orientation (100) cannot be attributed to
the absence of coalescence activity, since both the histogram (Figure 2) and
the electron microscope images attest to its existence (Figure 3b).
The specific density nx of the aggregates formed at a substrate tempera-
ture of 290*C with a deposition rate of 0.1 s has a much greater value
than that of all the above-mentioned depositions (Figure 1). The mean
diameter D of the Au aggregates and the degree of coverage of the surface Z
with aggregates is smaller than that of the particles made at a substrate* -1
temperature of 290*C at a deposition rate of 0.3 A " s (Figure 1 and
Figure 3c). Under these deposition conditions the Au aggregates in orienta-
tion (100) reach a higher percentage, 70% compared to approximately 60% for
deposition made at a deposition rate of 0.3 A " (Figure 1). Since the
number of coalescent actions is reduced at this deposition, according to
* !what can be judged from the histogram in Figure 2, the gradual increase in
epitaxial orientation S100 is attributed to the greater time accorded the
formation of Au aggregates (Table 2) following the reduction in deposition rate.
20
T
With respect to the Au aggregates formed in an ultrahigh vacuum on a
KBr substrate cleaved in situ, Puskeppel and Harsdorff (161 mention the increase
in the degree of epitaxial orientation with: the increase in evaporation time,
the increase in substrate temperature from 210 to 300*C, and the decrease in
the deposition rate. In the initial stage of nucleation histograms of the
diameter distribution of Au aggregates [16] indicate the presence of aggregates
of epitaxial orientation in the domain of diameters of greater value; in the
coalescence phase every large crystallite is oriented epitaxially.10-2
3.2. KCI Substrate (8.1 1 10I0 cm Pb Colloids)
The results obtained for Au particles formed on a KCl substrate with
Pb colloids are presented in Table 2 and Figures 4, 5 and 6. The specific
density n of aggregates formed at a substrate temperature of 290°C and a
deposition rate of 0.3 A " s-I increases in the interval of equivalent
thicknesses from 4.5 to 6 A. After reaching the maximum saturation density
of N at 6 A, n drops because of coalescence processes (Figures 5 and 6) in5 x
the interval of equivalent thickness from 6 to 12 A. The density of the
aggregates nx, obtained under identical deposition conditions and thickness
intervals, is greater for particles formed on the KCI substrate with Pb
colloids in comparison with the KBr substrate with Cu colloids, and the mean
diameter D of the aggregates is smaller, while the degree of coverage of the
surface Z with aggregates is approximately the same. In the interval of
equivalent thickness from 4.5 to 6 A, the degree of epitaxial ordering S10 0
increases from 25 to 41%, remaining practically constant up to the equivalent
*thickness of 12 A. Compared with the KBr substrate with Cu colloids for
particles made under these same conditions on a KCI substrate with Pb colloids,
with the exception of a smaller degree of epitaxial ordering, we can observe
the existence of an initial domain in which S increases with time for
10021
Le I II
equivalent thickness of particles t (Figure 4). It should be mentioned that,
in the interval of equivalent thickness from 4.5 to 6 A, an increase occurs
in both S100 and n x . Among the aggregates formed on the KCl substrate withill
Pb colloids, aggregates in orientation (ke" are also observed in a small
number (Table 2 and Figure 6). Deposition made at a substrate temperature of
260C at the same deposition rate R differs in all parameters (nx, Z, D, S1 0 0 )
in comparison with deposition made at a substrate temperature of 290*C
(Table 2 and Figure 4). Along with an increase in the equivalent thickness0
of particles from 6 to 12 A, there is an increase in the specific density nx
from 25 to 35 1 0 aggregates per cm , in the degree of epitaxial ordering
SI00 from 0 to 23%, in the degree of coverage Z from 5 to 11%, and in the mean
diameter D from 52 to 62 A. It should also be mentioned that, under the same
deposition conditions, the parameters n and S100 of the Au aggregates formed
on the KBr substrate with Cu colloids remain practically constant for particles
made at substrate temperatures of 260 and 2900C. Aggregates in orientation
(111) are missing from the deposition made at a substrate temperature of 260*C.
The rate of attaining the specific maximum density N of the Au aggregates mades
at the substrate temperature of 290*C at a deposition rate of 0.1 A - s is
very different from the rate of attaining the maximum density N for aggregatess
formed with a deposition rate of 0.3 A s (Figure 4).
3.3 NaCl Substrate (1.2 ' 10I0 cm-2 Cu Colloids) and Other NaCI Substrates
The results obtained for Au deposition on a NaCI substrate with Cu and Ag
colloids are presented in Table 3, and Figures 7, 8 and 9.
The specific density n of the Au aggregates formed at a substrate0.-i
temperature of 290°C, at a deposition rate of 0.3 A s * increases in the
interval of equivalent thickness from 4.5 to 6 A. After reaching the maximum
saturation density N at the equivalent thickness of 6A, n drops because ofSs x
22
the coalescence processes (Figures 8 and 9) in the domain of equivalent
thickness from 6 to 9 A, and increases again because of secondary nucleation
at the equivalent thickness of 12 1. The value of the specific density of
the aggregates nx is comparable to that obtained under similar deposition
conditions on a KCl substrate with Pb colloids in the domain of equivalent
thickness from 4.5 to 9 A, both in value and in the appearance of dependence
in comparison to the equivalent thickness of the particles. However, the
degree of epitaxial orientation S1 00 is greatly decreased (Figures 7, 8 and
9), while the increase in $100 in the interval of equivalent thickness from
4.5 to 12 1, from 0% to 6%, is very slight. On the other hand the percentage
of Au aggregates in orientation (111), Sil is quite large, compared to the
percentage found for the depositions made under the same conditions on a
KBr substrate with Cu colloids and on KCI with Pb substrates. In particles
with an equivalent thickness of 12 A, Sll is equal to 14% of the maximum
value for Au aggregates with the same morphology, and more than double the
$100 (Table 3). The degree of coverage of the surface Z with aggregates has
values close to those obtained by deposition on a KCl substrate with Pb
colloids for equivalent thicknesses of 4.5, 6.0 and 9.0 A, but the equivalent
thickness of 12 1 records a value of 44%, compared to 28% for the KCU sub-
strate with Pb colloids (Figures 4 and 7). A reduction in the substrate
temperature from 290 to 260oC, while maintaining the deposition rate of
0.3 A s ,determines a drop in the specific density nx of the Au aggregates,
in the degree of S100 and Sll orientation, in the degree of coverage Z and in
a reduction of the diameter D (Table 3). The most pronounced differences are
recorded in deposition with equivalent thickness of 12 A. Thus, while the
degree of coverage Z with aggregates for particles made at a substrate tempera-
ture of 290*C with an equivalent thickness of 12 A is 44%, it is only 8% for
23
particles with the same equivalent thickness made at a substrate temperature
of 260*C (Table 3 and Figure 7).
The increase in the formation period of aggregates at a substrate tempera-
ture of 290c in producing condensation at a deposition rate of 0.1 1 * s- 1
compared to that at 0.3 A s - , determines an increase in their specific
density nx and their degree of S O0 and Sll1 orientation (Table 3 and Figure 7).
The kinetics of formation and degree of orientation of the Au aggregates
condensed on a NaCI substrate with a density of 5.2 * 108 Cu colloids2 i1
per cm and on a NaCl substrate with a density of 3.6 1010 Ag colloids2
per cm , are similar (Table 3).
4. Discussion
As can be judged from a series of works [1, 9, 13, 17-22], with a total
existence of several m2 of Au deposited for evaporation on alkali halide
substrates, there still is not a satisfactory theory for the epitaxis or to
specify the specific factors which govern the processes of oriented growth
in the case of formation of thin layers through a process of nucleation and
growth.
In a previous work [23], using the formalism of the atomistic theory of
nucleation [15, 18, 24-28] and experimental results obtained by Adam and
Harsdorff [29,30] on the degree of oriented growth of thin layers of Au as a
function of deposition conditions on alkali halide substrates, we have
demonstrated the fact that epitaxial growth can only be achieved under
conditions of incomplete condensation. In accepting the hypotheses of the
atomistic theory of nucleation [15, 18, 24-28], the condition of incomplete
condensation is achieved under conditions in which the process of re-evaporation
of the donor atoms is dominant. The fact that realization of the degree of
j epitaxis different in the Au thin layers, as a function of the alkali halide
24
I IIII- - -- i
substrates on which they are formed, has not been able to be demonstrated
by parameters characteristic of the atomistic theory of nucleation [23],
demonstrates the inadequacy of the phenomenological hypotheses admitted in
the theory, especially for the condition of incomplete condensation. It should
be mentioned that, in order to achieve nore satisfactory correspondence between
the experimental data and the theoretical description of the kinetics of Au
aggregate formation on alkali halide substrates under conditions of incomplete
condensation, the atomistic theory of nucleation should have considered the
existence of aggregate mobility [15, 18, 24, 31, 32]. However, as Robins [24]
has mentioned, this agreement has only been produced by means of mathematical
calculation, while the intrinsic nature of aggregate mobility and of the
coalescence determining it have not yet been explained.
Acknowledging the mobility of the aggregates implies realization of their
coalescence, not only by growing together in a process of capturing donor
atoms which diffuse on the substrate, but also by shock in the process of
their migration. The interpretation of Harsdorff's theory [13, 16, 33] by
Metois, Masson and Kern [34, 35] from experimental results stipulates the
possibility of formation of epitaxially oriented aggregates through the
coalescence of aggregates migrating on the substrate. These opinions [13,
16, 19, 22, 33J and experimental data [34, 35] provide support to buttress
consideration of the formation of epitaxial aggregate as a post-nucleation
phenomenon [19, 36], and this implies renunciation of the theories based on
critical epitaxial nuclei [25].
In presenting the results of our experiments in forming Au aggregates onJ
KBr, KC 2 and NaCl substrates with colloidal centers, we have aimed at
demonstrating the existence of the two dependencies mentioned:
4
a. the dynamic nature of the degree of epitaxial ordering, and variations
in S with deposition times;
b. dependence of the degree of epitaxial ordering S100, with respect to
the phenomena of coalescence.
Our experimental data demonstrate the influence of the deposition time
on the grade of epitaxial ordering S100. Thus, by reducing the deposition*. -il -
rate from 0.3 A s to 0.1 A -, we have succeeded in increasing the
degree of epitaxial orientation S100 , and the Au aggregates with equivalent
identical thickness formed at a substrate temperature of 290*C on KBr, KCI
and NaCl substrates with colloids (Tables 2 and 3, Figures 1, 4 and 7).
When Au is deposited on KCl substrates with Pb colloids at a substrate0 -l
temperature of 290C and at a deposition rate of 0.3 A s , there is a
significant growth (30%) in the degree of epitaxial orientation S100, along
with an increase in the equivalent thickness of the particles. However, the
predominant role in producing Au aggregates of epitaxial orientation, as this
study verifies, is the nature of the alkali halide substrates and the deposi-
tion conditions [8, 19, 39, 30, 37, 38].
Our experimental results have demonstrated that no direct connection can
be established between the presence of phenomena of coalescence, secondarynucleation and the degree of epitaxial orientation S 00. Thus, the appearance
of coalescence phenomena and of secondary nucleation in Au aggregates with an
equivalent thickness of 12 A formed at a temperature of 290*C on a substrate
of KBr with Cu colloids and a substrate of KCl with Pb colloids does not
modify the value of the degree of epitaxial orientation (Table 2, Figures 1,
.1£ 2, 4 and 5). On the other hand, for Au aggregates with an equivalent thick-
ness of 12 A formed at a temperature of 2900C on a NaCl substrate with Cu
colloids, the presence of coalescence phenomena and secondary nucleation
26
determine the greater growth in the degree of S111 orientation compared to the
degree of epitaxial orientation S 0"
The kinetics of formation of Au aggregates on alkali halide substrates
with colloidal centers, namely: the time for reaching the maximum saturation
density N., the rate of increase in the mean diameter D of the aggregates and
the degree of coverage Z with aggregates, along with the increase in the
equivalent thickness t of the particles, demonstrates dependence with respect
to the intrinsic nature of the alkali halide substrate and the deposition
conditions.
5. Conclusions
The phenomenology of the processes of nucleation, aggregate mobility,
aggregate crystalization, the formation of continuous metallic layers on
alkali halide substrates, is primarily dependent on the intrinsic nature
of the substrates and, secondarily, on the deposition conditions. In
characterizing the intrinsic nature of the alkali halide substrates, it is
necessary to take into consideration both the parameters of the material in
the atomistic theory of nucleation [23] and the structure of defects in the
substrates [18, 22, 39, 40], along with possible interaction at the aggregate-
substrate interface.
References
I. f:..1. Ra.snw. .. A. KoTzR and C. A.O. HFNNI'fl. Ibi Folid Filit,. "P. M.5 0975),2. V. ToPA. S. o0A., B. VV, icFscU et. (;he. MITIMnA^ A. iH*v. 110 I h. 1, 1N. I7i (97:).3. A. J. DoNnunmo and J. . Rnomrs, .1. cr.st. Growth. 3,. 7 (1 1l72).4. H. ScHMF.sP., . Thin Solid Films. 2, 8I (1971).5. A. CKAMINVS. D. G. Lonn and M. NuTTON. Thin Solid Film%. A. 11, (0970).R. S. I.t .D. WATANAIIR. S. OOAWA, . Phy4, SoC. .10p1. 1. IT -1 (19 62).
• ( 7. .1. W. MArrtwR q and M,.GflE'NIVAt'I. AppI. rhys. 1.xithr% P. 111 (19c1): I'hi. in ., it.123 (1965).
Kt. .1. W. NIATTIFlVA, .J. Va'. Sei. Teehnol.. :1. 1::3 ii9)9. 11. SAro .and S. SIINNO.AKI. SUrfnV, SPII rc. 21. 2'9 09..
27
1 ) K 1 1H ). a d Y Y~A A nIIP .11 . O n I ".. S 1.6. l h . * . IIp aIII2 .1 1 i i l (19 6 )
61 S. 1-4. .1. Mrs \. Soc aan,' . 21i.. .:g. 1 1 19 ) 6
12. . Nom. Iid . 06AWI 1 . *.I~lis. 4% 1l. 2 2.25 . :16.7 (19 7)
1.1 . 6 f. ,.- H .11.1 Ir Thi ~So d Fis i ol. 39r 1403 6,19766). iit 111 S.INO 6 1 ). WSI SI II. and SnIII . 1 V% .6.611,St, itl.II." 14
I.S .1 l. on~s Iill. Mam..* 27~i* .(11 (1 4 97).
136 A. fin %1 IS.-mii SebrIic SC-Milc IU.m M's6 99 4197766.
2'. 4) 1' . 1 1114 1. PhIg~u~c i . WI6. t;2I4lJ1)
* 12. I. I I~ ~ II Ih %I %1 % Ig. , I6 9 . -I is ro %% A6 H I. 13111 . 11 's117212, 1'in. I', is, Ni.3 \- m 271. I S19 3
.11 'I IPi s S I I i , I 1.. Natua.i I ic ,. :1. .)7 1197 l.6
., .a,,.... suIIMo Ii~s M6 II.IrD . h iju oi lihau. 2:, (11.17774)
:., I. X'S I ,. 1ti~. Vikaiii. , I IN 196.L .IsicIb .. W. Iithw , A ue i I''5.
ii I. 9. \I N ami I d' s u. c S *% '19,6eIii .u %ci I ,616 olid 4 i las (167.24.)( 71 ..9m 'it 1 %mid a. v 'S. i tiveA 1. 2LI173 9 -1. Iz. kuN k. rhl..41 24 )(97 .
.139 mS... Ys:'. .Thiii So I'lid Hi s. V.i, 91 li 0971 , 8,25 1 4..\I .1. I,,.'11f. aso bii Pia II~m. :169,.m .2p:, 133716,.s S p i. 2 .1
I I I , 7: I ris M. liii. A \1tictliii 2. I t. k6ilMN1I Thill lid .g. Fii,eiI 11,1 5 (1972
3 ;. I I N I' i..meAt o I *.%. J. A 4 .N it I t 1:1i~iI6,. -,i. lim-.i. l a oidF l s 2031.J 7 )36 e Ir s ill~ v Inr r Epfer91 1. tee tcrliij ' m I. Att. I'di' by'c r.Illi*. IIP W.1( Mat e Aadi c rondt
.fro\ilo . off the %.nntn V. i.~ Ic% wi ll h s 6 I9 jl96 lid31 .16h .Filtob =1 241 190.llfil,.
my modc. n Ions :sil .1un 1610 Mim. rhiii sidNu Fims I3 rl ,~ :.V, 196,IlilI c iir .ITh IteIrflflllC hmagMo c,,nccrllo 39. e 2ll 4II9,i'97l ffl3,110iVICltIhik
j),11 1.p~h1if ro ns w r iled illt 2 nr'I to Heltn l1lI 161-11141% ild pornit111le r' ith p1.o1
'.1 11~~~~~~~~. peifenta i-*fmty nt,1 Ie ris lS~. ot5. 4 of 1"iIl )96iIS heIile1o h
Thife reseti bor her Iai le t he epr me anIinee li t prlc. llII6Itni.
tile e,,btronicdreslts re c~image cincrelinlut tile 11 lpoi..l.91ris of ails Iivlrkers In hk
phenfeflcloeagy the prces andililii ennI I gtr~il6mt 11) ,1rkl(it pnlc is r 'lIlt
28

DATE
IFILME1


![Chapter 308-93 WAC - Legislature Homeleg.wa.gov/CodeReviser/WACArchive/Documents/2012/WAC-308-93... · (5/11/10) [Ch. 308-93 WAC—p. 1] Chapter 308-93 Chapter 308-93 WAC VESSEL REGISTRATION](https://img.pdfslide.us/doc/110x75/5b99bc9a09d3f29c338cd7cb/chapter-308-93-wac-legislature-51110-ch-308-93-wacp-1-chapter-308-93.jpg)