Embed Size (px)
Citation preview

This is the author version published as: This is the author version published as:
QUT Digital Repository: http://eprints.qut.edu.au/
Frost, Ray L. and Zbik, Marek and Martens, Wayde N. and Chen, Yi-Ming and Chen, Jian-Hua and Song, Yen-Fang (2010) Smectite flocculation structure modified by AI13 macromolecules; as revealed by the Transmission X-ray Microscopy (TXM). Journal of Colloid and Interface Science, 345(1). pp. 34-40.
© Copyright 2010 Elsevier
1
Smectite flocculation structure modified by Al13 macromolecules; as 1
revealed by the Transmission X-ray Microscopy (TXM) 2
3 Marek S. Żbik, Wayde N. Martens, Ray L. Frost, 4
Inorganic Materials Research Program, School of Physical and Chemical Sciences, 5 Queensland University of Technology 2 George Street, GPO Box 2434, Brisbane Qld 4001 6
Australia. 7 8
Yen-Fang Song, Yi-Ming Chen, Jian-Hua Chen 9 National Synchrotron Radiation Research Center, 101 Hsin-Ann Road, Hsinchu Science 10
Park, Hsinchu 30076, Taiwan, R.O.C. 11
12
13
Corresponding Author: Ray L. Frost 14
E: [email protected] 15
P: +61 7 3138 2407 16
F: +61 7 3138 180417 Author to whom correspondence should be addressed ([email protected])
2
Smectite flocculation structure modified by Al13 macromolecules; as 18
revealed by the Transmission X-ray Microscopy (TXM) 19
20 Marek S. Żbik, Wayde N. Martens, Ray L. Frost, 21
Inorganic Materials Research Program, School of Physical and Chemical Sciences, 22 Queensland University of Technology 2 George Street, GPO Box 2434, Brisbane Qld 4001 23
Australia. 24 25
Yen-Fang Song, Yi-Ming Chen, Jian-Hua Chen 26 National Synchrotron Radiation Research Center, 101 Hsin-Ann Road, Hsinchu Science 27
Park, Hsinchu 30076, Taiwan, R.O.C. 28 29
Abstract 30
The aggregate structure which occurs in aqueous smectitic suspensions is responsible for 31
poor water clarification, difficulties in sludge dewatering and the unusual rheological 32
behaviour of smectite rich soils. These macroscopic properties are dictated by the 3-D 33
structural arrangement of smectite finest fraction within flocculated aggregates. Here, we 34
report results from a relatively new technique, Transmission X-ray Microscopy (TXM), 35
which makes it possible to investigate the internal structure and 3-D tomographic 36
reconstruction of the smectite clay aggregates modified by Al13 keggin macro-molecule 37
[Al13(O)4(OH)24(H2O)12 ]7+. Three different treatment methods were shown resulted in three 38
different micro-structural environments of the resulting flocculation. 39
40
Keywords: Transmission X-ray Microscopy, Keggin structure, smectite, flocculation 41
42
1. Introduction 43
44
Smectites are clay minerals commonly found as components of soils from temperate 45
climates. Smectites are formed as result of the weathering of volcanic glass which is 46
abundant in ash-beds and basic rocks like basalts. Smectites are useful for dam bed 47
impregnation, to improve water retention properties and as drilling mud, to seal the cut, thus 48
Author to whom correspondence should be addressed ([email protected])
3
preventing fluid loss. They are also popular stabilising additives in engine oils, cosmetics, 49
pharmaceutical and chemical industries. 50
Smectite’s unusual macroscopic properties are dominated by its structural arrangement 51
and the morphology of its finest fraction. These clays are extremely dispersed and exhibit 52
very high surface area of several hundred square meters per gram. High smectite dispersion 53
in water makes this group of minerals very attractive as the crude base to all game of nano-54
materials manufacturing for various applications. These applications use the materials high 55
porosity, high sorption capacity and high surface area for catalytic purposes. Intercalated and 56
pillared clays have attracted increasing attention, particularly from industry since the 1970s, 57
because of their microporous nature and catalytic potential. All clay modifications like cation 58
exchange, pH variation, intercalation and other techniques aims to change the structural 59
matrix of resultant material and this determining the resulting material properties. 60
61
The first attempt to describe the microstructure of clays was made by Terzaghi [1], who 62
proposed the honeycomb model as the structural basis of water saturated clays. Subsequent 63
investigations based on the development of new techniques in electron-microscopes [2] 64
confirm the existence of the “card house” structure Rosenquist [3], Bowles [4]. Pusch [5] 65
confirmed the presence of the honeycomb microstructure in wet clay sediments. Cryo-SEM 66
investigation in O’Brien [6] published a large amount of microstructural data. Given the size 67
of the clay constituents, SEM was found to be the tool of choice used by scientists studying 68
the microstructure of smectitic clays [7]. Most recently Synchrotron based Transmission X-69
Ray Microscopy (TXM) allowing 3-D examination of examined structure in stereo pares as 70
well as in computer calculated 3-D reconstruction [8, 9]. 71
72
From numbers of smectite modification agents we chose intercalation and cation 73
exchange by Al13 Keggin-like macromolecule in present investigation. This is because of 74
high positive charge of this molecule which may have significant impact on resulting 75
smectite aggregate structure in aqueous suspensions. Further to this this research has 76
profound implications for the water purification industry where alum or aluminium 77
chlorohydarte is used. In the present article we present the microstructure of resulting 78
aggregates as observed by the TXM technique. 79
80
Sample preparation methods available for cryo-investigations in electron microscopy 81
techniques, like partial freeze drying, critical point-drying and cryo-fixation, have been found 82
Comment [m1]: Does not make sense
4
to introduce many artefacts especially when applied to the study of clay suspension or gel 83
structure [10]. These artifacts result as a consequence of the low thermal conductivity of 84
water and ice, which only allows a slow rate of heat withdrawal from the specimen. Thus, 85
TXM method which allowed observation of clay particles in water without any pre-86
preparation is free of above mentioned artefacts and was chosen in conducting present 87
investigations. 88
89
2. Experimental Section 90
91
During the last decade the TXM technique has been implemented to the study of clay 92
aggregate structure in aqueous environment science, nano-tomography. This method is based 93
on the transmission X-ray microscopy, which works with a synchrotron photon source at the 94
BL01B1 endstation of the National Synchrotron Radiation Research Center (NSRRC) [11]. 95
This new technique [12] has recently been established to investigate clay suspension in an 96
aqueous environment, without sample preparation. The big advantage of TXM tomography, 97
is that without sample pre-treatment it is possible, for the first time, to observe clay 98
microstructure in an aqueous environment, artefact free. 99
100
The smectite used in this study was a well known Na-montmorillonite from Wyoming 101
(U.S.A.), obtained from Clay Science Society. The original clay sample (SWy-2) has been 102
well described [13] and the two samples were prepared from this original clay. First, the 103
colloidal fraction was separated by centrifugation and secondly, all cations in exchangeable 104
positions were ion exchanged with Al137+ ions. Experiments were performed in distilled 105
water. 106
107
The cluster cation (Al13O4(OH)24(H2O)12)7+ has the Keggin structure with a tetrahedral Al 108
atom in the centre of the cluster coordinated to 4 oxygen atoms [14]. This ion is generally 109
called the Al13 ion. A Ga13 analogue is known [15] and also was used in our experiments to 110
investigate whether Ga atoms have greater absorption and hence contrast than Al atoms. 111
112
Preparation of intercalated Swy-2 montmorillonite and solutions of aluminium and 113
gallium 13 keggin ions where prepared by a method similar to Doung et al. [16]. Solutions of 114
sodium hydroxide (0.10M), aluminium nitrate (0.05M) and gallium nitrate (0.05M) were 115
prepared in filtered water (18.2MΩ). A peristaltic pump was used to add the hydroxide 116
5
solution (0.125% of the solution per minute) to a solution of the metal nitrate in a molar ratio 117
of 2:1 (hydroxide: metal). The resultant keggin ion solution was allowed to age over night 118
before use. To an aliquot of the keggin ion solution, the sodium exchanged Swy-2 was added 119
in an amount which ensured the keggin ion remained four times the CEC. The clay in keggin 120
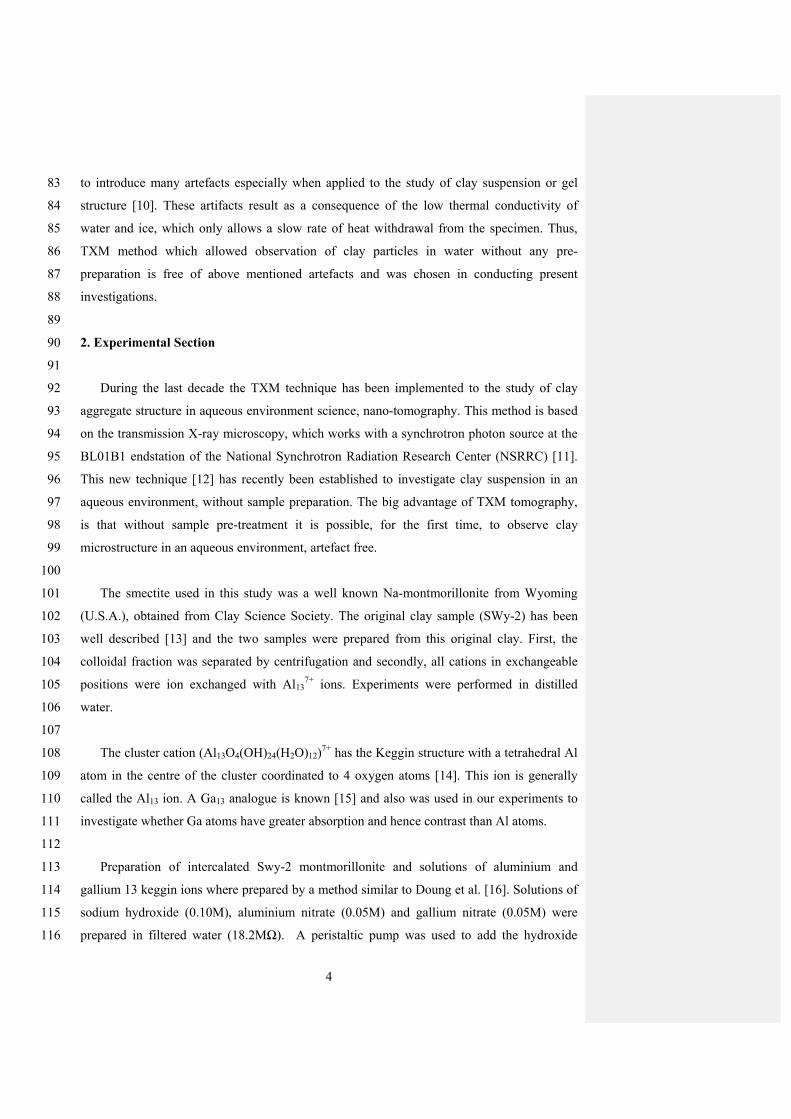
ion solution was mixed overnight using a magnetic stirrer before collection, washing and 121
drying via vacuum filtration. The keggin ion exchanged SWy-2 was subjected to x-ray 122
diffraction to ensure complete exchange as shown in Fig. 1. 123
124
0
5000
10000
15000
20000
25000
30000
3 8 13 18 23 28
2 Theta
Inte
ns
ity
SW-2 Na
125
A
Comment [m2]: We should give this information
6
0
500
1000
1500
2000
2500
3000
3500
4000
3 8 13 18 23 28
2 Theta
Inte
ns
ity
Keggin Ga13
Keggin Al13
126
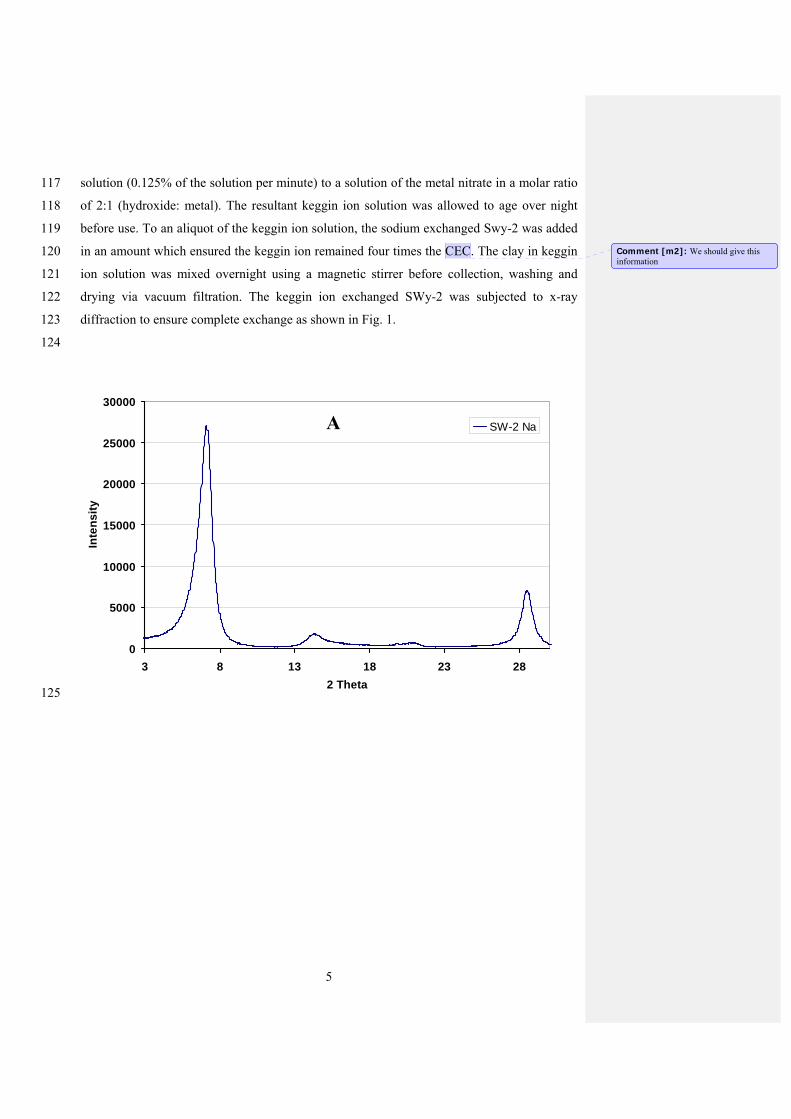
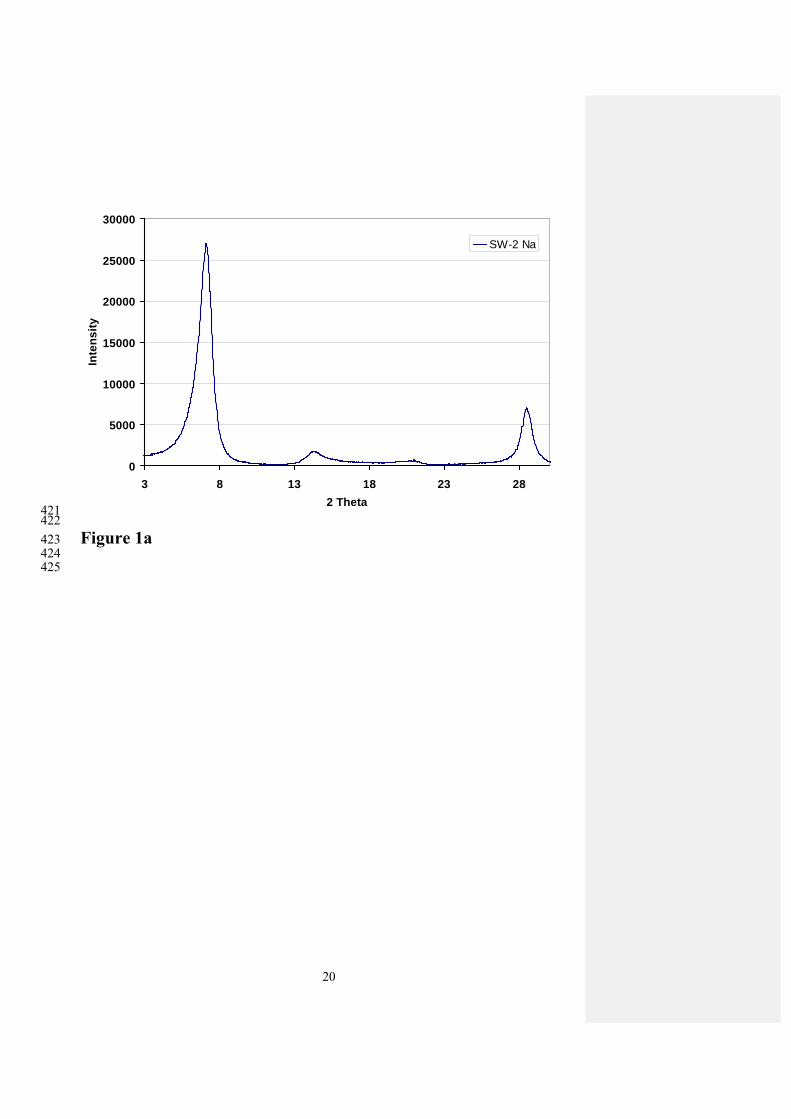
Fig. 1- XRD of the colloidal fraction of (A)- natural Na SW-2 show significant 001 peak in 127
xxnm, (B)- after intercalation by Al13 and Ga 13 the mine 001 peak shifted towards larger 128
separation distances. 129
130
A 10 % w/v suspension of the keggin exchanged Swy-2 was prepared from dried sample 131
(Sample 0) by redispersing it in filtered water. In addition to this method, two other ways of 132
smectite intercalation were performed to avoid the drying and redispersion step. One method 133
(Sample 1) was prepared by addition of keggin diluted solution to smectite suspension which 134
visibly resulted in gelation. A second method (Sample 2) based on addition of powdered 135
smectite into diluted keggin solution which destabilised the smectite into flocculated 136
aggregates. To all suspensions an aliquot (3 µl/ml of suspension) of 1mg/L gold nanoparticles 137
(0.8-0.5 µm) was added. 138
139
Sample of one nano-liter of suspension was placed on the Capton tape within a 140
silicon/silicon nitride and metal frame of sample holder about 3 cm in diameter. To prevent 141
water evaporation during the time of experiment samples were covered by another layer of 142
Capton tape. The prepared suspension was kept between two layers of Capton tape of 143
thickness about 100 nm was mounted in sample stage within the beamline of X-rays in TXM 144
and investigated. 145
146
B
Comment [m3]: Figure needs redoing please send the original files
Comment [m4]: This does not sound correct as I could see the thickness.
7
3. Results and discussion 147
148
Smectite represents a 2:1 type layer silicate with an expandable structure carrying a 149
certain amount of excess negative layer charge comprising of sheets linked by weak van der 150
Waals forces. The layered structure consists of an octahedral alumina sheet sandwiched 151
between two tetrahedral silica sheets. 152
153
From microscopical observations [17], smectite consists of relatively large, flexible sheets 154
with lateral dimension of ~800 -1000 nm and thickness of ~1-10 nm. The platelet assembly of 155
the sheets are stacked on top of each other, in a parallel fashion called a tactoid (stacks of 156
parallel clay platelets at – 10 Ǻ separation). Due to bonding between individual sheets being 157
very weak, the sheets easily slide along the top of each other and are quite flexible. Individual 158
smectite sheets can be as thin as about 1 nm. Sodium smectite in a water suspension forms a 159
gel where the tactoid sheets are highly flexible, individual particles and interact by a 160
combination of edge attraction and basal plane repulsion. These properties build an expanded 161
and extremely voluminous cellular network, composed of chain-like sheet assemblies similar 162
to those described in the cryo-SEM and TXM micrograph [18]. In such an extended cellular 163
network, flexible smectite sheets encapsulate water within cellular voids of dimensions up to 164
0.5-2 µm is known to span all volume of clay slurry, or produce separate aggregates. The 165
AFM force measurements presented by authors show long range repulsion in range similar to 166
observed cellular dimensions which were reduced in half in distances when Ca2+ cations were 167
in exchangeable positions. This unusual long interaction was explained by some sort of steric 168
interactions between smectite sheet tactoids. 169
170
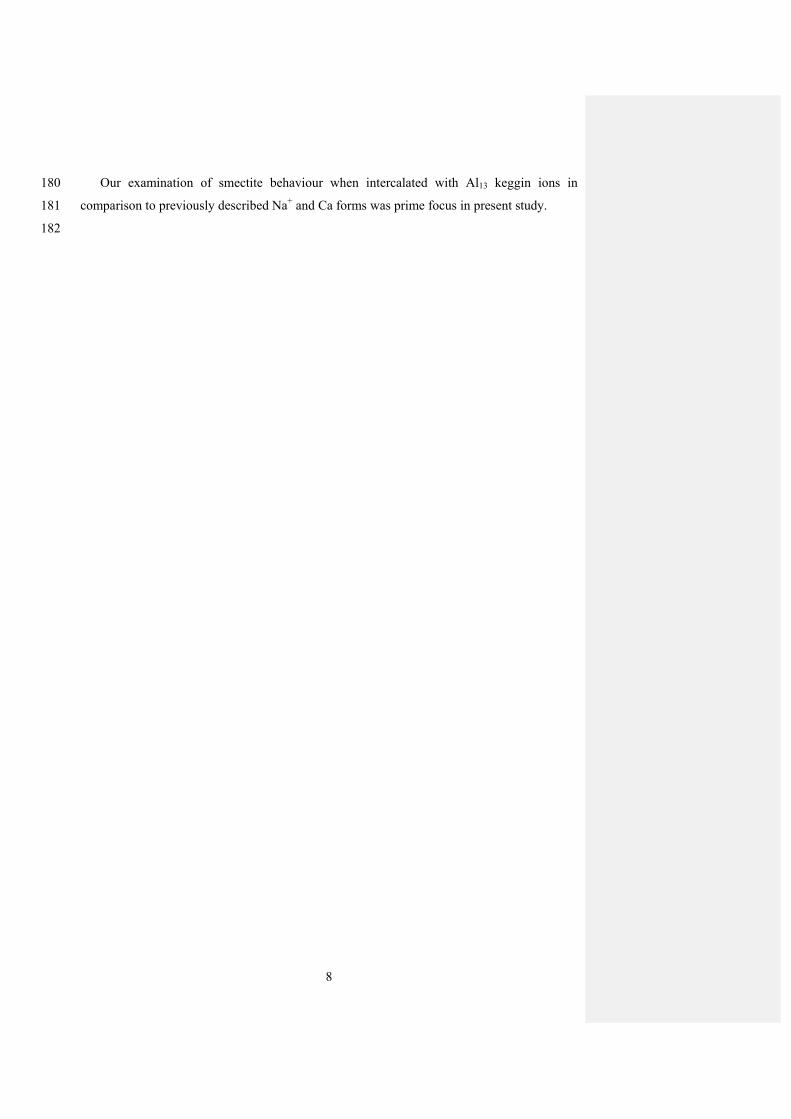
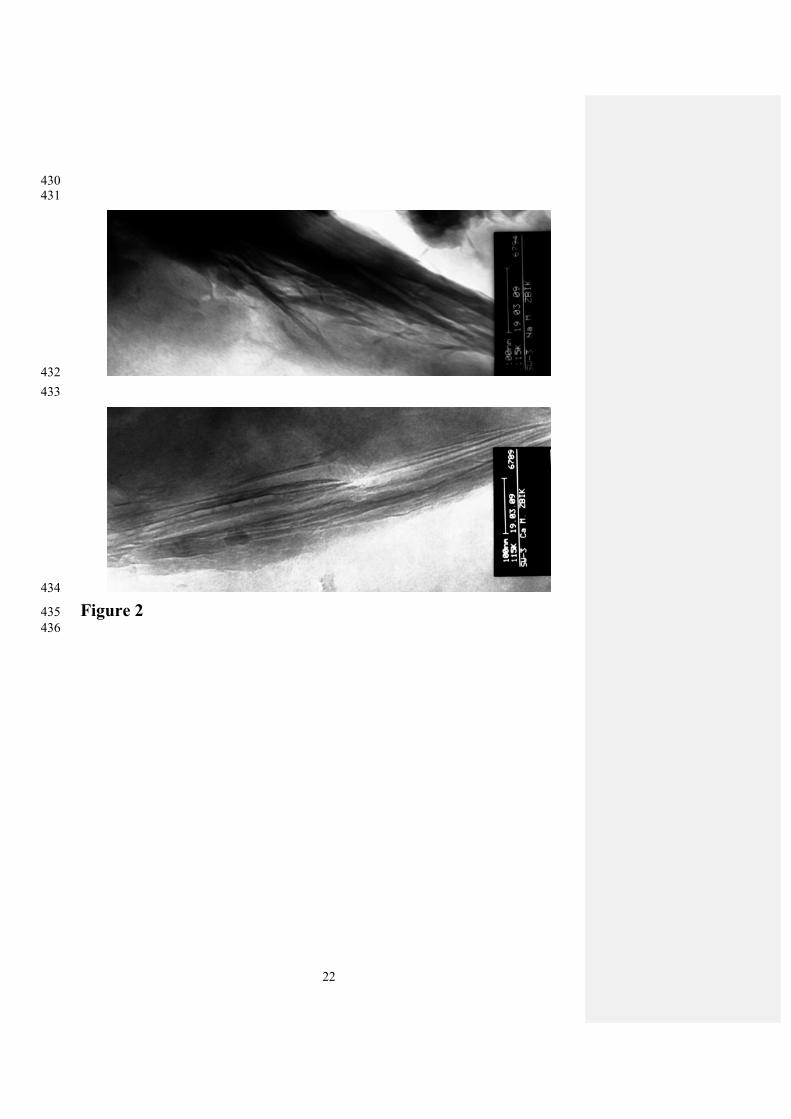
In can be true as has been seen in the TEM micrographs in Fig. 2. In micrograph Fig. 2A, 171
smectite plate with Na+ cations in exchangeable positions shows extended layer of loose 172
“hairy” texture which may resemble the diffusion layer from double layer electrokinetic 173
theory. This layer is more than 200 nm thick, but sample was dried to be investigated in 174
SEM. This layer may be significantly larger within water environment and it may be 175
responsible for described in [18] steric repulsion. In smectite with Ca2+ cations in 176
exchangeable positions like shown in Fig. 1B such a layer is depressed to within 50 nm 177
distance from platelet surface. 178
179
Comment [m5]: Figure 1A is XRD
8
Our examination of smectite behaviour when intercalated with Al13 keggin ions in 180
comparison to previously described Na+ and Ca forms was prime focus in present study. 181
182
9
183
184
185
186
Fig. 2 TEM micrographs of (A)- Na+ and (B)- Ca2+ smectite flakes shown significant 187
roughness at the platelet surface 200 nm extended in the Na+ and ~50 nm in Ca2+ 188
exchangeable forms. 189
190
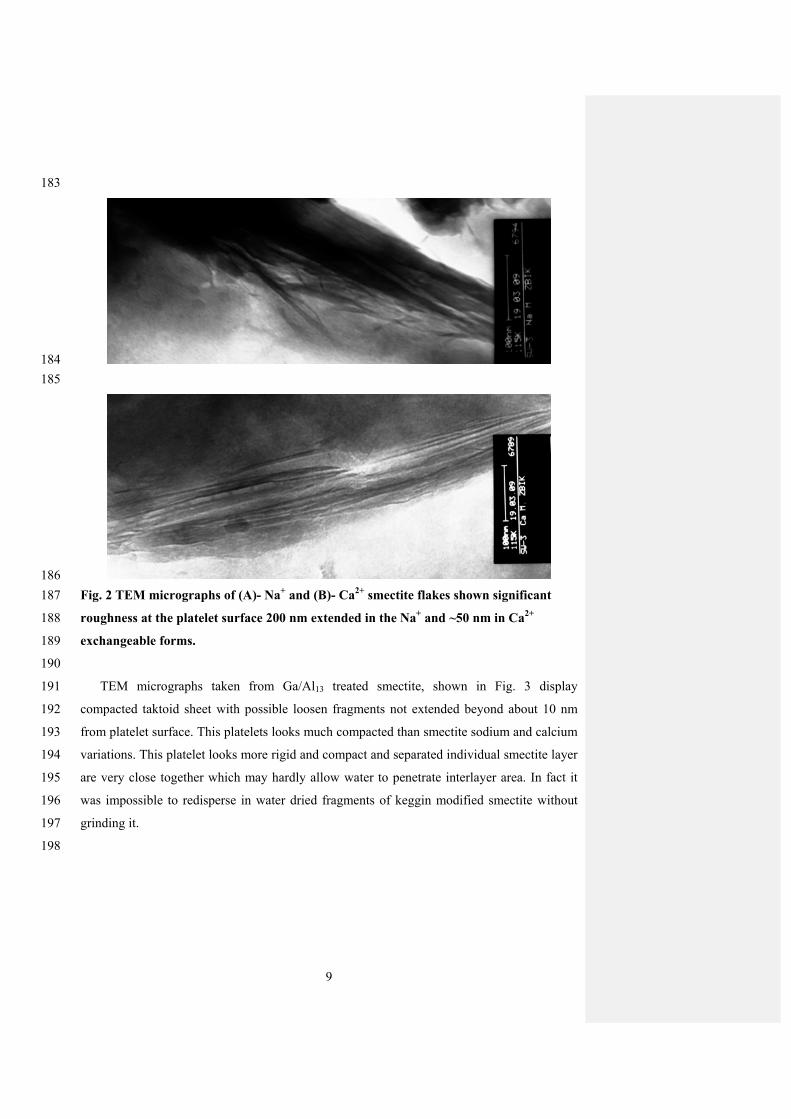
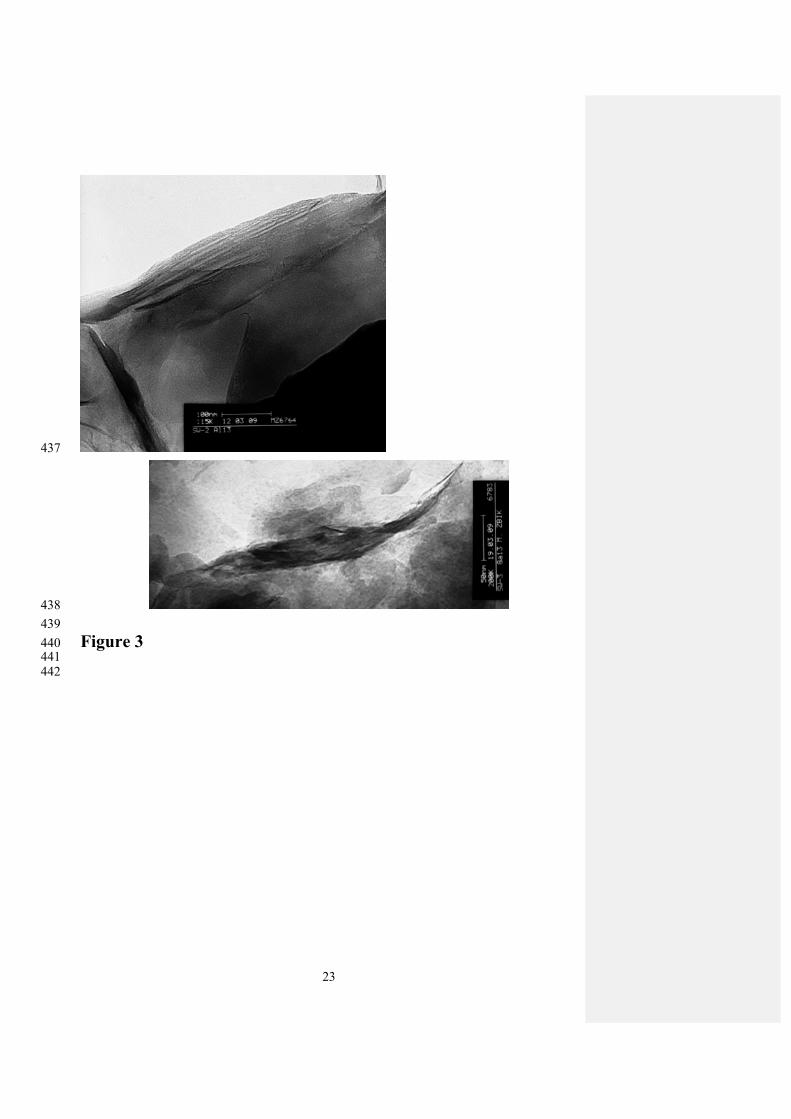
TEM micrographs taken from Ga/Al13 treated smectite, shown in Fig. 3 display 191
compacted taktoid sheet with possible loosen fragments not extended beyond about 10 nm 192
from platelet surface. This platelets looks much compacted than smectite sodium and calcium 193
variations. This platelet looks more rigid and compact and separated individual smectite layer 194
are very close together which may hardly allow water to penetrate interlayer area. In fact it 195
was impossible to redisperse in water dried fragments of keggin modified smectite without 196
grinding it. 197
198
10
199
200
201 Fig. 3 TEM micrographs showing keggin treated smectite display compacted taktoid sheet with 202
highly depressed surface loose material layer to maximum 10 nm. 203
204
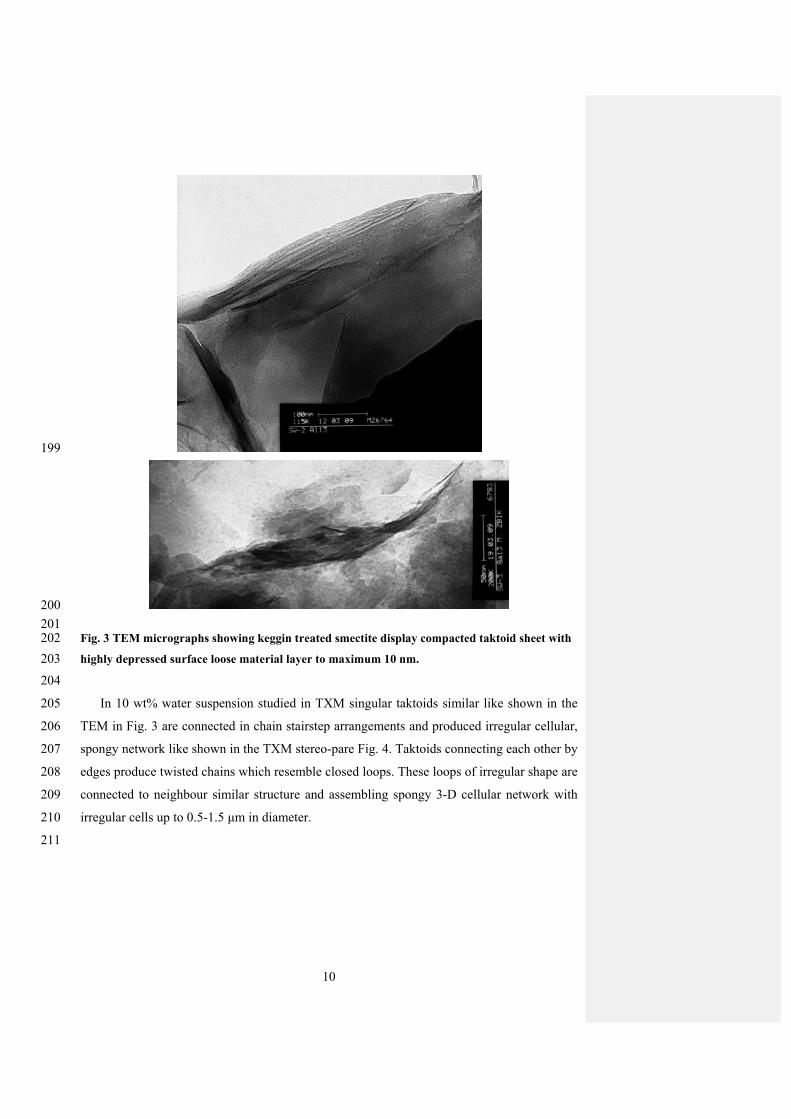
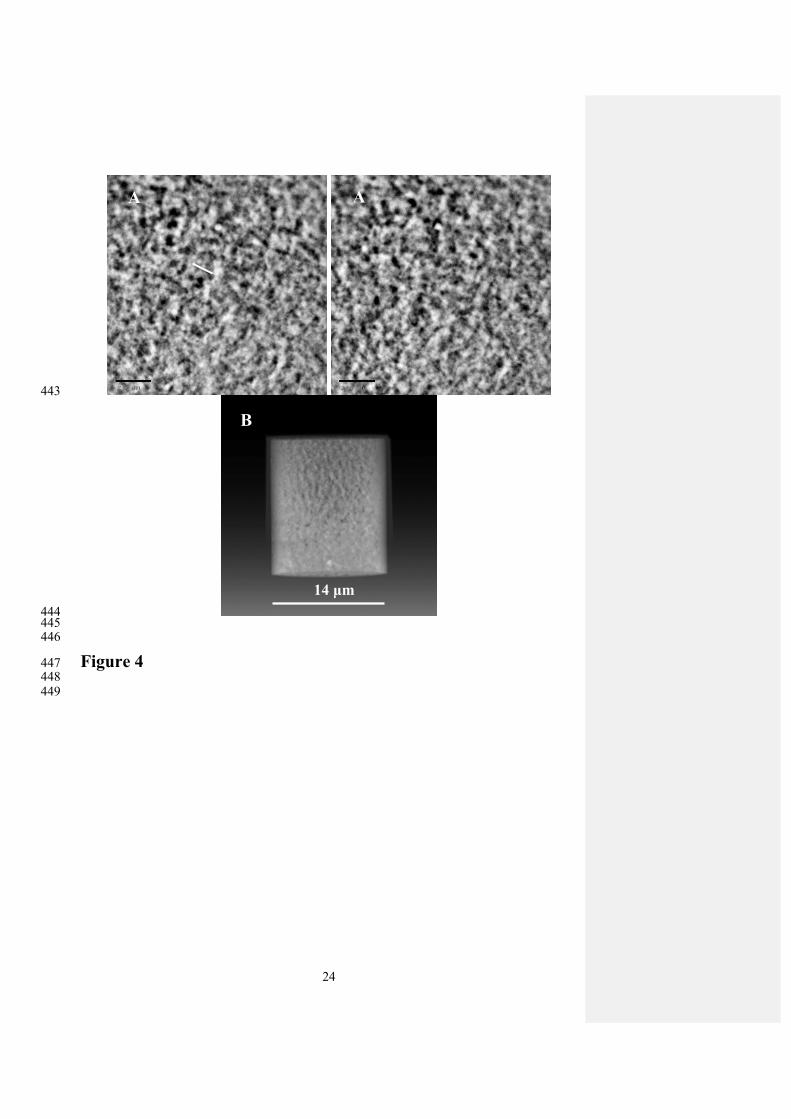
In 10 wt% water suspension studied in TXM singular taktoids similar like shown in the 205
TEM in Fig. 3 are connected in chain stairstep arrangements and produced irregular cellular, 206
spongy network like shown in the TXM stereo-pare Fig. 4. Taktoids connecting each other by 207
edges produce twisted chains which resemble closed loops. These loops of irregular shape are 208
connected to neighbour similar structure and assembling spongy 3-D cellular network with 209
irregular cells up to 0.5-1.5 μm in diameter. 210
211
11
212
213 214 215
Fig. 4 TXM stereo-pare micrographs (A) shot with 1 degree difference in angle (Sample 0), 216
reveals spongy irregular network of compact tactoids connecting with each other in chain 217
stairstep aggregates assembling cells up to 1.5 μm in diameter (shown as a white bar in left 218
micrograph). The 3-D computer reconstruction (B) shows large cellular pattern of 219
microstructure with thick elongated walls composed of stairstep-like stacked smectite tactoids. 220
221
Cells look clear inside and whole structure appears to be stabilised by strength of the chain 222
assembly and forces between contacting platelets. Elongated walls of cellular pattern consist 223
with thick (up to 300 nm) aggregates of stairstep-like arranged tactoids can be observed in the 224
3-D computer reconstruction from tomographic investigation conducted using TXM (Fig. 225
4B). 226
227
14 μm
A A
B
Comment [m6]: Is it friction of attraction
12
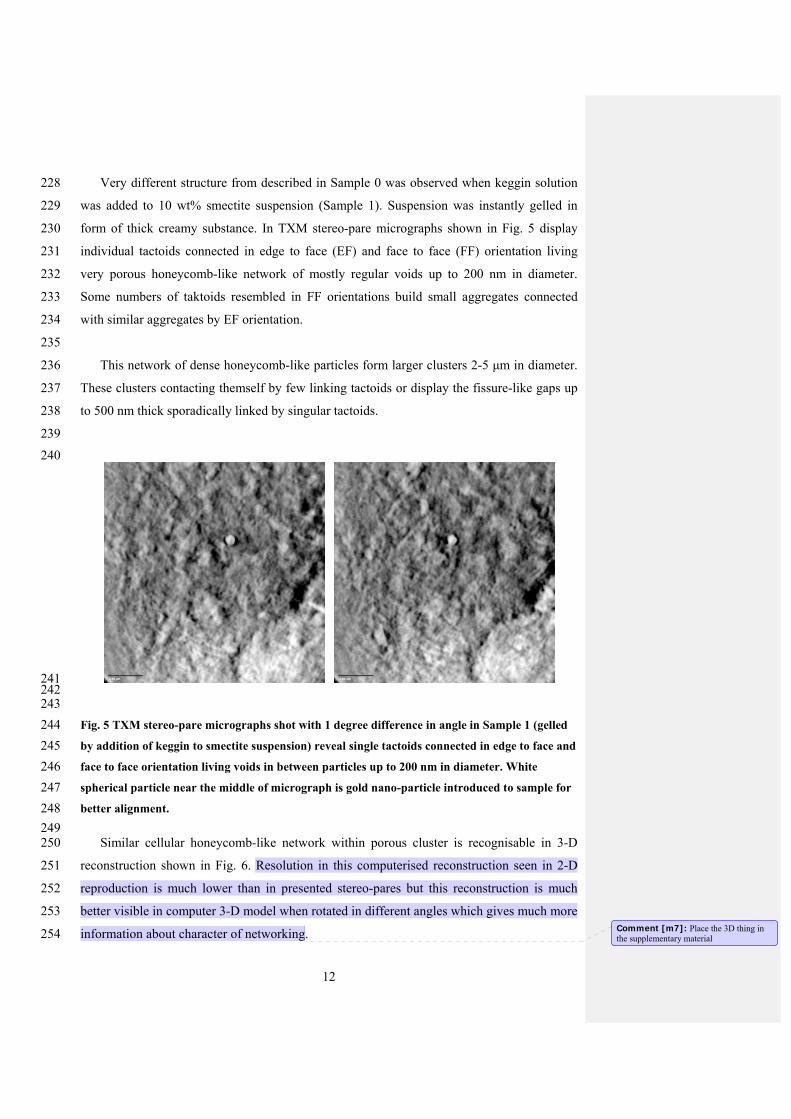
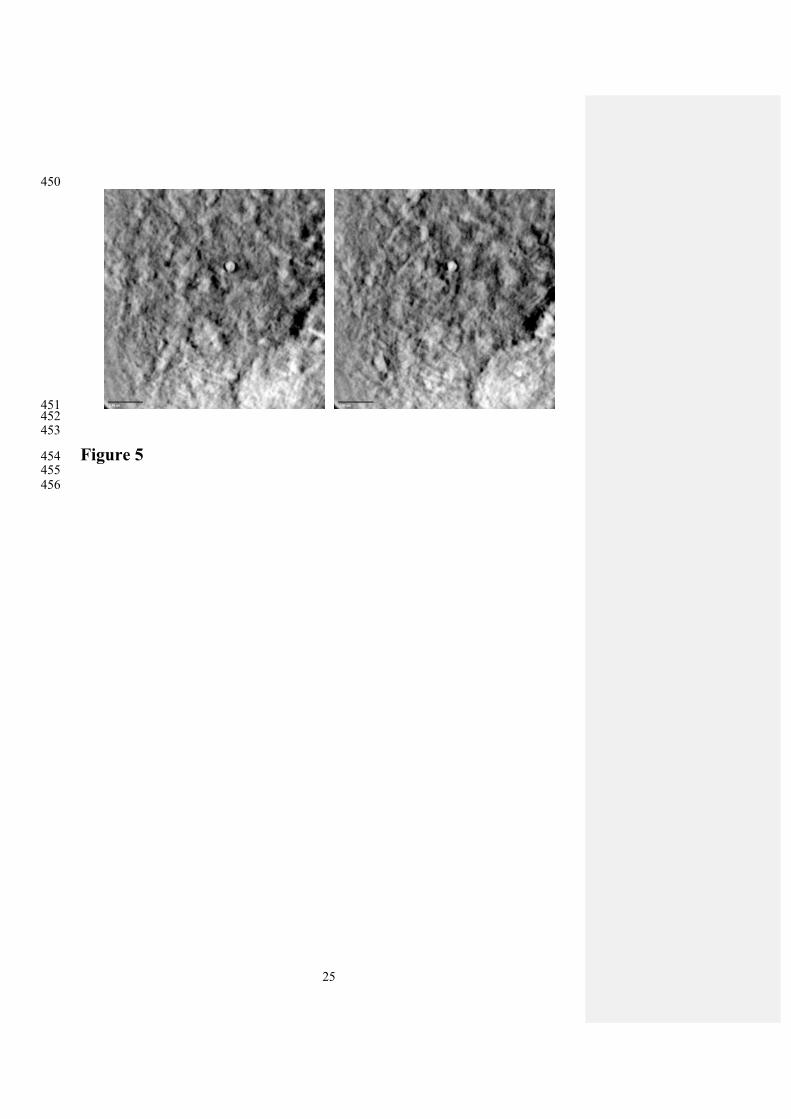
Very different structure from described in Sample 0 was observed when keggin solution 228
was added to 10 wt% smectite suspension (Sample 1). Suspension was instantly gelled in 229
form of thick creamy substance. In TXM stereo-pare micrographs shown in Fig. 5 display 230
individual tactoids connected in edge to face (EF) and face to face (FF) orientation living 231
very porous honeycomb-like network of mostly regular voids up to 200 nm in diameter. 232
Some numbers of taktoids resembled in FF orientations build small aggregates connected 233
with similar aggregates by EF orientation. 234
235
This network of dense honeycomb-like particles form larger clusters 2-5 μm in diameter. 236
These clusters contacting themself by few linking tactoids or display the fissure-like gaps up 237
to 500 nm thick sporadically linked by singular tactoids. 238
239
240
241 242 243
Fig. 5 TXM stereo-pare micrographs shot with 1 degree difference in angle in Sample 1 (gelled 244
by addition of keggin to smectite suspension) reveal single tactoids connected in edge to face and 245
face to face orientation living voids in between particles up to 200 nm in diameter. White 246
spherical particle near the middle of micrograph is gold nano-particle introduced to sample for 247
better alignment. 248
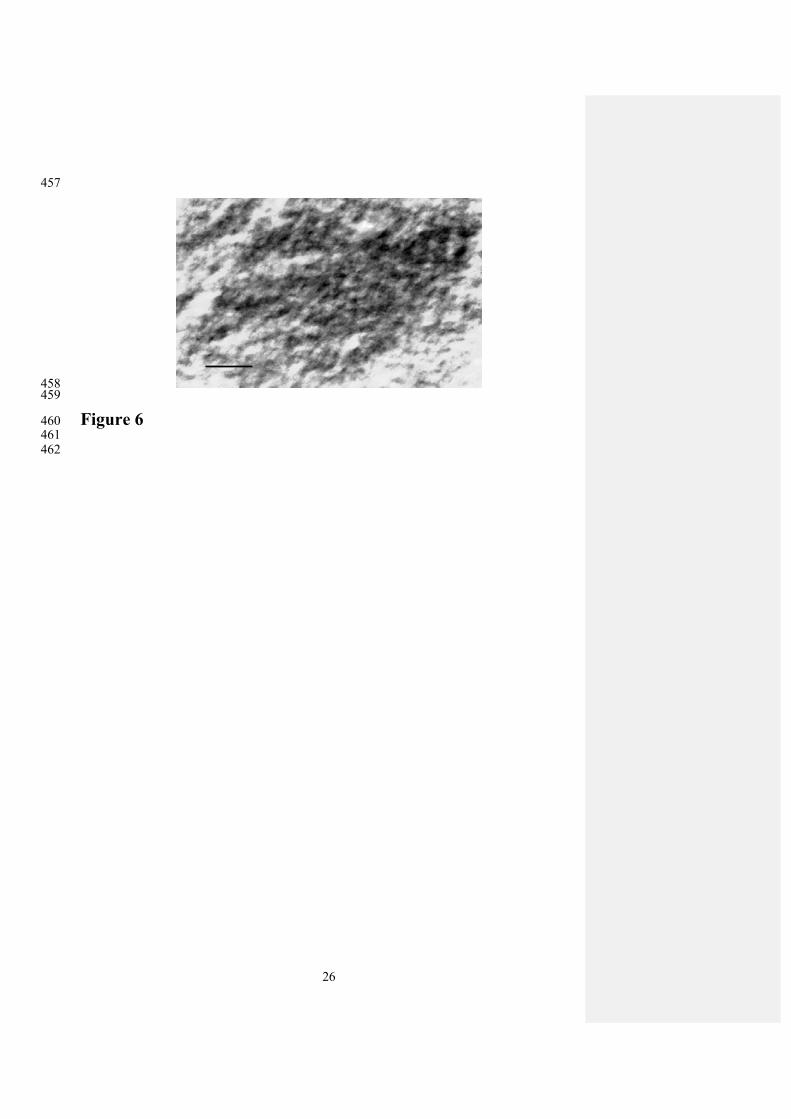
249 Similar cellular honeycomb-like network within porous cluster is recognisable in 3-D 250
reconstruction shown in Fig. 6. Resolution in this computerised reconstruction seen in 2-D 251
reproduction is much lower than in presented stereo-pares but this reconstruction is much 252
better visible in computer 3-D model when rotated in different angles which gives much more 253
information about character of networking. 254 Comment [m7]: Place the 3D thing in the supplementary material

13
255
From TXM 3-D examination we may conclude that inter-tactoid void system is free of 256
particles within method resolution (60 nm). 257
258
259 260
Fig. 6 Computer 3-D reconstruction of TXM tomography in Sample 1, shows cellular 261
honeycomb like networking between smectite tactoids (scale bar 1 μm). 262
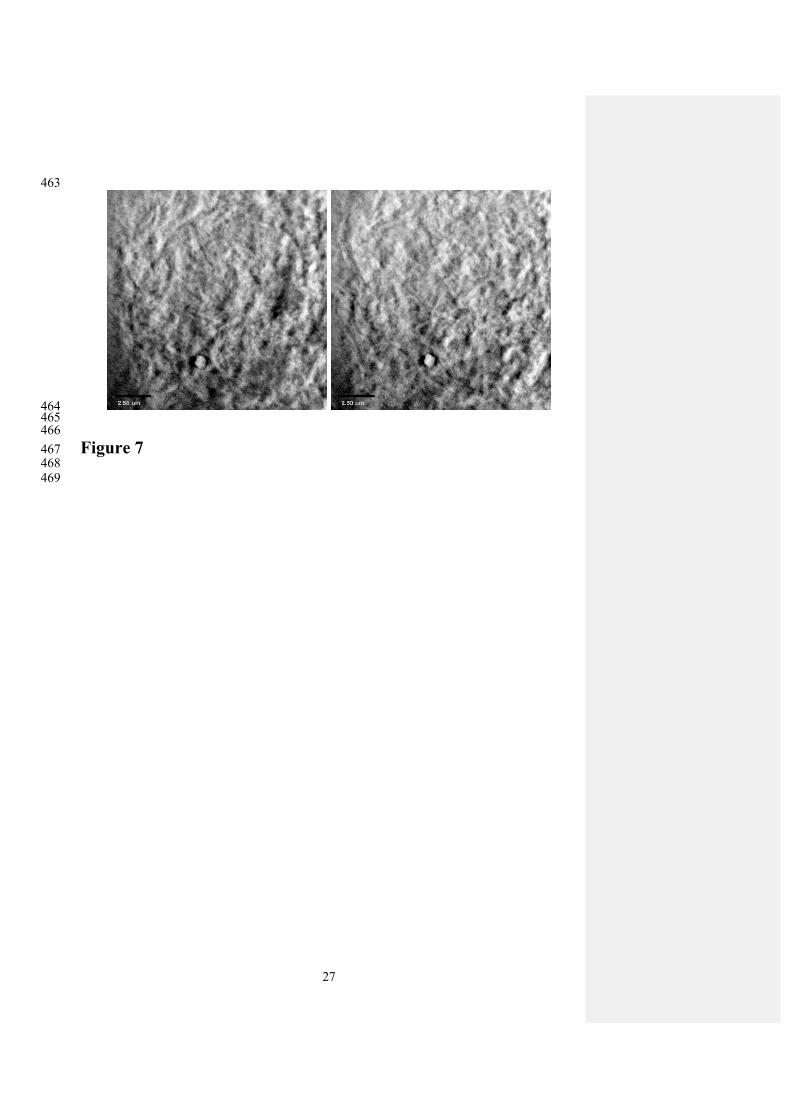
263 TXM investigation conducted on the flocculated Sample 2 revealed another type of 264
micro-structure. Here, tactoids are stacked on top of each other in FF arrangement, form 265 compact aggregates in shape of worms 0.5 to 3 μm long. These worms-like aggregates 266 sometimes are linked and twisted with each other and difficult to follow up for longer 267 distances. The stereo-pares in Fig. 7 this structure is visible, but partly masked by white 268 colloidal material of uncertain origin covering these stacks. Fissure-like gaps between worm-269 like aggregates are only voids visible in this sample. 270
271 272
273 274
14
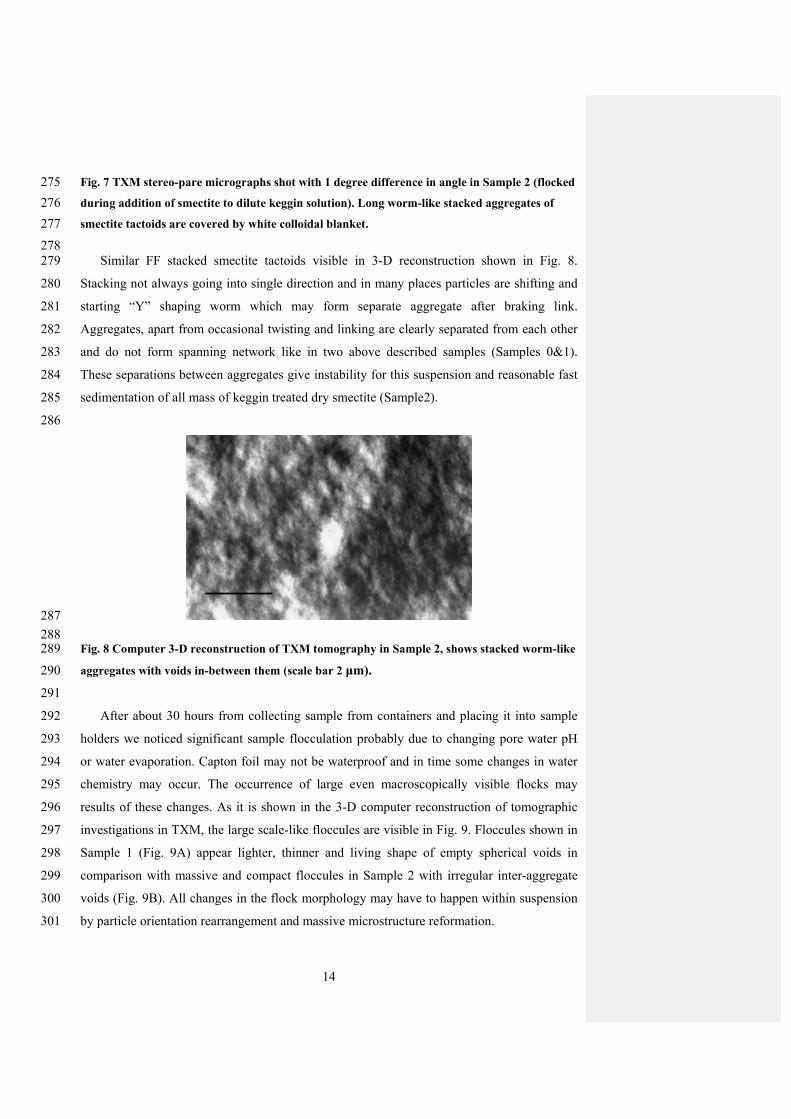
Fig. 7 TXM stereo-pare micrographs shot with 1 degree difference in angle in Sample 2 (flocked 275
during addition of smectite to dilute keggin solution). Long worm-like stacked aggregates of 276
smectite tactoids are covered by white colloidal blanket. 277
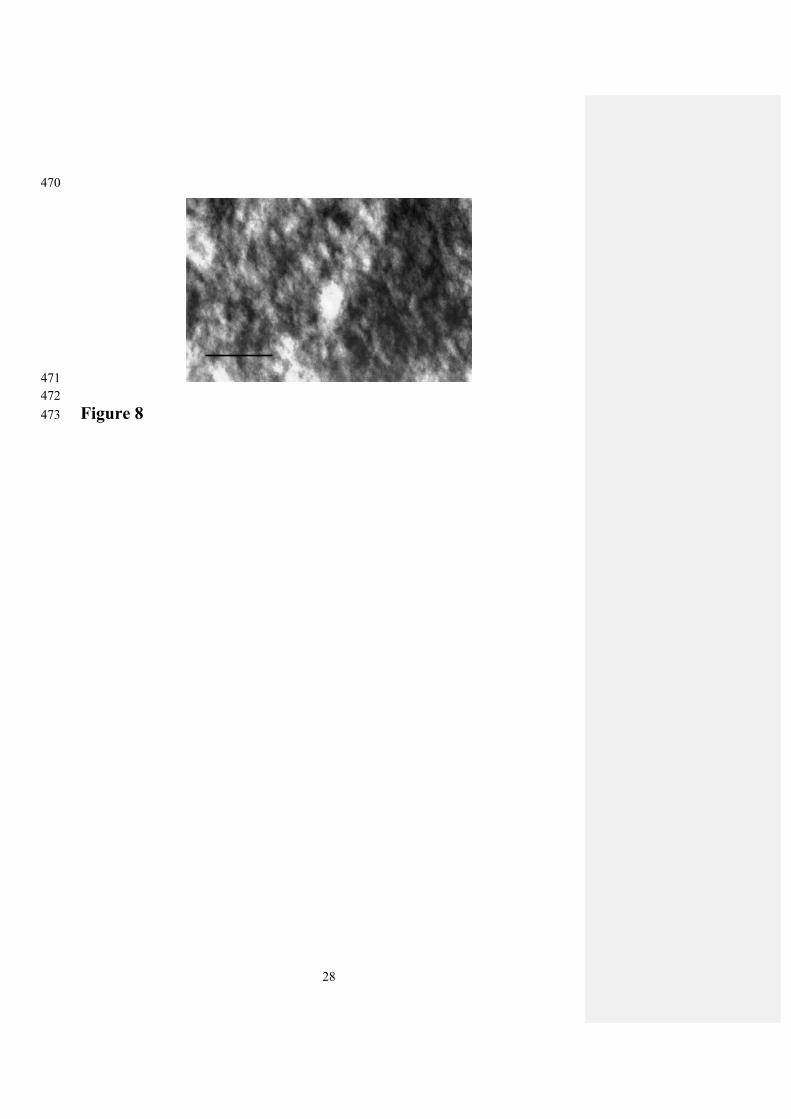
278 Similar FF stacked smectite tactoids visible in 3-D reconstruction shown in Fig. 8. 279
Stacking not always going into single direction and in many places particles are shifting and 280
starting “Y” shaping worm which may form separate aggregate after braking link. 281
Aggregates, apart from occasional twisting and linking are clearly separated from each other 282
and do not form spanning network like in two above described samples (Samples 0&1). 283
These separations between aggregates give instability for this suspension and reasonable fast 284
sedimentation of all mass of keggin treated dry smectite (Sample2). 285
286
287
288 Fig. 8 Computer 3-D reconstruction of TXM tomography in Sample 2, shows stacked worm-like 289
aggregates with voids in-between them (scale bar 2 μm). 290
291
After about 30 hours from collecting sample from containers and placing it into sample 292
holders we noticed significant sample flocculation probably due to changing pore water pH 293
or water evaporation. Capton foil may not be waterproof and in time some changes in water 294
chemistry may occur. The occurrence of large even macroscopically visible flocks may 295
results of these changes. As it is shown in the 3-D computer reconstruction of tomographic 296
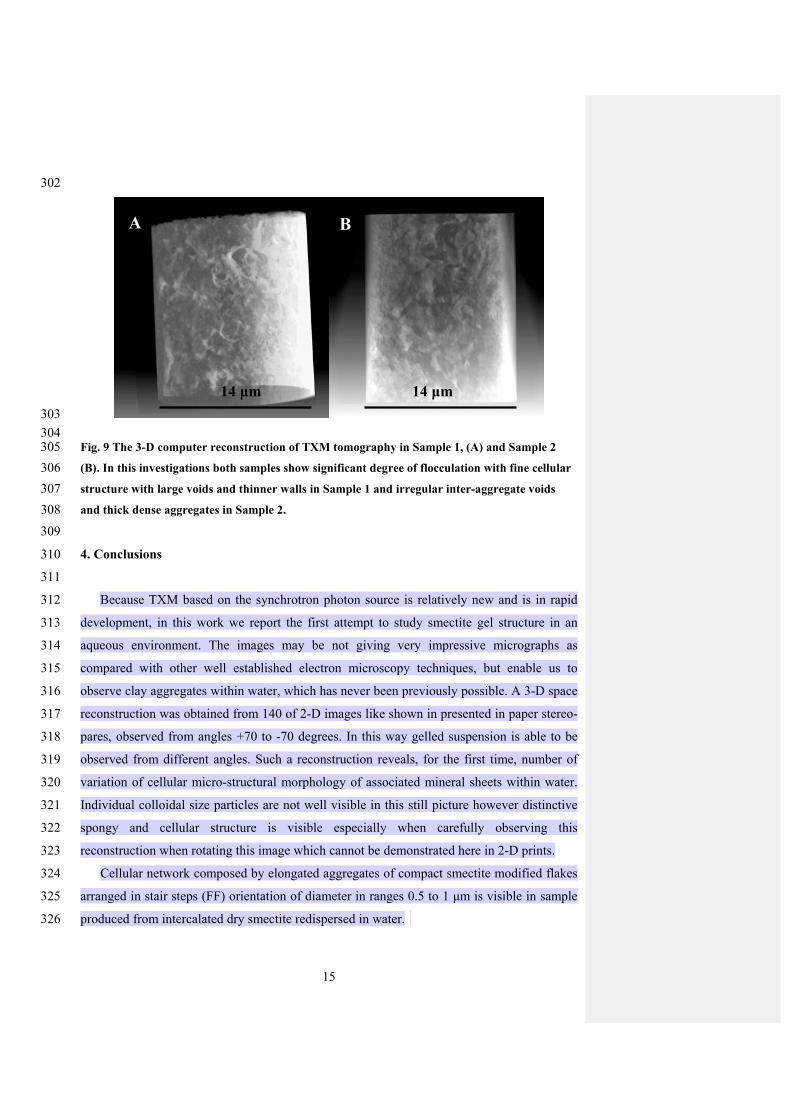
investigations in TXM, the large scale-like floccules are visible in Fig. 9. Floccules shown in 297
Sample 1 (Fig. 9A) appear lighter, thinner and living shape of empty spherical voids in 298
comparison with massive and compact floccules in Sample 2 with irregular inter-aggregate 299
voids (Fig. 9B). All changes in the flock morphology may have to happen within suspension 300
by particle orientation rearrangement and massive microstructure reformation. 301
15
302
303
304 Fig. 9 The 3-D computer reconstruction of TXM tomography in Sample 1, (A) and Sample 2 305
(B). In this investigations both samples show significant degree of flocculation with fine cellular 306
structure with large voids and thinner walls in Sample 1 and irregular inter-aggregate voids 307
and thick dense aggregates in Sample 2. 308
309
4. Conclusions 310
311
Because TXM based on the synchrotron photon source is relatively new and is in rapid 312
development, in this work we report the first attempt to study smectite gel structure in an 313
aqueous environment. The images may be not giving very impressive micrographs as 314
compared with other well established electron microscopy techniques, but enable us to 315
observe clay aggregates within water, which has never been previously possible. A 3-D space 316
reconstruction was obtained from 140 of 2-D images like shown in presented in paper stereo-317
pares, observed from angles +70 to -70 degrees. In this way gelled suspension is able to be 318
observed from different angles. Such a reconstruction reveals, for the first time, number of 319
variation of cellular micro-structural morphology of associated mineral sheets within water. 320
Individual colloidal size particles are not well visible in this still picture however distinctive 321
spongy and cellular structure is visible especially when carefully observing this 322
reconstruction when rotating this image which cannot be demonstrated here in 2-D prints. 323
Cellular network composed by elongated aggregates of compact smectite modified flakes 324
arranged in stair steps (FF) orientation of diameter in ranges 0.5 to 1 μm is visible in sample 325
produced from intercalated dry smectite redispersed in water. 326
14 μm 14 μm
A B
16
Much smaller voids of diameter ~200 nm were observed between mostly randomly 327
oriented intercalated smectite flakes when gelled in effect of keggin addition to smectite 328
suspension. These flakes randomly positioned in space are in EE and mostly EF orientation 329
and build spanning network. 330
The keggin modified smectite by addition of dried smectite to dilute keggin solution 331
display even another microstructural type where dense smectite flakes stacked in FF 332
orientation build worm-like long aggregates. These aggregates are not bridged to other 333
similar aggregates, fast settling and display narrow inter-aggregate voids in resulting 334
sediment. 335
Described different microstructural types are probably reflects difference in the Gibbs 336
energy position and DLVO theory. In case of smectite Sample 2 particles fall into the primary 337
minimum where Van der Waals forces act between FF oriented smectite flakes and 338
aggregates become approach irreversible flocculation. In case of Sample 1 particles 339
contacting by edges (EE) and edge to face (EF) orientation fell into secondary minimum and 340
weak flocculation resulted in severe gelation. 341
Acknowledgements This work was supported by the Australian Synchrotron Research Program 342
(ASRP). 343
Acknowledgements The financial and infra-structure support of the Queensland University of 344
Technology Inorganic Materials Research Program of the School of Physical and Chemical Sciences 345
is gratefully acknowledged. The Australian Research Council (ARC) is thanked for funding. 346
347 348
Comment [m9]: Can we measure the zeta potential and do the force measurements to confirm this?
17
References: 349 350 [1] Terzaghi, K. Erdbaummechanik auf Bodenphysikalischer Grundlage. Franz Deuticke Press, 351
Leipzig und Vienna 1925. 352
[2] Van Olphen, H. An Introduction to Clay Colloid Chemistry. Intersci. Publishers, N.Y. 1963 353
[3] Rosenquist, J.T. J. Soil Mech. And Found. Division, Proc. ASCE Sm 2, 85 (1959) 31-53 354
[4] Bowles, F.A. Science, 159 (1968) 1236-1237. 355
[5] Pusch, R. Clay Microstructure. National Swedish Building Research, Document D8, 1970 356
[6] O’Brien, N.R. Clays and Clay Minerals, 19 (1971) 353-359. 357
[7] Grabowska-Olszewska, B.; Osipov, V.; Sokolov, Vi. Atlas of the Microstructure of Clay Soils. 358
PWN, Warszawa, 1984. 359
[8] Zbik, M. S., Frost, R. L., Song, Y-F. Journal of Colloid and Interface Science 319 (2008) 169-360
174. 361
[9] Zbik, M. S., Frost, R. L., Song, Y-F., Chen, Yi-M., Chen, J-H. Journal of Colloid and Interface 362
Science 319 (2008) 457-461. 363
[10] M.S. Zbik, R.St.C. Smart, G.E. Morris, Journal of Colloid and Interface Science, 328 (2008) 73-364
80 365
[11] Attwood, D. Nature, 442 (2006) 642-643. 366
[12] Yin, G. C.; Tang, M. T.; Song, Y. F.; Chen, F. R.; Liang, K. S.; Duewer, F. W.; Yun, W.; Ko, 367
D.H.; Shieh, H-P.D. Appl. Phys. Lett, 88 (2006) 241115-1241115-3. 368
[13] Van Olphen, H.; Fripiat J. J. Data handbook for clay materials and other non-metallic minerals. 369
Oxford; New York. Pergamon Press. 1979, 183. 370
[14] Greenwood, Norman N.; Earnshaw, A. Chemistry of the Elements, 2nd Edition, Oxford: 371
Butterworth-Heinemann. 1997. 372
[15] Bradley, S. M. Kydd, R. A. and Yamdagni. R. J. Chem. Soc., Dalton Trans., 1990, 413 – 417. 373
[16] Doung et al, Microporous and mesoporous materials, 82 (2005) 165. 374
[17] Morris G.E., Zbik, M.S. International Journal of Mineral Processing, 93 (2009) 20-25. 375

18
[18] Zbik, M.S. Martens, W., Frost, R. L., Song, Y-F., Chen, Yi-M., Chen, J-H. Langmuir, 24 (2008) 376
8954-8958. 377
378
19
List of Figures 379 380 Fig. 1- XRD of the colloidal fraction of (A)- natural Na SW-2 show significant 001 peak in 381
xxnm, (B)- after intercalation by Al13 and Ga 13 the mine 001 peak shifted towards 382 larger separation distances. 383
384 Fig. 2 TEM micrographs of (A)- Na+ and (B)- Ca2+ smectite flakes shown significant 385
roughness at the platelet surface 200 nm extended in the Na+ and ~50 nm in Ca2+ 386 exchangeable forms. 387
388 Fig. 3 TEM micrographs showing keggin treated smectite display compacted taktoid sheet with 389
highly depressed surface loose material layer to maximum 10 nm. 390 391 Fig. 4 TXM stereo-pare micrographs (A) shot with 1 degree difference in angle (Sample 0), 392
reveals spongy irregular network of compact tactoids connecting with each other in 393 chain stairstep aggregates assembling cells up to 1.5 μm in diameter (shown as a white 394 bar in left micrograph). The 3-D computer reconstruction (B) shows large cellular 395 pattern of microstructure with thick elongated walls composed of stairstep-like stacked 396 smectite tactoids. 397
398 Fig. 5 TXM stereo-pare micrographs shot with 1 degree difference in angle in Sample 1 (gelled 399
by addition of keggin to smectite suspension) reveal single tactoids connected in edge to 400 face and face to face orientation living voids in between particles up to 200 nm in 401 diameter. White spherical particle near the middle of micrograph is gold nano-particle 402 introduced to sample for better alignment. 403
404 Fig. 6 Computer 3-D reconstruction of TXM tomography in Sample 1, shows cellular 405
honeycomb like networking between smectite tactoids (scale bar 1 μm). 406 407 Fig. 7 TXM stereo-pare micrographs shot with 1 degree difference in angle in Sample 2 (flocked 408
during addition of smectite to dilute keggin solution). Long worm-like stacked 409 aggregates of smectite tactoids are covered by white colloidal blanket. 410
411 Fig. 8 Computer 3-D reconstruction of TXM tomography in Sample 2, shows stacked worm-like 412
aggregates with voids in-between them (scale bar 2 μm). 413 414 Fig. 9 The 3-D computer reconstruction of TXM tomography in Sample 1, (A) and Sample 2 415
(B). In this investigations both samples show significant degree of flocculation with fine 416 cellular structure with large voids and thinner walls in Sample 1 and irregular inter-417 aggregate voids and thick dense aggregates in Sample 2. 418
419
420
Comment [m10]: Figure needs redoing please send the original files
20
0
5000
10000
15000
20000
25000
30000
3 8 13 18 23 28
2 Theta
Inte
ns
ity
SW-2 Na
421 422
Figure 1a 423 424
425
21
0
500
1000
1500
2000
2500
3000
3500
4000
3 8 13 18 23 28
2 Theta
Inte
ns
ity
Keggin Ga13
Keggin Al13
426 427
Figure 1b 428 429
22
430 431
432
433
434
Figure 2 435 436
23
437
438
439
Figure 3 440 441
442
24
443
444 445 446
Figure 4 447 448
449
14 μm
A A
B
25
450
451 452 453
Figure 5 454 455
456
26
457
458 459
Figure 6 460 461
462
27
463
464 465 466
Figure 7 467 468
469
28
470
471 472
Figure 8473

29
474
![CRISM Data Users' Workshop Nili Fossae Data Processing ......Smectite PHY07_02 [Link to Spectral Library] Smectite PHY07 [Link to Spectral Library] 03/22/2009 CRISM Workshop - Data](https://img.pdfslide.us/doc/110x75/60b27f7c389ce535bc442a75/crism-data-users-workshop-nili-fossae-data-processing-smectite-phy0702.jpg)