Embed Size (px)
Citation preview

QUT Digital Repository: http://eprints.qut.edu.au/
Pike, Steven D. (2010) Destination branding case study : tracking brand equity for an emerging destination between 2003 and 2007. Journal of Hospitality and Tourism Research, 34(1). pp. 124-139.
© Copyright 2009 SAGE Publications (India)
Destination branding – tracking brand equity for an emerging destination between 2003 and 2007
Journal of Hospitality & Tourism Research. Steven Pike School of Advertising, Marketing & Public Relations Queensland University of Technology 2 George St, Brisbane, Queensland 4001 Australia Tel: 61-7-31382702 E: [email protected]
Destination branding – tracking brand equity for an emerging destination between 2003 and 2007
ABSTRACT
Place branding has become a major focus of operations for destination marketing
organisations (DMO) striving for differentiation in cluttered markets. The topic of
destination branding has only received attention in the tourism literature since the late
1990s, and there has been relatively little research reported in relation to analyzing
destination brand effectiveness over time. This paper reports an attempt to
operationalise the concept of consumer-based brand equity (CBBE) for an emerging
destination over two points in time. The purpose of the project was to track the
effectiveness of the brand in 2007 against benchmarks that were established in a 2003
study at the commencement of a new destination brand campaign. Due to the common
challenges faced by DMOs world wide, it is suggested CBBE provides destination
marketers with a practical tool for evaluating brand performance over time.
Key words: destination branding, consumer-based brand equity, destination image
INTRODUCTION
The topic of branding first appeared in the marketing literature over 50 years ago (see
Banks 1950, Gardner & Levy 1955). However, published research relating to
destination branding did not emerge until the late 1990s. Ritchie and Ritchie (1998)
bemoaned this dearth of research in their conceptual paper around the same time as
the first destination branding journal article by Pritchard and Morgan (1998). In the
decade since these first papers appeared, the field has attracted increasing interest.
The first book on the topic appeared in 2002 (see Morgan, Pritchard & Pride, 2002),
case studies of destination brand development have appeared (see for example
Crockett & Wood 1999, Curtis 2001, Hall 1999, Morgan, Pritchard & Pride 2002,
Pride 2002, Slater 2002), and the first academic conference dedicated to the topic,
held at Macau’s Instituto De Formacao Turistica (IFT), took place in 2005 (see Dioko
& So, 2005).

Despite recent attention, there is at least one area in which the destination branding
literature remains significantly under reported. While the published case studies now
provide a destination brand development resource for DMOs and academics, there has
been little reported on the performance of destination brands over time. However, it
should be noted that the topic of brand metrics is also rare in the services marketing
literature (Kim, Kim & An, 2003). Given the resources now being invested in
destination brand initiatives globally there is a need for more research related to
destination brand performance.
Brand equity is the most common term used to represent brand performance, and is
measured in terms of a financial value on the corporate balance sheet. However, such
intangible asset values are of little practical value to DMOs, albeit with the exception
of potential licensing revenue. One alternative worthy of investigation by DMOs in
brand effectiveness measurement is consumer-based brand equity (CBBE) promoted
by Aaker (1991, 1996) and Keller (1993, 2003). CBBE measurement is based on the
premise of developing an understanding of how marketing initiatives are impacting on
consumer learning and recall of brand information.
During 2003, research was undertaken to measure CBBE for an emerging Queensland
destination at the time of a new brand launch. Aspects of this research have been
reported previously (reference with held). The aim of the 2003 study was to provide
benchmarks, against which the effectiveness of the brand could be monitored over
time. The purpose of this paper is to report the results of a repeat study undertaken in
2007, to enable a comparison of CBBE at two points in time over four years of the
brand’s life.
In Queensland, 13 tourism regions are officially recognised and supported by the state
tourism organization (STO), Tourism Queensland (see
http://www.queenslandholidays.com.au/destinations/index.cfm). The STO provides
substantial financial and human resources to the RTOs, much of which has been
invested in the development of destination brands. In the past few years most RTOs
have developed new brand positioning themes for use in Brisbane, the state capital.
Brisbane is the most important market in terms of visitor arrivals for most destinations

in Queensland and northern New South Wales. The destination of interest in this
study is the Coral Coast, which has been categorized by Tourism Queensland as an
‘emerging destination’. The foundation of a brand is its name (Keller, 2003), and the
destination brand name introduced in 2003 by Bundaberg Region Ltd, the RTO, is
‘Bundaberg, Coral Isles and Country’, which recognizes the geographic diversity of a
region covering 26,000 square kilometres and 11 shire councils. The name has since
been changed to Bundaberg and the Coral Coast. Located 350 kilometres north of
Brisbane, the region encompasses a large rural hinterland, for which Bundaberg
(population 45,000) is the largest city, and a lengthy coastline that boasts the southern
starting point of the Great Barrier Reef.
The travel situation of interest in the study is short break holidays by car. Following
White (2000) a short break is defined as a non-business trip of between one and four
nights away from home. While short breaks have emerged as one of the fastest
growing travel segments in many parts of the world (see for example Vanhove 2005),
there has been little research reported in Australia. This is despite Mackay’s (1988)
analysis of Australians’ attitudes towards travel, which identified ‘mini breaks’ as one
of seven major opportunities for tourism marketers. Domestic short break drive
tourism is an important aspect of Australian travel patterns. BTR (2002) estimated
76% of domestic travel is undertaken by car, 70% of which is travel within the state of
residence. The mean length of stay for these trips was estimated at three nights. BTR
estimated short breaks of 1-3 nights represented 68% of the Queensland drive market,
while short tours of 4-7 nights represented a further 19%. Australian domestic travel
growth has stagnated in recent years, which has been attributed to a trend towards
longer working hours and increasing competition for leisure time (Tourism
Forecasting Council, 2000, 2001). TFC forecast total domestic visitor nights to
increase by 0.3% annually until 2012. However, the past and forecast growth rate of
short breaks is less clear within published aggregated data associated with domestic
tourism in Queensland.
During 2002, Tourism Queensland undertook a series of focus groups with Brisbane
consumers to investigate perceptions of Bundaberg and the Coral Coast. The study
found that while Bundaberg had strong name recognition in the Brisbane market as
the home of Bundaberg Rum and Bundaberg Ginger Ale, the region lacked a clear
identity as a tourism destination. The results highlighted three possible barriers to
increased visitation from Brisbane residents were i) the perception there was ‘nothing
to do’, ii) the driving distance, and iii) a lack of nightlife, restaurants, cafes and
shopping (Tourism Queensland, 2003). To address these issues, a new destination
brand, at a cost of $20,000 was developed by the RTO and STO over 12 months (Still,
2002). The new brand was launched by the RTO in early 2003 with the objectives
being: i) to raise awareness of the destination, ii) to stimulate increased interest in, and
visitation to the region, and iii) educate the market about things to do. The new brand
positioning theme was ‘Take time to Discover Bundaberg, Coral Isles and Country’.
At the time of the brand launch in 2003, research was undertaken to provide
structured data that the RTO could use to monitor the effectiveness of the brand
campaign over time, relative to the objectives. It was felt CBBE could be adapted to
suit this aim. In terms of benchmarking the destination’s position as a short break
destination in the Brisbane market, the study concluded the Coral Coast had a low
level of brand equity in it’s most important geographic market. The 2003 results can
be used to track the performance of the brand, in relation to the original objectives,
over time. To this end, the purpose of this paper is to report a 2007 study to use the
CBBE model to analyse the extent to which the objectives had been achieved in the
four years since the brand launch.
LITERATURE REVIEW
Most definitions of a brand have been based on that proposed by Aaker (1991, p.7):
… a distinguishing name and/or symbol (such as a logo, trademark, or
package design) intended to identify the goods or services of either
one seller or a group of sellers, and to differentiate those goods from
those of competitors.
A brand is however, more than the presentation of such symbols in consumer
promotions. Aaker proposed a brand be viewed from both the supply and demand
perspectives. One way to do this is through understanding of the distinction between
the concepts of brand identity and brand image. The former is the self-image desired

by the marketers, while that latter is the actual image held by consumers. As shown in
Figure 1, brand positioning elements such as the name, symbol and slogan, are used
by the marketer to cut through the noise of competing and substitute products to
stimulate an induced destination image that matches the brand identity (see Pike,
2004, p. 112). Brand performance measurement with the analysis of the level of
congruence of brand image and brand identity. This in effect provides a measure of
brand equity.
(FIGURE 1 HERE)
Aaker (1991) defined brand equity as assets and liabilities that add or detract value to
a firm and/or its companies. High levels of brand equity can result in increased sales,
price premiums, customer loyalty, (Aaker, 1991), lower costs (Keller, 1993), and
purchase intent (Cobb-Walgren, Beal & Donthu, 1995). Commonly, measurement of
brand equity is by way of an intangible balance sheet asset net-present-value, with key
dependent variables including future financial performance (see Kim, Kim & An,
2003) and market share (see Mackay, 2001).
Underpinning CBBE is the proposition that indicators of market attitudes and
behaviour toward a brand underpin any financial valuation of brand equity. In this
way CBBE can be viewed as both a measurement of the effectiveness of past
marketing communication, and a predictor of future performance. The CBBE
hierarchy appears relevant to DMO stakeholders, for which the financial measure of a
destination brand would be of little practical value to DMOs. Following the work of
Aaker (1991, 1996) and Keller (1993, 2003), as well as Lavidge and Steiner’s (1961)
hierarchy of effects, CBBE for a destination is conceptualised as a hierarchy of brand
salience, brand associations, brand resonance and brand loyalty. Figure 2 illustrates
these concepts in relation to the RTO’s three 2003 brand objectives.
(FIGURE 2 HERE)
Brand salience is the foundation of the hierarchy, and represents the strength of the
destination’s presence in the mind of the target for a given travel situation. Salience is
best operationalised though unaided top of mind awareness (ToMA), rather than

through recall by prompting. Many studies have indicated the number of destinations
a traveller will actually consider in the purchase process is limited to four plus or
minus two (see for example Crompton 1992, Thompson & Cooper 1979). These
destinations form the decision set, which provides a measure of brand salience relative
to competitors. Brand associations are anything linked in memory to the destination.
Destination attractiveness is a function of the benefits desired by a traveller and the
ability of the destination to provide them (reference with held), and so associations
need to be measured in terms of attributes deemed determinant for a given travel
situation. Reviews of the extensive destination image literature (see Chon 1990,
Echtner & Ritchie 1991, Pike 2002, 2007, Gallarza, Saura, & Garcia 2002, Tasci,
Gartner, & Cavusgil 2007) indicate the most popular measurement approach is
structured surveys using scales of cognitive attributes and affective benefits. Brand
resonance represents willingness to engage with the destination. This can be
measured behaviourally, such as in actual visitation, and also attitudinally through
stated intent to visit. The highest level of the hierarchy is brand loyalty, which has
received little attention in the destination marketing literature. Loyalty can be
measured by repeat visitation and word of mouth recommendations. In this way the
CBBE hierarchy incorporates perceptual and behavioural measures. There has been
criticism in the marketing literature of what has been failure in market research to link
attitudinal data with measures of actual behaviour (see Schultz & Schultz, 2004).
Certainly, there has been a lack of longitudinal tourism studies investigating the
relationship between attitude and behaviour (reference withheld), such as stated
preferences and actual travel.
METHOD
The 2003 longitudinal study took place during the Autumn months of April to June
2003 (reference withheld). Autumn in subtropical Brisbane provides ample
opportunities for domestic short breaks by car including school, university and public
holidays. April is the second most popular holiday month in Australia (BTR, 2002).
For consistency, the 2007 study also took place during April, when questionnaires
were mailed to a systematic random sample of 3000 households selected from the
2007 White Pages telephone directory. An incentive prize of a short break holiday at a
mystery destination was offered. The questionnaire consisted of 173 items in three
sections. The first section included filter questions about attitudes towards short
breaks, two unaided questions to elicit the top of mind awareness (ToMA) destination
and decision set composition, and a battery of 22 destination attribute-importance
items using a seven point scale (1 = not important, 7 = very important). A ‘don’t
know’ option was also provided for each scale item. These attributes were selected
from the results of the 2003 study, supplemented by attributes from further
exploratory research using group applications of Repertory Grid with Brisbane
residents (reference withheld).
The second section asked participants to rate the perceived performance of the Coral
Coast, along with four competing destinations selected from the decision set findings
of the 2003 study, across the 22 cognitive scale items, and two affective scale items.
Questions were also used to identify measures of previous visitation, intent to visit
and word of mouth recommendations for each of the five destinations. The third
section contained questions related to demographics. The back page of the
questionnaire was left blank, apart from an open-ended question inviting participants
to indicate thoughts on how Queensland destinations could improve to suit their
needs.
RESULTS
A total of 447 completed questionnaires were received, which represented a useable
response rate of 17%. A further 7 incomplete questionnaires were received, along
with 337 returned due to incorrect mailing addresses, and 6 politely declining
participation. The response was similar to the 19% obtained in 2003. As shown in
Table 1, the characteristics of the 2007 participants were very similar to those who
participated in 2003. These characteristics were generally similar to the 2001 Census
population, albeit again with a higher level of females and a lower level of those aged
18-24 years.
(TABLE 1 HERE)
Participants indicated a strong familiarity with short break holidays, suggesting a
mean of three such trips by car per year, which was consistent with the 2003 sample.
The mean importance of taking at least one short break by car each year (1 = not
important, 7 = very important) was 6.3, while the mean likelihood of taking a short
break by car in the next 12 months (1 = definitely not, 7 = definitely) was 5.1. Eighty
six per cent had taken a short break during the previous 12 months.
The unaided awareness question elicited over 100 ToMA destinations from
participants. For reporting succinctness the list has been categorized in Table 2 by
RTO geographic boundary. These results were also consistent with the 2003 study for
each destination. The most popular destination region again the Sunshine Coast,
which was listed by almost half of the sample (46%). Less than 2% of participants
listed Coral Coast destinations as their ToMA destination.
(TABLE 2 HERE)
The mean number of destinations listed in decision sets was 3.1, in comparison to 3.8
in 2003. Over 90% of participants indicated a range of between two and four
destinations. Including the ToMA destinations, over 120 places were elicited unaided
from participants. This clearly indicates the range of available destinations, and
therefore competition, is extensive. Practically, the decision set size and composition
has serious implications for those destinations not listed, such as the Coral Coast,
given half of the sample indicated a likelihood of taking a short break within the next
three months. These destinations are less likely to be considered in the selection
process. Coral Coast destinations were listed 25 times in decision sets, in comparison
to 58 in 2003. The ToMA and decision set findings highlight a lack of improvement
in brand salience between 2003 and 2007. This is important given brand salience is
the foundation of the CBBE model.
While the Coral Coast did not rate well in terms of unaided awareness, more
favourable results emerged when participants were prompted to recall the destination.
Table 3 shows the perceived performance of the Coral Coast across the cognitive
attributes was generally favourable. With the exception of two attributes, ‘within a
comfortable drive’ and ‘trendy atmosphere’, the means were above the scale mid
point. While the latter was not deemed important, the former may play a major role in
decision making given the mean maximum comfortable drive time to a short break

destination indicated by the 2003 and 2007 participants was four hours. ‘Within a
comfortable drive’ also represents one of the three key problem areas the new brand
had sought to overcome. From a positioning perspective, of the competitive set of
destinations, the Coral Coast rated highest on four attributes. It is suggested that two
of these, ‘friendly locals’ and ‘uncrowded’, represent an as yet untapped market
position that the RTO could better exploit to improve other measures of CBBE. For
example, during 2004 one of the destination’s attractions, Bargara Beach, was
awarded Tourism Queensland’s ‘Friendliest Beach’ (see Tourism Queensland, 2005,
p. 10).
For the two affect items the Coral Coast was rated the most ‘sleepy’ of the five
destinations, as it was in 2003, which could be keeping with the leadership position
held on the cognitive attributes. While the destination was rated favourably on the
‘pleasant’ dimension, the mean of 4.7 was the lowest of the competitive set of
destinations, and lower than in 2003.
(TABLE 3 HERE)
Another important issue in destination image questionnaire design is avoiding
uninformed responses (reference with held). Therefore a ‘don’t know’ option was
provided alongside each of the cognitive attribute scale items. For the attribute
importance items, the maximum rate of ‘don’t know’ usage was 1.3%, which
indicated participants were familiar with the attributes. However, every Coral Coast
performance item attracted a ‘don’t know’ non-response rate of over 30%. This
provides additional information for the marketer, which might be lost if a ‘don’t
know’ option is not provided. Almost one third of participants were unable to express
an opinion about the extent to which the Coral Coast provides each attribute. Not
using such a non-response option runs the risk of attracting uninformed responses,
such as using the scale midpoint to denote neutrality. For the Coral Coast RTO, the
implication is that more work is needed to improve awareness of what the destination
has to offer, which was one of the 2003 brand objectives.
Over 90% of participants had previously visited their ToMA destination. However,
while 43% of participants indicated having previously visited the Coral Coast, the
mean likelihood of visiting the Coral Coast within the next year was 2.7. This was the
lowest of the competitive set of destinations, as it was in 2003. These findings suggest
a low level of brand resonance in terms of an indicator of future performance. For the
measure of brand loyalty participants were asked to rate the extent to which they
would recommend each destination to friends. On this seven point scale (1 =
definitely not, 7 = definitely) the mean for the Coral Coast was 3.9. This result, which
was not measured in 2003, was the lowest of the five destinations.
Key results from the 2003 study were presented to four tourism-related organisations
in the Coral Coast region, including the RTO. As a result of the research Bundaberg
Region Ltd changed part of the focus of its domestic marketing plan in 2004 to
position the destination in the Brisbane market as “an attractive, accessible and
affordable short-break destination” (www.tq.com.au). In comparing results between
2003 and 2007, it is suggested this approach has not yet resulted in improved CBBE
for the destination, which following Hunt and Gartner (1987), highlights the long term
nature of re-branding, re-positioning or changing destination image.
CONCLUSIONS
DMOs are increasingly engaging in place branding in the attempt to differentiate from
competing destinations. A destination brand comprises the supply-side desired
identity and the demand-side image of the destination held by the consumer.
Therefore a model of brand equity is required for DMOs as a means of measuring the
effectiveness of the investment in branding, in terms of congruence between brand
identity and brand image. Most of the destination branding papers published since the
literature started in 1998 have a strong practical focus on reporting the brand
development process. Other than Curtis’ (2001) report on the development of
Oregon’s brand during the 1980s and 1990s, there has been little analysis of the
effectiveness of destination brands over time. To date there has been little published
about what performance indicators may be used to measure the performance of a
brand campaign.
Destination marketing takes place within a politically charged environment, with
DMO staff accountable to government funding agencies, local tourism businesses,
travel intermediaries and host community. Pressure to justify brand rationale and to
change brand initiatives can be exerted by such stakeholders. It is suggested CBBE
provides destination marketers with a useful communication tool to guide
stakeholders on macro objectives, in addition to offering a practical and structured
approach towards measuring performance of branding initiatives.
One limitation of the study is that it is not possible to test relationships between the
proposed CBBE measures and a dependent variable such as financial performance or
market share, due to a lack of such data. Nevertheless, for the destination of interest,
the structure of the results provide measures of brand salience, brand associations,
brand resonance and brand loyalty in the most important market, in the context of
short breaks by car, after four years of a new brand campaign. For the Coral Coast, the
2003 results indicated the destination held weak CBBE in its most important market at
the time of the launch of a new brand campaign. The CBBE structure provides
indicators, related to the brand campaign objectives, for which the effectiveness of
future promotional activity can be evaluated. For example, the first objective of the
new destination brand campaign was to increase awareness of the region. Brand
salience is the foundation of the hierarchy, and in terms of unaided awareness, the
destination achieved no improvement between 2003 and 2007. The second objective
was to stimulate interest in and travel to the destination. Brand resonance was
operationalised by stated intent to visit for the next 12 months. In both the 2003 and
2007 studies half of the sample had previously visited the destination, and yet the
stated intent to visit in the future was the lowest of the competitive set of destinations.
The third objective was to educate consumers about what there is to see and do. Brand
associations were measured by asking participants to rate the performance of a
competitive set of destinations across a list of determinant attributes. The attribute-
based approach of the CBBE model enables destination marketers to identify
positioning opportunities for competitive advantage. The results highlighted a
positioning opportunity that has not yet been exploited by the destination. These
attributes could be used more explicitly in future brand promotions, since the easiest
route to the mind is to reinforce positively held perceptions rather than to attempt to
try to change opinions. Of concern is the high level of ‘don’t know’ responses to the
cognitive attribute questions.
The results clearly highlight the challenge facing the destination in what is a crowded
and competitive market. Branding underpins all marketing communications, and all
short term marketing initiatives should focus on developing favourable brand salience
and brand associations in the long term (Keller, 1993). Linking the brand’s attributes
to consumer needs will lead to enhanced brand resonance. Successful delivery of the
brand promise at the destination may lead to increased brand loyalty, particularly in
the short break drive market where consumers have favourite places to which they
make repeat visits. Repeating the CBBE research again at a future point in time will
enable a continued assessment of success for each of the destination’s three brand
objectives. For an emerging destination with very little formal market research, it is
suggested the hierarchy provides an important means of accountability to
stakeholders.
REFERENCES
Aaker, D. A. (1991). Managing Brand Equity. New York: Free Press.
Aaker, D. A. (1996). Building Strong Brands. New York: Free Press.
Baloglu, S., & Brinberg, D. (1997). Affective images of tourism destinations.
Journal of Travel Research. Spring: 11-15.
Baloglu, S., & McCleary, K.W. (1999). A model of destination image.
Annals of Tourism Research. 26(4): 868-897.
Banks, S. (1950). The relationship between preference and purchase of brands. The Journal of Marketing. 15 (Oct): 145-157.
BTR. (2002). Travel by Australians, 2001: Annual Results of the National
Visitor Survey 2001. Canberra: Bureau of Travel Research.
Chon, K. (1990). The role of destination image in tourism: a review and discussion.
The Tourist Review. 45(2):2-9.
Cobb-Walgren, C.J., Beal, C., & Donthu, N. (1995). Brand equity, brand preferences,
and purchase intent. Journal of Advertising. 24(3): 25-40.
Crockett, S.R., & Wood, L.J. (1999). Brand Western Australia: a totally integrated
approach to destination branding. Journal of Vacation Marketing. 5(3): 276-
289.
Crompton, J. (1992). Structure of vacation destination choice sets. Annals of
Tourism Research. 19: 420-434.
Curtis, J. (2001). Branding a State: the evolution of Brand Oregon. Journal of

Vacation Marketing. 7(1):75-81.
Dioko, L.A.N., & So, S. (2005). Proceedings of the International Conference on
Destination Branding and Marketing for Regional Tourism Development.
Institute for Tourism Studies. Macau. December.
Echtner, C.M. and Ritchie, J.R.B. (1991). The meaning and measurement of
destination image. The Journal of Tourism Studies. 2(2): 2-12.
Gallarza, M. G., Saura, I. G., & Garcia, H. C. (2002). Destination image: toward a
conceptual framework. Annals of Tourism Research. 29(1): 56-78.
Gardner, B. B., & Levy, S. J. (1955). The product and the brand. Harvard Business
Review. March-April: 33-39.
Hall, D. (1999). Destination branding, niche marketing and national image projection
in Central and Eastern Europe. Journal of Vacation Marketing. 5(3): 227-237.
Keller, K.L. (1993). Conceptualizing, measuring, and managing customer-based
brand equity. Journal of Marketing. 57(January): 1-22.
Keller, K.L. (2003). Strategic Brand Management. Upper Saddle River, NJ: Prentice
Hall.
Kim, H., Kim. W.G., & An, J.A. (2003). The effect of consumer-based brand equity
on firms’ financial performance. Journal of Consumer Marketing. 20(4/5):
335-351.
Lavidge, R.E., & Steiner, G.A. (1961). A model for predictive measurements of
advertising effectiveness. Journal of Marketing. 25: 59-62.
Mackay, H. (1988). The holiday market: A motivational analysis. Marketscan.
Mackay, M.M. (2001). Appication of brand equity measures in service markets.
Journal of Services Marketing. 15(3): 210-221.
Morgan, N., Pritchard, A., & Pride, R. (2002). Destination Branding – Creating the
Unique Destination Proposition. Oxford: Butterworth-Heinemann.
Pike, S. (2002). Destination image analysis: a review of 142 papers from 1973-2000.
Tourism Management. 23(5): 541-549.
Pike, S. (2004). Destination Marketing Organisations. Oxford: Elsevier Science.
Pike, S. (2007). Destination image literature: 2001 – 2007. Acta Turistica. 19(2): 107- 125. Pride, R. (2002). Brand Wales: ‘natural revival’. In Morgan, N, Prichard, A., & Pride,
R. (Eds). Destination Branding. Oxford: Butterworth-Heinemann. 109-123.
Pritchard, A., & Morgan, N. (1998). Mood marketing - the new destination branding
strategy: a case of Wales the brand. Journal of Vacation Marketing. 4(3): 215-
29.
Ritchie, J.R.B., & Ritchie, R.J.B. (1998).The branding of tourism destinations – past
achievements and future challenges. In Keller, P. (Ed). Destination Marketing
– Reports of the 48th AIEST Congress, Marrakech. 89-116.
Schultz, D., & Schultz, H. (2004). Brand babble – sense and nonsense about
branding. Mason, Ohio: South-Western.
Slater, J. (2002). Brand Louisiana: ‘Come as you are. Leave different.©’. In Morgan,
N., Pritchard, A., Pride, R. (2002). Destination Branding. Oxford:
Butterworth-Heinemann. 148-162.
Still, R. (2002). Region’s new brand unveiled at launch. News-Mail. Sept 21: 3.
Tasci, D.A., Gartner, W.C., & Cavusgil, S.T. (2007). Conceptualization and operationalization of destination image. Journal of Hospitality & Tourism Research. 31(2): 194-223. Thompson, J. R., & Cooper, P. D. (1979). Additional evidence on the limited
size of evoked and inept sets of travel destination. Journal of Travel
Research. 17(3): 23-25.
Tourism Forecasting Council. (2000). Steady growth for domestic tourism.
Forecast. 5(2): 4-8.
Tourism Forecasting Council. (2001). Outlook for domestic tourism: 2001-
2010. Forecast. October: 24-39.
Tourism Queensland. (2005). TQ News. Issue 1: Summer.
Vanhove, N. (2005). The Economics of Tourism Destinations. Oxford: Elsevier. White, A. (2000). Travelling tips. Leisure Management. 20(3): 30-34.
Woodside, A. G., & Sherrell, D. (1977). Traveler evoked, inept, and inert sets
of vacation destinations. Journal of Travel Research. 16: 14-18.

Figure 1
Brand identity, brand position and brand image
Source: Pike (2004, p. 112)
Brand image Actual image held by consumers
Brand identity Desired brand image
Brand positioning Name Symbol Slogan
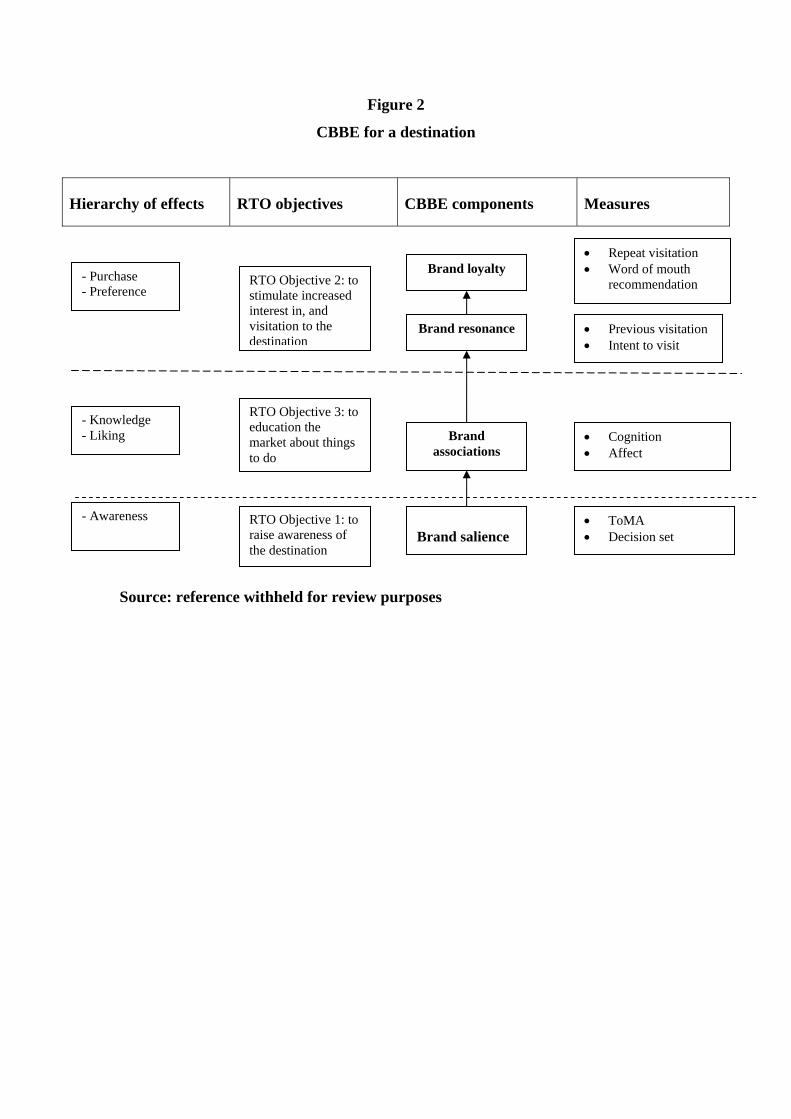
Figure 2
CBBE for a destination
Hierarchy of effects RTO objectives CBBE components Measures
Source: reference withheld for review purposes
Brand resonance
Brand associations
Brand salience
Previous visitation Intent to visit
Cognition Affect
ToMA Decision set
RTO Objective 1: to raise awareness of the destination
RTO Objective 3: to education the market about things to do
RTO Objective 2: to stimulate increased interest in, and visitation to the destination
Brand loyalty Repeat visitation and word of mouth
- Awareness
- Knowledge - Liking
- Purchase - Preference
Repeat visitation Word of mouth
recommendation

Table 1
Characteristics of participants in 2003 and 2007
2003 n
2003 Valid %
2007 n
2007 Valid %
Gender Male Female Total Missing
199 324 521 2
38.0% 62.0%
169 275 444 3
38.1% 61.9%
Age 18-24 25-44 45-64 65+ Total Missing
16 212 244 50 522 1
3.1% 40.6% 46.7% 9.6%
16 166 205 56 443 4
3.6% 37.5% 46.3% 12.6%
Annual household income
Less than $78,000 $78,000 or more Total Missing
372 136 508 15
73.2% 26.8%
243 190 433 19
56.1% 43.9%
Marital status
Single Married/permanent partner Separated, divorced, widowed Total Missing
57 395
70 522 1
10.9% 75.7%
13.4%
50 335
58 443 4
11.3% 75.6%
13.1%
Number of dependent children
0 1-2 3+ Total Missing
283 182 56 521 2
54.1% 34.8% 10.7%
238 163 44 445 2
53.5% 36.6% 9.9%
Highest level of education
High school TAFE University graduate Other Total Missing
211 123 164 22 520 3
40.6% 23.7% 31.5% 4.2%
149 101 147 48 445 2
33.5% 22.7% 33.0% 10.8%

Table 2 Unaided ToMA destinations
Region 2003
Frequency
2003
Valid %
2007
Frequency
2007
Valid %
Sunshine Coast 231 45.1% 202 45.9%
Gold Coast 96 18.8% 72 16.4%
Northern New South
Wales
57 11.1% 64 14.5%
Fraser Coast 33 6.4% 24 5.5%
Darling
Downs/Warwick
20 3.9% 22 4.7%
Coral Coast 11 2.1% 6 1.4%
Other 64 12.6% 50 11.6%
Missing 11 7
Total 523 447

Table 3
Brand associations
Cognitive attributes
2003 Mean Coral Coast
performance
2003 Rank of Coral
Coast in competiti
ve set
2007 Attribute importan
ce
2007 Mean Coral Coast
performance
2007 Rank of Coral
Coast in competiti
ve set Pleasant climate 5.9 4 5.3 5.8 4= Good fishing and boating
5.7 3 - - -
Relaxing, uncrowded and not touristy
5.6 1 - - -
Good value for money
5.5 2 = 6.1 5.1 2=
A safe destination
5.5 4 6.1 5.4 3
Places for walking
5.4 4 4.3 4.5 4
Friendly locals 5.4 2 = 5.0 5.2 1 Suitable accommodation
5.2 5 6.2 5.1 5
Good beaches 5.1 5 4.8 5.1 5 Lots to see and do
5.0 5 4.9 5.0 5
High levels of service
4.9 4 4.7 4.4 5
Good cafes and restaurants
4.7 4 5.1 4.4 4=
Within a comfortable drive
3.6 5 5.2 3.8 5
Beautiful scenery - - 5.4 5.6 4 Uncrowded - - 5.2 5.0 1= Places for swimming
- - 4.7 5.3 5
Not touristy - - 4.4 4.6 1 Affordable packages
- - 5.4 4.9 2
Good shopping - - 3.9 4.0 4 Family destination
- - 4.3 5.4 3
Water sports - - 3.1 4.7 5 Historical places - - 3.9 4.6 1 Marine life - - 3.9 5.3 2= Trendy atmosphere
- - 3.0 3.5 5

Affective attributes
Sleepy/arousing 3.8 5 n/a 3.7 5 Unpleasant/pleasant
5.0 5 n/a 4.7 5


![CBBE [Compatibility Mode]](https://img.pdfslide.us/doc/110x75/577d2c801a28ab4e1eac657c/cbbe-compatibility-mode.jpg)