Embed Size (px)
Citation preview

QuinoaImprovement and Sustainable
Production

QuinoaImprovement and Sustainable
Production
Edited by
Kevin Murphy and Janet Matanguihan
Copyright © 2015 by Wiley-Blackwell. All rights reserved
Published by John Wiley & Sons, Inc., Hoboken, NewJerseyPublished simultaneously in Canada
No part of this publication may be reproduced, stored ina retrieval system, or transmitted in any form or by anymeans, electronic, mechanical, photocopying, recording,scanning, or otherwise, except as permitted underSection 107 or 108 of the 1976 United States CopyrightAct, without either the prior written permission of thePublisher, or authorization through payment of theappropriate per-copy fee to the Copyright ClearanceCenter, Inc., 222 Rosewood Drive, Danvers, MA 01923,(978) 750-8400, fax (978) 750-4470, or on the web atwww.copyright.com. Requests to the Publisher forpermission should be addressed to the PermissionsDepartment, John Wiley & Sons, Inc., 111 River Street,Hoboken, NJ 07030, (201) 748-6011, fax (201) 748-6008,or online at http://www.wiley.com/go/permission.
Limit of Liability/Disclaimer of Warranty: While thepublisher and author have used their best efforts inpreparing this book, they make no representations orwarranties with respect to the accuracy or completenessof the contents of this book and specifically disclaim anyimplied warranties of merchantability or fitness for aparticular purpose. No warranty may be created orextended by sales representatives or written salesmaterials. The advice and strategies contained herein maynot be suitable for your situation. You should consultwith a professional where appropriate. Neither the
publisher nor author shall be liable for any loss of profit orany other commercial damages, including but not limitedto special, incidental, consequential, or other damages.
For general information on our other products andservices or for technical support, please contact ourCustomer Care Department within the United States at(800) 762-2974, outside the United States at (317)572-3993 or fax (317) 572-4002.
Wiley also publishes its books in a variety of electronicformats. Some content that appears in print may not beavailable in electronic formats. For more informationabout Wiley products, visit our web site atwww.wiley.com.
Library of Congress Cataloging-in-Publication Data:
Quinoa : improvement and sustainable production /edited by Kevin Murphy and Glafera Janet Matanguihan.
pages cmIncludes bibliographical references and index.ISBN 978-1-118-62805-8 (cloth)1. Quinoa. 2. Crop improvement. 3. Sustainable
agriculture. I. Murphy, Kevin (Kevin Matthew), 1972-editor. II. Matanguihan, Glafera Janet, editor.
SB177.Q55Q56 2015664′.7–dc23
2015006917
Printed in the United States of America
10 9 8 7 6 5 4 3 2 1
Contents
List of Contributors ix
Preface xi
1 Quinoa: An Incan Crop to FaceGlobal Changes in Agriculture 1Juan Antonio González, Sayed S. S.Eisa, Sayed A. E. S. Hussin, andFernando Eduardo Prado
Introduction 1A Brief History of Quinoa Cultivation 2Nutritional Value of Quinoa Seed 2Botanical and Genetic Characteristics of
the Quinoa Plant 5Quinoa and Environmental Stresses:
Drought and Salinity 7Conclusion 12References 12
2 History of Quinoa: Its Origin,Domestication, Diversification,and Cultivation with ParticularReference to the ChileanContext 19Enrique A. Martınez, Francisco F.Fuentes, and Didier Bazile
Quinoa Origins in the Central Andes 19Ancient Expansion to Southern Latitudes
in Chile 20Reintroduction of Quinoa in Arid Chile
after Local Extinction 20
Final Remarks 23References 23
3 Agroecological and AgronomicCultural Practices of Quinoa inSouth America 25Magali Garcia, Bruno Condori, andCarmen Del Castillo
Introduction 25Andean Domestication 26Botanical and Taxonomical Description 27Genetic Background and Research on
Quinoa Genetics 28Ecology and Phytogeography 30Cultivation and Agronomic Practices
in South America 30Quinoa Production 31
Soil conditions 31Climate 32
Drought resistance 32Temperature and photoperiod 33Hail 34
Cultivation 34Sowing 34Fertilization of quinoa 36Cultural practices 37Crop water requirements and
irrigation 37Biotic threats: pests and diseases 38Seed harvest and postharvest
technology 39References 41
v
vi Contents
4 Trends in Quinoa Yield over theSouthern Bolivian Altiplano:Lessons from Climate andLand-Use Projections 47Serge Rambal, Jean-Pierre Ratte,Florent Mouillot, and Thierry Winkel
Summary 47Introduction 48Materials and Methods 49
The study area 49Recent past and present climate 49Source of climate scenarios 50Simulating the yield index at local
or plot scale 50The soil water balance model 50Scenarios of land-use/land-cover
changes 51Scaling local yield index up to the region 51
Results 52Drought history over the area 52Climate projections and soil drought
limitation 52Time variation of yield at local or
plot scale 54Model results at landscape level 56
Discussion 57Acknowledgments 60References 60
5 The Potential of Using NaturalEnemies and ChemicalCompounds in Quinoa forBiological Control of InsectPests 63Mariana Valoy, Carmen Reguilón,and Griselda Podazza
Introduction 63Insects in Quinoa 64
Insect pests of quinoa 65Beneficial insects in quinoa 65Chemical responses of quinoa
to insect herbivory 72Quinoa secondary metabolites 74
Potential of Biological Control in Quinoa 76
Potential for Ecological Management ofQuinoa 77
References 80
6 Quinoa Breeding 87Luz Gomez-Pando
History – Domestication Process 87Collection of Genetic Resources 88Goals and Methods of Quinoa Breeding 92
Requirement of the farmers 92Requirements of the industry and
consumers 95Methods in genetic improvement 96
Quinoa Breeding Methods 98Selection 98Participatory plant breeding (PPB) 98Introduction of foreign germplasm 99Hybridization 99Interspecific and intergeneric crosses 102Backcross method 102Using heterosis in quinoa 102Mutagenesis 103Marker-assisted selection (MAS) 103
Conclusion 103References 103
7 Quinoa Cytogenetics, MolecularGenetics, and Diversity 109Janet B. Matanguihan, Peter J.Maughan, Eric N. Jellen, and BozenaKolano
Introduction 109Cytogenetics and Genome Structure of
Chenopodium Quinoa 109Crossability of Quinoa and Allied
Tetraploid Taxa 111DNA Sequence Evidence for Quinoa’s
Genomic Origins 112Quinoa Genetic Markers and Linkage
Maps 113Quinoa Diversity 115
Phenotypic diversity 115Genetic diversity 117
Summary 118References 120
Contents vii
8 Ex Situ Conservation of Quinoa:The Bolivian Experience 125Wilfredo Rojas and Milton Pinto
Introduction 125Centers of Origin and Diversity
of Quinoa 126Geographical Distribution of Quinoa 127Genebanks of the Andean Region 128Bolivian Collection of Quinoa
Germplasm 130History and management of the
quinoa germplasm 130Current status of quinoa germplasm 132
Steps for Ex Situ Management andConservation of Quinoa 132Collection of quinoa germplasm 133Technical procedure for quinoa
germplasm collection 133History and evolution of quinoa
germplasm collections 134Distribution of quinoa germplasm
collection 136Preliminary multiplication of quinoa
germplasm 136Storage and conservation of quinoa
germplasm 138Short- and medium-term storage
(1 to 20 years) 138Long-term storage (80 to 100 years) 138Characterization and evaluation
of the quinoa germplasm 140Stages of germplasm characterization
and evaluation 140Agromorphological variables 141Agro-food and nutritional value
variables 143Molecular characterization 144Multiplication and regeneration
of quinoa germplasm 144Monitoring of seed quantity and
percentage of seedgermination 145
Technical procedure for multiplicationand/or regeneration 145
Regeneration schedule 146Documentation and information
on quinoa germplasm 147
Utilization of quinoa germplasm 148Conclusions 155References 158
9 Quinoa Breeding in Africa:History, Goals, and Progress 161Moses F.A. Maliro and Veronica Guwela
Introduction 161Origin of quinoa 161Introducing quinoa in Africa 161Ecological adaptation of quinoa 163
Goals of Quinoa Breeding in Africa 164Quinoa studies under Malawi
conditions 164Quinoa studies in Kenya 166
Challenges and Considerations forFuture Research 169Plant lodging 169Acceptability 169Agronomic practices 170Rain-fed versus irrigated cropping
systems 170Conclusion 170References 170
10 Quinoa Cultivation forTemperate North America:Considerations and Areasfor Investigation 173Adam J. Peterson and Kevin M. Murphy
Introduction 173Tolerance to Abiotic Stresses 173
Heat tolerance 173Drought tolerance 174Cold tolerance 175Salinity tolerance 176
Production Aspects 177Variety selection 177Fertilization 178Planting/spacing 179Maturity and harvesting 181
Challenges to Quinoa Production 182Waterlogging and preharvest sprouting 182Disease 183Insect pests 184
viii Contents
Weed control 185Saponins 186
Alternative Uses of Quinoa 186Forage 186Feed 187
Conclusion 187Acknowledgments 188References 188
11 Nutritional Properties of Quinoa 193Geyang Wu
Introduction 193Protein 193Carbohydrates 196
Starch 196Sugar 198Dietary fiber 198
Lipids 199Vitamins 200Minerals 201Anti-Nutritional Factors of Quinoa 202Bioactive Compounds 204
Phenolic compounds 204Phenolic acid 204Flavonoids 204Carotenoids 205
Summary 205References 205
12 Quinoa’s Calling 211Sergio Núnez de Arco
Introduction 211A Snapshot of the Economics of a
Smallholder Farmer in Bolivia andthe International Market 212
The Quinoa Market: Supply andDemand 213
Bolivia, Peru, and Ecuadorincrease quinoa acreage 213
Evolution of quinoa,(Figs. 12.7–12.10and Fig. 12.3) acreage inBolivia 213
The US quinoa market and evolutionof prices 215
Quinoa in the eye of a market storm 215The quinoa grower rises out
of poverty 217Current Production Practices, Increased
Acreage, and Thoughts onSustainability 221
Living Well, Reversed Migration, andCultural Identity 224
Opportunities for the Bolivian Farmer 225
Index 227
List of Contributors
Sergio Núñez de ArcoAndean Naturals, Inc.,Foster City, CA, USA
Didier BazileUPR47, GREEN, Centre de CoopérationInternationale en Recherche Agronomiquepour le DéveloppementCampus International de BaillarguetMontpellier, France
Carmen Del CastilloFaculty of AgronomyUniversidad Mayor de San AndresLa Paz, Bolivia
Bruno CondoriConsultative Group on InternationalAgricultural Research – International PotatoCenter, La Paz, Bolivia
Sayed S.S. EisaAgricultural Botany Department, Faculty ofAgriculture, Ain Shams University, Cairo, Egypt
Francisco F. FuentesFacultad de Agronomía e Ingeniería Forestal,Pontificia Universidad Católica de Chile, Casilla306–22, Santiago, Chile
Magali GarciaFaculty of Agronomy,Universidad Mayor de San AndresLa Paz, Bolivia
Juan Antonio GonzálezInstituto de Ecologia – Area de BotánicaFundación Miguel Lillo TucumánTucumán, Argentina
Veronica GuwelaInternational Crops Research Institute for theSemi-Arid Tropics, Lilongwe, Malawi
Sayed Abd Elmonim Sayed HussinAgricultural Botany Department, Faculty ofAgriculture, Ain Shams UniversityCairo, Egypt
Eric N. JellenPlant and Wildlife SciencesBrigham Young UniversityProvo, UT, USA
Bozena KolanoDepartment of Plant Anatomy and CytologyUniversity of Silesia, Poland
Moses F.A. MaliroDepartment of Crop and Soil Sciences, BundaCollege Campus, Lilongwe University ofAgriculture and Natural ResourcesLilongwe, Malawi
Enrique A. MartínezCentro de Estudios Avanzados en Zonas ÁridasLa Serena and Facultad de Ciencias del MarUniversidad Católica del NorteCoquimbo, Chile
ix
x List of Contributors
Janet B. MatanguihanDepartment of Crop and Soil SciencesWashington State UniversityPullman, WA, USA
Peter J. MaughanPlant and Wildlife SciencesBrigham Young UniversityProvo, UT, USA
Florent MouillotIRD, UMR 5175 CEFEMontpellier, France
Kevin M. MurphyDepartment of Crop and Soil SciencesWashington State UniversityPullman, WA, USA
Luz Gomez-PandoUniversidad Nacional Agraria La MolinaAgronomy FacultyLima, Peru
Adam J. PetersonDepartment of Crop and Soil SciencesWashington State UniversityPullman, WA, USA
Milton PintoPROINPA Foundation538 Americo Vespucio St., P.O. Box 1078,La Paz, Bolivia
Griselda PodazzaInstituto de Ecología, Fundación Miguel LilloTucumán, Argentina
Fernando Eduardo PradoFacultad de Ciencias Naturales e IMLFisiología VegetalTucumán, Argentina
Serge RambalCNRS, UMR 5175 CEFEMontpellier, FranceDepartamento de BiologiaUniversidade Federal de LavrasLavras, MG, Brazil
Jean-Pierre RatteCNRS, UMR 5175 CEFEMontpellier, France
Carmen ReguilónInstituto de Entomología, Fundación MiguelLillo Tucumán, Argentina
Wilfredo RojasPROINPA FoundationAv. Elias Meneces km 4El Paso, Cochabamba, Bolivia
Mariana ValoyInstituto de Ecología, Fundación Miguel LilloTucumán, Argentina
Thierry WinkelIRD, UMR 5175 CEFEMontpellier, France
Geyang WuSchool of Food ScienceWashington State UniversityPullman, WA, USA
Preface
The seeds of this book took root in the summerof 2010, during the first year of our multilocationquinoa trials across three major climatic regionsof Washington State. We began growing andevaluating quinoa thanks to generous fundingfrom the Organic Farming Research Foundation,and growers around the state looked on with keeninterest. In that first year we tested 44 varieties ofquinoa sourced from almost as many diverse geo-graphical locations and we were mildly surprisedwhen only 12 of these actually produced seed inour northern latitude. That first year we wereintroduced to many of the ongoing challenges wecontinue to face 5 years later, including suscepti-bility to preharvest sprouting and downy mildew,photoperiod insensitivity, pollen sterilizationresulting from high summer temperatures withlittle to no rainfall or supplemental irrigation,and the negative effects of aphid and lyguspredation. We quickly realized that if quinoa wereto become a successfully grown crop in the PacificNorthwest region of the United States, it wouldrequire a concerted effort of a transdisciplinarycadre of scientists with a range of expertise,a forward-thinking and risk-taking group ofinnovative farmers, and a strong supporting castof distributors, processors, and consumers. Fromthat first year, with only one junior faculty and oneundergraduate research intern collaborating withthree farmers, the quinoa group at WashingtonState University has grown into diverse team ofover 10 faculty and 10 graduate students, eachaddressing a key component of quinoa breeding,agronomy, sociology, entomology, or food science.This book is intended to lay the groundwork forthe latest quinoa research worldwide and to assistfaculty and students new to the crop to gain a
foothold of understanding into quinoa genomicsand breeding, global agronomy and production,and marketing.
In August 2013, Washington State Univer-sity hosted the International Quinoa ResearchSymposium (IQRS). One hundred and sixtyenthusiastic participants from 24 countriesdescended on Pullman, Washington and sharedknowledge, questions, obstacles, observations,and ideas on the path forward during an intense,vibrant and thought-provoking 3 days of talks,field visits, poster sessions, and quinoa vodkainfused social exploration. Many of the co-authorsof the various chapters in this book were atten-dees and/or presenters at the IQRS, and thesymposium provided a safe forum for the opendiscussion of ideas that have found their way intothe chapters of this book. Symposium attendeeswho have contributed to this book include DidierBazille, Juan Antonio Gonzalez, Luz GomezPando, Rick Jellen, Moses Maliro, EnriqueMartinez (in absentia), Jeff Maughan, SergioNúñez de Arco, Adam Peterson, Wilfredo Rojas,Geyang Wu, and co-editors Janet Matanguihanand Kevin Murphy.
Keynote speakers at the IQRS includedSven-Erik Jacobsen, renowned quinoa researcherfrom University of Copenhagen, Tania San-tivanez from the United Nations Food andAgriculture Organization, and John McCamant,a long-time quinoa farmer and researcher fromWhite Mountain Farms in Colorado, USA. Otheresteemed presenters not mentioned includedDaniel Bertero from the University of BuenosAires, Argentina, Morgan Gardner of WashingtonState University, Frank Morton of Wild GardenSeeds in Oregon, and Hassan Munir of the
xi
xii Preface
University of Agriculture Faisalabad, Pakistan,as well as numerous poster presentations. Finally,the highlight of the symposium for many atten-dees was the eloquent thoughts delivered by agroup of five Bolivian farmers, who traveled tothe United States for the first time to join in theinternational discussion on the many social andpolitical aspects of quinoa cultivation.
This book reflects the many presentations anddiscussions that took place at the IQRS, and isintended to provide the reader with a compre-hensive base knowledge of the current body ofknowledge of the ever-expanding, global scientificresearch of quinoa. In Chapter 1, Gonzalez et al.provide a solid overview of quinoa as an Incancrop, primarily in Peru and Bolivia, now facing adiversity of global challenges. Chapter 2 followsup on this introduction by discussing the origin,domestication, diversification, and cultivation ofquinoa from a Chilean perspective.
Chapter 3 by Garcia et al. encapsulates many ofthe wide-ranging agronomic and agroecologicalcultural practices of quinoa throughout the majorgrowing regions of South America as a whole.This broad chapter provides a botanical andtaxonomical description of quinoa, ecology andphytogeography of quinoa, and many tangibleproduction practices across a wide range ofclimates, soils, and growing conditions that canbe emulated in nontraditional growing regionsaround the world. Rambal et al. follow this witha description of the historical trends in quinoayield in the southern Bolivian altiplano, includingimportant lessons from climate and land-use pro-jections in Chapter 4. Valoy et al. then discuss inChapter 5 the potential of using natural enemiesand chemical compounds in quinoa for biologicalcontrol of pests. This chapter follows up on theagroecological themes discussed in Chapter 3, andcompiles and elucidates a vast array of knowledgegained through previous research in this realmof quinoa science, and provides the thoughtfulreader many potential ideas for new research inthis direction.
In Chapter 6, Peruvian plant breederGomez-Pando describes the historical andmodern context of quinoa breeding in the Andeanregions. Beginning with the effect of farmer
selection on seed color, dormancy, seed sizeand seed coat thickness, salt and drought toler-ance, and adaptation to multiple and countlessmicroclimates, Gomez-Pando then moves on tohighlight the rise of modern quinoa breedingin the 1960s, the collection of quinoa geneticresources and in situ conservation, and the goalsand methodology employed by current quinoabreeders.
Matanguihan et al. follow this with an in-depthdiscussion on the cytogenetics, genomic structure,and diversity of quinoa in Chapter 7. Informa-tion on close genetic relatives of Chenopodiumquinoa are discussed, along with DNA-basedmolecular genetic tools and linkage maps whichcan facilitate and accelerate the transfer of exoticgenes into C. quinoa. Also included in Chapter 7is a review of phenotypic and genetic diversitystudies which show that the genetic variability ofquinoa has a spatial structure and distribution.The congruence between genetic differentiationand ecogeography suggests that quinoa all overthe southern Andes may be undergoing similarprocesses of genetic differentiation. Not surpris-ingly, human activities, specifically seed exchangeroutes, have significantly affected the geneticstructure of quinoa.
In Chapter 8, Rojas and Pinto discuss theex-situ conservation of quinoa genetic resourcesfrom a Bolivian perspective. According to Rojasand Pinto, the Bolivian quinoa germplasm col-lection has the greatest diversity in the world,and this diversity represents the cultural impor-tance of quinoa in Bolivian customs, indigenousconsumption, and production. Chapter 8 alsoprovides insight into the center of origin anddiversity of quinoa, the geographical distributionof quinoa, and steps needed for the ex situmanagement and conservation of quinoa.
Chapters 9 and 10 discuss quinoa cultivation ntwo continents, Africa and North America, thatare considered nontraditional quinoa productionenvironments. In Chapter 9, Maliro and Guweladescribe the necessity of stabilizing food securityand alleviating malnutrition in Africa, and thepotential for quinoa as a novel crop to make apositive contribution to these efforts. The goals ofquinoa breeding in Africa and information from
Preface xiii
recent quinoa trials in Malawi and Kenya arediscussed in an effort to address the challengesand considerations for future quinoa researchin Africa. Key among these considerations isthe acceptability of quinoa into African diets.In Chapter 10, Peterson and Murphy discussquinoa introduction to the United States as a cropapproximately 30 years ago, and the key breeding,research, and production events in the timeperiod after its introduction. Recent research atWashington State University is highlighted inthis chapter.
In Chapter 11, Wu describes the nutritionalproperties of quinoa that have played an impor-tant role in bringing the crop to worldwideattention. Finally, in a refreshing departure fromthe scientific writing in the previous chapters,Nuñez de Arco provides an insider’s view into themarketing of quinoa in Chapter 12. Of particularinterest are the personal descriptions and snap-shots of the lives of smallholder farmers, of whichan estimated 35,000 produce quinoa in Bolivia,who discuss their philosophy of marketing quinoa
under the current fluctuations in the supply anddemand of this increasingly popular crop.
This book is a reflection of the increasingimportance of quinoa in the global market. Theroster of contributors – from South America,Europe, Africa and North America – also reflectsthe expansion of quinoa from its origins to newproduction areas in the world. It was a pleasureto work with colleagues from countries who havegrown quinoa for centuries, and with colleaguesfrom countries which are growing quinoa for thefirst time. We are indebted to these authors fortheir willingness to share their expertise and fortheir cooperation in the process of shaping thisbook. It is our hope that this book will contributeto quinoa knowledge to benefit growers, students,researchers, and professionals from universitiesand institutes involved in the improvement ofquinoa and its sustainable production.
Kevin M. MurphyJanet B. Matanguihan

Chapter 1
Quinoa: An Incan Crop to Face GlobalChanges in Agriculture
Juan Antonio González1, Sayed S. S. Eisa2, Sayed A. E. S. Hussin2,
and Fernando Eduardo Prado3
1Instituto de Ecologia – Area de Botánica, Fundación Miguel Lillo, Tucumán, Argentina2Agricultural Botany Department, Faculty of Agriculture, Ain Shams University (ASU), Cairo, Egypt3Facultad de Ciencias Naturales e IML, Fisiología Vegetal, Miguel Lillo 205, 4000 Tucumán, Argentina
INTRODUCTION
Environmental changes have always occurred inthe past but in the last decades these have escalatedto critical levels, presenting environmental riskto people, especially in terms of food supply, as itaffects crop yield, production, and quality. Rapidpopulation growth leads to increase in demandfor land and thus to accelerated degradation anddestruction of the environment (Alexandratos2005; IPCC 2007). Probably the most importantchange driven by human activity is the increasingaccumulation of greenhouse gases such as carbondioxide (CO2), among others (Wallington et al.2004; Montzka et al. 2011). Greenhouse gasescan absorb and emit infrared radiation, and thus aglobal earth warming occurs, otherwise known asthe greenhouse effect. Many scientists agree thateven a small increase in the global temperaturewould lead to significant climate and weatherchanges, affecting cloud cover, precipitation, windpatterns, the frequency and severity of storms,and the duration of seasons (Solomon et al. 2009).This scenario will lead to scarce natural resourcesand the reduction of food production.
Quinoa: Improvement and Sustainable Production, First Edition. Edited by Kevin Murphy and Janet Matanguihan.© 2015 John Wiley & Sons, Inc. Published 2015 by John Wiley & Sons, Inc.
The net consequences of global warming oncrop physiology and yield are not yet fully under-stood, but there are some evidences indicatingthat decrease in yield may be the main response(Parry et al. 2005). Another deleterious effectof global warming is the increase in diseases,especially those caused by fungi and bacteria, asa consequence of higher humidity (Chakrabortyet al. 2000; Hunter 2001). As most crops world-wide are well adapted to previous weatherconditions, many of these crops will becomeless productive and may even disappear in afuture of increasing climate change. It is thereforenecessary to explore plant species as alternativecrops or develop new crops to grow underthese changing weather patterns. In this sense,it is very important to take into account plantspecies that grow in different altitudinal levelsor those that have thrived in mountain regionsfor millennia. Mountain plants, especially thoseadapted and cultivated in different altitudinallevels, may be very important because of thegenetic richness that enabled those adaptations.
Quinoa (Chenopodium quinoa Willd.), a nativegrain to the Andean highlands in South America,could be an excellent alternative crop in manyregions of the world. Quinoa has been grown
1
2 Quinoa: Improvement and Sustainable Production
in the Andes about 5,000–7,000 years ago andhas been cultivated in different ecological zonesfrom sea level in the northwest region of Chile toaltitudes over 4,000 m above sea level (masl) in theBolivian Altiplano (Fuentes et al. 2009). Owingto this plasticity, quinoa has been introduced tohigher latitudes as a new or alternative crop, withreports indicating an acceptable adaptation ofthis species in the United States, Canada, andEurope (Johnson and Ward 1993; Jacobsen 1997)and recently in Morocco (Jellen et al. 2005), India(Bhargava et al. 2006, 2007), and Italy (Pulventoet al. 2010).
A BRIEF HISTORY OF QUINOACULTIVATION
Archeological studies provide evidence on theconsumption of quinoa as human food thousandsof years before the first Spanish conquerorsarrived in America. Uhle (1919), taking intoaccount evidences from Ayacucho (Perú), saidthat quinoa domestication began almost 5,000years BC. According to Nuñez (1974), quinoa wasutilized in the north region of Chile at least 3,000years BC. Many chronicles and archeologicalstudies provide evidence that quinoa was usedby indigenous people for centuries in Colombia,Ecuador, Perú, Bolivia, Chile, and the Argen-tinean northwest. During pre-Columbian times,quinoa seed served as a staple food in the Incandiet, leading the Incas to call it the “mothergrain” and considered it as a gift of the sun god,“Inti.” It is believed that the Incas consideredquinoa to be a sacred plant. Religious festivalsincluding an offering of quinoa in a fountain ofgold to the Inti god were held. The Inca Emperorused a special gold tool to make the first furrowof each year’s quinoa planting. In Cuzco, ancientIncas worshipped entombed quinoa seeds asthe progenitors of the city. The first Spanishconqueror who mentioned quinoa was Pedrode Valdivia. In 1551, he wrote to Carlos I, theSpanish Emperor, about the presence of somecrops in the neighboring area of Concepción,Chile and specifically mentioned “…maize,potatoes and quinuas… ” (Tapia 2009). On the
other hand, in the Comentarios Reales de los Incas,a book written by Inca Garcilaso de la Vega andpublished in 1609 in Lisbon, Portugal, Garcilasomentioned “quinoa” as one of the first crops inthe Inca Empire (de la Vega 1966). Garcilasomentioned that there was an intent to exportquinoa to Spain but the seeds were nonviable.Other authors had also mentioned the existenceof quinoa in Pasto and Quito, Ecuador (Cieza deLeón 1560), in Collaguas, Bolivia (Ulloa Mogol-lón 1586), Chiloé island in Chile (Cortés Hogea1558), and in the Argentinean Northwest andCordoba province, Argentina (de Sotelo 1583).During the Spanish conquest of South Americain the sixteenth century, quinoa was scornedas a “food for Indians” and the conquerorsdestroyed fields of quinoa, actively suppressing its“non-Christian” production and consumption.The Incan peoples under the yoke of Spanishoppression were forbidden to grow it on painof death and were forced to grow corn instead.According to Tapia (2009), after the Spanishconquest, the quinoa crop was preserved byAndean peoples in “aynokas” (communal lands)for centuries. This cropping practice also allowedthe conservation of quinoa germplasm in situ(Tapia 2009). Today, quinoa is cultivated in morethan 50 countries beyond the Andes. As a result,the cloud of ambiguity that has enveloped thiscrop for more than four centuries is beginning todisappear (National Research Council 1989).
NUTRITIONAL VALUE OF QUINOA SEED
There is extensive literature on the chemicalcomposition of quinoa seed (González et al. 1989;Ando et al. 2002; Repo-Carrasco et al. 2003; Abu-goch 2009), which cover all nutritional aspectssuch as chemical characterization of proteins(Brinegar and Goundan 1993; Hevia et al. 2001),fatty acid composition of the seed oil (Wood et al.1993; Ando et al. 2002), mineral content (Koziol1992; Konishi et al. 2004; Prado et al. 2010), andnutritional value (Prakash et al. 1993; Ranhotraet al. 1993; Ruales and Nair 1992).
The lipid content of quinoa seed is higher thanthat in common cereals (Repo-Carrasco-Valencia
Quinoa: An Incan Crop to Face Global Changes in Agriculture 3
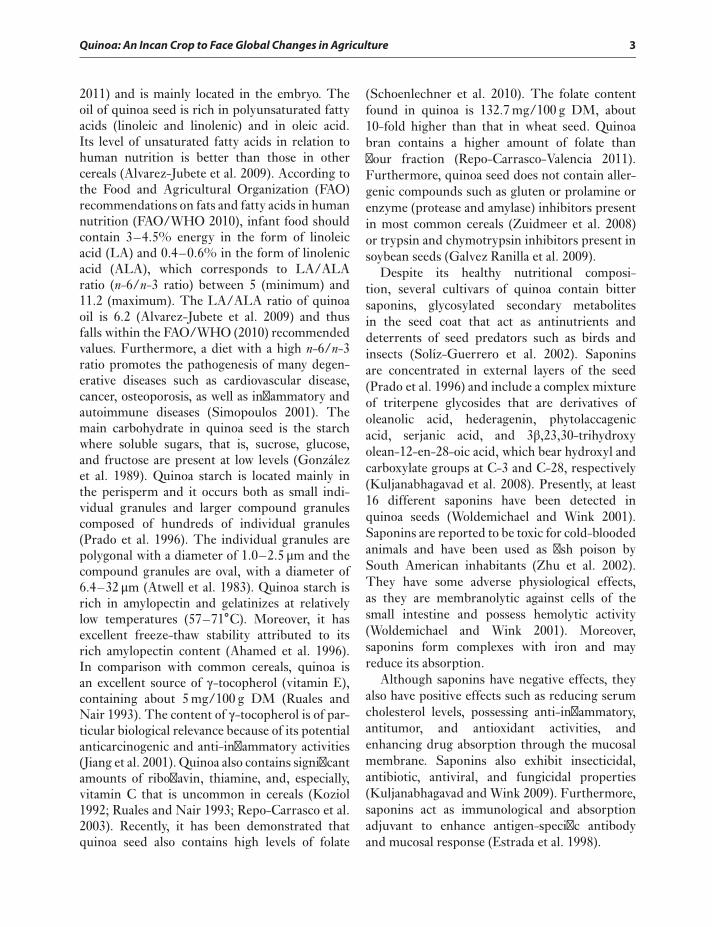
2011) and is mainly located in the embryo. Theoil of quinoa seed is rich in polyunsaturated fattyacids (linoleic and linolenic) and in oleic acid.Its level of unsaturated fatty acids in relation tohuman nutrition is better than those in othercereals (Alvarez-Jubete et al. 2009). According tothe Food and Agricultural Organization (FAO)recommendations on fats and fatty acids in humannutrition (FAO/WHO 2010), infant food shouldcontain 3–4.5% energy in the form of linoleicacid (LA) and 0.4–0.6% in the form of linolenicacid (ALA), which corresponds to LA/ALAratio (n-6/n-3 ratio) between 5 (minimum) and11.2 (maximum). The LA/ALA ratio of quinoaoil is 6.2 (Alvarez-Jubete et al. 2009) and thusfalls within the FAO/WHO (2010) recommendedvalues. Furthermore, a diet with a high n-6/n-3ratio promotes the pathogenesis of many degen-erative diseases such as cardiovascular disease,cancer, osteoporosis, as well as inflammatory andautoimmune diseases (Simopoulos 2001). Themain carbohydrate in quinoa seed is the starchwhere soluble sugars, that is, sucrose, glucose,and fructose are present at low levels (Gonzálezet al. 1989). Quinoa starch is located mainly inthe perisperm and it occurs both as small indi-vidual granules and larger compound granulescomposed of hundreds of individual granules(Prado et al. 1996). The individual granules arepolygonal with a diameter of 1.0–2.5 μm and thecompound granules are oval, with a diameter of6.4–32 μm (Atwell et al. 1983). Quinoa starch isrich in amylopectin and gelatinizes at relativelylow temperatures (57–71∘C). Moreover, it hasexcellent freeze-thaw stability attributed to itsrich amylopectin content (Ahamed et al. 1996).In comparison with common cereals, quinoa isan excellent source of γ-tocopherol (vitamin E),containing about 5 mg/100 g DM (Ruales andNair 1993). The content of γ-tocopherol is of par-ticular biological relevance because of its potentialanticarcinogenic and anti-inflammatory activities(Jiang et al. 2001). Quinoa also contains significantamounts of riboflavin, thiamine, and, especially,vitamin C that is uncommon in cereals (Koziol1992; Ruales and Nair 1993; Repo-Carrasco et al.2003). Recently, it has been demonstrated thatquinoa seed also contains high levels of folate
(Schoenlechner et al. 2010). The folate contentfound in quinoa is 132.7 mg/100 g DM, about10-fold higher than that in wheat seed. Quinoabran contains a higher amount of folate thanflour fraction (Repo-Carrasco-Valencia 2011).Furthermore, quinoa seed does not contain aller-genic compounds such as gluten or prolamine orenzyme (protease and amylase) inhibitors presentin most common cereals (Zuidmeer et al. 2008)or trypsin and chymotrypsin inhibitors present insoybean seeds (Galvez Ranilla et al. 2009).
Despite its healthy nutritional composi-tion, several cultivars of quinoa contain bittersaponins, glycosylated secondary metabolitesin the seed coat that act as antinutrients anddeterrents of seed predators such as birds andinsects (Solíz-Guerrero et al. 2002). Saponinsare concentrated in external layers of the seed(Prado et al. 1996) and include a complex mixtureof triterpene glycosides that are derivatives ofoleanolic acid, hederagenin, phytolaccagenicacid, serjanic acid, and 3β,23,30-trihydroxyolean-12-en-28-oic acid, which bear hydroxyl andcarboxylate groups at C-3 and C-28, respectively(Kuljanabhagavad et al. 2008). Presently, at least16 different saponins have been detected inquinoa seeds (Woldemichael and Wink 2001).Saponins are reported to be toxic for cold-bloodedanimals and have been used as fish poison bySouth American inhabitants (Zhu et al. 2002).They have some adverse physiological effects,as they are membranolytic against cells of thesmall intestine and possess hemolytic activity(Woldemichael and Wink 2001). Moreover,saponins form complexes with iron and mayreduce its absorption.
Although saponins have negative effects, theyalso have positive effects such as reducing serumcholesterol levels, possessing anti-inflammatory,antitumor, and antioxidant activities, andenhancing drug absorption through the mucosalmembrane. Saponins also exhibit insecticidal,antibiotic, antiviral, and fungicidal properties(Kuljanabhagavad and Wink 2009). Furthermore,saponins act as immunological and absorptionadjuvant to enhance antigen-specific antibodyand mucosal response (Estrada et al. 1998).
4 Quinoa: Improvement and Sustainable Production
Saponin content varies among genotypes,ranging between 0.2 and 0.4 g/kg DM (sweetgenotypes) and 4.7 and 11.3 g/kg DM (bit-ter genotypes). Therefore, selection of sweetgenotypes with very low saponin content inthe seeds is one of the main breeding goals inquinoa. However, selection for sweet genotypesis retarded by cross-pollination (Mastebroeket al. 2000). The tissue containing saponins is ofmaternal origin, and the saponin content of theseed reflects the genotype of the plant from whichthe grain is harvested (Ward 2001). Accordingto Gandarillas (1979), the saponin content traitis controlled by two alleles at a single locus,with the bitter allele (high saponin) dominantto the sweet allele (low saponin). More recently,researchers have observed that saponin content inquinoa seed is a continuously distributed variableand is therefore more likely to be polygenicallycontrolled and quantitatively inherited (Galweyet al. 1990; Jacobsen et al. 1996).
Quinoa seeds must be freed of seed coatsaponins before consumption. Saponins canbe easily eliminated by water washing or abra-sive dehulling. There was no difference in theremoval of saponins observed between the twomethods (Ridout et al. 1991), although the lattermethod has the advantage of not generatingwastewater. However, some nutrients can be lostwhen the abrasive dehulling method is used(Repo-Carrasco-Valencia 2011).
Among the nutritional attributes of quinoaseed, prominent is its high-quality protein thatis gluten-free and has an exceptional amino acidbalance. The presence of essential amino acidssuch as methionine, threonine, lysine, and trypto-phan are very important because they are limitingamino acids in most cereal grains (Gorinsteinet al. 2002). The high level of tryptophan foundin the seed of the Bolivian cultivar “Sajama” isnoteworthy (Comai et al. 2007). Protein quality isdetermined by its biological value (BV), which isan indicator of protein intake by relating nitrogenuptake to nitrogen excretion. The highest valuesof BV correspond to whole egg (93.7%) and cowmilk (84.5%) (Friedman 1996). The protein ofquinoa seed has a BV of 83%, which is higherthan that of fish (76%), beef (74.3%), soybean
(72.8%), wheat (64%), rice (64%), and corn(60%) protein (Abugoch 2009).
According to the FAO/WHO nutritionalrequirements for 10- to 12-year-old children,quinoa protein possesses adequate levels ofphenylalanine, tyrosine, histidine, isoleucine,threonine, and valine (FAO/WHO 1990). Con-sequently, there is no need to combine quinoaseed with other protein sources to supply humanrequirements for essential amino acids. Thisnutritional aspect of quinoa is very significant as itcan provide a new protein source for a good diet.Quinoa may also be an important alternative cropfor mountainous regions of the world, where manypeople live. In these regions, there are severe con-straints in obtaining good quality food and quinoawill be able to supply the nutrient requirementsthat other crops cannot, especially for children.
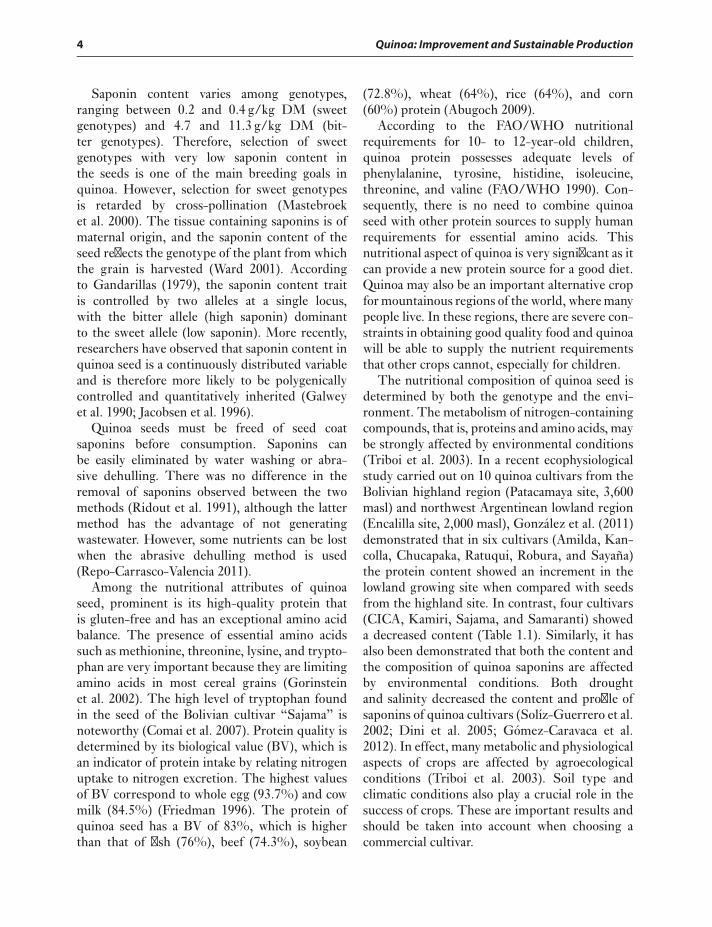
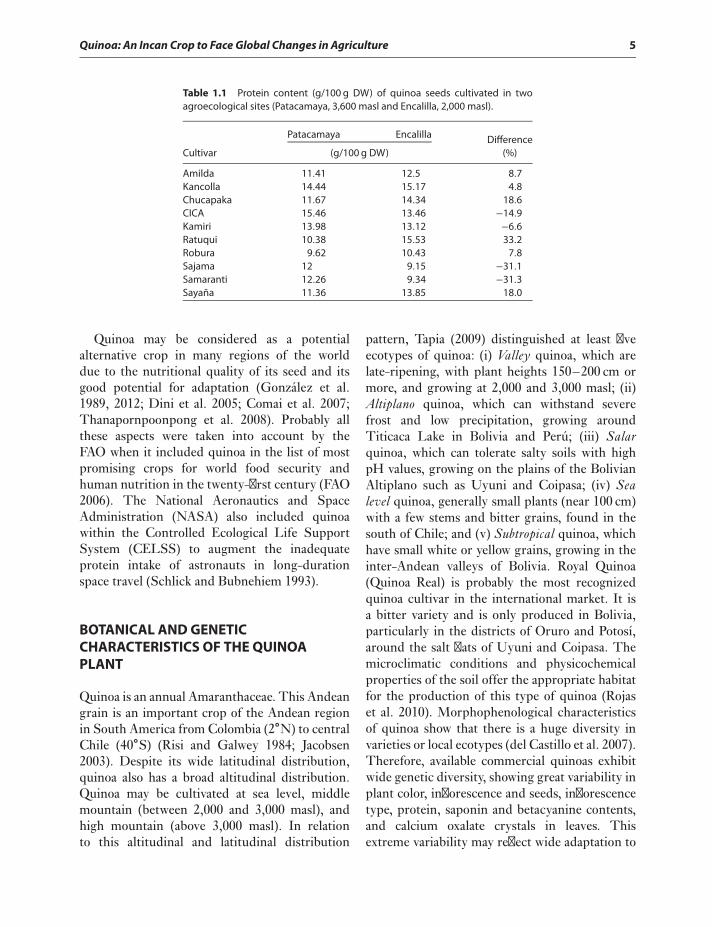
The nutritional composition of quinoa seed isdetermined by both the genotype and the envi-ronment. The metabolism of nitrogen-containingcompounds, that is, proteins and amino acids, maybe strongly affected by environmental conditions(Triboi et al. 2003). In a recent ecophysiologicalstudy carried out on 10 quinoa cultivars from theBolivian highland region (Patacamaya site, 3,600masl) and northwest Argentinean lowland region(Encalilla site, 2,000 masl), González et al. (2011)demonstrated that in six cultivars (Amilda, Kan-colla, Chucapaka, Ratuqui, Robura, and Sayaña)the protein content showed an increment in thelowland growing site when compared with seedsfrom the highland site. In contrast, four cultivars(CICA, Kamiri, Sajama, and Samaranti) showeda decreased content (Table 1.1). Similarly, it hasalso been demonstrated that both the content andthe composition of quinoa saponins are affectedby environmental conditions. Both droughtand salinity decreased the content and profile ofsaponins of quinoa cultivars (Solíz-Guerrero et al.2002; Dini et al. 2005; Gómez-Caravaca et al.2012). In effect, many metabolic and physiologicalaspects of crops are affected by agroecologicalconditions (Triboi et al. 2003). Soil type andclimatic conditions also play a crucial role in thesuccess of crops. These are important results andshould be taken into account when choosing acommercial cultivar.
Quinoa: An Incan Crop to Face Global Changes in Agriculture 5
Table 1.1 Protein content (g/100 g DW) of quinoa seeds cultivated in twoagroecological sites (Patacamaya, 3,600 masl and Encalilla, 2,000 masl).
Patacamaya Encalilla
Cultivar (g/100 g DW)Difference
(%)
Amilda 11.41 12.5 8.7Kancolla 14.44 15.17 4.8Chucapaka 11.67 14.34 18.6CICA 15.46 13.46 −14.9Kamiri 13.98 13.12 −6.6Ratuqui 10.38 15.53 33.2Robura 9.62 10.43 7.8Sajama 12 9.15 −31.1Samaranti 12.26 9.34 −31.3Sayaña 11.36 13.85 18.0
Quinoa may be considered as a potentialalternative crop in many regions of the worlddue to the nutritional quality of its seed and itsgood potential for adaptation (González et al.1989, 2012; Dini et al. 2005; Comai et al. 2007;Thanapornpoonpong et al. 2008). Probably allthese aspects were taken into account by theFAO when it included quinoa in the list of mostpromising crops for world food security andhuman nutrition in the twenty-first century (FAO2006). The National Aeronautics and SpaceAdministration (NASA) also included quinoawithin the Controlled Ecological Life SupportSystem (CELSS) to augment the inadequateprotein intake of astronauts in long-durationspace travel (Schlick and Bubnehiem 1993).
BOTANICAL AND GENETICCHARACTERISTICS OF THE QUINOAPLANT
Quinoa is an annual Amaranthaceae. This Andeangrain is an important crop of the Andean regionin South America from Colombia (2∘N) to centralChile (40∘S) (Risi and Galwey 1984; Jacobsen2003). Despite its wide latitudinal distribution,quinoa also has a broad altitudinal distribution.Quinoa may be cultivated at sea level, middlemountain (between 2,000 and 3,000 masl), andhigh mountain (above 3,000 masl). In relationto this altitudinal and latitudinal distribution
pattern, Tapia (2009) distinguished at least fiveecotypes of quinoa: (i) Valley quinoa, which arelate-ripening, with plant heights 150–200 cm ormore, and growing at 2,000 and 3,000 masl; (ii)Altiplano quinoa, which can withstand severefrost and low precipitation, growing aroundTiticaca Lake in Bolivia and Perú; (iii) Salarquinoa, which can tolerate salty soils with highpH values, growing on the plains of the BolivianAltiplano such as Uyuni and Coipasa; (iv) Sealevel quinoa, generally small plants (near 100 cm)with a few stems and bitter grains, found in thesouth of Chile; and (v) Subtropical quinoa, whichhave small white or yellow grains, growing in theinter-Andean valleys of Bolivia. Royal Quinoa(Quinoa Real) is probably the most recognizedquinoa cultivar in the international market. It isa bitter variety and is only produced in Bolivia,particularly in the districts of Oruro and Potosí,around the salt flats of Uyuni and Coipasa. Themicroclimatic conditions and physicochemicalproperties of the soil offer the appropriate habitatfor the production of this type of quinoa (Rojaset al. 2010). Morphophenological characteristicsof quinoa show that there is a huge diversity invarieties or local ecotypes (del Castillo et al. 2007).Therefore, available commercial quinoas exhibitwide genetic diversity, showing great variability inplant color, inflorescence and seeds, inflorescencetype, protein, saponin and betacyanine contents,and calcium oxalate crystals in leaves. Thisextreme variability may reflect wide adaptation to
6 Quinoa: Improvement and Sustainable Production
different agroecological conditions such as soil,rainfall, nutrients, temperature, altitude, drought,salinity, and UV-B radiation.
Quinoa is a dicotyledonous annual herba-ceous plant usually erect, with a height of about100–300 cm, depending on environmental con-ditions and genotype. Leaves are generally lobed,pubescent, powdery, rarely smooth, and alterna-tively inserted on a woody central stem. The plantmay be branched or unbranched, depending onvariety and sowing density. Stem color may begreen, red, or purple. The leafy flower cluster(a panicle with groups of flowers in glomerulus)arises predominantly from the top of the plantand may also arise from the leaf junction (axil) onthe stem. Flowers are sessile, of the same color asthe sepals, and may be hermaphrodite, pistillate,or male sterile. The stamens have short filamentsbearing basifixed anthers; the style has two orthree feathery stigma. The fruit occurs in anindehiscent achene, protected by the perigonium.The seeds are usually somewhat flat, measure1–2.6 mm, and approximately 250–500 seedscomprise 1 g. The seeds also exhibit a great varietyof colors – white, yellow, red, purple, brown, andblack, among others. Seed embryo can be up to60% of the seed weight and forms a ring aroundthe endosperm. The taproot (20–50 cm long) isprofusely branched and forms a dense web ofrootlets that penetrate to about the same depthas the plant height (National Research Council1989).
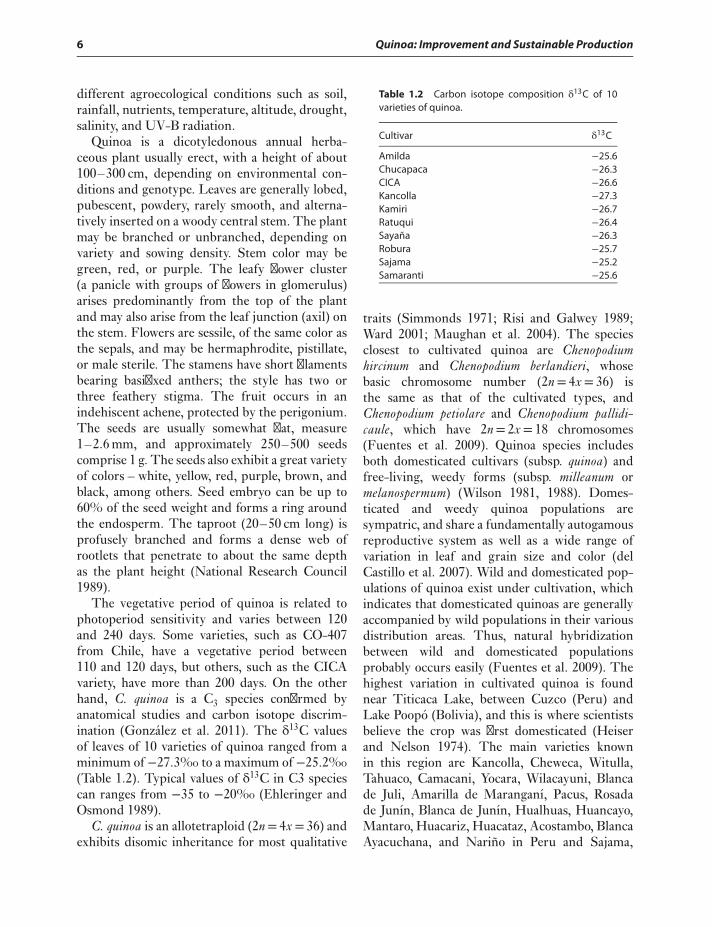
The vegetative period of quinoa is related tophotoperiod sensitivity and varies between 120and 240 days. Some varieties, such as CO-407from Chile, have a vegetative period between110 and 120 days, but others, such as the CICAvariety, have more than 200 days. On the otherhand, C. quinoa is a C3 species confirmed byanatomical studies and carbon isotope discrim-ination (González et al. 2011). The δ13C valuesof leaves of 10 varieties of quinoa ranged from aminimum of −27.3‰ to a maximum of −25.2‰(Table 1.2). Typical values of δ13C in C3 speciescan ranges from −35 to −20‰ (Ehleringer andOsmond 1989).
C. quinoa is an allotetraploid (2n= 4x= 36) andexhibits disomic inheritance for most qualitative
Table 1.2 Carbon isotope composition δ13C of 10varieties of quinoa.
Cultivar δ13C
Amilda −25.6Chucapaca −26.3CICA −26.6Kancolla −27.3Kamiri −26.7Ratuqui −26.4Sayaña −26.3Robura −25.7Sajama −25.2Samaranti −25.6
traits (Simmonds 1971; Risi and Galwey 1989;Ward 2001; Maughan et al. 2004). The speciesclosest to cultivated quinoa are Chenopodiumhircinum and Chenopodium berlandieri, whosebasic chromosome number (2n= 4x= 36) isthe same as that of the cultivated types, andChenopodium petiolare and Chenopodium pallidi-caule, which have 2n= 2x= 18 chromosomes(Fuentes et al. 2009). Quinoa species includesboth domesticated cultivars (subsp. quinoa) andfree-living, weedy forms (subsp. milleanum ormelanospermum) (Wilson 1981, 1988). Domes-ticated and weedy quinoa populations aresympatric, and share a fundamentally autogamousreproductive system as well as a wide range ofvariation in leaf and grain size and color (delCastillo et al. 2007). Wild and domesticated pop-ulations of quinoa exist under cultivation, whichindicates that domesticated quinoas are generallyaccompanied by wild populations in their variousdistribution areas. Thus, natural hybridizationbetween wild and domesticated populationsprobably occurs easily (Fuentes et al. 2009). Thehighest variation in cultivated quinoa is foundnear Titicaca Lake, between Cuzco (Peru) andLake Poopó (Bolivia), and this is where scientistsbelieve the crop was first domesticated (Heiserand Nelson 1974). The main varieties knownin this region are Kancolla, Cheweca, Witulla,Tahuaco, Camacani, Yocara, Wilacayuni, Blancade Juli, Amarilla de Maranganí, Pacus, Rosadade Junín, Blanca de Junín, Hualhuas, Huancayo,Mantaro, Huacariz, Huacataz, Acostambo, BlancaAyacuchana, and Nariño in Peru and Sajama,
Quinoa: An Incan Crop to Face Global Changes in Agriculture 7
Real Blanca, Chucapaca, Kamiri, Huaranga,Pasancalla, Pandela, Tupiza. Jachapucu, WilaCoymini, Kellu, Uthusaya, Chullpi, Kaslali,and Chillpi in Bolivia (Hernández Bermejo andLeón 1994). Throughout the Andean region,there are several genebanks where over 2,500quinoa accessions are preserved in cold-storagerooms: in Peru, at the experimental stations ofCamacani and Illpa (Puno), K’ayra and Andenes(Cuzco), Canaan (Ayacucho), Mantaro y SantaAna (Huancayo), Baños del Inca (Cajamarca); inBolivia, at the Patacamaya station of the IBTA;and in Ecuador, at the Santa Catalina station ofINIAP.
QUINOA AND ENVIRONMENTALSTRESSES: DROUGHT AND SALINITY
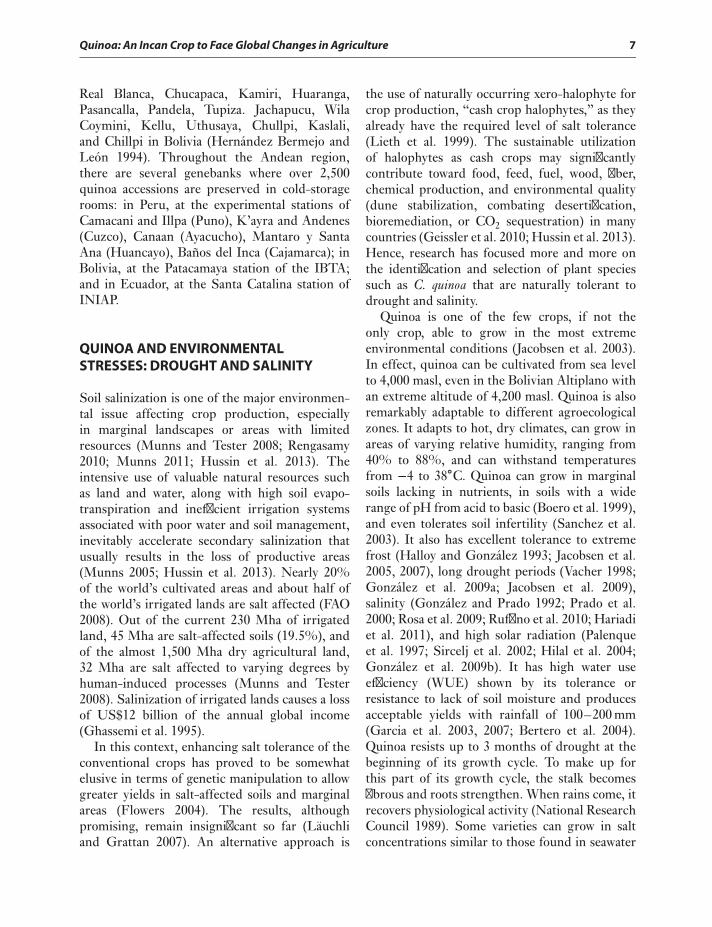
Soil salinization is one of the major environmen-tal issue affecting crop production, especiallyin marginal landscapes or areas with limitedresources (Munns and Tester 2008; Rengasamy2010; Munns 2011; Hussin et al. 2013). Theintensive use of valuable natural resources suchas land and water, along with high soil evapo-transpiration and inefficient irrigation systemsassociated with poor water and soil management,inevitably accelerate secondary salinization thatusually results in the loss of productive areas(Munns 2005; Hussin et al. 2013). Nearly 20%of the world’s cultivated areas and about half ofthe world’s irrigated lands are salt affected (FAO2008). Out of the current 230 Mha of irrigatedland, 45 Mha are salt-affected soils (19.5%), andof the almost 1,500 Mha dry agricultural land,32 Mha are salt affected to varying degrees byhuman-induced processes (Munns and Tester2008). Salinization of irrigated lands causes a lossof US$12 billion of the annual global income(Ghassemi et al. 1995).
In this context, enhancing salt tolerance of theconventional crops has proved to be somewhatelusive in terms of genetic manipulation to allowgreater yields in salt-affected soils and marginalareas (Flowers 2004). The results, althoughpromising, remain insignificant so far (Läuchliand Grattan 2007). An alternative approach is
the use of naturally occurring xero-halophyte forcrop production, “cash crop halophytes,” as theyalready have the required level of salt tolerance(Lieth et al. 1999). The sustainable utilizationof halophytes as cash crops may significantlycontribute toward food, feed, fuel, wood, fiber,chemical production, and environmental quality(dune stabilization, combating desertification,bioremediation, or CO2 sequestration) in manycountries (Geissler et al. 2010; Hussin et al. 2013).Hence, research has focused more and more onthe identification and selection of plant speciessuch as C. quinoa that are naturally tolerant todrought and salinity.
Quinoa is one of the few crops, if not theonly crop, able to grow in the most extremeenvironmental conditions (Jacobsen et al. 2003).In effect, quinoa can be cultivated from sea levelto 4,000 masl, even in the Bolivian Altiplano withan extreme altitude of 4,200 masl. Quinoa is alsoremarkably adaptable to different agroecologicalzones. It adapts to hot, dry climates, can grow inareas of varying relative humidity, ranging from40% to 88%, and can withstand temperaturesfrom −4 to 38∘C. Quinoa can grow in marginalsoils lacking in nutrients, in soils with a widerange of pH from acid to basic (Boero et al. 1999),and even tolerates soil infertility (Sanchez et al.2003). It also has excellent tolerance to extremefrost (Halloy and González 1993; Jacobsen et al.2005, 2007), long drought periods (Vacher 1998;González et al. 2009a; Jacobsen et al. 2009),salinity (González and Prado 1992; Prado et al.2000; Rosa et al. 2009; Ruffino et al. 2010; Hariadiet al. 2011), and high solar radiation (Palenqueet al. 1997; Sircelj et al. 2002; Hilal et al. 2004;González et al. 2009b). It has high water useefficiency (WUE) shown by its tolerance orresistance to lack of soil moisture and producesacceptable yields with rainfall of 100–200 mm(Garcia et al. 2003, 2007; Bertero et al. 2004).Quinoa resists up to 3 months of drought at thebeginning of its growth cycle. To make up forthis part of its growth cycle, the stalk becomesfibrous and roots strengthen. When rains come, itrecovers physiological activity (National ResearchCouncil 1989). Some varieties can grow in saltconcentrations similar to those found in seawater
8 Quinoa: Improvement and Sustainable Production
(40 dS/m) and even higher, well above thethreshold for any known crop species (Hariadiet al. 2011; Razzaghi et al. 2011).
Salt tolerance is a complex trait and attributedto a plethora of interconnected morphologi-cal, physiological, biochemical, and molecularmechanisms. These mechanisms are linked tothe major constraints of salinity on plant growth(i.e., osmotic effects, restriction of CO2 gasexchange, ion toxicity, and nutritional imbalance)and operate in coordination to alleviate both thecellular hyperosmolarity and ion disequilibrium(Koyro 2006; Flowers and Colmer 2008; Geissleret al. 2009). The primary deleterious effectof soil salinity on plant growth is due to anosmotic effect, resulting from the lower soil waterpotential (Ψ), defined as the work water can doas it moves from its present state to the referencestate. The reference state is the energy of a poolof pure water at an elevation defined to be zero(Munns 2002; Koyro et al. 2012). A low valueof (Ψ) interferes with plant ability to take upwater from the soil and, hence, causes a growthreduction, along with a range of physiologicaland biochemical changes similar to those causedby water deficit (Larcher 2001; Schulze et al.2002; Munns 2005). To endure osmotic con-straint, salt-tolerant plants are more restrictivewith water loss via transpiration by a sensitivestomatal closure response. Inevitably, this leadsto a decrease in the apparent photosynthetic ratedue to a restricted availability of CO2 for thecarboxylation reaction (stomatal limitation ofphotosynthesis) (Huchzermeyer and Koyro 2005;Flexas et al. 2007; Dasgupta et al. 2011; Benzartiet al. 2012), thereby suppressing plant growthand productivity (D’Souza and Devaraj 2010;Gorai et al. 2011; Tarchoune et al. 2012; Yan et al.2013).
According to several studies, quinoa toleranceto drought and salinity stresses is dependenton its vegetative stage (Bosque Sanchez et al.2003; Garcia et al. 2003; Jacobsen et al. 2003).At the cotyledonary stage, the high adaptabilityof quinoa to soil salinity is related to metabolicadjustment. In studies carried out with seedlingsof the Sajama cultivar, it was demonstrated thatsalinity tolerance depends on improved metabolic
control of ion absorption and osmotic adjustmentthrough osmolyte accumulation derived from asalt-induced altered carbohydrate metabolism(Rosa et al. 2009; Ruffino et al. 2010), whereasin early maturing stage, it is also related tostructural and physiological adaptations. In thisway, quinoa avoids the negative effects of droughtthrough the development of a deep and dense rootsystem, reduction of the leaf area, leaf dropping,special vesicular glands (salt bladders), smalland thick-walled cells adapted to losses of waterwithout loss of turgor even at severe water losses,and stomatal closure (Jensen et al. 2000; Adolfet al. 2013).
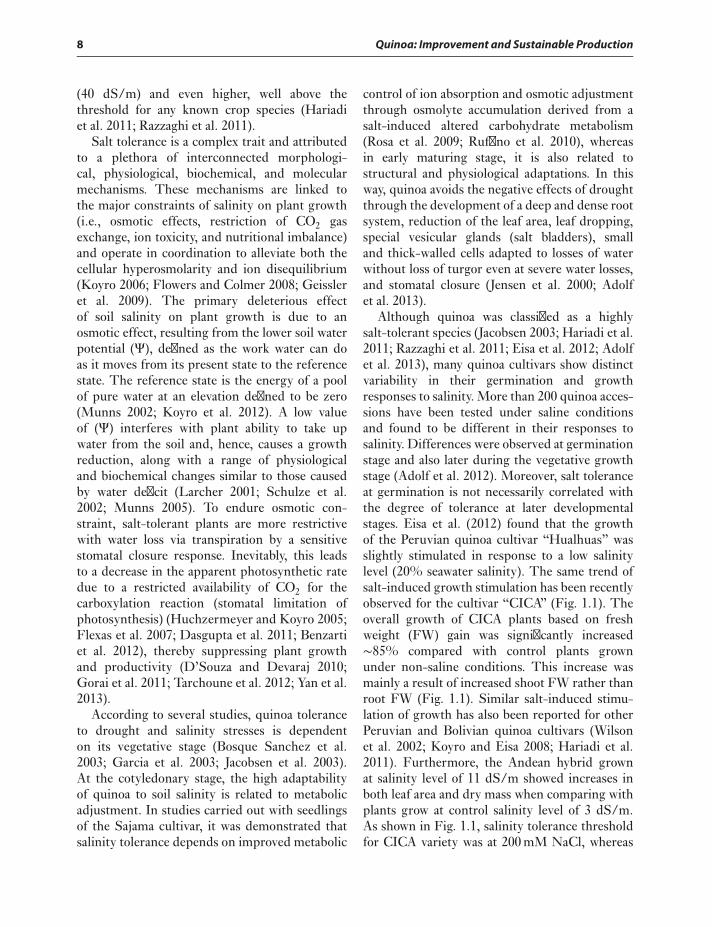
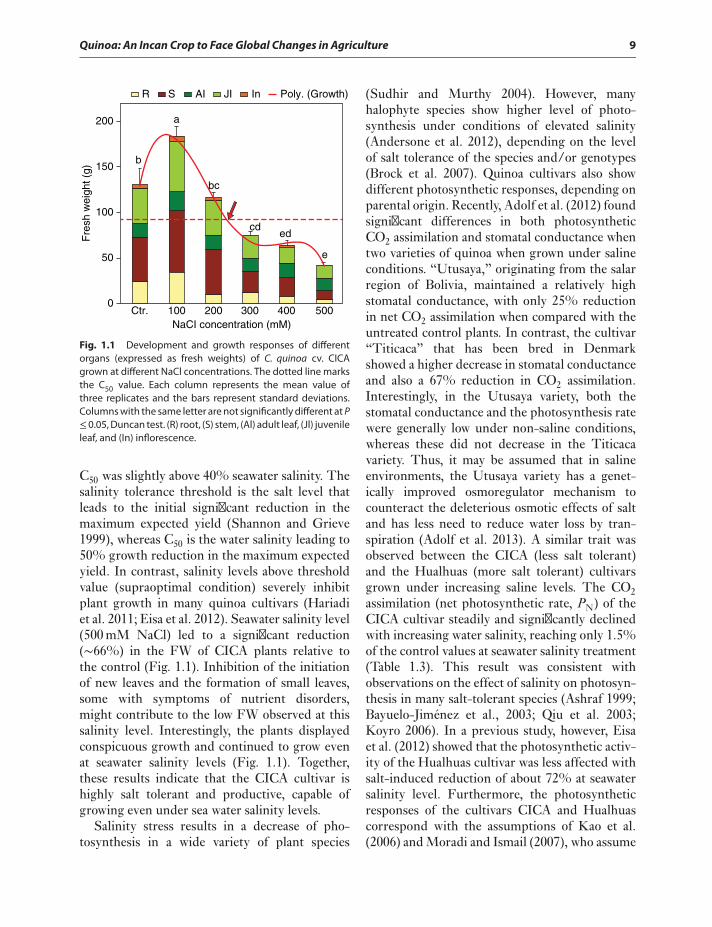
Although quinoa was classified as a highlysalt-tolerant species (Jacobsen 2003; Hariadi et al.2011; Razzaghi et al. 2011; Eisa et al. 2012; Adolfet al. 2013), many quinoa cultivars show distinctvariability in their germination and growthresponses to salinity. More than 200 quinoa acces-sions have been tested under saline conditionsand found to be different in their responses tosalinity. Differences were observed at germinationstage and also later during the vegetative growthstage (Adolf et al. 2012). Moreover, salt toleranceat germination is not necessarily correlated withthe degree of tolerance at later developmentalstages. Eisa et al. (2012) found that the growthof the Peruvian quinoa cultivar “Hualhuas” wasslightly stimulated in response to a low salinitylevel (20% seawater salinity). The same trend ofsalt-induced growth stimulation has been recentlyobserved for the cultivar “CICA” (Fig. 1.1). Theoverall growth of CICA plants based on freshweight (FW) gain was significantly increased∼85% compared with control plants grownunder non-saline conditions. This increase wasmainly a result of increased shoot FW rather thanroot FW (Fig. 1.1). Similar salt-induced stimu-lation of growth has also been reported for otherPeruvian and Bolivian quinoa cultivars (Wilsonet al. 2002; Koyro and Eisa 2008; Hariadi et al.2011). Furthermore, the Andean hybrid grownat salinity level of 11 dS/m showed increases inboth leaf area and dry mass when comparing withplants grow at control salinity level of 3 dS/m.As shown in Fig. 1.1, salinity tolerance thresholdfor CICA variety was at 200 mM NaCl, whereas
Quinoa: An Incan Crop to Face Global Changes in Agriculture 9
Ctr. 100 200NaCI concentration (mM)
300 400 5000
50
100
150
200
b
a
bc
cded
e
Fre
sh w
eigh
t (g)
R S AI JI In Poly. (Growth)
Fig. 1.1 Development and growth responses of differentorgans (expressed as fresh weights) of C. quinoa cv. CICAgrown at different NaCl concentrations. The dotted line marksthe C50 value. Each column represents the mean value ofthree replicates and the bars represent standard deviations.Columns with the same letter are not significantly different at P≤0.05, Duncan test. (R) root, (S) stem, (Al) adult leaf, (Jl) juvenileleaf, and (In) inflorescence.
C50 was slightly above 40% seawater salinity. Thesalinity tolerance threshold is the salt level thatleads to the initial significant reduction in themaximum expected yield (Shannon and Grieve1999), whereas C50 is the water salinity leading to50% growth reduction in the maximum expectedyield. In contrast, salinity levels above thresholdvalue (supraoptimal condition) severely inhibitplant growth in many quinoa cultivars (Hariadiet al. 2011; Eisa et al. 2012). Seawater salinity level(500 mM NaCl) led to a significant reduction(∼66%) in the FW of CICA plants relative tothe control (Fig. 1.1). Inhibition of the initiationof new leaves and the formation of small leaves,some with symptoms of nutrient disorders,might contribute to the low FW observed at thissalinity level. Interestingly, the plants displayedconspicuous growth and continued to grow evenat seawater salinity levels (Fig. 1.1). Together,these results indicate that the CICA cultivar ishighly salt tolerant and productive, capable ofgrowing even under sea water salinity levels.
Salinity stress results in a decrease of pho-tosynthesis in a wide variety of plant species
(Sudhir and Murthy 2004). However, manyhalophyte species show higher level of photo-synthesis under conditions of elevated salinity(Andersone et al. 2012), depending on the levelof salt tolerance of the species and/or genotypes(Brock et al. 2007). Quinoa cultivars also showdifferent photosynthetic responses, depending onparental origin. Recently, Adolf et al. (2012) foundsignificant differences in both photosyntheticCO2 assimilation and stomatal conductance whentwo varieties of quinoa when grown under salineconditions. “Utusaya,” originating from the salarregion of Bolivia, maintained a relatively highstomatal conductance, with only 25% reductionin net CO2 assimilation when compared with theuntreated control plants. In contrast, the cultivar“Titicaca” that has been bred in Denmarkshowed a higher decrease in stomatal conductanceand also a 67% reduction in CO2 assimilation.Interestingly, in the Utusaya variety, both thestomatal conductance and the photosynthesis ratewere generally low under non-saline conditions,whereas these did not decrease in the Titicacavariety. Thus, it may be assumed that in salineenvironments, the Utusaya variety has a genet-ically improved osmoregulator mechanism tocounteract the deleterious osmotic effects of saltand has less need to reduce water loss by tran-spiration (Adolf et al. 2013). A similar trait wasobserved between the CICA (less salt tolerant)and the Hualhuas (more salt tolerant) cultivarsgrown under increasing saline levels. The CO2assimilation (net photosynthetic rate, PN) of theCICA cultivar steadily and significantly declinedwith increasing water salinity, reaching only 1.5%of the control values at seawater salinity treatment(Table 1.3). This result was consistent withobservations on the effect of salinity on photosyn-thesis in many salt-tolerant species (Ashraf 1999;Bayuelo-Jiménez et al., 2003; Qiu et al. 2003;Koyro 2006). In a previous study, however, Eisaet al. (2012) showed that the photosynthetic activ-ity of the Hualhuas cultivar was less affected withsalt-induced reduction of about 72% at seawatersalinity level. Furthermore, the photosyntheticresponses of the cultivars CICA and Hualhuascorrespond with the assumptions of Kao et al.(2006) and Moradi and Ismail (2007), who assume
10 Quinoa: Improvement and Sustainable Production
that relatively higher salt-tolerant species wouldhave less reduced net photosynthesis. On theother hand, the reduction of PN observed inCICA coincided with the progressive decreaseof stomatal conductance (CS), suggesting thatsalinity impacted the photosynthesis of CICAplants, at least partly, by an enhanced stomatalclosure. Positive correlations between PN and CShave been found in C. quinoa, Hualhaus cultivar(Eisa et al. 2012), Atriplex prostrata (Wang et al.1997), Atriplex nummularia and Atriplex hastata(Dunn and Neales 1993), Atriplex centralasiatica(Qiu et al. 2003), and Avicennia marina (Ball andFarquhar 1984).
According to Moradi and Ismail (2007) andCentritto et al. (2003), reduction of stomatalconductance is a significant way to decreasewater loss from the leaves via transpiration andcould be considered as an adaptive feature forsalt tolerance. In CICA plants, the salt-inducedreduction of CS gives a strong inhibition of thetranspiration rate (E), which reaches a minimumvalue at the highest salinity treatment (Table 1.3).This would contribute to conservation of waterand also maintain a positive water balance. In fact,lower values of E represent an additional adaptivemechanism for coping with high salinity levels,as it could reduce salt loading into leaves andhence prolong the leaf lifespan by maintaining asubtoxic level of salt (Everard et al. 1994; Koyro2006).
The coordinated regulation of CO2/H2O gasexchange is considered a key determinant forplant growth and biomass production under salineconditions (Romero-Aranda et al. 2001; Lu et al.
2002; Gulzar et al. 2003, 2005). In Hualhuas, Eisaet al. (2012) found that salt-induced reductionof transpiration rate was proportionally largerthan the photosynthetic rate, leading to improvedphotosynthetic water use efficiency (PWUE).However, this is not the case for CICA, as thesalt-induced reduction of photosynthetic rate wasproportionally larger than that of the transpira-tion rate, resulting in a marked decline of PWUE(Table 1.3). According to Naidoo and Mundree(1993) and Koyro (2000), increasing PWUEis an important adaptive feature for long-termsurvival of plants and would be an advantagein saline environments. This may explain therelatively lower salt tolerance of CICA comparedto Hualhaus. Interestingly, salt-induced reductionof PN in CICA showed a positive correlation withCS, but not with intercellular CO2 concentration(Ci) (Table 1.3), suggesting that Ci is not thelimiting factor for photosynthesis reduction inCICA under saline conditions.
Non-stomatal inhibition of photosynthesis insalt-stressed plants, particularly under severestress conditions, has also been reported forseveral other crop species such as Gossypiumhirsutum and Phaseolus vulgaris (Brugnoli andLauteri 1991), Oryza sativa (Dionisio-Sese andTobita 2000), Helianthus annuus (Steduto et al.2000), and Beta vulgaris (Dadkhah 2011), amongothers. This inhibition of photosynthetic capacityhas been attributed to an inhibited coupling factoractivity (Tezara et al. 2008), reduced carboxy-lation efficiency (Wise et al. 1992; Jia and Gray2004), reduced amount and/or activity of crucialphotosynthetic enzymes such as Rubisco (Parry
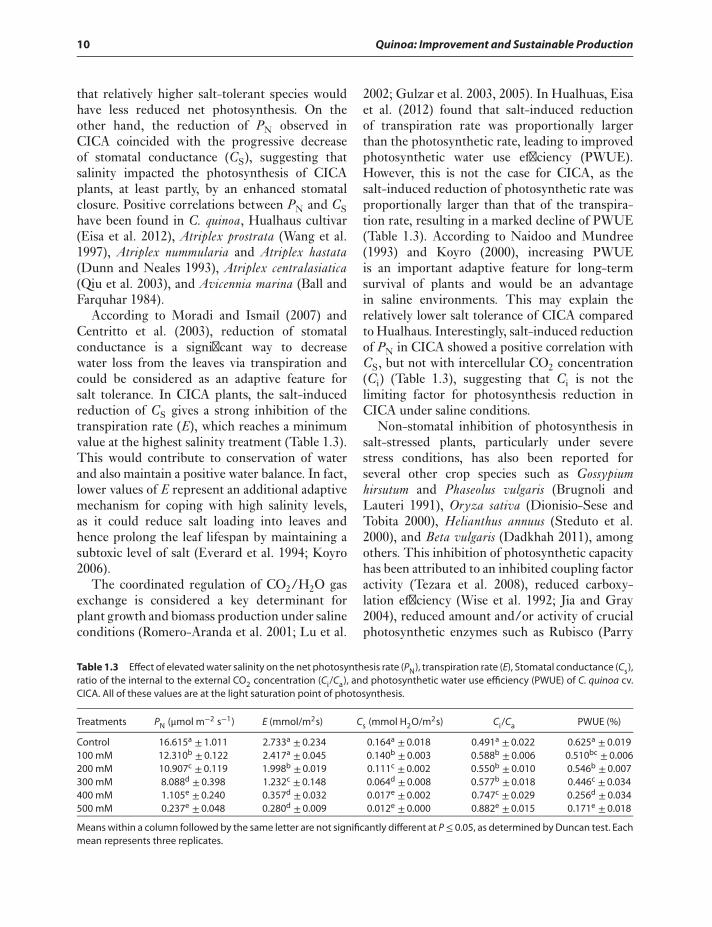
Table 1.3 Effect of elevated water salinity on the net photosynthesis rate (PN), transpiration rate (E), Stomatal conductance (Cs),ratio of the internal to the external CO2 concentration (Ci/Ca), and photosynthetic water use efficiency (PWUE) of C. quinoa cv.CICA. All of these values are at the light saturation point of photosynthesis.
Treatments PN (μmol m−2 s−1) E (mmol/m2s) Cs (mmol H2O/m2s) Ci/Ca PWUE (%)
Control 16.615a ± 1.011 2.733a ± 0.234 0.164a ± 0.018 0.491a ± 0.022 0.625a ± 0.019100 mM 12.310b ± 0.122 2.417a ± 0.045 0.140b ± 0.003 0.588b ± 0.006 0.510bc ± 0.006200 mM 10.907c ± 0.119 1.998b ± 0.019 0.111c ± 0.002 0.550b ± 0.010 0.546b ± 0.007300 mM 8.088d ± 0.398 1.232c ± 0.148 0.064d ± 0.008 0.577b ± 0.018 0.446c ± 0.034400 mM 1.105e ± 0.240 0.357d ± 0.032 0.017e ± 0.002 0.747c ± 0.029 0.256d ± 0.034500 mM 0.237e ± 0.048 0.280d ± 0.009 0.012e ± 0.000 0.882e ± 0.015 0.171e ± 0.018
Means within a column followed by the same letter are not significantly different at P ≤ 0.05, as determined by Duncan test. Eachmean represents three replicates.
Quinoa: An Incan Crop to Face Global Changes in Agriculture 11
et al. 2002), reduced ribulose-1,5-bisphosphate(RuBP) regeneration (Giménez et al. 1992;Gunasekera and Berkowitz 1993), and reductionof the contents of photosynthetic pigments(Seemann and Critchley 1985; Hajar et al. 1996;Koyro 2006).
Salinity and drought may also impair pho-tosynthesis by disturbing the photochemicalreactions in the chloroplast (Tezara et al. 2005;Hura et al. 2007). Furthermore, as an indirectconsequence of stomatal closure induced by saltand/or drought stress, restriction in intercellularCO2 concentration should increase suscepti-bility to photochemical damages as excessivelight energy at PSII level increases when CO2assimilation rates are low (Silva et al. 2010). Thiseffect, however, seems to be species specific.For example, sorghum (Sorghum bicolor) plantssubjected to salt stress showed a strong distur-bance of photochemical activity (Netondo et al.2004), whereas cowpea (Vigna unguiculata) plantssubjected to progressive drought displayed slightchanges in the PSII activity (Souza et al. 2004).Moreover, it has been demonstrated that stomatalclosure reduces the CO2/O2 ratio in leaves andinhibits the fixation of CO2, which induces anincreased ROS generation via enhanced leakageof electrons to oxygen (Foyer and Noctor 2000).Therefore, in salt-treated plants, a low rate ofCO2 assimilation can result in oxidative stress.
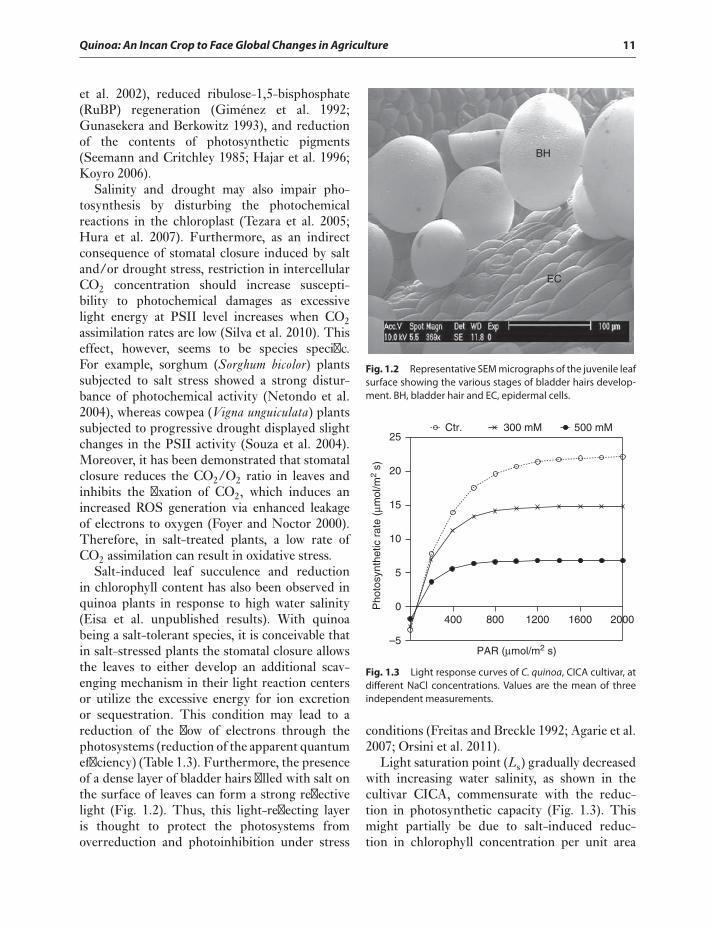
Salt-induced leaf succulence and reductionin chlorophyll content has also been observed inquinoa plants in response to high water salinity(Eisa et al. unpublished results). With quinoabeing a salt-tolerant species, it is conceivable thatin salt-stressed plants the stomatal closure allowsthe leaves to either develop an additional scav-enging mechanism in their light reaction centersor utilize the excessive energy for ion excretionor sequestration. This condition may lead to areduction of the flow of electrons through thephotosystems (reduction of the apparent quantumefficiency) (Table 1.3). Furthermore, the presenceof a dense layer of bladder hairs filled with salt onthe surface of leaves can form a strong reflectivelight (Fig. 1.2). Thus, this light-reflecting layeris thought to protect the photosystems fromoverreduction and photoinhibition under stress
BH
EC
Fig. 1.2 Representative SEM micrographs of the juvenile leafsurface showing the various stages of bladder hairs develop-ment. BH, bladder hair and EC, epidermal cells.
400 800
PAR (μmol/m2 s)
1200 1600 2000
–5
0
5
10
15
20
25Ctr. 300 mM 500 mM
Pho
tosy
nthe
tic r
ate
(μm
ol/m
2 s)
Fig. 1.3 Light response curves of C. quinoa, CICA cultivar, atdifferent NaCl concentrations. Values are the mean of threeindependent measurements.
conditions (Freitas and Breckle 1992; Agarie et al.2007; Orsini et al. 2011).
Light saturation point (Ls) gradually decreasedwith increasing water salinity, as shown in thecultivar CICA, commensurate with the reduc-tion in photosynthetic capacity (Fig. 1.3). Thismight partially be due to salt-induced reduc-tion in chlorophyll concentration per unit area
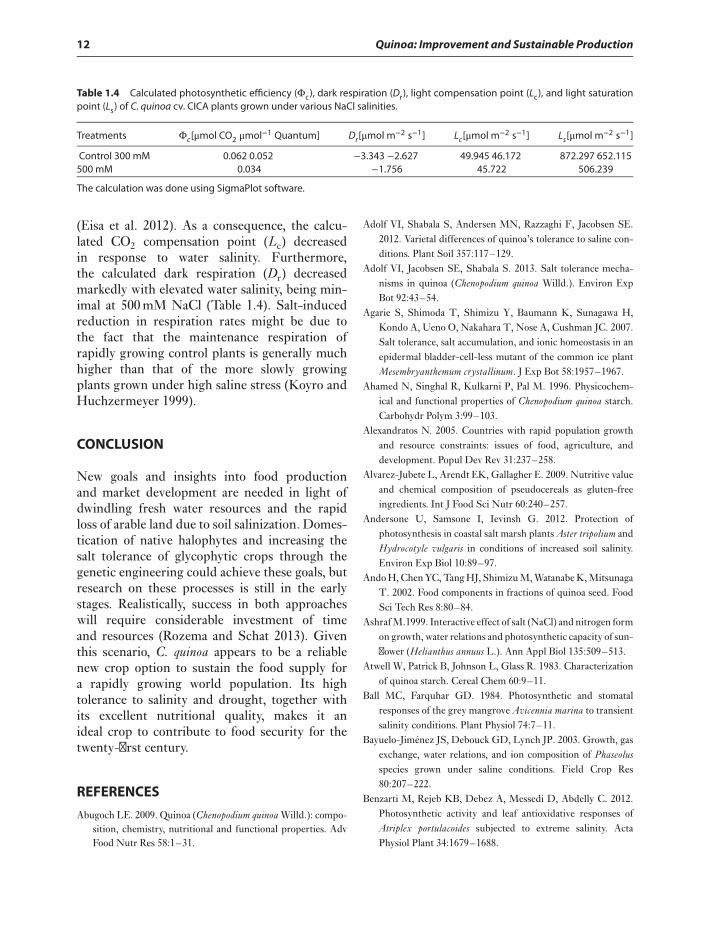
12 Quinoa: Improvement and Sustainable Production
Table 1.4 Calculated photosynthetic efficiency (Φc), dark respiration (Dr), light compensation point (Lc), and light saturationpoint (Ls) of C. quinoa cv. CICA plants grown under various NaCl salinities.
Treatments Φc[μmol CO2 μmol−1 Quantum] Dr[μmol m−2 s−1] Lc[μmol m−2 s−1] Ls[μmol m−2 s−1]
Control 300 mM 0.062 0.052 −3.343 −2.627 49.945 46.172 872.297 652.115500 mM 0.034 −1.756 45.722 506.239
The calculation was done using SigmaPlot software.
(Eisa et al. 2012). As a consequence, the calcu-lated CO2 compensation point (Lc) decreasedin response to water salinity. Furthermore,the calculated dark respiration (Dr) decreasedmarkedly with elevated water salinity, being min-imal at 500 mM NaCl (Table 1.4). Salt-inducedreduction in respiration rates might be due tothe fact that the maintenance respiration ofrapidly growing control plants is generally muchhigher than that of the more slowly growingplants grown under high saline stress (Koyro andHuchzermeyer 1999).
CONCLUSION
New goals and insights into food productionand market development are needed in light ofdwindling fresh water resources and the rapidloss of arable land due to soil salinization. Domes-tication of native halophytes and increasing thesalt tolerance of glycophytic crops through thegenetic engineering could achieve these goals, butresearch on these processes is still in the earlystages. Realistically, success in both approacheswill require considerable investment of timeand resources (Rozema and Schat 2013). Giventhis scenario, C. quinoa appears to be a reliablenew crop option to sustain the food supply fora rapidly growing world population. Its hightolerance to salinity and drought, together withits excellent nutritional quality, makes it anideal crop to contribute to food security for thetwenty-first century.
REFERENCES
Abugoch LE. 2009. Quinoa (Chenopodium quinoa Willd.): compo-sition, chemistry, nutritional and functional properties. AdvFood Nutr Res 58:1–31.
Adolf VI, Shabala S, Andersen MN, Razzaghi F, Jacobsen SE.2012. Varietal differences of quinoa’s tolerance to saline con-ditions. Plant Soil 357:117–129.
Adolf VI, Jacobsen SE, Shabala S. 2013. Salt tolerance mecha-nisms in quinoa (Chenopodium quinoa Willd.). Environ ExpBot 92:43–54.
Agarie S, Shimoda T, Shimizu Y, Baumann K, Sunagawa H,Kondo A, Ueno O, Nakahara T, Nose A, Cushman JC. 2007.Salt tolerance, salt accumulation, and ionic homeostasis in anepidermal bladder-cell-less mutant of the common ice plantMesembryanthemum crystallinum. J Exp Bot 58:1957–1967.
Ahamed N, Singhal R, Kulkarni P, Pal M. 1996. Physicochem-ical and functional properties of Chenopodium quinoa starch.Carbohydr Polym 3:99–103.
Alexandratos N. 2005. Countries with rapid population growthand resource constraints: issues of food, agriculture, anddevelopment. Popul Dev Rev 31:237–258.
Alvarez-Jubete L, Arendt EK, Gallagher E. 2009. Nutritive valueand chemical composition of pseudocereals as gluten-freeingredients. Int J Food Sci Nutr 60:240–257.
Andersone U, Samsone I, Ievinsh G. 2012. Protection ofphotosynthesis in coastal salt marsh plants Aster tripolium andHydrocotyle vulgaris in conditions of increased soil salinity.Environ Exp Biol 10:89–97.
Ando H, Chen YC, Tang HJ, Shimizu M, Watanabe K, MitsunagaT. 2002. Food components in fractions of quinoa seed. FoodSci Tech Res 8:80–84.
Ashraf M.1999. Interactive effect of salt (NaCl) and nitrogen formon growth, water relations and photosynthetic capacity of sun-flower (Helianthus annuus L.). Ann Appl Biol 135:509–513.
Atwell W, Patrick B, Johnson L, Glass R. 1983. Characterizationof quinoa starch. Cereal Chem 60:9–11.
Ball MC, Farquhar GD. 1984. Photosynthetic and stomatalresponses of the grey mangrove Avicennia marina to transientsalinity conditions. Plant Physiol 74:7–11.
Bayuelo-Jiménez JS, Debouck GD, Lynch JP. 2003. Growth, gasexchange, water relations, and ion composition of Phaseolusspecies grown under saline conditions. Field Crop Res80:207–222.
Benzarti M, Rejeb KB, Debez A, Messedi D, Abdelly C. 2012.Photosynthetic activity and leaf antioxidative responses ofAtriplex portulacoides subjected to extreme salinity. ActaPhysiol Plant 34:1679–1688.
Quinoa: An Incan Crop to Face Global Changes in Agriculture 13
Bertero HD, De la Vega AJ, Correa G, Jacobsen SE, MujicaA. 2004. Genotype and genotype-by-environment inter-action effects for grain yield and grain size of quinoa(Chenopodium quinoa Willd.) as revealed by pattern analysisof multi-environment trials. Field Crop Res 89:299–318.
Bhargava A, Shukla S, Ohri D. 2006. Chenopodium quinoa - anIndian perspective. Ind Crop Prod 23:73–87.
Bhargava A, Shukla S, Ohri D. 2007. Genetic variability andinterrelationship among various morphological and qualitytraits in quinoa (Chenopodium quinoa Willd.). Field Crop Res101:104–116.
Boero C, González JA, Prado FE. 1999. Germination in differentvarieties of quinoa (Chenopodium quinoa Willd.) under differ-ent conditions of salinity and pH (In Spanish). Primer TallerInternacional sobre Quinua. Recursos Genéticos y Sistemasde producción. Lima, Perú. Roma: FAO. Available from:www.rlc.fao.org/prior/segalim/prodalim/prodveg/cdrom/contenido/libro05/cap2.htm 103k.
Bosque Sanchez H, Lemeur R, Van Damme P, Jacobsen SE.2003. Ecophysiological analysis of drought and salinitystress in quinoa (Chenopodium quinoa Willd.). Food Rev Int19:111–119.
Brinegar C, Goundan S. 1993. Isolation and characterizationof chenopodin, the 11S seed storage protein of quinoa(Chenopodium quinoa). J Agric Food Chem 41:182–185.
Brock J, Aboling S, Stelzer R, Esch E, Papenbrock J.2007. Genetic variation among different populations ofAster tripolium grown on naturally and anthropogenicsalt-contaminated habitats: implications for conservationstrategies. J Plant Res 120:99–112.
Brugnoli E, Lauteri M. 1991. Effects of salinity on stomatalconductance, photosynthetic capacity, and carbon isotopediscrimination of salt tolerant (Gossypium hirsutum L.) andsalt-sensitive (Phaseolus vulgaris L.) C3 non-halophytes. PlantPhysiol 95:628–635.
del Castillo C, Winkel T, Mahy G, Bizoux JP. 2007. Geneticstructure of quinoa (Chenopodium quinoa Willd.) from theBolivian altiplano as revealed by RAPD markers. Genet ResCrop Evol 54:897–905.
Centritto M, Loreto F, Chartzoulakis K. 2003. The use of lowCO2 to estimate diffusional and non-diffusional limitations ofphotosynthetic capacity of salt stressed olive saplings. PlantCell Environ 26:585–594.
Chakraborty S, Tiedemann AV, Teng PS. 2000. Climate change:potential impact on plant diseases. Environ Poll 108:317–326.
Comai S, Bertazzo A, Bailoni L, Zancato M, Costa CVL, Alle-gri G. 2007. The content of proteic and nonproteic (free andprotein-bound) tryptophan in quinoa and cereal flours. FoodChem 100:1350–1355.
Cortés Hogea, 1558. 2009. In: Tapia M, editor. La quinua. Histo-ria, distribución geográfica actual, producción y usos. RevistaAmbienta 99:104–119.
D’Souza MR, Devaraj VR. 2010. Biochemical responses ofhyacinth bean (Lablab purpureus L.) to salinity stress. ActaPhysiol Plant 32:341–353.
Dadkhah A. 2011. Effect of salinity on growth and leaf photosyn-thesis of two sugar beet (Beta vulgaris L.) cultivars. J Agr SciTech 13:1001–1012.
Dasgupta N, Nandy P, Das S. 2011. Photosynthesis and antiox-idative enzyme activities in five Indian mangroves with respectto their adaptability. Acta Physiol Plant 33:803–810.
Dini I, Tenore GC, Dini A. 2005. Nutritional and antinutritionalcomposition of Kancolla seeds: an interesting and underex-ploited andine food plant. Food Chem 92:125–132.
Dionisio-Sese ML, Tobita S. 2000. Effects of salinity on sodiumcontent and photosynthetic responses of rice seedlings differ-ing in salt tolerance. J Plant Physiol 157:54–58.
Dunn GM, Neales TF. 1993. Are the effects of salinity on growthand leaf gas-exchange related. Photosynthetica 29:33–42.
Ehleringer JR, Osmond CB. 1989. Stable isotopes. In: Pearcy RW,Ehleringer JR, Rundel PW, editors. Plant physiological ecol-ogy. Field methods and instrumentation. UK: Chapman andHall Ltd. pp. 281–300.
Eisa S, Hussin S, Geissler N, Koyro HW. 2012. Effect of NaClsalinity on water relations, photosynthesis and chemical com-position of quinoa (Chenopodium quinoa Willd.) as a potentialcash crop halophyte. Aust J Crop Sci 6:357–368.
Estrada A, Li B, Laarveld B. 1998. Adjuvant action ofChenopodium quinoa saponins on the induction of antibodyresponses to intragastric and intranasal administered antigensin mice. Comp Immunol Microb 21:225–236.
Everard JD, Gucci R, Kann SC, Flore JA, Loescher WH. 1994.Gas exchange and carbon partitioning in the leaves of celery(Apium graveolens L.) at various levels of root zone salinity.Plant Physiol 106:281–292.
Flexas J, Diaz-Espejo A, Galme’s J, Kaldenhoff H, Medrano A,Ribas-Carbo M. 2007. Rapid variations of mesophyll conduc-tance in response to changes in CO2 concentration aroundleaves. Plant Cell Environ 30:1284–1298.
Flowers TJ. 2004. Improving crop salt tolerance. J Exp Bot55:307–319.
Flowers TJ, Colmer TD. 2008. Salinity tolerance in halophytes.New Phytol 179:945–963.
Food and Agriculture Organization. 2006. Rural land sustainablemanagement (in Spanish). FAO/Japan Regional Projects inLatin America 1988–2006. Tokyo, Japan.
Food and Agriculture Organization. 2008. Land andplant nutrition management service. Available from:www.fao.org/ag/agl/agll/spush.
[FAO/WHO] Food and Agriculture Organization/World HealthOrganization of United Nations. 1990. Protein quality evalu-ation. Rome, Italy: Report of a Joint FAO/WHO Expert Con-sultation.
[FAO/WHO] Food and Agriculture Organization/World HealthOrganization of United Nations. 2010. Fats and fatty acidsin human nutrition: report of an expert consultation. Rome,Italy: Food and Nutrition Paper 91.
Foyer C, Noctor G. 2000. Tansley review 112. Oxygen processingin photosynthesis: regulation and signaling. New Phytol 146:359–388.
14 Quinoa: Improvement and Sustainable Production
Freitas H, Breckle SW. 1992. Importance of bladder hairs for salttolerance of field-grown Atriplex species from a Portuguesesalt marsh. Flora 187:283–297.
Friedman M. 1996. Nutritional value of proteins from differentfood sources. A review. J Agric Food Chem 44:6–29.
Fuentes FF, Maughan PJ, Jellen EN. 2009. Diversidad genéticay recursos genéticos para el mejoramiento de la quinoa(Chenopodium quinoa Willd). Rev Geogr Valpso 42:20–33.
Galvez Ranilla L, Apostolidis E, Genovese MI, Lajolo FM,Shetty K. 2009. Evaluation of indigenous grains fromthe Peruvian Andean region for antidiabetes and antihy-pertension potential using in vitro methods. J Med Food12:704–713.
Galwey NW, Leakey CLA, Price KR, Fenwick GR. 1990. Chem-ical composition and nutritional characteristics of quinoa(Chenopodium quinoa Willd.). Food Sci Nutr 42:245–261.
Gandarillas H. 1979. Genética y origen. In: Tapia ME, editor.Quinua y Kaniwa. Cultivos Andinos. Serie Libros y Mate-riales Educativos, vol. 49. Bogotá, Colombia: Instituto Inter-americano de Ciencias Agrícolas. pp. 45–64.
Garcia M, Raes D, Jacobsen SE. 2003. Evapotranspirationanalysis and irrigation requirements of quinoa (Chenopodiumquinoa) in the Bolivian highlands. Agric Water Manag60:119–134.
Garcia M, Raes D, Jacobsen SE, Michel T. 2007. Agroclimaticcontraints for rainfed agriculture in the Bolivian Altiplano. JArid Environ 71:109–121.
Geissler N, Hussin S, Koyro HW. 2009. Interactive effectsof NaCl salinity, elevated atmospheric CO2 concentrationon growth, photosynthesis, water relations and chemicalcomposition of the potential cash crop halophyte Astertripolium L. Environ Exp Bot 65:220–231.
Geissler N, Hussin S, Koyro HW. 2010. Elevated atmosphericCO2 concentration enhances salinity tolerance in Astertripolium L. Planta 231:583–594.
Ghassemi F, Jakeman AJ, Nix HA. 1995. Salinisation of land andwater resources: human causes, extent, management and casestudies. Wallingford, England: CAB International. p. 544.
Giménez C, Mitchell VJ, Lawlor DW. 1992. Regulation of pho-tosynthesis rate of two sunflower hybrids under water stress.Plant Physiol 98:516–524.
Gómez-Caravaca AM, Iafelice G, Lavini A, Pulvento C, CaboniMF, Marconi E. 2012. Phenolic compounds and saponins inquinoa samples (Chenopodium quinoa Willd.) grown under dif-ferent saline and nonsaline irrigation regimens. J Agric FoodChem 60:4620–4627.
González JA, Prado FE. 1992. Germination in relation to salinityand temperature in Chenopodium quinoa Willd. Agrochimica36:101–107.
González JA, Roldán A, Gallardo M, Escudero T, Prado FE.1989. Quantitative determinations of chemical compoundswith nutritional value from Inca crops: Chenopodium quinoa("quinoa"). Plant Foods Hum Nutr 39:331–337.
González JA, Gallardo M, Hilal M, Rosa M, Prado FE. 2009a.Physiological responses of quinoa (Chenopodium quinoa) to
drought and waterlogging stresses: dry matter partitioning.Bot Stud 50:35–42.
González JA, Rosa M, Parrado MF, Hilal M, Prado FE. 2009b.Morphological and physiological responses of two varieties ofa highland species (Chenopodium quinoa Willd.) growing undernear-ambient and strongly reduced solar UV-B in a lowlandlocation. J Photochem Photobiol B 96:144–151.
González JA, Bruno M, Valoy M, Prado FE. 2011. Genotypicvariation of gas exchange parameters and leaf stable carbonand nitrogen isotopes in ten quinoa cultivars grown underdrought. J Agron Crop Sci 197:81–93.
González JA, Konishi Y, Bruno M, Valoy M, Prado FE. 2012.Interrelationships among seed yield, total protein and aminoacid composition of ten quinoa (Chenopodium quinoa) cultivarsfrom two different agroecological regions. J Sci Food Agric92:1222–1229.
Gorai M, Ennajeh M, Khemira H, Neffati M. 2011. Influence ofNaCl-salinity on growth, photosynthesis, water relations andsolute accumulation in Phragmites australis. Acta Physiol Plant33:963–971.
Gorinstein S, Pawelzik E, Delgado-Licon E, Haruenkit R, WeiszM, Trakhtenberg S. 2002. Characterisation of pseudocerealand cereal proteins by protein and amino acid analyses. J SciFood Agric 82:886–891.
Gulzar S, Khan MA, Ungar IA. 2003. Salt tolerance of a coastalsalt marsh grass. Comm Soil Sci Plant Anal 34:2595–2605.
Gulzar S, Khan MA, Ungar IA, Liu X. 2005. Influence of salinityon growth and osmotic relations of Sporobolus ioclados. Pak JBot 37:119–129.
Gunasekera D, Berkowitz GA. 1993. Use of transgenic plants withRubisco antisense DNA to evaluate the rate limitation of pho-tosynthesis under water stress. Plant Physiol 103: 629–635.
Hajar AS, Zidan MA, Al-Zahrani HS. 1996. Effect of salinitystress on the germination, growth and some physiologicalactivities of black cumin (Nigella sativa L.). Arab Gulf J SciRes 14:445–454.
Halloy S, González JA. 1993. An inverse relation between frostsurvival and atmospheric pressure. Arct Alp Res 25:117–123.
Hariadi Y, Marandon K, Tian Y, Jacobsen SE, Shabala S. 2011.Ionic and osmotic relations in 10 quinoa (Chenopodium quinoaWilld.) plants grown at various salinity levels. J Exp Bot62:185–193.
Heiser CB, Nelson CD. 1974. On the origin of cultivatedChenopods (Chenopodium). Genetics 78:503–505.
Hernández Bermejo JE, León J. 1994. Neglected crops: 1492 froma different perspective. FAO Plant Production and ProtectionSeries. No. 26. p. 341.
Hevia F, Wilckens R, Berti M, Badilla R. 2001. Característicasdel almidón y contenido de proteína de quinoa (Chenopodiumquinoa W.) cultivada bajo diferentes niveles de nitrógeno enChillán. Agro Sur 29:42–50.
Hilal M, Parrado MF, Rosa M, Gallardo M, Massa EM, GonzálezJA, Prado FE. 2004. Epidermal lignin deposition in quinoacotyledons in response to UV-B radiation. Photochem Pho-tobiol 79:205–210.
Quinoa: An Incan Crop to Face Global Changes in Agriculture 15
Huchzermeyer B, Koyro HW. 2005. Salt and drought stresseffects on photosynthesis. In: Pessarakli M, editor. Handbookof photosynthesis. 2nd edition. Florida: CRC Press, Taylorand Francis Publishing Company. pp. 751–777.
Hunter, M.D. 2001. Effects of elevated atmospheric carbondioxide on insect-plant interactions. Agr Forest Entomol 3:153–159.
Hura T, Hura K, Grzesiak M, Rzepka A. 2007. Effect of longterm drought stress on leaf gas exchange and fluorescenceparameters in C3 and C4 plants. Acta Physiol Plant29:103–113.
Hussin S, Geissler N, Koyro HW. 2013. Effect of NaCl salinityon Atriplex nummularia (L.) with special emphasis on carbonand nitrogen metabolism. Acta Physiol Plant 35:1025–1038.
Intergovernmental Panel on Climate Change. 2007. ClimateChange 2007. Mitigation of Climate Change. In: MetzB, Davidson OR, Bosch PR, Dave R, Meyer LA, editors.Contribution of working group III to the fourth assessmentreport of the Intergovernmental Panel on Climate Change.Cambridge, MA: Cambridge University Press. p. 851.
Jacobsen SE. 1997. Adaptation of quinoa (Chenopodium quinoa)to Northern European agriculture: studies on developmentalpattern. Euphytica 96:41–48.
Jacobsen SE. 2003. The worldwide potential of quinoa(Chenopodium quinoa Willd.). Food Rev Int 19:167–177.
Jacobsen SE, Hill J, Stolen O. 1996. Stability of quantitativetraits in quinoa (Chenopodium quinoa Willd). Theo Appl Gen93:110–116.
Jacobsen SE, Mujica A, Jensen CR. 2003. The resistance of quinoa(Chenopodium quinoa Willd.) to adverse abiotic factors. FoodRev Int 19:99–109.
Jacobsen SE, Monteros C, Christiansen JL, Bravo LA, CorcueraLJ, Mujica A. 2005. Plant responses of quinoa (Chenopodiumquinoa Willd.) to frost at various phenological stages. Eur JAgron 22:131–139.
Jacobsen SE, Monteros C, Corcuera LJ, Bravo LA, ChristiansenJL, Mujica A. 2007. Frost resistance mechanisms in quinoa(Chenopodium quinoa Willd.). Eur J Agron 26:471–475.
Jacobsen SE, Liu F, Jensen CR. 2009. Does root-sourced ABAplay a role for regulation of stomata under drought in quinoa(Chenopodium quinoa Willd.). Sci Hort 122:281–287.
Jellen EN, Benlhabib O, Maughan PJ, Stevens MR, SederbergMDM, Bonifacio A, Coleman CE, Fairbanks DJ, JacobsenSE. 2005. Introduction of the Andean crop quinoa inMorocco. Soil and water management interaction oncrop yields. The ASA-CSSA-SSSA International AnnualMeetings, Salt Lake City, UT.
Jensen CR, Jacobsen SE, Andersen MN, Núñez N, Ander-sen SD, Rasmussen L, Mogensen VO. 2000. Leaf gasexchange and water relation characteristics of field quinoa(Chenopodium quinoa Willd.) during soil drying. Eur J Agron13:11–25.
Jia YS, Gray VM. 2004. Interrelationship between nitrogen sup-ply and photosynthetic parameters in Vicia faba L. Photosyn-thetica 41:605–610.
Jiang Q, Christen S, Shigenaga MK, Ames BN. 2001.γ-Tocopherol, the major form of vitamin E in the US diet,deserves more attention. Am J Clin Nutr 74:714–722.
Johnson DL, Ward SM. 1993. Quinoa. In: Janick J, Simon JE,editors. New Crops. New York, NY: Wiley. pp. 219–221.
Kao WY, Tsai TT, Tsai HC, Shih CN. 2006. Response of threeglycine species to salt stress. Environ Exp Bot 56:120–125.
Konishi Y, Hirano S, Tsuboi H, Wada M. 2004. Distribution ofminerals in quinoa (Chenopodium quinoa Willd ) seeds. BiosciBiotechnol Biochem 68:231–234.
Koyro HW. 2000. Effect of high NaCl-salinity on plant growth,leaf morphology, and ion composition in leaf tissues of Betavulgaris ssp. maritima. J Appl Bot-Angew Bot 74:67–73.
Koyro HW. 2006. Effect of salinity on growth, photosynthesis,water relations and solute composition of the potential cashcrop halophyte Plantago coronopus (L.). Environ Exp Bot56:136–146.
Koyro HW, Eisa SS. 2008. Effect of salinity on composition, via-bility and germination of seeds of Chenopodium quinoa Willd.Plant Soil 302:79–90.
Koyro HW, Huchzermeyer B. 1999. Salt and drought stresseffects on metabolic regulation in maize. In: Pessarakli M,editor. Handbook of plant and crop stress. 2nd edition. NewYork, NY: Marcel Dekker Inc. pp. 843–878.
Koyro HW, Ahmad P, Nicole G. 2012. Abiotic stress responsesin plants: an overview. In: Ahmad P, Prasad MNV, editors.Environmental adaptations and stress tolerance of plantsin the era of climate change. New York, NY: SpringerScience+Business Media. pp. 1–28.
Koziol MJ. 1992. Chemical composition and nutritional evalua-tion of quinoa. J Food Compos Anal 5:35–68.
Kuljanabhagavad T, Wink M. 2009. Biological activities andchemistry of saponins from Chenopodium quinoa Willd.Phytochem Rev 8:473–490.
Kuljanabhagavad T, Thongphasuk P, Chamulitrat W, Wink M.2008. Triterpene saponins from Chenopodium quinoa Willd.Phytochem 69:1919–1926.
Larcher W. 2001. Physiological plant ecology: ecophysiologyand stress physiology of functional. Heidelberg, Germany:Springer-Verlag. p. 513.
Läuchli A, Grattan SR. 2007. Plant growth and developmentunder salinity stress. In: Jenks MA, Hasegawa PA, Jain SM,editors. Advances in molecular-breeding towards salinity anddrought tolerance. Heidelberg, Germany: Springer-Verlag.p.1-31.
Cieza de León, 1560. 2009. In: Tapia M, editor. La quinua. Histo-ria, distribución geográfica actual, producción y usos. RevistaAmbienta 99:104–119.
Lieth H, Moschenko M, Lohmann M, Koyro HW, Hamdy A.1999. Halophyte uses in different climates I. Ecological andecophysiological studies. Progress in biometeorology. Volume13. Leiden, The Netherlands: Backhuys Publishers. p. 258.
Lu C, Qiu N, Lu Q, Wang B, Luang T. 2002. Does saltstress lead to increased susceptibility of photosystem II tophotoinhibition and changes in photosynthetic pigment
16 Quinoa: Improvement and Sustainable Production
composition in halophyte Suaeda salsa grown outdoors? PlantSci163:1063–1068.
Mastebroek H, Limburg H, Gilles T, Marvin H. 2000.Occurrence of sapogenins in leaves and seeds of quinoa(Chenopodium quinoa Willd). J Sci Food Agric 80:152–156.
Maughan J, Bonifacio A, Jellen E, Stevens M, Coleman C, RicksM, Mason S, Jarvis D, Gardunia B, Fairbanks D. 2004. Agenetic linkage map of quinoa (Chenopodium quinoa) basedon AFLP, RAPD, and SSR markers. Theor Appl Genet109:1188–1195.
Montzka SA, Dlugokencky EJ, Butler JH. 2011. Non-CO2 green-house gases and climate change. Nature 476:43–50.
Moradi F, Ismail AM. 2007. Responses of photosynthesis,chlorophyll fluorescence and ROS-scavenging systems to saltstress during seedling and reproductive stages in rice. AnnBot 99:1161–1173.
Munns R. 2002. Comparative physiology of salt and water stress.Plant Cell Environ 25:239–250.
Munns R. 2005. Genes and salt tolerance: bringing them together.New Phytol 167: 645–663.
Munns R. 2011. Plant adaptations to salt and water stress: differ-ences and commonalities. Adv Bot Res 57:1–32.
Munns R, Tester M. 2008. Mechanisms of salinity tolerance. AnnRev Plant Biol 59: 51–681.
Naidoo G, Mundree SG. 1993. Relationship between morpholog-ical and physiological responses to water logging and salinityin Sporobolus virginicus (L). Kunth Oecologia 93:360–366.
National Research Council. 1989. Lost crops of the Incas: littleknown plants of the Andes with promise for worldwide culti-vation. Washington, DC: National Academy Press. p. 415.
Netondo GW, Onyango JC, Beck E. 2004. Sorghum and salin-ity: II. Gas exchange and chlorophyll fluorescence of sorghumunder salt stress. Crop Sci 44:806–811.
Nuñez LA. 1974. La agricultura prehistorica en los Andes Merid-ionales. Universidad del Norte, Editorial Orbe. Santiago dehile, Chile. p. 197.
Orsini F, Accorsi M, Gianquinto G, Dinelli G, Antognoni F,Carrasco KBR, Martinez EA, Alnayef M, Marotti I, Bosi S,Biondi S. 2011. Beyond the ionic and osmotic response tosalinity in Chenopodium quinoa: functional elements of suc-cessful halophytism. Funct Plant Biol 38:818–831.
Palenque ER, Andrade M, González JA, Forno R, Lairana V,Prado FE, Salcedo JC, Urcullo S. 1997. Effect of UVBradiation on quinoa (Chenopodium quinoa Willd.). Rev BolFis 3:120–128.
Parry MA, Andralojc PJ, Khan S, Lea P, Keys AJ. 2002. Rubiscoactivity: effects of drought stress. Ann Bot 89:833–839.
Parry M, Rosenzweig C, Livermore M. 2005. Climate change,global food supply and risk of hunger. Philos Trans R SocLond B Biol Sci 360:2125–2138.
Prado FE, Gallardo M, González JA. 1996. Presence ofsaponin-bodies in pericarp cells of Chenopodium quinoa Willd.(quinoa). Biocell 20:261–266.
Prado FE, Boero C, Gallardo M, González JA. 2000. Effect ofNaCl on growth germination and soluble sugars content
in Chenopodium quinoa Willd. seeds. Bot Bull Acad Sinica41:19–26.
Prado FE, Fernández-Turiel JL, Bruno M, Valoy M, Rosa M,González JA. 2010. Mineral content of seeds from quinoavarieties in Amaicha del Valle (Tucumán, Argentina). Biocell34(2):157
Prakash D, Nath P, Pal M. 1993. Composition, variation of nutri-tional contents in leaves, seed protein, fat and fatty acid profileof Chenopodium species. J Sci Food Agric 62:203–205.
Pulvento C, Riccardi M, Lavini A, d’Andria R, Iafelice G,Marconi E. 2010. Field trial evaluation of two Chenopodiumquinoa genotypes grown under rain-fed conditions in atypical Mediterranean environment in South Italy. J AgronCrop Sci 196:407–411.
Qiu QS, Barkla BJ, Vera-Estrella R, Zhu JK, Schumaker KS.2003. Na+/H+ exchange activity in the plasma membrane ofArabidopsis. Plant Physiol 132:1041–1052.
Ranhotra GS, Gelroth JA, Glaser BK, Lorenz KJ, Johnson DL.1993. Composition and protein nutritional quality of quinoa.Cereal Chem 70:303–305.
Razzaghi F, Ahmadi SH, Adolf VI, Jensen CR, Jacobsen SE,Andersen MN. 2011. Water relations and transpiration ofquinoa (Chenopodium quinoa Willd.) under salinity and soildrying. J Agron Crop Sci 197:348–360.
Rengasamy P. 2010. Soil processes affecting crop production insalt-affected soils. Funct Plant Biol 37:613–620.
Repo-Carrasco R, Espinoza C, Jacobsen SE. 2003. Nutritionalvalue and use of the Andean crops quinoa (Chenopodiumquinoa) and Kañiwa (Chenopodium pallidicaule). Food RevIntern 19:179–189.
Repo-Carrasco-Valencia RAM. 2011. Andean indigenous foodcrops: nutritional value and bioactive compounds. Ph.D.Thesis, University of Turku, Turku, Finland. p. 176.
Ridout CL, Price KR, DuPont MS, Parker ML, FenwickGR. 1991. Quinoa saponins-analysis and preliminaryinvestigations into the effects of reduction by processing. JSci Food Agric 54:165–176.
Risi J, Galwey NW. 1984. The chenopodium grains of the Andes:Inca crops for modern agriculture. Adv Appl Bot 10:145–216.
Risi J, Galwey NW. 1989. The pattern of genetic diversity in theAndean grain crop quinoa (Chenopodium (quinoa Willd.). I.Associations between characteristics. Euphytica 41: 147–162.
Rojas W, Soto JL, Pinto M, Jäger M, Padulosi S. 2010. GranosAndinos. Avances, logros y experiencias desarrolladasen quinua, cañahua y amaranto en Bolivia. Roma, Italia:Bioversity International. p. 178.
Romero-Aranda R, Soria T, Cuartero J. 2001. Tomatoplant-water uptake and plant-water relationships under salinegrowth conditions. Plant Sci 160:265–272.
Rosa M, Hilal M, González JA, Prado FE. 2009. Low-temperatureeffect on enzyme activities involved in sucrose-starch par-titioning in salt-stressed and salt-acclimated cotyledons ofquinoa (Chenopodium quinoa Willd.) seedlings. Plant PhysiolBiochem 47:300–307.
Quinoa: An Incan Crop to Face Global Changes in Agriculture 17
Rozema J, Schat H. 2013. Salt tolerance of halophytes, researchquestions reviewed in the perspective of saline agriculture.Environ Exp Bot 92:83–95.
Ruales J, Nair BM. 1992. Nutritional quality of the protein inquinoa (Chenopodium quinoa, Willd.) seeds. Plant Foods HumNutr 42:1–11.
Ruales J, Nair BM. 1993. Content of fat, vitamins and miner-als in quinoa (Chenopodium quinoa Willd.) seeds. Food Chem48:131–136.
Ruffino AMC, Rosa M, Hilal M, González JA, Prado FE. 2010.The role of cotyledon metabolism in the establishmentof quinoa (Chenopodium quinoa) seedlings growing undersalinity. Plant Soil 326:213–224.
Sanchez HB, Lemeur R, Van Damme P, Jacobsen SE. 2003.Ecophysiological analysis of drought and salinity stressof quinoa (Chenopodium quinoa Willd.). Food Rev Intern19:111–119.
Schlick D, Bubnehiem DL. 1993. Quinoa: an emerging “new”crop with potential for CELSS. Ames Research Center, Tech-nical Paper 3422. Moffett Field California: National Aeronau-tics and Space Administration.
Schoenlechner R, Wendner M, Siebenhandl-Ehn S, Berghofer E.2010. Pseudocereals as alternative sources for high folate con-tent in staple foods. J Cereal Sci 52:475–479.
Schulze DH, Polumuri SK, Gille T, Ruknudin A. 2002. Func-tional regulation of alternatively spliced Na+/Ca2+ exchanger(NCX1) isoforms. Ann NY Acad Sci 976:187–196.
Seemann JR, Critchley C. 1985. Effects of salt stress on thegrowth, ion content, stomatal behavior and photosyntheticcapacity of salt-sensitive species, Phaseolus vulgaris L. Planta164:151–162.
Shannon MC, Grieve CM. 1999. Tolerance of vegetable crops tosalinity. Sci Hort 78:5–38.
Silva EN, Ribeiro RV, Ferreira-Silva SL, Viégas RA, SilveiraJAG. 2010. Comparative effects of salinity and water stresson photosynthesis, water relations and growth of Jatrophacurcas plants. J Arid Environ 74:1130–1137.
Simmonds NW. 1971. The breeding system of Chenopodiumquinoa. I Male sterility Heredity 27:73–82.
Simopoulos AP. 2001. Evolutionary aspects of diet, theomega-6/omega-3 ratio and genetic variation: nutritionalimplications for chronic diseases. Biomed Pharmacother60:502–507.
Sircelj MR, Rosa MD, Parrado MF, González JA, Hilal M, PradoFE. 2002. Ultrastructural and metabolic changes induced byUV-B radiation in cotyledons of quinoa (Chenopodium quinoaWilld.). Biocell 26:180.
Solíz-Guerrero JB, Jasso de Rodriguez D, Rodríguez-GarcíaR, Angulo-Sánchez JL, Méndez-Padilla G. 2002. Quinoasaponins: concentration and composition analysis. In: JanickJ, Whipkey A, editors. Trends in new crops and new uses.Alexandria: ASHS Press. pp.110-114.
Solomon S, Plattner GK, Knott R, Friedlingstein P. 2009. Irre-versible climate change due to carbon dioxide emissions. ProcNatl Acad Sci U S A 106:1704–1709.
de Sotelo, 1583. 2009. In: Tapia M, editor. La quinua. Historia,distribución geográfica actual, producción y usos. RevistaAmbienta 99:104–119.
Souza RP, Machado EC, Silva JAB, Lagoa AMMA, Silveira JAG.2004. Photosynthetic gas exchange, chlorophyll fluorescenceand some associated metabolic changes in cowpea (Vignaunguiculata) during water stress and recovery. Environ ExpBot 51:45–56.
Steduto P, Albrizio R, Giorio P, Sorrentino G. 2000.Gas-exchange response and stomatal and non-stomatallimitations to carbon assimilation of sunflower under salinity.Environ Exp Bot 44:243–255.
Sudhir P, Murthy SDS. 2004. Effects of salt stress on basic pro-cesses of photosynthesis. Photosynthetica 42:481–486.
Tapia M. 2009. La quinua. Historia, distribución geográficaactual, producción y usos. Revista Ambienta 99:104–119.
Tarchoune I, Degl’Innocenti E, Kaddour R, Guidi L, Lachaal M,Navari-Izzo F, Ouerghi Z. 2012. Effects of NaCl or Na2SO4salinity on plant growth, ion content and photosynthetic activ-ity in Ocimum basilicum L. Acta Physiol Plant 34:607–615.
Tezara W, Marín O, Rengifo E, Martínez D, Herrera A. 2005.Photosynthesis and photoinhibition in two xerophytic shrubsduring drought. Photosynthetica 43:37–45.
Tezara W, Driscoll S, Lawlor DW. 2008. Partitioning of pho-tosynthetic electron flow between CO2 assimilation and O2reduction in sunflower plants under water deficit. Photosyn-thetica 46:127–134.
Thanapornpoonpong SN, Vearasilp S, Pawelzik E, Gorinstein S.2008. Influence of various nitrogen applications on proteinand amino acid profiles of amaranth and quinoa. J Agric FoodChem 56:11464–11470.
Triboi E, Martre P, Triboi-Blondel AM. 2003. Environmentally-induced changes in protein composition in developing grainsof wheat are related to changes in total protein content. J ExpBot 54:1731–1742.
Uhle M. 1919 La arqueología de Arica y Tacna. Boletín de laSociedad Ecuatoriana de Estudios Históricos Americanos III(7–8):1–48.
Ulloa Mogollón J. 1586. Relación de la provincial de los Collaguaspara la discripción de las Indias que su majestad manda hacer.En: Jimenez de la Espada M, editor. Relaciones geográficas delas Indias. Vol 1. Madrid, España.
Vacher JJ. 1998. Response of two main Andean crops, quinoa(Chenopodium quinoa Wild.) and papa amarga (Solanumjuzepczukii B.) to drought on the Bolivian altiplano:significance of local adaptation. Agric Ecosyst Environ68:99–108.
de la Vega G. 1966. El Inca. Royal commentaries of the Incas andgeneral history of Peru. Austin: University of Texas Press.
Wallington TJ, Srinivasan J, Nielsen OJ, Highwood EJ. 2004.Greenhouse gases and global warming. In: Sabljic A, editor.Environmental and ecological chemistry. Encyclopedia oflife support systems (EOLSS). Oxford, England: EOLSSPublishers. p. 27.
18 Quinoa: Improvement and Sustainable Production
Wang LW, Showalter AM, Ungar IA. 1997. Effect of growth,ion content and cell wall chemistry in Atriplex prostrata(Chenopodiaceae). Am J Bot 84:1247–1255.
Ward SM. 2001. A recessive allele inhibiting saponin synthesis intwo lines of Bolivian quinoa (Chenopodium quinoa Willd.). JHered 92:83–86.
Wilson HD. 1981. Genetic variation among South American pop-ulations of tetraploid Chenopodium sect. chenopodium subsect.cellulata. Syst Bot 6:380–398.
Wilson HD. 1988. Quinoa biosystematics II: free living popula-tions. Econ Bot 42:478–494.
Wilson C, Read JJ, Abo-Kassem E. 2002. Effect of mixed-saltsalinity on growth and ion relations of a quinoa and a wheatvariety. J Plant Nutr 25:2689–2704.
Wise RR, Frederick JR, Alm DM, Kramer DM, Hesketh JD,Crofts AR, Ort DR. 1992. Investigation of the limitations tophotosynthesis induced by leaf water deficit in field-grownsunflower (Helianthus annuus L.). Plant Cell Environ 15:755–756.
Woldemichael GM, Wink M. 2001 Identification and biologicalactivities of triterpenoid saponins from Chenopodium quinoa. JAgric Food Chem 49:2327–2332.
Wood SG, Lawson LD, Fairbanks DJ, Robison LR, AndersenWR. 1993. Seed lipid content and fatty acid composition ofthree quinoa cultivars. J Food Compos Anal 6:41–44.
Yan K, Shao H, Shao C, Chen P, Zhao S, Brestic M, ChenX. 2013.Physiological adaptive mechanisms of plantsgrown in saline soil and implications for sustainable salineagriculture in coastal zone. Acta Physiol Plant DOI:10.1007/s11738-013-1325-7.
Zhu N, Sheng S, Sang S, Jhoo JW, Bai N, Karwe M, RosenR, Ho CT. 2002. Triterpene saponins from debitteredquinoa (Chenopodium quinoa) seeds. J Agric Food Chem50:865–867.
Zuidmeer L, Goldhahn K, Rona RJ, Gislason D, MadsenC, Summers C, Sodergren E, Dahlstrom J, Lindner T,Sigurdardottir ST, et al. 2008. The prevalence of plantfood allergies: a systematic review. J Allergy Clin Immunol121:1210–1218.
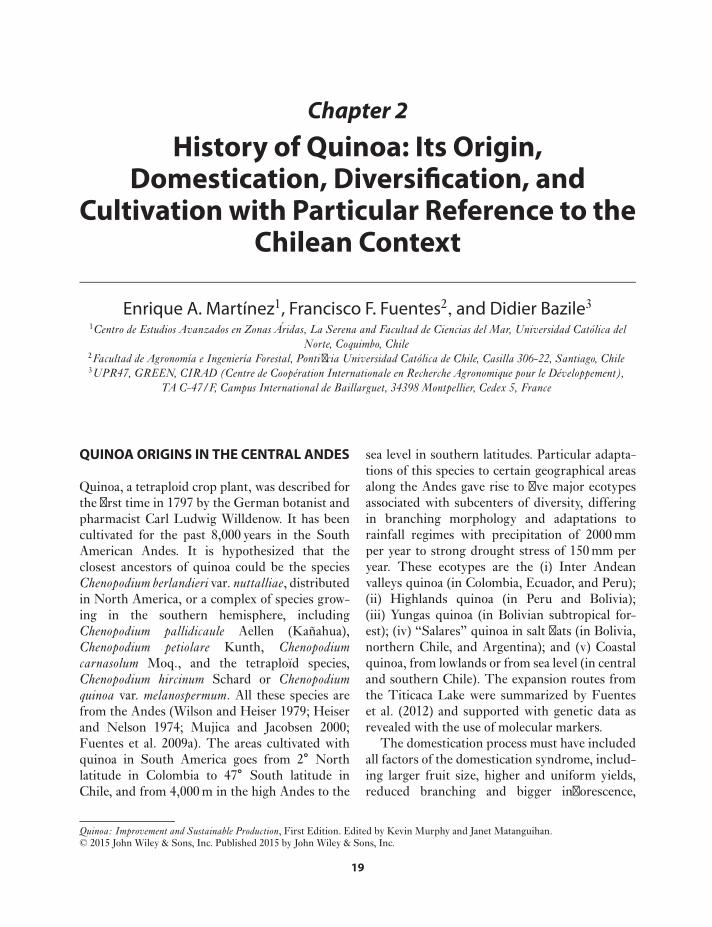
Chapter 2
History of Quinoa: Its Origin,Domestication, Diversification, and
Cultivation with Particular Reference to theChilean Context
Enrique A. Martínez1, Francisco F. Fuentes2, and Didier Bazile3
1Centro de Estudios Avanzados en Zonas Áridas, La Serena and Facultad de Ciencias del Mar, Universidad Católica delNorte, Coquimbo, Chile
2Facultad de Agronomía e Ingeniería Forestal, Pontificia Universidad Católica de Chile, Casilla 306-22, Santiago, Chile3UPR47, GREEN, CIRAD (Centre de Coopération Internationale en Recherche Agronomique pour le Développement),
TA C-47/F, Campus International de Baillarguet, 34398 Montpellier, Cedex 5, France
QUINOA ORIGINS IN THE CENTRAL ANDES
Quinoa, a tetraploid crop plant, was described forthe first time in 1797 by the German botanist andpharmacist Carl Ludwig Willdenow. It has beencultivated for the past 8,000 years in the SouthAmerican Andes. It is hypothesized that theclosest ancestors of quinoa could be the speciesChenopodium berlandieri var. nuttalliae, distributedin North America, or a complex of species grow-ing in the southern hemisphere, includingChenopodium pallidicaule Aellen (Kañahua),Chenopodium petiolare Kunth, Chenopodiumcarnasolum Moq., and the tetraploïd species,Chenopodium hircinum Schard or Chenopodiumquinoa var. melanospermum. All these species arefrom the Andes (Wilson and Heiser 1979; Heiserand Nelson 1974; Mujica and Jacobsen 2000;Fuentes et al. 2009a). The areas cultivated withquinoa in South America goes from 2∘ Northlatitude in Colombia to 47∘ South latitude inChile, and from 4,000 m in the high Andes to the
Quinoa: Improvement and Sustainable Production, First Edition. Edited by Kevin Murphy and Janet Matanguihan.© 2015 John Wiley & Sons, Inc. Published 2015 by John Wiley & Sons, Inc.
sea level in southern latitudes. Particular adapta-tions of this species to certain geographical areasalong the Andes gave rise to five major ecotypesassociated with subcenters of diversity, differingin branching morphology and adaptations torainfall regimes with precipitation of 2000 mmper year to strong drought stress of 150 mm peryear. These ecotypes are the (i) Inter Andeanvalleys quinoa (in Colombia, Ecuador, and Peru);(ii) Highlands quinoa (in Peru and Bolivia);(iii) Yungas quinoa (in Bolivian subtropical for-est); (iv) “Salares” quinoa in salt flats (in Bolivia,northern Chile, and Argentina); and (v) Coastalquinoa, from lowlands or from sea level (in centraland southern Chile). The expansion routes fromthe Titicaca Lake were summarized by Fuenteset al. (2012) and supported with genetic data asrevealed with the use of molecular markers.
The domestication process must have includedall factors of the domestication syndrome, includ-ing larger fruit size, higher and uniform yields,reduced branching and bigger inflorescence,
19
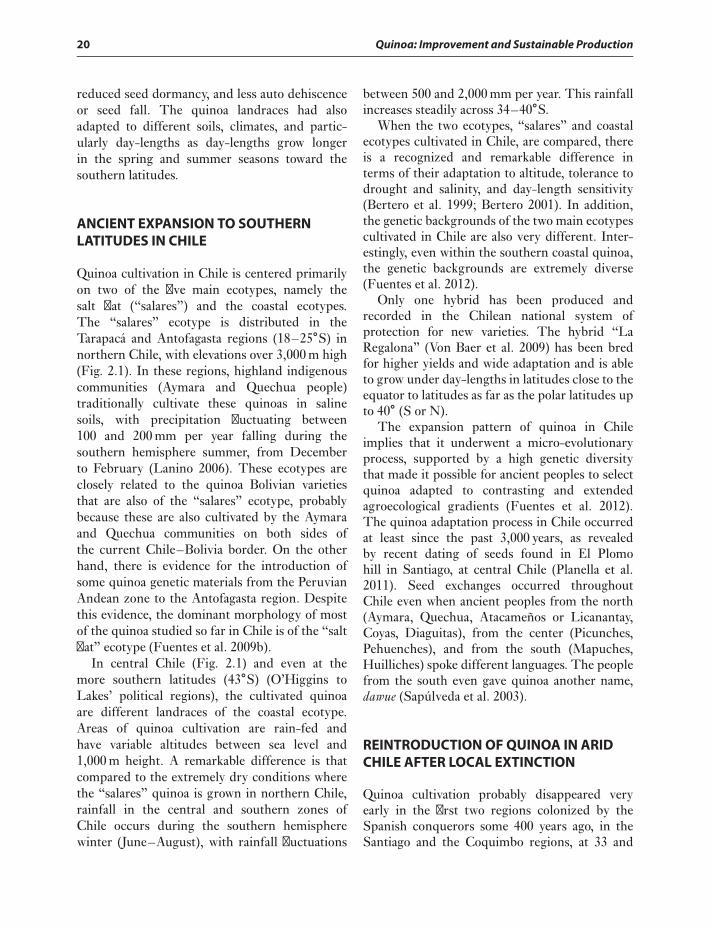
20 Quinoa: Improvement and Sustainable Production
reduced seed dormancy, and less auto dehiscenceor seed fall. The quinoa landraces had alsoadapted to different soils, climates, and partic-ularly day-lengths as day-lengths grow longerin the spring and summer seasons toward thesouthern latitudes.
ANCIENT EXPANSION TO SOUTHERNLATITUDES IN CHILE
Quinoa cultivation in Chile is centered primarilyon two of the five main ecotypes, namely thesalt flat (“salares”) and the coastal ecotypes.The “salares” ecotype is distributed in theTarapacá and Antofagasta regions (18–25∘S) innorthern Chile, with elevations over 3,000 m high(Fig. 2.1). In these regions, highland indigenouscommunities (Aymara and Quechua people)traditionally cultivate these quinoas in salinesoils, with precipitation fluctuating between100 and 200 mm per year falling during thesouthern hemisphere summer, from Decemberto February (Lanino 2006). These ecotypes areclosely related to the quinoa Bolivian varietiesthat are also of the “salares” ecotype, probablybecause these are also cultivated by the Aymaraand Quechua communities on both sides ofthe current Chile–Bolivia border. On the otherhand, there is evidence for the introduction ofsome quinoa genetic materials from the PeruvianAndean zone to the Antofagasta region. Despitethis evidence, the dominant morphology of mostof the quinoa studied so far in Chile is of the “saltflat” ecotype (Fuentes et al. 2009b).
In central Chile (Fig. 2.1) and even at themore southern latitudes (43∘S) (O’Higgins toLakes’ political regions), the cultivated quinoaare different landraces of the coastal ecotype.Areas of quinoa cultivation are rain-fed andhave variable altitudes between sea level and1,000 m height. A remarkable difference is thatcompared to the extremely dry conditions wherethe “salares” quinoa is grown in northern Chile,rainfall in the central and southern zones ofChile occurs during the southern hemispherewinter (June–August), with rainfall fluctuations
between 500 and 2,000 mm per year. This rainfallincreases steadily across 34–40∘S.
When the two ecotypes, “salares” and coastalecotypes cultivated in Chile, are compared, thereis a recognized and remarkable difference interms of their adaptation to altitude, tolerance todrought and salinity, and day-length sensitivity(Bertero et al. 1999; Bertero 2001). In addition,the genetic backgrounds of the two main ecotypescultivated in Chile are also very different. Inter-estingly, even within the southern coastal quinoa,the genetic backgrounds are extremely diverse(Fuentes et al. 2012).
Only one hybrid has been produced andrecorded in the Chilean national system ofprotection for new varieties. The hybrid “LaRegalona” (Von Baer et al. 2009) has been bredfor higher yields and wide adaptation and is ableto grow under day-lengths in latitudes close to theequator to latitudes as far as the polar latitudes upto 40∘ (S or N).
The expansion pattern of quinoa in Chileimplies that it underwent a micro-evolutionaryprocess, supported by a high genetic diversitythat made it possible for ancient peoples to selectquinoa adapted to contrasting and extendedagroecological gradients (Fuentes et al. 2012).The quinoa adaptation process in Chile occurredat least since the past 3,000 years, as revealedby recent dating of seeds found in El Plomohill in Santiago, at central Chile (Planella et al.2011). Seed exchanges occurred throughoutChile even when ancient peoples from the north(Aymara, Quechua, Atacameños or Licanantay,Coyas, Diaguitas), from the center (Picunches,Pehuenches), and from the south (Mapuches,Huilliches) spoke different languages. The peoplefrom the south even gave quinoa another name,dawue (Sapúlveda et al. 2003).
REINTRODUCTION OF QUINOA IN ARIDCHILE AFTER LOCAL EXTINCTION
Quinoa cultivation probably disappeared veryearly in the first two regions colonized by theSpanish conquerors some 400 years ago, in theSantiago and the Coquimbo regions, at 33 and
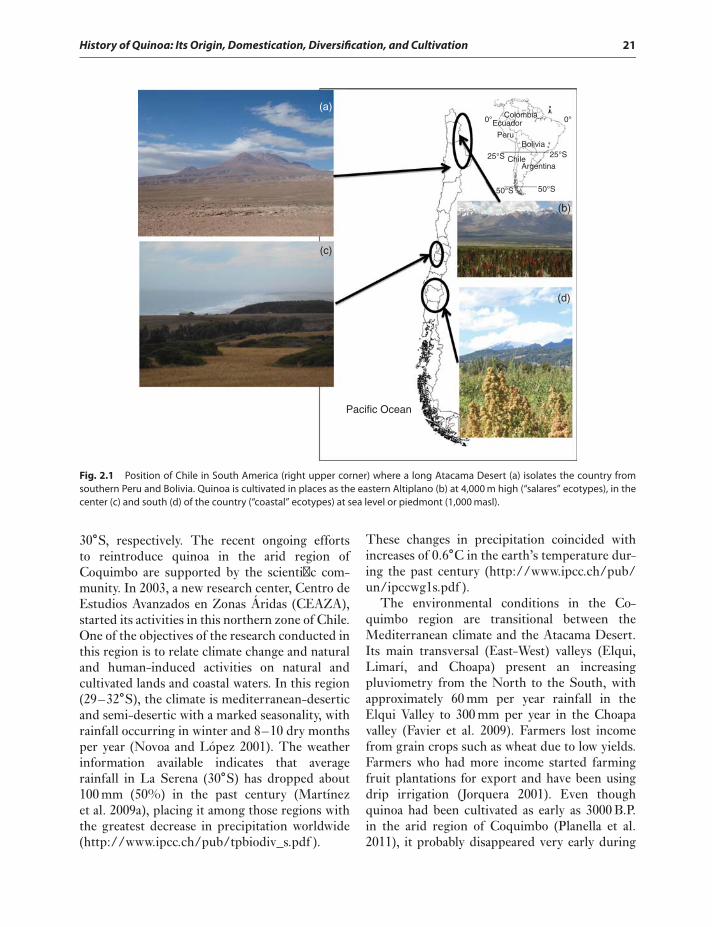
History of Quinoa: Its Origin, Domestication, Diversification, and Cultivation 21
PeruBolivia
Chile
EcuadorColombia
Argentina
25°S25°S
50°S50°S
0°0°
(a)
(c)
(b)
(d)
Pacific Ocean
Fig. 2.1 Position of Chile in South America (right upper corner) where a long Atacama Desert (a) isolates the country fromsouthern Peru and Bolivia. Quinoa is cultivated in places as the eastern Altiplano (b) at 4,000 m high (“salares” ecotypes), in thecenter (c) and south (d) of the country (“coastal” ecotypes) at sea level or piedmont (1,000 masl).
30∘S, respectively. The recent ongoing effortsto reintroduce quinoa in the arid region ofCoquimbo are supported by the scientific com-munity. In 2003, a new research center, Centro deEstudios Avanzados en Zonas Áridas (CEAZA),started its activities in this northern zone of Chile.One of the objectives of the research conducted inthis region is to relate climate change and naturaland human-induced activities on natural andcultivated lands and coastal waters. In this region(29–32∘S), the climate is mediterranean-deserticand semi-desertic with a marked seasonality, withrainfall occurring in winter and 8–10 dry monthsper year (Novoa and López 2001). The weatherinformation available indicates that averagerainfall in La Serena (30∘S) has dropped about100 mm (50%) in the past century (Martínezet al. 2009a), placing it among those regions withthe greatest decrease in precipitation worldwide(http://www.ipcc.ch/pub/tpbiodiv_s.pdf ).
These changes in precipitation coincided withincreases of 0.6∘C in the earth’s temperature dur-ing the past century (http://www.ipcc.ch/pub/un/ipccwg1s.pdf ).
The environmental conditions in the Co-quimbo region are transitional between theMediterranean climate and the Atacama Desert.Its main transversal (East-West) valleys (Elqui,Limarí, and Choapa) present an increasingpluviometry from the North to the South, withapproximately 60 mm per year rainfall in theElqui Valley to 300 mm per year in the Choapavalley (Favier et al. 2009). Farmers lost incomefrom grain crops such as wheat due to low yields.Farmers who had more income started farmingfruit plantations for export and have been usingdrip irrigation (Jorquera 2001). Even thoughquinoa had been cultivated as early as 3000 B.P.in the arid region of Coquimbo (Planella et al.2011), it probably disappeared very early during
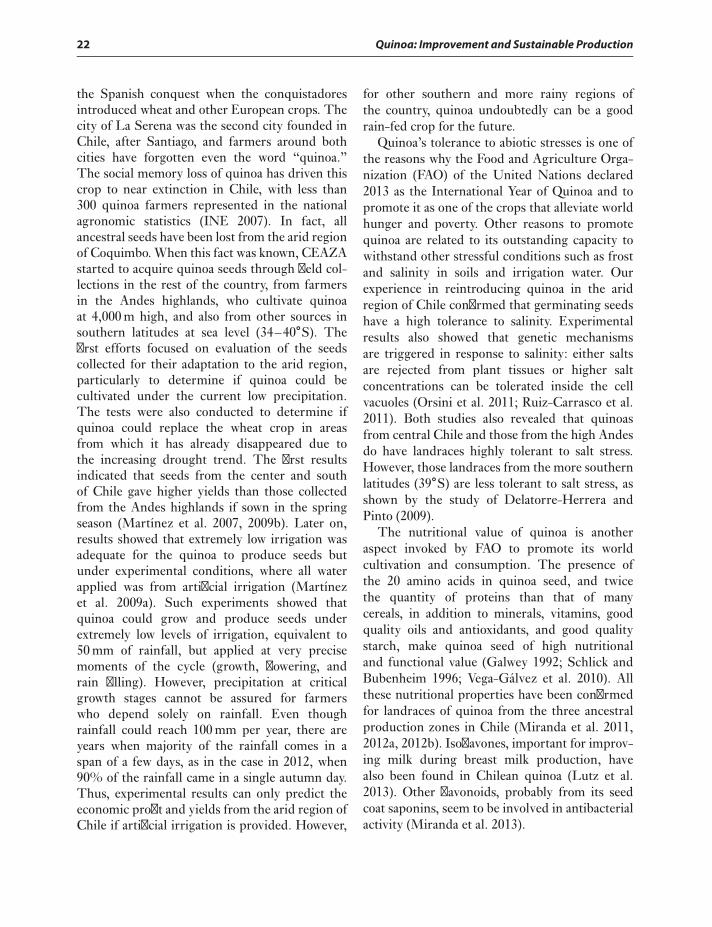
22 Quinoa: Improvement and Sustainable Production
the Spanish conquest when the conquistadoresintroduced wheat and other European crops. Thecity of La Serena was the second city founded inChile, after Santiago, and farmers around bothcities have forgotten even the word “quinoa.”The social memory loss of quinoa has driven thiscrop to near extinction in Chile, with less than300 quinoa farmers represented in the nationalagronomic statistics (INE 2007). In fact, allancestral seeds have been lost from the arid regionof Coquimbo. When this fact was known, CEAZAstarted to acquire quinoa seeds through field col-lections in the rest of the country, from farmersin the Andes highlands, who cultivate quinoaat 4,000 m high, and also from other sources insouthern latitudes at sea level (34–40∘S). Thefirst efforts focused on evaluation of the seedscollected for their adaptation to the arid region,particularly to determine if quinoa could becultivated under the current low precipitation.The tests were also conducted to determine ifquinoa could replace the wheat crop in areasfrom which it has already disappeared due tothe increasing drought trend. The first resultsindicated that seeds from the center and southof Chile gave higher yields than those collectedfrom the Andes highlands if sown in the springseason (Martínez et al. 2007, 2009b). Later on,results showed that extremely low irrigation wasadequate for the quinoa to produce seeds butunder experimental conditions, where all waterapplied was from artificial irrigation (Martínezet al. 2009a). Such experiments showed thatquinoa could grow and produce seeds underextremely low levels of irrigation, equivalent to50 mm of rainfall, but applied at very precisemoments of the cycle (growth, flowering, andrain filling). However, precipitation at criticalgrowth stages cannot be assured for farmerswho depend solely on rainfall. Even thoughrainfall could reach 100 mm per year, there areyears when majority of the rainfall comes in aspan of a few days, as in the case in 2012, when90% of the rainfall came in a single autumn day.Thus, experimental results can only predict theeconomic profit and yields from the arid region ofChile if artificial irrigation is provided. However,
for other southern and more rainy regions ofthe country, quinoa undoubtedly can be a goodrain-fed crop for the future.
Quinoa’s tolerance to abiotic stresses is one ofthe reasons why the Food and Agriculture Orga-nization (FAO) of the United Nations declared2013 as the International Year of Quinoa and topromote it as one of the crops that alleviate worldhunger and poverty. Other reasons to promotequinoa are related to its outstanding capacity towithstand other stressful conditions such as frostand salinity in soils and irrigation water. Ourexperience in reintroducing quinoa in the aridregion of Chile confirmed that germinating seedshave a high tolerance to salinity. Experimentalresults also showed that genetic mechanismsare triggered in response to salinity: either saltsare rejected from plant tissues or higher saltconcentrations can be tolerated inside the cellvacuoles (Orsini et al. 2011; Ruiz-Carrasco et al.2011). Both studies also revealed that quinoasfrom central Chile and those from the high Andesdo have landraces highly tolerant to salt stress.However, those landraces from the more southernlatitudes (39∘S) are less tolerant to salt stress, asshown by the study of Delatorre-Herrera andPinto (2009).
The nutritional value of quinoa is anotheraspect invoked by FAO to promote its worldcultivation and consumption. The presence ofthe 20 amino acids in quinoa seed, and twicethe quantity of proteins than that of manycereals, in addition to minerals, vitamins, goodquality oils and antioxidants, and good qualitystarch, make quinoa seed of high nutritionaland functional value (Galwey 1992; Schlick andBubenheim 1996; Vega-Gálvez et al. 2010). Allthese nutritional properties have been confirmedfor landraces of quinoa from the three ancestralproduction zones in Chile (Miranda et al. 2011,2012a, 2012b). Isoflavones, important for improv-ing milk during breast milk production, havealso been found in Chilean quinoa (Lutz et al.2013). Other flavonoids, probably from its seedcoat saponins, seem to be involved in antibacterialactivity (Miranda et al. 2013).
History of Quinoa: Its Origin, Domestication, Diversification, and Cultivation 23
FINAL REMARKS
The ancestral progenitors of quinoa mighthave originated in North America, but quinoaproduction and the culture that developedalongside its cultivation and consumption isknown to be shared among the ancient peoplesof South America. In ancient times, quinoa wasgrown from the southern part of South Americafrom the highlands of what is now Bolivia, to thefurthest austral latitudes and lowlands of Chileand Argentina, where the agrocultural tradition ofquinoa almost disappeared. This long latitudinalgradient implies at least 3,000 years of quinoaacclimation to new lands, new climates, andlonger day-lengths. Interestingly, the nutritionalquality and stress-tolerant properties of quinoadid not change. Efforts to reintroduce quinoato the arid regions of Chile have shown thatcertain quinoa landraces could produce seed evenunder extremely low irrigation levels, but it hasto be applied at precise points during the growthcycle. At present, there is a wide range of quinoalandraces that can be adapted to new areas in theworld. Stress-tolerant quinoa can be grown inmarginal areas or under harsher environmentswhere the more traditional crops cannot begrown. Moreover, quinoa seed is extremelynutritious and can fulfill the need and demands ofa growing world population for high-quality food.
REFERENCES
Bertero HD. 2001. Effects of photoperiod, temperature and radi-ation on the rate of leaf appearance in quinoa (Chenopodiumquinoa Willd.) under field conditions. Ann Bot 87:495–502.
Bertero HD, King RW, Hall AJ. 1999. Modelling photoperiodand temperature responses of flowering in quinoa (Cheno-podium quinoa Willd.). Field Crops Res 63:19–34.
Delatorre-Herrera J, Pinto M. 2009. Importance of ionic andosmotic components of salt stress on the germination of fourquinua (Chenopodium quinoa Willd.) selections. Chilean J AgrRes 69:477–485.
Favier V, Falvey M, Rabatel A, Praderio E, López D. 2009. Inter-preting discrepancies between discharge and precipitation inhigh-altitude area of Chile’s Norte chico region (26–32 S).Water Res Res 45:W02424 10.1029/2008WR006802.
Fuentes FF, Espinoza PA, Von Baer I, Jellen EN, MaughanPJ. 2009a. Determinación de relaciones genéticas entre
Chenopodium quinoa Willd. del sur de Chile y parientessilvestres del género Chenopodium. Anales del XVII CongresoNacional de Biología del Perú, Tacna, Perú, p. 45.
Fuentes FF, Martínez EA, Hinrichsen PV, Jellen EN, MaughanPJ. 2009b. Assessment of genetic diversity patterns inChilean quinoa (Chenopodium quinoa Willd.) germplasmusing multiplex fluorescent microsatellite markers. ConservGenet 10:369–377.
Fuentes FF, Bazile D, Bhargava A, Martínez EA. 2012. Implica-tions of farmers’ seed exchanges for on-farm conservation ofquinoa, as revealed by its genetic diversity in Chile. J AgricSci 150:702–716.
Galwey NW. 1992. The potential of quinoa as a multi-purposecrop for agricultural diversification: a review. Ind Crops Prod1:101–106.
Heiser CB, Nelson CD. 1974. On the origin of cultivatedChenopods (Chenopodium). Genetics 78:503–505.
INE-Instituto Nacional de Estadísticas. 2007. VII Censo NacionalAgropecuario y Forestal (Internet) (cited June 24, 2013).Available at: http://www.ine.cl/canales/base_datos/otras_bases_datos.php.
Jorquera C. 2001. Evolución Agropecuaria de la Región deCoquimbo: Análisis contextual para la conservación de lavegetación nativa. Squeo FA, Arancio G, Gutierrez JR.Libro rojo de la flora de la región de Coquimbo, y de lossitios prioritarios para su conservación. La Serena, Chile:Ediciones Universidad de La Serena. 386.
Lanino M. 2006. Características climáticas de ancovintodurante 2005 a 2006. Iquique, Chile: Boletín TecnicoFIA-UNAP-CODECITE. 1–3.
Lutz M, Martínez EA, Martínez A. 2013. Daidzein and genisteincontents in seeds of quinoa (Chenopodium quinoa Willd)from local ecotypes grown in arid Chile. Ind Crops Prod49:117–121.
Martínez EA, Delatorre J, Von Baer I. 2007. Quínoa: las poten-cialidades de un cultivo sub-utilizado en Chile. Tierra Aden-tro (INIA) 75:24–27.
Martínez EA, Veas E, Jorquera C, San Martín R, Jara P. 2009a.Re-introduction of Chenopodium quinoa Willd. into arid Chile:cultivation of two lowland races under extremely low irriga-tion. J Agron Crop Sci 195:1–10.
Martínez EA, Jorquera-Jaramillo C, Veas E, Chía E. 2009b. Elfuturo de la quínoa en la región árida de Coquimbo: leccionesy escenarios a partir de una investigación sobre su biodiversi-dad en chile para la acción con agricultores locales. Revista deGeografía de Valparaíso 42:95–111.
Miranda M, Bazile D, Fuentes FF, Vega-Gálvez A, Uribe E,Quispe I, Lemus R, Martínez EA. 2011. Quinoa crop biodi-versity in Chile: an ancient plant cultivated with sustainableagricultural practices and producing grains of outstandingand diverse nutritional values. In: 6th International CIGRTechnical Symposium – Section 6: “Towards a SustainableFood Chain” Food Process, Bioprocessing and Food QualityManagement, Nantes, France.
24 Quinoa: Improvement and Sustainable Production
Miranda M, Vega-Gálvez A, Quispe-Fuentes I, Rodríguez MJ,Maureira H, Martínez EA. 2012a. Nutritional aspects ofsix quinoa (Chenopodium quinoa Willd.) ecotypes from threegeographical areas of Chile. Chilean J Agric Res 72:175–181.
Miranda M, Vega-Gálvez A, Martinez EA, López J, RodríguezMJ, Henríquez K, Fuentes FF. 2012b. Genetic diversity andcomparison of physicochemical and nutritional characteristicsof six quinoa (Chenopodium quinoa Willd.) genotypes culti-vated in Chile. Food Sci Tech 32:835–843.
Miranda M, Vega-Gálvez A, Jorquera E, López J, Martínez EA.2013. Antioxidant and antimicrobial activity of quinoa seeds(Chenopodium quinoa Willd.) from three geographical zonesof Chile. Méndez-Vilas A. Worldwide research efforts in thefight against microbial pathogens: from basic research to tech-nological development. Boca Raton, FL: Brown Walker Press.83–86.
Mujica A, Jacobsen SE. 2000. Agrobiodiversidad de las aynokasde quinua (Chenopodium quinoa Willd.) y la seguridadalimentaria. Seminario Agrobiodiversidad en la RegiónAndina y Amazónica, pp. 151–156.
Novoa JE, López D. 2001. IV Región: El escenario geográficofísico. En Libro rojo de la flora nativa y de los sitios priori-tarios para su conservación: región de Coquimbo. Squeo FA,Arancio G, Gutierrez JR, Libro rojo de la flora de la región deCoquimbo, y de los sitios prioritarios para su conservación. LaSerena, Chile: Ediciones Universidad de La Serena. 13–28.
Orsini F, Accorsi M, Gianquinto G, Dinelli G, Antognoni F,Ruiz-Carrasco KB, Martínez EA, Alnayef M, Marotti I, BosiS, Biondi S. 2011. Beyond the ionic and osmotic response tosalinity in Chenopodium quinoa: functional elements of suc-cessful halophytism. Funct Plant Biol 38:818–831.
Planella MT, Scherson R, McRostie V. 2011. Sitio El Plomoy nuevos registros de cultígenos iniciales en cazadores delArcaico IV en alto Maipo, Chile central. Chungara, Revistade Antropología Chilena 43:189–202.
Ruiz-Carrasco KB, Antognoni F, Coulibaly AK, Lizardi S,Covarrubias A, Martínez EA, Molina-Montenegro MA,Biondi S, Zurita-Silva A. 2011. Variation in salinity toleranceof four lowland genotypes of quinoa (Chenopodium quinoaWilld.) as assessed by growth, physiological traits, andsodium transporter gene expression. Plant Physiol Biochem49:1333–1341.
Schlick G, Bubenheim DL. 1996. Quinoa: candidate crop forNASA’s Controlled Ecological Life Support Systems. JanickJ. Progress in new crops. Arlington, TX: ASHS Press.632–640.
Sepúlveda J, Thomet M, Palazuelos P, Mujica MA. 2003.La Kinwa Mapuche, recuperación de un cultivo para laalimentación. Chile: CET-Sur, Fundación para la InnovaciónAgraria, Ministerio de Agricultura.
Vega-Gálvez, A., M. Miranda, J. Vergara, E. Uribe, L. Puente, E.A. Martínez. 2010. Nutrition facts and functional potential ofquinoa (Chenopodium quinoa Willd.), an ancient Andean grain:a review. J Sci Food Agr 90:2541–2547.
Von Baer I, Bazile D, Martínez EA. 2009. Cuarenta años demejoramiento de la quínoa (Chenopodium quinoa Willd.) en laAraucanía: origen de “La Regalona-B”. Revista Geográficade Valparaíso 42:34–44.
Wilson HW, Heiser CB. 1979. The origin and evolutionary rela-tionships of ‘huauzontle’ (Chenopodium nuttalliae Safford),domesticated chenopod of Mexico. Am J Bot 66:198–206.
Chapter 3
Agroecological and Agronomic CulturalPractices of Quinoa in South America
Magali Garcia1, Bruno Condori2, and Carmen Del Castillo1
1Faculty of Agronomy, Universidad Mayor de San Andres, La Paz, Bolivia2Consultative Group on International Agricultural Research – International Potato Center, La Paz, Bolivia
INTRODUCTION
The Food and Agriculture Organization (FAO)of the United Nations identified quinoa as apotential crop to combat global malnutrition.Quinua or quinoa (Chenopodium quinoa Willd.) isan underutilized crop with enormous potential,mainly due to its nutritional and physiologicalproperties. The crop produces small grains andhas several intrinsic qualities for developingsuperior varieties, including a major gene pool,that is, more than 6,000 varieties and several wildrelatives with outstanding characteristics such asearliness, color, and grain size. Quinoa also has alarge genetic variability and plasticity, resistanceto biotic and abiotic factors, and ability to adaptto adverse soil and climatic conditions in placeswhere most agriculture is marginal. Moreover,quinoa is efficient in its use of production inputs,and thus can be grown through a large range ofproduction environments, from the equator tohigh latitudes, and from sea level to 4,000 m.It has the ability to produce grains even underhighly saline soils. It is a functional and idealfood for human nutrition due to its nutritionalprofile, as represented by the quality and quantityof its essential amino acid composition. Unlikemany other regional products, quinoa grain can
Quinoa: Improvement and Sustainable Production, First Edition. Edited by Kevin Murphy and Janet Matanguihan.© 2015 John Wiley & Sons, Inc. Published 2015 by John Wiley & Sons, Inc.
be stored in natural conditions, constituting areserve that can be consumed even after severalmonths or in seasons with food scarcity. Thisproperty increases the value of quinoa in supportof human nutrition. The diversity of its uses andits importance, both cultural and nutritional,make it a principal crop in South America.
Together with potato, quinoa was the staplefood of the indigenous population (Hellin andHigman 2003). Among the food grains cultivatedin the South American highlands, quinoa ranksas a very significant crop in terms of quality andnutritional value. At the time of the Spanishconquest of the Inca Empire in 1532, quinoa,potatoes, and maize were the principal staplefoods in Andean South America, with quinoacultivation extending slightly beyond the regionoccupied by the Incas (Galwey 1993; Cusack1984; Risi and Galwey 1984). Following theconquest, quinoa cultivation declined drasticallyand was displaced by crops preferred by the“conquistadores.” Furthermore, quinoa was notadopted as a crop by European settlers in SouthAmerica or in Europe, as were other New Worldcrops such as maize and potatoes. It was not untilthe last decades of the twentieth century thatinterest in quinoa rose again. The crisis in foodsecurity worldwide made it imperative to look
25
26 Quinoa: Improvement and Sustainable Production
for crop alternatives. Quinoa, with its excellentnutritional profile and genetic diversity, makes itan ideal crop to be developed further.
ANDEAN DOMESTICATION
Quinoa has been cultivated in the Bolivian andPeruvian Andean region for ∼7,000 years byindigenous population groups (e.g., the Aymaraand the Quechua in Bolivia) (Garcia 2003).Several names were given to the crop, such as“mother cereal” in Quechua, or the internation-ally known names “Inca-rice,” “Inca-wheat,” or“Han” (China). People of the Chibcha (Bogota)culture called quinoa “suba” (Valencia-Chamorro2004), the Tiahuanacotas (Bolivia) called it“jupha,” the inhabitants of the Atacama desert(currently in Chile) knew it by the name “dahue,”and in Ecuador, it was called “quimián” (PulgarVidal 1954). Tapia (1979) wrote that the names“quinua” and “quinoa” were used in Bolivia,Peru, Ecuador, Argentina, and Chile.
The monikers “Grain of the Incas” or“Inca-rice,” though internationally known, ismisleading since archaeological evidence showsthat the Andean quinoa was domesticated beforethe Incas (Heisser and Nelson 1974; Jacobsen2003). Through migration and growing trade,the crop spread throughout the Andean regions.Pre-Inca native populations practiced intensiveagriculture, using irrigation, composting, rota-tions, and construction of terraces to conserve soilfertility in the mountains and increase agriculturalproduction, especially in the areas surroundingLake Titicaca. When the Incas established theirkingdom in Cuzco (1100–1533 AC), they quicklyrecognized the extraordinary agricultural andnutritional qualities of quinoa and gave thequechua name “chisiya mama” or “mother grain”and introduced the grain in religious activities.Quinoa served very well as concentrated food forthe Incan army during the marches of conquest.Thus, through the extension of the Inca kingdom,quinoa was also systematically distributed fromChile to Colombia. The variation in quinoa seedsize and the wide range of seed color, from blackto yellow, pink, and white, is a clear indication
that the ancient Andean farmer successfully bredquinoa.
The botany of quinoa was first described byWilldenow in 1778. It was recognized as native toSouth America, with the center of origin locatedin the Andes of Bolivia and Peru (Cardenas1944). The distribution range is fairly widegeographically but restricted to the Andes. Thegreatest diversity of ecotypes can be found inthe Andes, both cultivated and wild relatives.Social, cultural, and economic importance wasalso given to quinoa by peoples of the Andesregion (Gandarillas 1979b).
Bonifacio (2001), Del Castillo et al. (2008),and the FAO (2011) identify four main groups ofquinoa according to the agroecological conditionsof the areas where it is grown: valleys, high plains,salt flats, and sea level. These ecotypes havedifferent and specific botanical agronomic andadaptive characteristics. Most probably, it tookdecades for the actual varieties to be developedfrom the wild forms, though certain wild formsof quinoa are still consumed as vegetable in localcommunities in the Andes (Mujica et al. 2001a).Although its production declined significantlyduring the Spanish conquest, the popularity ofquinoa rose again in the past century and is widelyconsumed at present.
The area where quinoa was domesticated ishardly suitable for agriculture. The Andes, andmore the higher planes, are exposed to harshclimatic and soil conditions. Water shortage is amajor problem due to the combined effect of lowrainfall, high rate of evapotranspiration, and thelow water retention capacity of the soils. Plants areexposed to extremely high rates of solar radiationand large daily thermal amplitudes. During spellsof dry periods, farmers frequently deal with yieldreductions that lead to cumulative shortages ofhuman food and animal feed (Garcia et al. 2003;Jensen et al. 2000). In addition, plant growth isexceedingly hampered by frost in the southernpart of Peru and Bolivia and by high soil salinity,especially in the salt deserts of the southern partof Bolivia (Jacobsen et al. 2003).
As quinoa and other robust agricultural cropshave been domesticated in the harsh environmentof the Andes, with its highly variable conditions,
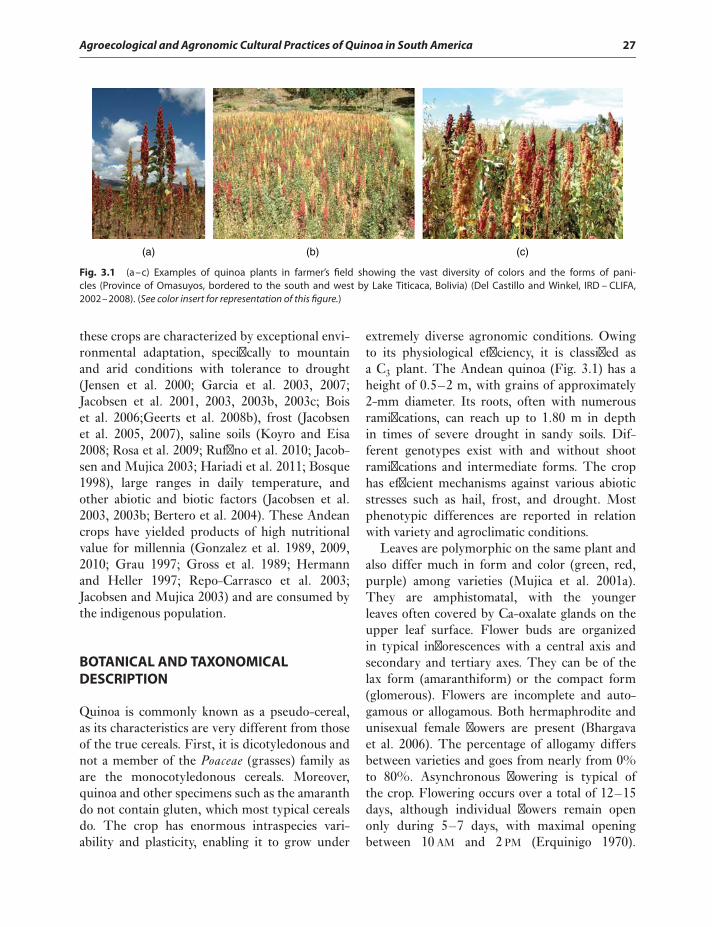
Agroecological and Agronomic Cultural Practices of Quinoa in South America 27
(a) (b) (c)
Fig. 3.1 (a–c) Examples of quinoa plants in farmer’s field showing the vast diversity of colors and the forms of pani-cles (Province of Omasuyos, bordered to the south and west by Lake Titicaca, Bolivia) (Del Castillo and Winkel, IRD – CLIFA,2002–2008). (See color insert for representation of this figure.)
these crops are characterized by exceptional envi-ronmental adaptation, specifically to mountainand arid conditions with tolerance to drought(Jensen et al. 2000; Garcia et al. 2003, 2007;Jacobsen et al. 2001, 2003, 2003b, 2003c; Boiset al. 2006;Geerts et al. 2008b), frost (Jacobsenet al. 2005, 2007), saline soils (Koyro and Eisa2008; Rosa et al. 2009; Ruffino et al. 2010; Jacob-sen and Mujica 2003; Hariadi et al. 2011; Bosque1998), large ranges in daily temperature, andother abiotic and biotic factors (Jacobsen et al.2003, 2003b; Bertero et al. 2004). These Andeancrops have yielded products of high nutritionalvalue for millennia (Gonzalez et al. 1989, 2009,2010; Grau 1997; Gross et al. 1989; Hermannand Heller 1997; Repo-Carrasco et al. 2003;Jacobsen and Mujica 2003) and are consumed bythe indigenous population.
BOTANICAL AND TAXONOMICALDESCRIPTION
Quinoa is commonly known as a pseudo-cereal,as its characteristics are very different from thoseof the true cereals. First, it is dicotyledonous andnot a member of the Poaceae (grasses) family asare the monocotyledonous cereals. Moreover,quinoa and other specimens such as the amaranthdo not contain gluten, which most typical cerealsdo. The crop has enormous intraspecies vari-ability and plasticity, enabling it to grow under
extremely diverse agronomic conditions. Owingto its physiological efficiency, it is classified asa C3 plant. The Andean quinoa (Fig. 3.1) has aheight of 0.5–2 m, with grains of approximately2-mm diameter. Its roots, often with numerousramifications, can reach up to 1.80 m in depthin times of severe drought in sandy soils. Dif-ferent genotypes exist with and without shootramifications and intermediate forms. The crophas efficient mechanisms against various abioticstresses such as hail, frost, and drought. Mostphenotypic differences are reported in relationwith variety and agroclimatic conditions.
Leaves are polymorphic on the same plant andalso differ much in form and color (green, red,purple) among varieties (Mujica et al. 2001a).They are amphistomatal, with the youngerleaves often covered by Ca-oxalate glands on theupper leaf surface. Flower buds are organizedin typical inflorescences with a central axis andsecondary and tertiary axes. They can be of thelax form (amaranthiform) or the compact form(glomerous). Flowers are incomplete and auto-gamous or allogamous. Both hermaphrodite andunisexual female flowers are present (Bhargavaet al. 2006). The percentage of allogamy differsbetween varieties and goes from nearly from 0%to 80%. Asynchronous flowering is typical ofthe crop. Flowering occurs over a total of 12–15days, although individual flowers remain openonly during 5–7 days, with maximal openingbetween 10 AM and 2 PM (Erquinigo 1970).
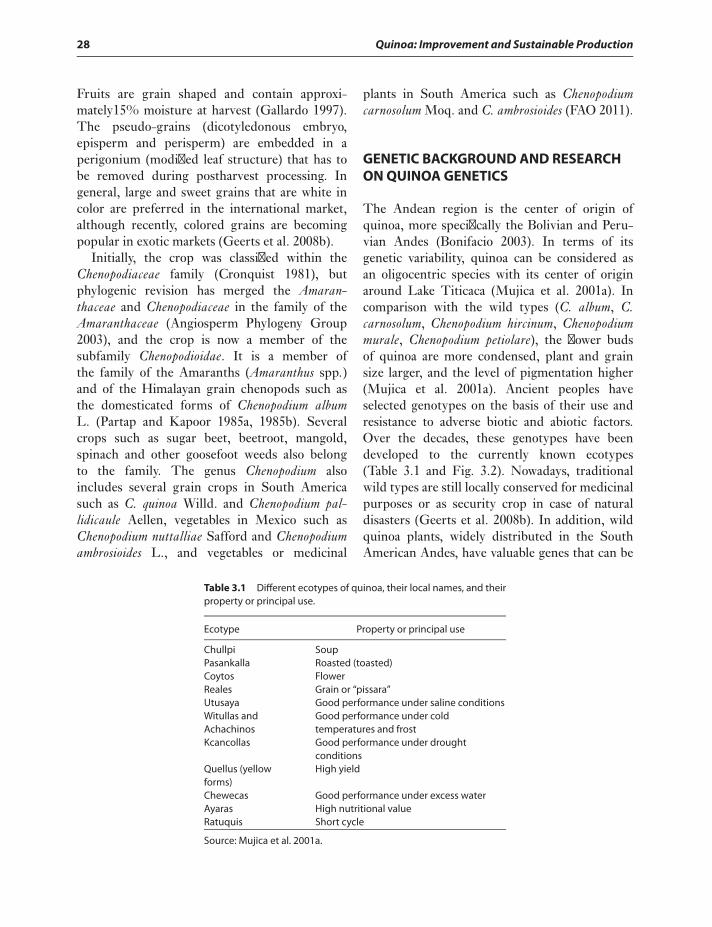
28 Quinoa: Improvement and Sustainable Production
Fruits are grain shaped and contain approxi-mately15% moisture at harvest (Gallardo 1997).The pseudo-grains (dicotyledonous embryo,episperm and perisperm) are embedded in aperigonium (modified leaf structure) that has tobe removed during postharvest processing. Ingeneral, large and sweet grains that are white incolor are preferred in the international market,although recently, colored grains are becomingpopular in exotic markets (Geerts et al. 2008b).
Initially, the crop was classified within theChenopodiaceae family (Cronquist 1981), butphylogenic revision has merged the Amaran-thaceae and Chenopodiaceae in the family of theAmaranthaceae (Angiosperm Phylogeny Group2003), and the crop is now a member of thesubfamily Chenopodioidae. It is a member ofthe family of the Amaranths (Amaranthus spp.)and of the Himalayan grain chenopods such asthe domesticated forms of Chenopodium albumL. (Partap and Kapoor 1985a, 1985b). Severalcrops such as sugar beet, beetroot, mangold,spinach and other goosefoot weeds also belongto the family. The genus Chenopodium alsoincludes several grain crops in South Americasuch as C. quinoa Willd. and Chenopodium pal-lidicaule Aellen, vegetables in Mexico such asChenopodium nuttalliae Safford and Chenopodiumambrosioides L., and vegetables or medicinal
plants in South America such as Chenopodiumcarnosolum Moq. and C. ambrosioides (FAO 2011).
GENETIC BACKGROUND AND RESEARCHON QUINOA GENETICS
The Andean region is the center of origin ofquinoa, more specifically the Bolivian and Peru-vian Andes (Bonifacio 2003). In terms of itsgenetic variability, quinoa can be considered asan oligocentric species with its center of originaround Lake Titicaca (Mujica et al. 2001a). Incomparison with the wild types (C. album, C.carnosolum, Chenopodium hircinum, Chenopodiummurale, Chenopodium petiolare), the flower budsof quinoa are more condensed, plant and grainsize larger, and the level of pigmentation higher(Mujica et al. 2001a). Ancient peoples haveselected genotypes on the basis of their use andresistance to adverse biotic and abiotic factors.Over the decades, these genotypes have beendeveloped to the currently known ecotypes(Table 3.1 and Fig. 3.2). Nowadays, traditionalwild types are still locally conserved for medicinalpurposes or as security crop in case of naturaldisasters (Geerts et al. 2008b). In addition, wildquinoa plants, widely distributed in the SouthAmerican Andes, have valuable genes that can be
Table 3.1 Different ecotypes of quinoa, their local names, and theirproperty or principal use.
Ecotype Property or principal use
Chullpi SoupPasankalla Roasted (toasted)Coytos FlowerReales Grain or “pissara”Utusaya Good performance under saline conditionsWitullas andAchachinos
Good performance under coldtemperatures and frost
Kcancollas Good performance under droughtconditions
Quellus (yellowforms)
High yield
Chewecas Good performance under excess waterAyaras High nutritional valueRatuquis Short cycle
Source: Mujica et al. 2001a.
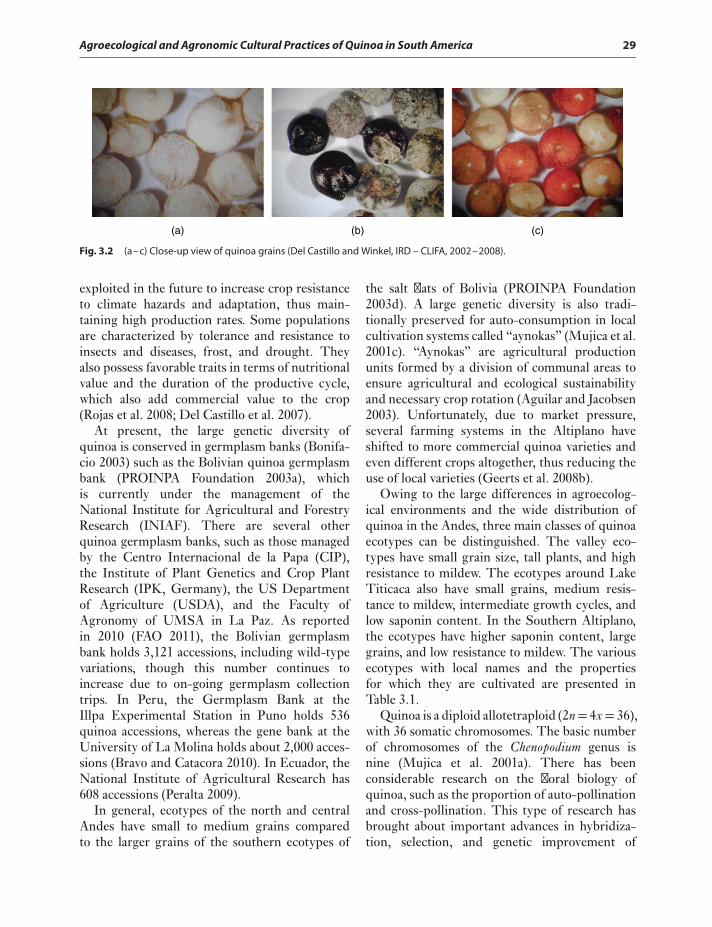
Agroecological and Agronomic Cultural Practices of Quinoa in South America 29
(a) (b) (c)
Fig. 3.2 (a–c) Close-up view of quinoa grains (Del Castillo and Winkel, IRD – CLIFA, 2002–2008).
exploited in the future to increase crop resistanceto climate hazards and adaptation, thus main-taining high production rates. Some populationsare characterized by tolerance and resistance toinsects and diseases, frost, and drought. Theyalso possess favorable traits in terms of nutritionalvalue and the duration of the productive cycle,which also add commercial value to the crop(Rojas et al. 2008; Del Castillo et al. 2007).
At present, the large genetic diversity ofquinoa is conserved in germplasm banks (Bonifa-cio 2003) such as the Bolivian quinoa germplasmbank (PROINPA Foundation 2003a), whichis currently under the management of theNational Institute for Agricultural and ForestryResearch (INIAF). There are several otherquinoa germplasm banks, such as those managedby the Centro Internacional de la Papa (CIP),the Institute of Plant Genetics and Crop PlantResearch (IPK, Germany), the US Departmentof Agriculture (USDA), and the Faculty ofAgronomy of UMSA in La Paz. As reportedin 2010 (FAO 2011), the Bolivian germplasmbank holds 3,121 accessions, including wild-typevariations, though this number continues toincrease due to on-going germplasm collectiontrips. In Peru, the Germplasm Bank at theIllpa Experimental Station in Puno holds 536quinoa accessions, whereas the gene bank at theUniversity of La Molina holds about 2,000 acces-sions (Bravo and Catacora 2010). In Ecuador, theNational Institute of Agricultural Research has608 accessions (Peralta 2009).
In general, ecotypes of the north and centralAndes have small to medium grains comparedto the larger grains of the southern ecotypes of
the salt flats of Bolivia (PROINPA Foundation2003d). A large genetic diversity is also tradi-tionally preserved for auto-consumption in localcultivation systems called “aynokas” (Mujica et al.2001c). “Aynokas” are agricultural productionunits formed by a division of communal areas toensure agricultural and ecological sustainabilityand necessary crop rotation (Aguilar and Jacobsen2003). Unfortunately, due to market pressure,several farming systems in the Altiplano haveshifted to more commercial quinoa varieties andeven different crops altogether, thus reducing theuse of local varieties (Geerts et al. 2008b).
Owing to the large differences in agroecolog-ical environments and the wide distribution ofquinoa in the Andes, three main classes of quinoaecotypes can be distinguished. The valley eco-types have small grain size, tall plants, and highresistance to mildew. The ecotypes around LakeTiticaca also have small grains, medium resis-tance to mildew, intermediate growth cycles, andlow saponin content. In the Southern Altiplano,the ecotypes have higher saponin content, largegrains, and low resistance to mildew. The variousecotypes with local names and the propertiesfor which they are cultivated are presented inTable 3.1.
Quinoa is a diploid allotetraploid (2n= 4x= 36),with 36 somatic chromosomes. The basic numberof chromosomes of the Chenopodium genus isnine (Mujica et al. 2001a). There has beenconsiderable research on the floral biology ofquinoa, such as the proportion of auto-pollinationand cross-pollination. This type of research hasbrought about important advances in hybridiza-tion, selection, and genetic improvement of
30 Quinoa: Improvement and Sustainable Production
quinoa varieties (Mujica et al. 2001a). Breedingprograms are generally directed toward develop-ing cultivars with higher yields, high protein, andlow saponin contents (Bhargava et al. 2006), whileincreasing or maintaining resistance against bioticand abiotic factors, such as downy mildew anddrought (Bonifacio 2003).
ECOLOGY AND PHYTOGEOGRAPHY
The geographical distribution of quinoa extendsfrom 5∘ North Latitude in southern Colombiato 43∘ South Latitude in the Tenth Region ofChile and the Argentinean Andes. The altitudinaldistribution ranges from sea level to 4,000 masl.Quinoa is planted mainly in the highlands sharedby Chile, Peru, and Bolivia. There are coastalquinoa, valley quinoa, and highlands quinoa.The Bolivian Altiplano, with a cultivated areaof more than 100,000 ha, has the world’s largestconcentrated area of quinoa production. A largepart of this extension is located in the south of thecountry, close to the salt flats. The second largestproducer is Peru with a cultivated area of around55,000 ha, concentrated mainly in southernPuno producing more than 41,000 tons per year.In Ecuador, 1,700 ha are dedicated to quinoaproduction in the provinces of Carchi, Imbabura,Pichincha, Cotopaxi, Chimborazo, Loja, Lata-cunga, Ambato, and Cuenca. In Colombia, some700 ha are grown with quinoa, nearly all in thesouth of Nariño, in the municipality of Sapuyes.The north of Chile and the Argentine highlandsare also working to increase quinoa production.
In South America, different quinoa varietiesare distributed according to eco-geographiczones. For example, one of the most popularvarieties is the variety “Real” (PROINPA Foun-dation 2003a) cultivated mainly in the largestproduction area in the Andes, at the south of theBolivian Altiplano. It is grown under conditionsof intensive drought and frost to which it isextremely resistant. In this area, annual rainfallvaries from exceptionally dry in the extremesouth to dry in the intersalar region, from 150to 340 mm precipitation, respectively (Geertset al. 2006b). Farm households rely mostly on
quinoa production (Laguna 2000). The “Real”variety is in demand due to its large white grains.Nevertheless, it has not been grown successfullyoutside its center of origin apparently due to thefact that its flowering is closely linked with lighthours at high altitude and high solar radiationintensity that is absent in other latitudes andaltitudes. To the north of the Bolivian Altiplano,specific varieties more adapted to their localenvironments are grown, generally with small andmedium grains (PROINPA Foundation 2002),but which are completely unable to thrive in thesalt flats of Bolivia. In general, native varietieshave a moderate yield but are more resistant toabiotic factors and have a higher-than-averagenutritional quality if cultivated close to theircenter of origin.
The crop cycle varies largely from 120 to 240days, depending on the varieties and on the zoneof production and the attendant environmentalconditions. In general, varieties grown in colderenvironments have longer crop cycles, whereasshorter cycle varieties are grown in the valleysand lowlands. Sanchez (2012), using a basetemperature of 1∘C for the crop, found in theBolivian Highlands at a thermal time of 1,500heat units, which was fairly constant from Northto South. Apart from this study, there have beenno more studies on the quantity of heat that thecrop needs to complete its growing cycle. Thereare indications that climate change impacts aresomewhat shortening the crops cycles, especiallyin the highlands. Despite this possible climateeffect, research institutions at present are notworking toward the release of early varieties.
The most important phenological stages thatare morphoanatomically significant accordingto Espindola (1980, 1992) and Mujica et al.(2001b) are presented in Table 3.2 with their keyproperties (Geerts et al. 2008b).
CULTIVATION AND AGRONOMICPRACTICES IN SOUTH AMERICA
In general, the production systems of quinoain South America can be grouped into thesystems of the southern highlands, the systems
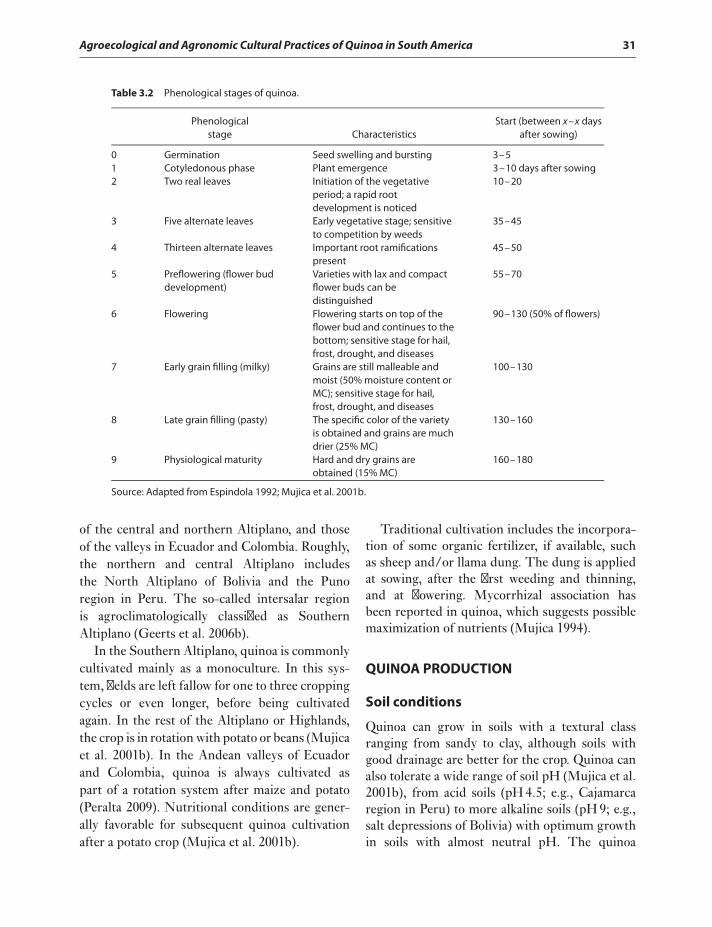
Agroecological and Agronomic Cultural Practices of Quinoa in South America 31
Table 3.2 Phenological stages of quinoa.
Phenological Start (between x–x daysstage Characteristics after sowing)
0 Germination Seed swelling and bursting 3–51 Cotyledonous phase Plant emergence 3–10 days after sowing2 Two real leaves Initiation of the vegetative
period; a rapid rootdevelopment is noticed
10–20
3 Five alternate leaves Early vegetative stage; sensitiveto competition by weeds
35–45
4 Thirteen alternate leaves Important root ramificationspresent
45–50
5 Preflowering (flower buddevelopment)
Varieties with lax and compactflower buds can bedistinguished
55–70
6 Flowering Flowering starts on top of theflower bud and continues to thebottom; sensitive stage for hail,frost, drought, and diseases
90–130 (50% of flowers)
7 Early grain filling (milky) Grains are still malleable andmoist (50% moisture content orMC); sensitive stage for hail,frost, drought, and diseases
100–130
8 Late grain filling (pasty) The specific color of the varietyis obtained and grains are muchdrier (25% MC)
130–160
9 Physiological maturity Hard and dry grains areobtained (15% MC)
160–180
Source: Adapted from Espindola 1992; Mujica et al. 2001b.
of the central and northern Altiplano, and thoseof the valleys in Ecuador and Colombia. Roughly,the northern and central Altiplano includesthe North Altiplano of Bolivia and the Punoregion in Peru. The so-called intersalar regionis agroclimatologically classified as SouthernAltiplano (Geerts et al. 2006b).
In the Southern Altiplano, quinoa is commonlycultivated mainly as a monoculture. In this sys-tem, fields are left fallow for one to three croppingcycles or even longer, before being cultivatedagain. In the rest of the Altiplano or Highlands,the crop is in rotation with potato or beans (Mujicaet al. 2001b). In the Andean valleys of Ecuadorand Colombia, quinoa is always cultivated aspart of a rotation system after maize and potato(Peralta 2009). Nutritional conditions are gener-ally favorable for subsequent quinoa cultivationafter a potato crop (Mujica et al. 2001b).
Traditional cultivation includes the incorpora-tion of some organic fertilizer, if available, suchas sheep and/or llama dung. The dung is appliedat sowing, after the first weeding and thinning,and at flowering. Mycorrhizal association hasbeen reported in quinoa, which suggests possiblemaximization of nutrients (Mujica 1994).
QUINOA PRODUCTION
Soil conditions
Quinoa can grow in soils with a textural classranging from sandy to clay, although soils withgood drainage are better for the crop. Quinoa canalso tolerate a wide range of soil pH (Mujica et al.2001b), from acid soils (pH 4.5; e.g., Cajamarcaregion in Peru) to more alkaline soils (pH 9; e.g.,salt depressions of Bolivia) with optimum growthin soils with almost neutral pH. The quinoa
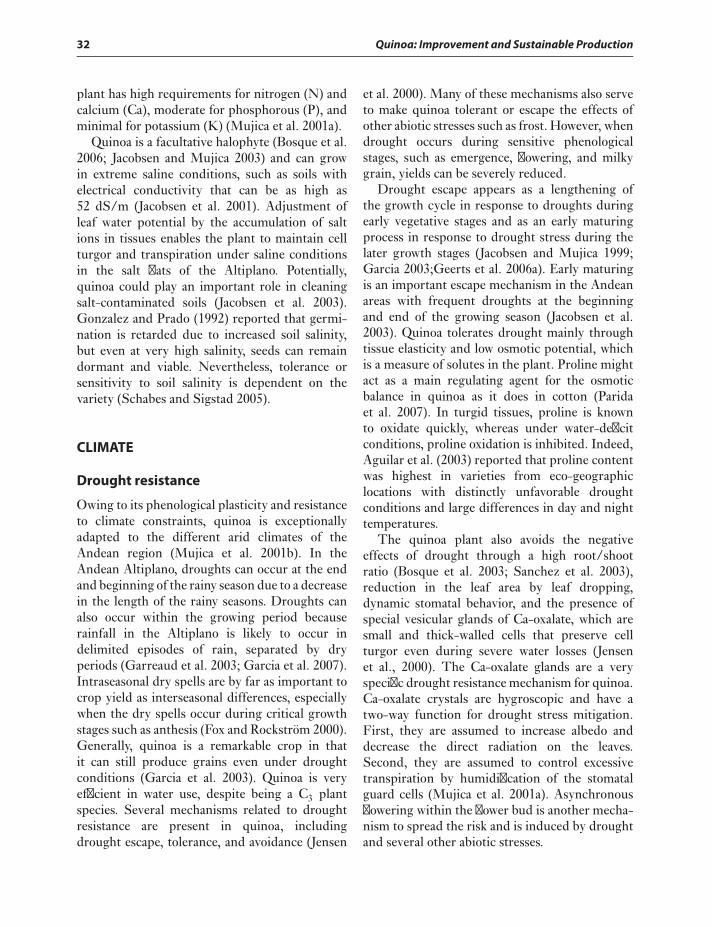
32 Quinoa: Improvement and Sustainable Production
plant has high requirements for nitrogen (N) andcalcium (Ca), moderate for phosphorous (P), andminimal for potassium (K) (Mujica et al. 2001a).
Quinoa is a facultative halophyte (Bosque et al.2006; Jacobsen and Mujica 2003) and can growin extreme saline conditions, such as soils withelectrical conductivity that can be as high as52 dS/m (Jacobsen et al. 2001). Adjustment ofleaf water potential by the accumulation of saltions in tissues enables the plant to maintain cellturgor and transpiration under saline conditionsin the salt flats of the Altiplano. Potentially,quinoa could play an important role in cleaningsalt-contaminated soils (Jacobsen et al. 2003).Gonzalez and Prado (1992) reported that germi-nation is retarded due to increased soil salinity,but even at very high salinity, seeds can remaindormant and viable. Nevertheless, tolerance orsensitivity to soil salinity is dependent on thevariety (Schabes and Sigstad 2005).
CLIMATE
Drought resistance
Owing to its phenological plasticity and resistanceto climate constraints, quinoa is exceptionallyadapted to the different arid climates of theAndean region (Mujica et al. 2001b). In theAndean Altiplano, droughts can occur at the endand beginning of the rainy season due to a decreasein the length of the rainy seasons. Droughts canalso occur within the growing period becauserainfall in the Altiplano is likely to occur indelimited episodes of rain, separated by dryperiods (Garreaud et al. 2003; Garcia et al. 2007).Intraseasonal dry spells are by far as important tocrop yield as interseasonal differences, especiallywhen the dry spells occur during critical growthstages such as anthesis (Fox and Rockström 2000).Generally, quinoa is a remarkable crop in thatit can still produce grains even under droughtconditions (Garcia et al. 2003). Quinoa is veryefficient in water use, despite being a C3 plantspecies. Several mechanisms related to droughtresistance are present in quinoa, includingdrought escape, tolerance, and avoidance (Jensen
et al. 2000). Many of these mechanisms also serveto make quinoa tolerant or escape the effects ofother abiotic stresses such as frost. However, whendrought occurs during sensitive phenologicalstages, such as emergence, flowering, and milkygrain, yields can be severely reduced.
Drought escape appears as a lengthening ofthe growth cycle in response to droughts duringearly vegetative stages and as an early maturingprocess in response to drought stress during thelater growth stages (Jacobsen and Mujica 1999;Garcia 2003;Geerts et al. 2006a). Early maturingis an important escape mechanism in the Andeanareas with frequent droughts at the beginningand end of the growing season (Jacobsen et al.2003). Quinoa tolerates drought mainly throughtissue elasticity and low osmotic potential, whichis a measure of solutes in the plant. Proline mightact as a main regulating agent for the osmoticbalance in quinoa as it does in cotton (Paridaet al. 2007). In turgid tissues, proline is knownto oxidate quickly, whereas under water-deficitconditions, proline oxidation is inhibited. Indeed,Aguilar et al. (2003) reported that proline contentwas highest in varieties from eco-geographiclocations with distinctly unfavorable droughtconditions and large differences in day and nighttemperatures.
The quinoa plant also avoids the negativeeffects of drought through a high root/shootratio (Bosque et al. 2003; Sanchez et al. 2003),reduction in the leaf area by leaf dropping,dynamic stomatal behavior, and the presence ofspecial vesicular glands of Ca-oxalate, which aresmall and thick-walled cells that preserve cellturgor even during severe water losses (Jensenet al., 2000). The Ca-oxalate glands are a veryspecific drought resistance mechanism for quinoa.Ca-oxalate crystals are hygroscopic and have atwo-way function for drought stress mitigation.First, they are assumed to increase albedo anddecrease the direct radiation on the leaves.Second, they are assumed to control excessivetranspiration by humidification of the stomatalguard cells (Mujica et al. 2001a). Asynchronousflowering within the flower bud is another mecha-nism to spread the risk and is induced by droughtand several other abiotic stresses.
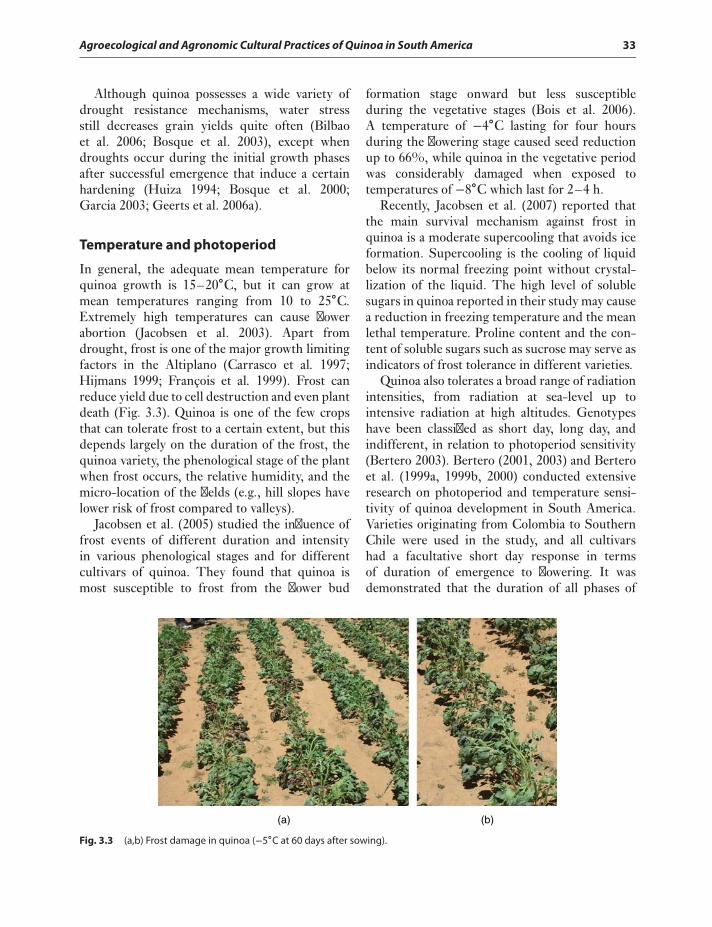
Agroecological and Agronomic Cultural Practices of Quinoa in South America 33
Although quinoa possesses a wide variety ofdrought resistance mechanisms, water stressstill decreases grain yields quite often (Bilbaoet al. 2006; Bosque et al. 2003), except whendroughts occur during the initial growth phasesafter successful emergence that induce a certainhardening (Huiza 1994; Bosque et al. 2000;Garcia 2003; Geerts et al. 2006a).
Temperature and photoperiod
In general, the adequate mean temperature forquinoa growth is 15–20∘C, but it can grow atmean temperatures ranging from 10 to 25∘C.Extremely high temperatures can cause flowerabortion (Jacobsen et al. 2003). Apart fromdrought, frost is one of the major growth limitingfactors in the Altiplano (Carrasco et al. 1997;Hijmans 1999; François et al. 1999). Frost canreduce yield due to cell destruction and even plantdeath (Fig. 3.3). Quinoa is one of the few cropsthat can tolerate frost to a certain extent, but thisdepends largely on the duration of the frost, thequinoa variety, the phenological stage of the plantwhen frost occurs, the relative humidity, and themicro-location of the fields (e.g., hill slopes havelower risk of frost compared to valleys).
Jacobsen et al. (2005) studied the influence offrost events of different duration and intensityin various phenological stages and for differentcultivars of quinoa. They found that quinoa ismost susceptible to frost from the flower bud
formation stage onward but less susceptibleduring the vegetative stages (Bois et al. 2006).A temperature of −4∘C lasting for four hoursduring the flowering stage caused seed reductionup to 66%, while quinoa in the vegetative periodwas considerably damaged when exposed totemperatures of −8∘C which last for 2–4 h.
Recently, Jacobsen et al. (2007) reported thatthe main survival mechanism against frost inquinoa is a moderate supercooling that avoids iceformation. Supercooling is the cooling of liquidbelow its normal freezing point without crystal-lization of the liquid. The high level of solublesugars in quinoa reported in their study may causea reduction in freezing temperature and the meanlethal temperature. Proline content and the con-tent of soluble sugars such as sucrose may serve asindicators of frost tolerance in different varieties.
Quinoa also tolerates a broad range of radiationintensities, from radiation at sea-level up tointensive radiation at high altitudes. Genotypeshave been classified as short day, long day, andindifferent, in relation to photoperiod sensitivity(Bertero 2003). Bertero (2001, 2003) and Berteroet al. (1999a, 1999b, 2000) conducted extensiveresearch on photoperiod and temperature sensi-tivity of quinoa development in South America.Varieties originating from Colombia to SouthernChile were used in the study, and all cultivarshad a facultative short day response in termsof duration of emergence to flowering. It wasdemonstrated that the duration of all phases of
(a) (b)
Fig. 3.3 (a,b) Frost damage in quinoa (−5∘C at 60 days after sowing).
34 Quinoa: Improvement and Sustainable Production
development is sensitive to photoperiod (Bertero2003). In the same way that water stress duringcertain phenological stages influences the dura-tion of subsequent phenological stages (Garcia2003), the duration of the photoperiod duringcertain phases also influences subsequent phasesand is called delayed response (Bertero 2003). Themean incident radiation affects the phyllochronin quinoa, with higher incident radiation causinglarger phyllochrons. However, cultivars withthe highest photoperiod sensitivity and largestphyllochron were insensitive to radiation (Bertero2001).
Temperature sensitivity was highest in quinoacultivars originating from cold and dry climatesbut lower in cultivars from warmer and humid cli-mates (Bertero et al. 2000), an observation that canpossibly explain why varieties from the highlandsare more affected by global warming. The highersensitivity of cultivars from regions with frequentlate season drought and frost predisposes them fora faster seed filling when photoperiods are short-ening and unfavorable conditions are approaching(Bertero 2003).
Hail
Hail, and sometimes snow, are sporadic and quitelocalized in the Andes (Jacobsen et al. 2003) butmay still cause substantial yield losses in quinoa,especially when flower buds are already present(Fig. 3.4, unpublished data). As is the case forother abiotic stresses, susceptibility to hail islargely dependent on the variety.
CULTIVATION
In the Andes, quinoa is mainly grown during theaustral summer months (September to May),although the sowing times markedly differ and insome equatorial areas cultivation may go beyondthat period. Similarly, the production techniquesare in accordance to the local ecosystem, and sodiffer from one system to another. In the areassurrounding the southern salt flats, traditionalcultivation includes field preparation carried outfrom March to May on virgin fields or fields
Fig. 3.4 Quinoa after hail damage (Del Castillo and Winkel,IRD – CLIFA, 2002–2008).
that are fallow to capture moisture from the laterains and some winter snows and store it for thefollowing season. Much of the intensity of fieldcultivation (plowing, breaking, harrowing, andleveling) depends on the years a field has beenfallow, the soil texture, and the availability of atractor.
In the northern Altiplano of Bolivia and Peru,field preparation is done either shortly afterharvest of the previous crop or before sowingafter the first rains. In Ecuador and Colombia, thecultivation period could range from November toFebruary, after the onset of the rainy season.
Sowing
Quinoa production in areas close to its cen-ter of origin goes from fully traditional tosemi-mechanized to fully mechanized. Fieldpreparation and sowing is carried out either byhand or tractor (Fig. 3.5). In general, it has to bestressed that mechanization often causes excessive
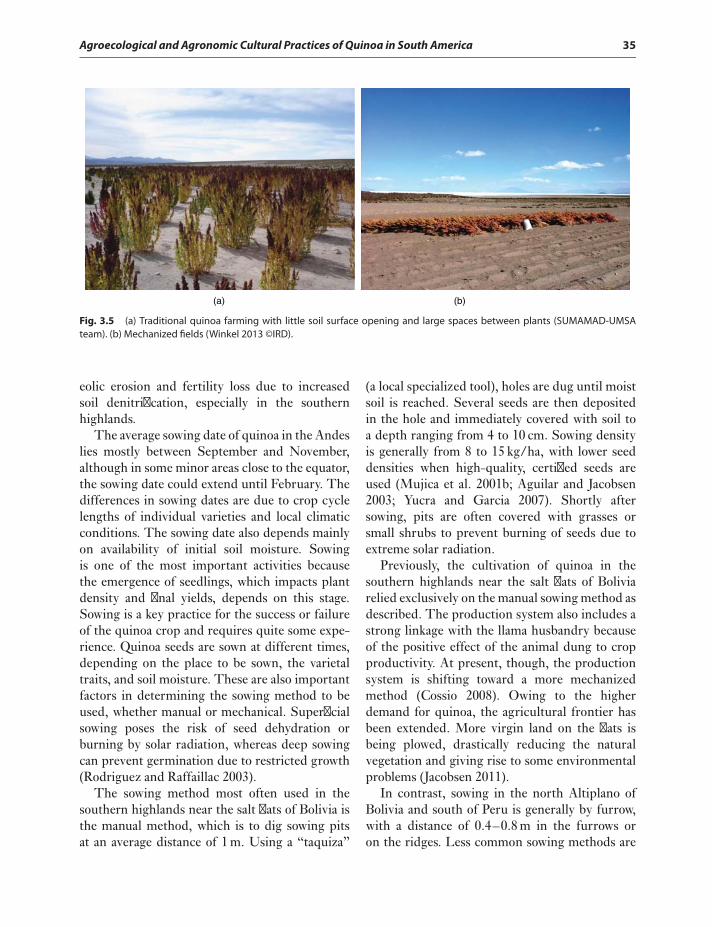
Agroecological and Agronomic Cultural Practices of Quinoa in South America 35
(a) (b)
Fig. 3.5 (a) Traditional quinoa farming with little soil surface opening and large spaces between plants (SUMAMAD-UMSAteam). (b) Mechanized fields (Winkel 2013 ©IRD).
eolic erosion and fertility loss due to increasedsoil denitrification, especially in the southernhighlands.
The average sowing date of quinoa in the Andeslies mostly between September and November,although in some minor areas close to the equator,the sowing date could extend until February. Thedifferences in sowing dates are due to crop cyclelengths of individual varieties and local climaticconditions. The sowing date also depends mainlyon availability of initial soil moisture. Sowingis one of the most important activities becausethe emergence of seedlings, which impacts plantdensity and final yields, depends on this stage.Sowing is a key practice for the success or failureof the quinoa crop and requires quite some expe-rience. Quinoa seeds are sown at different times,depending on the place to be sown, the varietaltraits, and soil moisture. These are also importantfactors in determining the sowing method to beused, whether manual or mechanical. Superficialsowing poses the risk of seed dehydration orburning by solar radiation, whereas deep sowingcan prevent germination due to restricted growth(Rodriguez and Raffaillac 2003).
The sowing method most often used in thesouthern highlands near the salt flats of Bolivia isthe manual method, which is to dig sowing pitsat an average distance of 1 m. Using a “taquiza”
(a local specialized tool), holes are dug until moistsoil is reached. Several seeds are then depositedin the hole and immediately covered with soil toa depth ranging from 4 to 10 cm. Sowing densityis generally from 8 to 15 kg/ha, with lower seeddensities when high-quality, certified seeds areused (Mujica et al. 2001b; Aguilar and Jacobsen2003; Yucra and Garcia 2007). Shortly aftersowing, pits are often covered with grasses orsmall shrubs to prevent burning of seeds due toextreme solar radiation.
Previously, the cultivation of quinoa in thesouthern highlands near the salt flats of Boliviarelied exclusively on the manual sowing method asdescribed. The production system also includes astrong linkage with the llama husbandry becauseof the positive effect of the animal dung to cropproductivity. At present, though, the productionsystem is shifting toward a more mechanizedmethod (Cossio 2008). Owing to the higherdemand for quinoa, the agricultural frontier hasbeen extended. More virgin land on the flats isbeing plowed, drastically reducing the naturalvegetation and giving rise to some environmentalproblems (Jacobsen 2011).
In contrast, sowing in the north Altiplano ofBolivia and south of Peru is generally by furrow,with a distance of 0.4–0.8 m in the furrows oron the ridges. Less common sowing methods are
36 Quinoa: Improvement and Sustainable Production
by transplanting (inter-Andean valleys) to avoidintensive weeding later on or by broadcasting theseeds. In the inter-Andean valleys of Ecuador andColombia, the traditional cultivation techniqueconsists of sowing under dry conditions inrotation with potato or on strips in maize crops,with little soil preparation and using only theresidual organic fertilizers from the precedingcrop. Sowing density varies between 15 and 20 kgseeds/ha. Regardless of the area where quinoais cultivated, traditional Andean growers alwayslook to reduce the risk, and sow several ecotypesat different times and in different locations.
Fertilization of quinoa
One of the problems in quinoa cultivation is thelocal belief that as it is an indigenous crop, it isunnecessary to provide a large quantity of exter-nal inputs. Actual field application by farmers isnot a priority, although animal dung is applied toquinoa fields or pits, when available.
Research on quinoa fertilization has beenlimited. Schulte auf’m Erley et al. (2005)reported that quinoa responds strongly tonitrogen fertilization, producing up to 3.5 t/hawith a fertilization rate of 120 kg N/ha withoutreduction in nitrogen use efficiency. Harvestindexes were not affected by nitrogen applicationbut grain nitrogen content increased significantly.Murillo (1995) investigated the application of80 kg N/ha for quinoa in Bolivia at sowing,without additional P or K application. Yieldand grain quality increased significantly. More-over, they reported the necessity of additionalirrigation to facilitate nitrogen absorption whenrainfall is inadequate. Berti et al. (1997) applied0–225 kg N/ha to quinoa sown at sea level inChile and found the highest yields (3,555 kg/ha)at the highest fertilizer levels. The yield responseto increasing N fertilization was quadratic inshape, and a slight decrease in nitrogen use effi-ciency was noted up to 225 kg N/ha. Moreover,the harvest index was significantly lower for treat-ments with high N fertilizer application. In otherChilean experiments, yields up to 5 t/ha werereported for quinoa fertilized with N combinedwith drip irrigation (De la Torre-Herrera 2003).
To ensure an adequate nutrient supply forcrops, growers must strive to maintain a goodbalance of nutrients in the soil (Miranda 2012).The loss of nutrients has to be minimized, whilemaximizing efficiency in their addition as theirremoval during harvest is unavoidable. The higherand better the quality of yield is, the greater theremoval of soil nutrients. Therefore, to increasequinoa yields in a sustainable way, it is extremelyimportant to consider application of fertilizers,particularly as quinoa is well known for the highquality of its protein, suggesting a strong nitrogendemand from the soil. Without fertilizers, therecould be permanent soil nitrogen and nutrientdepletion, rapidly degrading an already poor soil.
As the organic market is the largest nichemarket for quinoa, most fertilization researchhad been conducted on the application and useefficiency of manure in fields. The application oforganic fertilizers, especially manure, at inappro-priate times and quantities will not necessarilyimprove soil characteristics but may even havenegative effects on the soils, especially over theshort-term period. The actual incorporation ofmanure into the soil in farmers’ fields ranges onlyfrom 4 to 10 t/ha. Small quantities of manureincorporated within the production systems willincrease field labor but with negligible effect onyield. With such results, farmers get discouragedand forgo manure application. To have a signifi-cant effect, manure should be applied at higherrates, up to 20–30 t/ha, to guarantee adequaterevenue from crop harvest and commercialization,in addition to maintaining good soil structure(Miranda 2012). An adequate soil and waterbalance, as well as water availability during criticalperiods, is essential to reap benefits from soilfertilization, especially manure application.
The timing of fertilization is also impor-tant when working solely with organic fertilizers.There is limited effect on crop yield when manureis applied during sowing because the nitrogenwill be liberated approximately 50–60 days afterapplication, especially in the highlands of theAndes. The low air and soil temperatures preventthe rapid decomposition of manure and resultin a slow release of nutrients. The best time toapply manure is around 2 months before sowing,
Agroecological and Agronomic Cultural Practices of Quinoa in South America 37
or at least 45 days, to adequately age the manure.Working with compost, Miranda et al. (2012)demonstrated a reduction in the time needed formanure to be decomposed and showed the bene-fits to the crop because of the accelerated ageing ofmanure.
In general, in the northern Andes, wherequinoa is sown after potatoes, organic mattercontent and nutrients is favorable for quinoa. Insome cases, the slow decomposition of manure,coupled with previous application of nutrientsfor the potato crop, almost fulfill the nutrientrequirements of quinoa. Afterward, the crop onlyneeds supplemental fertilization.
However, when planted after a grain crop (cornor wheat on the coast and barley or oats in themountains), it is necessary to use organic matter ina ratio of at least 3 t/ha. The average fertilizationrequired is in the formula 80-40-00, equivalent to174 kg/ha of 46% urea, 88 kg/ha of 46% triplecalcium, and zero potassium. Potassium is freelyavailable in the soils of the Andes and in SouthAmerica in general, as there are large quantitiesof potassium-retaining clays in the soils.
On the coast, soil nutrients are scarce as theamount of organic matter is extremely low andsoils are very sandy. In general, the formularecommended for fertilization is 240-200-80,equivalent to 523 kg/ha of 46% urea, 435 kg/haof superphosphate, 46% calcium triple, and134 kg/ha of 60% potassium chloride. In addi-tion, application of manure, compost, humus, ororganic matter is recommended, when available.
Cultural practices
Cultivation is limited to one or two hoeings,with an occasional hilling-up, particularly in theinter-Andean valleys. Hoeing is done duringthe first phenological phases, whereas hilling-upis specific for furrow-sown quinoa and is alsoused for additional fertilization just before budformation to optimize yields. When there isexcessive vegetative growth, hilling-up can benecessary to avoid plant lodging due to heavycanopy. Also, thinning of plants is necessary toprevent intraspecific competition. If sown in
rows, quinoa plants should be spaced around10 cm apart (Aguilar and Jacobsen 2003).
Early weeding (±30 days after sowing) is impor-tant in quinoa fields in the Altiplano as plantscompete with each other for scarce nutrients(De Barros Santos et al. 2003; Bhargava et al.2006). Additional weeding is generally carriedout around flowering (±90 days after sowing).Chemical weed control is not recommended soas to preserve field biota. In the case of organicquinoa, chemical weed control is prohibited.
Crop water requirements and irrigation
Quinoa is known largely for its drought resis-tance (Jensen et al. 2000; Geerts et al. 2008a).Therefore, it is traditionally cultivated underrain-fed conditions, even in semi-arid and veryarid locations. However, this high drought resis-tance is often translated in low yields, becausequinoa sacrifices yield for survival and adap-tation. Under this consideration, Geerts et al.(2008a, 2008b) studied the impact of additionalwater on quinoa production and found deficitirrigation (DI) to be highly beneficial in variousexperimental locations. DI is already practiced inthe re-introduction of quinoa in the arid regionsof Chile (Martínez et al. 2009). On the otherhand, quinoa is rarely grown under full irrigation,probably because it is not traditional and becauseit does not respond well to high irrigation due tothe increased risk of downy mildew.
Analysis of water requirements showed howmuch water quinoa requires for “optimal” pro-duction (Garcia et al. 2003). The analysis alsodetermined which stages in quinoa productioncould be more efficient regarding water con-sumption and transformation into yield. The ideawas to apply DI with the aim of concentratingirrigation during the most sensitive crop stages,while maximizing water use efficiency (WUE).The results were quite significant, showing thatregardless of the cropping location, the mostsensitive stages for successful or at least mediumyields were crop establishment (emergence) andflowering. Moreover, an adequate balance betweenevapotranspiration before and after anthesis, witha larger proportion of water consumed after
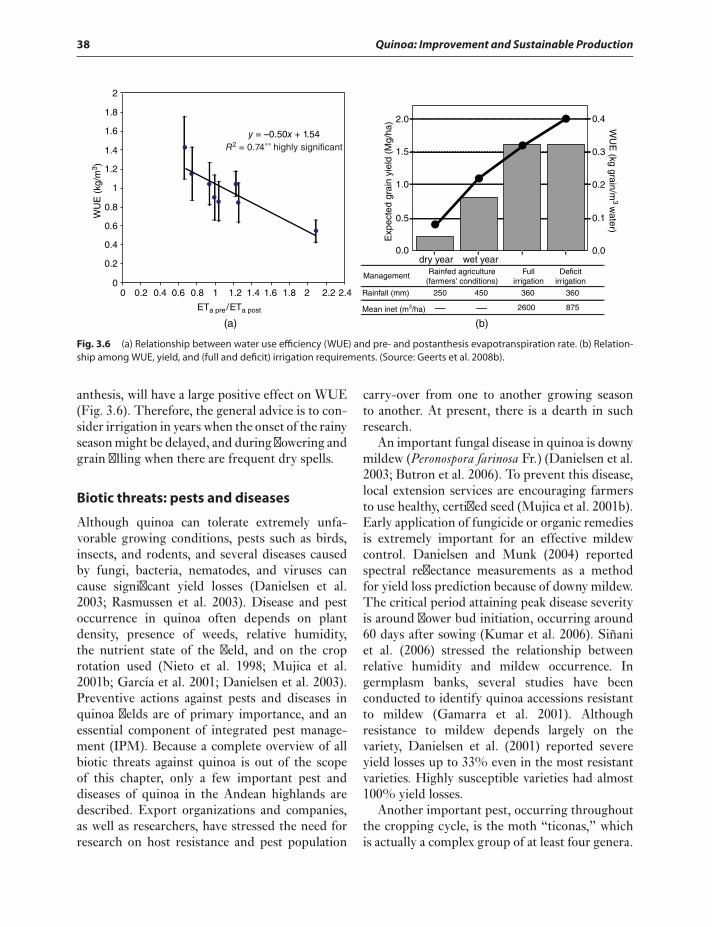
38 Quinoa: Improvement and Sustainable Production
2
1.8
1.6
1.4
1.2
1
0.8
0.6
0.4
0.2
0
WU
E (
kg/m
3 )
y = –0.50x + 1.54R2 = 0.74∗∗ highly significant
0 0.2 0.4 0.6 0.8 1 1.2 1.4 1.6 1.8 2 2.2 2.4
ETa pre/ETa post
(a) (b)
2.0
1.5
1.0
0.5
0.0
Exp
ecte
d gr
ain
yiel
d (M
g/ha
)
dry year wet year0.0
0.1
0.2
0.3
0.4
WU
E (kg grain/m
3 water)
Management
Rainfall (mm)
Mean inet (m3/ha)
Rainfed agriculture(farmers' conditions)
250 450 360 360
2600 875
Fullirrigation
Deficitirrigation
— —
Fig. 3.6 (a) Relationship between water use efficiency (WUE) and pre- and postanthesis evapotranspiration rate. (b) Relation-ship among WUE, yield, and (full and deficit) irrigation requirements. (Source: Geerts et al. 2008b).
anthesis, will have a large positive effect on WUE(Fig. 3.6). Therefore, the general advice is to con-sider irrigation in years when the onset of the rainyseason might be delayed, and during flowering andgrain filling when there are frequent dry spells.
Biotic threats: pests and diseases
Although quinoa can tolerate extremely unfa-vorable growing conditions, pests such as birds,insects, and rodents, and several diseases causedby fungi, bacteria, nematodes, and viruses cancause significant yield losses (Danielsen et al.2003; Rasmussen et al. 2003). Disease and pestoccurrence in quinoa often depends on plantdensity, presence of weeds, relative humidity,the nutrient state of the field, and on the croprotation used (Nieto et al. 1998; Mujica et al.2001b; García et al. 2001; Danielsen et al. 2003).Preventive actions against pests and diseases inquinoa fields are of primary importance, and anessential component of integrated pest manage-ment (IPM). Because a complete overview of allbiotic threats against quinoa is out of the scopeof this chapter, only a few important pest anddiseases of quinoa in the Andean highlands aredescribed. Export organizations and companies,as well as researchers, have stressed the need forresearch on host resistance and pest population
carry-over from one to another growing seasonto another. At present, there is a dearth in suchresearch.
An important fungal disease in quinoa is downymildew (Peronospora farinosa Fr.) (Danielsen et al.2003; Butron et al. 2006). To prevent this disease,local extension services are encouraging farmersto use healthy, certified seed (Mujica et al. 2001b).Early application of fungicide or organic remediesis extremely important for an effective mildewcontrol. Danielsen and Munk (2004) reportedspectral reflectance measurements as a methodfor yield loss prediction because of downy mildew.The critical period attaining peak disease severityis around flower bud initiation, occurring around60 days after sowing (Kumar et al. 2006). Siñaniet al. (2006) stressed the relationship betweenrelative humidity and mildew occurrence. Ingermplasm banks, several studies have beenconducted to identify quinoa accessions resistantto mildew (Gamarra et al. 2001). Althoughresistance to mildew depends largely on thevariety, Danielsen et al. (2001) reported severeyield losses up to 33% even in the most resistantvarieties. Highly susceptible varieties had almost100% yield losses.
Another important pest, occurring throughoutthe cropping cycle, is the moth “ticonas,” whichis actually a complex group of at least four genera.
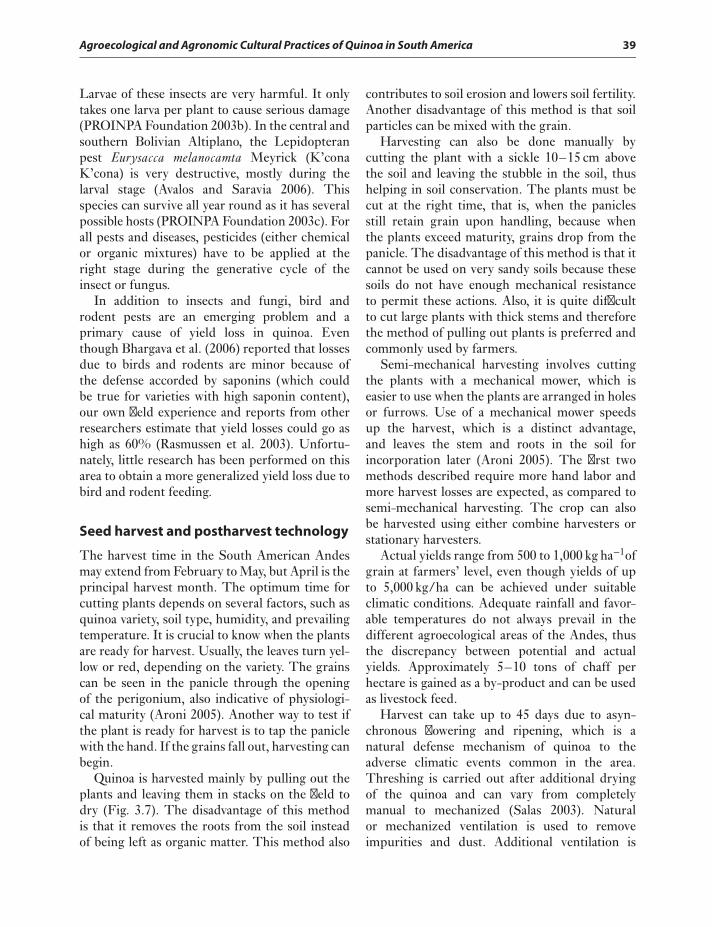
Agroecological and Agronomic Cultural Practices of Quinoa in South America 39
Larvae of these insects are very harmful. It onlytakes one larva per plant to cause serious damage(PROINPA Foundation 2003b). In the central andsouthern Bolivian Altiplano, the Lepidopteranpest Eurysacca melanocamta Meyrick (K’conaK’cona) is very destructive, mostly during thelarval stage (Avalos and Saravia 2006). Thisspecies can survive all year round as it has severalpossible hosts (PROINPA Foundation 2003c). Forall pests and diseases, pesticides (either chemicalor organic mixtures) have to be applied at theright stage during the generative cycle of theinsect or fungus.
In addition to insects and fungi, bird androdent pests are an emerging problem and aprimary cause of yield loss in quinoa. Eventhough Bhargava et al. (2006) reported that lossesdue to birds and rodents are minor because ofthe defense accorded by saponins (which couldbe true for varieties with high saponin content),our own field experience and reports from otherresearchers estimate that yield losses could go ashigh as 60% (Rasmussen et al. 2003). Unfortu-nately, little research has been performed on thisarea to obtain a more generalized yield loss due tobird and rodent feeding.
Seed harvest and postharvest technology
The harvest time in the South American Andesmay extend from February to May, but April is theprincipal harvest month. The optimum time forcutting plants depends on several factors, such asquinoa variety, soil type, humidity, and prevailingtemperature. It is crucial to know when the plantsare ready for harvest. Usually, the leaves turn yel-low or red, depending on the variety. The grainscan be seen in the panicle through the openingof the perigonium, also indicative of physiologi-cal maturity (Aroni 2005). Another way to test ifthe plant is ready for harvest is to tap the paniclewith the hand. If the grains fall out, harvesting canbegin.
Quinoa is harvested mainly by pulling out theplants and leaving them in stacks on the field todry (Fig. 3.7). The disadvantage of this methodis that it removes the roots from the soil insteadof being left as organic matter. This method also
contributes to soil erosion and lowers soil fertility.Another disadvantage of this method is that soilparticles can be mixed with the grain.
Harvesting can also be done manually bycutting the plant with a sickle 10–15 cm abovethe soil and leaving the stubble in the soil, thushelping in soil conservation. The plants must becut at the right time, that is, when the paniclesstill retain grain upon handling, because whenthe plants exceed maturity, grains drop from thepanicle. The disadvantage of this method is that itcannot be used on very sandy soils because thesesoils do not have enough mechanical resistanceto permit these actions. Also, it is quite difficultto cut large plants with thick stems and thereforethe method of pulling out plants is preferred andcommonly used by farmers.
Semi-mechanical harvesting involves cuttingthe plants with a mechanical mower, which iseasier to use when the plants are arranged in holesor furrows. Use of a mechanical mower speedsup the harvest, which is a distinct advantage,and leaves the stem and roots in the soil forincorporation later (Aroni 2005). The first twomethods described require more hand labor andmore harvest losses are expected, as compared tosemi-mechanical harvesting. The crop can alsobe harvested using either combine harvesters orstationary harvesters.
Actual yields range from 500 to 1,000 kg ha−1ofgrain at farmers’ level, even though yields of upto 5,000 kg/ha can be achieved under suitableclimatic conditions. Adequate rainfall and favor-able temperatures do not always prevail in thedifferent agroecological areas of the Andes, thusthe discrepancy between potential and actualyields. Approximately 5–10 tons of chaff perhectare is gained as a by-product and can be usedas livestock feed.
Harvest can take up to 45 days due to asyn-chronous flowering and ripening, which is anatural defense mechanism of quinoa to theadverse climatic events common in the area.Threshing is carried out after additional dryingof the quinoa and can vary from completelymanual to mechanized (Salas 2003). Naturalor mechanized ventilation is used to removeimpurities and dust. Additional ventilation is
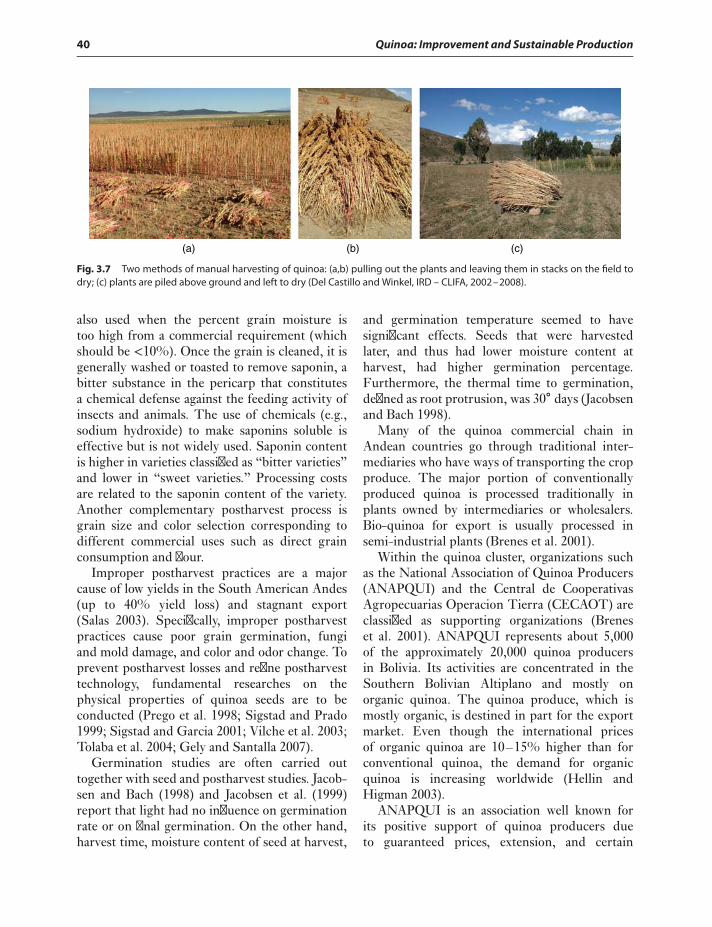
40 Quinoa: Improvement and Sustainable Production
(a) (b) (c)
Fig. 3.7 Two methods of manual harvesting of quinoa: (a,b) pulling out the plants and leaving them in stacks on the field todry; (c) plants are piled above ground and left to dry (Del Castillo and Winkel, IRD – CLIFA, 2002–2008).
also used when the percent grain moisture istoo high from a commercial requirement (whichshould be <10%). Once the grain is cleaned, it isgenerally washed or toasted to remove saponin, abitter substance in the pericarp that constitutesa chemical defense against the feeding activity ofinsects and animals. The use of chemicals (e.g.,sodium hydroxide) to make saponins soluble iseffective but is not widely used. Saponin contentis higher in varieties classified as “bitter varieties”and lower in “sweet varieties.” Processing costsare related to the saponin content of the variety.Another complementary postharvest process isgrain size and color selection corresponding todifferent commercial uses such as direct grainconsumption and flour.
Improper postharvest practices are a majorcause of low yields in the South American Andes(up to 40% yield loss) and stagnant export(Salas 2003). Specifically, improper postharvestpractices cause poor grain germination, fungiand mold damage, and color and odor change. Toprevent postharvest losses and refine postharvesttechnology, fundamental researches on thephysical properties of quinoa seeds are to beconducted (Prego et al. 1998; Sigstad and Prado1999; Sigstad and Garcia 2001; Vilche et al. 2003;Tolaba et al. 2004; Gely and Santalla 2007).
Germination studies are often carried outtogether with seed and postharvest studies. Jacob-sen and Bach (1998) and Jacobsen et al. (1999)report that light had no influence on germinationrate or on final germination. On the other hand,harvest time, moisture content of seed at harvest,
and germination temperature seemed to havesignificant effects. Seeds that were harvestedlater, and thus had lower moisture content atharvest, had higher germination percentage.Furthermore, the thermal time to germination,defined as root protrusion, was 30∘ days (Jacobsenand Bach 1998).
Many of the quinoa commercial chain inAndean countries go through traditional inter-mediaries who have ways of transporting the cropproduce. The major portion of conventionallyproduced quinoa is processed traditionally inplants owned by intermediaries or wholesalers.Bio-quinoa for export is usually processed insemi-industrial plants (Brenes et al. 2001).
Within the quinoa cluster, organizations suchas the National Association of Quinoa Producers(ANAPQUI) and the Central de CooperativasAgropecuarias Operacion Tierra (CECAOT) areclassified as supporting organizations (Breneset al. 2001). ANAPQUI represents about 5,000of the approximately 20,000 quinoa producersin Bolivia. Its activities are concentrated in theSouthern Bolivian Altiplano and mostly onorganic quinoa. The quinoa produce, which ismostly organic, is destined in part for the exportmarket. Even though the international pricesof organic quinoa are 10–15% higher than forconventional quinoa, the demand for organicquinoa is increasing worldwide (Hellin andHigman 2003).
ANAPQUI is an association well known forits positive support of quinoa producers dueto guaranteed prices, extension, and certain
Agroecological and Agronomic Cultural Practices of Quinoa in South America 41
mechanization (Magliocca 2002). The impactof such an organization is proof of the positiveeffect of integrating activities at various levelsof the market and processing chain. There isalso increased jurisdictional security by havingan association of farmers. However, restrictionson the use of agricultural inputs, in some casesnot adapted to local family production, make itextremely difficult for farmers to practice organicagriculture. In fact, farmers in other areas ofthe Andes do not produce much organic quinoabecause they prefer to spend their labor on cropsthat they perceive to be less labor intensive andmore economically rewarding.
Hellin and Higman (2003) investigated thestability and viability of potato and quinoaproduction systems in Bolivia, Ecuador, andPeru under current market pressure. They reportthat quinoa consumption has been improvedby government-sponsored initiatives that usequinoa in food support programs (e.g., free schoolmeals). Initiatives by private or nongovernmentorganizations also strengthen quality production,processing, public image, and market accessamong smallholder producers. Private as well aspublic interventions are essential and are to besupported in remote areas where quinoa is oftenthe only subsistence crop (Hellin and Higman2003).
REFERENCES
Aguilar PC, Cutipa Z, Machaca E, López M, Jacobsen, SE. 2003.Variation of proline content of quinoa (Chenopodium quinoaWilld.) in high beds (waru waru). Food Rev Int 19:121–127.
Aguilar PC, Jacobsen SE. 2003. Cultivation of quinoa on thePeruvian Altiplano. Food Rev Int 19:31–41.
Angiosperm Phylogeny Group. 2003. An update of theAngiosperm Phyllogeny Group classification for the ordersand families of flowering plants: APG II. Bot J Linnean Soc141:399–436.
Aroni JC. 2005. Fascículo 5 – Cosecha y poscosecha. In:PROINPA y FAUTAPO, editors. Serie de Módulos Publi-cados en Sistemas de Producción Sostenible en el Cultivode la Quinoa: Módulo 2. Manejo agronómico de la QuinoaOrgánica. Fundación PROINPA, Fundación AUTAPO,Embajada Real de los Países Bajos. La Paz, Bolivia. Octubrede 2005. pp. 87–102.
Avalos FL, Saravia R. 2006. Ciclo biológico, fluctuaciónpoblacional e identificación de la Kcona Kcona, plaga del
cultivo de la quinoa. In: Del Castillo C, Garcia M, VacherJJ, Winkel T, editors. Compendio de resúmenes de tesisde grado e investigaciones realizadas en quinoa, cañahua,amaranto y papa en la facultad de agronomía de la UMSAentre 1991 y 2006. Facultad de Agronomía, UMSA - IRD,Francia - QuinAgua, VLIR & K.U. Leuven, Bélgica, La Paz,Bolivia. p. 21.
Bertero HD. 2001. Effects of photoperiod, temperature and radi-ation on the rate of leaf appearance in quinoa (Chenopodiumquinoa Willd.) under field conditions. Ann Bot 87:495–502.
Bertero HD. 2003. Response of developmental processes totemperature and photoperiod in quinoa (Chenopodium quinoaWilld.). Food Rev Int 19:87–97.
Bertero HD, King RW, Hall AJ. 1999a. Photoperiod-sensitivedevelopment phases in quinoa (Chenopodium quinoa Willd.).Field Crops Res 60:231–243.
Bertero HD, King RW, Hall AJ. 1999b. Modeling photope-riod and temperature responses of flowering in quinoa(Chenopodium quinoa Willd.). Field Crops Res 63:19–34.
Bertero HD, King RW, Hall AJ. 2000. Photoperiod andtemperature effects on the rate of leaf appearance inquinoa (Chenopodium quinoa Willd.). Aust J Plant Physiol27:349–356.
Bertero HD, De la Vega AJ, Correa G, Jacobsen SE, Mujica A.2004. Genotype and genotype-by-environment interactioneffects for grain yield and grain size of quinoa (Chenopodiumquinoa Willd.) as revealed by pattern analysis of internationalmulti-environment trials. Field Crops Res 89:299–318.
Berti M, Wilckens R, Hevia F, Serri H, Vidal I, Mendez C. 1997.Fertilizacion nitrogenada en Quinoa (Chenopodium quinoaWilld.). Ciencia de Investigacion Agraria 27:81–90.
Bhargava A, Shukla S, Ohri D. 2006. Chenopodium quinoa- AnIndian perspective. Ind Crops Prod 23:73–87.
Bilbao M, Espíndola G, Peric Y. 2006. Semilla basica porselección masal estratificada en ocho variedades de quinoa(Chenopodium quinoa Willd.). In: Del Castillo C, Garcia M,Vacher JJ, Winkel T, editors. Compendio de resúmenes detesis de grado e investigaciones realizadas en quinoa, cañahua,amaranto y papa en la facultad de agronomía de la UMSAentre 1991 y 2006. Facultad de Agronomía, UMSA - IRD,Francia - QuinAgua, VLIR & K.U. Leuven, Bélgica, La Paz,Bolivia. p. 22.
Bois JF, Winkel T, Lhomme JP, Raffaillac JP, Rocheteau A. 2006.Response of some Andean cultivars of quinoa (Chenopodiumquinoa Willd.) to temperature: effects on germination,phenology, growth and freezing. Eur J Agron 25:299–308.
Bonifacio A. 2001. Recursos genéticos, etnobotánica y dis-tribución geográfica. In: Mujica A, Jacobsen SE, IzquierdoJ, Marathee JP, editors. Primer taller internacional sobrequinoa. Cultivos Andinos. [CD-ROM]. Santiago: FAO,UNA-Puno, CIP.
Bonifacio A. 2003. Chenopodium sp.: genetic resources, ethnob-otany, and geographic distribution. Food Rev Int 19:1–7.
Bosque H, Lemeur R, Van Damme P. 2006. La fluorescencia dela clorofila, una herramienta para estudios de la fisiologia del
42 Quinoa: Improvement and Sustainable Production
estres: experiencia con la quinoa (Chenopodium quinoa Willd.).Revista Ciencia y Tecnología Agropecuaria 1:38–43.
Bosque HD. 1998. Ecophysiological analysis of drought and salin-ity stress of quinoa (Chenopodium quinoa Willd.). MSc thesisin Soil Science and Eremology. Faculty of Science, Facultyof Agricultural and Applied Biological Sciences, Universityof Gent. International Center for Eremology, Gent, Belgium.122 p.
Bosque H, Lemeur R, Van Damme P. 2000. Análisis ecofi-siológico del cultivo de la quínua (Chenopodium quinoaWilld.) en condiciones de estrés de la sequía y la salinidad.Tropicultura 18:198–202.
Bosque H, Lemeur R, Van Damme P, Jacobsen SE. 2003. Eco-physiological analysis of drought and salinity stress of quinoa(Chenopodium quinoa Willd.). Food Rev Int 19:111–119.
Bravo R, Catacora P. 2010. Situación actual de los bancosnacionales de germoplasma. In: Bravo R, Valdivia R, AndradeK, Padulosi S, Jagger M, editors. Granos Andinos: avances,logros y experiencias desarrolladas en quinoa, cañihua ykiwicha en Perú. Roma, Italia: Biodiversity International. pp.15–18.
Brenes ER, Madrigal K, Condo A. 2001. El cluster de quinoa enBolivia: diagnostico competitivo y recomendaciones estratég-icas (Proyecto Andino de Competitividad).
Butron R, Mamani F, Coca Moranti M. 2006. Estudio de laincidencia y severidad del mildiu (Peronospora farinosa Fr.) ennueve variedades de quinoa en la estación experimental Belén.In: Del Castillo C, Garcia M, Vacher JJ, Winkel T, editors.Compendio de resúmenes de tesis de grado e investigacionesrealizadas en quinoa, cañahua, amaranto y papa en la facultadde agronomía de la UMSA entre 1991 y 2006. Facultad deAgronomía, UMSA - IRD, Francia - QuinAgua, VLIR &KULeuven, Bélgica, La Paz, Bolivia. p. 19.
Cardenas M. 1944. Descripción preliminar de las variedades deChenopodium quinoa de Bolivia. Revista de Agricultura. Uni-versidad Mayor San Simón de Cochabamba 2(2):13–26.
Carrasco E, Devaux A, Garcia W, Esprella R. 1997. Frost-tolerantpotato varieties for the Andean Highlands. In: CIP ProgramReport 1995–1996. Lima, Perú: Centro Internacional de laPapa (CIP). pp. 227–232.
Cossio J. 2008: Agricultura de conservación con un enfoquede manejo sostenible en el Altiplano sur. Revista Habitat75:44–49.
Cronquist A. 1981. An integrated system of classification of flow-ering plants. The New York Botanical Garden, New York:Colombia University Press. 1262 pp.
Cusack DF. 1984. Quinoa: grain of the Incas. The Ecologist14:21–30.
Danielsen S, Bonifacio A, Ames T. 2003.Diseases of quinoa(Chenopodium quinoa). Food Rev Int 19:43–59.
Danielsen S, Jacobsen SE, Echegaray J, Ames T. 2001. Impactof downy mildew on the yield of quinoa. Lima, Perú: CentroInternacional de la Papa (CIP). pp. 397–401.
Danielsen S, Munk L. 2004. Evaluation of disease assessmentmethods in quinoa for their ability to predict yield loss causedby downy mildew. Crop Prot 23:219–228.
De Barros Santos RL, Spehar, CR, Vivaldi L. 2003. Quinoa(Chenopodium quinoa) reaction to herbicide residue in aBrazilian Savannah soil. Pesquisa Agropecuária Brasileira,Brasília 38:771–776.
Del Castillo C, Winkel T, Mahy G, Bizoux JP. 2007. Geneticstructure of quinoa (Chenopodium quinoa Willd.) from theBolivian altiplano as revealed by RAPD markers. Genet ResCrop Evol 54:897–905.
Del Castillo C, Mahy G, Winkel T. 2008. La quinoa enBolivie: une culture ancestrale devenue culture de rente“bio-équitable.” Biotechnol Agron Soc Environ 12(4):421–435.
De la Torre-Herrera J. 2003. Current use of quinoa in Chile. FoodRev Int 19:155–165.
Erquinigo F. 1970. Biología floral de la quinoa (Chenopodiumquinoa Willd.). Tesis Ing. Agro. Facultad de Agronomía.Puno, Perú: Universidad Técnica del Altiplano. p. 89.
Espindola G. 1980. Estudio de componentes directos e indirectosdel rendimiento en quinoa (Chenopodium quinoa Willd.). Tesisde Grado, Facultad de Ciencias Agrícolas y Pecuarias ’MartinCardenas’, Cochabamba, Bolivia.
Espindola G. 1992. V curso de producción de quinoa. Centroexperimental para la industrialización de la quinoa. La Paz,Bolivia: Proyecto PNUD, FAO, MACA-IBTA. p. 70.
FAO. 2011. Quinoa: An ancient crop to contribute to world foodsecurity Regional office for Latin America and the Caribbean,60 pp.
Fox P, Rockström J. 2000. Water-harvesting for supplementalirrigation of cereal crops to overcome intra-seasonaldry-spells in the Sahel. Phys Chem Earth 25:289–296.
François C, Bosseno R, Vacher JJ, Seguin B. 1999. Frost riskmapping derived from satellite and surface data over theBolivian Altiplano. Agr Forest Meteorol 95:113–137.
Gallardo M, Gonzalez J, Ponessa G. 1997. Morfologia del frutoy semilla de Chenopodium quinoa Willd (“quinoa”) Chenopo-diaceae. (Fruit and seed morphology of Chenopodium quinoaWilld (“quinoa”) Chenopodiaceae.) Lilloa 39(1):71–80.
Galwey NW. 1993. The potential of quinoa as a multi-purposecrop for agricultural diversification: a review. Ind Crops Prod1:101–106.
Gamarra M, Bonifacio A, Peralta E. 2001. Mejoramiento geneticoy participativo en quinoa al mildeu en Peru, Bolivia y Ecuador.Program text of the “Programa Nacional de Investigación enCultivos Andinos.”
Gandarillas H. 1979. Genética y origen. In: Tapia M (ed). Quinuay Kañiwa, cultivos andinos. Bogota, Colombia, CIID, OficinaRegional para América Latina. pp. 45–64.
Garcia M. 2003. Agroclimatic study and drought resistanceanalysis of quinoa for an irrigation strategy in the BolivianAltiplano. Dissertationes de Agricultura, Faculty of AppliedBiological Sciences, K.U. Leuven, Belgium. 556. p. 184.
Agroecological and Agronomic Cultural Practices of Quinoa in South America 43
Garcia M, Raes D, Jacobsen SE. 2003. Evapotranspirationanalysis and irrigation requirements of quinoa (Chenopodiumquinoa) in the Bolivian highlands. Agr Water Manage60:119–134.
Garcia M, Raes D, Jacobsen SE, Michel T. 2007. Agroclimaticconstraints for rainfed agriculture in the Bolivian Altiplano. JArid Env 71(1):109–121.
García S, Marcos JF, Pallás V, Sánchez-Pina MA. 2001. Influ-ence of the plant growing conditions on the translocationroutes and systemic infection of carnation mottle virusin Chenopodium quinoa plants. Physiol Mol Plant Pathol58:229–238.
Garreaud R, Vuille M, Clement AC. 2003.The climate of theAltiplano: observed current conditions and mechanismsof past changes. Palaeogeogr Palaeoclimatol Palaeoecol194:5–22.
Geerts S, Mamani RS, Garcia M, Raes D. 2006a. Response ofquinoa (Chenopodium quinoa Willd.) to differential droughtstress in the Bolivian Altiplano: towards a deficit irrigationstrategy within a water scarce region. Proceedings of the 1stInternational Symposium on Land and Water Managementfor Sustainable Irrigated Agriculture. CD-rom and book ofabstracts. p. 200.
Geerts S, Raes D, Garcia M, Del Castillo C, Buytaert W. 2006b.Agro-climatic suitability mapping for crop production in theBolivian Altiplano: a case study for quinoa. Agr Forest Mete-orol 139:399–412.
Geerts S, Raes D, Garcia M, Condori O, Mamani J, MirandaR, Cusicanqui J, Taboada C, Vacher J. 2008a. Could deficitirrigation be a sustainable practice for quinoa (Chenopodiumquinoa Willd.) in the Southern Bolivian Altiplano? AgricWater Manage 95:909–917.
Geerts S, Raes D, Garcia M, Vacher J, Mamani R, Mendoza J,Huanca R, Morales R, Miranda B, Cusicanqui J, TaboadaC. 2008b. Introducing deficit irrigation to stabilize yieldsof quinoa (Chenopodium quinoa Willd.). Eur J Agron28:427–436.
Gely MC, Santalla EM. 2007. Moisture diffusivity in quinoa(Chenopodium quinoa Willd.) seeds: effect of air temperatureand initial moisture content of seeds. J Food Eng 78 (3):1029–1033.
Gonzalez JA, Prado FE. 1992. Germination in relation to salinityand temperature in Chenopodium quinoa Willd. Agrochimica36:101–107.
Hariadi Y, Marandon K, Tian Y, Jacobsen S-E, Shabala S. 2011.Ionic and osmotic relations in quinoa (Chenopodium quinoaWilld.) plants grown at various salinity levels. J Exp Bot62:185–193.
Hellin J, Higman S. 2003. Quinoa and food security. In: HellinJ, Higman S, editors. Feeding the market: South Americanfarmers, trade and globalization. UK: University of Manch-ester. pp. 131-169.
Hermann M, Heller J. (eds). 1997. Andean Roots and Tubers.Promoting the Conservation and Use of Underutilized andNeglected Crops. 21. Institute of Plant Genetics and Crop
Plant Research, Gatersleben/International Plant GeneticResources Institute, Rome, 256 p.
Hijmans RJ. 1999. Estimating frost risk in potato productionon the Altiplano using interpolated climate data. In:Internacional de la Papa (CIP) Program Report 1997–1998.Lima, Peru: CIP. pp. 373–380.
Huiza LZ. 1994. Efecto del déficit hídrico a marchitez intensasobre el ritmo de crecimiento de la quinoa (Chenopodiumquinoa Willd.). Tesis de grado de la Facultad de Agronomía,La Paz, Bolivia: UMSA.
Jacobsen SE. 2003. Quinoa - research and development at theInternational Potato Center (CIP). Lima, Perú: CIP. p. 5.
Jacobsen SE, Mujica A. 1999. Fisiología de la resistencia a sequíaen quinoa (Chenopodium quinoa Willd.). Lima, Peru: CentroInternacional de la Papa (CIP).
Jacobsen SE, Bach AP. 1998. The influence of temperature onseed germination rate in quinoa (Chenopodium quinoa Willd.).Seed Sci Tech 26:515–523.
Jacobsen SE, Mujica A. 2003. Quinoa: an alternative crop forsaline soils. J Exp Bot 54 (Suppl. 1), i25.
Jacobsen SE, Jornsgard B, Christiansen JL, Stolen O. 1999. Effectof harvest time, drying technique, temperature and light onthe germination of quinoa (Chenopodium quinoa). Seed SciTech 27:937–944.
Jacobsen SE, Quispe H, Mujica A. 2001. Quinoa: an alternativecrop for saline soils in the Andes. Lima, Peru: Centro Inter-nacional de la Papa (CIP). pp. 403–408.
Jacobsen SE, Mujica A, Jensen CR. 2003a. The resistance ofquinoa (Chenopodium quinoa Willd.) to adverse abiotic factors.Food Rev Int 19:99–109.
Jacobsen SE, Mujica A, Ortiz R. 2003b. The global potential forquinoa and other Andean crops. Food Rev Int 19:139–148.
Jacobsen S-E, Mujica A, Jensen CR. 2003c. Resistance of quinoa(Chenopodium quinoa Willd.) to adverse abiotic factors. J ExpBot 54 (Suppl. 1): i21.
Jacobsen SE, Monteros C, Christiansen JL, Bravo LA, CorcueraLJ, Mujica A. 2005. Plant responses of quinoa (Chenopodiumquinoa Willd.) to frost at various phenological stages. Eur JAgron 22:131–139.
Jacobsen SE, Monteros C, Corcuera LJ, Bravo LA, ChristiansenJL, Mujica A. 2007. Frost resistance mechanisms in quinoa(Chenopodium quinoa Willd.). Eur J Agron 26:471–475.
Jacobsen SE. 2011. The situation for quinoa and its productionin Southern Bolivia: from economic success to environmentaldisaster. J Agron Crop Sci 197 (5):390–399.
Jensen CR, Jacobsen SE, Andersen MN, Núñez N, Ander-sen SD, Rasmussen L, Mogensen VO. 2000. Leaf gasexchange and water relation characteristics of field quinoa(Chenopodium quinoa Willd.) during soil drying. Eur J Agron13:11–25.
Koyro HW, Eisa SS. 2008. Effect of salinity on composition, via-bility and germination of seeds of Chenopodium quinoa Willd.Plant Soil 302:79–90.
Kumar A, Bhargava A, Shukla S, Singh HB, Ohri D. 2006.Screening of exotic Chenopodium quinoa accessions for downy
44 Quinoa: Improvement and Sustainable Production
mildew resistance under mid-eastern conditions of India.Crop Prot 25:879–889.
Laguna PF. 2000. The impact of quinoa export on peasants’livelihoods of Bolivian highlands. In: Sustainable RuralLivelihoods: Building Communities, Protecting Resources,Fostering Human Development, Xth World Congress of theInternational Rural Sociology Association, Rio de Janeiro,Brazil, August, 2000.
Magliocca F. 2002. Etude de marché: La Quinoa. Maıtrise IMTL2001–2002.
Martínez E, San Martín R, Jorquera C, Veas E, Jara P. 2009. Rein-troduction of quinoa into arid Chile: cultivation of two low-land races under extremely low irrigation. J Agron Crop Sci195:1–10.
Miranda R. 2012. Organic matter requirements for a sustainableproduction of quinoa in the Central and Southern BolivianAltiplano. Doctoral research. Universidad Federal de SantaMaria, Brazil.
Miranda R, Carlesso R, Huanca M, Mamani P, Borda A. 2012.Rendimiento y acumulación de nitrógeno en la quinua(Chenopodium quinoa Willd) producida con estiércol y riegosuplementario. Revista Venesuelos 20(1).
Mujica A. 1994. Andean grains and legumes. In: HernandoBermujo, JELJ, editor. Neglected Crops: 1492 from adifferent perspective. Rome, Italy: FAO. pp. 131–148.
Mujica A, Izquierdo J, Marathee JP. 2001a. Capítulo I. Origeny descripción de la quinoa. In: Mujica A, Jacobsen SE,Izquierdo J, Marathee JP, editors. Quinoa (Chenopodiumquinoa Willd.): ancestral cultivo andino, alimento del presentey futuro. Santiago de Chile: FAO, UNA, Puno. pp. 9–29.
Mujica A, Canahua A, Saravia R. 2001b. Capítulo II. Agronomíadel cultivo de la quinoa. In: Mujica A, Jacobsen SE, IzquierdoJ, Marathee JP, editors. Quinoa (Chenopodium quinoa Willd.):Ancestral cultivo andino, alimento del presente y futuro. San-tiago de Chile: FAO, UNA, Puno. pp. 20–48.
Mujica A, Jacobsen SE, Canahua A. 2001c. Los aynokas de quinoa(Chenopodium quinoa Willd.) - un sistema de conservación derecursos genéticos estratégicos del altiplano peruano. Con-ferencia Electrónica 2001 del Consorcio para el DesarrolloSostenible de la Ecorregion Andina (http://www.condesan.org/infoandina/Foros/insitu2001/S.Jacobsen-spanish.htm).
Murillo R. 1995. Comportamiento del nitrógeno proveniente defertilizantes minerales en el cultivo de la quinoa (Chenopodiumquinoa Willd) bajo condiciones de riego y secano. Thesisdissertation for Agronomist. UMSA.
Nieto CC, Vimos CN, Caicedo CV, Monteros CJ, Rivera MM.1998. Respuesta de la quinoa a diferentes tipos de rotación decultivos en dos localidades de la sierra, durante cinco años.Centro Internacional de Investigaciones para el Desarrollo,Programa Cultivos Andinos (INIAP), working paper.
Parida AK, Dagaonkar VS, Phalak MS, Umalkar GV,Aurangabadka LP. 2007. Alterations in photosyntheticpigments, protein and osmotic components in cottongenotypes subjected to short-term drought stress followed byrecovery. Plant Biotech Rep 1 (1): 37–48.
Partap T, Kapoor P. 1985a. The Himalayan grain chenopods. I.Distribution and ethnobotany. Agr Ecosys Env 14:185–199.
Partap T, Kapoor P. 1985b. The Himalayan grain chenopods. II.Comparative morphology. Agr Ecosys Env 14:201–220.
Peralta E. 2009. La quinoa en Ecuador. “Estado del Arte.” Quito,Ecuador: INIAP.
Prego I, Maldonado S, Otegui M. 1998. Seed structure andlocalization of reserves in Chenopodium quinoa. Ann Bot82:481–488.
PROINPA Foundation. 2002. Variedades de quinoa recomen-dadas para el Altiplano Norte y Central. La Paz, Bolivia:PROINPA.
PROINPA Foundation. 2003a. Catálogo de Quinoa Real. La Paz,Bolivia: PROINPA. p. 52.
PROINPA Foundation. 2003b. Biología y comportamiento de lasticonas. Ficha Técnica n∘4. La Paz, Bolivia: PROINPA.
PROINPA Foundation. 2003c. Biología y comportamiento dela polilla de la quinoa. Ficha Técnica n∘5. La Paz, Bolivia:PROINPA.
PROINPA Foundation. 2003d. Variedad “Quinoa Jacha Grano.”Ficha Técnica n∘6. La Paz, Bolivia: PROINPA.
Pulgar Vidal J. 1954. La quinoa o suba en Colombia. Publ. No. 3.Fichero Científico Agropecuario. Bogotá, Colombia: Ministe-rio de Agricultura. pp. 73–76.
Rasmussen C, Lagnaoui A, Esbjerg P. 2003. Advances in theknowledge of quinoa pests. Food Rev Int 19:61–75.
Repo-Carrasco R, Espinoza C, Jacobsen S-E. 2003. Nutritionalvalue and use of the Andean crops quinoa (Chenopodiumquinoa) and kañiwa (Chenopodium pallidicaule). Food Rev Int19:179–189.
Risi J, Galwey NW. 1984. The Chenopodium grains of theAndes: Inca crops for modern agriculture. Adv Appl Biol10:145–216.
Rodriguez JP, Raffaillac JP. 2003. El papel de tamaño de quinoa(Chenopodium quinoa Willd.) en el crecimiento y desarrollode las plantas frente a diferentes profundidades de siembra.La Paz, Bolivia: Facultad de Agronomia, UMSA, internalworking paper. p. 5.
Rojas W, Mamani E, Pinto M, Alanoca C, Ortuño T. 2008.Identificación taxonómica de parientes silvestres de quinuadel Banco de Germoplasma de Granos Altoandinos. Revistade Agricultura–Año 60, Nro. 44. Cochabamba, Bolivia,Diciembre 2008. pp. 56–65.
Rosa M, Hilal M, Gonzalez JA, Prado FE. 2009. Low-temperatureeffect on enzyme activities involved in sucrose-starch par-titioning in salt-stressed and salt-acclimated cotyledons ofquinoa (Chenopodium quinoa Willd.) seedlings. Plant PhysiolBiochem 47: 300–307.
Salas S. 2003. Quinoa - postharvest and commercialization. FoodRev Int 19:191–201.
Sanchez V. 2011. Influencia de la plasticidad de la quinua(Chenopodium quínoa Willd) sobre su constante térmica enel Altiplano Boliviano. Trabajo dirigido Lic. Ing. Agr. LaPaz-Bolivia. Universidad Mayor de San Andrés. Facultad deAgronomía. 71 p.
Agroecological and Agronomic Cultural Practices of Quinoa in South America 45
Sanchez HB, Lemeur R, Van Damme P, Jacobsen S-E. 2003. Eco-physiological analysis of drought and salinity stress of quinoa(Chenopodium quinoa Willd.). Food Rev Int 1–2: pp. 111–119.
Schabes FI, Sigstad EE. 2005. Calorimetric studies of quinoa(Chenopodium quinoa Willd.) seed germination under salinestress conditions. Thermochimica Acta 428:71–75.
Schulte auf’m Erley G, Kaul HP, Kruse M, Aufhammer W. 2005.Yield and nitrogen utilization efficiency of the pseudocere-als amaranth, quinoa, and buckwheat under differing nitrogenfertilization. Eur J Agron 22:95–100.
Sigstad EE, Prado FE. 1999. A microcalorimetric study ofChenopodium quinoa Willd. seed germination. Thermochim-ica Acta 326:159–164.
Sigstad EE, Garcia CI. 2001. A microcalorimetric analysis ofquinoa seeds with different initial water content duringgermination at 25∘C. Thermochimica Acta 366:149–155.
Siñani E, Espíndola G, Morales DM. 2006. Evaluación de laeficiencia de fungicidas en el control de mildiu (Peronosporafarinosa Fr.) de la quinoa en el Altiplano central y norte.In: Del Castillo C, Garcia M, Vacher JJ, Winkel T, editors.Compendio de resúmenes de tesis de grado e investigacionesrealizadas en quinoa, canahua, amaranto y papa en la Facultadde Agronomía de la UMSA entre 1991 y 2006. Facultad de
Agronomía, UMSA - IRD, Francia - QuinAgua, VLIR &KU Leuven, Belgica, La Paz, Bolivia, p 24.
Tapia ME. 1979. Historia y distribución geográfica.. In: TapiaME, editor. Quinoa y kaniwa: cultivos andinos. Bogotá,Colombia: CIID. pp. 11–19.
Tolaba MP, Peltzer M, Enriquez N, Lucia Pollio M. 2004. Grainsorption equilibria of quinoa grains. J Food Eng 61:365–371.
Valencia-Chamorro SA. 2004. Quinoa. In: Encyclopedia of grainscience. Australia: Elsevier/CRC, pp. 4885–4892.
Vilche C, Gely M, Santalla E. 2003. Physical properties of quinoaseeds. Biosystems Eng 86:59–65.
Willdenow CL. 1798. Species plantarum, ed. 4, 1(2). – Berolini:G. C. Nauk.
Winkel T. 2013. Quinua y quinueros. Ed. IRD France. ISBN978-2-7099-1749-0. 176 pp.
Yucra E, Garcia M. 2007. Producción y sistemas de cultivo dequinoa en zonas del altiplano boliviano. In: Annals of theInternational Congress of Quinoa. Iquique. Chile.

Chapter 4
Trends in Quinoa Yield over the SouthernBolivian Altiplano: Lessons from Climate
and Land-Use Projections
Serge Rambal1,3, Jean-Pierre Ratte1, Florent Mouillot2
and Thierry Winkel21CNRS, UMR 5175, CEFE, F-34293, Montpellier cedex 5, France
2IRD, UMR 5175, CEFE F-34293, Montpellier cedex 5, France3Universidade Federal de Lavras Departamento de Biologia, CP 3037, CEP 37200-000, Lavras MG, Brazil
SUMMARY
The Southern Altiplano of Bolivia is the worldleader in quinoa export. In these arid high-lands, quinoa yield is largely influenced byon-going changes affecting both climate driversand land-use practices. We developed a simple“what-if ” simulation model for anticipat-ing such changes in quinoa yields over threetime-slices: a recent past (1961–2000), a nearfuture (2046–2065), and finally a remote one(2081–2100). Outputs from a global climatemodel (GCM) were used as drivers for pro-jections of regional climate patterns and forproviding risk information. For tackling furtherproblems arising from our limited understandingof what the local-level impacts of climate changeare likely to be in this arid mountain area, wedecided to consider a grid-level area centered onthe salar of Uyuni, a region experiencing markedchanges in climate and land use for the pastfour decades. Local land-use change scenarioswere derived from aerial photographs and datafrom high-resolution remote-sensing validated by
Quinoa: Improvement and Sustainable Production, First Edition. Edited by Kevin Murphy and Janet Matanguihan.© 2015 John Wiley & Sons, Inc. Published 2015 by John Wiley & Sons, Inc.
ground truth observations on sample areas repre-sentative of the region. Climate change scenarioswere linked to our yield model composed of asoil water balance model coupled with a simplecrop growth component. The daily climate fromGCM runs has been used for driving the soilwater balance model and calculating the droughtseverity that the crop might undergo. At thefield plot level, the yield index (defined as thesimulated yield relative to a fixed yield potential)depends on soil drought, mean air temperaturethat largely affects carbon assimilation throughphotosynthesis, and minimal temperature thatimpairs the yield during frost nights. At thelandscape scale, a mosaic of three land units isconsidered: cerros (steep slopes), faldas (gentleslopes in piedmonts), and pampas (flat plains). Wesimulated 2-year crop cycles taking into accountcomplementarities among these landscape units.In each land unit, growth efficiency parametersare affected by the decline in the biologicalpotential of the land. These parameters parallelthe rate of encroachment of the quinoa crop,the subsequent decline of pasture lands in the
47
48 Quinoa: Improvement and Sustainable Production
pampas and the soil aeolian erosion caused by suchintensification. Results show an on-going decreasein the occurrence of frost that will be followed byan increasing drought frequency in the forthcom-ing decades. Long-term increase in soil drynessassociated with a decline in the biological potentialof the land may largely impair the sustainabilityof this area. This type of analysis, althoughspeculative, provides insights that can assistresearch and development organizations targetoptions for sustainability in crop production.
INTRODUCTION
The Andes are the most densely populatedhighlands in the world, with human settle-ments commonly found above 3800 masl andagricultural activities up to 4200 masl (Little1982). GCMs suggest that climatic changesin the Andean Altiplano might have seriousconsequences for water management and localagriculture (Thibeault et al. 2010; Seth et al.2010). Some climate scenarios even project thatthe montane climate currently known in theAndean region would disappear by the end ofthe twenty-first century (Williams et al. 2007).Specifically, climate analyses suggest that thewarming observed in the Andean highlands islikely to accelerate in the coming decades at arate greatly exceeding that of the surroundinglowlands (Vergara et al. 2007). Paradoxically, thisclimate warming would not necessarily lead to adecrease in the number of frost days (Thibeaultet al. 2010). There is more uncertainty withprojections on precipitation, but trends suggestan evolution toward a shorter, more intensewet season with less precipitation in spring(September–November) and more in summer(January–March) (Seth et al. 2010).
While our understanding of glacier retreatand its consequences has significantly improved(Vuille et al. 2008), assessing the vulnerabilityof Andean agricultural lands to the continuingclimate change requires more specific studies, inparticular the interactions between climate andland-use changes and their combined impacts on
the economic yield of indigenous crop species(Valdivia et al. 2010).
Among the Andean crops, quinoa (Chenop-odium quinoa Willd.) is an interesting casedue to the huge expansion of its cultivation inthe southern Altiplano of Bolivia, at the sametime that the impacts of climate warming areobserved in the region. Over the past 40 years,the southern Altiplano of Bolivia has become thefirst region to export quinoa worldwide. Quinoahas transitioned from an auto subsistence graincrop, limited mostly to small fields on slopes(a traditional frost avoiding strategy), to a com-mercial product cultivated over extended areasin the flat plains amenable to mechanization.In this arid region, quinoa is cultivated underrain-fed conditions and low plant density in fieldsthat, since the 1970s, have rapidly encroachedon pasture lands of native herb and shrubvegetation in the plains. It is estimated thatthe land surface dedicated to quinoa crop inBolivia has increased more than 230% between1980 and 1990 (FAO-Stat), most of this increasecorresponding to newly cultivated plains in thesouthern Altiplano. Quinoa grain yield, withan average value of 600 kg/ha in the region, isnotably unstable, due to harsh cropping condi-tions (Garcia et al. 2004; Geerts et al. 2009). Whatwould the quinoa grain yield become through thetwenty-first century under the projected trendsof increasing climate instability and expandingcrop land area?
Regional climate scenarios and crop modelingare useful tools to answer such a question, helpinganticipate agroclimatic risks and prepare adap-tation strategies that could reduce agriculturalvulnerability under climate and land-use changes(Hertel et al. 2010; Parry and Livermore 2002).After a brief presentation of the southern Alti-plano region, this chapter describes the methodsused to analyze the climatic risks affecting thestudy area as well as the climatic trends derivedfrom the current observations and GCM pro-jections. The subsequent section introduces theyield index approach, the water balance model,and the land-use scenarios applied to scale quinoaproductivity up to the landscape level. Resultssummarize the current and projected drought
Trends in Quinoa Yield over the Southern Bolivian Altiplano: Lessons from Climate 49
and frost limitations over the study area andshow the subsequent effects on quinoa yield atthe plot and the landscape levels at varying timepoints. From this, a picture of future quinoa cropproduction in the southern Altiplano can be seen,and adaptation options for a sustainable use oflocal land resources are discussed.
MATERIALS AND METHODS
The study area
The study area consists of highlands (Altiplano)located at the southwestern part of the Bolivianterritory, at the borders with Argentina and Chile.This region, bordered on its eastern and westernedges by the Andean cordilleras, is characterizedby the presence at its center of a ca. 100× 100 kmdry salt expanse, the salar of Uyuni, whereasa smaller salt lake, the salar of Coipasa, lies atits northern edge. Except for the vast salt lakeareas, the landscapes in this region show a mosaicof three types of land units: relatively extendedflat plains at an altitude of ca. 3650 masl, andan alternation of volcanic slopes and valleys inthe hinterland. The native vegetation of thistropical highland ecosystem, also known as puna,consists of a mountain steppe of herbaceous andshrub species traditionally used for extensivegrazing of llama and sheep herds. The southernAltiplano has an arid climate, with an annual meanprecipitation varying between 100 and 350 mmfrom the south to the north of the salar of Uyuni.Most of the precipitation (>70%) occurs duringaustral summer (December–January–February),when mid- and upper-level easterly winds bringmoist air that feed convective storms over theplateau (Garreaud 2000; Falvey and Garreaud2005). Summer precipitations exhibit significantsynoptic variations, largely explained by bothlocal boundary layer moisture and zonal windaloft (Garreaud and Aceituno 2001). The rest ofthe year, the Altiplano is influenced by a mid-levelwesterly flow that brings very dry air from thePacific and rare precipitation events (Vuilleand Ammann 1997). Between-year variationsin rainfall over this area may be explained by a
tendency for more precipitation during La Niñaand less during El Niño events (Ronchail andGallaire 2006), although the connection betweenthe rainfall regime and the El Niño SouthernOscillation (ENSO) still remains unclear (Gar-reaud et al. 2009; Thibeault et al. 2012; Seileret al. 2013).
Mean annual air temperature is about +9∘C,with daily thermal amplitudes much higherthan seasonal ones and radiative night frostoccurring virtually in any season. Frost risks for astandard temperature threshold of 0∘C have beendetailed by Pouteau et al. (2011). These authorsdemonstrated the nested effects of physiographicfactors across scales in this mountain area. Resultsshowed prominent effects of elevation, latitude,and salt lake proximity at regional scale, whereasslope, topographic convergence, and insulationhad more influence at local scales. As a result, theshores of the salt lakes appear less prone to frost,whereas highlands at the west and south of theregion are continuously exposed.
Recent past and present climate
We used the Standardized Precipitation Evapo-transpiration Index (SPEI), which is a site-specificdrought metric that quantifies deviations fromthe average water balance. The SPEI is cal-culated by means of a climate water balance,that is, the difference between precipitationand potential evapotranspiration, at monthlytime intervals. Different SPEIs are obtainedfor different time windows representing thecumulative water balance over the previousmonths (Vicente-Serrano et al. 2013). Monthlyclimate data at high-resolution 0.5 × 0.5 degreegrids for the study area are provided by theClimate Research Unit (CRU) of the Universityof East Anglia (United Kingdom). We used theCRU TS3.1 datasets for the period 1901–2009.Three time-windows of 3, 6, and 24 months wereretained for the analysis. The first time-window(SPEI3) is related to the top soil water limitationthat could impair the seedling stage, the second(SPEI6) is related to the whole productivity ofthe crop, and the last and longer one (SPEI24) isassociated with the availability of rain from the
50 Quinoa: Improvement and Sustainable Production
previous year in the subsoil. Within a 2-year rota-tion, quinoa crop uses water stored in the subsoilduring the previous fallow year. If this additionalsoil water is insufficient, quinoa productivitymay be drastically impacted. We retain a value ofSPEI less than −1 lasting more than 3 monthsas a drought threshold for any time-window(3, 6, or 24 months). For the frequency analysisof drought events, we cut the whole sequenceinto three successive 36-year periods: 1901–1936,1937–1972, and 1973–2009.
Source of climate scenarios
We used climate scenarios from the Centre deRecherches Météorologiques Coupled GlobalClimate Model version 3 (CNRM-CM3). It isbased on the coupling of the ARPEGE-ClimateAtmospheric Global Climate Model, an oceanicGeneral Circulation Model OPA8.1, a sea icemodel GELATO2, and TRIP, a river routingscheme. CNRM-CM3 has been applied in theframework of the fourth assessment reportof the Intergovernmental Panel on ClimateChange (IPCC). We retained the IPCC-SRESA1B simulations for the twenty-first centurythat provided daily precipitation, minimal andmaximal temperatures, and global radiation forthree time-slices: 1960–2000, 2046–2065, and2081–2100. We used a coarse resolution of 2.5× 2.5∘ grid, which is a good compromise as itdoes not affect the large-scale patterns and allowsa reasonable level of regional description overSouth America (Boulanger et al. 2006, 2007).
Simulating the yield index at local or plotscale
We defined three abiotic limitation factors thatmay impair crop productivity and yield at a dailytime step: a soil water limitation factor, f1, whichwill be discussed in more detail further on; a limi-tation factor for carbon assimilation, f2, related tothe within-day variations of air temperature; anda frost limitation factor, f3, exponentially relatedto the minimal temperature. All these factorshave values ranging between 0 and 1, and theirproduct calculated over the entire growth period
(from early November to late March) defines thepotential yield index:
YIplot =∑
f3
∑
growth period
f1 f2Δt (4.1)
YIplot = 1 means that no limitation has beenobserved during the whole growth period.
For calculating f2, it was considered that,within a given day, the pattern of change of airtemperature follows two sinusoidal segments:first, a decline from the maximal value thatoccurred at 2 pm to the next minimal valuethat was observed at dawn; second, the increaseof air temperature from its minimal value tothe maximal 1. The theoretical duration of thedaylight period, d, was calculated for the latitudeof the study area using Milankovitch’s equation.Relative instantaneous carbon assimilation, Ar,follows a parabolic pattern with current time airtemperature, Ta, reaching a maximum (Ar = 1) atan optimal temperature of Topt:
Ar = 1 − α(Ta − Topt)2 (4.2)
with α being a thermal efficiency coefficient.The f2 factor was then calculated as
f2 = 1∕d∑
d
Ar Δt (4.3)
The f3 factor affects sequentially the yield(Eq. 4.1), quantifying the percent yield loss dueto frost. This factor is exponentially related tothe minimal daily temperature and scaled by avulnerability parameter. The vulnerability scalingparameter was fitted to produce realistic losses inthe recent period and was applied further to thewhole period.
The soil water balance model
The water balance of the top soil layer was simu-lated at a daily time step using a bucket-type modelwith a limited storage capacity and mathematicallyrepresented by a difference equation in which thedaily change in soil water storage, ΔS, equals raininput, R, minus outputs that are deep drainage, D,and actual evaporation, AET:
ΔS = R–AET–D (4.4)
Trends in Quinoa Yield over the Southern Bolivian Altiplano: Lessons from Climate 51
Maximum stored water in the soil, S, is limitedby the field capacity, FC. When the soil waterstorage exceeds the field capacity threshold,extra water flows down as deep drainage. Actualevaporation AET extracts water from the soilcompartment. AET is a fraction of potentialevaporation PET, related to both the amountof stored water in the soil and to PET itself.PET was calculated using Priestley–Taylor’sequation (1972). Daily PET values were cal-ibrated for our regional applications with astandard Priestley–Taylor parameter of 1.26 thatcorresponds to the original equation (Geerts et al.2007, 2009). The net all-wave radiation term wasrelated to global incoming short-wave radiationusing Kalma et al.’s equation (2000) calibratedwith unpublished measurements over quinoafield. For reducing PET to AET, Linacre (1973)proposed a simplified algorithm: AET rate equalswhichever is the less of (i) the PET rate or (ii)β(S∕FC)2. Finally, the model may be summarizedby two coupled equations:
AET = min[β(S∕FC)2
,PET]
(4.5)
S(t + 1) = min[S(t) + R − AET,FC] (4.6)
β is fixed to 4.5 mm, a value slightly lower thanthe one retained in this area by Geerts et al.(2006). Retention properties of the sandy soilthat covers the study area have been derivedfrom Saxton et al. (1986). Percent sand rangesfrom 76% to 81% and clay fraction from 6%to 7%. Depending on the soil texture, fieldcapacity may be estimated to extend from 0.153to 0.167 cm3 H2O/cm3 soil, corresponding to thewater content reached at a soil water potentialof −0.02 MPa. The water content at wiltingpoint ranged from 0.067 to 0.074 cm3 H2O/cm3
soil. For modeling purposes, we retained asoil layer of 0.50 m depth with a 75 mm fieldcapacity and 37.5 mm storage at wilting point.For well-watered conditions, when S ranges fromfield capacity to a relative soil water content of0.8, f1 = 1 and then declines linearly down to 0 atwilting point.
Scenarios of land-use/land-cover changes
The whole land area potentially suitable forquinoa crops can be classified into three neigh-boring land units: cerros, faldas, and pampas. Thehilly cerros correspond to the higher altitudeareas cultivated manually and hardly affectedby night frosts. The pampas, previously usedfor livestock grazing, are now undergoing rapidcropping intensification. The faldas correspondto the transition area between cerros and pampas.The area of fallow lands equal that of crop landsin this arid region, as a result of 2-year croppingcycles. This “dry farming” practice, as well as theclump (pocket) sowing, is typical of local quinoafields. With this practice, for a given plot, thesoil is maintained bare the first year so rain watercan infiltrate the soil and will be used for thesubsequent cultivation year. We considered that,on average, the partitioning of the whole areasuitable for cultivation over the study area wouldbe 10% cerros, 20% faldas, and 70% pampas.
Scenarios of land-use/land-cover (LULC)changes came from maps derived from aerialphotographs taken in 1963, high-resolution scansof digital photographic data from the US geolog-ical survey of 1972, and high-resolution remotelysensed data from 1990 and 2005. Interpretationswere validated by ground truth observations onsampled areas. Five communities representativeof the study area were mapped since 1963: Cha-coma, Chilalo, Kapura, Palaya, and Otuyo. Forthe more recent period, we used SPOT satellitedata recorded in 1998, 1999, 2005, and 2007 over14 communities: Alianza, Cacohota, Cacoma,Chilaco, Chusiquiri, Colcaya, Irpani, Jirira, Lia,Otuyo, Pastos Lobo, Salinas, Tahua, and Vituyo.Results obtained at the community-level wereaggregated in three trajectories for each land unitexpressed in percent changes of the suitable areaand then extrapolated toward 2040.
Scaling local yield index up to the region
For all the simulations at plot scale, we assumedthat land use did not change over the consideredperiod.
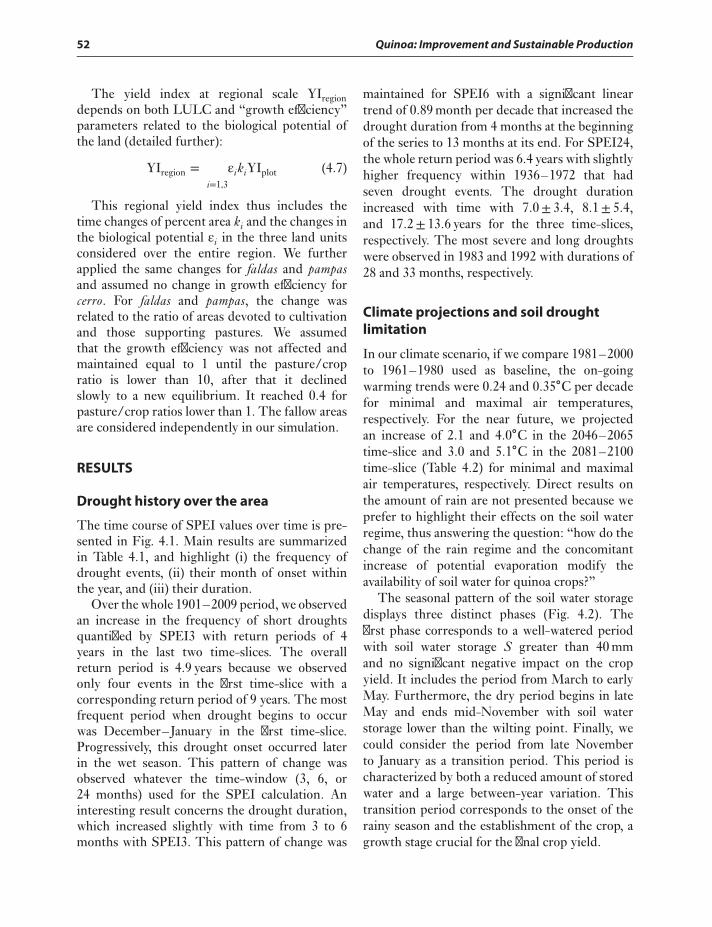
52 Quinoa: Improvement and Sustainable Production
The yield index at regional scale YIregiondepends on both LULC and “growth efficiency”parameters related to the biological potential ofthe land (detailed further):
YIregion =∑
i=1,3
εikiYIplot (4.7)
This regional yield index thus includes thetime changes of percent area ki and the changes inthe biological potential εi in the three land unitsconsidered over the entire region. We furtherapplied the same changes for faldas and pampasand assumed no change in growth efficiency forcerro. For faldas and pampas, the change wasrelated to the ratio of areas devoted to cultivationand those supporting pastures. We assumedthat the growth efficiency was not affected andmaintained equal to 1 until the pasture/cropratio is lower than 10, after that it declinedslowly to a new equilibrium. It reached 0.4 forpasture/crop ratios lower than 1. The fallow areasare considered independently in our simulation.
RESULTS
Drought history over the area
The time course of SPEI values over time is pre-sented in Fig. 4.1. Main results are summarizedin Table 4.1, and highlight (i) the frequency ofdrought events, (ii) their month of onset withinthe year, and (iii) their duration.
Over the whole 1901–2009 period, we observedan increase in the frequency of short droughtsquantified by SPEI3 with return periods of 4years in the last two time-slices. The overallreturn period is 4.9 years because we observedonly four events in the first time-slice with acorresponding return period of 9 years. The mostfrequent period when drought begins to occurwas December–January in the first time-slice.Progressively, this drought onset occurred laterin the wet season. This pattern of change wasobserved whatever the time-window (3, 6, or24 months) used for the SPEI calculation. Aninteresting result concerns the drought duration,which increased slightly with time from 3 to 6months with SPEI3. This pattern of change was
maintained for SPEI6 with a significant lineartrend of 0.89 month per decade that increased thedrought duration from 4 months at the beginningof the series to 13 months at its end. For SPEI24,the whole return period was 6.4 years with slightlyhigher frequency within 1936–1972 that hadseven drought events. The drought durationincreased with time with 7.0± 3.4, 8.1± 5.4,and 17.2± 13.6 years for the three time-slices,respectively. The most severe and long droughtswere observed in 1983 and 1992 with durations of28 and 33 months, respectively.
Climate projections and soil droughtlimitation
In our climate scenario, if we compare 1981–2000to 1961–1980 used as baseline, the on-goingwarming trends were 0.24 and 0.35∘C per decadefor minimal and maximal air temperatures,respectively. For the near future, we projectedan increase of 2.1 and 4.0∘C in the 2046–2065time-slice and 3.0 and 5.1∘C in the 2081–2100time-slice (Table 4.2) for minimal and maximalair temperatures, respectively. Direct results onthe amount of rain are not presented because weprefer to highlight their effects on the soil waterregime, thus answering the question: “how do thechange of the rain regime and the concomitantincrease of potential evaporation modify theavailability of soil water for quinoa crops?”
The seasonal pattern of the soil water storagedisplays three distinct phases (Fig. 4.2). Thefirst phase corresponds to a well-watered periodwith soil water storage S greater than 40 mmand no significant negative impact on the cropyield. It includes the period from March to earlyMay. Furthermore, the dry period begins in lateMay and ends mid-November with soil waterstorage lower than the wilting point. Finally, wecould consider the period from late Novemberto January as a transition period. This period ischaracterized by both a reduced amount of storedwater and a large between-year variation. Thistransition period corresponds to the onset of therainy season and the establishment of the crop, agrowth stage crucial for the final crop yield.
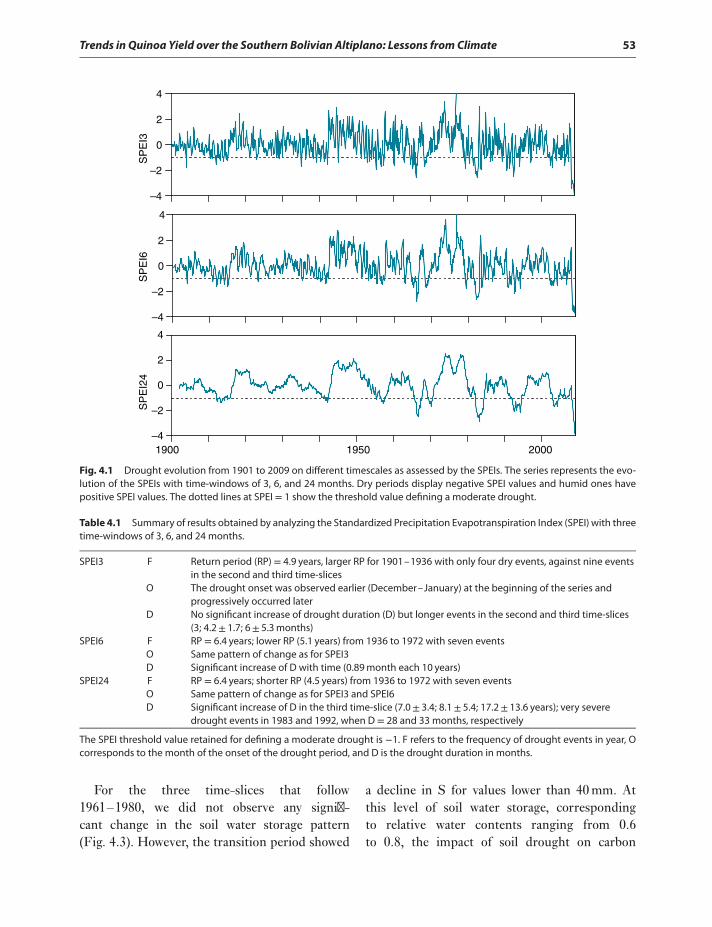
Trends in Quinoa Yield over the Southern Bolivian Altiplano: Lessons from Climate 53
–4
–2
0
2
4
–4
–2
0
2
4
0
2
4
1950 20001900–4
–2SP
EI2
4S
PE
I6S
PE
I3
Fig. 4.1 Drought evolution from 1901 to 2009 on different timescales as assessed by the SPEIs. The series represents the evo-lution of the SPEIs with time-windows of 3, 6, and 24 months. Dry periods display negative SPEI values and humid ones havepositive SPEI values. The dotted lines at SPEI = 1 show the threshold value defining a moderate drought.
Table 4.1 Summary of results obtained by analyzing the Standardized Precipitation Evapotranspiration Index (SPEI) with threetime-windows of 3, 6, and 24 months.
SPEI3 F Return period (RP) = 4.9 years, larger RP for 1901–1936 with only four dry events, against nine eventsin the second and third time-slices
O The drought onset was observed earlier (December–January) at the beginning of the series andprogressively occurred later
D No significant increase of drought duration (D) but longer events in the second and third time-slices(3; 4.2± 1.7; 6± 5.3 months)
SPEI6 F RP = 6.4 years; lower RP (5.1 years) from 1936 to 1972 with seven eventsO Same pattern of change as for SPEI3D Significant increase of D with time (0.89 month each 10 years)
SPEI24 F RP = 6.4 years; shorter RP (4.5 years) from 1936 to 1972 with seven eventsO Same pattern of change as for SPEI3 and SPEI6D Significant increase of D in the third time-slice (7.0± 3.4; 8.1± 5.4; 17.2± 13.6 years); very severe
drought events in 1983 and 1992, when D = 28 and 33 months, respectively
The SPEI threshold value retained for defining a moderate drought is −1. F refers to the frequency of drought events in year, Ocorresponds to the month of the onset of the drought period, and D is the drought duration in months.
For the three time-slices that follow1961–1980, we did not observe any signifi-cant change in the soil water storage pattern(Fig. 4.3). However, the transition period showed
a decline in S for values lower than 40 mm. Atthis level of soil water storage, correspondingto relative water contents ranging from 0.6to 0.8, the impact of soil drought on carbon
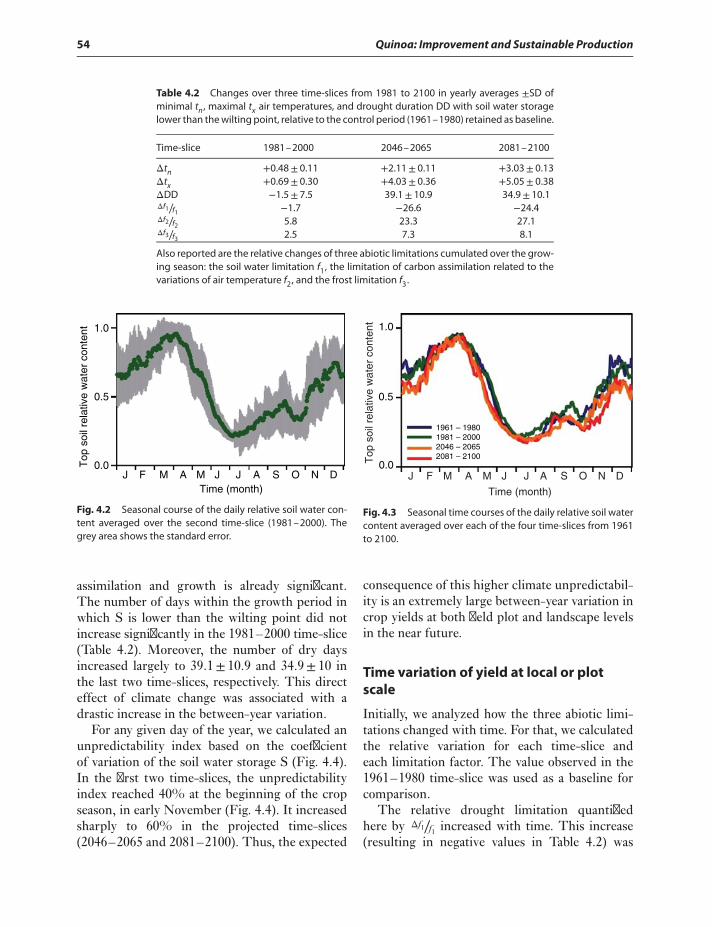
54 Quinoa: Improvement and Sustainable Production
Table 4.2 Changes over three time-slices from 1981 to 2100 in yearly averages ±SD ofminimal tn , maximal tx air temperatures, and drought duration DD with soil water storagelower than the wilting point, relative to the control period (1961–1980) retained as baseline.
Time-slice 1981–2000 2046–2065 2081–2100
Δtn +0.48± 0.11 +2.11± 0.11 +3.03± 0.13Δtx +0.69± 0.30 +4.03± 0.36 +5.05± 0.38ΔDD −1.5± 7.5 39.1± 10.9 34.9± 10.1Δf1∕f1 −1.7 −26.6 −24.4Δf2∕f2 5.8 23.3 27.1Δf3∕f3 2.5 7.3 8.1
Also reported are the relative changes of three abiotic limitations cumulated over the grow-ing season: the soil water limitation f1, the limitation of carbon assimilation related to thevariations of air temperature f2, and the frost limitation f3.
1.0
0.5
0.0Top
soi
l rel
ativ
e w
ater
con
tent
J F M A AM J J S O N DTime (month)
Fig. 4.2 Seasonal course of the daily relative soil water con-tent averaged over the second time-slice (1981–2000). Thegrey area shows the standard error.
assimilation and growth is already significant.The number of days within the growth period inwhich S is lower than the wilting point did notincrease significantly in the 1981–2000 time-slice(Table 4.2). Moreover, the number of dry daysincreased largely to 39.1± 10.9 and 34.9± 10 inthe last two time-slices, respectively. This directeffect of climate change was associated with adrastic increase in the between-year variation.
For any given day of the year, we calculated anunpredictability index based on the coefficientof variation of the soil water storage S (Fig. 4.4).In the first two time-slices, the unpredictabilityindex reached 40% at the beginning of the cropseason, in early November (Fig. 4.4). It increasedsharply to 60% in the projected time-slices(2046–2065 and 2081–2100). Thus, the expected
1.0
0.5
0.0
1961 – 19801981 – 20002046 – 20652081 – 2100
J F M A AM J J S O N D
Time (month)
Top
soi
l rel
ativ
e w
ater
con
tent
Fig. 4.3 Seasonal time courses of the daily relative soil watercontent averaged over each of the four time-slices from 1961to 2100.
consequence of this higher climate unpredictabil-ity is an extremely large between-year variation incrop yields at both field plot and landscape levelsin the near future.
Time variation of yield at local or plotscale
Initially, we analyzed how the three abiotic limi-tations changed with time. For that, we calculatedthe relative variation for each time-slice andeach limitation factor. The value observed in the1961–1980 time-slice was used as a baseline forcomparison.
The relative drought limitation quantifiedhere by Δf1∕f1 increased with time. This increase(resulting in negative values in Table 4.2) was
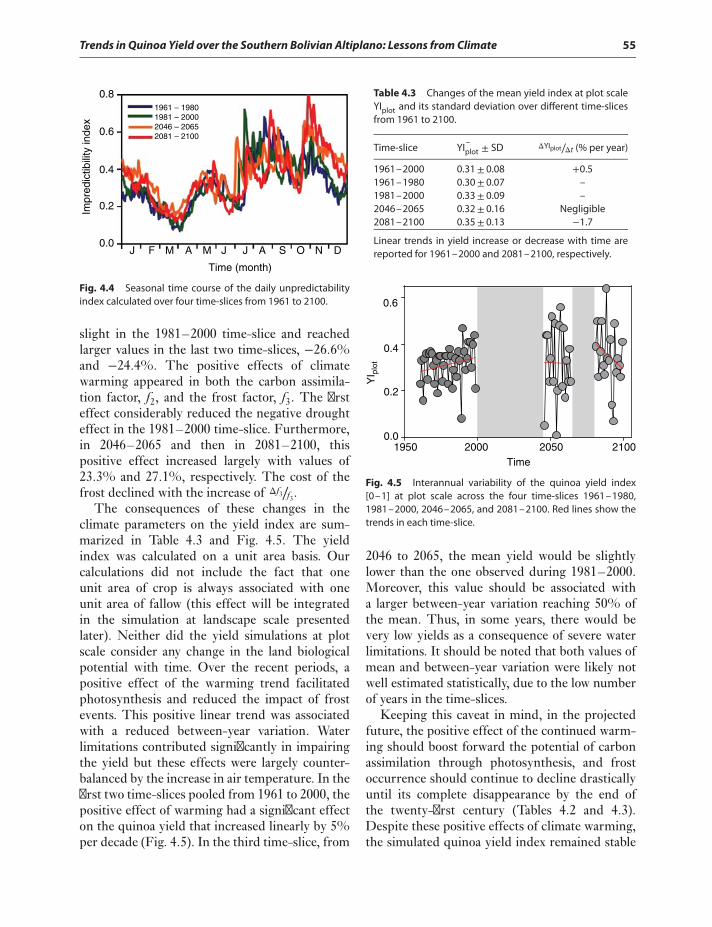
Trends in Quinoa Yield over the Southern Bolivian Altiplano: Lessons from Climate 55
1961 – 19801981 – 20002046 – 20652081 – 2100
0.8
0.6
0.4
0.2
0.0
Impr
edic
tibili
ty in
dex
J F M A M J J A S O N D
Time (month)
Fig. 4.4 Seasonal time course of the daily unpredictabilityindex calculated over four time-slices from 1961 to 2100.
slight in the 1981–2000 time-slice and reachedlarger values in the last two time-slices, −26.6%and −24.4%. The positive effects of climatewarming appeared in both the carbon assimila-tion factor, f2, and the frost factor, f3. The firsteffect considerably reduced the negative droughteffect in the 1981–2000 time-slice. Furthermore,in 2046–2065 and then in 2081–2100, thispositive effect increased largely with values of23.3% and 27.1%, respectively. The cost of thefrost declined with the increase of Δf3∕f3.
The consequences of these changes in theclimate parameters on the yield index are sum-marized in Table 4.3 and Fig. 4.5. The yieldindex was calculated on a unit area basis. Ourcalculations did not include the fact that oneunit area of crop is always associated with oneunit area of fallow (this effect will be integratedin the simulation at landscape scale presentedlater). Neither did the yield simulations at plotscale consider any change in the land biologicalpotential with time. Over the recent periods, apositive effect of the warming trend facilitatedphotosynthesis and reduced the impact of frostevents. This positive linear trend was associatedwith a reduced between-year variation. Waterlimitations contributed significantly in impairingthe yield but these effects were largely counter-balanced by the increase in air temperature. In thefirst two time-slices pooled from 1961 to 2000, thepositive effect of warming had a significant effecton the quinoa yield that increased linearly by 5%per decade (Fig. 4.5). In the third time-slice, from
Table 4.3 Changes of the mean yield index at plot scaleYIplot and its standard deviation over different time-slicesfrom 1961 to 2100.
Time-slice YIplot ± SD ΔYIplot∕Δt (% per year)
1961–2000 0.31± 0.08 +0.51961–1980 0.30± 0.07 –1981–2000 0.33± 0.09 –2046–2065 0.32± 0.16 Negligible2081–2100 0.35± 0.13 −1.7
Linear trends in yield increase or decrease with time arereported for 1961–2000 and 2081–2100, respectively.
YI p
lot
0.6
0.4
0.2
0.01950 2000 2050 2100
Time
Fig. 4.5 Interannual variability of the quinoa yield index[0–1] at plot scale across the four time-slices 1961–1980,1981–2000, 2046–2065, and 2081–2100. Red lines show thetrends in each time-slice.
2046 to 2065, the mean yield would be slightlylower than the one observed during 1981–2000.Moreover, this value should be associated witha larger between-year variation reaching 50% ofthe mean. Thus, in some years, there would bevery low yields as a consequence of severe waterlimitations. It should be noted that both values ofmean and between-year variation were likely notwell estimated statistically, due to the low numberof years in the time-slices.
Keeping this caveat in mind, in the projectedfuture, the positive effect of the continued warm-ing should boost forward the potential of carbonassimilation through photosynthesis, and frostoccurrence should continue to decline drasticallyuntil its complete disappearance by the end ofthe twenty-first century (Tables 4.2 and 4.3).Despite these positive effects of climate warming,the simulated quinoa yield index remained stable
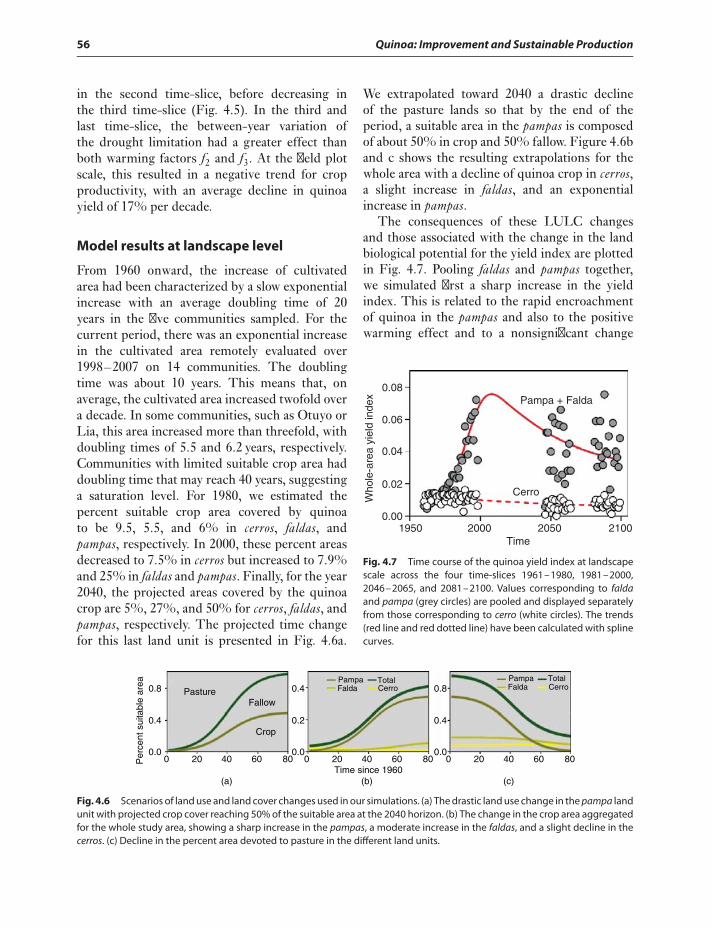
56 Quinoa: Improvement and Sustainable Production
in the second time-slice, before decreasing inthe third time-slice (Fig. 4.5). In the third andlast time-slice, the between-year variation ofthe drought limitation had a greater effect thanboth warming factors f2 and f3. At the field plotscale, this resulted in a negative trend for cropproductivity, with an average decline in quinoayield of 17% per decade.
Model results at landscape level
From 1960 onward, the increase of cultivatedarea had been characterized by a slow exponentialincrease with an average doubling time of 20years in the five communities sampled. For thecurrent period, there was an exponential increasein the cultivated area remotely evaluated over1998–2007 on 14 communities. The doublingtime was about 10 years. This means that, onaverage, the cultivated area increased twofold overa decade. In some communities, such as Otuyo orLia, this area increased more than threefold, withdoubling times of 5.5 and 6.2 years, respectively.Communities with limited suitable crop area haddoubling time that may reach 40 years, suggestinga saturation level. For 1980, we estimated thepercent suitable crop area covered by quinoato be 9.5, 5.5, and 6% in cerros, faldas, andpampas, respectively. In 2000, these percent areasdecreased to 7.5% in cerros but increased to 7.9%and 25% in faldas and pampas. Finally, for the year2040, the projected areas covered by the quinoacrop are 5%, 27%, and 50% for cerros, faldas, andpampas, respectively. The projected time changefor this last land unit is presented in Fig. 4.6a.
We extrapolated toward 2040 a drastic declineof the pasture lands so that by the end of theperiod, a suitable area in the pampas is composedof about 50% in crop and 50% fallow. Figure 4.6band c shows the resulting extrapolations for thewhole area with a decline of quinoa crop in cerros,a slight increase in faldas, and an exponentialincrease in pampas.
The consequences of these LULC changesand those associated with the change in the landbiological potential for the yield index are plottedin Fig. 4.7. Pooling faldas and pampas together,we simulated first a sharp increase in the yieldindex. This is related to the rapid encroachmentof quinoa in the pampas and also to the positivewarming effect and to a nonsignificant change
0.08
0.06
0.04
0.02
0.00
Who
le-a
rea
yiel
d in
dex
1950 2000 2050 2100Time
Cerro
Pampa + Falda
Fig. 4.7 Time course of the quinoa yield index at landscapescale across the four time-slices 1961–1980, 1981–2000,2046–2065, and 2081–2100. Values corresponding to faldaand pampa (grey circles) are pooled and displayed separatelyfrom those corresponding to cerro (white circles). The trends(red line and red dotted line) have been calculated with splinecurves.
(a)
Per
cent
sui
tabl
e ar
ea 0.8
0.4
0.0
0.8
0.4
0.0
0.4
0.2
0.00 20 40 60 80
(b)
0 20 40 60 80
(c)
0 20 40 60 80
PastureFallow
Crop
Time since 1960
PampaFalda
TotalCerro
PampaFalda
TotalCerro
Fig. 4.6 Scenarios of land use and land cover changes used in our simulations. (a) The drastic land use change in the pampa landunit with projected crop cover reaching 50% of the suitable area at the 2040 horizon. (b) The change in the crop area aggregatedfor the whole study area, showing a sharp increase in the pampas, a moderate increase in the faldas, and a slight decline in thecerros. (c) Decline in the percent area devoted to pasture in the different land units.
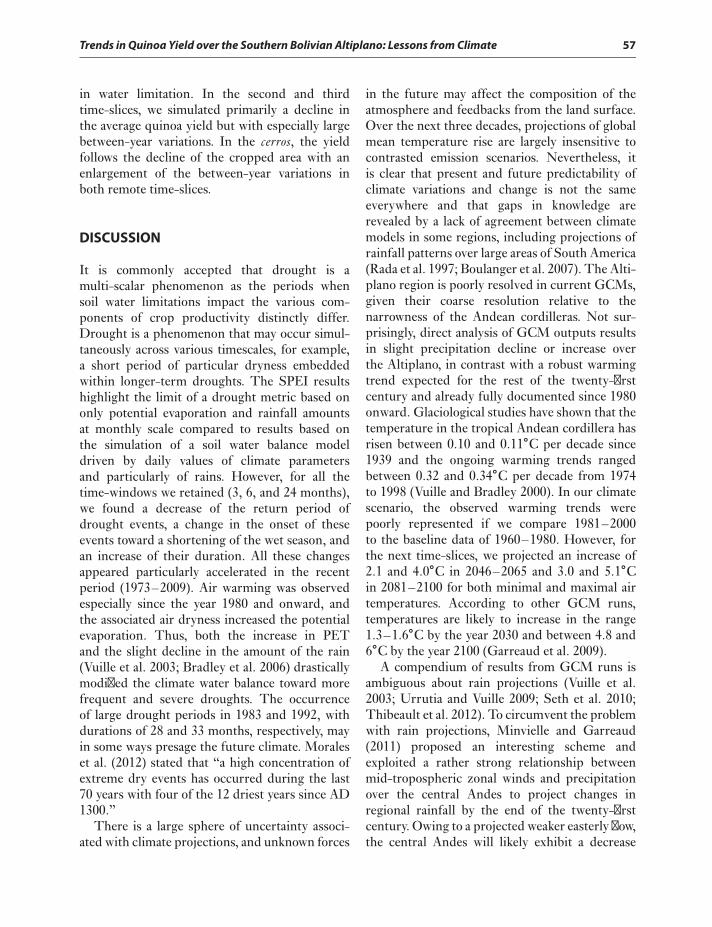
Trends in Quinoa Yield over the Southern Bolivian Altiplano: Lessons from Climate 57
in water limitation. In the second and thirdtime-slices, we simulated primarily a decline inthe average quinoa yield but with especially largebetween-year variations. In the cerros, the yieldfollows the decline of the cropped area with anenlargement of the between-year variations inboth remote time-slices.
DISCUSSION
It is commonly accepted that drought is amulti-scalar phenomenon as the periods whensoil water limitations impact the various com-ponents of crop productivity distinctly differ.Drought is a phenomenon that may occur simul-taneously across various timescales, for example,a short period of particular dryness embeddedwithin longer-term droughts. The SPEI resultshighlight the limit of a drought metric based ononly potential evaporation and rainfall amountsat monthly scale compared to results based onthe simulation of a soil water balance modeldriven by daily values of climate parametersand particularly of rains. However, for all thetime-windows we retained (3, 6, and 24 months),we found a decrease of the return period ofdrought events, a change in the onset of theseevents toward a shortening of the wet season, andan increase of their duration. All these changesappeared particularly accelerated in the recentperiod (1973–2009). Air warming was observedespecially since the year 1980 and onward, andthe associated air dryness increased the potentialevaporation. Thus, both the increase in PETand the slight decline in the amount of the rain(Vuille et al. 2003; Bradley et al. 2006) drasticallymodified the climate water balance toward morefrequent and severe droughts. The occurrenceof large drought periods in 1983 and 1992, withdurations of 28 and 33 months, respectively, mayin some ways presage the future climate. Moraleset al. (2012) stated that “a high concentration ofextreme dry events has occurred during the last70 years with four of the 12 driest years since AD1300.”
There is a large sphere of uncertainty associ-ated with climate projections, and unknown forces
in the future may affect the composition of theatmosphere and feedbacks from the land surface.Over the next three decades, projections of globalmean temperature rise are largely insensitive tocontrasted emission scenarios. Nevertheless, itis clear that present and future predictability ofclimate variations and change is not the sameeverywhere and that gaps in knowledge arerevealed by a lack of agreement between climatemodels in some regions, including projections ofrainfall patterns over large areas of South America(Rada et al. 1997; Boulanger et al. 2007). The Alti-plano region is poorly resolved in current GCMs,given their coarse resolution relative to thenarrowness of the Andean cordilleras. Not sur-prisingly, direct analysis of GCM outputs resultsin slight precipitation decline or increase overthe Altiplano, in contrast with a robust warmingtrend expected for the rest of the twenty-firstcentury and already fully documented since 1980onward. Glaciological studies have shown that thetemperature in the tropical Andean cordillera hasrisen between 0.10 and 0.11∘C per decade since1939 and the ongoing warming trends rangedbetween 0.32 and 0.34∘C per decade from 1974to 1998 (Vuille and Bradley 2000). In our climatescenario, the observed warming trends werepoorly represented if we compare 1981–2000to the baseline data of 1960–1980. However, forthe next time-slices, we projected an increase of2.1 and 4.0∘C in 2046–2065 and 3.0 and 5.1∘Cin 2081–2100 for both minimal and maximal airtemperatures. According to other GCM runs,temperatures are likely to increase in the range1.3–1.6∘C by the year 2030 and between 4.8 and6∘C by the year 2100 (Garreaud et al. 2009).
A compendium of results from GCM runs isambiguous about rain projections (Vuille et al.2003; Urrutia and Vuille 2009; Seth et al. 2010;Thibeault et al. 2012). To circumvent the problemwith rain projections, Minvielle and Garreaud(2011) proposed an interesting scheme andexploited a rather strong relationship betweenmid-tropospheric zonal winds and precipitationover the central Andes to project changes inregional rainfall by the end of the twenty-firstcentury. Owing to a projected weaker easterly flow,the central Andes will likely exhibit a decrease
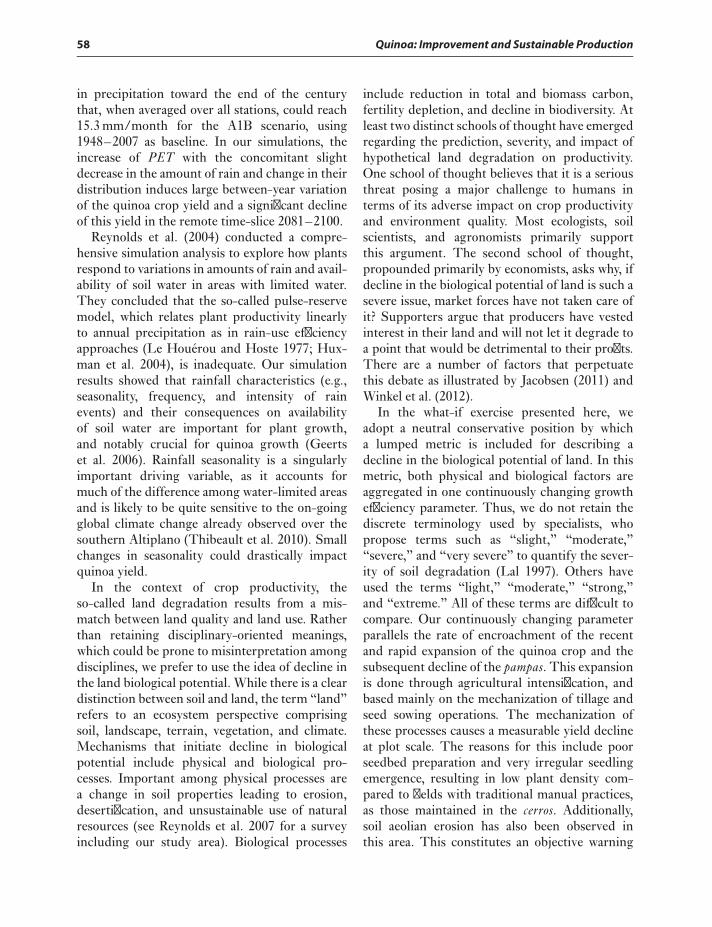
58 Quinoa: Improvement and Sustainable Production
in precipitation toward the end of the centurythat, when averaged over all stations, could reach15.3 mm/month for the A1B scenario, using1948–2007 as baseline. In our simulations, theincrease of PET with the concomitant slightdecrease in the amount of rain and change in theirdistribution induces large between-year variationof the quinoa crop yield and a significant declineof this yield in the remote time-slice 2081–2100.
Reynolds et al. (2004) conducted a compre-hensive simulation analysis to explore how plantsrespond to variations in amounts of rain and avail-ability of soil water in areas with limited water.They concluded that the so-called pulse-reservemodel, which relates plant productivity linearlyto annual precipitation as in rain-use efficiencyapproaches (Le Houérou and Hoste 1977; Hux-man et al. 2004), is inadequate. Our simulationresults showed that rainfall characteristics (e.g.,seasonality, frequency, and intensity of rainevents) and their consequences on availabilityof soil water are important for plant growth,and notably crucial for quinoa growth (Geertset al. 2006). Rainfall seasonality is a singularlyimportant driving variable, as it accounts formuch of the difference among water-limited areasand is likely to be quite sensitive to the on-goingglobal climate change already observed over thesouthern Altiplano (Thibeault et al. 2010). Smallchanges in seasonality could drastically impactquinoa yield.
In the context of crop productivity, theso-called land degradation results from a mis-match between land quality and land use. Ratherthan retaining disciplinary-oriented meanings,which could be prone to misinterpretation amongdisciplines, we prefer to use the idea of decline inthe land biological potential. While there is a cleardistinction between soil and land, the term “land”refers to an ecosystem perspective comprisingsoil, landscape, terrain, vegetation, and climate.Mechanisms that initiate decline in biologicalpotential include physical and biological pro-cesses. Important among physical processes area change in soil properties leading to erosion,desertification, and unsustainable use of naturalresources (see Reynolds et al. 2007 for a surveyincluding our study area). Biological processes
include reduction in total and biomass carbon,fertility depletion, and decline in biodiversity. Atleast two distinct schools of thought have emergedregarding the prediction, severity, and impact ofhypothetical land degradation on productivity.One school of thought believes that it is a seriousthreat posing a major challenge to humans interms of its adverse impact on crop productivityand environment quality. Most ecologists, soilscientists, and agronomists primarily supportthis argument. The second school of thought,propounded primarily by economists, asks why, ifdecline in the biological potential of land is such asevere issue, market forces have not taken care ofit? Supporters argue that producers have vestedinterest in their land and will not let it degrade toa point that would be detrimental to their profits.There are a number of factors that perpetuatethis debate as illustrated by Jacobsen (2011) andWinkel et al. (2012).
In the what-if exercise presented here, weadopt a neutral conservative position by whicha lumped metric is included for describing adecline in the biological potential of land. In thismetric, both physical and biological factors areaggregated in one continuously changing growthefficiency parameter. Thus, we do not retain thediscrete terminology used by specialists, whopropose terms such as “slight,” “moderate,”“severe,” and “very severe” to quantify the sever-ity of soil degradation (Lal 1997). Others haveused the terms “light,” “moderate,” “strong,”and “extreme.” All of these terms are difficult tocompare. Our continuously changing parameterparallels the rate of encroachment of the recentand rapid expansion of the quinoa crop and thesubsequent decline of the pampas. This expansionis done through agricultural intensification, andbased mainly on the mechanization of tillage andseed sowing operations. The mechanization ofthese processes causes a measurable yield declineat plot scale. The reasons for this include poorseedbed preparation and very irregular seedlingemergence, resulting in low plant density com-pared to fields with traditional manual practices,as those maintained in the cerros. Additionally,soil aeolian erosion has also been observed inthis area. This constitutes an objective warning
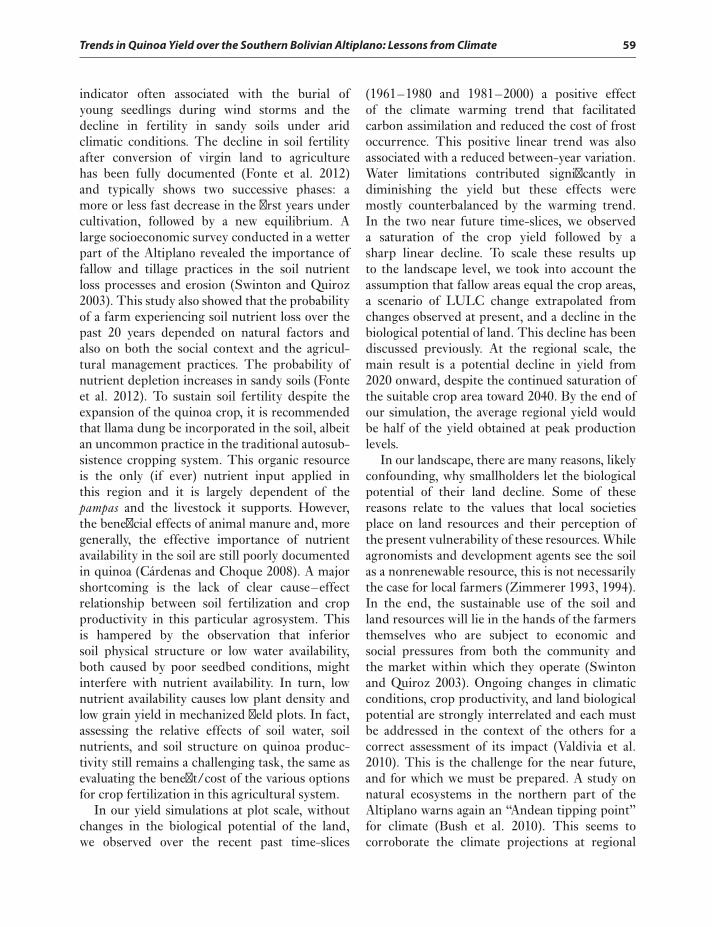
Trends in Quinoa Yield over the Southern Bolivian Altiplano: Lessons from Climate 59
indicator often associated with the burial ofyoung seedlings during wind storms and thedecline in fertility in sandy soils under aridclimatic conditions. The decline in soil fertilityafter conversion of virgin land to agriculturehas been fully documented (Fonte et al. 2012)and typically shows two successive phases: amore or less fast decrease in the first years undercultivation, followed by a new equilibrium. Alarge socioeconomic survey conducted in a wetterpart of the Altiplano revealed the importance offallow and tillage practices in the soil nutrientloss processes and erosion (Swinton and Quiroz2003). This study also showed that the probabilityof a farm experiencing soil nutrient loss over thepast 20 years depended on natural factors andalso on both the social context and the agricul-tural management practices. The probability ofnutrient depletion increases in sandy soils (Fonteet al. 2012). To sustain soil fertility despite theexpansion of the quinoa crop, it is recommendedthat llama dung be incorporated in the soil, albeitan uncommon practice in the traditional autosub-sistence cropping system. This organic resourceis the only (if ever) nutrient input applied inthis region and it is largely dependent of thepampas and the livestock it supports. However,the beneficial effects of animal manure and, moregenerally, the effective importance of nutrientavailability in the soil are still poorly documentedin quinoa (Cárdenas and Choque 2008). A majorshortcoming is the lack of clear cause–effectrelationship between soil fertilization and cropproductivity in this particular agrosystem. Thisis hampered by the observation that inferiorsoil physical structure or low water availability,both caused by poor seedbed conditions, mightinterfere with nutrient availability. In turn, lownutrient availability causes low plant density andlow grain yield in mechanized field plots. In fact,assessing the relative effects of soil water, soilnutrients, and soil structure on quinoa produc-tivity still remains a challenging task, the same asevaluating the benefit/cost of the various optionsfor crop fertilization in this agricultural system.
In our yield simulations at plot scale, withoutchanges in the biological potential of the land,we observed over the recent past time-slices
(1961–1980 and 1981–2000) a positive effectof the climate warming trend that facilitatedcarbon assimilation and reduced the cost of frostoccurrence. This positive linear trend was alsoassociated with a reduced between-year variation.Water limitations contributed significantly indiminishing the yield but these effects weremostly counterbalanced by the warming trend.In the two near future time-slices, we observeda saturation of the crop yield followed by asharp linear decline. To scale these results upto the landscape level, we took into account theassumption that fallow areas equal the crop areas,a scenario of LULC change extrapolated fromchanges observed at present, and a decline in thebiological potential of land. This decline has beendiscussed previously. At the regional scale, themain result is a potential decline in yield from2020 onward, despite the continued saturation ofthe suitable crop area toward 2040. By the end ofour simulation, the average regional yield wouldbe half of the yield obtained at peak productionlevels.
In our landscape, there are many reasons, likelyconfounding, why smallholders let the biologicalpotential of their land decline. Some of thesereasons relate to the values that local societiesplace on land resources and their perception ofthe present vulnerability of these resources. Whileagronomists and development agents see the soilas a nonrenewable resource, this is not necessarilythe case for local farmers (Zimmerer 1993, 1994).In the end, the sustainable use of the soil andland resources will lie in the hands of the farmersthemselves who are subject to economic andsocial pressures from both the community andthe market within which they operate (Swintonand Quiroz 2003). Ongoing changes in climaticconditions, crop productivity, and land biologicalpotential are strongly interrelated and each mustbe addressed in the context of the others for acorrect assessment of its impact (Valdivia et al.2010). This is the challenge for the near future,and for which we must be prepared. A study onnatural ecosystems in the northern part of theAltiplano warns again an “Andean tipping point”for climate (Bush et al. 2010). This seems tocorroborate the climate projections at regional
60 Quinoa: Improvement and Sustainable Production
scale that predict the Andean climate to disappearby the end of the twenty-first century (Williamset al. 2007).
We could question the use of speculativeexercises. Testing model simulations against fieldobservations and other model simulations is onlypart of the model validation process, and a goodagreement between simulated and measuredvalues alone does not guarantee the correctnessof using model projections (Geerts et al. 2007,2009; Lebonvallet 2008). To make further use ofthis approach in diverse ecological situations andhierarchies of scales, three challenges must beovercome. First, additional processes associatedwith land-use practices and decline in landbiological potential need to be incorporated.Second, appropriate spatially explicit simulationapproaches and scaling methods should beused to link landscape patterns and processes atmultiple spatial scales (e.g., local spot, landscape,and whole region). Correspondingly, multilayerspatial datasets need to be developed and con-tinuously updated (see Pouteau et al. 2011 fora significant account on frost mapping). Third,variables that show large changes associated withclimate, for example, warming trends and changein rainfall patterns, should be manipulated infield experiments to evaluate their effects onland productivity. Our results show that suchnumerical experiments are likely to provide astrong and realistic set of predictions with whichto compare actual long-term change in a rapidlychanging region. Thus, this study provides abasis for further investigating how abiotic andbiotic environmental changes influence quinoayield. Another arising problem is our limitedunderstanding of what the local-level impacts ofclimate change on crop yield are likely to be. Thisrelates to the uncertainties involved in GCMoutputs at the high spatial resolutions neededfor an effective application of such type of work(Challinor et al. 2005; Watson and Challinor2013). While there are still substantial gaps in ourcurrent knowledge and techniques, significantopportunities do exist for improving the produc-tion and evaluation of higher-resolution climatechange scenarios, as illustrated by the work ofBuytaert et al. (2010). Despite its limitations, the
type of analysis presented here should be able toprovide some insights to help research and devel-opment organizations target adaptation optionsfor a sustainable use of local land resources.
ACKNOWLEDGMENTS
This chapter is a tribute to Jean-Pierre Ratte whopassed away in 2011. The authors acknowledge thework of Roland Bosseno of the IRD (Institut deRecherche pour le Développement) for land-usechange analyses on SPOT images. Thanks also toD. Salas-Mélia from the CNRM (Centre Nationalde la Recherche Météorologique) Meteo Francefor climate scenarios. This study was carriedout with the financial support of the “ANR-Agence Nationale de la Recherche - The FrenchNational Research Agency” under the program“Agriculture et Développement Durable,” project“ANR-06-PADD-011-EQUECO.”
REFERENCES
Boulanger JP, Martinez F, Segura EC. Projection of futureclimate change conditions using IPCC simulations, neuralnetworks and Bayesian statistics. Part 1: Temperature meanstate and seasonal cycle in South America. Climate Dynam2006;27:233–259.
Boulanger JP, Martinez F, Segura EC. Projection of futureclimate change conditions using IPCC simulations, neuralnetworks and Bayesian statistics. Part 2: Precipitation meanstate and seasonal cycle in South America. Climate Dynam2007;28:255–271.
Bradley RS, Vuille M, Diaz HF, Vergara W. Climate Change:threats to water supplies in the Tropical Andes. Science2006;312:1755–1756.
Bush MB, Hanselman JA, Gosling WD. Nonlinear climatechange and Andean feedbacks: an imminent turning point?Glob Chang Biol 2010;16:3223–3232.
Buytaert W, Vuille M, Dewulf A, Urrutia R, Karmalkar A,Celleri R. Uncertainties in climate change projections andregional downscaling in the tropical Andes: implicationsfor water resources management. Hydrol Earth Syst Sci2010;14:1247–1258.
Cárdenas CJ, Choque MW. 2008. Fertilidad, uso y manejo de sue-los en la zona del Intersalar, departamentos de Oruro y Potosí.La Paz, Bolivia:Fundación AUTAPO, Programa Quinua Alti-plano Sur. 105 p.
Challinor AJ, Wheeler TR, Slingo JM, Hemming D. Quantifica-tion of physical and biological uncertainty in the simulation
Trends in Quinoa Yield over the Southern Bolivian Altiplano: Lessons from Climate 61
of the yield of a tropical crop using present-day and doubledCO2 climates. Philos T Roy Soc B 2005;360:2085–2094.
Falvey M, Garreaud RD. 2005. Moisture variability over theSouth American Altiplano during the South AmericanLow Level Jet Experiment (SALLJEX) observing season. JGeophys Res-Atmos 110:D22105.
Fonte SJ, Vanek SJ, Oyarzun P, Parsa S, Quintero DC, Rao IM,Lavelle P, Donald LS. Pathways to agroecological intensifica-tion of soil fertility management by smallholder farmers in theAndean highlands. Adv Agron 2012;116:125–184.
Garcia M, Raes D, Allen R, Herbas C. Dynamics of referenceevapotranspiration in the Bolivian highlands (Altiplano). AgrForest Meteorol 2004;125:67–82.
Garreaud RD. Intraseasonal variability of moisture and rainfallover the South American Altiplano. Mon Weather Rev2000;128:3337–3346.
Garreaud RD, Aceituno P. Interannual rainfall variability over theSouth American Altiplano. J Climate 2001;14:2779–2789.
Garreaud RD, Vuille M, Compagnucci R, Marengo J. Present-day South American climate. Palaeogeogr PalaeoclimatolPalaeoecol 2009;281:180–195.
Geerts S, Raes D, Garcia M, Del Castillo C, Buytaert W.Agro-climatic suitability mapping for crop production in theBolivian Altiplano: A case study for quinoa. Agric ForestMeteor 2006;139(3–4):399–412. DOI: 10.1016/j.agrformet.2006.08.018.
Geerts S, Raes D, Garcia M, Miranda R, Cusicanqui JA,Taboada C, Mendoza J, Huanca R, Mamani A, CondoriO, etal. 2007. Simulating yield response of quinoa to wateravailability with AquaCrop. Agron J 111:499–508.
Geerts S, Raes D, Garcia M, Taboada C, Miranda R, Cusican-qui J, Mhizha T, Vacher J. Modeling the potential for closingquinoa yield gaps under varying water availability in the Boli-vian Altiplano. Agr Water Manage 2009;96:1652–1658.
Hertel TW, Burke MB, Lobell DB. The poverty implications ofclimate-induced crop yield changes by 2030. Global EnvironChange 2010;20:577–585.
Huxman TE, Smith MD, Fay PA, Knapp AK, Shaw MR, LoikME, Smith SD, Tissue DT, Zak JC, Weltzin JF, et al. Conver-gence across biomes to a common rain-use efficiency. Nature2004;429:651–654.
Jacobsen SE. The situation for quinoa and its production in south-ern Bolivia: from economic success to environmental disaster.J Agron Crop Sci 2011;197:390–399.
Kalma JD, Perera H, Wooldridge SA, Stanhill G. Seasonalchanges in the fraction of global radiation retained as netall-wave radiation and their hydrological implications. HydrolSci J 2000;45:653–674.
Lal R. Degradation and resilience of soils. Philos T Roy Soc B1997;352:997–1010.
Lebonvallet S. 2008. Implantation du quinoa et simulationde sa culture sur l’altiplano bolivien. Thèse de Doctorat,AgroParisTech, France.
Le Houérou HN, Hoste CH. Rangeland production and annualrainfall relations in Mediterranean basin and in Africansahelo-sudanian zone. J Range Manage 1977;30:181–189.
Linacre ET. Simpler empirical expression for actual evapotran-spiration rates - discussion. Agr Meteorol 1973;11:451–452.
Little MA. Human populations of the Andes: the human sciencebasis for research planning. Mt Res Dev 1982;1:145–170.
Minvielle M, Garreaud RD. Projecting rainfall changes over theSouth American Altiplano. J Climate 2011;24:4577–4583.
Morales MS, Christie DA, Villalba R, Argollo J, Pacajes J, SilvaJS, Alvarez CA, Llancabure JC, Soliz Gamboa CC. Precipita-tion changes in the South American Altiplano since 1300 ADreconstructed by tree-rings. Clim Past 2012;8:653–666.
Parry ML, Livermore MTJ. 2002. Climate change, global foodsupply and risk of hunger. In: Issues in EnvironmentalScience and Technology n∘17: Global EnvironmentalChange. Cambridge, UK: The Royal Society of Chemistry.pp. 109-137.
Pouteau R, Rambal S, Ratte JP, Gogé F, Joffre R, WinkelT. Downscaling MODIS-derived maps using GIS andboosted regression trees: the case of frost occurrence overthe arid Andean highlands of Bolivia. Remote Sens Environ2011;115:117–129.
Priestley CHB, Taylor RJ. On the assessment of surface heat-fluxand evaporation using large-scale parameters. Mon WeatherRev 1972;100:81–92.
Rada OP, Crespo SR, Miranda FT. Analysis of climate scenariosfor Bolivia. Climate Res 1997;9:115–120.
Reynolds JF, Kemp PR, Ogle K, Fernandez RJ. Modifying the’pulse-reserve’ paradigm for deserts of North America: pre-cipitation pulses, soil water, and plant responses. Oecologia2004;141:194–210.
Reynolds JF, Stafford Smith DM, Lambin EF, TurnerII BL, Mortimore M, Batterbury SPJ, Downing TE,Dowlatabadi H, Fernández RJ, Herrick JE, et al. Globaldesertification: building a science for dryland development.Science 2007;316:847–851.
Ronchail J, Gallaire R. ENSO and rainfall along the Zongo val-ley (Bolivia) from the Altiplano to the Amazon basin. Int JClimatol 2006;26:1223–1236.
Saxton KE, Rawls WJ, Romberger JS, Papendick RI. Estimatinggeneralized soil-water characteristics from texture. Soil SciSoc Am J 1986;50:1031.
Seiler C, Hutjes RWA, Kabat P. Climate variability and trends inBolivia. J Appl Meteorol Climatol 2013;52:130–146.
Seth A, Thibeault J, Garcia M, Valdivia C. Making senseof twenty-first-century climate change in the altiplano:observed trends and CMIP3 projections. Ann Assoc AmGeogr 2010;100:835–847.
Swinton SM, Quiroz R. Poverty and the deterioration of natu-ral soil capital in the Peruvian altiplano. Environ Dev Sustain2003;5:477–490.
Thibeault J, Seth A, Wang GL. Mechanisms of summertimeprecipitation variability in the Bolivian Altiplano: presentand future. Int J Climatol 2012;32:2033–2041.
62 Quinoa: Improvement and Sustainable Production
Thibeault JM, Seth A, Garcia M. 2010. Changing climate in theBolivian Altiplano: CMIP3 projections for temperature andprecipitation extremes. J Geophys Res-Atmos 115:D08103.
Urrutia R, Vuille M. 2009. Climate change projections for thetropical Andes using a regional climate model: temperatureand precipitation simulations for the end of the 21st century.J Geophys Res-Atmos 114:D021108.
Valdivia C, Seth A, Gilles JL, García M, Jiménez E,Cusicanqui J, Navia F, Yucra E. Adapting to climate changein Andean ecosystems: landscapes, capitals, and perceptionsshaping rural livelihood strategies and linking knowledgesystems. Ann Assoc Am Geogr 2010;100:818–834.
Vergara W, Kondo H, Pérez Pérez E, Méndez Pérez JM, Mag-aña Rueda V, Martínez Arango MC, Ruíz Murcia JF, Ava-los Roldán GJ, Palacios E. 2007. Visualizing future climate inLatin America: results from the application of the Earth Sim-ulator. The World Bank, Latin America and the CaribbeanRegion. 82 p.
Vicente-Serrano SM, Gouveia C, Camarero JJ, Beguería S,Trigo R, López-Moreno JI, Azorín-Molina C, Pasho E,Lorenzo-Lacruz J, Revuelto J. Response of vegetation todrought time-scales across global land biomes. Proc NatAcad Sci 2013;110:52–57. http://dx.doi.org/10.1073/pnas.1207068110.
Vuille M, Ammann C. Regional snowfall patterns in the high,arid Andes. Climatic change 1997;36(3–4):413–423. DOI:10.1023/A:1005330802974.
Vuille M, Bradley RS. Mean annual temperature trends and theirvertical structure in the tropical Andes. Geophys Res Lett2000;27:3885–3888.
Vuille M, Bradley RS, Werner M, Keimig F. 20th century climatechange in the tropical Andes: observations and model results.Clim Change 2003;59:75–99.
Vuille M, Francou B, Wagnon P, Juen I, Kaser G, Mark BG,Bradley RS. Climate change and tropical Andean glaciers:past, present and future. Earth-Sci Rev 2008;89:79–96.
Watson J, Challinor A. The relative importance of rainfall, tem-perature and yield data for a regional-scale crop model. AgrForest Meteorol 2013;170:47–57.
Williams JW, Jackson ST, Kutzbach JE. Projected distributionsof novel and disappearing climates by 2100 AD. Proc NatlAcad Sci 2007;104:5738–5742.
Winkel T, Bertero HD, Bommel P, Chevarría Lazo M,Cortes G, Gasselin P, Geerts S, Joffre R, Léger F, MartinezAvisa B, et al. The sustainability of quinoa production insouthern Bolivia: from misrepresentations to questionablesolutions. Comments on Jacobsen (2011, J. Agron. Crop Sci.197: 390–399). J Agron Crop Sci 2012;198:314–319.
Zimmerer KS. Soil erosion and social (dis)courses inCochabamba, Bolivia: perceiving the nature of environmentaldegradation. Econ Geogr 1993;69:312–327.
Zimmerer KS. Local soil knowledge: answering basic ques-tions in highland Bolivia. J Soil Water Conserv 1994;49:29–34.
Chapter 5
The Potential of Using Natural Enemiesand Chemical Compounds in Quinoa for
Biological Control of Insect Pests
Mariana Valoy1, Carmen Reguilón2, and Griselda Podazza1
1Instituto de Ecología, Fundación Miguel Lillo, Tucumán, Argentina2Instituto de Entomología, Fundación Miguel Lillo, Tucumán, Argentina
INTRODUCTION
Over the centuries, agriculture has transformednatural landscapes into agricultural landscapes,and modified not only plant diversity but alsoanimal diversity, including insect diversity.Insect life depends on plant populations, asthey feed, reproduce, oviposit, and shelter inplants. Changes in the structure and diversity ofvegetation, land use, cultivated area, type of cropmanagement, physical environment, and otherfactors influence the behavior of insects, turningmany of them into agricultural pests.
Agricultural intensification is one of the factorsthat modify an ecosystem’s ability to managepest populations by means of natural enemies(Altieri and Letourneau 1982; Oerke et al.1994; Matson et al. 1997; Wilby and Thomas2002; Bianchi et al. 2006; Parsa 2010). Thereare three hypotheses regarding the influence ofagricultural intensification on pest populationsand their natural enemies. First, with agriculturalintensification, natural enemy populations aredecimated by pesticides and/or decreased by thesimplification of local ecosystem structures andlandscapes driven by reduction of plant diversity(DeBach and Rosen 1991; Andow 1991; Bianchi
Quinoa: Improvement and Sustainable Production, First Edition. Edited by Kevin Murphy and Janet Matanguihan.© 2015 John Wiley & Sons, Inc. Published 2015 by John Wiley & Sons, Inc.
et al. 2006). Second, crop intensification alsocontributes to the increase and persistence ofpests by providing concentrated resources andan optimal environment for insects (Root 1973).Third, crop intensification entails the use ofinsecticides and techniques to enhance produc-tivity, ultimately weakening plant defenses againstherbivores (Harris 1980; Throop and Lerdau2004). In this context, it has been proposed thatecological knowledge, conservation, and handlingof biotic interactions (Médiène et al. 2011) areessential elements for reducing chemical use andpromoting ecosystem services, thereby slowingdown the loss of diversity in agroecosystems(Robinson and Sutherland 2002; Benton et al.2003; Bianchi et al. 2006; Farwig et al. 2009).
Since ancient times, Andean agroecosystemshave had a wide variety of cultivated species(Kraljevic 2006). Among these species, theAndean grains stand out, of which quinoa(Chenopodium quinoa Willd.) is one of the mostrepresentative species. Traditionally, quinoa cul-tivation has been intended for local consumption,with long periods of fallow land. In cultivatedareas, direct sowing, manure application, thresh-ing, and cleaning were all performed manually(Jacobsen 2011). This type of subsistence
63
64 Quinoa: Improvement and Sustainable Production
agriculture was characterized by covering a smallarea of cultivated land and sowing seed in moun-tain slopes. However, due to the high internationaldemand for quinoa (Jacobsen 2011), its cultiva-tion has been extended to the plains. This marksthe beginning of a semi-intensive agriculture,going from a crop rotation system, which is akey component for sustainable agriculture, to amarked tendency toward intensified monoculture(CIRNMA 2009).
The intensification of quinoa production hasalso increased pests and diseases and is hasteningsoil deterioration to the detriment of the environ-ment and sustainability of the quinoa crop itself(Mujica 1993; Campos et al. 2012).
A study assessed the effect of crop intensi-fication on insect pest populations and showedan increase in the population density of thequinoa moth (Eurysacca melanocampta) beyondthe economic damage threshold, causing a yieldreduction and economic loss (Campos et al. 2012).Use of farm machinery, such as a plough andsowing machine, produces a loose soil substratumthat helps ticona larvae (Copitarsia sp.) and quinoamoth (Eurysacca quinoae) to penetrate the soileasily and complete their life cycles (Rasmussenet al. 2003; Sigsgaard et al. 2008).
At present, there has been little attentiongiven to the study of entomofauna associatedwith quinoa compared to other Andean cropssuch as corn and potato (Zanabria and Mujica1977; Sánchez and Vergara 1991; Yábar et al.2002; Valoy et al. 2011). Because of this, there isa critical lack of knowledge about insect diversityand the role they play in quinoa cropping systems.However, there is a recent movement towardimplementation of integrated pest managementstrategies in quinoa (Palacios et al. 1999; Dangleset al. 2009, 2010).
In this chapter, existing information on harm-ful and beneficial insects of quinoa is discussed.The short-term and long-term effects of changesin quinoa production are also examined. Possiblesolutions to the challenges posed by currentquinoa farming are explored within the contextof sustainable agroecosystems.
INSECTS IN QUINOA
Insects associated with quinoa consist of diversephytophagous and entomophagous organisms.The abundance and occurrence of these insectpopulations, and the intensity of herbivorydamage, may fluctuate according to quinoaphenological stages and the prevailing environ-mental conditions throughout the growing period(Mamani Quispe 2009; Valoy et al. 2011). Otherfactors involved are location and extent of crops,cultivars used, presence or absence of other cropsnearby, and presence of native vegetation patches,among others (Costa et al. 2009a, 2009b).
In order to implement integrated managementprograms with emphasis on biological control, itis fundamental to identify and study the insectscomprising the agroecosystem. Native and exoticinsect species have been reported associated withquinoa (Ortíz Romero 1993). These are membersof different functional herbivorous groups such asleaf miners, leaf cutters, leaf chewers, sap suckers,stem borers, defoliators, and grain and panicleconsumers (Alata 1973; Ortiz and Sanabria 1979;Bravo and Delgado 1992; Ortiz 1997; Zanabriaand Banegas 1997; Rasmussen et al. 2003).Moreover, many of these herbivores are vectors ofpathogenic microorganisms (FAO 1993).
The Neotropical region, an ecozone thatincludes South and Central America, the Mexi-can lowlands, the Caribbean islands, and southernFlorida, has 74 insect species associated withquinoa. These insect species are distributedin 25 families belonging to five orders: Lepi-doptera, Hemiptera, Coleoptera, Diptera, andThysanoptera (Barrientos Zamora 1985; FAO1993; Lamborot et al. 1999; Hidalgo and Jacobsen2000; Rasmussen et al. 2001; Yábar et al. 2002;Saravia and Quispe 2005; Costa et al. 2007, 2009a,2009b; Valoy et al. 2011; Campos et al. 2012). Mostof these insect records pertain to quinoa cropslocated in Bolivia, Peru, and Ecuador, whereas inthe more southern portion of the Andes, infor-mation is scarce, with a few descriptive papers(Lamborot et al. 1999; Reguilón et al. 2009; Valoyet al. 2011). A literature review revealed that in21 years (1987–2012) there are only 20 paperspublished on insects linked to Andean crops such
The Potential of Using Natural Enemies and Chemical Compounds 65
as quinoa, amaranth, and potato. Twelve of thesepapers mentioned insects of quinoa, includingharmful and beneficial ones (Valoy, unpublisheddata) (Table 5.1 and Figs 5.1–5.3).
Insect pests of quinoa
Among the insect pests of quinoa, several Lepi-dopteran species collectively known as the quinoamoth cause the greatest damage. Among thesemoths, E. melanocampta and E. quinoae (Lepi-doptera: Gelechiidae) are regarded as key pests,due to the direct damage their larvae make to theplant. Even though they affect all developmentalstages of the plant, most damage is inflictedduring the grain ripening state (Rasmussen2003). E. melanocampta, commonly known as“quinoa kuro,” causes between 35% and 60%of plant damage (Ochoa Vizarreta and Franco2013). Its distribution covers xeric environmentsof the Andes Mountains (1,900–4,350 masl)from Argentina and Chile to northern Colombia(Povolny and Valencia 1986; Povolny 1986, 1997).Adults have crepuscular or nocturnal habit andtypically lay their eggs in the glomeruli or inflo-rescence axils. When first-stage larvae emerge,they chew leaves and inflorescences. The moreadvanced larval stages subsequently roll leavesfor use as shelter as they wait to feed duringthe grain-filling and ripening stages (Rasmussen2003; Ochoa Vizarreta and Franco 2013). Thebiology and morphology of E. quinoae (commonlynamed “kona kona” or “grain grinder”) is verysimilar to E. melanocampta, but distinguishedfrom each other by differences in their wingspot patterns (Ochoa 1990; Povolny 1997). E.quinoae has often been described as a pest of morerestricted distribution than E. melanocampta,although recent papers mentioned E. quinoae as akey pest in Peru (Rasmussen et al. 2000; Camposet al. 2012) (Fig. 5.1).
Another Lepidopteran group that may occa-sionally cause important losses in quinoa is the“ticona complex,” a group composed of cut-worms belonging to family Noctuidae: Copitarsiaturbata, Feltia sp., Heliothis sp., and Spodopterasp. (Blanco 1982; Aroni 2000; Chambilla et al.2009). The most representative species of this
complex is C. turbata (Larrain 1996). Its larvaeare stemborers, usually causing damage in thebeginning of the season by cutting the stem ofyoung plants. In cases of severe infestation, theymay even eat leaves, inflorescences, and grains,aside from shoots and stems (Vela and Quispe1988; Zanabria and Banegas 1997).
Rasmussen et al. (2003) listed several phy-tophagous insects that affect quinoa, indicatingwhich are pests and potential pests. Included inthe list are the orders Orthoptera (Gryllidae) andDiptera (Agromizidae), together with Coleoptera(Bruchidae, Curculionidae, and Tenebrionidae),for a total of 54 species (Table 5.1 and Fig. 5.1).
South of the Neotropical region, in Brazil, theAtta sp. (Formicidae: Hymenoptera) and Diabrot-ica speciosa (Genn.) (Coccinellidae: Coleoptera)species have been reported in quinoa (CabreraAlmendros and Oliveira 2011). In the Amaichadel Valle, Tucumán, Argentina, Valoy et al. (2011)carried out studies in an experimental quinoaplot and reported the presence of three families,four genera, and seven species of phytophagousinsects that have not been mentioned previouslyin quinoa grown in the Neotropical region(Table 5.1 and Fig. 5.1).
Beneficial insects in quinoa
Natural enemies of phytophagous insects are alsocalled beneficial or entomophagous insects. Mostphytophagous insects have more than one andoften many natural enemies that regulate theirpopulations. A large number of beneficial insectsattack several species of herbivorous insects inquinoa, while there are entomophagous groupsthat are more specific (Table 5.2). Generally, natu-ral enemies of phytophagous insects are classifiedas parasitoids, predators, or pathogens. Specifi-cally, parasitoids and predators are categorizedas entomophagous and these will be discussedin more detail in this chapter. Another group ofnatural enemies of insects are entomopathogens,which are microorganisms that cause diseases oninsects. These are closely associated with insectpests and have been used to control insect pestsin quinoa but are discussed only briefly in thischapter.
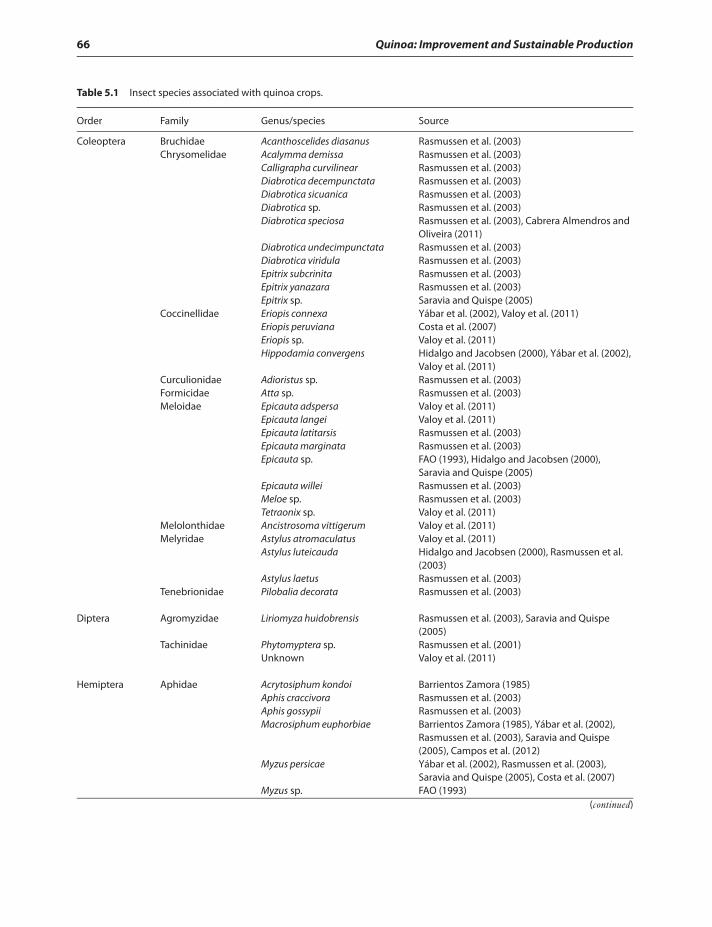
66 Quinoa: Improvement and Sustainable Production
Table 5.1 Insect species associated with quinoa crops.
Order Family Genus/species Source
Coleoptera Bruchidae Acanthoscelides diasanus Rasmussen et al. (2003)Chrysomelidae Acalymma demissa Rasmussen et al. (2003)
Calligrapha curvilinear Rasmussen et al. (2003)Diabrotica decempunctata Rasmussen et al. (2003)Diabrotica sicuanica Rasmussen et al. (2003)Diabrotica sp. Rasmussen et al. (2003)Diabrotica speciosa Rasmussen et al. (2003), Cabrera Almendros and
Oliveira (2011)Diabrotica undecimpunctata Rasmussen et al. (2003)Diabrotica viridula Rasmussen et al. (2003)Epitrix subcrinita Rasmussen et al. (2003)Epitrix yanazara Rasmussen et al. (2003)Epitrix sp. Saravia and Quispe (2005)
Coccinellidae Eriopis connexa Yábar et al. (2002), Valoy et al. (2011)Eriopis peruviana Costa et al. (2007)Eriopis sp. Valoy et al. (2011)Hippodamia convergens Hidalgo and Jacobsen (2000), Yábar et al. (2002),
Valoy et al. (2011)Curculionidae Adioristus sp. Rasmussen et al. (2003)Formicidae Atta sp. Rasmussen et al. (2003)Meloidae Epicauta adspersa Valoy et al. (2011)
Epicauta langei Valoy et al. (2011)Epicauta latitarsis Rasmussen et al. (2003)Epicauta marginata Rasmussen et al. (2003)Epicauta sp. FAO (1993), Hidalgo and Jacobsen (2000),
Saravia and Quispe (2005)Epicauta willei Rasmussen et al. (2003)Meloe sp. Rasmussen et al. (2003)Tetraonix sp. Valoy et al. (2011)
Melolonthidae Ancistrosoma vittigerum Valoy et al. (2011)Melyridae Astylus atromaculatus Valoy et al. (2011)
Astylus luteicauda Hidalgo and Jacobsen (2000), Rasmussen et al.(2003)
Astylus laetus Rasmussen et al. (2003)Tenebrionidae Pilobalia decorata Rasmussen et al. (2003)
Diptera Agromyzidae Liriomyza huidobrensis Rasmussen et al. (2003), Saravia and Quispe(2005)
Tachinidae Phytomyptera sp. Rasmussen et al. (2001)Unknown Valoy et al. (2011)
Hemiptera Aphidae Acrytosiphum kondoi Barrientos Zamora (1985)Aphis craccivora Rasmussen et al. (2003)Aphis gossypii Rasmussen et al. (2003)Macrosiphum euphorbiae Barrientos Zamora (1985), Yábar et al. (2002),
Rasmussen et al. (2003), Saravia and Quispe(2005), Campos et al. (2012)
Myzus persicae Yábar et al. (2002), Rasmussen et al. (2003),Saravia and Quispe (2005), Costa et al. (2007)
Myzus sp. FAO (1993)(continued)
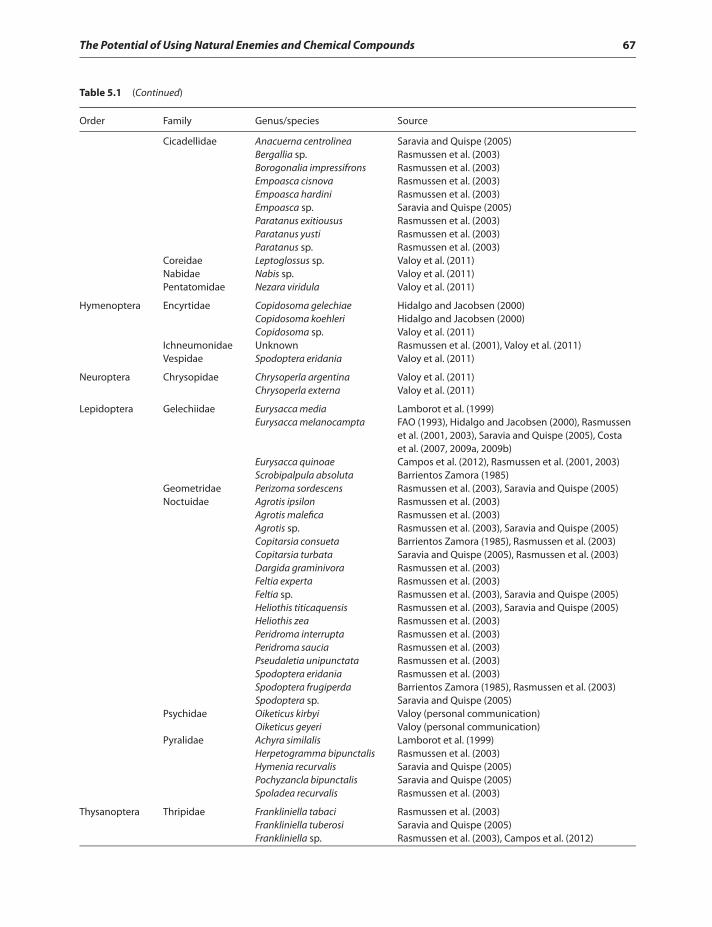
The Potential of Using Natural Enemies and Chemical Compounds 67
Table 5.1 (Continued)
Order Family Genus/species Source
Cicadellidae Anacuerna centrolinea Saravia and Quispe (2005)Bergallia sp. Rasmussen et al. (2003)Borogonalia impressifrons Rasmussen et al. (2003)Empoasca cisnova Rasmussen et al. (2003)Empoasca hardini Rasmussen et al. (2003)Empoasca sp. Saravia and Quispe (2005)Paratanus exitiousus Rasmussen et al. (2003)Paratanus yusti Rasmussen et al. (2003)Paratanus sp. Rasmussen et al. (2003)
Coreidae Leptoglossus sp. Valoy et al. (2011)Nabidae Nabis sp. Valoy et al. (2011)Pentatomidae Nezara viridula Valoy et al. (2011)
Hymenoptera Encyrtidae Copidosoma gelechiae Hidalgo and Jacobsen (2000)Copidosoma koehleri Hidalgo and Jacobsen (2000)Copidosoma sp. Valoy et al. (2011)
Ichneumonidae Unknown Rasmussen et al. (2001), Valoy et al. (2011)Vespidae Spodoptera eridania Valoy et al. (2011)
Neuroptera Chrysopidae Chrysoperla argentina Valoy et al. (2011)Chrysoperla externa Valoy et al. (2011)
Lepidoptera Gelechiidae Eurysacca media Lamborot et al. (1999)Eurysacca melanocampta FAO (1993), Hidalgo and Jacobsen (2000), Rasmussen
et al. (2001, 2003), Saravia and Quispe (2005), Costaet al. (2007, 2009a, 2009b)
Eurysacca quinoae Campos et al. (2012), Rasmussen et al. (2001, 2003)Scrobipalpula absoluta Barrientos Zamora (1985)
Geometridae Perizoma sordescens Rasmussen et al. (2003), Saravia and Quispe (2005)Noctuidae Agrotis ipsilon Rasmussen et al. (2003)
Agrotis malefica Rasmussen et al. (2003)Agrotis sp. Rasmussen et al. (2003), Saravia and Quispe (2005)Copitarsia consueta Barrientos Zamora (1985), Rasmussen et al. (2003)Copitarsia turbata Saravia and Quispe (2005), Rasmussen et al. (2003)Dargida graminivora Rasmussen et al. (2003)Feltia experta Rasmussen et al. (2003)Feltia sp. Rasmussen et al. (2003), Saravia and Quispe (2005)Heliothis titicaquensis Rasmussen et al. (2003), Saravia and Quispe (2005)Heliothis zea Rasmussen et al. (2003)Peridroma interrupta Rasmussen et al. (2003)Peridroma saucia Rasmussen et al. (2003)Pseudaletia unipunctata Rasmussen et al. (2003)Spodoptera eridania Rasmussen et al. (2003)Spodoptera frugiperda Barrientos Zamora (1985), Rasmussen et al. (2003)Spodoptera sp. Saravia and Quispe (2005)
Psychidae Oiketicus kirbyi Valoy (personal communication)Oiketicus geyeri Valoy (personal communication)
Pyralidae Achyra similalis Lamborot et al. (1999)Herpetogramma bipunctalis Rasmussen et al. (2003)Hymenia recurvalis Saravia and Quispe (2005)Pochyzancla bipunctalis Saravia and Quispe (2005)Spoladea recurvalis Rasmussen et al. (2003)
Thysanoptera Thripidae Frankliniella tabaci Rasmussen et al. (2003)Frankliniella tuberosi Saravia and Quispe (2005)Frankliniella sp. Rasmussen et al. (2003), Campos et al. (2012)
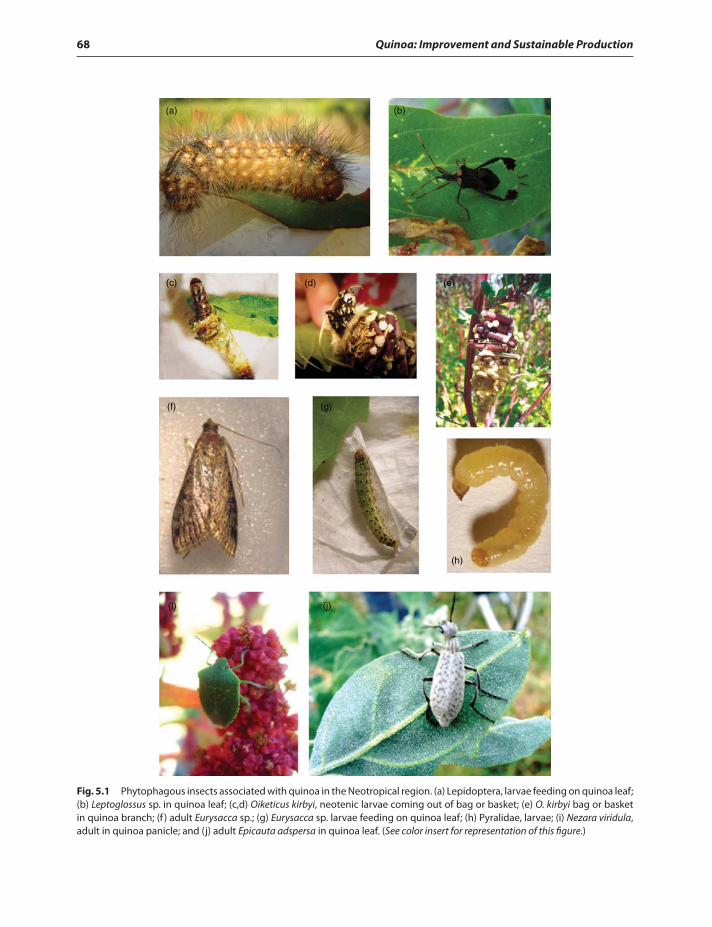
68 Quinoa: Improvement and Sustainable Production
(a)
(c)
(f) (g)
(h)
(j)(l)
(d) (e)
(b)
Fig. 5.1 Phytophagous insects associated with quinoa in the Neotropical region. (a) Lepidoptera, larvae feeding on quinoa leaf;(b) Leptoglossus sp. in quinoa leaf; (c,d) Oiketicus kirbyi, neotenic larvae coming out of bag or basket; (e) O. kirbyi bag or basketin quinoa branch; (f ) adult Eurysacca sp.; (g) Eurysacca sp. larvae feeding on quinoa leaf; (h) Pyralidae, larvae; (i) Nezara viridula,adult in quinoa panicle; and (j) adult Epicauta adspersa in quinoa leaf. (See color insert for representation of this figure.)
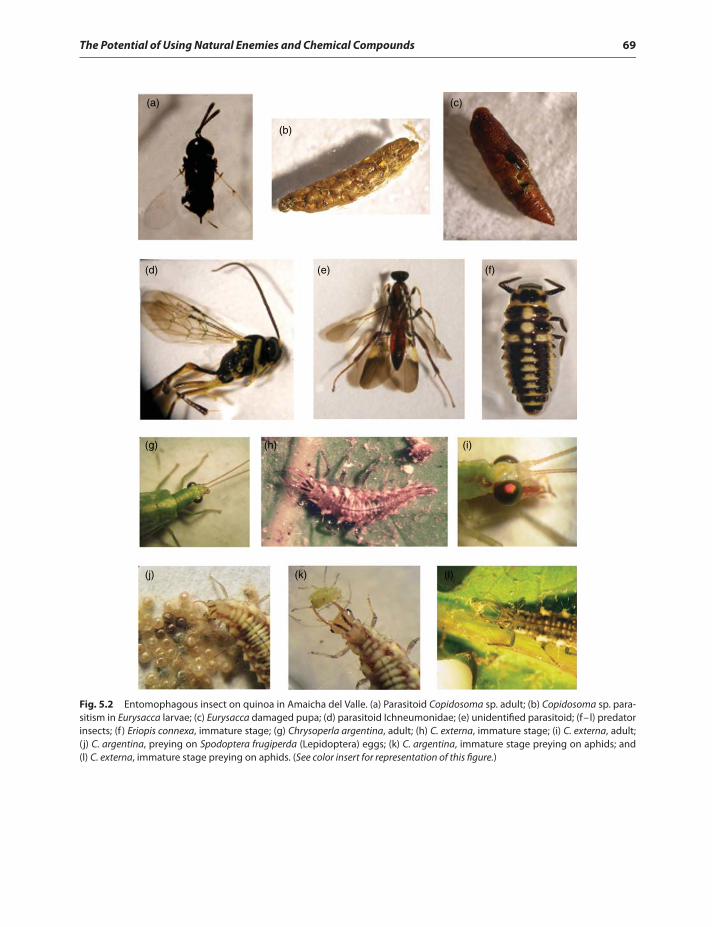
The Potential of Using Natural Enemies and Chemical Compounds 69
(a)
(d)
(g) (h) (i)
(l)(k)(j)
(e) (f)
(b)
(c)
Fig. 5.2 Entomophagous insect on quinoa in Amaicha del Valle. (a) Parasitoid Copidosoma sp. adult; (b) Copidosoma sp. para-sitism in Eurysacca larvae; (c) Eurysacca damaged pupa; (d) parasitoid Ichneumonidae; (e) unidentified parasitoid; (f–l) predatorinsects; (f ) Eriopis connexa, immature stage; (g) Chrysoperla argentina, adult; (h) C. externa, immature stage; (i) C. externa, adult;(j) C. argentina, preying on Spodoptera frugiperda (Lepidoptera) eggs; (k) C. argentina, immature stage preying on aphids; and(l) C. externa, immature stage preying on aphids. (See color insert for representation of this figure.)
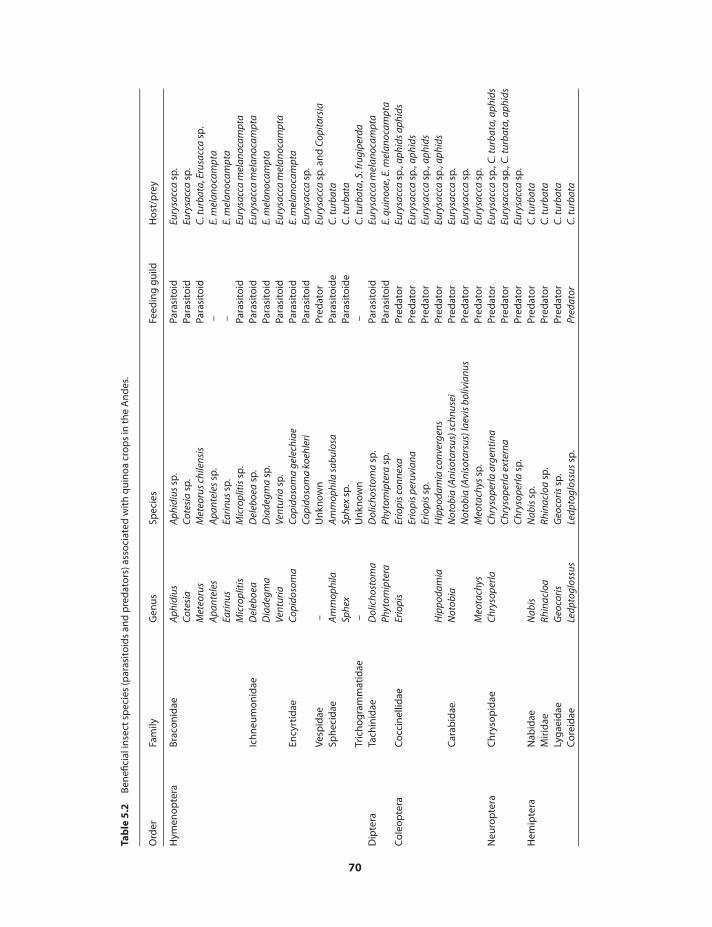
Tab
le5.
2Be
nefic
iali
nsec
tsp
ecie
s(p
aras
itoid
san
dp
reda
tors
)ass
ocia
ted
with
quin
oacr
ops
inth
eA
ndes
.
Ord
erFa
mily
Gen
usSp
ecie
sFe
edin
ggu
ildH
ost/
pre
y
Hym
enop
tera
Brac
onid
aeA
phid
ius
Aph
idiu
ssp
.Pa
rasi
toid
Eury
sacc
asp
.Co
tesi
aCo
tesi
asp
.Pa
rasi
toid
Eury
sacc
asp
.M
eteo
rus
Met
eoru
schi
lens
isPa
rasi
toid
C.tu
rbat
a,Er
usac
casp
.A
pant
eles
Apa
ntel
essp
.–
E.m
elan
ocam
pta
Earin
usEa
rinus
sp.
–E.
mel
anoc
ampt
aM
icro
pliti
sM
icro
pliti
ssp
.Pa
rasi
toid
Eury
sacc
am
elan
ocam
pta
Ichn
eum
onid
aeD
eleb
oea
Del
eboe
asp
.Pa
rasi
toid
Eury
sacc
am
elan
ocam
pta
Dia
degm
aD
iade
gma
sp.
Para
sito
idE.
mel
anoc
ampt
aVe
ntur
iaVe
ntur
iasp
.Pa
rasi
toid
Eury
sacc
am
elan
ocam
pta
Ency
rtid
aeCo
pido
som
aCo
pido
som
age
lech
iae
Para
sito
idE.
mel
anoc
ampt
aCo
pido
som
ako
ehle
riPa
rasi
toid
Eury
sacc
asp
.Ve
spid
ae–
Unk
now
nPr
edat
orEu
rysa
cca
sp.a
ndCo
pita
rsia
Sphe
cida
eA
mm
ophi
laA
mm
ophi
lasa
bulo
saPa
rasi
toid
eC.
turb
ata
Sphe
xSp
hex
sp.
Para
sito
ide
C.tu
rbat
aTr
icho
gram
mat
idae
–U
nkno
wn
–C.
turb
ata,
S.fr
ugip
erda
Dip
tera
Tach
inid
aeD
olic
host
oma
Dol
icho
stom
asp
.Pa
rasi
toid
Eury
sacc
am
elan
ocam
pta
Phyt
omip
tera
Phyt
omip
tera
sp.
Para
sito
idE.
quin
oae,
E.m
elan
ocam
pta
Col
eop
tera
Coc
cine
llida
eEr
iopi
sEr
iopi
scon
nexa
Pred
ator
Eury
sacc
asp
.,ap
hids
aphi
dsEr
iopi
sper
uvia
naPr
edat
orEu
rysa
cca
sp.,
aphi
dsEr
iopi
ssp
.Pr
edat
orEu
rysa
cca
sp.,
aphi
dsH
ippo
dam
iaH
ippo
dam
iaco
nver
gens
Pred
ator
Eury
sacc
asp
.,ap
hids
Car
abid
aeN
otob
iaN
otob
ia(A
niso
tars
us)s
chnu
sei
Pred
ator
Eury
sacc
asp
.N
otob
ia(A
niso
tars
us)l
aevi
sbol
ivia
nus
Pred
ator
Eury
sacc
asp
.M
eota
chys
Meo
tach
yssp
.Pr
edat
orEu
rysa
cca
sp.
Neu
rop
tera
Chr
ysop
idae
Chry
sope
rlaCh
ryso
perla
arge
ntin
aPr
edat
orEu
rysa
cca
sp.,
C.tu
rbat
a,ap
hids
Chry
sope
rlaex
tern
aPr
edat
orEu
rysa
cca
sp.,
C.tu
rbat
a,ap
hids
Chry
sope
rlasp
.Pr
edat
orEu
rysa
cca
sp.
Hem
ipte
raN
abid
aeN
abis
Nab
issp
.Pr
edat
orC.
turb
ata
Mir
idae
Rhin
aclo
aRh
inac
loa
sp.
Pred
ator
C.tu
rbat
aLy
gaei
dae
Geo
coris
Geo
coris
sp.
Pred
ator
C.tu
rbat
aC
orei
dae
Ledp
togl
ossu
sLe
dpto
glos
sus
sp.
Pred
ator
C.tu
rbat
a
70
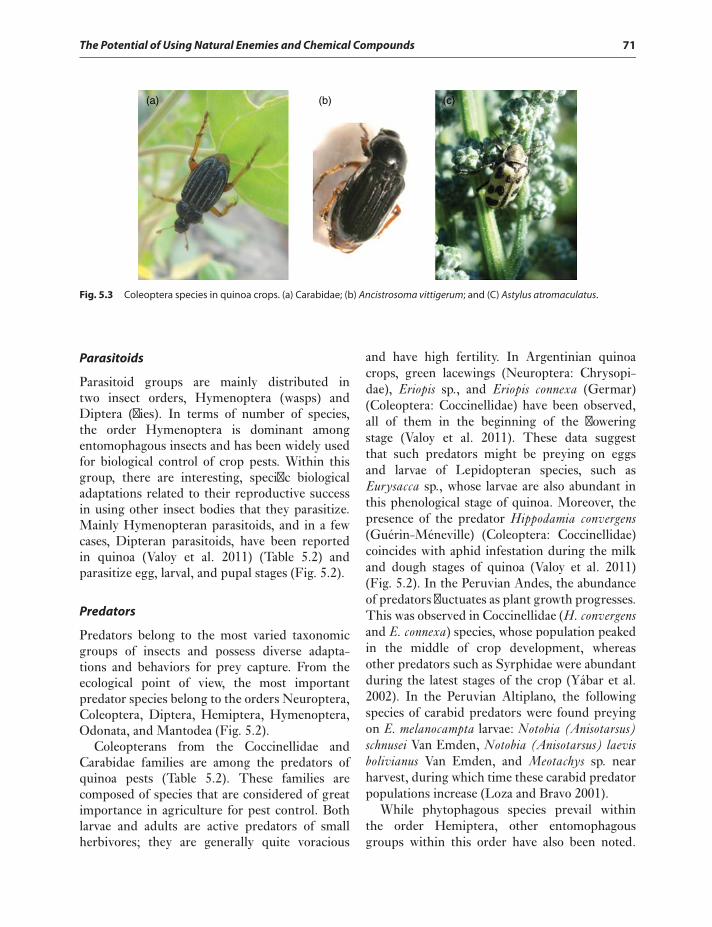
The Potential of Using Natural Enemies and Chemical Compounds 71
(a) (b) (c)
Fig. 5.3 Coleoptera species in quinoa crops. (a) Carabidae; (b) Ancistrosoma vittigerum; and (C) Astylus atromaculatus.
Parasitoids
Parasitoid groups are mainly distributed intwo insect orders, Hymenoptera (wasps) andDiptera (flies). In terms of number of species,the order Hymenoptera is dominant amongentomophagous insects and has been widely usedfor biological control of crop pests. Within thisgroup, there are interesting, specific biologicaladaptations related to their reproductive successin using other insect bodies that they parasitize.Mainly Hymenopteran parasitoids, and in a fewcases, Dipteran parasitoids, have been reportedin quinoa (Valoy et al. 2011) (Table 5.2) andparasitize egg, larval, and pupal stages (Fig. 5.2).
Predators
Predators belong to the most varied taxonomicgroups of insects and possess diverse adapta-tions and behaviors for prey capture. From theecological point of view, the most importantpredator species belong to the orders Neuroptera,Coleoptera, Diptera, Hemiptera, Hymenoptera,Odonata, and Mantodea (Fig. 5.2).
Coleopterans from the Coccinellidae andCarabidae families are among the predators ofquinoa pests (Table 5.2). These families arecomposed of species that are considered of greatimportance in agriculture for pest control. Bothlarvae and adults are active predators of smallherbivores; they are generally quite voracious
and have high fertility. In Argentinian quinoacrops, green lacewings (Neuroptera: Chrysopi-dae), Eriopis sp., and Eriopis connexa (Germar)(Coleoptera: Coccinellidae) have been observed,all of them in the beginning of the floweringstage (Valoy et al. 2011). These data suggestthat such predators might be preying on eggsand larvae of Lepidopteran species, such asEurysacca sp., whose larvae are also abundant inthis phenological stage of quinoa. Moreover, thepresence of the predator Hippodamia convergens(Guérin-Méneville) (Coleoptera: Coccinellidae)coincides with aphid infestation during the milkand dough stages of quinoa (Valoy et al. 2011)(Fig. 5.2). In the Peruvian Andes, the abundanceof predators fluctuates as plant growth progresses.This was observed in Coccinellidae (H. convergensand E. connexa) species, whose population peakedin the middle of crop development, whereasother predators such as Syrphidae were abundantduring the latest stages of the crop (Yábar et al.2002). In the Peruvian Altiplano, the followingspecies of carabid predators were found preyingon E. melanocampta larvae: Notobia (Anisotarsus)schnusei Van Emden, Notobia (Anisotarsus) laevisbolivianus Van Emden, and Meotachys sp. nearharvest, during which time these carabid predatorpopulations increase (Loza and Bravo 2001).
While phytophagous species prevail withinthe order Hemiptera, other entomophagousgroups within this order have also been noted.
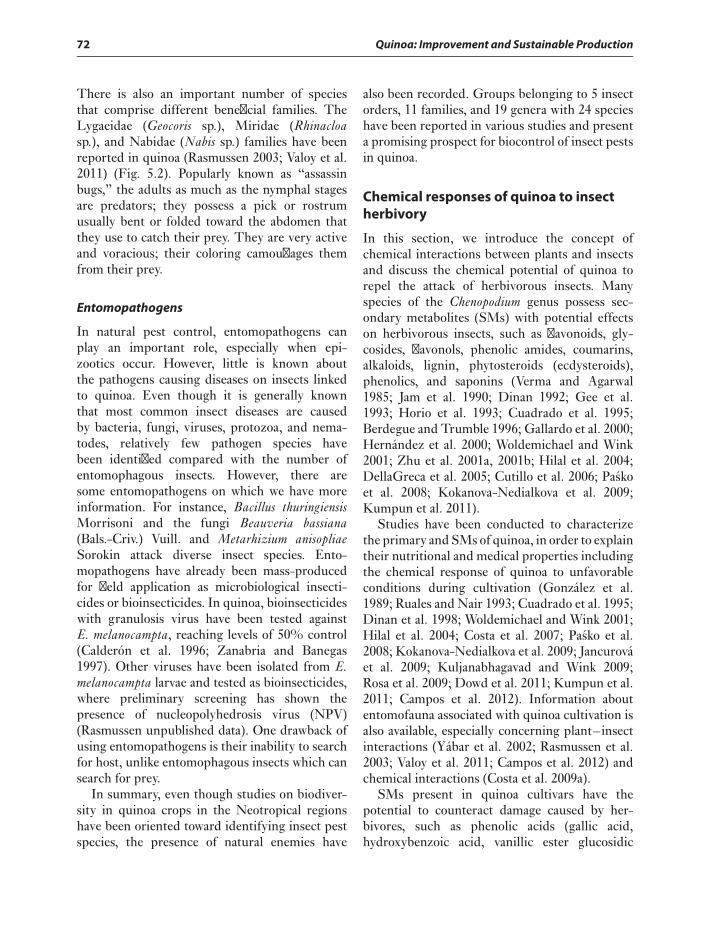
72 Quinoa: Improvement and Sustainable Production
There is also an important number of speciesthat comprise different beneficial families. TheLygaeidae (Geocoris sp.), Miridae (Rhinacloasp.), and Nabidae (Nabis sp.) families have beenreported in quinoa (Rasmussen 2003; Valoy et al.2011) (Fig. 5.2). Popularly known as “assassinbugs,” the adults as much as the nymphal stagesare predators; they possess a pick or rostrumusually bent or folded toward the abdomen thatthey use to catch their prey. They are very activeand voracious; their coloring camouflages themfrom their prey.
Entomopathogens
In natural pest control, entomopathogens canplay an important role, especially when epi-zootics occur. However, little is known aboutthe pathogens causing diseases on insects linkedto quinoa. Even though it is generally knownthat most common insect diseases are causedby bacteria, fungi, viruses, protozoa, and nema-todes, relatively few pathogen species havebeen identified compared with the number ofentomophagous insects. However, there aresome entomopathogens on which we have moreinformation. For instance, Bacillus thuringiensisMorrisoni and the fungi Beauveria bassiana(Bals.-Criv.) Vuill. and Metarhizium anisopliaeSorokin attack diverse insect species. Ento-mopathogens have already been mass-producedfor field application as microbiological insecti-cides or bioinsecticides. In quinoa, bioinsecticideswith granulosis virus have been tested againstE. melanocampta, reaching levels of 50% control(Calderón et al. 1996; Zanabria and Banegas1997). Other viruses have been isolated from E.melanocampta larvae and tested as bioinsecticides,where preliminary screening has shown thepresence of nucleopolyhedrosis virus (NPV)(Rasmussen unpublished data). One drawback ofusing entomopathogens is their inability to searchfor host, unlike entomophagous insects which cansearch for prey.
In summary, even though studies on biodiver-sity in quinoa crops in the Neotropical regionshave been oriented toward identifying insect pestspecies, the presence of natural enemies have
also been recorded. Groups belonging to 5 insectorders, 11 families, and 19 genera with 24 specieshave been reported in various studies and presenta promising prospect for biocontrol of insect pestsin quinoa.
Chemical responses of quinoa to insectherbivory
In this section, we introduce the concept ofchemical interactions between plants and insectsand discuss the chemical potential of quinoa torepel the attack of herbivorous insects. Manyspecies of the Chenopodium genus possess sec-ondary metabolites (SMs) with potential effectson herbivorous insects, such as flavonoids, gly-cosides, flavonols, phenolic amides, coumarins,alkaloids, lignin, phytosteroids (ecdysteroids),phenolics, and saponins (Verma and Agarwal1985; Jam et al. 1990; Dinan 1992; Gee et al.1993; Horio et al. 1993; Cuadrado et al. 1995;Berdegue and Trumble 1996; Gallardo et al. 2000;Hernández et al. 2000; Woldemichael and Wink2001; Zhu et al. 2001a, 2001b; Hilal et al. 2004;DellaGreca et al. 2005; Cutillo et al. 2006; Paskoet al. 2008; Kokanova-Nedialkova et al. 2009;Kumpun et al. 2011).
Studies have been conducted to characterizethe primary and SMs of quinoa, in order to explaintheir nutritional and medical properties includingthe chemical response of quinoa to unfavorableconditions during cultivation (González et al.1989; Ruales and Nair 1993; Cuadrado et al. 1995;Dinan et al. 1998; Woldemichael and Wink 2001;Hilal et al. 2004; Costa et al. 2007; Pasko et al.2008; Kokanova-Nedialkova et al. 2009; Jancurováet al. 2009; Kuljanabhagavad and Wink 2009;Rosa et al. 2009; Dowd et al. 2011; Kumpun et al.2011; Campos et al. 2012). Information aboutentomofauna associated with quinoa cultivation isalso available, especially concerning plant–insectinteractions (Yábar et al. 2002; Rasmussen et al.2003; Valoy et al. 2011; Campos et al. 2012) andchemical interactions (Costa et al. 2009a).
SMs present in quinoa cultivars have thepotential to counteract damage caused by her-bivores, such as phenolic acids (gallic acid,hydroxybenzoic acid, vanillic ester glucosidic
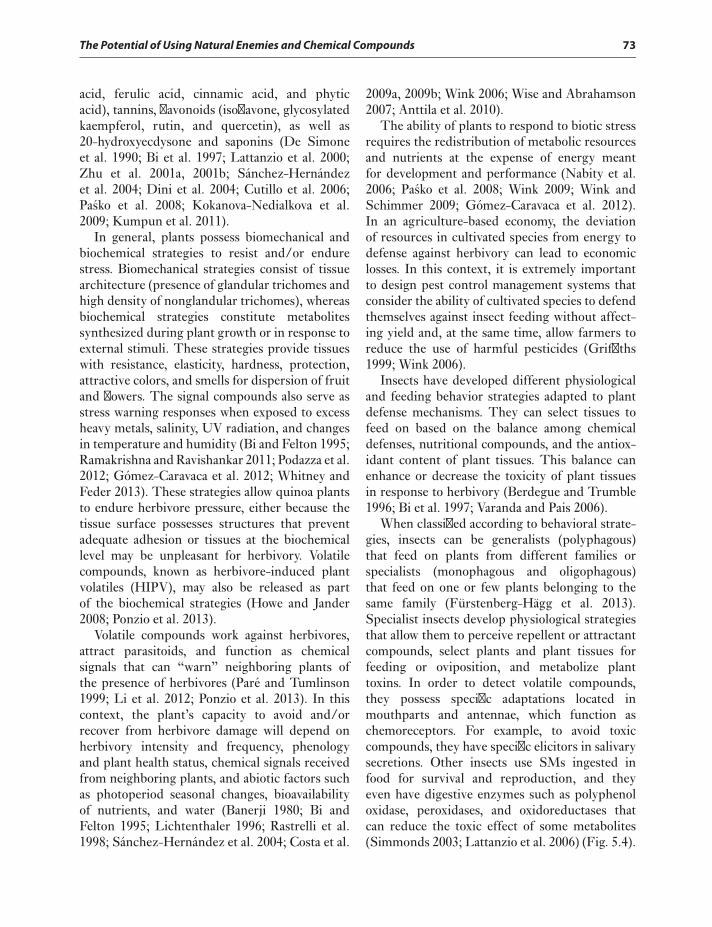
The Potential of Using Natural Enemies and Chemical Compounds 73
acid, ferulic acid, cinnamic acid, and phyticacid), tannins, flavonoids (isoflavone, glycosylatedkaempferol, rutin, and quercetin), as well as20-hydroxyecdysone and saponins (De Simoneet al. 1990; Bi et al. 1997; Lattanzio et al. 2000;Zhu et al. 2001a, 2001b; Sánchez-Hernándezet al. 2004; Dini et al. 2004; Cutillo et al. 2006;Pasko et al. 2008; Kokanova-Nedialkova et al.2009; Kumpun et al. 2011).
In general, plants possess biomechanical andbiochemical strategies to resist and/or endurestress. Biomechanical strategies consist of tissuearchitecture (presence of glandular trichomes andhigh density of nonglandular trichomes), whereasbiochemical strategies constitute metabolitessynthesized during plant growth or in response toexternal stimuli. These strategies provide tissueswith resistance, elasticity, hardness, protection,attractive colors, and smells for dispersion of fruitand flowers. The signal compounds also serve asstress warning responses when exposed to excessheavy metals, salinity, UV radiation, and changesin temperature and humidity (Bi and Felton 1995;Ramakrishna and Ravishankar 2011; Podazza et al.2012; Gómez-Caravaca et al. 2012; Whitney andFeder 2013). These strategies allow quinoa plantsto endure herbivore pressure, either because thetissue surface possesses structures that preventadequate adhesion or tissues at the biochemicallevel may be unpleasant for herbivory. Volatilecompounds, known as herbivore-induced plantvolatiles (HIPV), may also be released as partof the biochemical strategies (Howe and Jander2008; Ponzio et al. 2013).
Volatile compounds work against herbivores,attract parasitoids, and function as chemicalsignals that can “warn” neighboring plants ofthe presence of herbivores (Paré and Tumlinson1999; Li et al. 2012; Ponzio et al. 2013). In thiscontext, the plant’s capacity to avoid and/orrecover from herbivore damage will depend onherbivory intensity and frequency, phenologyand plant health status, chemical signals receivedfrom neighboring plants, and abiotic factors suchas photoperiod seasonal changes, bioavailabilityof nutrients, and water (Banerji 1980; Bi andFelton 1995; Lichtenthaler 1996; Rastrelli et al.1998; Sánchez-Hernández et al. 2004; Costa et al.
2009a, 2009b; Wink 2006; Wise and Abrahamson2007; Anttila et al. 2010).
The ability of plants to respond to biotic stressrequires the redistribution of metabolic resourcesand nutrients at the expense of energy meantfor development and performance (Nabity et al.2006; Pasko et al. 2008; Wink 2009; Wink andSchimmer 2009; Gómez-Caravaca et al. 2012).In an agriculture-based economy, the deviationof resources in cultivated species from energy todefense against herbivory can lead to economiclosses. In this context, it is extremely importantto design pest control management systems thatconsider the ability of cultivated species to defendthemselves against insect feeding without affect-ing yield and, at the same time, allow farmers toreduce the use of harmful pesticides (Griffiths1999; Wink 2006).
Insects have developed different physiologicaland feeding behavior strategies adapted to plantdefense mechanisms. They can select tissues tofeed on based on the balance among chemicaldefenses, nutritional compounds, and the antiox-idant content of plant tissues. This balance canenhance or decrease the toxicity of plant tissuesin response to herbivory (Berdegue and Trumble1996; Bi et al. 1997; Varanda and Pais 2006).
When classified according to behavioral strate-gies, insects can be generalists (polyphagous)that feed on plants from different families orspecialists (monophagous and oligophagous)that feed on one or few plants belonging to thesame family (Fürstenberg-Hägg et al. 2013).Specialist insects develop physiological strategiesthat allow them to perceive repellent or attractantcompounds, select plants and plant tissues forfeeding or oviposition, and metabolize planttoxins. In order to detect volatile compounds,they possess specific adaptations located inmouthparts and antennae, which function aschemoreceptors. For example, to avoid toxiccompounds, they have specific elicitors in salivarysecretions. Other insects use SMs ingested infood for survival and reproduction, and theyeven have digestive enzymes such as polyphenoloxidase, peroxidases, and oxidoreductases thatcan reduce the toxic effect of some metabolites(Simmonds 2003; Lattanzio et al. 2006) (Fig. 5.4).
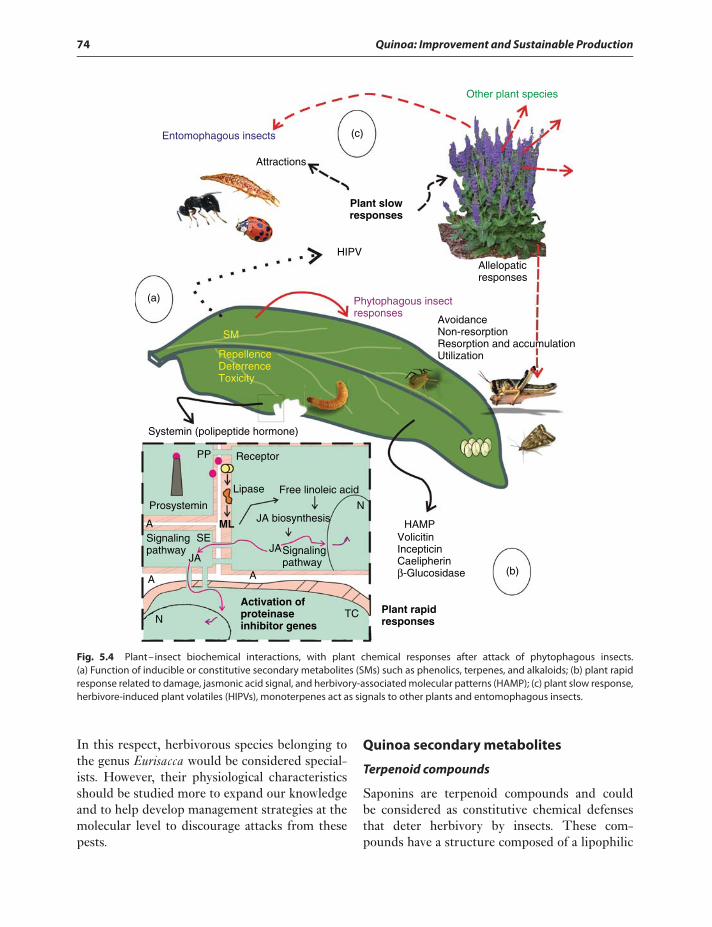
74 Quinoa: Improvement and Sustainable Production
Entomophagous insects
Attractions
Plant slowresponses
HIPV
Phytophagous insectresponses
(c)
Other plant species
Allelopaticresponses
SM
RepellenceDeterrenceToxicity
(a)
Systemin (polipeptide hormone)
PP Receptor
Lipase Free linoleic acid
JA biosynthesisN
N
JAJA
Signalingpathway
Signalingpathway
A
AA
SEML
Activation ofproteinaseinhibitor genes
TC
HAMPVolicitinIncepticinCaelipherinβ-Glucosidase (b)
Plant rapidresponses
Prosystemin
AvoidanceNon-resorptionResorption and accumulationUtilization
Fig. 5.4 Plant–insect biochemical interactions, with plant chemical responses after attack of phytophagous insects.(a) Function of inducible or constitutive secondary metabolites (SMs) such as phenolics, terpenes, and alkaloids; (b) plant rapidresponse related to damage, jasmonic acid signal, and herbivory-associated molecular patterns (HAMP); (c) plant slow response,herbivore-induced plant volatiles (HIPVs), monoterpenes act as signals to other plants and entomophagous insects.
In this respect, herbivorous species belonging tothe genus Eurisacca would be considered special-ists. However, their physiological characteristicsshould be studied more to expand our knowledgeand to help develop management strategies at themolecular level to discourage attacks from thesepests.
Quinoa secondary metabolites
Terpenoid compounds
Saponins are terpenoid compounds and couldbe considered as constitutive chemical defensesthat deter herbivory by insects. These com-pounds have a structure composed of a lipophilic
The Potential of Using Natural Enemies and Chemical Compounds 75
nucleus (steroid or triterpene) and a hydrophilicmoiety (different glycosylation patterns), whichdefines their membranolytic properties affectinginsect intestinal mucus and damage membranefunctionality (Gee et al. 1993; Wink 2006;Kuljanabhagavad and Wink 2009; Dowd et al.2011). Saponins are found in branches, leaves,flowers, and fruits of different quinoa varieties.However, it has been observed that saponincontent fluctuates among varieties. For instance,varieties with yellow seeds such as “Marangani”have higher saponin content than those withwhite seeds, because of high hederagenin andoleanolic acid content. Differences in saponinconcentration due to phytolaccagenic, deoxyphy-tolaccagenic, and serjanic acid content might alsobe influenced by water availability (Cuadradoet al. 1995; Woldemichael and Wink 2001; Yábaret al. 2002; Kokanova-Nedialkova et al. 2009;Gómez-Caravaca et al. 2012). Nevertheless, inspite of varying saponin content in quinoa vari-eties, insect pests would most likely be controlledby their natural enemies than by the presence ofsaponin (Yábar et al. 2002).
Other metabolites of the steroid typefound in quinoa seeds are ecdysteroids, alsocalled phytoecdysteroids. They are known as20-hydroxyecdysone, makisterone, and kan-collosterone (Dinan 1992) and are particularlypredominant in quinoa, with amounts rangingbetween 450 and 1300 μg.g-1DW ecdysteroidequivalents reported (Dinan 1992; Dinan et al.1998). The importance of ecdysteroids lies intheir structural similarity to insect steroids,hormones that regulate biochemical and physi-ological processes associated with reproduction,embryo maturation, development, and metamor-phosis (Dinan 2001; Thummel and Chory 2002).Phytoecdysteroids are present in numerous fam-ilies of the plant kingdom and play a protectiverole against nonspecialist herbivores and alsoagainst soil nematodes. These compounds affectmolting of nematodes and can even be lethal.The presence of phytoecdysteroids in quinoa hasled to the development of breeding programswith the goal of increasing these compounds inquinoa lines and varieties. Aside from helpingcontrol pest outbreaks, these compounds also
have nutritional benefits to humans. They cansupplement the caloric intake of the human dietand have remarkable chemical stability duringby-products manufacturing (Kumpun et al.2011).
The terpenes found in quinoa are limonene,α-terpinolen, β-phellandrene, α-terpinene,aromatic monoterpenoids such as p-cymene,trans-carveol, carvone and pinocarvone, piperi-tone, and aromatic sesquiterpenes such asβ-elemene and β-caryophyllene. Limonene,α-terpinolen, and β-phellandrene are accumu-lated in plant tissues against herbivory damage(Lerdau et al. 1994; Loughrin et al. 1994). More-over, aromatic sesquiterpenes such as β-elemeneand β-caryophyllene might be associated withHIPV response, as it is known that many volatilecompounds can originate from membrane lipids(during the “quick response”) or they can beterpenoid-type (during the “slow response”).In the “quick response” situation, volatile com-pounds derived from cell membrane fatty acidsact as precursors of signals for the synthesis ofprotease inhibitors, which interfere with thedigestion of plant tissues. For example, responseto herbivory injury is triggered when tissuesrelease a polypeptide hormone called systemin,which is then coupled to a plasma membranereceptor. A lipase is then induced to releaselinoleic acid molecules inside the cell, which areprecursors of jasmonic acid synthesis. Jasmonicacid is a signal molecule that simultaneouslyactivates genes for protease inhibitors. Thus, thissuite of events makes the tissue unpalatable toinsects (Sánchez-Hernández et al. 2004; Fig. 5.4).In the “slow response,” volatile terpenes, usuallymonoterpenes, are released. The volatiles canattract predators and parasitoids or act as warningsignals to neighboring plants so that they activatetheir defenses (Paré and Tumlinson 1999; Howeand Jander 2008; Li et al. 2012).
On the other hand, the salivary secretions ofmany orders, including Lepidoptera, Diptera,and Orthoptera, have a mixture of compoundsrelated both to feeding and oviposition andalso function as elicitors or effectors of plantreactions. Some of these compounds havebeen identified as β-glucosidase, violicitin,
76 Quinoa: Improvement and Sustainable Production
incepticin, and caelipherin and are useful tocharacterize herbivory-associated molecularpatterns (HAMPs). Furthermore, it should benoted that microorganisms participate in thisinteraction, being present both in plant and insectsurfaces and in insect salivary secretions, and alsocause a signal sequence that is a component ofthe microorganism-associated molecular patterns(MAMPs). The joint action of compoundscoming from plants, insects, and microorganismscan suppress the toxic effects of some compoundssynthesized by plants and enable herbivory, aswell as induce the release of volatile compoundsthat can serve as attractants and ovipositionstimulants for parasitoids and as warning signalsto neighboring plants. These reactions would alsobe linked to P450s, a versatile enzyme systempresent in plants and specialist insects, involvedboth in plant SM biosynthesis and in insectdetoxification catabolic systems (Schuler 1996)(Fig. 5.4).
Phenolic compounds
Among the phenolic compounds in quinoa,some metabolites act as signaling molecules andare responsible for raising the alarm againststressors such as UV-B radiation, herbivores, andpathogens. Other phenolic compounds defendplant tissues against resulting oxidative stress.Within this group, there are some pigments, suchas flavonoids and anthocyanins, that not onlyprevent UV-B damage but also act as opticalsignals to attract pollinators and dispersal vectorsbecause of their bright colors (Bi and Felton 1995;Simmonds 2003; Lattanzio et al. 2006; Wink andSchimmer 2009; Prado et al. 2012).
Phenolic compounds accumulate in vacuolesand are linked to epidermal and sub-epidermalcell walls of leaves, stems, cutin, and wax depositsfrom outer surfaces of plant organs. Phenoliccompounds can even form complexes with DNAmolecules in order to provide oxidative protection(Simmonds 2003; Lattanzio et al. 2006). The roleof phenolic content in plant–insect interactionsis directly related to PAL activity (phenylalanineammonia lyase), a key enzyme in the synthesisof phenolics. Therefore, analysis of PAL activity
may serve as a response indicator to herbivory.Moreover, the phenolic profile in tissues mayserve as an estimate of herbivory occurrence.
Although the anti-herbivory role of phenolsand polyphenols has not been studied in quinoa,it has been reported that these compoundshave anti-herbivory properties in Amaranthus,another genus belonging to the Chenopodiaceaefamily (Niveyro et al. 2013). On the other hand,quinoa seed has compounds with anti-herbivoryproperties, such as rutin, orientin, vitexin, morin,hesperidin, neohesperidin, cinamic acid, caffeicacid vanillic acid, and gallic acid (tannin synthesis)and kaempferol and quercetin glycosides (Diniet al. 2004; Pasko et al. 2008). For example, rutinacts as a phagostimulant, whereas kaempferol hasgenotoxic properties, acts as feeding deterrent,and can affect the emergence of aphids. Vanillicacid glucose ester acts with greater intensityon broods of aphids, whereas tannins decreasethe palatability of plant tissues because of theirastringent properties or hinder digestion byforming complexes with proteins and/or inacti-vate digestive enzymes (Bi et al. 1997; Lattanzioet al. 2000, 2006; Simmonds 2003; Pasko et al.2008; Wink and Schimmer 2009; Steffensen et al.2011). Phytic acid in quinoa chelates many ionsand interferes with their incorporation into theinsect diet (De Simone et al. 1990; Bi and Felton1995; Bi et al. 1997; Zhu et al. 2001b; Dini et al.2004; Pasko, et al. 2008; Wink and Schimmer,2009; Steffensen et al. 2011; Niveyro et al. 2013).
In summary, there are various chemical com-pounds produced in quinoa as a response toherbivory. These present an exciting new area forstudy, especially assessing their potential use forbiological control.
POTENTIAL OF BIOLOGICAL CONTROL INQUINOA
At present, most of the information on biologicalcontrol in the Andean quinoa crop comes fromstudies on entomophagous insects (parasitoidsand predators). Cultural practices and host plantresistance are also important factors to consider
The Potential of Using Natural Enemies and Chemical Compounds 77
in establishing a phytosanitary management pro-tocol for quinoa. It is encouraging to know thatin the field, up to 45% of parasitoid and predatorspecies exert natural biological control in keyquinoa pests such as the quinoa moth (Eurysaccasp.) and ticona complex (Heliothis, Copitarsia, andSpodoptera sp.) (Rasmussen et al. 2003). Fluctu-ations in key and potential pest populations inAndean crops follow a similar temporal patternin different regions and are associated with cropphenology. However, relative densities of keypests, such as quinoa moths and ticona complex,exhibit variations between different Andeanzones. In the Northern Altiplano, pest densitiesare low, with 1–6 larvae/plant; in the CentralAltiplano, 7–15 larvae/plant have been recorded;and in the Southern Altiplano, pest densities havebeen recorded from 9 to over 45 larvae/plant(Saravia and Quispe 2005), indicating that thesepests could be a limiting factor in the southernareas for quinoa production.
The percentage of parasitism on E.melanocampta in the field during a completecycle of quinoa cultivation has been measuredby Mamani (1998). The percentage of parasitismranged from about 25% during the soft doughstage to 45% during the milk grain phenolog-ical phase, reaching 80% during physiologicalmaturity (Mamani 1998). The main parasitoidsof this Lepidopteran pest are Copidosomagelechiae Howard (Encyrtidae) and Diadegma sp.(Ichneumonidae) (Rasmussen et al 2003).
In addition to parasitoids, natural biologicalcontrol relies on a complex of insect predatorsthat regulate the populations of phytophagouspests of quinoa. Among the predator insectgroups, the Coccinellidae (Coleoptera) andChrysopidae (Neuroptera) species have a moresignificant role in pest control in agroecosystems.The Chrysopidae is the most important predatorgenus used in biological control and can be bredon a large scale and commercialized for releasein the field (Tauber et al. 2000). The larvae ofthese predator families are extremely active, fastmoving, and have considerable ability to searchfor prey. They are polyphagous predator speciesand feed on a large number of economicallyimportant insect pests. They can also feed during
different life stages of the insect prey, such as theegg, larvae (nymphs), and adult stages.
It is important to have the correct taxonomicidentification of predator species in quinoa,particularly of Chrysopidae (Reguilón et al. 2006,2009), as they are only mentioned at the genuslevel in studies conducted in the Neotropicalregion. Correct species identification is the firststep to study the biology of natural enemiesand their predation capacity to develop methodsfor mass rearing and design biological controlsystems to be applied in quinoa.
We followed the course of a quinoa crop inTucuman, Argentina for two periods (fromNovember 2008 to March 2010), which allowedus to establish the dynamics of two Chrysop-erla species associated with quinoa (Reguilón,personal communication). Chrysoperla externaHagen and Chrysoperla argentina GonzálezOlazo-Reguilón (González Olazo and Reguilón2002) were collected throughout the crop phe-nology (Fig. 5.5). This is the first report of C.argentina in quinoa. As shown in Figure 5.5, thepresence of C. argentina was evident on all cropsurvey dates. The highest predator populationdensities occurred in the months of Novemberand March and coincided with the presenceof herbivorous lepidopteran genus Eurysaccaand Pyralidae family. Lacewings such as Eriopissp. and E. connexa (Coleoptera: Coccinellidae)were also observed at the beginning of floweringand during the flowering stage, though in lowerdensities (Valoy et al. 2011). These data sug-gest that predators in these phenological stageswere actively preying on eggs and larvae of theLepidoptera species mentioned. Aphids wererecorded in milky and dough stage, coincidingwith the presence of the predator H. convergens(Valoy et al. 2011).
POTENTIAL FOR ECOLOGICALMANAGEMENT OF QUINOA
The use of biological control agents (parasitoids,predators, or pathogens) is a necessary componentof integrated pest management to regulate pop-ulations of insects that cause economic damage
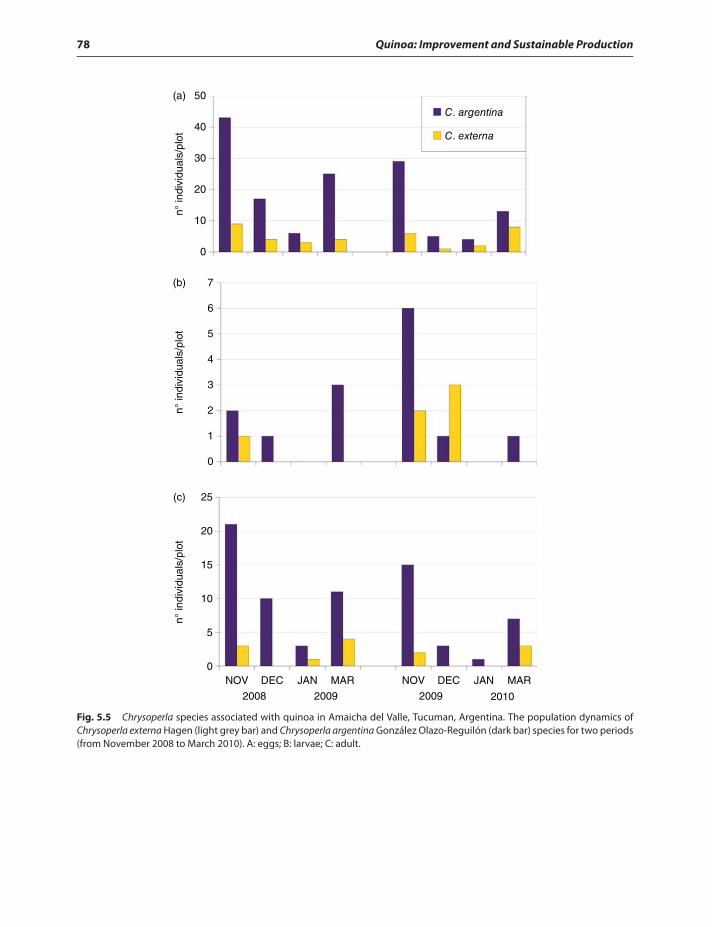
78 Quinoa: Improvement and Sustainable Production
C. argentina
C. externa
NOV DEC
2008 2009 2009 2010
JAN MAR NOV DEC JAN MAR
50
40
30
20
10
0
n° in
divi
dual
s/pl
otn°
indi
vidu
als/
plot
n° in
divi
dual
s/pl
ot
7
6
5
4
3
2
1
0
(a)
(b)
(c) 25
20
15
10
5
0
Fig. 5.5 Chrysoperla species associated with quinoa in Amaicha del Valle, Tucuman, Argentina. The population dynamics ofChrysoperla externa Hagen (light grey bar) and Chrysoperla argentina González Olazo-Reguilón (dark bar) species for two periods(from November 2008 to March 2010). A: eggs; B: larvae; C: adult.
The Potential of Using Natural Enemies and Chemical Compounds 79
to crops (Kogan and Shenk 2002; Romero 2004;Hruska 2008) and to reduce the use of agro-chemicals. However, this practice frequently doesnot consist of a comprehensive agroecosystemmanagement, which should, in all cases, includethe application of ecological principles takinginto account all key aspects of insect–plantinteractions, besides the use of biocontrol agents.It is especially important to understand howthe dynamics of species interactions may affectherbivore outbreaks and the expression of pestresistance within an agricultural system. Inthis context, one of the advantages of plants innatural populations is phenotypic and geneticheterogeneity, which translates into variability inexpression of individual plant defenses (Whithamet al. 1984; Nyman 2010). Such heterogeneity canreduce the likelihood of herbivores developingcounterdefenses, thus allowing plants to preservetheir defense mechanisms over time (Letourneau1997).
Ecological principles, from their origin in natu-ral systems to their application in agroecosystems,take into consideration several concepts. One ofthese concepts, and perhaps the most comprehen-sive one, postulates preservation of biodiversity asthe cornerstone for operation and sustainable useof agricultural systems (Altieri et al. 1983; Altieri2009; Butler et al. 2007; Attwood et al. 2008) asit considers the preservation of beneficial bioticinteractions and ecosystem services (Shennan2008; Letourneau et al. 2009; Kremen and Miles2012). In addition, agroecosystem management iscompatible with the system community approach,which decentralizes attention focused solely onpests while understanding the temporal dynamicsof nonpest species (Ordano et al. 2013) that arealso part of the agroecosystem (Griffiths 1999;Wink 2006).
The use of intercropping or mixed croppingsystems is one of the practices that has beenproposed as a means of preserving biodiversity(Vandermeer 1989; Altieri and Nicholls 2004;Perfecto et al. 2009; Lithourgidis et al. 2011).Different cultivars or types of crops could beintercropped. The companion plants may or maynot have commercial value (Parker et al. 2013) butact as repellents or as shelter for beneficial insects.
This has been tested on numerous occasionsand types of crops but with different results.In a review, Poveda et al. (2008) found thatdiversification of vegetation schemes tested inagriculture in the past decade served to reduceherbivore densities in approximately half of thecases included in the review.
In Latin America, a significant portion of thetropical crops are produced in intercropping ormixed cropping systems. However, this type ofmanagement is uncommon in the Andean crop-ping systems (Altieri 1999; Altieri and Toledo2001). There are only a few cases where the effectof corn-and-potato mixed systems has been tested(Raymundo and Alcazar 1983; Thiery and Visser1986; Lal 1991; Rhoades and Bebbington 1990;Silwana and Lucas 2002; Gianoli et al. 2006;Seran and Brintha 2010) and where several typesof biological control have also been carried out(Weber 2012; Kroschel et al. 2012). The effectof agricultural intensification on changing thestatus of insect pests has also been explored inthese mixed systems (Risch 1980; Trenbath 1993;Smith and McSorley 2000; Mojena et al. 2012).
Traditionally, quinoa crops are grown inmonoculture or polyculture systems side by sidewith corn, bean, or potato crops that extendto areas where the vegetation is more diverse,consisting of eucalyptus, turnip, and Poaceae,Asteraceae, and Lamiaceae species. The place-ment of the quinoa crop in relation to othercrops is important as it has been shown that inCusco, Peru, the number of species of parasitoidsof quinoa moth (E. melanocampta) present inthe agroecosystem increased as the diversityof the surrounding crops also increased (Costaet al. 2009a, 2009b). The results of this studyshould spur further research on this topic sothat it can be incorporated in pest managementstrategies.
Currently, several quinoa-producing countriesare changing their crop management practices,gravitating toward monoculture, partially orcompletely replacing crop rotation and resting orfallow periods (Nieto-Cabrera et al. 1997; Fonteet al. 2012; Soto et al. 2012). The practice ofsowing different species that are annually rotatedin the same plot is also slowly being phased out
80 Quinoa: Improvement and Sustainable Production
(Clades 1992). Increasing crop intensificationof quinoa in Bolivia and Peru has replaced theexisting quinoa cultural management, leadingto problems of desertification, decline in soilfertility, and loss of natural vegetation. In Bolivia,the plowing of large tracts of land has led to lossof native vegetation such as “thola” (Pharastrepiasp.), which is used as feed for llamas. Tholamay also be a significant element of the agroe-cosystem as it is a shelter for beneficial species.Moreover, this species possesses anti-herbivoryproperties. Together with another native species(Minthostachys sp.), Pharastrepia sp. is used tomanufacture natural insecticides for applicationin organic quinoa production (Gallegos et al.1982; Jaldin 2010).
Complementary to these management strate-gies, the intrinsic characteristics of quinoa shouldbe known, such as its properties and mechanismsagainst insect pests and how these characteris-tics vary among selected cultivars. One of themechanisms acting on herbivore populations isthe emission of volatile compounds (terpenes andgreen leaf lipid-derived volatiles) that can repelherbivores, attract entomophagous insects (preda-tors and parasitoids), or act as warning signalsto neighboring plants. Quinoa has monoterpenesand sesquiterpenes (Whitman et al. 1990) thatcould be studied further to evaluate whetherthey participate in the exchange of chemicalsignals or as defense mechanism to avoid damageby herbivore feeding or oviposition. It has alsobeen reported that these chemicals decrease theability of the males and females of the quinoamoth to connect with each other (Costa et al.2009a, 2009b). In addition, the study of phenoliccomposition of different quinoa varieties wouldhelp determine which varieties have the potentialto be more repellent to insects and thus incur lessdamage.
Given the current demand for quinoaworldwide, it is particularly urgent to startimplementing ecological crop management, withbiological control as an integral component.Ecological management of the quinoa crop wouldalso consider restoring traditional agriculturalpractices, such as the use of organic fertilizers,to mitigate soil degradation while taking into
account that soil nutritional quality influences theability of plants to withstand herbivore attacks(Altieri et al. 2012; Ghorbani et al. 2008).
In conclusion, it is vital to conduct researchand promote the sustainable management ofquinoa to preserve plant and animal biodiversitywhere quinoa is grown and to protect the bioticinteractions between quinoa and other Andeancrops. We are convinced that conscious efforts tomanage the quinoa crop in an ecologically sus-tainable framework would preserve this Andeanlegacy for generations to come.
REFERENCES
Alata J. Lista de insectos y otros animales dañinos a la agricul-tura en Perú. Lima, Perú: Ministerio De Agricultura; 1973.p 177.
Altieri MA. Agroecology, small farms, and food sovereignty. MonWeather Rev 2009;61(3):102–113.
Altieri M, Ponti L, Nicholls CI. Soil fertility, biodiversity and pestmanagement. In: Gur GM, Wratten SD, Snyder WE, editors.Biodiversity and insect pests: key issues for sustainable man-agement. Willey-Blackwell: West Sussex, UK; 2012. p 72–84.
Altieri MA, Nicholls CI. Biodiversity and pest managementin agroecosystems. 2nd ed. Boca Raton: CRC Press; 2004.p 236.
Altieri MA, Letourneau DK. Vegetation management and biolog-ical control in agroecosystems. Crop Prot 1982;1:405–430.
Altieri MA, Toledo VM. The agroecological revolution in LatinAmerica: rescuing nature, ensuring food sovereignty andempowering peasants. J Peasant Stud 2001;38(3):587–612.
Altieri MA. Applying agroecology to enhance the productivity ofpeasant farming systems in Latin America. Environ Dev Sus-tain 1999;1(3–4):197–217.
Altieri MA, Letourneau DK, Davis JR. Developing sustainableagroecosystems. Bioscience 1983;33:45–49.
Andow DA. Vegetational diversity and arthropod populationresponse. Ann Rev Entom 1991;36:561–586.
Anttila U, Julkunen-Tiitto R, Rousi M, Yang S, Rantala MJ,Ruuhola T. Effects of elevated ultraviolet-B radiation on aplant–herbivore interaction. Oecologia 2010;164:163–175.
Aroni G. Manejo y producción actual de quinua en Bolivia. In:Jacobsen SE, Portillo Z, editors. Primer taller internacionalsobre quinua - recursos genéticos y sistemas de producción.UNALM: Perú; 2000. p 10–14.
Attwood SJ, Maron M, House AP, Zammit C. Do arthropodassemblages display globally consistent responses to inten-sified agricultural land use and management? Global EcolBiogeo 2008;17:585–599.
Banerji N. Two new saponins from the root of Amaranthusspinosus. J Indian Chem Soc 1980;57(4):417–419.
The Potential of Using Natural Enemies and Chemical Compounds 81
Barrientos Zamora R. 1985. Dinámica poblacional y ciclosbiológicos de insectos en quinua (Chenopodium quinoa).Cochabamba (Bolivia): Universidad Mayor de San Simón,Cochabamba (Bolivia), Facultad de Ciencias Agrícolas yPecuarias Martín Cárdenas. 113p.
Benton TG, Vickery JA, Wilson JD. Farmland biodiver-sity: is habitat heterogeneity the key? Trend Ecol Evol2003;18:182–188.
Berdegue M, Trumble JT. Effects of plant chemical extracts andphysical characteristics of Apium graveolens and Chenopodiummurale on host choice by Spodoptera exigua larvae. Entom ExpAppl 1996;78:253–262.
Bi JL, Felton GW. Foliar oxidative stress and insect herbivory:primary compounds, secondary metabolites, and reactive oxy-gen species as components of induced resistance. J Chem Ecol1995;21:1511–1530.
Bi JL, Felton GW, Murphy JB, Howles PA, Dixon RA, Lamb CJ.Do plant phenolics confer resistance to specialist and general-ist insect herbivores? J Agric Food Chem 1997;45:4500–4504.
Bianchi F, Booij C, Tscharntke T. Sustainable pest regulation inagricultural landscapes: a review on landscape composition,biodiversity and natural pest control. Proc Royal Soc B2006;273:1715–1727.
Blanco MC. Evaluación de daños de Scrobipalpula sp. y Perisomasp. en el cultivo de quinua en la zona del Cusco. In: Resumendel III Congreso Internacional de Cultivos Andinos. Bolivia:La Paz; 1982. p 133–135.
Bravo R, Delgado P. Colección de insectos en papa, quinoay pastos cultivados. Puno, Perú: PIWA: ConvenioPELT/NADEIC/COTESU; 1992. p 44.
Butler SJ, Vickery JA, Norris K. Farmland biodiversity and thefootprint of agriculture. Science 2007;315:381–384.
Cabrera Almendros A, Oliveira NC. 2011. Consumo foliar esobrevivência de Diabrotica speciosa em diferentes linhagensde quinoa. Campo Digital. 6(1):1–6. Available from:http://www.revista.grupointegrado.br/revista/index.php/campodigital/article/view/795/368.
Calderón R, Becerra A, Marquez A. 1996. Expectativas del virusgranulosis Phthorimaea operculella para el control de otroslepidopteros. IV Reunión Nacional de la Papa: Compendio deExposiciones, 8–11 Oct. Cochabamba, Bolivia. pp. 107–108.
Campos E, Bravo R, Valdivia R, Soto J. Plagas insectiles enáreas de intensificación de quinua en Puno. CienciAgro2012;2(3):379–390.
Chambilla C, Gonzales MA, Jarandilla C, Baltazar B. Estudio dela fluctuación poblacional del complejo ticonas de la quinua(Chenopodium quinoa Willd.) bajo condiciones actuales decambio climático. In: Prácticas y estrategias en respuesta ariesgos climáticos y de mercado en agroecosistemas vulner-ables de la Región Andina. La Paz, Bolivia: PROYECTOSANREM′-CRSP; 2009. p 14.
CIRNMA (Centro De Investigación De Recursos NaturalesY Medio Ambiente). 2009. Informe Anual ProyectoALTAGRO: Programa Orgánico De Quinua. Puno, Perú.
[CLADES]. The Latin American Consortium on Agroecologyand Development. Revista Agroecológica y Desarrollo N∘ 4.Sistemas Agrícolas alternativos. 1992. In Manejo Ecológicodel suelo. 1997. CLADES-CIED. Lima-Perú.
Costa F, Cardenas Molina M, Yábar E. 2007. Insectos plaga y ene-migos naturales asociados al cultivo de la quinoa (Chenopodiumquinoa Willd.) en Cusco, Perú. Resumen II, Resumen del Con-greso Internacional De La Quinoa, 23–26 oct. Iquique, Chile.
Costa JF, Cosio W, Cardenas Molina M, Yábar E, Gianoli E.Preference of quinoa moth Eurysacca melanocampta Meryck(Lepidoptera: Gelechiidae) for two varieties of quinoa(Chenopodium quinoa Willd) in olfactometry assays. Chilean JAgr Res 2009a;69:71–78.
Costa JF, Yábar E, Gianoli E. Parasitism on Eurysaccamelanocampta Meyrick (Lepidoptera: Gelechiidae) in twolocalities at Cusco, Peru. Revista Facultad Nacional De Agron2009b;62(1):4807–4813.
Cuadrado C, Ayet G, Burbano C, Muzquiz M. Occurrence ofsaponins and sapogenols in Andean crops. J Sci Food Agr1995;67:169–172.
Cutillo F, DellaGreca1 M, Gionti M, Previtera L, Zarrelli A.Phenols and lignans from Chenopodium album. PhytochemAnalysis 2006;17(5):344–349.
Dangles O, Carpio FC, Villares M, Yumisaca F, Liger B, RebaudoF, Silvain JF. Community-based participatory research helpsfarmers and scientists to manage invasive pests in the Ecuado-rian Andes. Ambiom 2010;39:325–335.
Dangles O, Mesias V, Crespo-Perez V, Silvain JF. Cropdamage increases with pest species diversity: evidence frompotato tuber moths in the tropical Andes. J Appl Ecol2009;46:1115–1121.
Debach P, Rosen D. Biological control by natural enemies. 2nded. New York: Cambridge University Press; 1991. p 386p.
De Simone F, Dim A, Pizza C, Satuminos P, Schettino O. Twoflavonol glycosides from Chenopodium quinoa. Phytochem1990;29:3690–3692.
DellaGreca M, D’Abrosca B, Fiorentino A, Previtera L,Zarrelli A. Structure elucidation and phytotoxicity ofecdysteroids from Chenopodium album. Chem Biodivers2005;2(4):457–462.
Dinan L, Whiting P, Scott AJ. Taxonomic distribution of phy-toecdysteroids in seeds of members of the Chenopodiaceae.Biochem Syst Ecol 1998;26:553–576.
Dinan L. The association of phytoecdysteroids with floweringin fat hen, Chenopodium album, and other members of theChenopodiaceae. Experientia 1992;48:305–308.
Dinan L. Phytoecdysteroids: biological aspects. Phytochemistry2001;57:325–339.
Dini I, Tenore GC, Dini A. Phenolic constituents of Kancollaseeds. Food Chem 2004;84:163–168.
Dowd PF, Berhow MA, Johnson ET. Differential activity of mul-tiple saponins against omnivorous insects with varying feedingpreferences. J Chem Ecol 2011;37:443–449.
82 Quinoa: Improvement and Sustainable Production
FAO Food And Agricultural Organization. 1993. http://www.Rlc.Fao.Org/Es/Agricultura/Produ/Cdrom/Contenido/Libro14/Cap2.3.Htm.
Farwig N, Bailey D, Bochud E, Herrmann JD, Kindler E, ReusserN, Schüepp C, Schmidt-Entling MH. Isolation from forestreduces pollination, seed predation and insect scavenging inSwiss farmland. Landscape Ecol 2009;24:919–927.
Fonte SJ, Vanek SJ, Oyarzun P, Parsa S, Carolina Quintero D,Rao IM, Lavelle P. Four pathways to agroecological intensi-fication of soil fertility management by smallholder farmersin the Andean highlands. In: Sparks DL, editor. Advances inagronomy. New York: ; 2012. p 116–125.
Fürstenberg-Hägg J, Zagrobelny M, Bak S. Plant defense againstinsect herbivores. Int J Mol Sci 2013;14:10242–10297.
Gallardo M, González JA, Prado FE. Presence of beta-lains in Chenopodium quinoa Willd. seedlings. Lilloa2000;40(1):109–113.
Gallegos J, Díaz J, Jayo E. 1982. Evaluación de la planta repe-lente “Muña” (Minthostachys sp.) en el control de Scrobip-ulpa sp. (Lepidoptera: Gelechiidae) en quinoa. In: Resumende la XXV Convención Nacional De Entomología, 3–7 deOct, Huaraz, Perú. pp. 35–36.
Gee JM, Price KR, Ridout CL, Wortley GM, Hurrel RF, John-son IT. Saponins of quinoa (Chenopodium quinoa): effects ofprocessing on their abundance in quinoa products and theirbiological effects on intestinal mucosal tissue. Sci Food Agr1993;63:201–209.
Ghorbani R, Wilcockson S, Koocheki A, Leifert C. Soil manage-ment for sustainable crop disease control: a review. EnvironChem Lett 2008;6(3):149–162.
Gianoli E, Ramos I, Alfaro-Tapia A, Valdéz Y, Echegaray ER,Yábar E. Benefits of a maize–bean–weeds mixed croppingsystem in Urubamba Valley, Peruvian Andes. Int J Pest Man-age 2006;52(4):283–289.
Gómez-Caravaca AM, Ianfelice G, Lavini A, Pulvento C,Fiorenza Carboni M, Marconi E. Phenolic compounds andsaponins in quinoa samples (Chenopodium quinoa Willd.)grown under different saline and nonsaline irrigationregimens. J Agr Food Chem 2012;60:4620–4627.
Gonzalez JA, Roldan A, Gallardo M, Escudero T, Prado FE.Quantitative determinations of chemical compounds withnutritional value from Inca crops: Chenopodium quinoa(‘quinoa’). Plant Food Hum Nutr 1989;39(4):3.
González Olazo EV, Reguilón C. Una nueva especie de Chrysop-erla (Neuroptera: Chrysopidae) para la Argentina, Revista dela Sociedad Entomológica Argentina ISSN 0373–5680. Volu-men 2002;61(1–2):47–50.
Griffiths JT. 1999. Predispersal seed predation of Ama-ranthus spp. and Chenopodium album (L). Thesis offaculty of graduate studies of the University of Guelph[Internet]. [cited 2013 mar 10] pp 93. Available from:http://www.collectionscanada.gc.ca/obj/s4/f2/dsk1/tape2/PQDD_0017/MQ47328.pdf.
Harris MK. Arthropod-plant interactions related to agriculture,emphasizing host plant resistance. In: Harris MK, editor.
Biology and breeding for resistance to arthropods andpathogens in agricultural plants. Texas: Texas AgriculturalExperiment Station, A&M University, College Station; 1980.p 23–51.
Hernández NE, Tereschuk MLK, Abdala LR. Antimicrobialactivity of flavonoids in medicinal plants from Tafí del Valle(Tucumán, Argentina). J Ethnopharmacol 2000;73:317–322.
Hidalgo W, Jacobsen SE. 2000. Principales plagas del cultivo dela quinua en la sierra central del Perú y las perspectivas decontrol integrado. In: Resumen del primer taller internacionalsobre quinua-recursos genéticos y sistemas de producción,10–14 May. Lima, Perú. pp. 49–50.
Hilal M, Parrado MF, Rosa M, Gallardo M, Orce L, MassaEM, Gonzalez JA, Prado FE. Epidermal lignin deposition inquinoa cotyledons in response to UV-B radiation. PhotochemPhotobiol 2004;79(2):205–210.
Horio T, Yoshida K, Kikuchi H, Kawabata J, Mizutani J. Aphenolic amide from roots of Chenopodium album. Phytochem1993;33:807–808.
Howe GA, Jander G. Plant immunity to insect herbivores. AnnRev Plant Biol 2008;59:41–66.
Hruska AJ. Nuevos temas en la transferencia de tecnologíasde manejo integrado de plagas para productores de bajosrecursos. Manejo Integrado de Plagas en Mesoamerica:Aportes Conceptuales 2008;32:265.
Jacobsen SE. The situation for quinoa and its production inSouthern Bolivia: from economic success to environmentaldisaster. J Agron Crop Sci 2011;197(5):390–399.
Jaldin R. 2010. Producción de quinua en Oruro y Potosí. LaPaz, Bolivia. Programa de investigación estratégica en Bolivia(PIEB).100 p. Available from: http://www.pieb.com.bo/UserFiles/File/enlinea/pd_quinua_jaldin.pdf.
Jam N, Alam MS, Kamil M, Ilyas M, Niwa M, Sakae A.Two flavonol glycosides from Chenopodium ambrosioides.Phytochemistry 1990;29:3988–3991.
Jancurová M, Minarovicová L, Dandár A. Quinoa – a review.Czech J Food Sci 2009;27(2):71–79.
Kogan M, Shenk M. Conceptualización del manejo integradode plagas en escalas espaciales y niveles de integración másamplios. Manejo Integrado de Plagas y Agroecología CostaRica 2002;65:34–42.
Kokanova-Nedialkova Z, Nedialkov PT, Nikolov SD. The genusChenopodium: phytochemistry, ethnopharmacology andpharmacology. Pharmacognosy Rev 2009;3(6):280–306.
Kuljanabhagavad T, Wink M. Biological activities and chemistryof saponins from Chenopodium quinoa Willd. Phytochem Rev2009;8:473–490.
Kumpun S, Annick M, Crouzet S, Evrard-Todeschi N, GiraultJP, Lafont R. Ecdysteroids from Chenopodium quinoa Willd.,an ancient Andean crop of high nutritional value. Food Chem2011;125:1226–1234.
Kraljevic BGJ. Andean grains and tubers: ancient crops forbetter livelihoods today. In: Bala Ravi S, Hoeschle-Zeledon I,Swaminathan MS, Frison E, editors. Hunger and poverty: therole of biodiversity – report of an international consultation
The Potential of Using Natural Enemies and Chemical Compounds 83
on the role of biodiversity in achieving the UN MilleniumDevelopment goal of freedom from hunger and poverty.M.S. Swaminathan Research Foundation: Chennai, India;2006. p 113.
Kremen C, Miles A. Ecosystem services in biologically diversifiedversus conventional farming systems: benefits, externalities,and trade-Offs. Ecol Soc 2012;17(4):40.
Kroschel J, Mujica N, Alcazar J, Canedo V, Zegarra O. Develop-ing integrated pest management for potato: experiences andlessons from two distinct potato production systems of Peru.In: Sustainable potato production: global case studies. TheNetherlands: Springer; 2012. p 419–450.
Lal L. Effect of intercropping on the incidence of potato tubermoth, Phthorimaea operculella (Zeller). Agr Ecosyst Environ1991;36:185–190.
Lamborot L, Guerrero MA, Araya JE. Lepidópteros asociadosal cultivo de quinoa (Chenopodium quinoa Willd.) en lazona central de Chile. Boletín De Sanidad Vegetal: Plagas1999;25:203–207.
Larrain P. Biologia de Copitarsia turbata (Lepidoptera: Noc-tuidae) bajo ambiente controlado. Agricultura Tecnica1996;56:220–223.
Lattanzio V, Arpaia S, Cardinali A, Di Venere D, Linsalata V.Role of endogenous flavonoids in resistance mechanism ofvigna to aphids. J Agr Food Chem 2000;48:5316–5320.
Lattanzio V, Lattanzio VMT, Cardinali A. Role of phenolics inthe resistance mechanisms of plants against fungal pathogensand insects. In: Imperato F, editor. Phytochemistry: advancesin research. Research Signpost: Kerala; 2006. p 23–67.
Lerdau M, Litvak M, Monson R. Plant chemical defense:monoterpenes and the growth-differentiation balancehypothesis. Tree 1994;9(2):58–61.
Li T, Holopainen JK, Kokko H, Tervahauta AI, Blande JD.Herbivore-induced aspen volatiles temporally regulate twodifferent indirect defences in neighbouring plants. FunctEcol 2012;26:1176–1185.
Lichtenthaler HK. Vegetation stress: an introduction to the stressconcept in plants. J Plant Physiol 1996;148:4–14.
Loughrin JH, Manukian A, Heath RR, Turlings TCJ, TumlinsonJH. Diurnal cycle of emission of induced volatile terpenoidsby herbivore-injured cotton plants. Proc Natl Acad Sci U S A1994;91:11836–11840.
Letourneau DK, Jedlicka JA, Bothwell SG, Moreno CR. Effectsof natural enemy biodiversity on the suppression of arthropodherbivores in terrestrial ecosystems. Ann Rev Ecol Evol Syst2009;40:573–592.
Letourneau DK. Plant-arthropod interactions in agroecosystems.In: Jackson LE, editor. Ecology in agriculture. San Diego, CA:Academic Press; 1997. p 239–290.
Lithourgidis AS, Dordas CA, Damalas CA, Vlachostergios DN.Annual intercrops: an alternative pathway for sustainable agri-culture. Aust J Crop Sci 2011;5:396–410.
Loza LA, Bravo R. Poblaciones de carábidos (Coleoptera) enagroecosistemas del Altiplano Peruano. Revista Peruana DeEntomología 2001;42:79–87.
Mamani D. Control Biológico en forma natural de la Polilla de laQuinoa (Eurysacca melanocampta Meyrick) por Parasitoidesy Perspectivas de Cría para su manipulación en el AltiplanoCentral. Tesis Ing. Agr. Facultad de Agronomía, UMSA.1998. La Paz. Bolivia. 91 pp.
Mamani Quispe JR. 2009. Evaluar la dinámica poblacional de lapolilla de la quinua (Eurysacca melanocampta Meyrick) y com-plejo ticona en cuatro variedades de quinua en la comunidadChinchaya del Departamento de La Paz, Bolivia. 84 p. Tesisn∘ 22. UMSA, Facultad de Agronomía.
Matson PA, Parton WJ, Power A, Swift MJ. Agricultural intensi-fication and ecosystem properties. Science 1997;277:504.
Médiène S, Valantin-Morison M, Sarthou JP, De TourdonnetS, Gosme M, Bertrand M, Estarde J, Aubertot A, RuschN, Motisi C, et al. Agroecosystem management and bioticinteractions: a review. Agron Sustain Dev 2011;31(3):491–514.
Mojena M, Bertolí M, Zaffaroni E. Evaluaciones de plagas insec-tiles en agroecosistemas de intercalamiento de maiz (Zea mays,L) y frijol (Phaseolus vulgaris, L) con yuca (Manihot esculenta,Crantz). Curr Agr Sci Tech 2012;6(1).
Mujica A. Manual del cultivo de quinua. ProyectoTTA-AID-INIA, PIWA. 1993. 32–46 pp. Lima, Peru.
Nabity PD, Heng-Moss TM, Higley LG. Effects of insectherbivory on physiological and biochemical (oxidativeenzyme) responses of the halophyte Atriplex subspicata(Chenopodiaceae). Environ Entom 2006;35:1677–1689.
Nieto-Cabrera C, Francis C, Caicedo C, Gutiérrez PF, Rivera M.Response of four Andean crops to rotation and fertilization.Mt Res Dev 1997;17:273–282.
Niveyro SL, Mortensen AG, Fomsgaard IS, Salvo A. Differencesamong five amaranth varieties (Amaranthus spp.) regardingsecondary metabolites and foliar herbivory by chewing insectsin the field. Arth-Plant Int 2013;7:235–245.
Nyman T. To speciate, or not to speciate? Resource heterogeneity,the subjectivity of similarity, and the macroevolutionary con-sequences of niche width shifts in plant feeding insects. BiolRev 2010;85(2):393–411.
Ochoa Vizarreta R, Franco JF. Morfología y biología de lapolilla de la quinua Eurysacca melanocampta Meyrick1917 (Lepidoptera: Gelechiidae), De Cusco (Perú). Bioma2013;1(4):35–38.
Ochoa R. 1990. Ciclo biológico de la polilla de la quinoa(Eurysacca melanocampta Meyrick). Thesis, Cusco (Perú)UNSAAC, Thesis For Biologie, UNSAAC, Cusco, Perú.
Oerke EC, Dehne HW, Schonbeck F, Weber A. Crop productionand crop protection: estimated losses in major food and cashcrops. Amsterdam: Elsevier Science; 1994. p 808.
Ordano M, Guillén L, Rull J, Lasa R, Aluja M. Temporal dynam-ics of diversity in a tropical fruit fly (Tephritidae) ensembleand their implications on pest management and biodiversityconservation. Biodiver Conserv 2013;22(6–7):1557–1575.
Ortiz R, Sanabria E. Plagas. En: Quinua y kañiwa cultivos Andi-nos. Editorial IICA, Bogotá, Colombia. Serie Libros Y Mate-riales Educativos; 1979. p 121–136.
84 Quinoa: Improvement and Sustainable Production
Ortíz Romero R. [Internet]. 1993. Insectos plaga en quinua.Available from: http://www.rlc.fao.org/es/agricultura/produ/cdrom/contenido/libro14/cap2.3.htm
Ortiz R. 1997. Plagas de cultivos Andinos. En: 2do. SeminarioInternacional De Especies Andinas, Una Riqueza NoExplotada Por Chile, Calama, Chile.
Palacios M, Tenorio J, Vera M, Zevallos F, Lagnaoui A.1999. Population dynamics of the Andean potato tubermoth, Symmetrischema tangolias (Gyen), in three differentagroecosystems in Peru. Lima, Peru: International PotatoCenter Program Report 1997–1998. pp. 153–160.
Paré PW, Tumlinson JH. Plant volatiles as a defense against insectherbivores. Plant Physiol 1999;121:325–331.
Parker JE, Snyder WE, Hamilton GC, Rodríguez-Saona C. 2013.Companion planting and insect pest control. In: Soloneski S,Larramendy M, editors. Agricultural and biological sciencesweed and pest control - conventional and new challenges.Intech 10.5772/55044
Parsa S. Native herbivore becomes key pest alter dismantlement ofa traditional farming system. Am Entom 2010;56(4):242–251.
Pasko P, Sajewicz M, Gorinstein S, Zachwiejal Z. Analysis ofselected phenolic acids and flavonoids in Amaranthus cruentusand Chenopodium quinoa seeds and sprouts by HPLC. ActaChromat 2008;20(4):661–672.
Perfecto I, Vandermeer JH, Wright AL. Nature’s matrix: linkingagriculture, conservation and food sovereignty. London, UK:Earthscan; 2009. p 233.
Podazza G, Arias M, Prado FE. Cadmium accumulation andstrategies to avoid its toxicity in roots of the citrus rootstockCitrumelo. J Hazard Mater 2012;215–216:83–89.
Ponzio C, Gols R, Pieterse CMJ, Dicke M. Ecological and phyto-hormonal aspects of plant volatile emission in response to sin-gle and dual infestations with herbivores and phytopathogens.Funct Ecol 2013;27:587–598.
Poveda K, Gomez MI, Martinez E. Diversification practices: theireffect on pest regulation and production. Revista ColombianaDe Entomologia 2008;34:131–144.
Povolny D, Valencia L. Una palomilla de papa nueva para Colom-bia. Memorias Del Curso Sobre Control Integrado De PlagasDe Papa, Bogota, Colombia 1986;113:33–35.
Povolny D. Gnorimoschemini of southern South America.II: The genus Eurysacca (Lepidoptera: Gelechiidae).Steenstrupia 1986;12(1):1–47.
Povolny D. Eurysacca quinoae sp. N. - a new quinoa-feedingspecies of the tribe Gnorimoschemini (Lepidoptera:Gelechiidae) from Bolivia. Steenstrupia 1997;22:41–43.
Prado FE, Rosa M, Prado C, Podazza G, Interdonato R,González JA, Hila M. UV-B radiation, its effects anddefense mechanisms in terrestrial plants. In: Ahmadand P,Prasad MNV, editors. Environmental adaptations and stresstolerance of plants in the era of climate change. New York:Springer; 2012. p 57–84.
Ramakrishna A, Ravishankar GA. Influence of abiotic stress sig-nals on secondary metabolites in plants. Plant Signal Behav2011;6(11):1720–1731.
Rasmussen C, Jacobsen SE, Lagnaoui A, Esbjerg P. 2000. Plagasde quinua (Chenopodium quinoa Willd.) en la zona Andina. In:II Congreso Internacional De Agricultura En Zonas Aridas,16–21 oct, Iquique, Chile. 42 p.
Rasmussen C, Jacobsen SE, Lagnaoui A. Las polillas de laquinoa (Chenopodium quinoa Willd) en el Perú: Eurysacca(Lepidoptera: Gelechiidae). Revista Peruana De Entomología2001;42:57–59.
Rasmussen C, Lagnaoui A, Esbjerg P. Advances in the knowledgeof quinoa pests. Food Rev Int 2003;19:61–75.
Rastrelli L, Aquino R, Abdo S, Proto M, De Simone F, DeTommasi N. Studies on the constituents of Amaranthuscaudatus leaves: isolation and structure elucidation of newtriterpenoid saponins and ionol-derived glycosides. J AgrFood Chem 1998;46:1797–1804.
Raymundo SA, Alcazar J. 1983. Effects of polyculture (mixedcropping) on the incidence and severity of potato pests anddiseases (Solanum tuberosum, Diabrotica spp., Phytophthorainfestans). In: International Congress Research for the Potatoin the Year 2000, 22–27 Feb, Lima, Peru.
Reguilón C, González Olazo EV, Nuñez Campero SR. Mor-fología de los estados inmaduros de Chrysoperla argentina(Neuroptera: Chrysopidae). Acta Zoológica Lilloana2006;50(1–2):31–39.
Reguilón C, Valoy M, González JA. 2009. Neurópteros asociadosa un cultivo experimental de quinoa (Chenopodium quinoaWilld) en una zona de valles intermontanos (Tucumán,Argentina). En: XXXII Congreso Argentino de Horticultura,23 al 26 de Sept, Salta, Argentina.
Rhoades RE, Bebbington AJ. Mixing it up: variations in Andeanfarmers’ rationales for intercropping of potatoes. Field CropsRes 1990;25(1):145–156.
Risch S. The population dynamics of several herbivorous beetlesin a tropical agroecosystem: the effect of intercropping corn,beans and squash in Costa Rica. J Appl Ecol 1980;17:593–611.
Robinson RA, Sutherland WJ. Postwar changes in arablefarming and biodiversity in Great Britain. J Appl Ecol2002;39(1):157–176.
Romero F. 2004. Manejo integrado de plagas - las bases, losconceptos, su mercantilización. Universidad AutónomaChapingo. Colegio de Postgraduados-Instituto de Fitos-anidad. Montecillo.
Root R. Organization of a plant-arthropod association in simpleand diverse habitats: the fauna of collards (Brassica oleracea).Ecol Monogr 1973;43:96–124.
Rosa M, Hilal M, González JA, Prado FE. Low-temperatureeffect on enzyme activities involved in sucrose–starchpartitioning in salt-stressed and salt-acclimated cotyledons ofquinoa (Chenopodium quinoa Willd.) seedlings. Plant PhysiolBiochem 2009;47:300–307.
Ruales J, Nair BM. Saponins, phytic acid, tannins and proteaseinhibitors in quinoa (Chenopodium quinoa, Willd) seeds. FoodChem 1993;48:137–143.
The Potential of Using Natural Enemies and Chemical Compounds 85
Sánchez G, Vergara C. 1991. Plagas de los cultivos Andinos. Uni-versidad Agraria La Molina, Departamento de Entomología,Lima, Perú. 46 p.
Sánchez-Hernández C, Martínez-Gallardo N, Guerrero-RangelA, Valdés-Rodríguez S, Délano-Frier J. Trypsin anda-amylase inhibitors are differentially induced in leaves ofamaranth (Amaranthus hypochondriacus) in response to bioticand abiotic stress. Physiol Plantarum 2004;122:254–264.
Saravia R, Quispe R. 2005. Manejo integrado de las plagasinsectiles del cultivo de la quinua. Fascicle 4 In: PROINPA yFAUTAPO Ed. Serie de Módulos Publicados en Sistemas deProducción Sostenible en el Cultivo de la Quinua: Módulo2. Manejo agronómico de la Quinua Orgánica. FundaciónPROINPA, Fundación AUTAPO, Embajada Real de losPaíses Bajos. La Paz, Bolivia. pp. 53-86.
Schuler MA. The role of cytochrome P450 monooxygenases inplant-insect interactions. Plant Physiol 1996;112:1411–1419.
Simmonds MSJ. Flavonoid–insect interactions: recent advancesin our knowledge. Phytochemistry 2003;64:21–30.
Seran TH, Brintha I. Review on maize based intercropping. JAgron 2010;9(3):135–145.
Shennan C. Biotic interactions, ecological knowledge andagriculture. Phil Trans Royal Soc B-Biol Sci 2008;363(1492):717–739.
Sigsgaard L, Jacobsen SE, Christiansen JL. Quinoa,(Chenopodium quinoa) provides a new host for nativeherbivores in northern Europe: case studies of the moth,Scrobipalpa atriplicella, and the tortoise beetle, Cassidanebulosa. J Insect Sci 2008;8:50–54.
Silwana TT, Lucas EO. The effect of planting combinationsand Weeding on the growth and yield of component cropsof maize/bean and maize/pumpkin intercrops. J Agr Sci2002;138:193–200.
Smith HA, McSorley R. Intercropping and pest management: areview of major concepts. Am Entom 2000;46(3):154–161.
Soto J, Valdivia E, Valdivia R, Cuadros A, Bravo R. Descripciónde sistemas de rotación de cultivos en parcelas de producciónde quinua en cuatro zonas (siete distritos) del Altiplano Peru-ano. CienciAgro 2012;2(3):391–402.
Steffensen SK, Pedersen HA, Labouriau R, Mortensen AG,Laursen B, de Troiani RM, Noellemeyer EJ, Janovska D,Stavelikova H, Taberner A, Christophersen C, FomsgaardIS. Variation of polyphenols and betaines in aerial parts ofyoung, field-grown Amaranthus genotypes. J Agric FoodChem 2011;59:12073–12082.
Tauber MJ, Tauber CA, Daane KM, Hagen KS. Commercializa-tion of predators: Recent lessons from green lacewings (Neu-roptera: Chrysopidae). Am. Entomol 2000;46:26–37.
Thiery D, Visser JH. Masking of host plant odour in the olfactoryorientation of the Colorado potato beetle. Entom Exp Appl1986;41(2):165–172.
Throop HL, Lerdau MT. Effects of nitrogen deposition on insectherbivory: implications for community and ecosystem pro-cesses. Ecosystem 2004;7:109–133.
Thummel CS, Chory J. Steroid signaling in plants andinsects: common themes, different pathways. Genes Dev2002;16:3113–3129.
Trenbath BR. Intercropping for the management of pests and dis-eases. Field Crop Res 1993;34(3):381–405.
Valoy ME, Bruno MA, Prado FE, González JA. Insects associatedto a quinoa crop in Amaicha Del Valle, Tucumán, Argentina.Acta Zoologica Lilloana 2011;55(1):16–22.
Vandermeer JH. The ecology of intercropping. New York, USA:Cambridge University Press; 1989. p 248.
Varanda EM, Pais MP. Insect folivory in Didymopanax vinosum(Apiaceae) in a vegetation mosaic of Brazilian cerrado. Braz JBiol 2006;66(2B):671–680.
Vela A, Quispe A. Plagas de los cultivos de papa y maiz. Impre-siones y Publicaciones Martinez Camañón. Perú: Cajamarca;1988. p 155 p.
Verma S, Agarwal P. Phytochemical investigation of Chenopodiumalbum Linn. and C. murale Linn. Nat Acad Sci Lett1985;8:137–138.
Weber DC. Biological control of potato insect pests. In: Gior-danengo P, Vincent C, Alyokhin A, editors. Insect pests ofpotato: global perspectives on biology and management. USA:Elsevier; 2012. p 399–424.
Whitham TG, Williams AG, Robinson AM. The variation princi-ple: individual plants as temporal and spatial mosaics of resis-tance to rapidly evolving pests. In: Price P, Slobodchikoff C,Gaud W, editors. A new ecology: novel approaches to inter-active systems. New York, USA: Wiley; 1984. p 15–52.
Whitman DW, Blum MS, Alsop DW. Allomones: chemicals fordefense. In: Evans DL, Schmidt JO, editors. Insect defenses:adaptive mechanisms and strategies of prey and predators.Albany, New York: State University of New York Press; 1990.p 289–351.
Whitney HM, Feder W. Biomechanics of plant–insect interac-tions. Curr Opin Plant Biol 2013;16:105–111.
Wilby A, Thomas M. Natural enemy diversity and pest control:patterns of pest emergence with agricultural intensification.Ecol Lett 2002;5:353–360.
Wink M. Importance of plants secondary metabolites forprotection against insects and microbial infections. In: RaiM, Carpinella MC, editors. Naturally occurring bioactivecompounds. Amsterdam: Elsevier; 2006. p 251–268.
Wink M, Schimmer O. Molecular modes of action of defensivesecondary metabolites. Ann Plant Rev 2009;39:21–161.
Wink M. Introduction: biochemistry, physiology and eco-logical function of secondary metabolites. Ann Plant Rev2009;40:1–19.
Wise MJ, Abrahamson WG. Effects of resource availability on tol-erance of herbivory: a review and assessment of three opposingmodels. Am Nat 2007;169(4):443–454.
Woldemichael GM, Wink M. Identification and biological activi-ties of triterpenoid saponins from Chenopodium quinoa. J AgrFood Chem 2001;49:2327–2332.
86 Quinoa: Improvement and Sustainable Production
Yábar E, Gianoli E, Echegaray ER. Insect pests and natural ene-mies in two varieties of quinoa (Chenopodium quinoa) at Cusco,Perú. J Appl Ent 2002;126:275–280.
Zanabria E, Mujica S. Plagas de la quinoa. Fondo Simón Boli-var, Puno, Perú: Universidad Nacional Técnica Del Altiplano;1977. p 129–142.
Zanabria E, Banegas M. Entomología económica sostenible. Puno,Perú: Aquarium Impresiones; 1997. p 201.
Zhu N, Kikuzaki H, Vastano BC, Nakatani N, Karwe MV, RosenRT, Ho C. Ecdysteroids of quinoa seeds (Chenopodium quinoaWilld.). J Agr Food Chem 2001a;49:2576–2578.
Zhu N, Sheng S, Li D, Lavoie EJ, Karwe MV, Rosen RT, HoCT. Antioxidative flavonoid glycosides from quinoa seeds(Chenopodium quinoa Willd). J Food Lipids 2001b;8(1):37–44.
Chapter 6
Quinoa Breeding
Luz Gomez-PandoUniversidad Nacional Agraria La Molina-Agronomy Faculty, Lima-Peru
HISTORY – DOMESTICATION PROCESS
Quinoa was probably among the earliest culti-vated plants in the Andes region. The earliestarcheological evidence indicates that the pro-cess of quinoa domestication began around5000 BC in Ayacucho, located in the centralhighlands of Peru (Lumbreras et al. 2008) andin several other locations of South America.Remnants of Chenopodium sp. seeds were foundin the Chinchorro Complex of Chile dating to3000 BC, in Indian graves at Tarapaca, Calma,Calchaqui-Diaguita, Tiltil, and Quilagua in Chile(Bollaert 1860; Tapia 1979). The progress ofquinoa cultivation has been studied intensively inthe Lake Titicaca basin in Peru and Bolivia and itwas found as a part of an agricultural complex thatdeveloped during the regional Formative Period,from 1800 BC to AD 500 (Bruno and Whitehead2003). Seeds and fruit of cultivated species ofthe genus Chenopodium were identified frombotanical remnants recovered at the archeologicalsite of Punta de la Peña 4, layer 3, dated to ca.760–560 BC at Sierra, Catamarca, SouthernArgentinean Puna (Rodríguez et al. 2006).
In view of the archeological findings, quinoaimprovement began many thousands of years agowhen men and women started selecting seedsand plants. After centuries of natural and humanselection, the different quinoa phenotypes andgenotypes show adaptation to different partsof the Andean region, similar to the way that
Quinoa: Improvement and Sustainable Production, First Edition. Edited by Kevin Murphy and Janet Matanguihan.© 2015 John Wiley & Sons, Inc. Published 2015 by John Wiley & Sons, Inc.
selection has affected hundreds of annual andperennial plant species worldwide (Duvick 1996).Seeds are the only available evidence to show theimprovement of plant characteristics by naturaland human selection through time. The majorchanges reported from the wild types and thedomesticated varieties of chenopods are in themorphology of seeds, specifically those relatedto seed coat thickness, seed size, margin config-uration, and surface patterns. The occurrenceof a thin seed husk and the truncated marginamong the domesticated chenopod seeds reflectsan adaptive response to the selective pressuresof human domestication, in terms of seedlingviability and reduced seed dormancy (Murray2005). Another character affected by humanmanipulation is the color of seeds, as there wasa decrease in the number of black seeds amongsamples of varying ages as determined by C14
dating (Tapia 1979).Farmers from the Highland Andean region
required a complex combination of traits fromthe quinoa that they grew, traits needed to meettheir food needs, and agronomic characteristics toenable them to grow in countless microclimates,from driest to wettest, coldest to hottest, andlowest to highest elevation. The products ofnatural and human selection are five quinoaecotypes, each adapted to a particular growingenvironment. The Salares ecotype is recom-mended for the salt plateau (Salares) of southernBolivia; the Altiplano ecotype for the high plateau
87
88 Quinoa: Improvement and Sustainable Production
(Altiplano) of Peru and Bolivia surrounding LakeTiticaca; the Valley ecotype for the low valleys ofthe highland below 3,800 masl; the Sea-level eco-type for sea level or low altitudes in central Chileand high altitudes in southern Chile; and the Sub-tropics ecotype for the eastern, subtropical slopesof the Andes.
As a result of natural and human selection,complex populations were developed as cultivars,some of which are still used at present. Thevariability of these cultivars is seen in traitssuch as duration of the growth cycle, dormancy(time elapsed between physiological maturity andsprouting), disease resistance, and yield stabilitybecause of tolerance to frost, salt, and drought. Onthe other hand, quinoa cultivars share commoncharacteristics such as plant height, seed color,and quality characteristics related to quinoa enduse and commercialization. Besides importantagronomic criteria, consumption criteria werealso considered by farmers in their selection,such as suitability for traditional dishes or drinksand secondary use of the leaves as vegetables oranimal feed.
Together with potato and maize, quinoabecame an important food source for the IncaEmpire with almost 15 million inhabitants in theAndean region. After the Spanish conquest ofthe region around 1532 AD, quinoa was replacedby crops such as barley, wheat, broad beans, peas,and oats. From that time on until the 1960s,almost 500 years since Pizarro’s conquest, quinoaremained as a neglected crop in the highlands.During this period, quinoa had received littleattention from researchers or scientists, andalmost no commercial advancement. Although itwas largely lost to the outside world, quinoa didnot become extinct because farmers maintainedthis crop mainly in the Peruvian and BolivianAltiplano (Cusack 1984; National ResearchCouncil 1989; Mujica 1992; Jacobsen and Stolen1993).
Beginning in the 1960s, interest in quinoaincreased, eventually leading to the establishmentof several new breeding programs in differentcountries. Several factors have contributed to thisincreased interest in quinoa, namely awareness ofthe role of quinoa in food security in the Andean
South America, its unique potential as a cropfor marginal soils worldwide, and a growinghealth food export market. Genetic improve-ment of quinoa started in Bolivia in 1965 at theExperimental Station Patacamaya supported byFAO-OXFAM (Oxford Famine Relief) and theBolivian Government (Gandarillas 1979a). InPeru, it started almost at the same time in theTechnical University of Altiplano in Puno.
COLLECTION OF GENETIC RESOURCES
Crop genetic improvement in the Andean regionstarted in the 1960s with the collection andcharacterization of quinoa germplasm preservedby the farmers. Gandarillas (1968) made one ofthe first descriptions of quinoa germplasm ofBolivia, Peru, and Ecuador. On the basis of thedescriptors such as plant habit, type of inflores-cence, leaf shape, seed, and leaf dentation number,Gandarillas (1968) described 17 different races ofquinoa: four races in the North of Cusco (Pich-incha, Ancash, Cajamarca, Junin), three races inCusco (Cusco, Sicuani, Puca), four races aroundthe basin of Lake Titicaca (Copacabana, Dulce,Achacachi, Puno), four races in the Andean valleylocated at the southeast of Lake Titicaca (Potosi,Sucre, La Glorieta, Cochabamba), and two racesaround the Poopo Lake basin (Real, Challapata).On the basis of these characteristics and researchconducted on quinoa genetic diversity, it isaccepted that the region with the highest quinoadiversity is located between Cuzco (Peru) andPoopo Lake (Bolivia) (Wilson 1988; Christensenet al. 2007).
Quinoa germplasm and that of otherChenopodium species are mainly preserved ex situ.In Bolivia, around 5,000 accessions are preservedin several institutions, such as the TorolapaCentre of the National Institute of Agricul-tural and Forestry Innovation, the ChoquenairaExperimental Station of the Universidad Mayorde San Andrés-UMSA, the Biotechnologyand Phytogenetic Resources Research Centre(CIBREF) of the Technical University of Oruro(UTO), the Tiahuanacu Academic Unit of theBolivian Catholic University-UCB, the Kallutaca
Quinoa Breeding 89
Experimental Centre of Public University ElAlto-UPEA, and the Centre of CommunalResearch and Promotion-CIPROCOM. Thesegermplasm collections are preserved mainly in theINIAF Toralapa Centre that currently maintains3,121 accessions, both cultivated and wild, whichwere gathered from communities in the Altiplanoand the valleys in the Bolivian departments of LaPaz, Oruro, Potosi, Cochabamba, Chuquisaca,and Tarija. It also has germplasm from Peru,Ecuador, Colombia, Argentina, Chile, Mexico,and the United States. Eight wild species ofquinoa were identified among 270 accessionscollected (Rojas et al. 2010).
In Peru, around 5,351 accessions are alsomaintained in several institutions. The Instituteof Agricultural Research (INIA) at the Experi-mental Station of Illpa preserves 536 accessions.The National University of the Altiplano (UNA)in Puno has a collection of 1,873 accessions thatwere collected in Bolivia (457), Altiplano (990),Valley (357), Colombia (1), Ecuador (18), Chile(8), and the United States (2) (Bravo and Catacora2010). At La Molina Agrarian University, 2,942accessions are preserved, collected from thedepartments of Cajamarca, La Libertad, Ancash,Junín, Ayacucho, Arequipa, Apurimac, Cusco,and Puno, as well as from Bolivia (Gómez andEguiluz 2011). Other universities housing quinoagermplasm are the National University of theCentre in Junín, the National University of SanCristobal de Huamanga in Ayacucho, and theNational University of San Antonio Abad inCusco (Mujica 1992; Bonifacio et al. 2004).
Aside from Bolivia and Peru, there are othercountries that also preserve quinoa germplasm.In Ecuador, around 642 accessions are pre-served at the Santa Catalina ExperimentalStation of the National Institute of Agricul-tural Research-INIAP. In Chile, 25 accessionsare maintained at the Austral University and59 accessions in the North of Chile (Fuenteset al. 2006). In addition, 164 quinoa accessionsare maintained in the USDA National PlantGermplasm System (NPGS) (Christensen et al.2007). The reduction in the genetic diversityof quinoa in countries of the Andean regioncould be a result of founder effects associated
with the dispersal of the crop from its center oforigin or response to selective adaptation to otherecological regions. In the past centuries, the lossof biodiversity probably was due to the systematicdecline and, in some areas, the disappearance ofthe quinoa crop and its use outside the Peruvianand Bolivian Altiplano and the salt flats of Bolivia.
The in situ conservation systems for quinoa arefound mainly in Bolivia and Peru. Germplasm ispreserved by cultivation and utilization of quinoaand wild types through traditional systems infarmers’ communities. In Peru, it is kept in theaynokas, ancient systems maintained for severaldifferent purposes such as food security, adequatemanagement of soils and pests, conservation ofgenetic diversity in situ, and rational use of plantdiversity (Ichuta and Artiaga 1986). In Bolivia,five microcenters have been identified wherefarmers still keep customs and traditions such asbiological indicators or signs during the crop yearthat are used in crop management, rituals, andfestivals. The quinoa crop has a spatial and tem-poral distribution in traditional farming systemscalled aynoqas, sayañas, huyus, and jochiirana.The social system of community organizationsannually elects families called yapu campus orfarm caretakers, who are responsible for the careof crops against adverse weather such as hail,frost, and floods (Rojas et al. 2010b).
In these in situ conservation systems, cultivatedquinoa and wild relatives are preserved. Thesesystems are widely distributed in the Andeanregion and are known by different names such asmandas and laymes (Mujica and Jacobsen 2000).The related wild species growing alongside culti-vated quinoa in the Altiplano and the valleys areChenopodium carnosolum, Chenopodium petiolare,Chenopodium ambrosioides, Chenopodium hircinum,and Swaeda foliosa (Bonifacio 2003; Mujica andJacobsen 2005). The wild relatives are sometimesfound in isolation, either at the edges of thefarmers’ fields or in places considered sacred(Gentilwasi o Phiru). Still, these wild relativesof quinoa are cared for by farmers and used asfood, medicine, or for ritual purposes, especiallyin times of drought or extreme weather disasterscharacteristic of the Andean highlands of Peruand Bolivia. The young leaves of wild quinoa are
90 Quinoa: Improvement and Sustainable Production
used as a salad and the precooked, toasted seed ismade into flour.
Domesticated chenopods are distinguishedfrom wild Chenopodium species on the basis ofseveral characteristics. Domesticated chenopodshave (i) more compacted inflorescences; (ii) losttheir natural seed shattering mechanisms; (iii)uniform maturation of fruit; and (iv) reducedgermination dormancy (Smith 1984; Gremillion1993; Bruno and Whitehead 2003).
Quinoa germplasm has been generally char-acterized and evaluated using the morphologicalcharacteristics of vegetative and reproductiveorgans and agronomic characters such as plantheight, life cycle, yield potential, susceptibility tostress, and resistance or tolerance to pathogensand diseases. In addition, quality characters ofthe seeds such as size and color as well as protein,oil, and saponin content have been used. In somecases, variation in these characters was measuredin different years and locations to determinethe performance of the same genotype in dif-ferent environments (genotype × environmentinteraction). This work has permitted, thoughin a preliminary way, a method of knowingthe magnitude of the variation and the sourcesof genes for many characters, thus facilitatingbreeding programs. A number of this type ofresearch has permitted the formation of core col-lections to simplify the management and enhancethe utilization of quinoa genetic resources(Ortiz et al. 1998).
At present, quinoa germplasm is dividedinto five ecotypes (Tapia et al. 1980). Theseecotypes differ in adaptation to altitude, toler-ance to drought and salinity, and photoperiodresponse. These populations have most likelyreceived different selection pressures from theirenvironments as well as during the domesticationprocess.
1. Valley Type: These quinoas have evolved atvalleys situated at altitudes from 2,000 to3,800 masl. Plants of this ecotype are generally2–3 m in height and have branched stems, alife cycle of more than 210 days, low saponincontent, and some resistance or tolerance todowny mildew (Peronospora variabilis).
2. Altiplano Type: These quinoas originatearound the Lake Titicaca basin that has analtitude of 3,800 to 4,000 masl and is character-ized by adverse conditions (drought, frost, andhail). The plant height ranges from 1 to 1.8 mand the life cycle from 120 to 210 days. Ingeneral, they do not have branched stems andthe seeds are rich in saponin. These quinoasvary in their reaction to downy mildew and canbe tolerant, resistant, or highly susceptible.
3. Salar Type: These quinoas have evolved inthe salt flats of the southern altiplano inBolivia with altitudes around 4,000 masl, lowrainfall (300 mm), and soils having a pH above8.0. The plant characteristics are similar tothe Altiplano ecotype. In general, they haveblack seeds with sharp edges and are rich insaponin. Among the Salar ecotypes, thereare some sweet, saponin-free genotypes andsome “Real”-type quinoa, which have largewhite seeds.
4. Sea Level Type: These quinoas originate fromsouthern Chile, at latitudes around 40∘S. Theyare mostly unbranched and will flower in longdays. They have small, yellow translucent seedswith high saponin content. They are reportedto be resistant to fungal diseases such as downymildew (Fuentes et al. 2009).
5. Subtropical Type: These quinoas are found atthe subtropical Yungas of Bolivia. Plants havean intense green coloration that turns orange atmaturity and produce very small yellow-orangeseeds (Tapia 1982).
After the 1960s, there had been exchanges ofgermplasm among different organizations suchthat the quinoa population distribution of thepast has been changed in different degrees. Somenew sites have been identified in the Americanand European Test of quinoa, organized bythe FAO. Field trials in Italy and Greece haveshown promising results with reported seedyield of 2,280 and 3,960 kg/ha, respectively(Mujica et al. 2001).
Using morphological and agronomic charac-teristics, 95–100% of the quinoa collections ofBolivia had been characterized and evaluated,
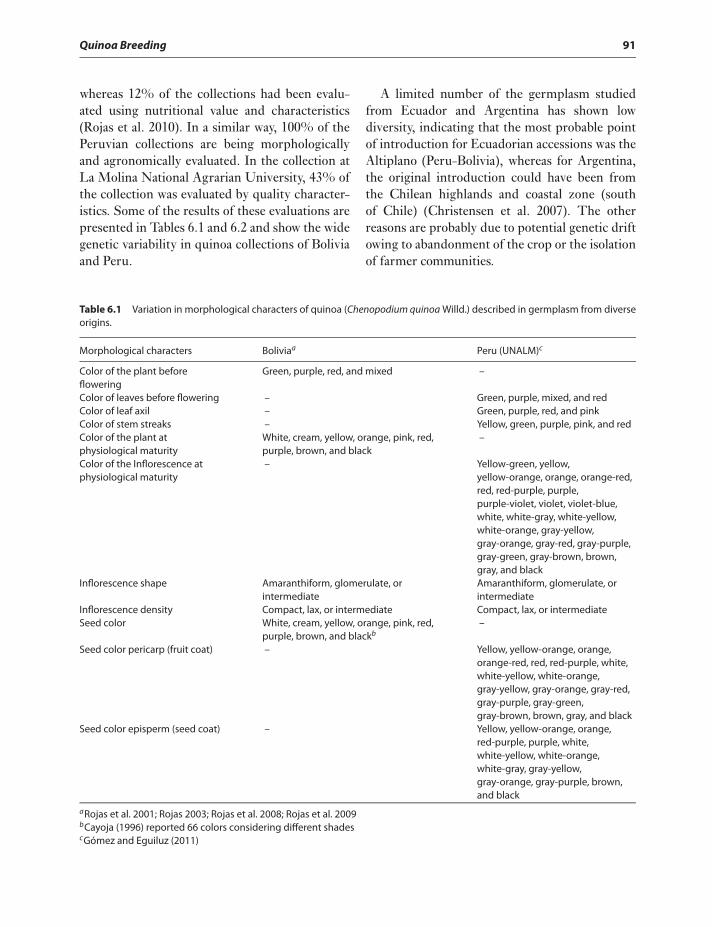
Quinoa Breeding 91
whereas 12% of the collections had been evalu-ated using nutritional value and characteristics(Rojas et al. 2010). In a similar way, 100% of thePeruvian collections are being morphologicallyand agronomically evaluated. In the collection atLa Molina National Agrarian University, 43% ofthe collection was evaluated by quality character-istics. Some of the results of these evaluations arepresented in Tables 6.1 and 6.2 and show the widegenetic variability in quinoa collections of Boliviaand Peru.
A limited number of the germplasm studiedfrom Ecuador and Argentina has shown lowdiversity, indicating that the most probable pointof introduction for Ecuadorian accessions was theAltiplano (Peru-Bolivia), whereas for Argentina,the original introduction could have been fromthe Chilean highlands and coastal zone (southof Chile) (Christensen et al. 2007). The otherreasons are probably due to potential genetic driftowing to abandonment of the crop or the isolationof farmer communities.
Table 6.1 Variation in morphological characters of quinoa (Chenopodium quinoa Willd.) described in germplasm from diverseorigins.
Morphological characters Boliviaa Peru (UNALM)c
Color of the plant beforeflowering
Green, purple, red, and mixed –
Color of leaves before flowering – Green, purple, mixed, and redColor of leaf axil – Green, purple, red, and pinkColor of stem streaks – Yellow, green, purple, pink, and redColor of the plant atphysiological maturity
White, cream, yellow, orange, pink, red,purple, brown, and black
–
Color of the Inflorescence atphysiological maturity
– Yellow-green, yellow,yellow-orange, orange, orange-red,red, red-purple, purple,purple-violet, violet, violet-blue,white, white-gray, white-yellow,white-orange, gray-yellow,gray-orange, gray-red, gray-purple,gray-green, gray-brown, brown,gray, and black
Inflorescence shape Amaranthiform, glomerulate, orintermediate
Amaranthiform, glomerulate, orintermediate
Inflorescence density Compact, lax, or intermediate Compact, lax, or intermediateSeed color White, cream, yellow, orange, pink, red,
purple, brown, and blackb–
Seed color pericarp (fruit coat) – Yellow, yellow-orange, orange,orange-red, red, red-purple, white,white-yellow, white-orange,gray-yellow, gray-orange, gray-red,gray-purple, gray-green,gray-brown, brown, gray, and black
Seed color episperm (seed coat) – Yellow, yellow-orange, orange,red-purple, purple, white,white-yellow, white-orange,white-gray, gray-yellow,gray-orange, gray-purple, brown,and black
aRojas et al. 2001; Rojas 2003; Rojas et al. 2008; Rojas et al. 2009bCayoja (1996) reported 66 colors considering different shadescGómez and Eguiluz (2011)
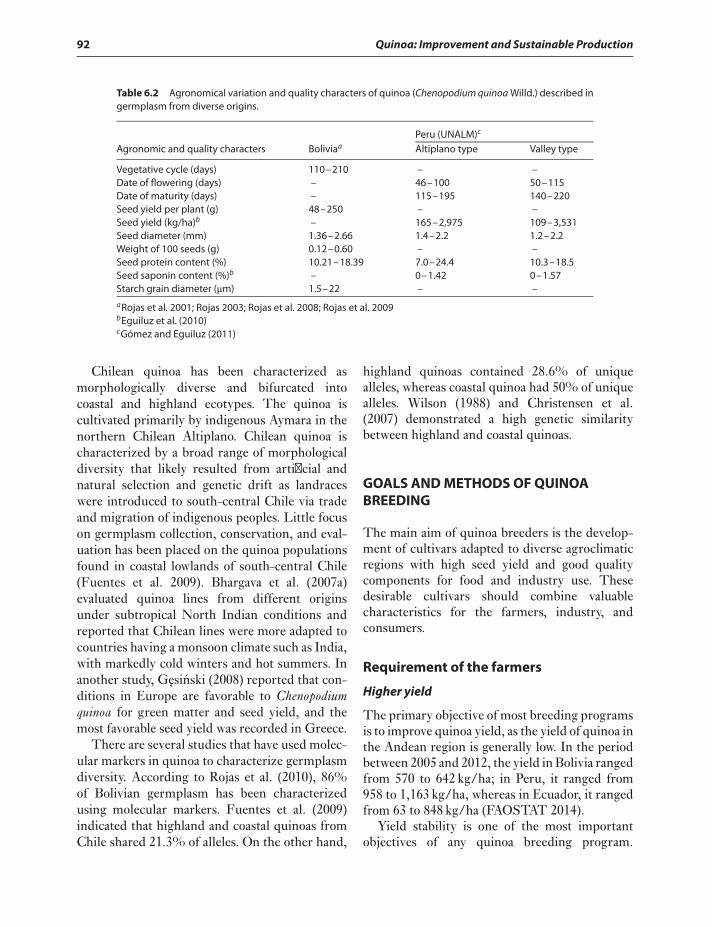
92 Quinoa: Improvement and Sustainable Production
Table 6.2 Agronomical variation and quality characters of quinoa (Chenopodium quinoa Willd.) described ingermplasm from diverse origins.
Peru (UNALM)c
Agronomic and quality characters Boliviaa Altiplano type Valley type
Vegetative cycle (days) 110–210 – –Date of flowering (days) – 46–100 50–115Date of maturity (days) – 115–195 140–220Seed yield per plant (g) 48–250 – –Seed yield (kg/ha)b – 165–2,975 109–3,531Seed diameter (mm) 1.36–2.66 1.4–2.2 1.2–2.2Weight of 100 seeds (g) 0.12–0.60 – –Seed protein content (%) 10.21–18.39 7.0–24.4 10.3–18.5Seed saponin content (%)b – 0–1.42 0–1.57Starch grain diameter (μm) 1.5–22 – –
aRojas et al. 2001; Rojas 2003; Rojas et al. 2008; Rojas et al. 2009bEguiluz et al. (2010)cGómez and Eguiluz (2011)
Chilean quinoa has been characterized asmorphologically diverse and bifurcated intocoastal and highland ecotypes. The quinoa iscultivated primarily by indigenous Aymara in thenorthern Chilean Altiplano. Chilean quinoa ischaracterized by a broad range of morphologicaldiversity that likely resulted from artificial andnatural selection and genetic drift as landraceswere introduced to south-central Chile via tradeand migration of indigenous peoples. Little focuson germplasm collection, conservation, and eval-uation has been placed on the quinoa populationsfound in coastal lowlands of south-central Chile(Fuentes et al. 2009). Bhargava et al. (2007a)evaluated quinoa lines from different originsunder subtropical North Indian conditions andreported that Chilean lines were more adapted tocountries having a monsoon climate such as India,with markedly cold winters and hot summers. Inanother study, G ¸esinski (2008) reported that con-ditions in Europe are favorable to Chenopodiumquinoa for green matter and seed yield, and themost favorable seed yield was recorded in Greece.
There are several studies that have used molec-ular markers in quinoa to characterize germplasmdiversity. According to Rojas et al. (2010), 86%of Bolivian germplasm has been characterizedusing molecular markers. Fuentes et al. (2009)indicated that highland and coastal quinoas fromChile shared 21.3% of alleles. On the other hand,
highland quinoas contained 28.6% of uniquealleles, whereas coastal quinoa had 50% of uniquealleles. Wilson (1988) and Christensen et al.(2007) demonstrated a high genetic similaritybetween highland and coastal quinoas.
GOALS AND METHODS OF QUINOABREEDING
The main aim of quinoa breeders is the develop-ment of cultivars adapted to diverse agroclimaticregions with high seed yield and good qualitycomponents for food and industry use. Thesedesirable cultivars should combine valuablecharacteristics for the farmers, industry, andconsumers.
Requirement of the farmers
Higher yield
The primary objective of most breeding programsis to improve quinoa yield, as the yield of quinoa inthe Andean region is generally low. In the periodbetween 2005 and 2012, the yield in Bolivia rangedfrom 570 to 642 kg/ha; in Peru, it ranged from958 to 1,163 kg/ha, whereas in Ecuador, it rangedfrom 63 to 848 kg/ha (FAOSTAT 2014).
Yield stability is one of the most importantobjectives of any quinoa breeding program.
Quinoa Breeding 93
In some cases, quinoa genotypes that have beenselected for good yield at a given location willnot perform well at another location. Thus, it isimportant to identify genotypes that give goodyields in a broad range of environments. In theAndean region, where subsistence agricultureis prevalent, a cultivar with the ability to give aconsistent yield under variable climatic conditionsis preferred to a cultivar that has the potentialfor outstanding yields but only under favorablegrowing conditions.
To assess the possibility of genetic improve-ment of seed yield, it is necessary to determinethe extent and nature of genetic variation, geno-type (G) × environment (E) interactions, andheritability. According to Bertero et al. (2004),the extremely high levels of environmentalvariation encountered within the quinoa growingregion require breeding and testing strategiesstructured to accommodate the effects of large G× E interactions. Mujica et al. (2001) reportedseed yields of 2,280 and 3,960 kg/ha in Italyand Greece, respectively, from some genotypesselected in the American and European Test ofQuinoa organized by the FAO. These findingsshowed good yield potential for quinoa. Bonifacio(2003) indicated that the improved varietiesobtained at the Patacamaya experimental stationyielded about 1,200 kg/ha on a commercial scalein the Altiplano, though their potential is muchgreater (3 t/ha) with increased inputs and theuse of modern technology. This is a considerableimprovement when compared to 700 kg/haobtained by the farmers using native varieties.However, acceptance of the improved varietiesdepends on their adaptation to local conditionsand their commercial and culinary characteristics.
It is also necessary to study seed size, plantheight, and lodging in relation to seed yield.Correlations among these characters are usefulin determining both favorable and unfavorablecorrelated responses to selection. Bertero et al.(2004) found that simultaneous progress for seedyield and seed size can be expected from selectionbecause no association was found between theaverage cultivar responses for seed yield and seedsize and no associations were found betweenthe G × E interaction effects for both traits.
Bhargava et al. (2007a) reported that plant height,leaf area, branches/plant, inflorescence/plant,seed size, 1,000 seed weight, dry weight/plant,and harvest index exhibited significant positiveassociation with seed, and the maximum valuewas recorded for inflorescence/plant. In anotherstudy, Bhargava et al. (2008) used direct andindirect selection for some parameters. Theyfound that stem diameter, chlorophyll a, totalchlorophyll, and leaf carotenoid content hadhigh correlated response and relative selectionefficiency values for seed yield. Thus, these traitscan be used to increase seed yield. Protein andcarotenoid contents in seed showed negativecorrelated response. Relative selection efficiencyvalues for seed yield indicated that direct selectionfor seed yield would lead to a slight decreasein these quality characters. Bertero and Ruiz(2008) reported a negative association betweenreproductive efficiencies and panicle biomass.Seed size was not of much significance eitherin increasing seed yield or any of the qualitycomponents. Seed yield can also be increasedthrough indirect selection for stem diameter,whereas leaf pigments are likely to play a majorrole in enhancement of quality traits such as leafand seed carotenoid levels.
Plant height
Plant height is generally considered to be aquantitative character, although several reportsindicate that reduced height or semidwarf char-acteristics may be controlled by single recessivegenes. There are significant variations in plantheight among quinoa ecotypes. Plants withshorter heights are usually found among theAltiplano and Salares ecotypes and the tallerplants (more than 2 m high) are found in theValley ecotypes. Plant height could be reduced byselection among genotypes without a semidwarfallele. Another way to reduce plant height is bythe use of mutagens to develop dwarf mutants,as reported by Gomez-Pando and Eguiluz-dela Barra (2013). It is also important to note thatthere are indications of a positive correlationbetween plant height and inflorescence length(Ochoa and Peralta 1988; Rojas et al. 2003).
94 Quinoa: Improvement and Sustainable Production
Stalk strength
Major advances in yield have been achieved bythe development of cultivars with resistance tolodging, planted in highly productive environ-ments managed with good farming technology.Resistance to lodging ensures good seed fillingand minimal harvest loss. In most crops, stemstrength must be dealt with as a quantitative trait.Several individual characters influence resistanceto lodging, including stem diameter, stem outerwall thickness, plant height, and type of rootsystem. The genetic control of stalk strength isalso quantitative.
Life cycle
Another important objective in breeding quinoais the development of early-maturing cultivarsthat can be grown in areas where the averagenumber of frost-free days in the growing seasonis <120–150, such as in the Andean region. Earlymaturing cultivars could also be less vulnerableto inclement weather and have more potentialto fit into multiple cropping systems in thecoastal areas. According to Mujica (1988), thenumber of days to flowering has a heritabilityof 0.82. Late-maturing genotypes frequentlyproduce higher seed yield but run a higher risk ofencountering frost, drought, or hail damage to anunacceptable degree.
Resistance to biotic stresses
Quinoa improvement programs in the Andeanregion have made it a priority to breed for pestand disease resistance, especially because farmersin the highlands can increase their income byselling organic quinoa. Many programs concen-trate on resistance to the fungus P. variabilis, thecausal agent of quinoa downy mildew. Downymildew causes serious yield losses throughout theAndean region and other locations in the world.At a number of locations, the focus has been onscreening germplasm for resistance, and geneticmaterials with different levels of resistance havebeen identified. Ochoa et al. (1999) determinedthe factors of resistance and virulence groups inthe quinoa-downy mildew pathosystem. Using 60
accessions of quinoa in Ecuador and 20 isolatesof P. variabilis, they identified three factors ofresistance and four virulence groups or races ofthe pathogen. The specific interaction betweenfungal isolates and host genes indicated thepresence of major genes. Accessions ECU-291,ECU-470, ECU-379, and ECU-288, were pro-posed as a set of preliminary differentials toidentify pathogenic races of downy mildew inquinoa. However, virulence tests showed that thevariability in P. variabilis is much more complexthan could be revealed using the Ecuadorian C.quinoa differentials used in the study (Danielsenet al. 2000). In India, 34 quinoa accessions wereevaluated for response to downy mildew. Sevenaccessions were found to be resistant, suggestingphysiological specialization of current pathotypesfor C. quinoa (Kumar et al. 2006).
Insects can be very damaging in quinoa, espe-cially when the insects feed on floral structuresor seeds, thus reducing seed yield and quality.Breeding for resistance to insects must considerthe genetics of the pest and the host becausecomplex interactions occur between insects andplants that may be morphological, biochemical,or physiological in nature. Plant resistance maybe obtained through nonpreference (suppressionof feeding or oviposition), antibiosis (adverseeffects on normal growth or survival of insects),and tolerance (ability of the plant to survive wheninsects are present).
Bird predation is another problem in quinoa.Variations in seed saponins, which cause dif-ferences in bird feeding preferences, have beenreported to deter bird feeding and thus decreaseinflorescence damage. Achenes with high amountsof saponin are often less damaged. Developinglines with tolerance to bird predation is a complexprocess, apparently requiring a combination ofmany characters that are independently inheritedbut contribute to overall tolerance.
Resistance to abiotic stresses
Quinoa is cultivated under a wide range ofenvironments in the Andean region. Quinoahas been noted to have tolerance to droughtand salt stresses (Jacobsen et al. 2001; Jacobsen
Quinoa Breeding 95
and Mujica 2002; Jacobsen et al. 2003; Jacobsenet al. 2005; Jacobsen et al. 2007; Gomez-Pandoet al. 2010; Ruiz-Carrasco et al. 2011; Verenaet al. 2013). It is important to understand thegenetic principles and the mechanisms governingtolerance to these factors and apply this knowl-edge to develop improved varieties of quinoa.There are two approaches to achieve drought-and salt-tolerant varieties: breed cultivars witha plant growth type that escapes the water andtemperature stress conditions and/or breed forcharacteristics that contribute to physiologicaldrought and salt tolerance.
Plant morphology
In some cultivars, it will be necessary to modifythe architecture of plants to allow for mechanizedharvesting. The areas devoted to quinoa cultiva-tion have been expanding rapidly and traditionalways of harvesting quinoa must be replaced bymechanical methods. Nonbranched or simplestem plants with an adequate plant height andunique terminal inflorescence and uniformseed maturity will be suitable for mechanizedagriculture.
Harvest index
The harvest index measures the photosyn-thetic capacity and the effective translocationof assimilates to the seeds. The harvest indexcan be modified by agronomic practices andenvironmental growing conditions (Berteroand Ruiz 2010). Rojas et al. (2003) reported avariation in the harvest index of quinoa from 0.06to 0.87. Traditional cultivars, especially valleyecotypes, have low harvest index due to the highamount of branching relative to plant height andmore partitioning of assimilated products to thevegetative parts rather than the seeds.
Requirements of the industryand consumers
Within the quinoa germplasm, significant differ-ences have been found in some qualitative traitsthat can be used in breeding to improve the nutri-tional quality of quinoa.
Protein content and composition
The protein concentration in quinoa seeds, asseen in other crops, is linked with soil nitrogen(N) availability and uptake, N transport andassimilation in the vegetative structures, directN transport and remobilization from plantstructures into developing seeds, carbohydratedeposition in the developing endosperm, andthe number and size of seeds per unit area. Thesecomplex relationships may cause a wide range inprotein percentages for the same genotype grownin different parts of the same field, in differentfields, in different regions, or in different years.The range of seed protein content reportedwas from 7% to 22% (Koziol 1992; Prakashet al. 1993; Wright et al. 2002; Repo-Carrascoet al. 2003; Bhargava et al. 2007a; Gómez andEguiluz 2011). High protein percentage generallyresults from low carbohydrate deposition in thekernel so that increased yield is often associatedwith lower protein content. However, Bhargavaet al. (2007a) reported insignificant correlationand low values of direct path among seed yieldand protein content in quinoa lines of differentorigins and remarked that this result could helpthe development of cultivars with good yieldpotential and high seed protein content.
Quinoa proteins have a remarkably high bio-logical value. However, raising the level of someamino acids is not yet possible at the moment, dueto the lack of knowledge regarding the variabilityof amino acid composition among genotypes andthe effect of environment. Even with this lackof knowledge, this is a promising area of futureresearch because the potential to increase thelevel of some amino acids exists.
Seed characteristics
Color
Until the 2000s, white- or cream-colored quinoaseeds had been preferred by consumers and theindustry. In the past decade, however, quinoawith darker-colored seeds had been incorporatedto the market probably due to the high associationof seed color with carotenoid content. The resultsof Bhargava et al.’s study (2007a) showed that
96 Quinoa: Improvement and Sustainable Production
accessions with dark seed coat color have highseed carotenoid content.
Size of seeds
Another potential goal in breeding quinoa is todevelop cultivars with homogeneous seed size inthe inflorescence. The size of quinoa seed variesfrom <1.4 mm diameter to more than 2.0 mm,and it is very common to find such variability ina single inflorescence (Gómez and Eguiluz 2011).Highly significant correlations between seeddiameter and seed weight have been determinedin quinoa (Ochoa and Peralta 1988; Cayoja 1996;Rojas et al. 2003). Temperature and photoperiodafter anthesis also affect seed diameter to aconsiderable extent. Short photoperiod and cooltemperatures after anthesis promote larger seeddiameters, whereas long photoperiods and hightemperature after anthesis negatively affect seedsize (Bertero et al. 1999; Bhargava et al. 2007a).Large seed size is preferred when the seed is useddirectly as pearled seeds or flakes, whereas seedsize is immaterial when seeds are to be used forflour.
Seed saponin content
The saponin content has different implicationsfor quinoa growers, consumers, and the industry.For the consumers, saponin gives seeds a bittertaste and must be removed from the seed, thusincreasing the time for food preparation. Onthe other hand, under some circumstances,growers will prefer bitter quinoa as the saponincould reduce damage due to birds and cer-tain insects. For the industry, saponin removalrequires specific equipment and a good sourceof quality water, thus increasing processingcosts. Recently, several uses have been found forsaponin, namely as an organic detergent, as foamfire extinguishers, and as deodorant and otheruses in the cosmetic industry. To fulfill thesediffering requirements for saponin content, thereare several accessions in the gene banks withoutsaponin (sweet), with very low content (mediumsweet), and with high levels (bitter) (Ward 2000a;Malt et al. 2006).
Further investigation into the genetic inher-itance of several quinoa characteristics will beuseful in developing methodologies for cultivardevelopment and for determining short- orlong-term breeding goals. Genetic studies inquinoa have provided knowledge regarding theinheritance of some qualitative and quantitativecharacters such as plant color, axillary pigmen-tation, inflorescence type, saponin content, seedcolor and type, genetic and cytoplasmic malesterility, earliness, and plant height (Gandarillas1968, 1974, 1979a, 1979b, 1986; Rea 1969; Espin-dola 1980; Bonifacio 1990, 1995; Saravia 1991;Ward 2000b).
Methods in genetic improvement
Reproductive biology
Quinoa is predominantly autogamous, thoughsome out-crossing is also possible. The sex-ual reproduction system of quinoa providesopportunities to produce new combinations ofgenes or mutations, passing on to the succeedinggenerations traits that might provide superioradaptability to changing environments. Eventhough quinoa is mainly grown from seed, in vitrovegetative propagation of quinoa has also beenreported (Ruiz 2002).
Gynomonoecy is the predominant breedingsystem in quinoa. The inflorescence bears threebasic flower types, namely, hermaphrodite,chlamydeous female, and achlamydeous female.There can be five flower types based on flowersize. On the other hand, there can be 10 flowertypes based on the proportion of hermaphroditeand female flowers and their arrangement andalso on the number of divisions of the dichasiumon the glomerule (Leon 1964; Rea 1969; Bhargavaet al. 2007b).
Quinoa is predominantly autogamous, thoughsome out-crossing is also possible. In studiesconducted in Peru and Bolivia, the amount ofcross pollination of different genotypes variedfrom 1.5% at a distance of 20 m to 9.9% at adistance of 1 m (Gandarillas and Tapia 1976).Some studies in the United States showedsimilar percentages of cross pollination, with
Quinoa Breeding 97
out-crossing exceeding 10% (House 1982;Jennings et al. 1981). In Argentine-Mendoza,out-crossing rates of 17.36% were observed(Silvestri and Gil 2000). The amount of crosspollination depends on (i) the proportion of thedifferent types of flowers in the inflorescence; (ii)the proportion of hermaphrodite flowers on aplant, which can vary from 2% to 99%; (iii) thenumber of androsterile hermaphrodite flowers;(iv) the presence of self-incompatibility and pro-togyny; and (v) the environment and presence ofinsects. Temperatures lower or higher than 30∘Cretard anthesis and affect pollen viability. Windpollination studies of fertile quinoa (CO 407) withan orange panicle crossed with a near-isoline (CO407R) with a red panicle showed that pollen canmove as far as 36 cm. In South America, pollencan be transported by some insects such as thripsand green aphids (Aphis sp.). However, in the SanLuis Valley, Colorado, no insect activity in theflowers was observed, although various Dipteraspp. visit quinoa flowers and may add to winddistribution of pollen (Rea 1969; Gandarillas1979a; Aguilar 1980; Johnson and Ward 1993;Lescano 1994; Silvestri and Gil 2000). However,there are also reports of some extreme cases ofcomplete self-pollination through cleistogamy(Nelson 1968) and obligatory out-crossing dueto self-incompatibility and male sterility (Nelson1968; Gandarillas 1969; Simmonds 1971), indi-cations that quinoa has a fairly versatile breedingsystem.
Male sterility was reported in many quinoaaccessions collected from the Central highlandsand from those growing around the Lake Titicacabasin of Peru-Bolivia and northern Bolivia. Theinheritance of male sterility has been found tobe controlled by nuclear genes and cytoplasmicfactors. Cytoplasm was classified as normal (N)and sterile (S) and the nuclear genes as fertile(Ms) and sterile (ms). Sterile cytoplasm fromthe cultivar “Apelawa” has been denoted asA-cytoplasm, whereas the older source and thatin PI 510536 are referred to as C-cytoplasm(Gandarillas 1969; Saravia 1991; Ward and John-son 1993; Ward 1998). The anthers of normalfertile quinoa are generally bright lemon yellow(Rea 1969), but the anthers of quinoa possessing
a gene for male sterility are whitish-yellow.Plants with male sterile cytoplasm produceflowers without anthers and show a prominentexertion of stigmas, whereas male sterile plantsfrom PI 510536 have shrunken anthers that donot produce pollen (Ward and Johnson 1993;Ward 1998).
The cultivars “Amachuma” and Apelawa aretwo potential sources of male sterile quinoaplants. Male sterility in the Amachuma typeappears to be a simply inherited genetic trait.On the other hand, the Apelawa type is a cyto-plasmic male sterile and has been transferredinto four additional background genotypes.Progeny from the crosses of Apelawa with theweedy species Chenopodium berlandieri had par-tially restored male fertility (Ward and Johnson1993).
Polyploidy level
Polyploidy in quinoa is also an important fac-tor in plant breeding because it can influencereproductive compatibility, fertility, and phe-notypic traits. The base chromosome numberof the genus Chenopodium is n= x= 9 chromo-somes. Quinoa has 2n= 36 chromosomes andis considered an allotetraploid. It is the resultof the cross between two diploid species with asubsequent doubling of chromosomes leading tothe development of a fertile allotetraploid (Gan-darillas 1986; Simmonds 1971; Maughan et al.2004, 2006).
Allelic segregation analysis showed disomicinheritance with independent assortment athomologous loci. Several sources have reportedclassic Mendelian ratios for qualitative traitssegregating in the F2 generation for one or twogene pairs (Cardenas and Hawkes 1948; Gandar-illas and Luizaga 1967; Gandarillas 1968, 1979b,1986; Simmonds 1971; Saravia 1991; Bonifacio1990, 1991). Ward (2000b) reported that allelicsegregation analysis in the F1 and F2 ratiosindicate both disomic-digenic and tetrasomicinheritance in two of the three traits studied,as well as distorted F2 ratios suggesting erraticmultivalent formation at meiosis.
98 Quinoa: Improvement and Sustainable Production
QUINOA BREEDING METHODS
Several breeding methods have been used withquinoa, such as selection (individual selectionand/or mass selection), introduction of foreigngermplasm, hybridization, backcrossing, andinduction of mutation.
Selection
The early stages of quinoa improvement began inthe different areas of the Andean region, drivenby selection of individuals from the naturalpopulations or land races developed throughoutthe centuries. Both individual selection and massselection had been applied.
Individual selection
Individual selection consists of selecting indi-vidual plants with one or more outstandingcharacteristics from a landrace population andsowing a single inflorescence per row. The off-spring are evaluated and selected in and betweenrows for characters under consideration. A modi-fication of this method, named inflorescence-row,follows the same procedure described earlier butwith one difference – selfing of the inflorescenceis controlled in each season. This modifiedprocedure was repeated for two or more cycles,enough to achieve homogeneity (Gandarillas1979a; Bonifacio 2003). Using this method, thecultivar “Sajama Amarantiforme” was obtained.
The selfing process could take place in all theinflorescence or only in some selected glomerulusor group of flowers. When the whole inflorescenceis to be selfed, it is necessary to cover it with agrease-proof paper bag and the leaves removed.When only a small number of glomeruli in theinflorescence are to be selfed, the major part ofthe inflorescence should be removed, and 8–10glomeruli in the base of the inflorescence areselected and isolated from the rest by enclosure ina glassine bag. Plants should be checked period-ically to avoid damage from diseases and insectsbecause isolated glomeruli are often preferred bylarvae that consume growing seeds.
Mass selection
This method consists of the selection of alarge number of superior plants with similarphenotype. Their seeds are then harvested andmixed together to constitute the new variety.Mass selection is applied multiple times in thesame population to improve the base populationperformance as mass-selected cultivars maycontain considerable genetic variation. Cultivarsdeveloped by mass selection have wide adaptabil-ity, a wide genetic base, and yield stability overa long period of time. Characters such as plantheight, plant and seed color, seed size, diseaseresistance, saponin content, and life cycle havebeen considered in the mass selection process.The main characteristic of cultivars developedthrough mass selection is that they are a mixtureof different genotypes, generally uniform in size,seed color, and saponin content, and in othercharacters preferred by the general market andthe industry. In Bolivia, stratified mass selectionwas used to produce seeds of cultivars developedfrom the Real landrace and also used to preservethe identity and composition of establishedcultivars. The most important cultivars obtainedusing mass selection are “Real” (Bolivia), “Baer”(Chile), “Dulce de Quitopamba” (Colombia),“Pasankalla,” “Chewecca,” “Blanca de Juli,”“Amarilla de Marangani,” “Blanca de Junín,”“Rosada de Junin,” and “Blanca de Hualhuas”(Peru).
Participatory plant breeding (PPB)
Although initially developed for smallholderagriculture in difficult and diverse environments,participatory plant breeding (PPB) appears tobe a viable alternative for improving quinoagermplasm in small-scale farmers’ fields. PPBinvolves farmers and other stakeholders in thebreeding process. Stakeholders may work withscientists in any of the five basic steps of the plantbreeding cycle: setting goals, creating variability,selecting experimental lines/genotypes, testingexperimental lines/genotypes, and cultivarrelease/diffusion. In Ecuador, the PPB processeswere applied and the farmers’ field selection
Quinoa Breeding 99
criteria for quinoa were based mostly on yield,earliness, and plant color. At seed selection,farmers with insecure food sources chose linesbased on yield, whereas farmers who had moreresources also considered seed size, color, saponincontent, and marketability in addition to yield(Ceccarelli et al. 2000; McElhinny et al. 2007).
Introduction of foreign germplasm
For the past several decades, germplasm andcultivars of quinoa have been exchanged amongcountries of the Andean region. After a series ofevaluations and multiplications, some of theseintroduced materials have been developed ascommercial cultivars. On the whole, the intro-duction of cultivars from the Bolivian southernaltiplano to the Bolivian northern altiplano andPeru altiplano had not been successful, due to thehigh susceptibility of these quinoas, especiallythe Real race, to downly mildew, although therehave been some exceptions. Similarly, accessionsfrom the Northern and Central Highlands didnot adapt very well because these accessions areof the Valley ecotype, have a long life cycle, andare susceptible to drought and frost. An exceptionis the “Sayaña” cultivar that is currently adaptedto the surrounding area of Uyuni. Cultivarsdeveloped at Patacamaya such as “Sajama,”“Kamiri,” “Huaranga,” and “Chucapaca” wereintroduced by farmers and research institutionsto Peru and had adapted well in Puno. These areused as commercial cultivars mainly because ofthe high quality of their seed. The cultivar “Patade Ganso” from Ecuador was developed fromintroduced Bolivian material.
Quinoa was also introduced to other countriesoutside of the Andean region. Approximately 300accessions from Bolivia, Peru, and Chile havebeen introduced to England (Risi and Galwey1984; Risi 1986). Outstanding accessions ofquinoa from the region selected by differentinstitutions were included in the American andEuropean Quinoa Test, which was conductedin different countries (Mujica et al. 2001). Thepreliminary results showed that accessions fromthe Peruvian and Ecuadorian Valley have goodtolerance to mildew, whereas material from
Bolivia showed high susceptibility to the samedisease. Accessions from the Coast maturedearlier but were highly susceptible to hail atthe highland locations. Adaptation to NorthIndian subtropical conditions were reported byBhargava et al. (2007a) who studied 27 germplasmlines of C. quinoa and two lines of C. berlandierisubsp. nuttalliae over a 2-year period. Seedyield ranged from 0.32 to 9.83 t/ha, with higheryields recorded in four Chilean, two US, oneArgentinian, and one Bolivian line.
Hybridization
Hybridization has been used to improve quinoa.The main objectives of hybridization are to bringtogether desired characters from different acces-sions into one new plant or plant line to improvecertain quantitative characteristics.
Selection of parents
Selection of parents is the first and one of themost important steps in a successful quinoabreeding program. The choice of parents willdepend on the objectives of the program andthe availability of genotypes to meet the specificobjectives. Crossing two genotypes with comple-mentary traits is a common practice. Valuablecharacteristics are scattered among germplasm ofdifferent origin such as saponin-free ecotypes thathave small to medium seed size and bitter eco-types that have large seeds; tolerance/resistanceto mildew (P. variabilis) is present in Valleyecotypes combined with branched stems and along life cycle; Altiplano ecotypes are suscep-tible to downy mildew but have a single stemand mature earlier. All these characters can becombined into one genotype using hybridizationand subsequent selection. Risi and Galwey (1989)concluded that quinoa characteristics requiredfor temperate conditions are available to a largeextent in accessions collected near sea level insouthern-central Chile, whereas seed character-istics are scattered throughout the germplasm.Carmen (1984) recommended the utilization ofearlier genetic material available from the quinoacollection of the Germplasm Bank of AndeanCrops at the Altiplano-Puno National University
100 Quinoa: Improvement and Sustainable Production
(UNAP). Quinoa breeders might focus on intro-ducing resistance to downy mildew from coastalgermplasm to Altiplano germplasm. Conversely,coastal cultivars need the introduction of moreattractive agronomic characteristics, such aslarger seed size, that are present in the Real-typequinoas from the Andean highlands (Fuenteset al. 2009).
Flowering biology
Anthesis in quinoa starts at the apex of eachglomerulus or group of flowers. Hermaphroditeand female flowers generally open at the sametime. Most flowers open in the morning and themaximum number of flowers open at midday.Rain reduces the number of open flowers. Antherdehiscence occurs from early morning until lateafternoon. It is also highest at midday duringwhich large quantities of pollen are produced.Flowers remain open for 5–13 days. In eightlandraces and five commercial varieties of quinoa,the average duration of anthesis was 14.5 days andthe average duration of dehiscence was 18.2 days.An average of 2.5% floral aberrations had beenobserved (Ignacio and Vera 1976; Gandarillas1979a; Lescano 1980).
Emasculation and pollination procedure
Procedures for artificial hybridization of quinoahave been described by Rea (1948), Gandarillasand Luizaga (1967), Gandarillas (1979a), Lescanoand Palomino (1976), and Bonifacio (1990, 1995).Emasculation techniques and artificial pollinationare often simple procedures in many other cropsbut are quite laborious in quinoa due to inflores-cence characteristics and extremely small flowersize. Quinoa crosses can be made in the fieldand in the greenhouse but it is very importantto have favorable environmental conditions forplant growth and development. Crosses between“Pasankalla” × “Salcedo” INIA and “Pasankalla”× “Choclo” made under field conditions resultedin 41% and 63% seed set in the female parent,respectively (Leon 2004, 2005).
Crossing may be simple or reciprocal, but inall cases, it is important to have one or more
morphological markers or qualitative characterspresent in one of the parents, to be used asmorphological marker to identify the hybrids inthe F1 generation. The female parental line musthave the recessive character and the male parentalline the dominant character. It is also important toselect parental lines that can withstand handlingduring the whole process, which can take 10–14days. The female parent must tolerate repetitiveemasculation and pollination and the male parentmust provide an adequate amount of viable pollen.
The equipment needed for crossing consistof small scissors with sharp and pointed blades,finely tipped forceps or needles, glassine bags,paper clips or staples, and small tags. The femaleplant must be prepared by choosing two or threeequidistant glomerulus from the base of theinflorescence before flowering time. Leaves of theinflorescence must be removed, retaining onlyone leaf under each glomerulus and the rest of theinflorescence also removed. The optimum timeto emasculate quinoa flowers is when the anthershave obtained full size but are not yet ready todehisce. Hermaphrodite flowers are chosen foremasculation, which is the process of removingthe anthers with a needle before they have shedpollen without damaging the stigmata. Afterwhich, the female flowers of the glomerulus areretained. Five anthers in each inflorescence mustbe removed. The process can take 10–14 days.The inflorescence must be covered with a glassinebag or a paper bag depending of the size of theinflorescence to exclude unwanted pollen once theprocess has been initiated. The bag should be justwide enough to cover the inflorescence and longenough to be folded and stapled or secured with apaper clip. In the field, crossed inflorescences aresometimes supported by a stake. An identificationtag must be used, containing the names of parentlines, the date of emasculation, and the name ofthe operator.
Emasculation using hot water (42∘C), as in thecase of sorghum (Alvarez 1993), has not been suc-cessful in quinoa. The use of the suction pumprecommended for rice (Jennings et al. 1981) hasnot been tested in quinoa, though presumably itwill be ineffective due to the tightly closed peri-anth lobes enveloping the anthers.
Quinoa Breeding 101
Clear days with temperatures near to 24∘C areideal for gathering viable pollen. Cloudy dayswith high relative humidity and low temperature,near or below 15∘C, are not favorable for anthesis.Quinoa pollen must be collected in a watchglass, paper bag, or Petri dish. The selectedinflorescence must be bent over and shaken tocollect pollen. Viable pollen can be recognizedby the appearance of fine yellowish powderwithout agglutination, whereas old pollen showsagglutination and the presence of pollen sacs.
The phenomenon of male sterility in quinoacan also be utilized in crossing quinoa. However,using male sterility requires prior development ofmale sterile lines and maintainer lines, as well asthe introduction of male sterility into the selectedparents for each cross. Conversely, if there areexcellent lines possessing male sterility, theycan be used directly as female parents withoutbeing emasculated. The process begins with theidentification of male sterile plants, in whichapical parts of the inflorescence must be removedto eliminate any flower that could have alreadyreceived foreign pollen. Plants are then isolatedfor 1 week and flowers forming seed are removed.Male sterile plants (to be used as female parents)are then pollinated with pollen collected fromthe male parent. Pollination can be repeated fora second time to ensure greater seed production.Ward and Johnson (1993) made crosses usingmale sterility, where the selected male parent wasplaced next to the male sterile plant. This methodis simple and may be applicable in greenhousesfor a single or few crosses where foreign pollencontamination can be easily controlled.
Bulk or mass selection
The F2 population must be large so that there areenough recombinant plants to develop a new pop-ulation combining desirable characteristics. Bulkselection, pedigree selection, and the single-seeddescent (SSD) method could be used to managethe segregating population.
Bulk selection is a preferred breeding methoddue to its simplicity and low labor cost. Plantsfrom F2 to F6 are harvested in bulk. The follow-ing year, a sample of the bulk in each generation
is planted in a plot with the expectation thatnatural selection will reduce the frequency ofmaladapted types in the population. In quinoa, itis recommended to have more than 30,000 plantsin each generation for mass selection. At the F6generation, plants are considered to have thedesired level of homozygosity and breeders makeinflorescence selections. In the next generation,inflorescence rows are planted. Each is treated asa line and yield trials are begun.
In Bolivia, the cultivar Sajama was developedfollowing this method. In the F2 generation, allthe bitter plants were discarded. In the followinggenerations, plant vigor, seed size, compactinflorescence, and sweet seeds were the traits usedin the selection procedure (Gandarillas 1979a,1979b). Other varieties obtained by this methodare “Chucapaca,” “Huaranga,” and “KamiriRobura” (Bonifacio 2003).
Individual or pedigree selection
Individual or pedigree selection requires themaintenance of records on selected material, fromF2 to F6 or until the generation when the seed isbulked to start yield trials. Each F2 plant selectedfrom a cross is identified by the number of thecross and selection number. Inflorescence rowsare grown from each F2 plant and selection ismade among and within the F3 progeny rows.Each plant selected is identified by a number,and seeds from each plant are grown as the F4progeny. This procedure can be continued untilthe desired level of homozygosity is reached, atwhich point seeds within selected rows are bulkedand planted as new lines in yield trials.
In the F2 or F3 generation, it is advisableto select for the most heritable characterssuch as sweet seeds, color of inflorescence,and color of seeds. In the F3, F4, or moreadvanced generations, selection will be made forcharacters controlled by multiple genes. Morerecently, this method has been modified by theinflorescence-row systems.
In Bolivia, in a joint effort among thePROINPA 2002-2003, PREDUZA, andMcKnight projects, a cross with 25 diverse
102 Quinoa: Improvement and Sustainable Production
parental varieties was made to obtain 36 suc-cessful crosses that generated true F1 hybrids.The F2, F3, and F4 generations were managedusing two generations per year in a “waliplini”(semi-subterranean greenhouse). The progenieswere selected for favorable characteristics, suchas resistance to mildew, large seed size, earlymaturity, white and colored seeds, and plantvigor. Advanced generations were tested in a yieldtrial in five locations. Line L-26(85) was selectedbecause of its yield, earliness, and seed size. It wasreleased as a new variety with the name “Jach’aGrano,” which in the native language means“large seed” (http://www.proinpa.org).
Combination of individual and mass selection
A combination of individual selection and massselection can also be used in the F2 population.The combination permits the evaluation of theindividual offspring and the broadening of thegenetic base of future varieties. The varietiesobtained by this combined method are “Sayaña,”“Jilata,” “Patacamaya,” “Ratuqui,” “Jumataki,”“Intinaira,” “Surumi,” and “Santamaria”(Bonifacio 2003).
Single-seed descent
In the SSD method, the objective is to maintaina high level of heterogeneity among a largernumber of plants in a population as they arebrought rapidly toward homozygosity. The basicprocedure is to remove one or two seeds from theinflorescence of selected plants from the F2 to F6generations. In quinoa, due to the small size ofseeds and the difficulty in the initial establishmentof the plants, it is recommended to remove 5–10seeds in each plant per generation. After plantingall seeds, the most vigorous plant is chosen to beadvanced. The SSD method advances cycles inthe greenhouse and field and reduces the timeneeded to develop a new cultivar. The F7 andmore advanced generations are grown in the field,and outstanding plants are selected with farmerparticipation.
Interspecific and intergeneric crosses
Interspecific crosses (simple and reciprocal) aredone in quinoa to recombine favorable traitspresent in different species and concentrate themin the selected offspring. However, hybrid sterilityhad been observed, with fertility only restoredthrough backcrossing (Bonifacio 1995). It was alsopossible to obtain hybrids from the intergenericcross between quinoa and Atriplex hortensis, buthybrid sterility was more difficult to overcome.Another intergeneric cross between quinoa andS. foliosa showed that high level of frost and saltresistance present in Swaeda (Kauchi) may beincorporated into quinoa (Bonifacio 2003).
Backcross method
The backcross method can be used improve acultivar that is outstanding in many traits but isdeficient in certain qualitative characters. Oneexample is the work done in Bolivia, where theline 1638 (donor parent) was crossed with thecultivar “Patacamaya” (recurrent parent). Thedonor parent is an accession of the Real race, aPandela (pink) type with large bitter seeds and therecurrent parent is green in color and has sweetseeds. The resultant F1 was a Pandela (pink) typewith bitter seeds. The F1 was backcrossed to thePatacamaya cultivar, resulting in progenies thatare of a Pandela (pink) type cultivar with large,sweet seeds. Backcrossing has also been usedprimarily after cultivated and wild progenitorswere crossed to clean up the genetic backgroundof the progeny (Bonifacio 2003).
Using heterosis in quinoa
Hybrid vigor in quinoa, as observed by Wardand Johnson (1993), has generated interest inthe production of commercial hybrids. Wilson(1990) differentiated groups in quinoa, which arethe result of crosses between accessions of verydifferent origin and sources of male sterility. InColorado crossing trials, quinoas within Wilson’sdesignated groups have shown no heterosis foryield, whereas crosses between his groups have
Quinoa Breeding 103
shown heterosis varying between 201% and491% (Wilson 1990).
Mutagenesis
The advantage of nuclear techniques such asmutagenesis, compared to conventional methodssuch as hybridization and recurrent selection,is that a single or few traits can be targeted forimprovement in local or native cultivars that arealready superior in many traits. Hybridizationinvolves the recombination of parental genomebut the selection of target traits will require a largeamount of time and land. In contrast, the use ofmutagenesis to select for target traits can be fasterand with less use of land and other resources. Thefirst work on mutagenesis in quinoa was reportedin Peru (Gomez-Pando and Eguiluz-de laBarra 2013). Dry seeds of the cultivar Pasankallawere irradiated with gamma rays at doses of150, 250, and 350 Gy. In the M1 generation, thegermination process was delayed with increas-ing radiation dose, whereas seedling height, rootlength, and leaf development were mostly reducedat a dose of 250 Gy. At the 350 Gy dose, no plantssurvived. In the M2, the maximum spectrumof chlorophyll mutations corresponded to the150 Gy dose, whereas the maximum frequency ofchlorophyll mutations were at 250 Gy. The chlo-rine mutation was predominant, followed by thexanthan mutation. In both doses, changes wereobserved in branch number, pedicel length, plantheight, life-cycle duration, stem and foliage color,and leaf morphology, with overall improvementsin plant type, especially with increased vigor andyield potential. More than one mutation per plantwas found, especially at the 250 Gy. In the M3,the same spectrum of mutations was observed,along with desirable changes such as reduction inplant height. Some quinoa traditional cultivarscan reach more than 2 m, are prone to lodging,and present difficulties in harvesting. In suchcultivars, reduced plant height is desirable.Changes in seed color (from red to white) can alsobe achieved, especially to target markets wherethe white seed color is preferred (Gomez-Pandoand Eguiluz-de la Barra 2013).
Marker-assisted selection (MAS)
Modern techniques that permit the use ofmarkers linked to quantitative trait loci (QTL)in quinoa could be exploited for future culti-var improvement. In a joint effort among thePROINPA, PREDUZA, and McKnight projects,a medium-density genetic map was developed.Hundreds of single-sequence repeat (SSR) andsingle-nucleotide polymorphism (SNP) markershave been developed by scientists at the BrighamYoung University (BYU) and are being mappedto three mapping populations to produce ahigh-density genetic map for marker-assistedselection (MAS) in Bolivia. Molecular markersfor important traits such as resistance to mildew,saponin content, and seed protein content andcomposition had been mapped using these mark-ers (Maughan et al. 2004; Coles et al. 2005; Masonet al. 2005; Stevens et al. 2006; Jarvis et al. 2008;Rodriguez and Isla 2009), making it possible touse MAS in quinoa breeding programs.
CONCLUSION
Genetic improvement of the quinoa crop can beachieved by various methods such as classicalbreeding, mutagenesis, and molecular geneticstechniques to obtain outstanding genotypes.Quinoa is an underutilized crop that could be avaluable alternative crop to help the world facecritical challenges such as climatic change, foodsecurity, human nutrition, and overdependenceon a few plant species for the world food supply.
REFERENCES
Alvarez A. 1993. Evaluacion de Tecnicas de Hibridacion en elMejoramiento Genetico de la quinua (Chenopodium quinoaWilld). Mg. Sc. Thesis, Universidad Nacional Agraria LaMolina, Lima, Peru. p. 51.
Aguilar AP. 1980. Identificación de mecanismos de androester-ilidad, componentes de rendimiento y contenido proteico enquinua (Chenopodium quinoa Willd). Mg. Sc. Thesis, Univer-sidad Agraria La Molina, Lima-Peru. p. 77.
Bhargava A, Shukla S, Ohri D. Genetic variability and interre-lationship among various morphological and quality traitsin quinoa (Chenopodium quinoa Willd.). Field Crops Res2007a;101:104–116.
104 Quinoa: Improvement and Sustainable Production
Bhargava A, Shukla S, Ohri D. Gynomonoecy in Chenopodiumquinoa (Chenopodiaceae): variation in inflorescenceand floral types in some accessions. Biologia Bratislava2007b;62(1):19–23.
Bhargava A, Shuklab S, Ohrib D. Implications of direct and indi-rect selection parameters for improvement of grain yield andquality components in Chenopodium quinoa Willd. Int J PlantProd 2008;2:184–191.
Bollaert W. 1860. Antiquarian, ethnological and other researchersin New Granada, Ecuador, Peru and Chile. S.N.T: 279.
Bertero HD, King RW, Hall AJ. Photoperiod-sensitive develop-ment phases in quinoa (Chenopodium quinoa Willd.). FieldCrops Res 1999;60:231–243.
Bertero HD, de la Vega AJ, Correa G, Jacobsen SE, MujicaA. Genotype and genotype-by-environment interactioneffects for grain yield and grain size of quinoa (Chenopodiumquinoa Willd.) as revealed by pattern analysis of internationalmulti-environment trials. Field Crops Res 2004;89:299–318.
Bertero HD, Ruiz RA. Determination of seed number in sea levelquinoa (Chenopodium quinoa Willd.) cultivars. Eur J Agron2008;28(3):186–194.
Bertero HD, Ruiz RA. Reproductive partitioning in sea levelquinoa (Chenopodium quinoa Willd.) cultivars. Field CropsRes 2010;118:94–101.
Bonifacio A. 2003. Chenopodium spp.: genetic resources,ethnobotany, and geographic distribution. Food Rev Int19(1):1–7. DOI: 10.1081/FRI-120018863. Available from:10.1081/FRI-120018863.
Bonifacio A, Mujica A, Alvarez A, Roca W. Mejoramientogenético, germoplasma y producción de semilla. In: MujicaA, Jacobsen S, Izquierdo J, Marathee MP, editors. Quinua:ancestral cultivo andino, alimento del presente y futuro.Chile: FAO. UNA. CIP. Santiago; 2004. p 125–187.
Bonifacio A. 1990. Caracteres hereditarios y ligamiento factorialen la quinua (Chenopodium quinoa Willd.) Ing. Agr. Thesis,Cochabamba, Bolivia Universidad Mayor de San Simon. p.189
Bonifacio A. 1991. Materiales de aislamiento en cruzamientos dela quinua. In: Congreso Internacional sobre Cultivos Andinos,6to. Quito, Ecuador. pp. 67–68.
Bonifacio A. 1995. Interspecific and intergeneric hybridization inchenopod species. Thesis M.Sc., Provo, Utah Brigham YoungUniversity. p. 150
Bravo R, Catacora P. Granos Andinos: avances, logros y experien-cias desarrolladas en quinua. In: Bravo R, Valdivia R, AndradeK, Padulosi S, Jager M, editors. Cañihua y Kiwicha en el Perú.Ed FIDA - Bioversity International: Roma, Italia; 2010. p 136.
Bruno MC, Whitehead WT. Chenopodium cultivation and theformative period of agriculture at Chiripa, Bolivia. Latin AmAntiq 2003;14(3):339–355.
Cardenas M, Hawkes JG. Número de cromosomas de algunasplantas nativas cultivadas por los indios en los Andes. RevAgric 1948;4:30–32.
Carmen M. Acclimatization of quinoa (Chenopodium quinoaWilld.) and canihua (Chenopodium pallidicaule Aellen) toFinland. Ann Agr Fenniae 1984;23:135–144.
Cayoja MR. 1996. Caracterización de variables continuas ydiscretas del grano de quinua (Chenopodium quinoa Willd.)del banco de germoplasma de la Estación ExperimentalPatacamaya. Tesis de Lic. en Agronomía. Oruro, Bolivia,Universidad Técnica Oruro, Facultad de Agronomía. 129 p.
Ceccarelli S, Grando S, Tutweiler R, Baha J, Martini AM,Salahieh H, Goodchild A, Michael M. A methodologicalstudy on participatory barley breeding: I. selection phase.Euphytica 2000;111:91–104.
Christensen SA, Pratt DB, Pratt C, Stevens MR, Jellen EN,Coleman CE, Fairbanks DJ, Bonifacio A, Maughan PJ.Assessment of genetic diversity in the USDA and CIP-FAOinternational nursery collections of quinoa (Chenopodiumquinoa Willd.) using microsatellite markers. Plant Genet Res2007;5:82–95.
Coles ND, Coleman CE, Christensen SA, Jelle EN, Stevens MR,Bonifacio A, Rojas-Beltran JA, Fairbanks DJ, Maughan PJ.Development and use of an expressed sequenced tag library inquinoa (Chenopodium quinoa Willd.) for the discovery of singlenucleotide polymorphisms. Plant Sci 2005;168(2):439–447.
Cusack DF. Quinoa: grain of the Incas. Ecologist 1984;14:21–31.Danielsen S, Jacobsen SE, Mujica A. 2000. Susceptibilidad al
mildiu (Peronospora farinosa) y pérdida de rendimiento enocho cultivares de quinua (Chenopodium quinoa Willd). En:Resumen II Congreso Internacional de Agricultura en ZonasÁridas. Iquique, Chile. p. 59.
Duvick DN. Plant Breeding, an Evolutionary Concept. Crop Sci1996;36:539–548.
Eguiluz A, Maugham PJ, Jellen E, Gómez L. 2010. Deter-minación de la diversidad fenotipica de accesiones dequinua (Chenopodium quinoa Willd) provenientes de vallesinterandinos y del altiplano peruano. Available from:http://www.infoquinua.bo/fileponencias/.
Espindola G. 1980. Estudio de componentes directos e indirectosdel rendimiento en quinua (Chenopodium quinoa Willd.) Ing.Agr. Thesis, Cochabamba, Bolivia Universidad Mayor de SanSimon. 91 p.
FAOSTAT. 2014. http://faostat3.fao.org.Fuentes F, Martinez E, Delatorre J, Hinrichsen P, Jellen E,
Maughan PJ. 2006. Diversidad genética de germoplasmachileno de quinua (Chenopodium quinoa Willd.) usandomarcadores de microsatélites SSR. In: Estrella A, Batallas M,Peralta E and Mazón N, editors. Resúmenes XII CongresoInternacional de Cultivos Andinos. 24 al 27 de Julio de 2006.Quito, Ecuador.
Fuentes FF, Martinez EA, Hinrichsen PV, Jellen EN, MaughanPJ. Assessment of genetic diversity patterns in Chileanquinoa (Chenopodium quinoa Willd.) germplasm usingmultiplex fluorescent microsatellite markers. Conserv Genet2009;10:369–377.
Quinoa Breeding 105
Gandarillas H, Luizaga J. Numero de cromosomas deChenopodium quinoa Willd. En radículas y raicillas. Turrialba(Costa Rica) 1967;17(3):275–279.
Gandarillas H. 1968. Razas de quinua. Boletin Experimental34. La Paz, Bolivia: Ministerio de Agricultura y AsuntosCampesinos. Division de InvestigacionesAgrıcolas, Universo.p. 35.
Gandarillas H. Esterilidad genética y citoplasmática de la quinua(Chenopodium quinoa Willd.). Turrialba 1969;19:429–430.
Gandarillas H. 1974. Genetica y origen de la quinua. Ministeriode Asuntos Campesinos y Agropecuarios. Instituto Nacionaldel Trigo. La Paz, Bolivia. Boletin Informativo 9. p. 21.
Gandarillas H, Tapia M. 1976. La variedad de quinua dulceSajama. In: II Convención Internacional de Quenopodiaceas,Quinua y Cañahua. 26 – 29 abril, Potosi, Bolivia. UBTF,CDOP de Potosi, IICA. Potosi, Bolivia. p. 105.
Gandarillas H. Mejoramiento genético. In: Tapia M, editor.Quinua y Kaniwa. Cultivos Andinos. Bogotá, Colombia:Centro Internacional de Investigaciones para el Desarrollo(CIID), Instituto Interamericano de Ciencias Agricolas(IICA); 1979a. p 65–82.
Gandarillas H. Genetica y origen. In: Tapia M, editor. Quinua yKaniwa. Cultivos Andinos. Bogotá, Colombia: Centro Inter-nacional de Investigaciones para el Desarrollo (CIID), Insti-tuto Interamericano de Ciencias Agricolas (IICA); 1979b. p45–64.
Gandarillas H. 1986. Estudio anatomico de los organos de laquinua. Estudio de caracteres correlacionados y sus efectossobre el rendimiento. Hibridaciones entre especies de lasubseccion. Cellulata del Genero Chenopodium, La Paz,Bolivia. 48 p.
G ¸esinski K. Evaluation of the development and yielding potentialof Chenopodium quinoa Willd. under the climatic conditionsof Europe. In: Part two: Yielding potential of Chenopodiumquinoa under different conditions. Acta Agrobotanica2008;61(1):185–189.
Gomez-Pando L, Alvarez-Castro R, Eguiluz-de la Barra A.Effect of salt stress on Peruvian germplasm of Chenopodiumquinoa Willd.: a promising crop. J Agron Crop Sci2010;196:391–396.
Gómez L, Eguiluz A. 2011. Catalógo del Banco de Germoplasmade Quinua (Chenopodium quinoa Willd), Universidad NacionalAgraria La Molina, p. 183.
Gomez-Pando L, Eguiluz-de la Barra A. 2013. Developinggenetic variability of quinoa (Chenopodium quinoa Willd.)with gamma radiation for use in breeding programs. AmJ Plant Sci 4:349–355. doi:10.4236/ajps.2013.42046.Published Online February 2013 available from:http://www.scirp.org/journal/ajps.
Gremillion KJ. The evolution of seed morphology in domesti-cated Chenopodium: an archeological case study. J Ethnobiol1993;13(2):149–169.
House LR. El sorgo. México, Gaceta: Guía para su mejoramiento.Universidad Autónoma Chapingo; 1982. p 425.
Ichuta F, Artiaga E. 1986. Relación de géneros en la produccióny en la organización social en comunidades de Apharuni,Totoruma, Yauricani-Ilave. Informe para optar el grado deBachiller en Trabajo Social. Puno, Peru. pp. 15–17.
Ignacio J, Vera R. 1976. Observaciones sobre la intensidad defloraci{on durante las diferentes horas del día efectuadosen quinua Chenopodium quinoa Willd. Anales de la II Con-cenci{on Internacional de Quenopodiaceas quinua-cañihua.Potosi Bolibia. p. 102.
Jacobsen S, Stolen O. Quinoa - Morphology, phenology andprospects for its production as a new crop in Europe. Eur JAgron 1993;2(1):19–29.
Jacobsen SE, Quispe H, Mujica A. 2001. Quinoa: an alter-native crop for saline in the Andes. In: Scientist andFarmer – Partners in Research for the 21st Century. CIPProgram Report 1999–2000. pp. 403–408.
Jacobsen SE, Mujica A. Genetic resources and breeding of theAndean grain crop quinoa (Chenopodium quinoa Willd.). PlantGenet Res Newsl 2002;130:54–61.
Jacobsen SE, Mujica A, Jensen CR. The resistance of quinoa(Chenopodium quinoa Willd.) to adverse abiotic factors. FoodRev Int 2003;19:99–109.
Jacobsen SE, Monteros C, Christiansen JL, Bravo LA, CorcueraLJ, Mujica A. Plant responses of quinoa (Chenopodium quinoaWilld.) to frost at various phenological stages. Eur J Agron2005;22(2):131–139.
Jacobsen SE, Monteros C, Corcuera LJ, Bravo LA, Chris-tiansen JL, Mujica A. Frost resistance mechanismsin quinoa (Chenopodium quinoa Willd.). Eur J Agron2007;26(4):471–475.
Jarvis DE, Kopp OR, Jellen EN, Mallory MA, Pattee J, BonifacioA, Coleman CE, Stevens MR, Fairbanks DJ, Maughan PJ.Simple sequence repeat marker development and geneticmapping in quinoa (Chenopodium quinoa Willd.). J Genet2008;87(1):39–51.
Jennings P, Coffman W, Kauffman H. Mejoramiento de Arroz.Centro Internacional de Agricultura Tropical (CIAT). CIAT:Cali; 1981. p 237.
Johnson DL, Ward SM. Quinoa. In: Janick J, Simon JE, editors.New crops. New York: Wiley; 1993. p 219–221.
Koziol MJ. Chemical composition and nutritional value ofquinoa (Chenopodium quinoa Willd.). J Food Comp Anal1992;5:35–68.
Kumar A, Bhargava A, Shukla S, Ohri D. Screening ofexotic Chenopodium quinoa accessions for downy mildewresistance under mid-eastern conditions of India. Crop Prot2006;25:879–889.
Leon J. 1964. Plantas Alimenticias. Bol. Tecnico. No.6. InstitutoInteramericano de Ciencias Agricolas-Zona Andina, Lima,Peru. p. 112.
Leon J. 2004, 2005. Hibridación y comparación dela F1 con sus progenitores en tres cultivares dequinua (Chenopodium quinoa Willd.) en Puno, Perú.www.monografias.com/… quinua… /mejoramiento-genetico-quinua-hibrid.
106 Quinoa: Improvement and Sustainable Production
Lescano R, Palomino L. 1976. Metodologia de cruzamiento enquinua. In Segunda convención Internacional de Quenopodi-aceas. Universidad Boliviana Tomas Frias, Comité Departa-mental de Obras Publicas de Postosi, Instituto Interamericanode Ciencias Agricolas, Potosi, Bolivia, pp. 78–80.
Lescano R. 1980. Avances en la genetica de la quinua. In PrimeraReunion de Genetica y Fitomejoramiento de la Quinua.Universidad Nacional del Altiplano, Instituto Bolivianode Tecnologia Agropecuaria, Instituto Interamericano deCiencias Agricolas, Centro Internacional de Investigacionespara el Desarrollo de Puno. pp. 1–9.
Lescano JL. Mejoramiento y fisiologia de cultivos andinos. CON-CYTEC, Proyecto FEAS: Cultivos andinos en el Peru. Lima;1994. p 231.
Lumbreras LG, Kaulicke P, Santillana JI, Espinoza W. 2008.Economía Prehispanica (Tomo 1). In: Contreras C, editor.Compendio de historia economica del Peru. Banco Central deReserva del Peru. Instituto de Estudios Peruanos. pp. 53–77.
Malt SH, Mittelbach M, Rechberger GN. Tandem massspectrometric analysis of a complex triterpene saponinmixture of Chenopodium quinoa. J Am Soc Mass Spec2006;17(6):795–806.
Mason SL, Stevens MR, Jellen EN, Bonifacio A, FairbanksDJ, Coleman CE, McCarty RR, Rasmussen AG, MaughanPJ. Development and use of microsatellite markers forgermplasm characterization in quinoa (Chenopodium quinoaWilld.). Crop Sci 2005;45(4):1618–1630.
Maughan PJ, Bonifacio A, Jellen EN, Stevens MR, Coleman CE,Ricks M, Mason SL, Jarvis DE, Gardunia BW, Fairbanks DJ.A genetic linkage map of quinoa (Chenopodium quinoa) basedon AFLP, RAPD, and SSR markers. Theor Applied Genet2004;109:1188–1195.
Maughan PJ, Kolano BA, Maluszynska J, Coles ND, BonifacioA, Rojas J, Coleman CE, Stevens MR, Fairbanks DJ,Parkinson SE, Jellen EN. Molecular and cytological charac-terization of ribosomal RNA genes in Chenopodium quinoaand Chenopodium berlandieri. Genome 2006;49(7):825–839.
McElhinny E, Peralta E, Mazón N, Danial D, Thiele G, Lind-hout P. Aspects of participatory plant breeding for quinoa inmarginal areas of Ecuador. Euphytica 2007;153:373–384.
Mujica A. 1988. Parámetros genéticos e índices de selección enquinua (Chenopodium quinoa Willd.). Tesis de Doctor en Cien-cias. Colegio de Postgrado, Montecillo, México. 113 p.
Mujica A. Granos y leguminosas andinas. In: Hernandez J,Bermejo J, Leon J, editors. Cultivos marginados: otraperspectiva de 1492. Organización de la Naciones Unidaspara la Agricultura y la Alimentación FAO: Roma; 1992. p129–146.
Mujica A, Jacobsen SE. 2000. Agrobiodiversidad de las Aynokasde quinua (Chenopodium quinoa Willd.) y la seguridadalimentaria. In: Felipe-Morales C, Manrique A, editors. Proc.Seminario Taller Agrobiodiversidad en la Región Andina yAmazónica. 23–25 Noviembre 1988. Lima: NGO- CGIAR.pp. 151–156.
Mujica A, Jacobsen SE, Izquierdo J, Marathee JP. 2001. Resul-tados de la prueba americana y Europes de la quinua. FAO,UNA-Puno, CIP. p. 51.
Mujica A, Jacobsen SE. 2005. La quinua (Chenopodium quinoaWilld.) y sus parientes silvestres. In: Moraes M, ØllgaardRB, Kvist LP, Borchsenius F, Balslev H, editors. Botánicaeconómica de los Andes Centrales. La Paz: UniversidadMayor de San Andrés. pp. 449–457. Available fromhttp://www.ars-grin.gov/cgi-bin/npgs/html/tax_site_acc.pl?NC7%20Chenopodium%20quinoa.
Murray A. 2005. Chenopodium domestication in the SouthCentral Andes: confirming the presence of domesticatesat Jiskairumoko (Late Archaic-Formative), Peru. Thesis,Master of Arts in Anthropology, California State University:Fullerton. 98 p.
[NRC] National Research Council. Lost crops of the Incas. Wash-ington, DC: National Academy Press; 1989. p 414.
Nelson DC. 1968. Taxonomy and origins of Chenopodium quinoaand Chenopodium nuttalliae. Ph.D. Thesis, University of Indi-ana, Bloomington. 99 p.
Ochoa J, Peralta E. 1988. Evaluación preliminar morfológica yagronómica de 153 entradas de quinua en Santa Catalina,Pichincha. Actas del VI Congreso Internacional sobreCultivos Andinos. Quito, Ecuador. pp. 137–142.
Ochoa J, Frinking HD, Jacobs T. Postulation of virulencegroups and resistance factors in the quinoa/downymildew pathosystem using material from Ecuador. Pl Path1999;48(3):425–430.
Ortiz R, Ruiz-Tapia EN, Mujica-Sanchez A. Sampling strategyfor a core collection of Peruvian quinoa germplasm. TheorAppl Genet 1998;96:475–483.
Prakash D, Nath P, Pal M. Composition, variation of nutritionalcontents in leaves, seed protein, fat and fatty acid profile ofChenopodium species. J Sci Food Agric 1993;62:203–205.
PROINPA (http://www.proinpa.org). 2002–2003. Promocione Investigacion de Productos Andinos Foundation, [BYU]Brigham Young University, The McKnight Foundation:Sustainable production of quinoa (Chenopodium quinoaWilld.) a neglected food crop in the Andean region. Annualreport. p. 31.
Rea J. 1948. Observaciones sobre biologia floral y studio de sapon-inas en Chenopodium quinoa Willd. Ministerio de Agricul-tura. La Paz. Serie Tecnica3. p. 17.
Rea J. Biologıa floral de la quinua (Chenopodium quinoa Willd.).Turrialba 1969;19:91–96.
Repo-Carrasco R, Espinoza C, Jacobsen SE. Nutritional valueand use of the Andean crops Quinoa (Chenopodium quinoa)and Kaniwa (Chenopodium pallidicaule). Food Rev Int2003;19:179–189.
Risi J, Galwey NW. The Chenopodium grains of the Andes:Inca crops for modern agriculture. Adv Appl Biol1984;10:145–216.
Risi J. 1986. Adaptation of the Andean grain crop quinoa(Chenopodium quinoa Willd.) for cultivation in Britain. ThesisPh. D. University of Cambridge, Cambridge, Britain. 338 p.
Quinoa Breeding 107
Risi J, Galwey NW. Chenpodium grains of the Andes: a crop fortemperate latitudes. In: Wickens GE, Haq N, Day P, editors.New crops for food and industry. London: Chapman and Hall;1989. p 222–234.
Rodríguez MF, Rugolo de Agrasar ZE, Aschero CA. El uso de lasplantas en unidades domésticas del Sitio arqueológico Puntade la Peña 4, Puna Meridional Argentina. Chungara Revistade Antropología Chilena 2006;38(2):257–271.
Rodriguez LA, Isla MT. Comparative analysis of geneticand morphologic diversity among quinoa accessions(Chenopodium quinoa Willd.) of the South of Chileand highland accessions. J Plant Breeding Crop Sci2009;1(5):210–216.
Rojas W, Cayoja MR, Espindola G. Catálogo de la colección dequinua conservado en el Banco Nacional de Granos Altoandi-nos. Bolivia: La Paz; 2001. p 128.
Rojas W. Multivariate analysis of genetic diversity of Bolivianquinoa germplasm. Food Rev Int 2003;19(1–2):9–23.
Rojas W, Barriga P, Figueroa H. Multivariate analysis of geneticdiversity of Bolivian quinoa germplasm. Food Rev Int2003;19:9–23.
Rojas W, Mamani E, Pinto M, Alanoca C, Ortuño T. 2008.Identificación taxonómica de parientes silvestres de quinuadel Banco de Germoplasma de Granos Altoandinos. Revistade Agricultura Año 60, Nro. 44. Cochabamba, Bolivia. pp.56–65.
Rojas W, Pinto M, Maman E. 2009. Logro e impactos delSubsistema Granos Altoandinos, periodo 2003 – 2008.En Encuentro Nacional de Innovación Tecnológica,Agropecuaria y Forestal. INIAF. Cochabamba. 29 y 30 deJunio de 2009. pp. 58–65.
Rojas W, Pinto M, Bonifacio A, Gandarillas A. Banco de ger-moplasma de granos Andinos. In: Rojas W, Pinto M, SotoJL, Jagger M, Padulosi S, editors. Granos Andinos: avances,logros y experiencias desarrolladas en quinua, cañahua y ama-ranto en Bolivia. Bioversity International: Roma, Italia; 2010.p 24–38.
Ruiz R. 2002. Micropropagación de germoplasma de quinua(Chenopodium quinoa Willd.). Tesis Universidad NacionalAgraria La Molina. 100 p.
Ruiz-Carrasco AF, Coulibaly AK, Lizardi S, Covarrubias A, Mar-tinez EA, Molina-Montenegro MA, Biondi S, Zurita- SA.Variation in salinity tolerance of four lowland genotypes ofquinoa (Chenopodium quinoa Willd.) as assessed by growth,physiological traits, and sodium transporter gene expression.Plant Physiol Biochem 2011;49(11):133–1341.
Saravia R. 1991. La androesterilidad en quinua y forma de heren-cia. Tesis Ing. Agr., Cochabamba, Bolivia Universidad Mayorde San Simon. 139 p.
Simmonds NW. The breeding system of Chenopodium quinoa. IMale sterility. Heredity 1971;27:73–82.
Silvestri V, Gil F. Alogamia en quinua. Tasa en Mendoza(Argentina). Revista de la Facultad de Ciencias Agrarias,Universidad Nacional de Cuyo 2000;32(1):71–76.
Smith BD. Chenopodium as a prehistoric domesticate in EasternNorth America: evidence from Russelll Cave, Alabama. Sci-ence 1984;226(4671):165–167.
Stevens MR, Coleman CE, Parkinson SE, Maugham PJ, ZhangHB, Balzotti MR, Kooyman DL, Arumuganathan K,Bonifacio A, Fairbanks DJ, et al. Construction of a quinoa(Chenopodium quinoa Willd.) BAC library and its use inidentifying genes encoding seed storage proteins. TheorApplied Genet 2006;112:1593–1600.
Tapia M. Historia y distribución geográfica. In: Tapia M, editor.Quinua y Kaniwa. Cultivos Andinos. Bogotá, Colombia:Centro Internacional de Investigaciones para el Desarrollo(CIID), Instituto Interamericano de Ciencias Agricolas(IICA); 1979. p 11–19.
Tapia ME, Mujica SA, Canahua A. 1980. Origen, distribucióngeográfica y sistemas de producción en quinua. In: Primerareunión sobre genética y fitomejoramiento de la quinua.Universidad Técnica del Altiplano, Instituto Bolivianode Tecnología Agropecuaria, Instituto Interamericano deCiencias Agrícolas, Centro de Investigación Internacionalpara el Desarrollo, Puno, Peru. pp. A1–A8.
Tapia ME. 1982. El medio, los cultivos y los sistemas agrícolasen los Andes del Sur del Peru. Proyecto de Investigación delos Sistemas Agricolas Andinos, Instituto Interamericano deCiencias Agrícolas, Centro de Investigación Internacionalpara el Desarrollo, Cusco, Peru. 79 p.
Verena IA, Jacobsen SE, Shabalab S. Salt tolerance mechanismsin quinoa (Chenopodium quinoa Willd.). Env Exp Bot2013;92:43–54.
Ward SM, Johnson D. Cytoplasmic male sterility in quinoa.Euphytica 1993;66:217–223.
Ward SM. A new source of restorable cytoplasmic male sterilityin quinoa. Euphytica 1998;101(2):157–163.
Ward SM. Response to selection for reduced grain saponin con-tent in quinoa (Chenopodium quinoa Willd). Field Crop Res2000a;68(2):157–163.
Ward SM. Allotetraploid segregation for single-gene morphologi-cal characters in quinoa (Chenopodium quinoa Willd.). Euphyt-ica 2000b;116(1):11–16.
Wilson HD. Quinoa biosystematics I: domesticated populations.Econ Bot 1988;42:461–477.
Wilson HD. Crop/weed gene flow: Chenopodium quinoa Willdand C. berlandieri Moq. Theor Applied Genet 1990;86:642–648.
Wright KH, Pike OA, Fairbanks DJ, Huber CS. Composition ofAtriplex hortensis, sweet and bitter Chenopodium quinoa seeds.J Food Sci 2002;67:1383–1385.

Chapter 7
Quinoa Cytogenetics, Molecular Genetics,and Diversity
Janet B. Matanguihan1, Peter J. Maughan2, Eric N. Jellen2, and
Bozena Kolano3
1Department of Crop and Soil Sciences, Washington State University, Pullman, WA, USA2Plant and Wildlife Sciences, Brigham Young University, Provo, UT, USA3Department of Plant Anatomy and Cytology, University of Silesia, Poland
INTRODUCTION
Quinoa, Chenopodium quinoa, is the domesti-cated South American member of a complexof allotetraploid taxa (2n= 4x= 36) native tothe New World. This complex includes theweedy North American Chenopodium berlandierisubsp. berlandieri, the weedy and malodorousSouth American Chenopodium hircinum, andthe two domesticated Mesoamerican forms ofC. berlandieri subsp. nuttalliae. An additionalmember of the complex, now extinct but knownfrom archeological remains, was the domesticatedeastern North American C. berlandieri subsp.jonesianum (Smith and Yarnell 2009).
Quinoa’s importance as an internationallyexported food crop has expanded greatly withinthe past decade. As cultivation of this crop movesout of the highland Andes and relatively isolatedcoastal lowlands of central and southern Chile,there is a real danger that the crop will contractnew diseases and pick up new pests against whichit does not currently harbor genetic resistance.Consequently, existing quinoa breeding programsin the Andean region will need to pay moreattention to germplasm diversification. Emergingquinoa breeding programs in other parts of the
Quinoa: Improvement and Sustainable Production, First Edition. Edited by Kevin Murphy and Janet Matanguihan.© 2015 John Wiley & Sons, Inc. Published 2015 by John Wiley & Sons, Inc.
world, particularly in the Eastern Hemispherewhere quinoa’s close genetic cousins of the lamb-squarters complex (Chenopodium album et al.)have been widespread weeds for thousands ofyears, will need to be extra vigilant in identifyingand exploiting existing genetic variation forpest and disease resistance in C. berlandieri andother taxa cross-compatible to C. quinoa. In thischapter, we describe the cytogenetic and genomicstructure of quinoa – information that points topotentially close genetic relatives and, therefore,exploitable exotic gene sources – along with aseries of advanced, DNA-based molecular genetictools to facilitate and accelerate the transfer ofexotic genes into C. quinoa.
CYTOGENETICS AND GENOMESTRUCTURE OF CHENOPODIUM QUINOA
C. quinoa is an allotetraploid species with 2n = 4x= 36 chromosomes. Its haploid genome size (1Cvalue) has been estimated at between 1.005 and1.596 pg (Bennett and Smith 1991; Stevens et al.2006; Bhargava et al. 2007a; Palomino et al. 2008;Kolano et al. 2012a). This discrepancy in genomesize among different reports could be due either
109
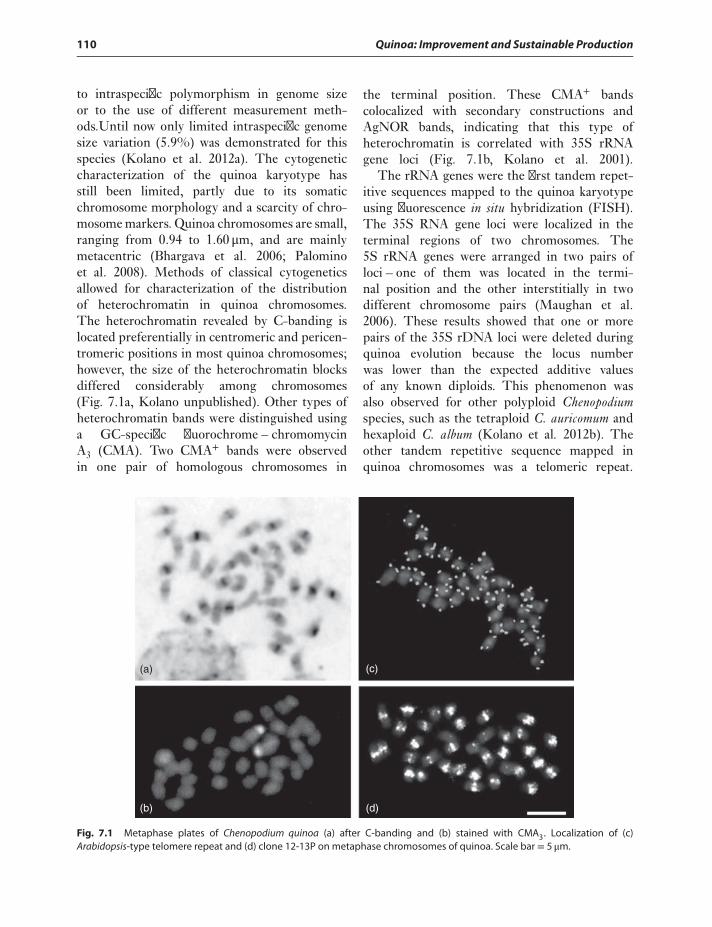
110 Quinoa: Improvement and Sustainable Production
to intraspecific polymorphism in genome sizeor to the use of different measurement meth-ods.Until now only limited intraspecific genomesize variation (5.9%) was demonstrated for thisspecies (Kolano et al. 2012a). The cytogeneticcharacterization of the quinoa karyotype hasstill been limited, partly due to its somaticchromosome morphology and a scarcity of chro-mosome markers. Quinoa chromosomes are small,ranging from 0.94 to 1.60 μm, and are mainlymetacentric (Bhargava et al. 2006; Palominoet al. 2008). Methods of classical cytogeneticsallowed for characterization of the distributionof heterochromatin in quinoa chromosomes.The heterochromatin revealed by C-banding islocated preferentially in centromeric and pericen-tromeric positions in most quinoa chromosomes;however, the size of the heterochromatin blocksdiffered considerably among chromosomes(Fig. 7.1a, Kolano unpublished). Other types ofheterochromatin bands were distinguished usinga GC-specific fluorochrome – chromomycinA3 (CMA). Two CMA+ bands were observedin one pair of homologous chromosomes in
the terminal position. These CMA+ bandscolocalized with secondary constructions andAgNOR bands, indicating that this type ofheterochromatin is correlated with 35S rRNAgene loci (Fig. 7.1b, Kolano et al. 2001).
The rRNA genes were the first tandem repet-itive sequences mapped to the quinoa karyotypeusing fluorescence in situ hybridization (FISH).The 35S RNA gene loci were localized in theterminal regions of two chromosomes. The5S rRNA genes were arranged in two pairs ofloci – one of them was located in the termi-nal position and the other interstitially in twodifferent chromosome pairs (Maughan et al.2006). These results showed that one or morepairs of the 35S rDNA loci were deleted duringquinoa evolution because the locus numberwas lower than the expected additive valuesof any known diploids. This phenomenon wasalso observed for other polyploid Chenopodiumspecies, such as the tetraploid C. auricomum andhexaploid C. album (Kolano et al. 2012b). Theother tandem repetitive sequence mapped inquinoa chromosomes was a telomeric repeat.
(a)
(b) (d)
(c)
Fig. 7.1 Metaphase plates of Chenopodium quinoa (a) after C-banding and (b) stained with CMA3. Localization of (c)Arabidopsis-type telomere repeat and (d) clone 12-13P on metaphase chromosomes of quinoa. Scale bar = 5 μm.
Quinoa Cytogenetics, Molecular Genetics, and Diversity 111
Quinoa has an Arabidopsis-type telomere repeatlocated exclusively in the terminal positionin each chromosome arm (Fig. 7.1c, Kolanounpublished). Centromeric and pericentromericlocalization in quinoa chromosomes was iden-tified for clone 12-13P (Fig. 7.1d, Kolano et al.2011). This repetitive sequence showed partialhomology to satellite DNA (pBC1447) detectednear the centromere of Beta corolliflora chromo-somes (Gao et al. 2000). Hybridization signals of12-13P were observed in each chromosome of C.quinoa; however, the intensity of the FISH signalsdiffered considerably among chromosomes indi-cating that varying numbers of 12-13P repeats arepresent at each locus. The pattern observed on C.quinoa chromosomes after FISH with 12-13P wasvery similar to C-banding results, suggesting thatthe 12-13P sequence constituted a major part ofthe heterochromatin of C. quinoa (Kolano et al.2011). The 12-13P sequence also hybridized tocentromeric and pericentromeric chromosomalregions of related North American tetraploidC. berlandieri as well as European accessionsof hexaploid C. album; however, the intensityof hybridization signals was somewhat lower(Kolano et al. 2011).
The second group of repetitive DNA, whichare dispersed repetitive sequences, comprisemainly mobile elements (retrotransposons andDNA transposons). Kolano et al. (2013) ana-lyzed the chromosomal distribution of reversetranscriptase-coding fragments of LTR retro-transposons and discovered that both Ty1-copiaand Ty3-gypsy retrotransposons were preferen-tially located in pericentromeric heterochromatinof quinoa chromosomes. Apart from retro-transposons, dispersed distribution in quinoachromosomes was demonstrated for two repet-itive sequences (pTaq10 and 24-18J) withouthomology to mobile elements. The first sequence,pTaq10, hybridized across the quinoa genome,without a specific chromosome or subgenomedistribution pattern (Kolano et al. 2008a). In con-trast, the second dispersed repetitive sequence,24-18J, hybridized primarily to one subgenome(18 chromosomes) of quinoa (Kolano et al. 2011).A similar hybridization pattern was observed forC. berlandieri, which supports the hypothesis that
C. berlandieri and C. quinoa are descended fromat least one common diploid ancestor (Maughanet al. 2006). Both C. berlandieri and C. quinoashare the A-genome (Chenopodium standleyanum)and the B-genome (Chenopodium ficifolium, OldWorld). After allopolyploid speciation of C.quinoa and C. berlandieri, at least one of theancestral subgenomes experienced loss of the35S rRNA gene locus. Comparison of the chro-mosomal distributions of 18–24J homologousand rDNA sequences revealed that in quinoaand C. berlandieri, rRNA gene loci were retainedin the subgenome to which 18–24J abundantlyhybridized (Kolano et al. 2011). As probe 18-24Jalso abundantly hybridized to metaphase chromo-somes of a diploid form of Eurasian C. album, aswell as to one of the subgenomes in allohexaploidC. album, we conclude that this subgenomeoriginated in the Eastern Hemisphere (Kolanoet al. 2011).
Another item of interest with respect to quinoacytogenetics is that C. quinoa is a polysomaticplant (Kolano et al. 2008b). Polysomaty isthe occurrence of cells with different ploidylevels in the same organ or tissue (Joubesand Chevalier 2000). During quinoa seedlingdevelopment, endopolyploid cells (cells withmore than the 4C DNA value) were observedin roots, hypocotyls, and in young cotyledons.Its tissues comprised a mixture of cells withDNA content ranging from 2 to 16 C in varyingproportions and the polysomaty patterns cor-responded to the developmental stage and theindividual organ. Endopolyploidization was notpresent in nuclei from leaves and the shoot apex(Kolano et al. 2008b).
CROSSABILITY OF QUINOA AND ALLIEDTETRAPLOID TAXA
The New World allotetraploid “quinoacomplex” consists of three taxa that arecross-compatible – C. berlandieri, C. hircinum,and C. quinoa. This is an important observationbecause the extensive geographical distributionof weedy C. berlandieri, from Alaska and theCanadian Maritimes in the north to Mesoamerica
112 Quinoa: Improvement and Sustainable Production
and perhaps the northern Andes in the south,suggests that this taxon possesses a wealth ofgenetic diversity, including novel pest and diseaseresistance genes (Jellen, personal observations).Similarly, the native range of C. hircinum in SouthAmerica extends across the temperate and sub-tropical lowlands of the Argentinian pampas, anarea in which it has been in contact with invasiveEurasian pests and pathogens since the period ofthe Spanish Conquest. Heiser and Nelson (1974)first reported that quinoa×Mexican huauzontle(C. berlandieri subsp. nuttalliae) domesticatedhybrids were fertile; interestingly, the hybridshad dark seed, unlike either parent. Wilson(1980) again reported that quinoa×weedy C.berlandieri and quinoa× huauzontle hybrids werefertile. Wilson and Manhart (1993) providedisozyme-based evidence that >30% of the off-spring of C. berlandieri plants surrounding quinoafields in the Pacific Northwest carried allelestransferred sexually from quinoa; these hybridswere also partially fertile and displayed heteroticphenotypic effects.
At Brigham Young University (BYU), we arecurrently analyzing F3 plants derived from a crossbetween a large-seeded weedy C. berlandieri var.macrocalycium (BYU 803, from Maine) and high-land quinoa cv. “Ingapirca.” The F2 generationplants were highly diverse and phenotypicallyvigorous, though between 10% and 30% hadvarying degrees of pollen sterility, presumablydue to summer greenhouse heat stress. In total,19 of the 115 F2 plants displayed phenotypicevidence of hybrid breakdown, including leafwhorling, abnormal coloration, or dwarfing. Allof the recovered seed had the wild, black-pericarptrait from BYU 803 (Jellen unpublished). Morerecent DNA sequence evidence, however, sug-gests that C. berlandieri var. macrocalycium is arelatively distant member of the allotetraploidcomplex and may have a different origin or at leastintrogression from a different diploid species(Jellen and Walsh unpublished).
With respect to crossability between the NewWorld allotetraploid complex and Eurasian-originC. album, Wilson (1981) failed to detect transferof isozyme marker alleles from C. hircinum tosympatric populations of allohexaploid C. album.
Consequently, as quinoa begins to be cultivatedmore extensively in areas of the world wherelambsquarters is a common weed, transfer ofexotic alleles into the quinoa crop from thissource is probably not going to be an issue, nordoes C. album appear to be a promising source ofbreeding alleles to improve quinoa’s biotic stressresistance.
DNA SEQUENCE EVIDENCE FOR QUINOA’SGENOMIC ORIGINS
Maughan et al. (2006) sequenced portions of 35SrRNA gene NOR intergenic spacer (IGS) and 5SrRNA gene nontranscribed spacer (NTS) regionsfrom five cultivars of C. quinoa and a weedyaccession of C. berlandieri. They also performedFISH on metaphase chromosome preparationsof both species along with domesticated C.berlandieri subsp. nuttalliae to verify locus copynumbers. While subsp. nuttalliae had either oneor two 35S loci – presumably, the ancestral locusnumber in an allotetraploid – both the weedyaccession and C. quinoa carried only a singlelocus. However, for 5S, the subsp. nuttalliaegenotypes carried three loci, whereas C. quinoaand weedy C. berlandieri had only two. DNAsequencing experiments identified two NTSsequence variants in C. quinoa – apparently,from each of the two loci – one of which wasalmost an exact match (196/200 bases) with thesequence of the weedy C. berlandieri clone. Theother NTS sequence was much more divergent(158/200 bases). The IGS region was moredivergent among five varieties of quinoa and asingle weedy C. berlandieri; the latter possesseddifferent numbers of B, C, and H subrepeats thanthe former, while the five quinoa varieties variedmostly for SNPs. These combined observationssuggest that ancestors of quinoa and the weedyaccession of C. berlandieri lost different 35S loci;this hypothesis could be tested by sequencing thetwo IGS loci in subsp. nuttalliae.
Another gene studied extensively is Salt OverlySensitive 1 (SOS1), which encodes a plasmalemmaNa+/H+ antiporter protein (Shi et al. 2000).The two full-length genomic orthologs from
Quinoa Cytogenetics, Molecular Genetics, and Diversity 113
quinoa were previously cloned and sequenced(Maughan et al. 2009a) and introns 16 and 17 wereselected for further phylogenetic study. Extensivesequencing of introns 16 and 17 of SOS1 in anumber of cultivated and weedy Chenopodium taxaand quinoa cultivars at the 2x, 4x, and 6x ploidylevels has confirmed the Eurasian and New Worldorigins of the two constituent subgenomes of C.quinoa, C. berlandieri, and C. hircinum (Walshet al. manuscript in preparation). The New Worldsubgenome is now referred to as “AA” and theEurasian subgenome as “BB.” These studieshave also pointed to a North American origin ofthe allotetraploid, followed by dispersion – mostlikely as a wild or weedy ecotype – to SouthAmerica (C. hircinum), with domestication eventsoccurring on both continents.
QUINOA GENETIC MARKERS ANDLINKAGE MAPS
The recent awareness of the importance of quinoain food security of the Andean region as wellas a growing export health food market hasled to the establishment of several new quinoabreeding programs. In addition to germplasmmanagement, principal objectives of these pro-grams include enhancing grain yield, earliness,disease resistance, drought tolerance, and modu-lating saponin content (Ochoa et al. 1999). Theseprograms recognize that the development anduse of molecular markers is critical to meetingthese objectives (Bonifacio, PROINPA personalcommunication).
Marker-assisted selection methods, includ-ing association mapping applied directly tobreeding populations (Kraakman et al. 2004;Crossa et al. 2007) and genomic selection(Jannink et al. 2010; Windhausen et al. 2012),are quickly becoming the commercial standardfor enhancing breeding efficiency (Eathingtonet al. 2007; Moose and Mumm 2008). Key tothese enhanced breeding methodologies is easyaccess to numerous, inexpensive, reliable, andeasily scored genetic markers. Unfortunately,few researchers have reported the developmentand use of molecular markers in quinoa. Wilson
(1988a) reported the development of the firstset of allozyme markers, whereas Fairbankset al. (1990) identified the first seed proteinsvariants within the USDA quinoa germplasmcollection. Ruas et al. (1999) reported the use ofrandomly amplified polymorphic DNA (RAPD)markers to detect DNA polymorphisms amongseveral C. quinoa cultivars and Chenopodium weedspecies. Maughan et al. (2004) used amplifiedfragment length polymorphism (AFLP) markersto generate the first low-resolution linkage map ofquinoa. Unfortunately, all of these markers havehad only limited utility in breeding programs,due at least in part to the inherent problems ofcost, reproducibility, and technology transfer ofthese types of markers, especially to laboratoriesin the developing world where resources arelimiting.
In an attempt to make quinoa marker technol-ogy more widely available, Mason et al. (2005)and Jarvis et al. (2008) developed the first largesets (>400) of microsatellite (also termed simplesequence repeats or SSRs) markers for quinoa.Jarvis et al. (2008) also reported the first quinoalinkage genetic map consisting primarily ofmicrosatellite markers. This early map was com-posed of 38 linkage groups (n= 18) and coveredjust over 900 cM. Microsatellite loci consistof short tandemly repeated nucleotide motifsflanked by conserved sequences (Tautz 1989).Polymorphism is detected as variation in thenumber of repeat units among individuals usingstandard polymerase chain reaction (PCR) tech-niques (Weber and May 1989). Microsatellitesare multiallelic and generally more informative,based on polymorphic information content(PIC) values, than RAPD or AFLP markers(Powell et al. 1996). Microsatellite loci, whileubiquitous in eukaryotic genomes (approximately1 microsatellite per 33 kb in plants; Chawla 2000),are not the most abundant marker type.
Single nucleotide polymorphisms (SNPs) arethe most abundant type of DNA polymorphismfound in eukaryotic genomes (Garg et al. 1999;Batley et al. 2003) and are the marker of choice inmarker-assisted plant breeding programs (Batleyand Edwards 2007; Eathington et al. 2007). Thehigh frequency of SNPs in plant genomes is
114 Quinoa: Improvement and Sustainable Production
well documented (Russell et al. 2004; Ossowskiet al. 2008), with actual SNP densities rangingdramatically depending on the species type(auto- or allogamous), number and geneticdiversity of the cultivars being assessed, andwhether coding or noncoding regions are beingconsidered. For example, in soybean [Glycinemax (L.) Merr.], SNPs occur at a frequencyof 1 per 2038 bp in coding sequence and 1 per191 bp in noncoding sequence (Van et al. 2005),whereas in maize (Zea mays L.), 1 SNP wasobserved per 124 bp of coding sequence and 1per 31 bp in noncoding regions (Ching et al.2002). In quinoa, Coles et al. (2005) identified 38single-base changes and 13 insertions–deletions(indels) in 20 EST sequences analyzed acrossfive quinoa accessions, suggesting an average of1 SNP per 462 bases and 1 indel per 1812 bases.The high frequency of SNPs in most speciesoffers the possibility of constructing extremelydense genetic maps that are particularly valu-able for map-based gene cloning efforts andhaplotype-based association studies.
Several technical methods have been reportedfor the initial discovery of SNPs in plant genomes,specifically (i) EST sequencing (Barbazuk et al.2007); (ii) targeted amplicon resequencing(Bundock et al. 2009); (iii) gene space rese-quencing with methylation-sensitive digestion(Gore et al. 2009; Deschamps et al. 2010); and(iv) genomic reduction based on restriction siteconservation (Maughan et al. 2009b). Whencombined with next-generation DNA sequencingtechnologies, these methods can be used toidentify large numbers of SNPs with limitedtechnical expertise and at minimal cost. SNPs canthen be cost-effectively genotyped using severalnext-generation technologies, including beadarrays (Shen et al. 2005), nano-fluidic devices(Wang et al. 2009), and genotyping by sequencing(Miller et al. 2007; Maughan et al. 2010; Elshireet al. 2011). In 2012, Maughan et al. reported theuse of a reduced representation protocol and geno-typing by sequencing to identify >14,000 putativeSNPs in five bi-parental quinoa populations.Transition mutations (A/G or C/T) were themost numerous, outnumbering transversions(A/T, C/A, G/C, G/T) by 1.6× margin,
which was in accordance with the observationthat transition SNPs are the most frequentSNP type reported in both plant and ani-mal genomes and are thought to result fromhypermutability effects of CpG dinucleotidesites and deamination of methylated cytosines(Zhang and Zhao 2004; Morton et al. 2006).Maughan et al. (2012) converted 511 of theputative SNP into functional SNP assays.A diversity screen of 113 quinoa accessions usingthese 511 SNPs clearly revealed the two majorquinoa subgroups corresponding to the Andeanand coastal quinoa ecotypes (Maughan et al.2012). Minor allele frequency of the SNPs rangedfrom 0.02 to 0.50, with an average MAF of 0.28.Linkage mapping of the SNPs in two recombi-nant inbred line populations (KU-2× 0654 andNL-6× 0654) produced an integrated linkagemap consisting of 29 linkage groups with 20large linkage groups, spanning 1,404 cM with amarker density of 3.1 cM per SNP marker. Thefunctional SNP assays were developed usingKBioscience KASPar™ genotyping chemistrydetected using a Fluidigm integrated fluidicchip (Fig. 7.2). The combination of the KASParchemistry with the nano-fluidic chip technology(9.7 nL reaction volume) not only significantlyreduces the marker data point genotyping costs(∼US$0.05) but also significantly increases thespeed of genotyping. Indeed, a single Fluidigm96.96 IFC is capable of producing 9216 PCRs ina single run (∼3 h) with little technical expertise.
Given the dramatic decrease in costs andrelative ease of genotyping, we anticipate thedevelopment of fully saturated genetic maps ofquinoa within 12–18 months. These maps shouldquickly open up the possibility to integratemarker-assisted selection protocols, specificallygenomic selection, into accelerated quinoa breed-ing programs. However, before genomic selectioncan be fully realized, quinoa breeders must iden-tify a “training population” of quinoa accessionsand develop rigorous phenotyping strategies.The training population will need to be bothfully genotyped and phenotyped to develop thestatistical models necessary to estimate breedingvalues of genomic regions (Jannink et al. 2010).
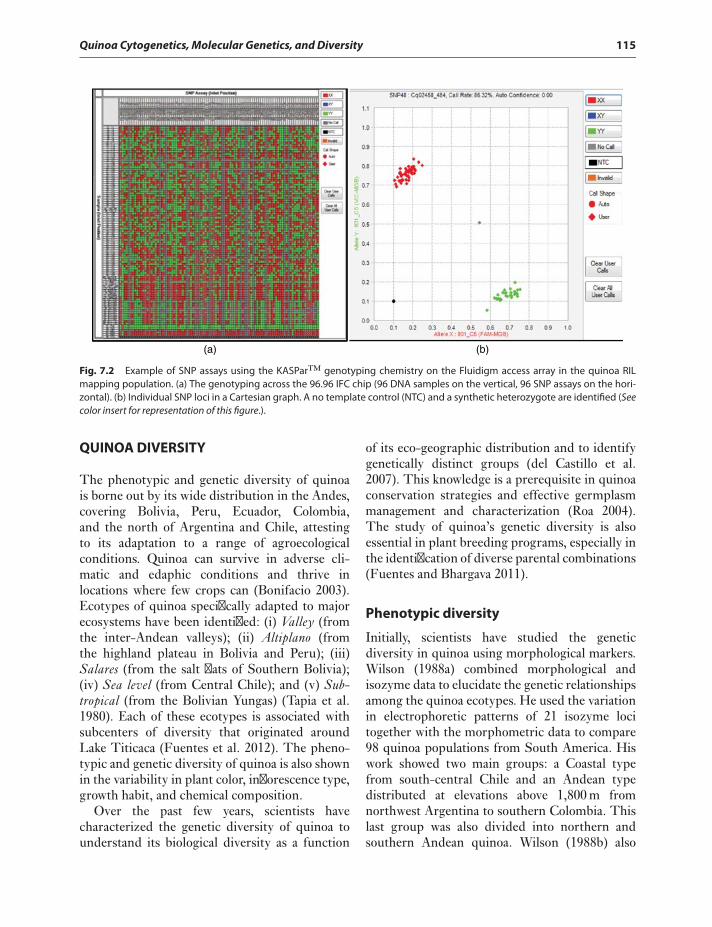
Quinoa Cytogenetics, Molecular Genetics, and Diversity 115
(a) (b)
Fig. 7.2 Example of SNP assays using the KASPar™ genotyping chemistry on the Fluidigm access array in the quinoa RILmapping population. (a) The genotyping across the 96.96 IFC chip (96 DNA samples on the vertical, 96 SNP assays on the hori-zontal). (b) Individual SNP loci in a Cartesian graph. A no template control (NTC) and a synthetic heterozygote are identified (Seecolor insert for representation of this figure.).
QUINOA DIVERSITY
The phenotypic and genetic diversity of quinoais borne out by its wide distribution in the Andes,covering Bolivia, Peru, Ecuador, Colombia,and the north of Argentina and Chile, attestingto its adaptation to a range of agroecologicalconditions. Quinoa can survive in adverse cli-matic and edaphic conditions and thrive inlocations where few crops can (Bonifacio 2003).Ecotypes of quinoa specifically adapted to majorecosystems have been identified: (i) Valley (fromthe inter-Andean valleys); (ii) Altiplano (fromthe highland plateau in Bolivia and Peru); (iii)Salares (from the salt flats of Southern Bolivia);(iv) Sea level (from Central Chile); and (v) Sub-tropical (from the Bolivian Yungas) (Tapia et al.1980). Each of these ecotypes is associated withsubcenters of diversity that originated aroundLake Titicaca (Fuentes et al. 2012). The pheno-typic and genetic diversity of quinoa is also shownin the variability in plant color, inflorescence type,growth habit, and chemical composition.
Over the past few years, scientists havecharacterized the genetic diversity of quinoa tounderstand its biological diversity as a function
of its eco-geographic distribution and to identifygenetically distinct groups (del Castillo et al.2007). This knowledge is a prerequisite in quinoaconservation strategies and effective germplasmmanagement and characterization (Roa 2004).The study of quinoa’s genetic diversity is alsoessential in plant breeding programs, especially inthe identification of diverse parental combinations(Fuentes and Bhargava 2011).
Phenotypic diversity
Initially, scientists have studied the geneticdiversity in quinoa using morphological markers.Wilson (1988a) combined morphological andisozyme data to elucidate the genetic relationshipsamong the quinoa ecotypes. He used the variationin electrophoretic patterns of 21 isozyme locitogether with the morphometric data to compare98 quinoa populations from South America. Hiswork showed two main groups: a Coastal typefrom south-central Chile and an Andean typedistributed at elevations above 1,800 m fromnorthwest Argentina to southern Colombia. Thislast group was also divided into northern andsouthern Andean quinoa. Wilson (1988b) also
116 Quinoa: Improvement and Sustainable Production
constructed the first phylogenetic tree of theChenopodium species and his data supportedthe hypothesis that the Altiplano was the centerof origin and diversity of quinoa. A follow-upstudy, conducted using seed protein variationand morphological markers (Fairbanks et al.1990), confirmed Wilson’s initial conclusion(Jellen et al. 2011).
Ortiz et al. (1998) demonstrated that eightphenotypic descriptors can be used to derive acore collection of 103 accessions (10%) from apool of 1,029 accessions from the Peruvian quinoagermplasm bank at the Universidad National delAltiplano-Puno (UNAP). The core collectionrepresents most of the genetic diversity of thewhole collection, with a high correlation observedbetween quantitative trait variation and altitude.The authors recommend that a comprehensivequinoa core collection should also include acces-sions from Bolivian, Ecuador, and Chile, togetherwith cross-compatible, wild Chenopodium speciessympatric with cultivated quinoa.
Rojas et al. (2000) used morphological traitsand agronomic performance of 1,512 acces-sions of the Bolivian national quinoa collectionto analyze genetic diversity. Genotypes werecollected in Chile, Argentina, and Peru, aswell as native Bolivian materials. Using threemultivariate procedures, including principalcomponent, cluster, and discriminate functionanalyses, quinoa germplasm was classified intoseven distinct groups, including five within theAltiplano and two from lower altitude valleys ofthe eastern Andean mountain range. The traitsused in the study did not discriminate for theChilean lowland germplasm, which grouped withone of the Altiplano clusters.
More recently, Bhargava et al. (2007b) usedmorphological and quality traits to investi-gate genetic diversity in C. quinoa germplasm.Twenty-nine lines of C. quinoa and two lines of C.berlandieri subsp. nuttalliae were evaluated for 12morphological and 7 quality traits. Cluster anal-ysis and principal component analysis conductedfor the 19 traits revealed a high level of geneticvariability existing in the lines tested. Althoughcluster analysis grouped those lines with greatergenetic similarity, it did not group those lines
from the same origin, indicating heterogeneity oflines within a geographical region. The authorssuggested that heterogeneity, genetic architectureof population, history of selection, and/or devel-opmental traits could account for this populationdiversity within a geographical region. In anotherstudy, Bhargava et al. (2007c) used morphologicaland qualitative traits to analyze the degree of sim-ilarity/dissimilarity among 27 diverse germplasmlines of C. quinoa in the Indian subcontinent.These traits were discussed in relation to theirutility for plant breeding efforts.
Fuentes and Bhargava (2011) presented thefirst report on quinoa germplasm grown underlowland desert conditions. A total of 11 mor-phological descriptors were used on 28 quinoaaccessions collected from the northern highlandsof Chile, and cluster analysis classified the acces-sions into 6 discrete groups. Multivariate analysiselucidated the genetic relationships among theaccessions, with yield being the most importantdescriptor for discriminating the accessionsused. Significantly, Chilean quinoa under desertconditions did not show particularly extremevalues for any of the variables measured.
Curti et al. (2012) characterized 34 quinoapopulations from the northwest Argentina regionusing quantitative and qualitative phenotypictraits. Northwest Argentina represents the south-ern end of what is known as the C. quinoa Andeancomplex. Quinoa is considered marginal in termsof its cultivation in this region. Curti et al. (2012)analyzed the data using descriptive and multivari-ate techniques. On the basis of quantitative traits,both the principal component analysis and thecluster analysis differentiated between accessionsfrom the highlands, transition zone, centraldry valleys, and eastern valleys. On the otherhand, the principal coordinates analysis based onqualitative traits only discriminated accessionsfrom transition zone and eastern valleys. Theaccessions from the highlands and dry valleyspresented the more advanced domesticated traits,whereas accessions from transition zone andeastern valleys showed traits more similar towild-type-related Chenopods from the Andeanregion. This is the first phenotypic diversitystudy of accessions from Northwest Argentina.
Quinoa Cytogenetics, Molecular Genetics, and Diversity 117
Genetic diversity
With the development of molecular markers, thegenetic diversity of quinoa germplasm collectionshas been studied, as well as the genetic diversityof quinoa populations, for both cultivated andwild/weedy populations. Molecular markersprovide unique and effective tools for evaluatingand characterizing plant genetic diversity ina way that is unaffected by the environment(Gupta and Varshney 2000). Random amplifiedpolymorphic DNA (RAPD) markers were thefirst markers used to detect DNA polymorphismsamong different quinoa accessions (Fairbankset al. 1993). RAPDs have also been used toidentify true hybrids from intergeneric crosses(Bonifacio 1995). The genetic relationshipsamong 19 Chenopodium species were investigatedby Ruas et al. (1999) using RAPD markers. TheChenopodium species used in the study includedC. quinoa cultivars and weed species. Polymor-phisms were detected among these species butaccessions clustered according to their speciesclassifications. Wild and crop populations of C.quinoa shared a low level of molecular varia-tion, without differentiation between sympatricdomesticated and weedy populations, and lowlevels of intraspecific variation within accessions(Ruas et al. 1999).
In contrast to the study of Ruas et al. (1999)and del Castillo et al. (2007) studied the geneticdiversity and relationships among wild andcultivated populations of quinoa collected directlyfrom farmer’s fields. Ruas et al. (1999) comparedaccessions, whereas del Castillo et al. (2007)compared individuals of the cultivated and wildforms of quinoa, growing sympatrically withincultivated fields. del Castillo et al. (2007) sampledfrom three distinct regions of the altiplano andone inter-Andean valley in Bolivia. Using RAPDmarkers, the wild and cultivated populationsshow a significant but very low level of globaldifferentiation. However, there was a stronggenetic differentiation among the eight popula-tions in the study, with a strong correlation withthe regional ecogeography. The population struc-ture appears related to three major biogeographiczones: (i) the northern and central altiplano, (ii)
the interandean valley, and (iii) the southern Salar.A small proportion of the variation was explainedby geographical distance.
Aside from RAPD markers, AFLP markershave also been used to study genetic diversityin quinoa. Anabalón Rodríguez and ThometIsla (2009) used AFLP markers together with20 morphological descriptors to characterize14 accessions of quinoa located in the southof Chile, and also highland accessions. Theselocal, ancestral varieties are usually conservedand selected by Mapuche communities andother smallholder farmers, passed down throughthe generations. Also included in the study arethree varieties from the Tarapacá region and oneenrolled variety (Regalona-Baer), with C. albumand Chenopodium ambrosioides as the controls.The accessions clustered into two groups: (i)the coastal type, which included accessions fromthe north of Chile, and highland accessions, and(ii) the pre-cordillera accessions. The resultsare in accordance with previous morphologicaland isozyme studies, which separate quinoainto two types: a coastal type (Chile) and anAndean plateau type. This study indicates thatthe Chilean lowland germplasm could be moregenetically diverse than previously thought.The authors explained that this level of geneticdiversity could also be due to out-crossingwith the weedy populations of C. album andC. hircinum, coupled with the ancestral seedexchange system and selection due to edaphocli-matic and photoperiod factors. This work alsocomplements the work of Ruas (1999) in thatthe C. album and C. ambrosioides accessions werealso differentiated from the C. quinoa accessions.However, with the use of AFLP markers, one C.album accession was grouped together with oneC. ambrosioides accession (Anabalón Rodríguezand Thomet Isla 2009), whereas with the use ofRAPD markers, the C. album and the C. ambro-sioides accessions were placed in different groups(Ruas et al. 1999).
More recent studies have utilized microsatel-lites or SSR because these are frequentlycodominant, multi-allelic, highly reproducible,polymorphic, ubiquitous and widely distributedin the plant genome (Bhargava and Fuentes
118 Quinoa: Improvement and Sustainable Production
2010). Christensen et al. (2007) used 35 ofthe first SSR markers developed to assess thelevel of genetic diversity in quinoa germplasmcollections. A total of 152 accessions from theUSDA and CIP-FAO collections were used in thestudy, including accessions from Peru, Bolivia,Ecuador, Argentina, and Chile. Results show thatthe accessions clustered into two main groups:one group included accessions from the lowlandsof Chile together with a set of USDA accessions,whereas the other group consisted of accessionsfrom the Andean highlands of Peru, Bolivia,Ecuador, Argentina, and extreme northeasternChile.
Using multiplex fluorescent SSR markers,Fuentes et al. (2009) studied the genetic diversitypatterns of 59 accessions from the northern andsouthern regions of Chile. These accessionswere classified as Altiplano (28) and coastal (31)ecotypes. Both cluster analysis (UPGMA) andprincipal component analysis separated the acces-sions into two discrete groups. The first groupcomprised quinoa accessions from the north(Andean highlands), whereas the second groupconsisted of accessions from the south (lowland orcoastal). Coastal quinoas showed more diversitythan Chilean highland quinoas using both clusterand principal component analysis. The coastalgroup showed continuous variation betweenextreme subgroups represented. Their resultsare in contrast with those of del Castillo et al.(2007), which showed that Chilean accessions,as representatives of coastal quinoas, were notgenetically diverse from the highland populationsof Peru and Bolivia.
Fuentes et al. (2012) examined the correlationof seed exchanges on the genetic diversity ofquinoa in Chile. In total, 34 quinoa accessionsrepresentative of Chile, 20 SSR markers, and 92field interviews were used in their study. Resultsshowed that a wide genetic diversity exists inquinoa grown along the main growing areas inChile. The accessions were classified into twomajor groups, and further subdivided into fivepopulations. Population I has nine accessionsrepresentative of the northern zone of Chile;Population II has seven accessions of the centralzone; Population III has nine accessions from
the southern zone and one from the centralzone; Population IV has six accessions from thehighlands of Peru, Bolivia, and Argentina; andPopulation V had two accessions, one each fromEcuador and Colombia. The genetic distancesamong populations were consistent with theirgeographic origin. Thus, quinoa populations withthe lowest genetic distances between them werePopulations I and IV (highlands) and II and III(lowlands). This grouping correlated well withthe geographic origins of the accessions, togetherwith edaphic and climatic conditions of theirorigin. This grouping also correlated with theexpansion of quinoa and is a genetic reflectionof the sociolinguistic context of ancient peopleinhabiting the Andes region.
Costa Tártara et al. (2012) studied the geneticstructure of cultivated quinoa in NorthwestArgentina, a region that has been underrepre-sented in germplasm collections and previousstudies. Aside from being underrepresented,Northwest Argentina is also the southernextreme of quinoa distribution within the CentralAndes. The authors used 22 SSR markers on35 accessions, which showed a high level ofgenetic diversity. Cluster analysis separatedthe populations into four distinct groups; thegroupings were consistent with the geographicorigin of the accessions. The first group consistedof 5 accessions from the Transition area thatis characterized by high altitudes, whereas thesecond group consisted of 12 accessions fromPuna, the highland Plateau. The third groupconsisted of 8 accessions from Eastern humidvalleys, and the fourth group consisted of 10accessions from the dry valleys. Even though theNorthwest Argentina is considered marginal interms of quinoa cultivation, high levels of geneticdiversity was still found in the accessions used.This genetic differentiation could be related toregional ecogeography and is also affected by theuse of landraces.
SUMMARY
A better understanding of quinoa genetic diversityhas been gleaned from all the studies discussed
Quinoa Cytogenetics, Molecular Genetics, and Diversity 119
earlier. First, the wide range of environments inwhich quinoa can grow has a direct influence onits genetic diversity. Over a long period of time,the adaptation of quinoa to extremely dissimilarclimatic conditions may have contributed to itswide genetic diversity (Costa Tártara et al. 2012).Phenotypic and genetic diversity studies haveshown that quinoa accessions are most oftenclustered according to their geographic origin,indicating that genetic variability has a spatialstructure and distribution (Risi and Galwey1989a, 1989b; Ortiz et al. 1998; Rojas 2003; delCastillo et al. 2007; Costa Tártara et al. 2012;Curti et al. 2012). The effect of populationisolation on genetic diversity was linked not onlyto geographical distance but also to climatic andorographic barriers (del Castillo et al. 2007).Furthermore, the congruence between geneticdifferentiation and ecogeography suggests thatquinoa all over the southern Andes may be under-going similar processes of genetic differentiationand that variation in quinoa ecotypes may beinfluenced significantly by gradients of frost andaridity (Curti et al. 2012).
The use of more informative molecular mark-ers has made it possible to elucidate the geneticdiversity of quinoa accessions. In their study,Christensen et al. (2007) suggested that theArgentinean accessions represent introductionsfrom both the southern Bolivian highlandsand the Chilean lowlands. A later study, usingmorphological data, also proposed that the mainintroductions of quinoa to Argentina came fromsouthern Bolivia (Curti et al. 2012). On the otherhand, instead of the Chilean lowlands, it is theChilean highlands that could be the alternativeroute for quinoa introduction to Argentina (Curtiet al. 2012). In Southern Chile, the high geneticdiversity of coastal/lowland ecotypes has beeninvestigated using dominant AFLP markers(Anabalón Rodríguez and Thomet Isla 2009)and codominant SSR markers (Fuentes et al.2009; Fuentes et al. 2012). These studies showedthat Chilean lowland germplasm is much moregenetically diverse than previously thought. Thishigh genetic diversity could be due to the contin-uous hybridization with relatives that coexist inthe field (Fuentes et al. 2009), active crop/weed
complexes having a monophyletic coevolvingbehavior (Rana et al. 2010). Christensen et al.(2007) also reported diversity data that were moreconsistent with an allogamous system rather thanan autogamous one.
Genetic events, such as genetic drift, geneticbottlenecks, and founder effects, have beenillustrated by genetic diversity studies in quinoa.Quinoa may have been domesticated twice – oncein the High Andes and a second time in theChilean lowlands (Christensen et al. 2007;Fuentes et al. 2009). This Chilean domesticationevent is a genetic bottleneck (Jellen et al. 2011).Fuentes et al. (2012) showed a fragmented patternof diversity between the central zone and thesouthern zone of Chile, corresponding with theisolation of quinoa farmers. The average het-erozygosity and proportion of polymorphic lociin the central zone of Chile were lower than thatfor the southern zone. This indicates a subpatternof geographic bottleneck within lowland/coastalquinoa. The reduction in genetic diversity levelsin the northern highland and coastal lowlandregions compared to the southern highlandregions near Lake Titicaca could be a result offounder effects associated with the dispersal ofthe crop from its center of origin; alternatively, itcould be a response to selective adaptation in themore uniform ecological regions of the northernhighlands and coastal lowlands (Christensen et al.2007). The diffusion of quinoa into NorthwestArgentina from the centers of origin and diversitycould also have been mediated by foundingevents associated with early dispersal fromthe central Andean region of Peru and Bolivia(Curti et al. 2012).
Human activities, specifically seed exchanges,have significantly affected the genetic diversity ofquinoa. The influence of ancient exchange routesaffecting germplasm distribution contributes tothe genetic structure of quinoa (Costa Tartara2012). As the earliest societies along the Andeanrange tested new soils and climates, the geneticdiversity of quinoa probably evolved throughcycles of seed exchange and the domesticationprocess (Fuentes et al. 2012). It has been shownthrough genetic data and farmer interviews thatgenetic population structure can be reinforced
120 Quinoa: Improvement and Sustainable Production
by seed exchanges among farmers (del Castilloet al. 2007). Genetic relationships within quinoapopulations have revealed the influence of variousproduction systems on quinoa biodiversity. Thus,studies of genetic diversity in quinoa must belinked with sociological and agronomic studies(Fuentes et al. 2012).
The results of genetic diversity studies inquinoa has implications in our conservationefforts and, consequently, on our plant breedingprograms. Since the 1960s, ex situ germplasmbanks of quinoa have been established (Bonifacio2003). However, some ecological zones are stillinadequately represented in these gene banks,such as the northern Andes (especially Ecuadorand Colombia), the Yungas (eastern slopes ofthe Bolivian and Peruvian Andes) (Christensenet al. 2007), and Argentina (Mujica and Jacobsen2002). In areas such as Northwest Argentina,where it has been shown that phenotypic andgenetic diversity is structured according to thesite of origin (Curti et al. 2012; Costa Tártaraet al. 2012), conservation programs shouldcarefully consider the areas to be preserved. Also,some accessions in the USDA and the CIP-FAOcollections could be heterogeneous lines of mixedgenotypes as multiple alleles at marker loci havebeen detected. Accessions should be screened andpurified before use in plant breeding programs(Christensen et al. 2007). Germplasm collectionsshould also be replenished (Mujica and Jacobsen2002). Meanwhile, in situ germplasm banks arefound in specific ecological environments ofthe Andean region. The conservators of thesequinoa landraces are farmers of the indigenouspopulation (Bonifacio 2003). As the pattern ofgenetic diversity in ex situ collections does notnecessarily reflect the extant genetic structureof in situ landraces, caution must be taken whenextrapolating the results of studies using ex situaccessions to in situ collections (del Castillo et al.2007). Armed with the knowledge of quinoadiversity in a particular region, the challengethen for plant breeders is to preserve the geneticdiversity so that quinoa could still adapt tostressful environments, while achieving a level ofhomogeneity required for commercial production(Curti et al. 2012).
REFERENCES
Anabalón Rodríguez L, Thomet Isla M. Comparative analysis ofgenetic and morphologic diversity among quinoa accessions(Chenopodium quinoa Willd.) of the South of Chile and high-land accessions. J Plant Breeding Crop Sci 2009;1:210–216.
Barbazuk WB, Emrich SJ, Chen HD, Li L, Schnable PS.SNP discovery via 454 transcriptome sequencing. Plant J2007;51:910–918.
Batley J, Barker G, O’sullivan H, Edwards KJ, Edwards D.Mining for single nucleotide polymorphisms and inser-tions/deletions in maize expressed sequence tag data. PlantPhysiol 2003;132:84–91.
Batley J, Edwards D. SNP applications in plants. In: OraguzieNC, Rikkerink EHA, Gardeiner SE, de Silva HN, editors.Association mapping in plants. New York: Springer; 2007. p95–102.
Bennett MD, Smith JB. Nuclear-DNA amounts inangiosperms. Phil Trans Royal Soc London SeriesB-Biol Sci 1991;334:309–345.
Bhargava A, Shukla S, Ohri D. Karyotypic studies on some cul-tivated and wild species of Chenopodium (Chenopodiaceae).Genet Resour Crop Evol 2006;57:1309–1320.
Bhargava A, Shukla S, Ohri D. Genome size variation in somecultivated and wild species of Chenopodium (Chenopodiaceae).Caryologia 2007a;60:245–250.
Bhargava A, Shukla S, Rajan S, Ohri S. Genetic diversity for mor-phological and quality traits in quinoa (Chenopodium quinoaWilld.) germplasm. Genet Res Crop Evol 2007b;54:167–173.
Bhargava A, Shukla S, Ohri D. Genetic variability and interre-lationship among various morphological and quality traitsin quinoa (Chenopodium quinoa Willd.). Field Crops Res2007c;101:104–116.
Bhargava A, Fuentes FF. Mutational dynamics of microsatellites.Mol Biotech 2010;44:250–266.
Bonifacio A. 1995. Interspecific and intergeneric hybridizationin chenopod species. MS Thesis, Brigham Young University,Provo, UT, USA.
Bonifacio A. Chenopodium sp.: Genetic resources, ethnobotany,and geographic distribution. Food Rev Int 2003;19:1–7.
Bundock PC, Eliott FG, Ablett G, Benson AD, Casu RE, AitkenKS, Henry RJ. Targeted single nucleotide polymorphism(SNP) discovery in a highly polyploid plant species using 454sequencing. Plant Biotech J 2009;7:347–354.
Chawla HS. Introduction to Plant Biotechnology. Enfield, NH:Science Publishers Inc.; 2000.
Ching A, Caldwell K, Jung M, Dolan M, Smith O, Tingey S,Morgante M, Rafalski A. SNP frequency, haplotype structureand linkage disequilibrium in elite maize inbred lines. BMCGenet 2002;3:19.
Christensen SA, Pratt DB, Pratt C, Nelson PT, StevensMR, Jellen EN, Coleman CE, Fairbanks DJ, Bonifacio A,Maughan PJ. Assessment of genetic diversity in the USDAand CIP-FAO international nursery collections of quinoa(Chenopodium quinoa Willd.) using microsatellite markers.
Quinoa Cytogenetics, Molecular Genetics, and Diversity 121
Plant Genetic Resources: Characterization and Utilization2007;5:82–95.
Coles ND, Coleman CE, Christensen SA, Jellen EN, StevensMR, Bonifacio A, Rojas-Beltran JA, Fairbanks DJ, MaughanPJ. Development and use of an expressed sequenced taglibrary in quinoa (Chenopodium quinoa Willd.) for thediscovery of single nucleotide polymorphisms. Plant Sci2005;168:439–447.
Costa Tártara SM, Manifesto MM, Bramardi SJ, Bertero HD.Genetic structure in cultivated quinoa (Chenopodium quinoaWilld.), a reflection of landscape structure in NorthwestArgentina. Conserv Genet 2012;13:1027–1038.
Crossa J, Burgueno J, Dreisigacker S, Vargas M, Herrera-FoesselSA, Lillemo M, Singh RP, Trethowan R, Warburton M,Franco J, et al. Association analysis of historical bread wheatgermplasm using additive genetic covariance of relatives andpopulation structure. Genetics 2007;177:1889–1913.
Curti RN, Andrade AJ, Bramardi S, Velásquez B, Bertero HD.Ecogeographic structure of phenotypic diversity in cultivatedpopulations of quinoa from Northwest Argentina. Ann ApplBiol 2012;160:114–125.
del Castillo C, Winkel T, Mahy G, Bizoux JP. Genetic structureof quinoa (Chenopodium quinoa Willd.) from the Bolivian alti-plano as revealed by RAPD markers. Genet Res Crop Evol2007;54:897–905.
Deschamps SP, La Rota M, Ratashak JP, Biddle P, Thureen D,Farmer A, Luck S, Beatty M, Nagasawa N, Michael L, et al.Rapid genome-wide single nucleotide polymorphism discov-ery in soybean and rice via deep resequencing of reduced rep-resentation libraries with the illumina genome analyzer. PlantGenome 2010;3:53–68.
Eathington SR, Crosbie TM, Edwards MD, Reiter R, Bull JK.Molecular markers in a commercial breeding program. CropSci 2007;47:S154–S163.
Elshire RJ, Glaubitz JC, Sun Q, Poland JA, Kawamoto K, BucklerES, Mitchell SE. A robust, simple genotyping-by-sequencing(GBS) approach for high diversity species. PLoS One2011;6:e19379.
Fairbanks DJ, Burgener KW, Robison LR, Andersen WR, BallonE. Electrophoretic characterization of quinoa seed proteins.Plant Breeding 1990;104:190–195.
Fairbanks DJ, Waldrigues DF, Ruas CF, Ruas RM, Maughan PJ,Robinson LR, Andersen WR, Riede CR, Panley CS, CaetanoLG, Arantes OMN, Fungaro MH, Vidotto MC, JankeviciusSE. Efficient characterization of biological diversity usingfield DNA extraction and RAPD markers. Braz J Genet1993;16:11–33.
Fuentes FF, Martinez EA, Hinrichsen VP, Jellen EN, MaughanPJ. Assessment of genetic diversity patterns in Chileanquinoa (Chenopodium quinoa Willd.) germplasm usingmultiplex fluorescent microsatellite markers. Conserv Genet2009;10:369–377.
Fuentes FF, Bhargava A. Morphological analysis of quinoagermplasm grown under lowland desert conditions. J AgronCrop Sci 2011;197:124–134.
Fuentes FF, Bazile D, Bhargava A, Martinez EA. Implicationsof farmers’ seed exchanges for on-farm conservation ofquinoa, as revealed by its genetic diversity in Chile. J AgricSci 2012;150:702–716.
Gao D, Schmidt T, Jung C. Molecular characterization andchromosomal distribution of species-specific repetitive DNAsequences from Beta corolliflora, a wild relative of sugar beet.Genome 2000;43:1073–1080.
Garg K, Green P, Nickerson DA. Identification of candidatecoding region single nucleotide polymorphisms in 165 humangenes using assembled expressed sequence tags. Genome Res1999;9:1087–1092.
Gore MA, Wright MH, Ersoz ES, Bouffard P, Szekeres ES, JarvieTP, Hurwitz BL, Narechania A, Harkins TT, Grills GS, et al.Large-scale discovery of gene-enriched SNPs. Plant Genome2009;2:121–133.
Gupta PK, Varshney RK. The development and use ofmicrosatellite markers for genetic analysis and plant breedingwith emphasis on bread wheat. Euphytica 2000;113:163–185.
Heiser CB, Nelson DC. On the origin of the cultivated chenopods(Chenopodium). Genetics 1974;78:503–505.
Jannink JL, Lorenz AJ, Iwata H. Genomic selection in plantbreeding: From theory to practice. Brief Funct Genomics2010;9:166–177.
Jarvis DE, Kopp OR, Jellen EN, Mallory MA, Pattee J, BonifacioA, Coleman CE, Stevens MR, Fairbanks DJ, Maughan PJ.Simple sequence repeat marker development and geneticmapping in quinoa (Chenopodium quinoa willd.). J Genet2008;87:39–51.
Jellen EN, Kolano BA, Sederberg MC, Bonifacio A, Maughan PJ.2011. Chenopodium. In: Kole C, editor. Wild crop relatives:genomic and breeding resources. Berlin: Springer. pp. 35-61.
Joubes J, Chevalier C. Endoreduplication in higher plants. PlantMol Biol 2000;43:735–745.
Kolano B, Gomez Pando L, Maluszynska J. Molecular cytoge-netic studies in Chenopodium quinoa and Amaranthus caudatus.Acta Societatis Botanicorum Poloniae 2001;70:85–90.
Kolano B, Plucienniczak A, Kwasniewski M, Maluszynska J.Chromosomal localization of a novel repetitive sequencein the Chenopodium quinoa genome. J Applied Genet2008a;49:313–320.
Kolano B, Siwinska D, Maluszynska J. Endopolyploidy patternsduring development of Chenopodium quinoa. Acta Biol CracovBot 2008b;51:85–92.
Kolano B, Gardunia BW, Michalska M, Bonifacio A, FairbanksDJ, Maughan PJ, Coleman CE, Stevens MR, Jellen EN,Maluszynska J. Chromosomal localization of two novelrepetitive sequences isolated from the Chenopodium quinoaWilld. genome. Genome 2011;54:710–717.
Kolano B, Siwinska D, Gomez Pando L, Szymanowska-Pulka J,Maluszynska J. Genome size variation in Chenopodium quinoa(Chenopodiaceae). Plant Syst Evol 2012a;298:251–255.
Kolano B, Tomczak H, Molewska R, Jellen EN, MaluszynskaJ. Distribution of 5S and 35S rRNA gene sites in 34
122 Quinoa: Improvement and Sustainable Production
Chenopodium species (Amaranthaceae). Bot J of the LinneanSoc 2012b;170:220–231.
Kolano B, Bednara E, Weiss-Schneeweiss H. 2013. Isolation andcharacterization of reverse transcriptase fragments of LTRretrotransposons from the genome of Chenopodium quinoa(Amaranthaceae). Plant Cell Reports 32: 1575–1588
Kraakman AT, Niks RE, Van Den Berg PM, Stam P, VanEeuwijk FA. Linkage disequilibrium mapping of yield andyield stability in modern spring barley cultivars. Genetics2004;168:435–446.
Mason SL, Stevens MR, Jellen EN, Bonifacio A, FairbanksDJ, Coleman CE, Mccarty RR, Rasmussen AG, MaughanPJ. Development and use of microsatellite markers forgermplasm characterization in quinoa (Chenopodium quinoawilld.). Crop Sci 2005;45:1618–1630.
Maughan PJ, Bonifacio A, Jellen EN, Stevens MR, Coleman CE,Ricks M, Mason SL, Jarvis DE, Gardunia BW, FairbanksDJ. A genetic linkage map of quinoa (Chenopodium quinoa)based on AFLP, RAPD, and SSR markers. Theor ApplGenet 2004;109:1188–1195.
Maughan PJ, Kolano BA, Maluszynska J, Coles ND, BonifacioA, Rojas J, Coleman CE, Stevens MR, Fairbanks DJ,Parkinson SE, Jellen EN. Molecular and cytological charac-terization of ribosomal RNA genes in Chenopodium quinoaand Chenopodium berlandieri. Genome 2006;49:825–839.
Maughan PJ, Turner TB, Coleman CE, Elzinga DB, JellenEN, Morales JA, Udall JA, Fairbanks DJ, Bonifacio A.Characterization of Salt Overly Sensitive 1 (SOS1) genehomoeologs in quinoa (Chenopodium quinoa willd.). Genome2009a;52:647–657.
Maughan PJ, Yourstone SM, Jellen EN, Udall JA. SNP discoveryvia genomic reduction, barcoding and 454-pyrosequencing inamaranth. Plant Genome 2009b;2:260–270.
Maughan PJ, Yourstone SM, Byers RL, Smith SM, Udall JA.SNP genotyping in mapping populations via genomic reduc-tion and next-generation sequencing: Proof-of-concept. PlantGenome 2010;3:166–178.
Maughan PJ, Smith SM, Rojas-Beltran JA, Elzinga D, RaneyJA, Jellen EN, Bonifacio A, Udall JA, Fairbanks DJ.Single nucleotide polymorphism identification, charac-terization, and linkage mapping in quinoa. Plant Genome2012;5:114–125.
Miller MR, Dunham JP, Amores A, Cresko WA, Johnson EA.Rapid and cost-effective polymorphism identification andgenotyping using restriction site associated DNA (RAD)markers. Genome Res 2007;17:240–248.
Moose SP, Mumm RH. Molecular plant breeding as thefoundation for 21st century crop improvement. Plant Physiol2008;147:969–977.
Morton BR, Bi IV, Mcmullen MD, Gaut BS. Variation inmutation dynamics across the maize genome as a functionof regional and flanking base composition. Genetics2006;172:569–577.
Mujica A, Jacobsen S-E. Genetic resources and breeding of theAndean grain crop quinoa (Chenopodium quinoa Willd).PGR Newsl 2002;130:54–61.
Ochoa J, Frinking HD, Jacobs T. Postulation of virulencegroups and resistance factors in the quinoa/downy mildewpathosystem using material from Ecuador. Plant Pathol1999;48:425–430.
Ortiz R, Ruiz-Tapia EN, Mujica-Sanchez A. Sampling strategyfor a core collection of Peruvian quinoa germplasm. TheorAppl Genet 1998;96:475–483.
Ossowski S, Schneeberger K, Clark RM, Lanz C, WarthmannN, Weigel D. Sequencing of natural strains of Arabidopsisthaliana with short reads. Genome Res 2008;18:2024–2033.
Palomino G, Hernandez LT, Torres ED. Nuclear genome sizeand chromosome analysis in Chenopodium quinoa and C.berlandieri subsp. nuttalliae. Euphytica 2008;164:221–230.
Powell W, Morgante M, Andre C, Hanafey M, Vogel J, Tingey S,Rafalski A. The comparison of RFLP, RAPD, AFLP, and SSR(microsatellite) markers for germplasm analysis. Mol Breed-ing 1996;2:225–238.
Rana TS, Narzary D, Ohri D. Genetic diversity and relationshipsamong some wild and cultivated species of Chenopodium L.(Amaranthaceae) using RAPD and DAMD methods. Curr Sci2010;98:840–846.
Risi JC, Galwey NW. The pattern of genetic diversity inthe Andean grain crop quinoa (Chenopodium quinoaWilld.) I. Associations between characteristics. Euphytica1989a;41:147–162.
Risi JC, Galwey NW. The pattern of genetic diversity in theAndean grain crop quinoa (Chenopodium quinoa Willd.) II.Multivariate methods. Euphytica 1989b;41:135–145.
Roa NK. Plant genetic resources: advancing conservation and usethrough biotechnology. African J Biotech 2004;3:136–145.
Rojas W, Barriga P, Figueroa H. Multivariate analysis of thegenetic diversity of Bolivian quinua germplasm. Plant GenetRes Newsl 2000;122:16–23.
Rojas W. Multivariate analysis of genetic diversity of Bolivianquinoa germplasm. Food Rev Int 2003;19:9–23.
Ruas PM, Bonifacio A, Ruas CF, Fairbanks DJ, Andersen WR.Genetic relationship among 19 accessions of six species ofChenopodium L., by random amplified polymorphic DNAfragments (RAPD). Euphytica 1999;105:25–32.
Russell J, Booth A, Fuller J, Harrower B, Hedley P, MachrayG, Powell W. A comparison of sequence-based polymorphismand haplotype content in transcribed and anonymous regionsof the barley genome. Genome 2004;47:389–398.
Shen R, Fan JB, Campbell D, Chang WH, Chen J, DoucetD, Yeakley J, Bibikova M, Garcia EW, Mcbride C, et al.High-throughput SNP genotyping on universal beadarrays. Mutation Res-Fundamental Mol Mech Mutagenesis2005;573:70–82.
Shi H, Ishitani M, Kim C, Zhu J-K. The Arabidopsis thaliana salttolerance gene SOS1 encodes a putative Na+/H+ antiporter.Proc Natl Acad Sci U S A 2000;97:6896–6901.
Quinoa Cytogenetics, Molecular Genetics, and Diversity 123
Smith BD, Yarnell RA. Initial formation of an indigenous cropcomplex in eastern North America at 3800 B.P. Proc NatlAcad Sci U S A 2009;106:6561–6566.
Stevens MR, Coleman CE, Parkinson SE, Maughan PJ, ZhangHB, Balzotti MR, Kooyman DL, Arumuganathan K, Bonifa-cio A, Fairbanks DJ, Jellen EN, Stevens JJ. Construction of aquinoa (Chenopodium quinoa Willd.) BAC library and its use inidentifying genes encoding seed storage proteins. Theor ApplGenet 2006;112:1593–1600.
Tapia ME, Mujica SA, Canahua A. Orígen, distribución geográ-fica, y sistemas de producción en quinua. In: Primera reunionsobre genetica y fitomejoramiento de la quinua. Puno:Universidad Nacional Técnica del Altiplano (UNTA),Instituto Boliviano de Technologia Agropecuaria (IBTA),Instituto Interamericana de Ciencias Agricolas (IICA),Centro de Investigación Internacional para el Desarollo;1980. p A1–A8.
Tautz D. Hypervariability of simple sequences as a generalsource for polymorphic DNA markers. Nucleic Acids Res1989;17:6463–6471.
Van K, Hwang EY, Kim MY, Park HJ, Lee SH, Cregan PB.Discovery of SNPs in soybean genotypes frequently used asthe parents of mapping populations in the United States andKorea. J Hered 2005;96:529–535.
Walsh BM, Adhikary D, Maughan PJ, Emshwiller E, Jellen EN.Chenopodium (Amaranthaceae) polyploidy inferences fromSOS1 data. Manuscript in preparation.
Wang J, Lin M, Crenshaw A, Hutchinson A, Hicks B, YeagerM, Berndt S, Huang WY, Hayes RB, Chanock SJ, et al.2009. High-throughput single nucleotide polymorphism
genotyping using nanofluidic dynamic arrays. BMCGenomics 10:561. doi:10.1186/1471-2164-10-561. Availablefrom http://www.biomedcentral.com/content/pdf/1471-2164-10-561.pdf
Weber J, May PE. Abundant class of human DNA polymorphismswhich can be typed using the polymerase chain reaction. AmJ Hum Genet 1989;44:388–396.
Wilson HD. Domesticated Chenopodium of the Ozark Bluffdwellers. Econ Bot 1980;35:233–239.
Wilson HD. Genetic variation among tetraploid Chenopodiumpopulations of southern South America (sect. Chenopodiumsubsect. Cellulata). Syst Bot 1981;6:380–398.
Wilson HD. Allozyme variation and morphological relation-ships of Chenopodium hircinum (s.1.). Syst Bot 1988a;13:215–228.
Wilson HD. Quinoa biosystematics I: domesticated populations.Econ Bot 1988b;42:461–477.
Wilson HD, Manhart J. Crop/weed gene flow: Chenopodiumquinoa Willd. and C. berlandieri Moq. Theor Appl Genet1993;86:642–648.
Windhausen VS, Atlin GN, Hickey JM, Crossa J, Jannink JL,Sorrells ME, Raman B, Cairns JE, Tarekegne A, SemagnK, et al. Effectiveness of genomic prediction of maizehybrid performance in different breeding populations andenvironments. G3 (Bethesda) 2012;2:1427–1436.
Zhang F, Zhao Z. The influence of neighboring-nucleotidecomposition on single nucleotide polymorphisms (SNPs) inthe mouse genome and its comparison with human SNPs.Genomics 2004;84:785.

Chapter 8
Ex Situ Conservation of Quinoa:The Bolivian Experience
Wilfredo Rojas and Milton PintoPROINPA Foundation, Av. Elias Meneces km 4, El Paso, Cochabamba, Bolivia
INTRODUCTION
During the past four decades, germplasm collec-tions maintained ex situ have grown in numberand size as a result of the intense worldwideefforts to conserve plant genetic resources forfood and agriculture (PGRFA). These collectionsare kept under very different conditions, depend-ing on policies at the national or internationallevel, the institutional environment, availableexpertise, facilities and budget, and the degree ofnational and international collaboration (Engelsand Visser 2003). According to the second reporton the state of the art of PGRFA (FAO 2010), thetotal number of samples stored ex situ worldwidehas increased by approximately 20% (1.4 million)since 1996, reaching a total of 7.4 million samples.This growth in quantity and diversity of samplesover a range of germplasm requires that collec-tions be managed with the highest standards ofconservation.
Genebanks are essential for the food securityand sovereignty of every nation. They are part ofa nation’s ancestral and cultural heritage, and assuch are a responsibility that should be assumedby society and the state. Toward this goal, conser-vation of genetic resources requires institutionalsupport, including sustained financing, trainedstaff with specialized expertise and essential
Quinoa: Improvement and Sustainable Production, First Edition. Edited by Kevin Murphy and Janet Matanguihan.© 2015 John Wiley & Sons, Inc. Published 2015 by John Wiley & Sons, Inc.
equipment needed to maintain germplasmcollections and conduct conservation activities.
However, the mere creation of a genebank doesnot guarantee the conservation of plant geneticresources of a country, as shown by the first andsecond reports on the state of the art of PGRFAin the world (FAO 1996, 2010). Increasingly,more attention is paid as to how and when toregenerate germplasm from a collection, becauseof the increasing costs of germplasm maintenanceand regeneration (Engels and Visser 2003). Thereis also the possibility that, in time, genetic erosionoccurs in a bank that is improperly managed.The economics of genebank management andoperation is implicit in all conservation efforts.It does not merely consist of assigning budgetsto specific operations of the bank, but is relatedto internal decision making on the expendituresof the institution. These are crucial decisions,constituting a more important issue, becausethose who initially support its implementationcontinuously demand improvements in theregistration of its operations.
In the absence of good planning, genebankmanagement can develop and evolve in manyways. In addition, local germplasm conditionsvary greatly, calling for several managementapproaches and producing a diversity of expe-riences. In developing countries, conservationissues and technological advancements are not
125
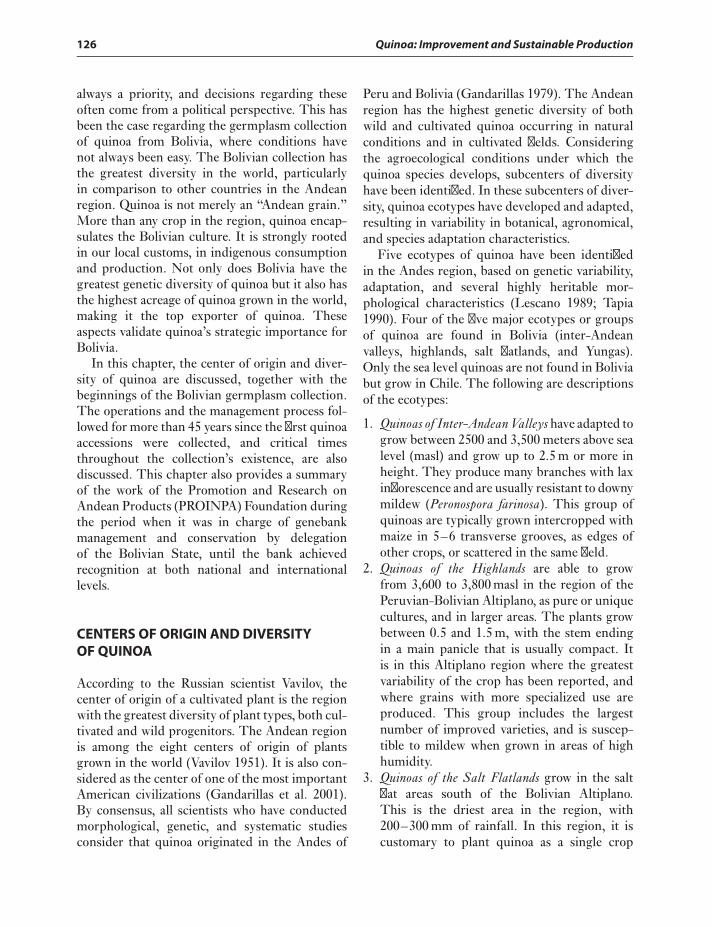
126 Quinoa: Improvement and Sustainable Production
always a priority, and decisions regarding theseoften come from a political perspective. This hasbeen the case regarding the germplasm collectionof quinoa from Bolivia, where conditions havenot always been easy. The Bolivian collection hasthe greatest diversity in the world, particularlyin comparison to other countries in the Andeanregion. Quinoa is not merely an “Andean grain.”More than any crop in the region, quinoa encap-sulates the Bolivian culture. It is strongly rootedin our local customs, in indigenous consumptionand production. Not only does Bolivia have thegreatest genetic diversity of quinoa but it also hasthe highest acreage of quinoa grown in the world,making it the top exporter of quinoa. Theseaspects validate quinoa’s strategic importance forBolivia.
In this chapter, the center of origin and diver-sity of quinoa are discussed, together with thebeginnings of the Bolivian germplasm collection.The operations and the management process fol-lowed for more than 45 years since the first quinoaaccessions were collected, and critical timesthroughout the collection’s existence, are alsodiscussed. This chapter also provides a summaryof the work of the Promotion and Research onAndean Products (PROINPA) Foundation duringthe period when it was in charge of genebankmanagement and conservation by delegationof the Bolivian State, until the bank achievedrecognition at both national and internationallevels.
CENTERS OF ORIGIN AND DIVERSITYOF QUINOA
According to the Russian scientist Vavilov, thecenter of origin of a cultivated plant is the regionwith the greatest diversity of plant types, both cul-tivated and wild progenitors. The Andean regionis among the eight centers of origin of plantsgrown in the world (Vavilov 1951). It is also con-sidered as the center of one of the most importantAmerican civilizations (Gandarillas et al. 2001).By consensus, all scientists who have conductedmorphological, genetic, and systematic studiesconsider that quinoa originated in the Andes of
Peru and Bolivia (Gandarillas 1979). The Andeanregion has the highest genetic diversity of bothwild and cultivated quinoa occurring in naturalconditions and in cultivated fields. Consideringthe agroecological conditions under which thequinoa species develops, subcenters of diversityhave been identified. In these subcenters of diver-sity, quinoa ecotypes have developed and adapted,resulting in variability in botanical, agronomical,and species adaptation characteristics.
Five ecotypes of quinoa have been identifiedin the Andes region, based on genetic variability,adaptation, and several highly heritable mor-phological characteristics (Lescano 1989; Tapia1990). Four of the five major ecotypes or groupsof quinoa are found in Bolivia (inter-Andeanvalleys, highlands, salt flatlands, and Yungas).Only the sea level quinoas are not found in Boliviabut grow in Chile. The following are descriptionsof the ecotypes:
1. Quinoas of Inter-Andean Valleys have adapted togrow between 2500 and 3,500 meters above sealevel (masl) and grow up to 2.5 m or more inheight. They produce many branches with laxinflorescence and are usually resistant to downymildew (Peronospora farinosa). This group ofquinoas are typically grown intercropped withmaize in 5–6 transverse grooves, as edges ofother crops, or scattered in the same field.
2. Quinoas of the Highlands are able to growfrom 3,600 to 3,800 masl in the region of thePeruvian-Bolivian Altiplano, as pure or uniquecultures, and in larger areas. The plants growbetween 0.5 and 1.5 m, with the stem endingin a main panicle that is usually compact. Itis in this Altiplano region where the greatestvariability of the crop has been reported, andwhere grains with more specialized use areproduced. This group includes the largestnumber of improved varieties, and is suscep-tible to mildew when grown in areas of highhumidity.
3. Quinoas of the Salt Flatlands grow in the saltflat areas south of the Bolivian Altiplano.This is the driest area in the region, with200–300 mm of rainfall. In this region, it iscustomary to plant quinoa as a single crop
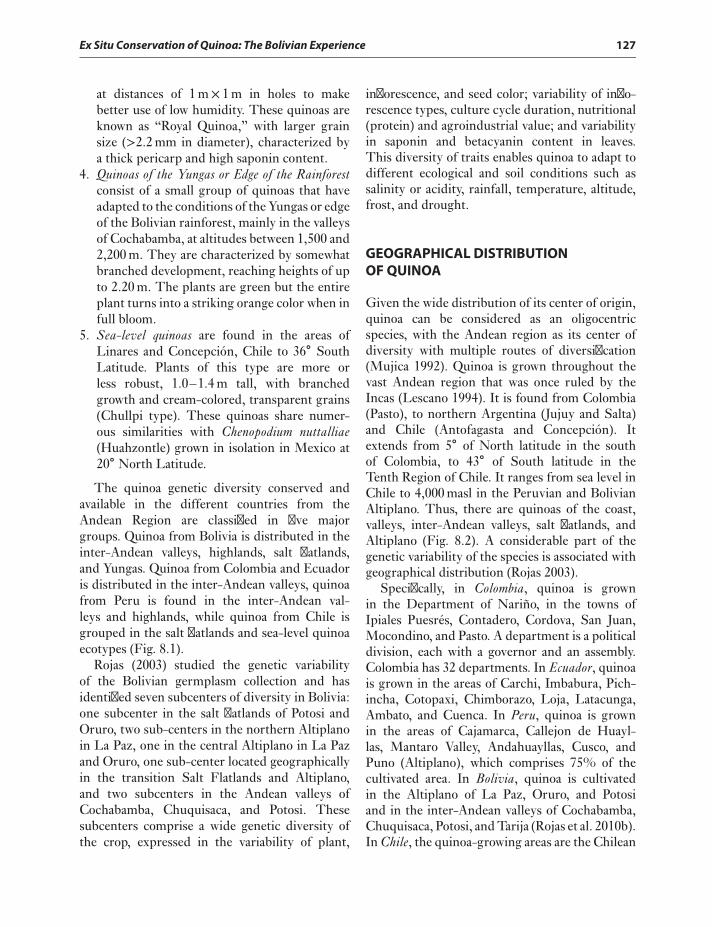
Ex Situ Conservation of Quinoa: The Bolivian Experience 127
at distances of 1 m× 1 m in holes to makebetter use of low humidity. These quinoas areknown as “Royal Quinoa,” with larger grainsize (>2.2 mm in diameter), characterized bya thick pericarp and high saponin content.
4. Quinoas of the Yungas or Edge of the Rainforestconsist of a small group of quinoas that haveadapted to the conditions of the Yungas or edgeof the Bolivian rainforest, mainly in the valleysof Cochabamba, at altitudes between 1,500 and2,200 m. They are characterized by somewhatbranched development, reaching heights of upto 2.20 m. The plants are green but the entireplant turns into a striking orange color when infull bloom.
5. Sea-level quinoas are found in the areas ofLinares and Concepción, Chile to 36∘ SouthLatitude. Plants of this type are more orless robust, 1.0–1.4 m tall, with branchedgrowth and cream-colored, transparent grains(Chullpi type). These quinoas share numer-ous similarities with Chenopodium nuttalliae(Huahzontle) grown in isolation in Mexico at20∘ North Latitude.
The quinoa genetic diversity conserved andavailable in the different countries from theAndean Region are classified in five majorgroups. Quinoa from Bolivia is distributed in theinter-Andean valleys, highlands, salt flatlands,and Yungas. Quinoa from Colombia and Ecuadoris distributed in the inter-Andean valleys, quinoafrom Peru is found in the inter-Andean val-leys and highlands, while quinoa from Chile isgrouped in the salt flatlands and sea-level quinoaecotypes (Fig. 8.1).
Rojas (2003) studied the genetic variabilityof the Bolivian germplasm collection and hasidentified seven subcenters of diversity in Bolivia:one subcenter in the salt flatlands of Potosi andOruro, two sub-centers in the northern Altiplanoin La Paz, one in the central Altiplano in La Pazand Oruro, one sub-center located geographicallyin the transition Salt Flatlands and Altiplano,and two subcenters in the Andean valleys ofCochabamba, Chuquisaca, and Potosi. Thesesubcenters comprise a wide genetic diversity ofthe crop, expressed in the variability of plant,
inflorescence, and seed color; variability of inflo-rescence types, culture cycle duration, nutritional(protein) and agroindustrial value; and variabilityin saponin and betacyanin content in leaves.This diversity of traits enables quinoa to adapt todifferent ecological and soil conditions such assalinity or acidity, rainfall, temperature, altitude,frost, and drought.
GEOGRAPHICAL DISTRIBUTIONOF QUINOA
Given the wide distribution of its center of origin,quinoa can be considered as an oligocentricspecies, with the Andean region as its center ofdiversity with multiple routes of diversification(Mujica 1992). Quinoa is grown throughout thevast Andean region that was once ruled by theIncas (Lescano 1994). It is found from Colombia(Pasto), to northern Argentina (Jujuy and Salta)and Chile (Antofagasta and Concepción). Itextends from 5∘ of North latitude in the southof Colombia, to 43∘ of South latitude in theTenth Region of Chile. It ranges from sea level inChile to 4,000 masl in the Peruvian and BolivianAltiplano. Thus, there are quinoas of the coast,valleys, inter-Andean valleys, salt flatlands, andAltiplano (Fig. 8.2). A considerable part of thegenetic variability of the species is associated withgeographical distribution (Rojas 2003).
Specifically, in Colombia, quinoa is grownin the Department of Nariño, in the towns ofIpiales Puesrés, Contadero, Cordova, San Juan,Mocondino, and Pasto. A department is a politicaldivision, each with a governor and an assembly.Colombia has 32 departments. In Ecuador, quinoais grown in the areas of Carchi, Imbabura, Pich-incha, Cotopaxi, Chimborazo, Loja, Latacunga,Ambato, and Cuenca. In Peru, quinoa is grownin the areas of Cajamarca, Callejon de Huayl-las, Mantaro Valley, Andahuayllas, Cusco, andPuno (Altiplano), which comprises 75% of thecultivated area. In Bolivia, quinoa is cultivatedin the Altiplano of La Paz, Oruro, and Potosiand in the inter-Andean valleys of Cochabamba,Chuquisaca, Potosi, and Tarija (Rojas et al. 2010b).In Chile, the quinoa-growing areas are the Chilean
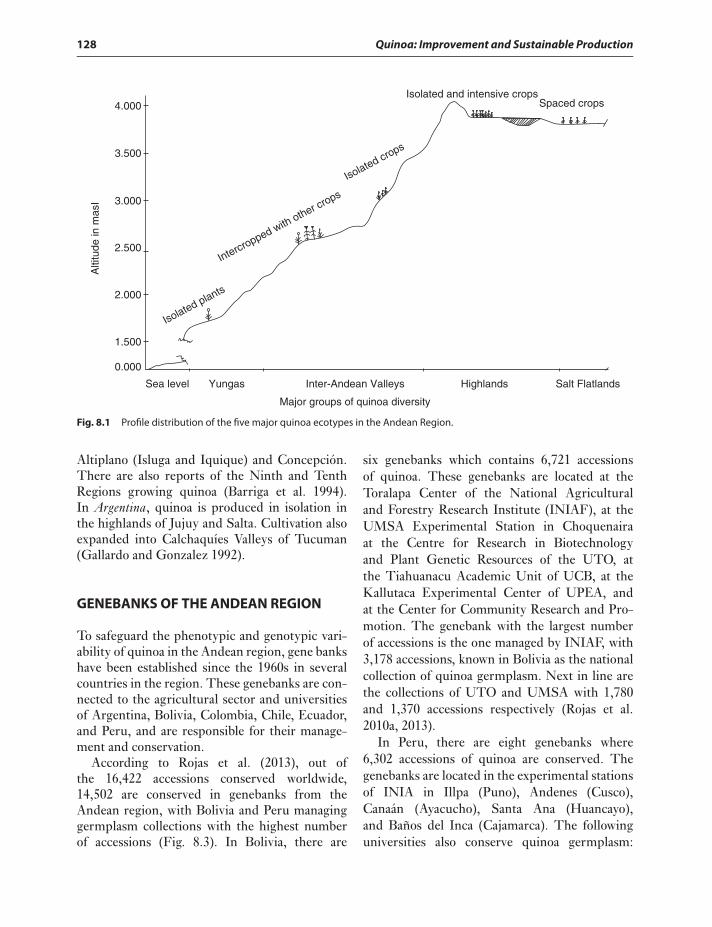
128 Quinoa: Improvement and Sustainable Production
4.000
3.500
3.000
2.500
2.000
1.500
0.000
Alti
tude
in m
asI
Sea level Yungas Inter-Andean Valleys Highlands Salt Flatlands
Major groups of quinoa diversity
Isolated plants
Intercropped with other crops
Isolated crops
Isolated and intensive cropsSpaced crops
Fig. 8.1 Profile distribution of the five major quinoa ecotypes in the Andean Region.
Altiplano (Isluga and Iquique) and Concepción.There are also reports of the Ninth and TenthRegions growing quinoa (Barriga et al. 1994).In Argentina, quinoa is produced in isolation inthe highlands of Jujuy and Salta. Cultivation alsoexpanded into Calchaquíes Valleys of Tucuman(Gallardo and Gonzalez 1992).
GENEBANKS OF THE ANDEAN REGION
To safeguard the phenotypic and genotypic vari-ability of quinoa in the Andean region, gene bankshave been established since the 1960s in severalcountries in the region. These genebanks are con-nected to the agricultural sector and universitiesof Argentina, Bolivia, Colombia, Chile, Ecuador,and Peru, and are responsible for their manage-ment and conservation.
According to Rojas et al. (2013), out ofthe 16,422 accessions conserved worldwide,14,502 are conserved in genebanks from theAndean region, with Bolivia and Peru managinggermplasm collections with the highest numberof accessions (Fig. 8.3). In Bolivia, there are
six genebanks which contains 6,721 accessionsof quinoa. These genebanks are located at theToralapa Center of the National Agriculturaland Forestry Research Institute (INIAF), at theUMSA Experimental Station in Choquenairaat the Centre for Research in Biotechnologyand Plant Genetic Resources of the UTO, atthe Tiahuanacu Academic Unit of UCB, at theKallutaca Experimental Center of UPEA, andat the Center for Community Research and Pro-motion. The genebank with the largest numberof accessions is the one managed by INIAF, with3,178 accessions, known in Bolivia as the nationalcollection of quinoa germplasm. Next in line arethe collections of UTO and UMSA with 1,780and 1,370 accessions respectively (Rojas et al.2010a, 2013).
In Peru, there are eight genebanks where6,302 accessions of quinoa are conserved. Thegenebanks are located in the experimental stationsof INIA in Illpa (Puno), Andenes (Cusco),Canaán (Ayacucho), Santa Ana (Huancayo),and Baños del Inca (Cajamarca). The followinguniversities also conserve quinoa germplasm:
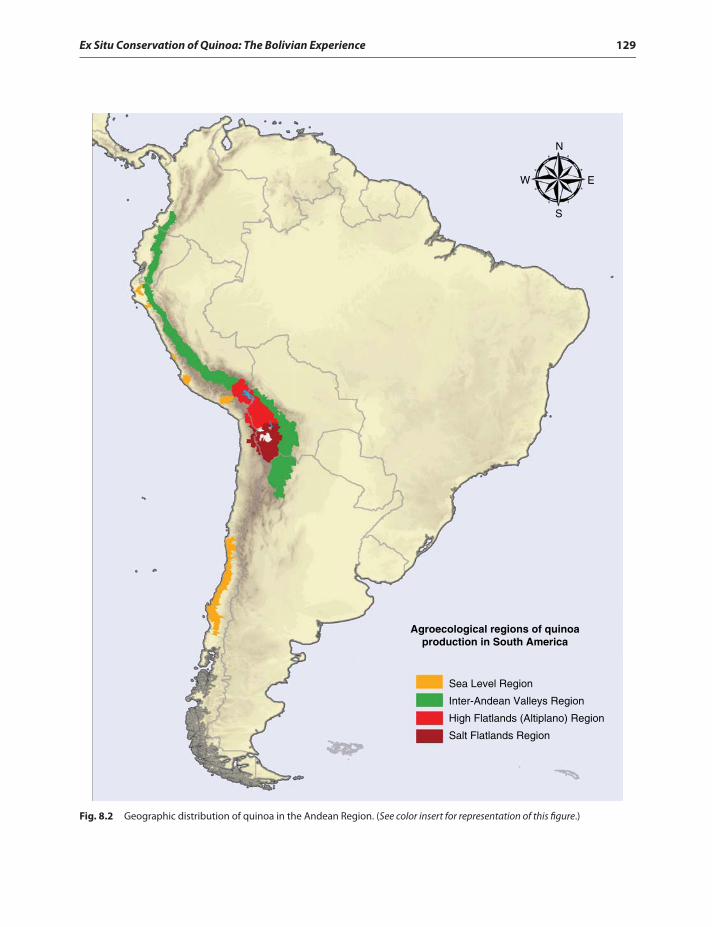
Ex Situ Conservation of Quinoa: The Bolivian Experience 129
Agroecological regions of quinoaproduction in South America
Sea Level Region
Inter-Andean Valleys Region
High Flatlands (Altiplano) Region
Salt Flatlands Region
W
N
E
S
Fig. 8.2 Geographic distribution of quinoa in the Andean Region. (See color insert for representation of this figure.)
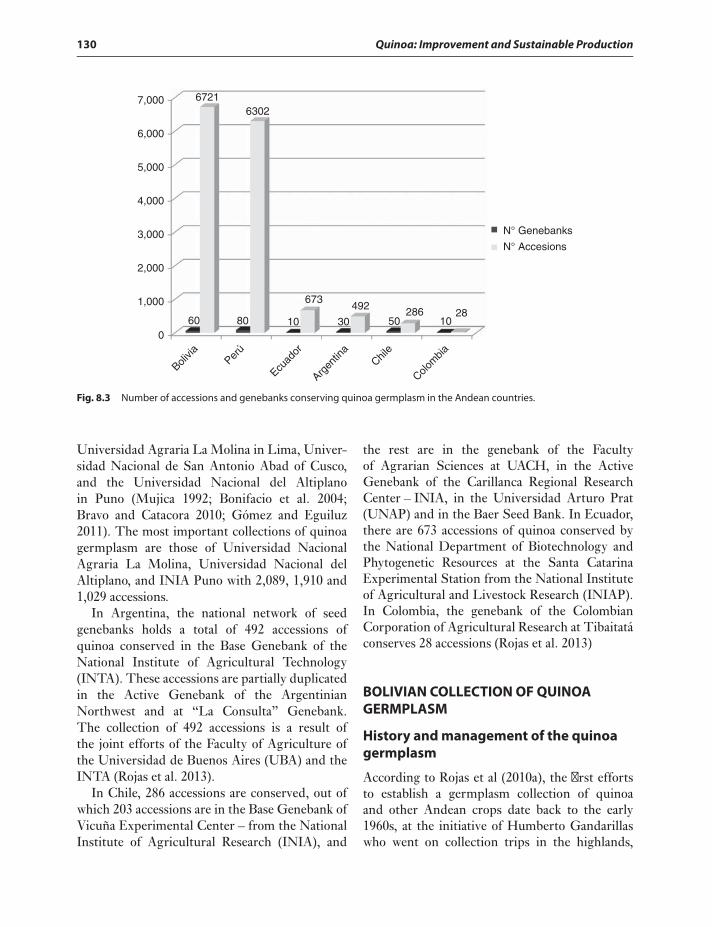
130 Quinoa: Improvement and Sustainable Production
0
7,000
6,000
5,000
4,000
3,000
2,000
1,000
Bolivia
Perú
Argen
tina
Ecuad
orChil
e
Colom
bia
N° Genebanks
N° Accesions
67216302
60 80 10 30 50 1028286492
673
Fig. 8.3 Number of accessions and genebanks conserving quinoa germplasm in the Andean countries.
Universidad Agraria La Molina in Lima, Univer-sidad Nacional de San Antonio Abad of Cusco,and the Universidad Nacional del Altiplanoin Puno (Mujica 1992; Bonifacio et al. 2004;Bravo and Catacora 2010; Gómez and Eguiluz2011). The most important collections of quinoagermplasm are those of Universidad NacionalAgraria La Molina, Universidad Nacional delAltiplano, and INIA Puno with 2,089, 1,910 and1,029 accessions.
In Argentina, the national network of seedgenebanks holds a total of 492 accessions ofquinoa conserved in the Base Genebank of theNational Institute of Agricultural Technology(INTA). These accessions are partially duplicatedin the Active Genebank of the ArgentinianNorthwest and at “La Consulta” Genebank.The collection of 492 accessions is a result ofthe joint efforts of the Faculty of Agriculture ofthe Universidad de Buenos Aires (UBA) and theINTA (Rojas et al. 2013).
In Chile, 286 accessions are conserved, out ofwhich 203 accessions are in the Base Genebank ofVicuña Experimental Center – from the NationalInstitute of Agricultural Research (INIA), and
the rest are in the genebank of the Facultyof Agrarian Sciences at UACH, in the ActiveGenebank of the Carillanca Regional ResearchCenter – INIA, in the Universidad Arturo Prat(UNAP) and in the Baer Seed Bank. In Ecuador,there are 673 accessions of quinoa conserved bythe National Department of Biotechnology andPhytogenetic Resources at the Santa CatarinaExperimental Station from the National Instituteof Agricultural and Livestock Research (INIAP).In Colombia, the genebank of the ColombianCorporation of Agricultural Research at Tibaitatáconserves 28 accessions (Rojas et al. 2013)
BOLIVIAN COLLECTION OF QUINOAGERMPLASM
History and management of the quinoagermplasm
According to Rojas et al (2010a), the first effortsto establish a germplasm collection of quinoaand other Andean crops date back to the early1960s, at the initiative of Humberto Gandarillaswho went on collection trips in the highlands,
Ex Situ Conservation of Quinoa: The Bolivian Experience 131
salt flatlands, and inter-Andean valleys of Bolivia.With the material Gandarillas collected, thefirst quinoa genebank was established. Initially,the genebank was under the responsibility ofthe Patacamaya Experiment Station but waslater under the National Quinoa Program of theBolivian Institute of Agricultural Technology(IBTA) that operated in Bolivia until 1998.
After the closure of IBTA in the late 1990s,the Patacamaya Experimental Station becamedependent on the Prefecture of La Paz and thequinoa germplasm collection was in imminentdanger of being lost. The Prefecture of La Pazwas administered by the newly created Depart-mental Agricultural Services (SEDAG) – La Pazunit, and management of the quinoa germplasmcollection also became one of its responsibilities.Unfortunately, during this time, germplasm col-lection had no financial support. In the absenceof a clear policy regarding the collection, itsconservation and management was discontinued.
At the initiative of quinoa researchers and exec-utives of the Foundation for the PROINPA, everyeffort was made to maintain the plots of quinoagermplasm that had been sown in the northernAltiplano through the Durable Resistance Projectin the Andean Region (PREDUZA). During the1997–1998 crop year, the PREDUZA projectwas in full operation and managed by researchersfrom the former National Quinoa Program ofIBTA. The material was planted by the lakesideof Lake Titicaca mainly for accessibility and easein management. In addition, the environmen-tal conditions in the northern Altiplano wereconductive to assessment for mildew resistance.The germplasm had been divided into two lots,where 50% was assessed at the Belen ExperimentStation (Omasuyos province) while the other 50%at the Choquenaira Experimental Station (Ingaviprovince), to replicate the quinoa germplasmcollection at harvest. Both stations were managedby the Faculty of Agronomy, UMSA.
Under these circumstances, the authoritiesof the Ministry of Agriculture, Livestock andRural Development (MAGDER), later theMinistry of Rural Development, Agriculture andEnvironment (MDRAyMA) currently known asthe Ministry of Rural Development and Land
(MDRyT) through letter PDTA-2216-BO-CNo. 418/98, enabled the PROINPA Foundationto take over the conservation of the quinoagenebank. The PROINPA Foundation wasentrusted to administer, manage, and conservethe quinoa collection within the framework ofBolivia’s legislation. To fulfill its responsibilities,PROINPA on its own initiative raised fundsand received support from several agencies,including the Danish Cooperation for Develop-ment (DANIDA), International Plant GeneticResource Institute (IPGRI) currently knownas Bioversity International, Program of SmallDonations of the United Nations DevelopmentProgram (PPD/PNUD), International Fundfor Agricultural Development (FIDA), and theMcKnight Foundation. This marked a new begin-ning concerning the conservation of plant geneticresources of Bolivia. The PROINPA Foundationhas taken over the management and conservationof the quinoa genebank for more than 10 years.
Later, the quinoa genebank received finan-cial support from the national governmentin February 2001 through agreements signedbetween MAGDER, Agricultural ServicesProgram – Coordination Unit (UCPSA), andPROINPA. After the creation of the NationalSystem of Genetic Resources for Food andAgriculture (SINARGEAA) in 2003, six nationalgenebanks came into operation and MDRAyMAendorsed PROINPA as the entity in chargeof the National Genebank of Andean Grains,including the quinoa germplasm collection.During this period up to December 2008,PROINPA has managed and conserved thesegenetic resources under the SINARGEAAframework and with the support of projectsunder the Neglected and Underutilized Species(NUS) – IFAD and United Nations Environ-mental Program/Global Environmental Facility(UNEP/GEF) frameworks.
Subsequently, INIAF, an institution createdthrough a national decree in 2008 and desig-nated as the national competent authority inGenetic Resources, enabled funding for theSINARGEAA Transition Plan (2009–2010).Under this framework, INIAF and PROINPAsigned an interagency cooperation agreement,
132 Quinoa: Improvement and Sustainable Production
through which the coordination and interactionmechanisms for the transfer of genetic materialand relevant equipment to the new competentauthority were established.
Current status of quinoa germplasm
In the crop year 2010, the quinoa germplasm col-lection and the Genebank of High Andean Grainswere transferred to INIAF. The transfer wascompleted on July 23, 2010 and was notarized,recording in detail the conservation status ofeach accession, along with related documentation(databases, publications, and other protocols),equipment and materials basis for conservation.The transfer also included a period of at least18 months of joint work between the two insti-tutions, including staff training and capacitybuilding to facilitate immediate management ofthe genebanks.
This moment closed a very important stage forPROINPA in the management of the NationalGenebank of Andean Grains, and, in particular,the administration of the Bolivian collection ofquinoa germplasm which lasted for 12 years. Itwas a labor of dedication to increase the number ofaccessions of the germplasm collection, improvethe quality of conservation, upgrade the collec-tion’s documentation, and generate a knowledgedatabase that can be used in different fields, fromgenetic improvement to agribusiness. All of thishas been made possible through complementaryprojects with which the genebank has beenarticulated with different users, from academic,scientific, and technical users to communitiesthat work with in situ conservation. This workand dedication has been recognized both nation-ally and internationally. Conservation farmers,government agencies, international cooperationagencies based in Bolivia, and entities outside thecountry, have lauded the genebank for its highconservation quality and possession of uniquematerials (Rojas et al. 2010a).
At present, the Bolivian quinoa germplasmcollection is part of the National Genebank ofAndean Grains, preserved in the INIAF ToralapaCenter. The collection has wide genetic vari-ability and conserves 3,178 cultivated and wild
accessions collected in highland communities,salt flatlands, inter-Andean valleys and alongthe edge of rainforests in the regions of La Paz,Oruro, Potosi, Cochabamba, Chuquisaca, andTarija. In addition, it includes germplasm fromPeru, Ecuador, Colombia, Argentina, Chile,Mexico, the United States, England, Holland,and Denmark.
STEPS FOR EX SITU MANAGEMENT ANDCONSERVATION OF QUINOA
Ex situ conservation is considered complementaryto in situ conservation as it is not possible toconserve all species ex situ or “off site.” It consistsof a set of activities towards the managementof plant genetic resources. It is carried out bycreating genebanks and germplasm collections,involving a series of steps and procedures thatrequire trained personnel.
Seed genebanks are viable options for ex situconservation of quinoa germplasm. Conditionsin these seed genebanks promote maximumstorage time with minimal physiological activityand negligible loss of viability and germination.Quinoa seeds have been classified as “orthodox”according to its behavior in storage (Ellis et al.1988). In “orthodox” seeds, one can managehumidity and temperature in order to keep seedsviable for longer periods of time, whereas in“recalcitrant” seeds this is not possible. Becausequinoa seeds are “orthodox,” their viability canbe maintained in a predictable manner withina range of environmental conditions throughtemperature and seed moisture reduction.
The “orthodox” behavior of quinoa seeds instorage makes it possible to devise a managementstrategy for the seed genebanks. The protocolsdeveloped and the results achieved with the Boli-vian quinoa seed germplasm collection, duringthe time that it was managed by PROINPA, arediscussed in this section. An effective protocolfor ex situ management has been developed byseveral specialists in Plant Genetic Resources inLatin America (Jaramillo and Baena 2000). Theprotocol has been adapted to quinoa germplasm,
Ex Situ Conservation of Quinoa: The Bolivian Experience 133
including the collection, preliminary multipli-cation, storage, characterization, and evaluationof germplasm. It also includes the regenerationand multiplication of germplasm, plus theirdocumentation and utilization.
Collection of quinoa germplasm
“Collection of germplasm” is the process ofobtaining seed samples that represent wild plantpopulations or varieties of cultivated species.The collection of germplasm is performed forthe conservation of species diversity, to obtaingermplasm that can be used in breeding or tosearch for and find new populations not availablepreviously in the genebanks (Sevilla and Holle2004). Germplasm collections are necessary andfully justified in areas considered as centers oforigin and diversity because cultivated varietiesand wild relatives that coexist and evolve overtime can be found in such places. Germplasmcollection is the first stage or step that needs to becarried out in a management strategy for ex situconservation. Utmost caution and care shouldbe taken in technical and logistical planningand in job execution. For instance, seed samplescollected should be viable to ensure that thesewill germinate and develop into plants similarto the mother plants if grown in comparableenvironments.
Since 1964, when germplasm collections ofquinoa began in Bolivia, the Centralized Collectionmethod has been used. This method is based onthe work of a team of scientists and researcherswho visit various sites in the highlands, saltflatlands, inter-Andean valleys, and areas of cropdistribution in the country. The team collectsseeds to form the main quinoa germplasm collec-tion. Although the germplasm collection holdssignificant numbers of quinoa accessions, thevariability stored does not represent all the exist-ing diversity of quinoa in the country. For thisreason, quinoa germplasm was collected in areasthat had not been represented in the collection.
Since 2002, the Decentralized Collection me-thod for quinoa germplasm collection has beenimplemented in the country. This method entailscollaboration with local entities or groups such
as extension services, farmer organizations,NGOs and universities, among others. It isbased on itinerant collection of samples by ateam of scientists throughout different ecologicalregions. This collection method also involvesinteraction with local experts and constitutes apractical alternative to the Centralized CollectionMethod, because local experts have extensiveecogeographic and cultural knowledge of thearea. These local experts also know how to choosethe best collection time and can collect duringfruiting and later stages (Guarino et al. 1995).
Technical procedure for quinoagermplasm collection
For both the Centralized Collection and Decen-tralized Collection methods, it is critical thattechnical and logistical planning should be in syncto ensure the success of a quinoa germplasm col-lection trip. Technical planning involves definingwhat to collect and determining why, where, how,and when to collect. On the other hand, logisticalplanning means organizing the mission. Arrange-ments need to be made for the effective imple-mentation of the technical planning aspects, suchas forming the team or collection team, prepar-ing the itinerary, arranging the transportation,acquiring permits, and assembling the necessaryimplements for collection, such as instruments,equipment, and supplies (Guarino et al. 1995).
A protocol for quinoa germplasm collectionhas been adapted, and it can be applied to both thecentralized and decentralized collection methods.The protocol meets the minimum requirementsneeded for germplasm collection work. Someimportant points in the protocol are specified inthe following sub-sections.
Collection form
The collection form adapted for quinoa germ-plasm collection is shown in Annex 8.1; it is basedon the Germplasm Collection Form publishedby the International Plant Genetic ResourcesInstitute or IPGRI (Jaramillo and Baena 2000).The form has the minimum necessary informa-tion about the origin of the collected populations.
134 Quinoa: Improvement and Sustainable Production
Unavoidable variables were included to recordmorphological and ethnobotanical information,used to compare qualitative characteristics at thetime of characterization and evaluation of quinoaaccessions (Rojas 2002b).
Sources of collection
Sources of collection are those sites where samplesof germplasm can be obtained. Farmers’ fieldsand storage facilities constitute the main sourcesfor quinoa collections because these providemore homogeneous seed samples. Moreover, theinformation needed on the collection form ismore reliable, often coming from the farmersthemselves. Nevertheless, rural fairs, markets, andother places of sale are also considered sourcesof collection, depending on available informationregarding the origin of the sample so it can berecorded in the collection form. Finally, wildlifehabitats are also considered sources of collectionfor the registration of wild populations, althoughwild populations of quinoa can also be found infarmers’ fields.
Sampling strategy
The objective of a collection trip is to gather agroup of accessions that would be a representativesample of the genetic diversity of a taxon. Thisrequires adequate knowledge of the area and ofthe target species. For this reason, informationon topography, geology, soil, climate, and vege-tation of the area must be collected. In addition,information on the distribution, phenology,reproductive biology, genetic diversity, storagebehavior, and ethnobotany of the species, that is,knowledge about their uses, must be gathered(Guarino et al. 1995).
The number of samples to be collected in ageographic area depends on the existing geneticvariability found in the area. The number ofsample plants to be taken per population woulddepend on the characteristics of the plot. Usually,a seed sample of 50 plants per population ofquinoa is recommended. The plants should berandomly selected (random sampling) in caseof homogeneous plots, and selected at small
intervals (stratified sampling) in case of variablesites (Genebank Standard 1994). In the case ofwild species, sampling should be done withoutcompromising the natural preservation of plantpopulations (Querol 1988).
From each plant, it is recommended thatthe glomeruli to the average height of the mainpanicle be cut on the glomerular basal axis with ascissor. A sufficient quantity of seed can be pro-duced with the material collected from at least 50plants, which may vary from 20 to 100 g of seed,depending on the plant structure. For quinoa, 3 gof seed on average equals approximately 1,000seeds. Therefore, the amount of seeds collectedwould exceed the recommended minimumamount of 1,500 to 2,000 seeds for autogamousand pollinated populations (Genebank Standard1994; Hawkes 1980). Consequently, the seedscollected from an accession could be consideredas representative samples.
Sample handling and documentation
Whenever possible, samples to be collectedshould be healthy, viable, and fresh. Plants shouldbe collected in the mature stage so it can toleratedesiccation without losing viability. The moisturecontent of the seed sample should be between10% and 12%. However, if the collection is doneimmediately after a rain, samples should be driedor exposed to the sun for the duration of theexpedition.
For each sample of quinoa germplasm, thecollection form described in Annex 8.1 mustbe completed. Information on origin, agromor-phological characteristics, and uses is generallyprovided by farmers through informal interviews.Both the collected seed and collection formshould be placed in paper envelopes identifyingclearly the expedition name and the samplenumber.
History and evolution of quinoagermplasm collections
Rojas et al. (2001) published a catalog on theBolivian quinoa germplasm collection andsummarized the history and progress of quinoa
Ex Situ Conservation of Quinoa: The Bolivian Experience 135
collections. The first germplasm collection ofquinoa and Andean crops organized in theAndean region was in the Patacamaya Station in1966, at the initiative of Humberto Gandarillas.He went on collection trips throughout thehighlands and inter-Andean valleys of Bolivia,with financial support from the Project BoliviaII Oxfam-FAO and later from the Institute ofAndean Crops, Ministry of Agriculture of Bolivia(Tapia 1977).
Later, the germplasm collection was aug-mented with valuable donations received fromthe Technical University of Oruro (56 accessions)and IICA (239 accessions from Peru), expandingthe collection to 1,375 accessions. The geneticmaterial from the collection was evaluated atthe Patacamaya Station, and as a result, 17landraces of quinoa were developed and described(Gandarillas 1968). In the late 1960s and early1970s, 446 accessions were received from Peru asdonation and exchange, including 131 accessionsensuing from mass selections from the NationalUniversity of the Altiplano in Puno. In thesame period, a collection of 159 cultivated andwild accessions were received from the centralAltiplano of Bolivia (La Paz and Oruro) and65 accessions collected by the OAS, withoutregistration data and collection date.
By the mid-1970s, the accessions of quinoaand Andean crops numbered to 2,045. However,loss of genetic material and separation of thequinoa collection from the potato, oca, andullucus collections reduced the number to 1,458.Subsequently, Waldo Tellería made a collectionin the Department of Oruro and increased thegermplasm collection to 1,472. In 1978, the col-lection was expanded to 1,487 accessions througha donation of accessions from northern Argentina.In the same year, Humberto Gandarillas madecollections in the Altiplano and inter-Andeanvalleys of the country and the inclusion of threeaccessions from Mexico increased the collectionto 1,516 accessions. Later, in 1981, HumbertoGandarillas, Gualberto Espindola, and FlorencioZambrana undertook different collection tripsin the country, increasing the collection to 1,752accessions. In 1982, the entry of eight accessionsfrom Ecuador (INIAP) and northern Chile were
registered, increasing the collection to 1,761accessions.
Between 1983 and 1985, Humberto Gandaril-las, Gualberto Espindola, Raúl Saravia, AlejandroBonifacio, Emigdio Ballon, German Nina, andEstanislao Quispe embarked on several collectiontrips in the country and enlarged the collectionto 1,985 accessions. In the same period, quinoavarieties from Peru, Ecuador, Chile, and Mexicowere incorporated in the collection. A singleaccession from northern Argentina was receivedin 1987. In 1989, 15 accessions were collected byGuillermo Prieto, Raúl Saravia and AlejandroBonifacio in the central Altiplano, making thetotal number of accessions 2,001.
In 1992, the genebank recorded 2,012 germ-plasm accessions. In the same year, 20 acces-sions were incorporated from the southern andcentral Altiplano, through collections made byGualberto Espindola, Genaro Aroni, and JuanTupa. In 1993, 54 accessions were received fromCochabamba as a donation from the NGO WiñaySiway, Comprehensive Services CooperativePunata, Radio Esperanza, and Second Alandia.In addition, four accessions were received fromINIAP Ecuador, for a total of 2,090 accessions.In the same year, the Mañica Substation of IBTA(Potosí), through Severino Bartolome, collected147 cultivated and wild accessions. Furthermore,182 accessions (wild material and advanced linesclassified as bitter and sweet) from the breedingarea of the Quinoa National Program wereincorporated, increasing the collection to 2,419accessions.
In 1994, Wilfredo Rojas, Nicholas Monas-teries, and Gualberto Espindola collected nineaccessions from the South Altiplano and nineaccessions from the Pacajes province in La Paz.An exchange with the Caquiaviri TechnicalCollege resulted to 65 accessions incorporatedin the collection. INIA Peru donated nine acces-sions, bringing the collection to a total of 2,511accessions. In 1995, 24 accessions were added tothe collection, mainly varieties and breeding lines.By the time of the closure of IBTA, the number ofgermplasm accessions managed at the PatacamayaExperiment Station numbered at 2,535.
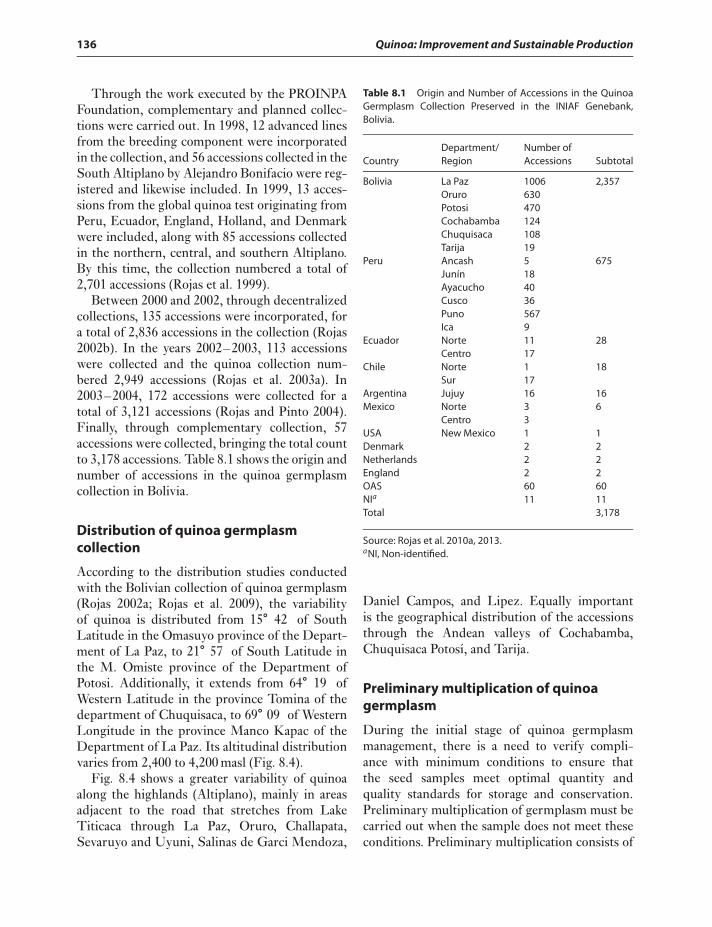
136 Quinoa: Improvement and Sustainable Production
Through the work executed by the PROINPAFoundation, complementary and planned collec-tions were carried out. In 1998, 12 advanced linesfrom the breeding component were incorporatedin the collection, and 56 accessions collected in theSouth Altiplano by Alejandro Bonifacio were reg-istered and likewise included. In 1999, 13 acces-sions from the global quinoa test originating fromPeru, Ecuador, England, Holland, and Denmarkwere included, along with 85 accessions collectedin the northern, central, and southern Altiplano.By this time, the collection numbered a total of2,701 accessions (Rojas et al. 1999).
Between 2000 and 2002, through decentralizedcollections, 135 accessions were incorporated, fora total of 2,836 accessions in the collection (Rojas2002b). In the years 2002–2003, 113 accessionswere collected and the quinoa collection num-bered 2,949 accessions (Rojas et al. 2003a). In2003–2004, 172 accessions were collected for atotal of 3,121 accessions (Rojas and Pinto 2004).Finally, through complementary collection, 57accessions were collected, bringing the total countto 3,178 accessions. Table 8.1 shows the origin andnumber of accessions in the quinoa germplasmcollection in Bolivia.
Distribution of quinoa germplasmcollection
According to the distribution studies conductedwith the Bolivian collection of quinoa germplasm(Rojas 2002a; Rojas et al. 2009), the variabilityof quinoa is distributed from 15∘ 42′ of SouthLatitude in the Omasuyo province of the Depart-ment of La Paz, to 21∘ 57′ of South Latitude inthe M. Omiste province of the Department ofPotosi. Additionally, it extends from 64∘ 19′ ofWestern Latitude in the province Tomina of thedepartment of Chuquisaca, to 69∘ 09′ of WesternLongitude in the province Manco Kapac of theDepartment of La Paz. Its altitudinal distributionvaries from 2,400 to 4,200 masl (Fig. 8.4).
Fig. 8.4 shows a greater variability of quinoaalong the highlands (Altiplano), mainly in areasadjacent to the road that stretches from LakeTiticaca through La Paz, Oruro, Challapata,Sevaruyo and Uyuni, Salinas de Garci Mendoza,
Table 8.1 Origin and Number of Accessions in the QuinoaGermplasm Collection Preserved in the INIAF Genebank,Bolivia.
Department/ Number ofCountry Region Accessions Subtotal
Bolivia La Paz 1006 2,357Oruro 630Potosi 470Cochabamba 124Chuquisaca 108Tarija 19
Peru Ancash 5 675Junín 18Ayacucho 40Cusco 36Puno 567Ica 9
Ecuador Norte 11 28Centro 17
Chile Norte 1 18Sur 17
Argentina Jujuy 16 16Mexico Norte 3 6
Centro 3USA New Mexico 1 1Denmark 2 2Netherlands 2 2England 2 2OAS 60 60NIa 11 11Total 3,178
Source: Rojas et al. 2010a, 2013.aNI, Non-identified.
Daniel Campos, and Lipez. Equally importantis the geographical distribution of the accessionsthrough the Andean valleys of Cochabamba,Chuquisaca Potosí, and Tarija.
Preliminary multiplication of quinoagermplasm
During the initial stage of quinoa germplasmmanagement, there is a need to verify compli-ance with minimum conditions to ensure thatthe seed samples meet optimal quantity andquality standards for storage and conservation.Preliminary multiplication of germplasm must becarried out when the sample does not meet theseconditions. Preliminary multiplication consists of
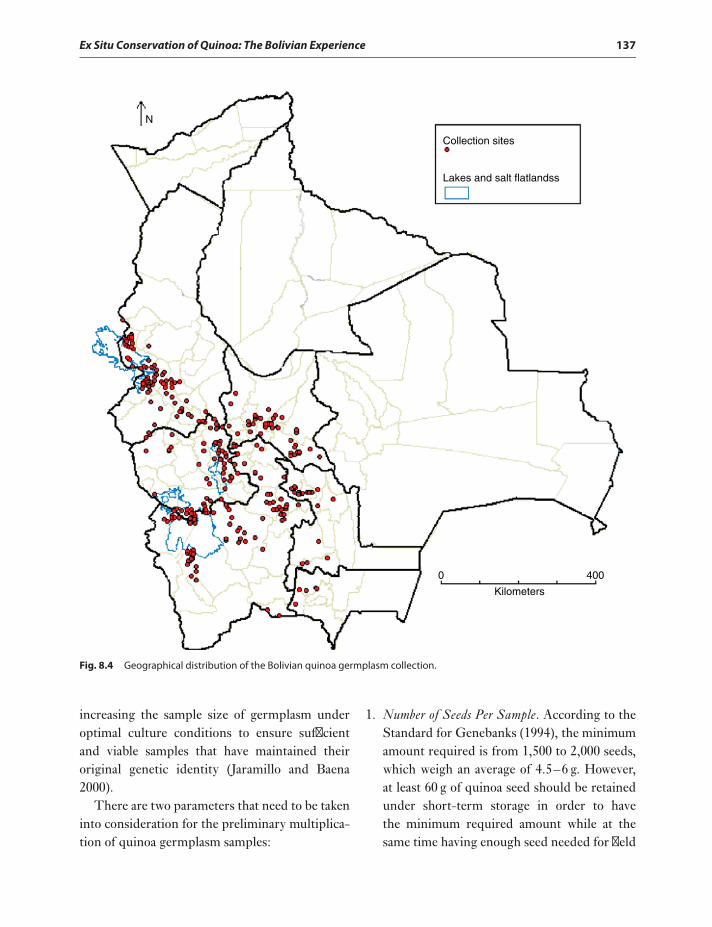
Ex Situ Conservation of Quinoa: The Bolivian Experience 137
N
Collection sites
Lakes and salt flatlandss
0 400
Kilometers
Fig. 8.4 Geographical distribution of the Bolivian quinoa germplasm collection.
increasing the sample size of germplasm underoptimal culture conditions to ensure sufficientand viable samples that have maintained theiroriginal genetic identity (Jaramillo and Baena2000).
There are two parameters that need to be takeninto consideration for the preliminary multiplica-tion of quinoa germplasm samples:
1. Number of Seeds Per Sample. According to theStandard for Genebanks (1994), the minimumamount required is from 1,500 to 2,000 seeds,which weigh an average of 4.5–6 g. However,at least 60 g of quinoa seed should be retainedunder short-term storage in order to havethe minimum required amount while at thesame time having enough seed needed for field
138 Quinoa: Improvement and Sustainable Production
research tests or a plot of 70 m2 (Rojas andBonifacio 2001).
2. Germination of the Initial Sample. Quinoasamples should meet the germination levelsrequired by the Standard for Genebanks(1994), which are at least 85% for cultivatedsamples and 65% for wild samples. The higherthe germination percentage at storage, thebetter it would be for long term storage, asgermination potential decreases over time.
If the quinoa germplasm samples do notmeet one or both of these parameters, thesemust go through preliminary multiplication,which consists of meeting the target parameterunder optimum growing conditions (this willbe explained in detail in the “regeneration andmultiplication” stage). On the other hand, ifthe samples have optimal quantities of seedand germination rate, they are placed undershort-term storage. During this process, anaccession number is permanently assigned to thesample, and the passport information obtainedduring the collection of the quinoa germplasmsample is registered.
Storage and conservation of quinoagermplasm
The purpose of this stage of management is tokeep quinoa seeds viable and with the geneticidentity that represents the population. Thisrequires that storage be carried out under appro-priate conditions. According to Jaramillo andBaena (2000), the recommended procedure con-sists of three steps: preparation or conditioningof samples, packing of samples, and storage ofsamples.
1. Conditioning of the Sample. This procedureis performed to obtain a clean sample ofquinoa seeds, free of physical impuritiessuch as perigone residues, seed stalks of thepanicle, broken, infected, or foreign seeds.The conditioning process also includes theinitial measurement of moisture content of thesample to ensure longevity in storage. Thismeasurement can be determined by direct orindirect quantification of moisture content.
2. Packing of the Sample. After the conditioningprocess, the sample of quinoa seeds are packedand stored. A wide assortment of containers,of various shapes and materials, can be usedfor seed packing as long as the containers areairtight to isolate the germplasm and preventmoisture absorption and/or contamination.
3. Storage of the Sample. Storage conditionsmust be such that quinoa seed samples arekept viable. The packaging used and thesite of storage depend on the objective ofconservation and the projected duration ofstorage.
Short- and medium-term storage(1 to 20 years)
Short- and medium-term storage can last from1 to 20 years, and is used for quinoa germplasmthat will be used immediately or in the follow-ing years after collection. Weather conditionsin the highlands of Bolivia favor this kind ofstorage, with an average temperature of 10∘C,an average relative humidity of 45% and analtitude ranging between 3,700 and 3,900 masl.Since the establishment of the Bolivian quinoagermplasm collection, most samples have beenkept in short- and medium-term storage. For thiskind of storage, it is important to keep samplesin a dark environment with a simple ventilationsystem. The storage containers used for theBolivian germplasm collection are plastic bottles0.4 to 2 mm thick, with a double lid and a capacityof 1,000 g. These containers are well suited forshort- and medium-term storage at temperaturesranging from 8 to 20∘C and a relative humidityof 15% to 60% (IPGRI 1996). Under theseconditions, samples can be stored and maintainedfrom 1 to 20 years, depending on the geneticmaterial.
Long-term storage (80 to 100 years)
Seeds conserved under these conditions aremaintained for approximately 80–100 years.According to the Standard for Genebanks (1994),most orthodox seed species can be kept indefi-nitely at temperatures between −10 and −20∘C,
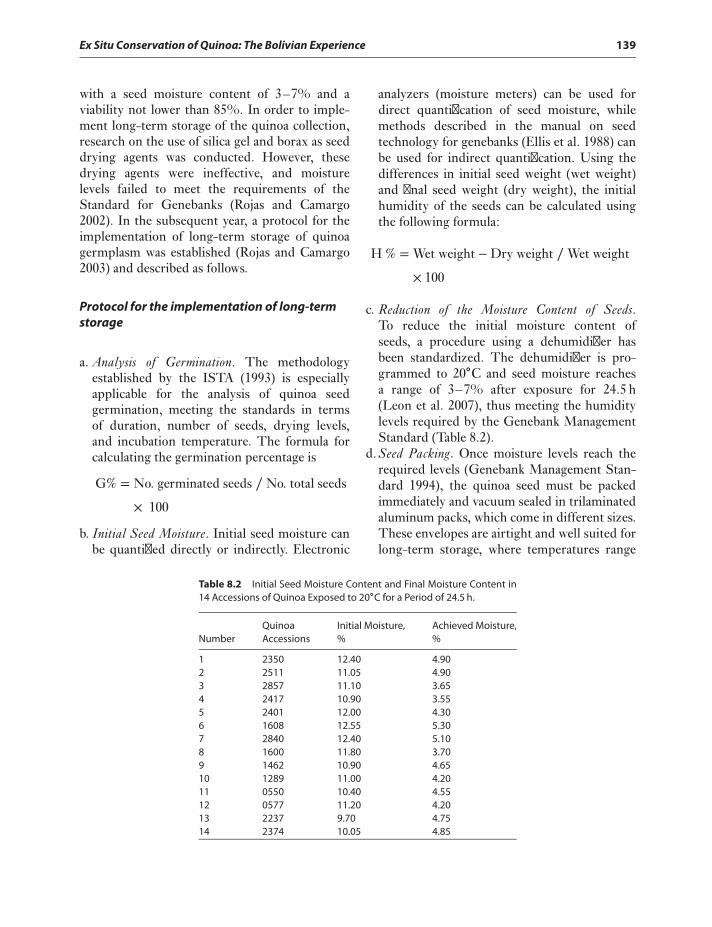
Ex Situ Conservation of Quinoa: The Bolivian Experience 139
with a seed moisture content of 3–7% and aviability not lower than 85%. In order to imple-ment long-term storage of the quinoa collection,research on the use of silica gel and borax as seeddrying agents was conducted. However, thesedrying agents were ineffective, and moisturelevels failed to meet the requirements of theStandard for Genebanks (Rojas and Camargo2002). In the subsequent year, a protocol for theimplementation of long-term storage of quinoagermplasm was established (Rojas and Camargo2003) and described as follows.
Protocol for the implementation of long-termstorage
a. Analysis of Germination. The methodologyestablished by the ISTA (1993) is especiallyapplicable for the analysis of quinoa seedgermination, meeting the standards in termsof duration, number of seeds, drying levels,and incubation temperature. The formula forcalculating the germination percentage is
G% = No. germinated seeds ∕ No. total seeds
× 100
b. Initial Seed Moisture. Initial seed moisture canbe quantified directly or indirectly. Electronic
analyzers (moisture meters) can be used fordirect quantification of seed moisture, whilemethods described in the manual on seedtechnology for genebanks (Ellis et al. 1988) canbe used for indirect quantification. Using thedifferences in initial seed weight (wet weight)and final seed weight (dry weight), the initialhumidity of the seeds can be calculated usingthe following formula:
H % = Wet weight − Dry weight ∕ Wet weight
× 100
c. Reduction of the Moisture Content of Seeds.To reduce the initial moisture content ofseeds, a procedure using a dehumidifier hasbeen standardized. The dehumidifier is pro-grammed to 20∘C and seed moisture reachesa range of 3–7% after exposure for 24.5 h(Leon et al. 2007), thus meeting the humiditylevels required by the Genebank ManagementStandard (Table 8.2).
d. Seed Packing. Once moisture levels reach therequired levels (Genebank Management Stan-dard 1994), the quinoa seed must be packedimmediately and vacuum sealed in trilaminatedaluminum packs, which come in different sizes.These envelopes are airtight and well suited forlong-term storage, where temperatures range
Table 8.2 Initial Seed Moisture Content and Final Moisture Content in14 Accessions of Quinoa Exposed to 20∘C for a Period of 24.5 h.
Quinoa Initial Moisture, Achieved Moisture,Number Accessions % %
1 2350 12.40 4.902 2511 11.05 4.903 2857 11.10 3.654 2417 10.90 3.555 2401 12.00 4.306 1608 12.55 5.307 2840 12.40 5.108 1600 11.80 3.709 1462 10.90 4.6510 1289 11.00 4.2011 0550 10.40 4.5512 0577 11.20 4.2013 2237 9.70 4.7514 2374 10.05 4.85
140 Quinoa: Improvement and Sustainable Production
from 8 to −20∘C and the relative humidity isfrom 10% to 20% (IPGRI 1996).
e. Storage. The aluminum packages should bestored in freezers at −20∘C, as indicated in theStandard for Genebanks (FAO/IPGRI 1994).
f. Germination Monitoring of Stored Samples. Tomonitor the germination rate of stored samples,the following steps are recommended: (i) openthe envelopes to remove seeds, and immediatelyvacuum seal the package to preserve the remain-ing seeds; (ii) rehydrate seed in a boiling waterbath for 50–60 min (Rojas and Camargo 2003);and (iii) perform a germination test followingthe procedure established by ISTA (1993).
Following this procedure, 247 germplasmaccessions of quinoa that belong to the “corecollection” were conserved for long term stor-age in 2003. This is the first experience withlong-term conservation of the Bolivian quinoagermplasm. After 5 years in storage, the firstmonitoring activity was performed in 2008 on the247 accessions that had been put on long-termstorage. Results were encouraging because thegermination percentage remained stable between90% and 98% when compared to the initialgermination percentage.
Characterization and evaluationof the quinoa germplasm
Characterization and evaluation of accessionsin a germplasm collection are complementaryactivities that involve describing the qualitativeand quantitative attributes of the accessions.These activities are undertaken to differentiateaccessions, determine their usefulness, structure,genetic variability, and relatedness, and findgenes of value in the production or breeding ofquinoa (Jaramillo and Baena 2000). Germplasmconservation goes hand in hand with its use,as experienced with the Bolivian collection ofquinoa. This is only possible if the characteristics,attributes, and potential uses of the accessionsare known. Information on the germplasm andits usefulness come from taking and analyzing aset of data on the germplasm sample in various
stages of its management, but mainly during thecharacterization and evaluation stage.
Theoretically, the quantity of data that can betaken during characterization and evaluation isinfinite. However, a good and useful descriptionof plants is not determined by the number of vari-ables used, but by its practical utility and accuracy(Querol 1988). Therefore, before describing anaccession, the data to be registered must be welldefined, although it also depends on the purposeand/or stage that is being followed in the process.
Stages of germplasm characterizationand evaluation
It is important to differentiate the stages involvedin characterization and evaluation of germplasmin order to carry out the work. These stages arecomplementary, based on data registration, andcan be performed simultaneously. The stages are(a) correct identification; (b) characterization; (c)preliminary assessment; and (d) evaluation.
(a) Correct Identification. Before describing agermplasm accession, the sample must haveaccurate botanical identification becausework is done through differentiations at theintraspecific level using the taxonomic clas-sification system. Furthermore, compliancewith passport data must be verified, a usefulprocedure for identifying duplicates amongaccessions that are often reintroduced to thegenebank (Valls 1992).
(b) Characterization. In a strict sense, this stageinvolves the systematic description of acces-sions using a set of highly heritable and per-sistent qualitative characters. Characters suchas growth habit, branching, plant color, mor-phology, etc., in addition to aiding the descrip-tion, help differentiate the accessions.
(c) Preliminary Assessment. This stage involves thedescription of agronomic traits of accessionsin a particular environment (space or time).The descriptors used are usually quantitativecharacters affected by the environment, suchas yield and resistance to biotic and abioticfactors, among others. It is recommendedthat a preliminary assessment be conducted
Ex Situ Conservation of Quinoa: The Bolivian Experience 141
when evaluating the entire collection ofgermplasm accessions or significant amountsof the collection.
(d) Evaluation – Further evaluation of germplasmconsists of the description of agronomic orother traits of interest in the maximumnumber of possible environments (space ortime). These traits are usually quantitativeand affected by the environment, such asyield and resistance to biotic and abioticfactors, among others. The evaluation stage iscarried out after the preliminary assessmentand with those accessions that require furtherevaluation to assess their use. Unlike the pre-liminary assessment stage, the evaluation stageis similar to research trials and is establishedusing statistical experimental designs.
The characterization and preliminary eval-uation of quinoa germplasm can be performedsimultaneously. A representative sample of theaccessions is used, together with a list of cropdescriptors and the necessary tools to registerthe information. The genetic material mustbe established in properly identified plots, andwhenever possible, under uniform managementconditions. Depending on the number of acces-sions, it will require between 3 and 5 days of workper week from planting to physiological maturity.The data should be recorded systematically andconsistently to facilitate subsequent statisticalanalysis.
The procedure that must be followed to regis-ter each one of the target variables is in the list of“crop descriptors.” However, when conductingpreliminary characterization and evaluation ofquinoa germplasm, there are important things toconsider. First, sites with ecologies similar to theplaces of origin of the quinoa accessions must bechosen. Planting dates must match the naturalperiods of quinoa crop sowing, taking into accountthe area or place of origin of the accession. Toachieve a representative population, plots shouldhave four or six rows per quinoa accession andinformation should be gathered from the centralrows (registration of information). Recordingof qualitative variables and phenological phasesshould be performed according to the total
number of plants established from the accession.For the recording or registration of quantitativevariables, 10 plants randomly selected fromthe central rows during the “tipping panicle”stage are used. Moreover, it is recommendedthat information throughout the crop cycle berecorded.
In the over 40 years of its existence, the Boli-vian quinoa germplasm has been characterizedand evaluated with a focus on agromorphologicalinformation. The first catalog of the Boliviancollection of quinoa germplasm was published in2001 (Rojas et al. 2001). The catalog describesthe genetic variability of 2,701 quinoa accessionsusing 59 qualitative and quantitative variables.Although the information recorded was basedon the “Quinoa Descriptor” (IBPGR 1981),the catalog includes more variables identifiedin the various characterization and evaluationprocesses carried out since the 1980s. Later, a newversion of “Descriptor for Quinoa” was preparedand subsequently validated by researchers fromEcuador, Peru, and Bolivia (Rojas et al. 2003b).This document was the basis for the publicationof the new list of “Descriptors for Quinoa and itsWild Relatives” edition spearheaded by Biover-sity International and PROINPA (BioversityInternational et al. 2013).
Assessment of nutritional value of the quinoaaccessions began in 2001 and assessment ofagroindustrial variables began in 2006. Informa-tion on 555 accessions of quinoa was recorded toguide the use of germplasm in the developmentof products from processed quinoa. In addi-tion, most quinoa germplasm accessions werecharacterized at the molecular level.
Agromorphological variables
Starting in the 1980s, several characterizationand evaluation tasks were performed on thequinoa germplasm from Bolivia. As a result, thegenetic, morphological, and agronomic variabilityobserved during the crop cycle of the quinoagermplasm was studied. Although this informa-tion is published in the germplasm catalogs, theparameters of some variables of interest weresubsequently presented (Rojas et al. 2001, 2009;
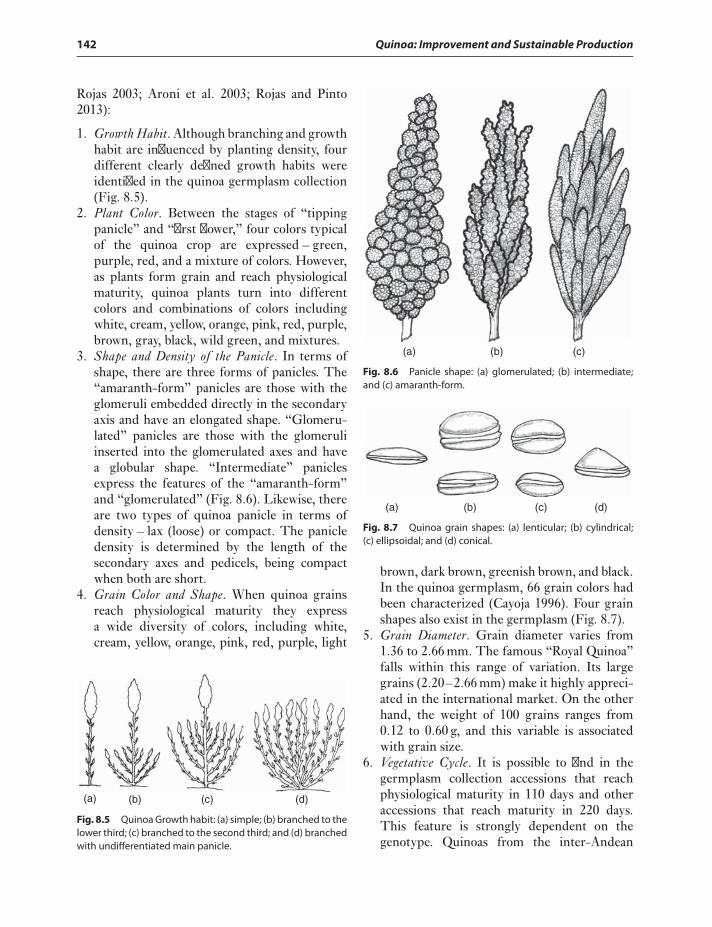
142 Quinoa: Improvement and Sustainable Production
Rojas 2003; Aroni et al. 2003; Rojas and Pinto2013):
1. Growth Habit. Although branching and growthhabit are influenced by planting density, fourdifferent clearly defined growth habits wereidentified in the quinoa germplasm collection(Fig. 8.5).
2. Plant Color. Between the stages of “tippingpanicle” and “first flower,” four colors typicalof the quinoa crop are expressed – green,purple, red, and a mixture of colors. However,as plants form grain and reach physiologicalmaturity, quinoa plants turn into differentcolors and combinations of colors includingwhite, cream, yellow, orange, pink, red, purple,brown, gray, black, wild green, and mixtures.
3. Shape and Density of the Panicle. In terms ofshape, there are three forms of panicles. The“amaranth-form” panicles are those with theglomeruli embedded directly in the secondaryaxis and have an elongated shape. “Glomeru-lated” panicles are those with the glomeruliinserted into the glomerulated axes and havea globular shape. “Intermediate” paniclesexpress the features of the “amaranth-form”and “glomerulated” (Fig. 8.6). Likewise, thereare two types of quinoa panicle in terms ofdensity – lax (loose) or compact. The panicledensity is determined by the length of thesecondary axes and pedicels, being compactwhen both are short.
4. Grain Color and Shape. When quinoa grainsreach physiological maturity they expressa wide diversity of colors, including white,cream, yellow, orange, pink, red, purple, light
(a) (b) (c) (d)
Fig. 8.5 Quinoa Growth habit: (a) simple; (b) branched to thelower third; (c) branched to the second third; and (d) branchedwith undifferentiated main panicle.
(a) (b) (c)
Fig. 8.6 Panicle shape: (a) glomerulated; (b) intermediate;and (c) amaranth-form.
(b) (c) (d)(a)
Fig. 8.7 Quinoa grain shapes: (a) lenticular; (b) cylindrical;(c) ellipsoidal; and (d) conical.
brown, dark brown, greenish brown, and black.In the quinoa germplasm, 66 grain colors hadbeen characterized (Cayoja 1996). Four grainshapes also exist in the germplasm (Fig. 8.7).
5. Grain Diameter. Grain diameter varies from1.36 to 2.66 mm. The famous “Royal Quinoa”falls within this range of variation. Its largegrains (2.20–2.66 mm) make it highly appreci-ated in the international market. On the otherhand, the weight of 100 grains ranges from0.12 to 0.60 g, and this variable is associatedwith grain size.
6. Vegetative Cycle. It is possible to find in thegermplasm collection accessions that reachphysiological maturity in 110 days and otheraccessions that reach maturity in 220 days.This feature is strongly dependent on thegenotype. Quinoas from the inter-Andean
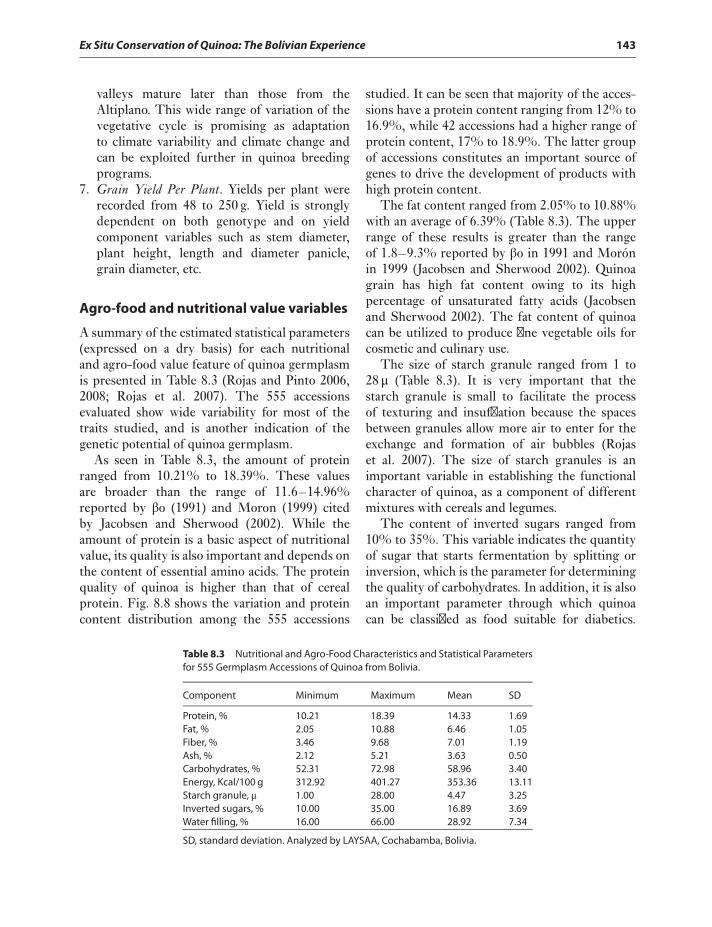
Ex Situ Conservation of Quinoa: The Bolivian Experience 143
valleys mature later than those from theAltiplano. This wide range of variation of thevegetative cycle is promising as adaptationto climate variability and climate change andcan be exploited further in quinoa breedingprograms.
7. Grain Yield Per Plant. Yields per plant wererecorded from 48 to 250 g. Yield is stronglydependent on both genotype and on yieldcomponent variables such as stem diameter,plant height, length and diameter panicle,grain diameter, etc.
Agro-food and nutritional value variables
A summary of the estimated statistical parameters(expressed on a dry basis) for each nutritionaland agro-food value feature of quinoa germplasmis presented in Table 8.3 (Rojas and Pinto 2006,2008; Rojas et al. 2007). The 555 accessionsevaluated show wide variability for most of thetraits studied, and is another indication of thegenetic potential of quinoa germplasm.
As seen in Table 8.3, the amount of proteinranged from 10.21% to 18.39%. These valuesare broader than the range of 11.6–14.96%reported by βo (1991) and Moron (1999) citedby Jacobsen and Sherwood (2002). While theamount of protein is a basic aspect of nutritionalvalue, its quality is also important and depends onthe content of essential amino acids. The proteinquality of quinoa is higher than that of cerealprotein. Fig. 8.8 shows the variation and proteincontent distribution among the 555 accessions
studied. It can be seen that majority of the acces-sions have a protein content ranging from 12% to16.9%, while 42 accessions had a higher range ofprotein content, 17% to 18.9%. The latter groupof accessions constitutes an important source ofgenes to drive the development of products withhigh protein content.
The fat content ranged from 2.05% to 10.88%with an average of 6.39% (Table 8.3). The upperrange of these results is greater than the rangeof 1.8–9.3% reported by βo in 1991 and Morónin 1999 (Jacobsen and Sherwood 2002). Quinoagrain has high fat content owing to its highpercentage of unsaturated fatty acids (Jacobsenand Sherwood 2002). The fat content of quinoacan be utilized to produce fine vegetable oils forcosmetic and culinary use.
The size of starch granule ranged from 1 to28 μ (Table 8.3). It is very important that thestarch granule is small to facilitate the processof texturing and insufflation because the spacesbetween granules allow more air to enter for theexchange and formation of air bubbles (Rojaset al. 2007). The size of starch granules is animportant variable in establishing the functionalcharacter of quinoa, as a component of differentmixtures with cereals and legumes.
The content of inverted sugars ranged from10% to 35%. This variable indicates the quantityof sugar that starts fermentation by splitting orinversion, which is the parameter for determiningthe quality of carbohydrates. In addition, it is alsoan important parameter through which quinoacan be classified as food suitable for diabetics.
Table 8.3 Nutritional and Agro-Food Characteristics and Statistical Parametersfor 555 Germplasm Accessions of Quinoa from Bolivia.
Component Minimum Maximum Mean SD
Protein, % 10.21 18.39 14.33 1.69Fat, % 2.05 10.88 6.46 1.05Fiber, % 3.46 9.68 7.01 1.19Ash, % 2.12 5.21 3.63 0.50Carbohydrates, % 52.31 72.98 58.96 3.40Energy, Kcal/100 g 312.92 401.27 353.36 13.11Starch granule, μ 1.00 28.00 4.47 3.25Inverted sugars, % 10.00 35.00 16.89 3.69Water filling, % 16.00 66.00 28.92 7.34
SD, standard deviation. Analyzed by LAYSAA, Cochabamba, Bolivia.
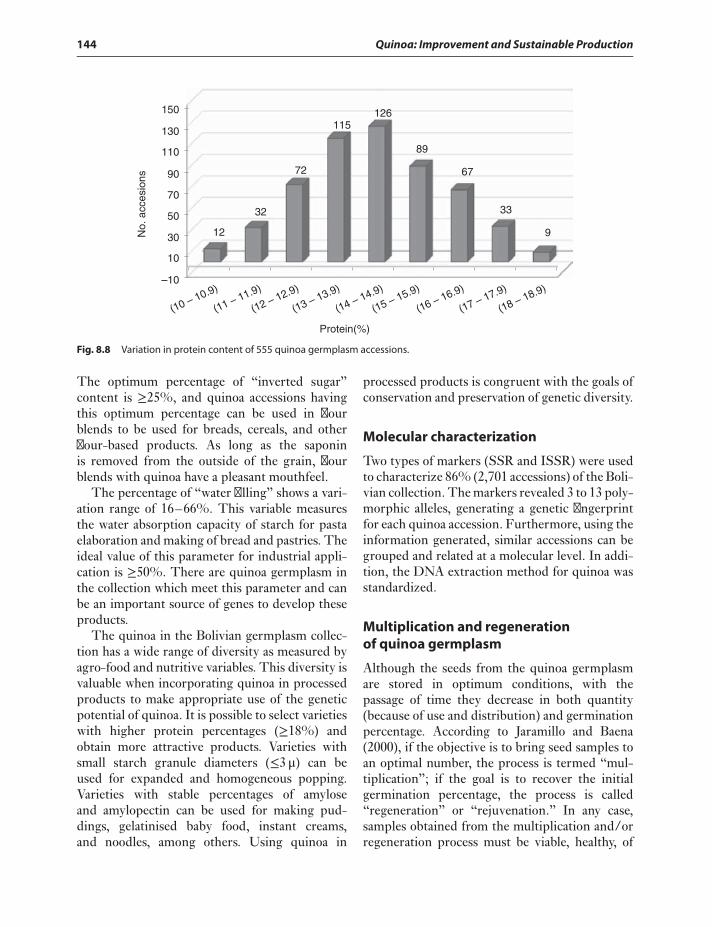
144 Quinoa: Improvement and Sustainable Production
72
115126
89
67
33
9No.
acc
esio
ns
150
130
110
90
70
50
30
10
–10
Protein(%)
12
32
(10 – 10.9)
(11 – 11.9)
(12 – 12.9)
(13 – 13.9)
(14 – 14.9)
(15 – 15.9)
(16 – 16.9)
(17 – 17.9)
(18 – 18.9)
Fig. 8.8 Variation in protein content of 555 quinoa germplasm accessions.
The optimum percentage of “inverted sugar”content is ≥25%, and quinoa accessions havingthis optimum percentage can be used in flourblends to be used for breads, cereals, and otherflour-based products. As long as the saponinis removed from the outside of the grain, flourblends with quinoa have a pleasant mouthfeel.
The percentage of “water filling” shows a vari-ation range of 16–66%. This variable measuresthe water absorption capacity of starch for pastaelaboration and making of bread and pastries. Theideal value of this parameter for industrial appli-cation is ≥50%. There are quinoa germplasm inthe collection which meet this parameter and canbe an important source of genes to develop theseproducts.
The quinoa in the Bolivian germplasm collec-tion has a wide range of diversity as measured byagro-food and nutritive variables. This diversity isvaluable when incorporating quinoa in processedproducts to make appropriate use of the geneticpotential of quinoa. It is possible to select varietieswith higher protein percentages (≥18%) andobtain more attractive products. Varieties withsmall starch granule diameters (≤3 μ) can beused for expanded and homogeneous popping.Varieties with stable percentages of amyloseand amylopectin can be used for making pud-dings, gelatinised baby food, instant creams,and noodles, among others. Using quinoa in
processed products is congruent with the goals ofconservation and preservation of genetic diversity.
Molecular characterization
Two types of markers (SSR and ISSR) were usedto characterize 86% (2,701 accessions) of the Boli-vian collection. The markers revealed 3 to 13 poly-morphic alleles, generating a genetic fingerprintfor each quinoa accession. Furthermore, using theinformation generated, similar accessions can begrouped and related at a molecular level. In addi-tion, the DNA extraction method for quinoa wasstandardized.
Multiplication and regenerationof quinoa germplasm
Although the seeds from the quinoa germplasmare stored in optimum conditions, with thepassage of time they decrease in both quantity(because of use and distribution) and germinationpercentage. According to Jaramillo and Baena(2000), if the objective is to bring seed samples toan optimal number, the process is termed “mul-tiplication”; if the goal is to recover the initialgermination percentage, the process is called“regeneration” or “rejuvenation.” In any case,samples obtained from the multiplication and/orregeneration process must be viable, healthy, of
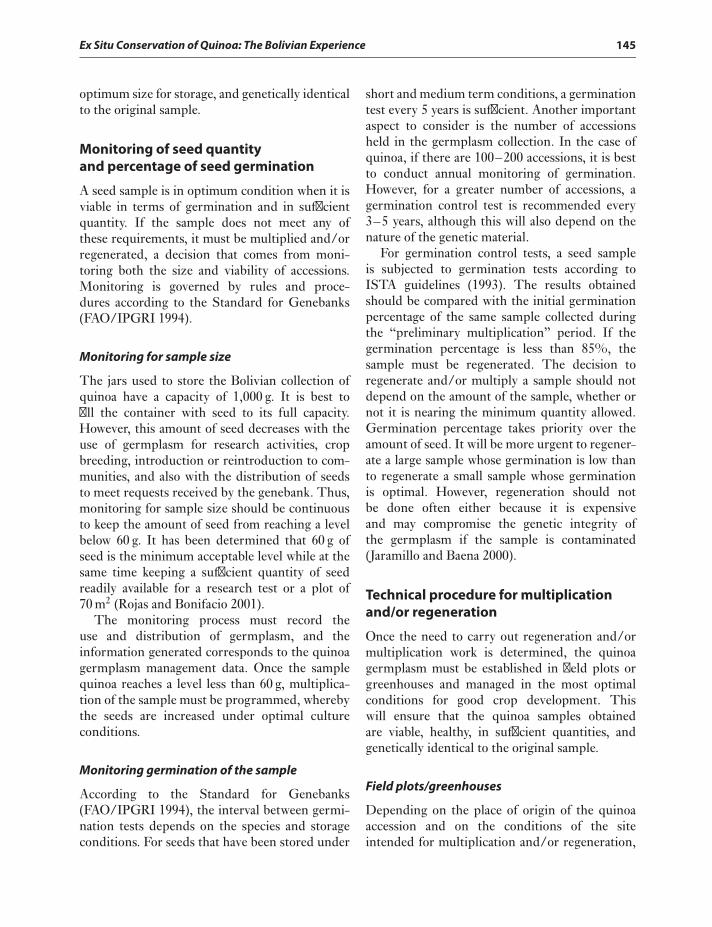
Ex Situ Conservation of Quinoa: The Bolivian Experience 145
optimum size for storage, and genetically identicalto the original sample.
Monitoring of seed quantityand percentage of seed germination
A seed sample is in optimum condition when it isviable in terms of germination and in sufficientquantity. If the sample does not meet any ofthese requirements, it must be multiplied and/orregenerated, a decision that comes from moni-toring both the size and viability of accessions.Monitoring is governed by rules and proce-dures according to the Standard for Genebanks(FAO/IPGRI 1994).
Monitoring for sample size
The jars used to store the Bolivian collection ofquinoa have a capacity of 1,000 g. It is best tofill the container with seed to its full capacity.However, this amount of seed decreases with theuse of germplasm for research activities, cropbreeding, introduction or reintroduction to com-munities, and also with the distribution of seedsto meet requests received by the genebank. Thus,monitoring for sample size should be continuousto keep the amount of seed from reaching a levelbelow 60 g. It has been determined that 60 g ofseed is the minimum acceptable level while at thesame time keeping a sufficient quantity of seedreadily available for a research test or a plot of70 m2 (Rojas and Bonifacio 2001).
The monitoring process must record theuse and distribution of germplasm, and theinformation generated corresponds to the quinoagermplasm management data. Once the samplequinoa reaches a level less than 60 g, multiplica-tion of the sample must be programmed, wherebythe seeds are increased under optimal cultureconditions.
Monitoring germination of the sample
According to the Standard for Genebanks(FAO/IPGRI 1994), the interval between germi-nation tests depends on the species and storageconditions. For seeds that have been stored under
short and medium term conditions, a germinationtest every 5 years is sufficient. Another importantaspect to consider is the number of accessionsheld in the germplasm collection. In the case ofquinoa, if there are 100–200 accessions, it is bestto conduct annual monitoring of germination.However, for a greater number of accessions, agermination control test is recommended every3–5 years, although this will also depend on thenature of the genetic material.
For germination control tests, a seed sampleis subjected to germination tests according toISTA guidelines (1993). The results obtainedshould be compared with the initial germinationpercentage of the same sample collected duringthe “preliminary multiplication” period. If thegermination percentage is less than 85%, thesample must be regenerated. The decision toregenerate and/or multiply a sample should notdepend on the amount of the sample, whether ornot it is nearing the minimum quantity allowed.Germination percentage takes priority over theamount of seed. It will be more urgent to regener-ate a large sample whose germination is low thanto regenerate a small sample whose germinationis optimal. However, regeneration should notbe done often either because it is expensiveand may compromise the genetic integrity ofthe germplasm if the sample is contaminated(Jaramillo and Baena 2000).
Technical procedure for multiplicationand/or regeneration
Once the need to carry out regeneration and/ormultiplication work is determined, the quinoagermplasm must be established in field plots orgreenhouses and managed in the most optimalconditions for good crop development. Thiswill ensure that the quinoa samples obtainedare viable, healthy, in sufficient quantities, andgenetically identical to the original sample.
Field plots/greenhouses
Depending on the place of origin of the quinoaaccession and on the conditions of the siteintended for multiplication and/or regeneration,
146 Quinoa: Improvement and Sustainable Production
it is recommended that this activity be done underfield conditions so quinoa plants can express theirgenetic potential in natural environments. In fieldplots, there should be six rows per accession, witha furrow 5 m long. Once quinoa plants reach phys-iological maturity, the four central rows shouldbe harvested, leaving 50 cm headers at both endsof the plot. If there is less available land, plotswith four rows per accession can also be planted.To facilitate management, the rows should bespaced uniformly. Crop management practicesusually carried out on the quinoa crop should beperformed in a timely manner. However, if anaccession has a small amount of seed or very lowlevels of germination, it requires more care toregenerate or multiply it. Therefore, the samplecan be grown in greenhouses or under controlledenvironments, where suitable substrates forsowing can be prepared, soil moisture controlledwith appropriate irrigation, and temperatureregulated with simple aeration systems.
Prevention of pollen exchange
Great care should be taken to prevent gene flowand contamination by pollen exchange betweentwo accessions, because quinoa is a partiallyallogamous species (10–15%). To overcome thischallenge, accessions with short phenologicalcycle can be planted alternately with accessionsthat have long phenological cycle, so that theirflowering phases do not coincide. Panicles canalso be bagged using paper envelopes immediatelybefore the quinoa plants enter the flowering phase.Another way to reduce allogamy and preventcontamination is to plant other crops in alternaterows with quinoa, preferably those similar inheight or architecture. It is also equally importantto avoid mechanical mixing of accessions, whichis common when handling quinoa germplasm,especially during threshing and venting. Carefuland correct management of the identification ofevery accession is recommended, from its estab-lishment in the field to harvest and postharvestoperations.
Finally, once the quinoa germplasm sampleis multiplied and/or regenerated, the germi-nation test must be redone. After fulfilling the
requirements established by the Standard forGenebanks (FAO/IPGRI 1994) and for quinoagermplasm, the sample must be conditionedfor the corresponding storage duration. Thepercentage of germination and the quantity ofseed both serve as points of reference for the nextmonitoring cycle.
Regeneration schedule
When a germplasm collection consists of thou-sands of accessions, such as the case of theBolivian quinoa germplasm collection, this stagein the genebank management requires consider-able attention to technical details. Because of thewide genetic variability of the accessions, differentgrowth traits and behaviors are expected whenevaluating germination percentage over time.
To develop a regeneration schedule of thegermplasm collection, the “monitoring of ger-mination behavior” has been implemented since2004 in a continuous manner in different groupsof cultivated and wild quinoa. This work beganwith the formation of nine groups of cultivatedquinoa and five groups of wild quinoa withsimilar germination percentages. Representativeaccessions were selected from each group, whiletaking into consideration the agromorphologicalvariability and passport data of these accessions.
Fig. 8.9 shows half-year results for the period2004–2010 from the four groups of cultivatedquinoa (Q-1, Q-2, Q-3, and Q-4) and two groupsof wild quinoa (QS-1 and QS-2), stored undershort and medium term conditions. As expected,the results indicate that there is a variation inthe levels of maintenance of seed germination.In general, an average reduction of germinationfrom 8% to 40% was observed for the studyperiod. From these results, it can be seen thatQ-1 seeds need to be regenerated after 2 years ofstorage, the Q-2 seeds after 4 years, and the Q-3seeds after 6 years, as germination levels are belowthe level required by the Standard for Genebanks(FAO/IPGRI 1994).
While this schedule of quinoa germplasmregeneration is still being developed, it clearlyindicates that generalizations cannot be made
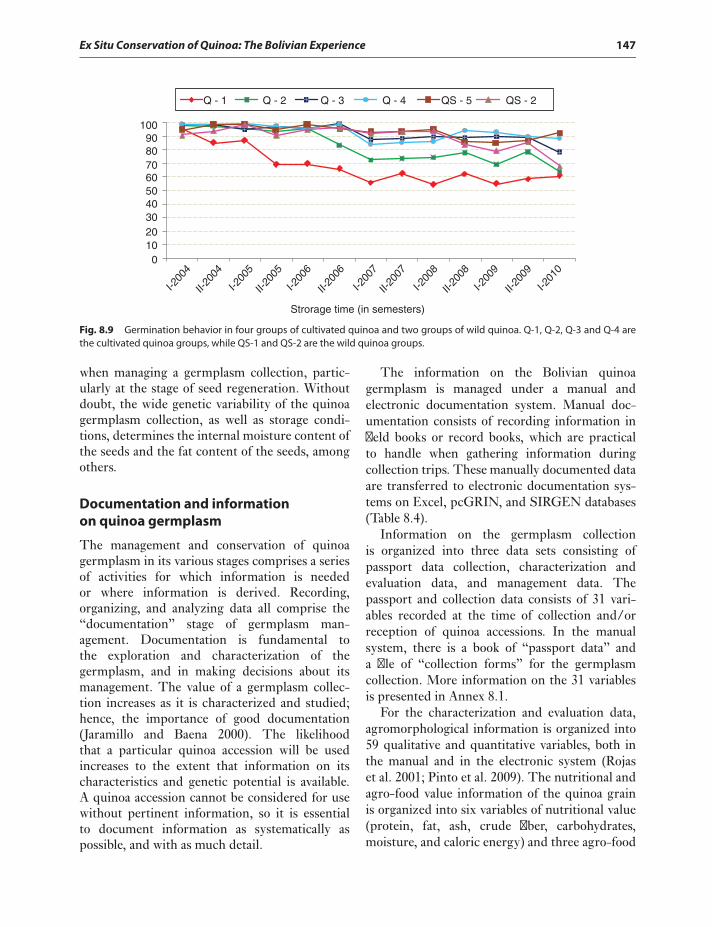
Ex Situ Conservation of Quinoa: The Bolivian Experience 147
I-200
4
II-20
04
II-20
05
II-20
06
I-200
5
I-200
6
II-20
07
I-200
7
II-20
08
II-20
09
I-200
9
I-200
8
I-201
0
Strorage time (in semesters)
0
2030
10
405060708090
100
Q - 2 Q - 3 Q - 4 QS - 5 QS - 2Q - 1
Fig. 8.9 Germination behavior in four groups of cultivated quinoa and two groups of wild quinoa. Q-1, Q-2, Q-3 and Q-4 arethe cultivated quinoa groups, while QS-1 and QS-2 are the wild quinoa groups.
when managing a germplasm collection, partic-ularly at the stage of seed regeneration. Withoutdoubt, the wide genetic variability of the quinoagermplasm collection, as well as storage condi-tions, determines the internal moisture content ofthe seeds and the fat content of the seeds, amongothers.
Documentation and informationon quinoa germplasm
The management and conservation of quinoagermplasm in its various stages comprises a seriesof activities for which information is neededor where information is derived. Recording,organizing, and analyzing data all comprise the“documentation” stage of germplasm man-agement. Documentation is fundamental tothe exploration and characterization of thegermplasm, and in making decisions about itsmanagement. The value of a germplasm collec-tion increases as it is characterized and studied;hence, the importance of good documentation(Jaramillo and Baena 2000). The likelihoodthat a particular quinoa accession will be usedincreases to the extent that information on itscharacteristics and genetic potential is available.A quinoa accession cannot be considered for usewithout pertinent information, so it is essentialto document information as systematically aspossible, and with as much detail.
The information on the Bolivian quinoagermplasm is managed under a manual andelectronic documentation system. Manual doc-umentation consists of recording information infield books or record books, which are practicalto handle when gathering information duringcollection trips. These manually documented dataare transferred to electronic documentation sys-tems on Excel, pcGRIN, and SIRGEN databases(Table 8.4).
Information on the germplasm collectionis organized into three data sets consisting ofpassport data collection, characterization andevaluation data, and management data. Thepassport and collection data consists of 31 vari-ables recorded at the time of collection and/orreception of quinoa accessions. In the manualsystem, there is a book of “passport data” anda file of “collection forms” for the germplasmcollection. More information on the 31 variablesis presented in Annex 8.1.
For the characterization and evaluation data,agromorphological information is organized into59 qualitative and quantitative variables, both inthe manual and in the electronic system (Rojaset al. 2001; Pinto et al. 2009). The nutritional andagro-food value information of the quinoa grainis organized into six variables of nutritional value(protein, fat, ash, crude fiber, carbohydrates,moisture, and caloric energy) and three agro-food
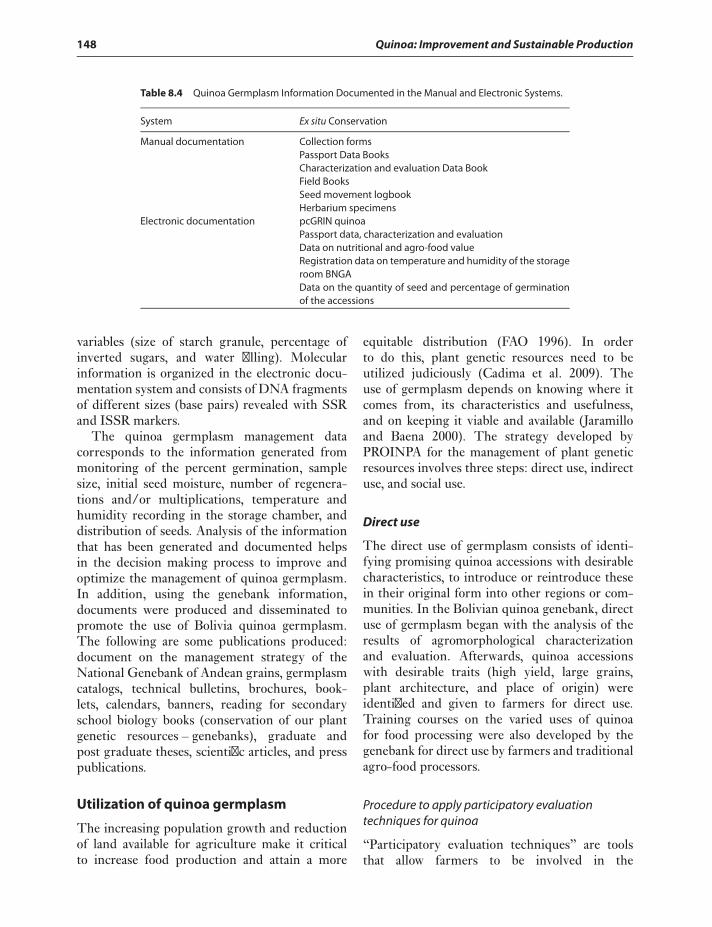
148 Quinoa: Improvement and Sustainable Production
Table 8.4 Quinoa Germplasm Information Documented in the Manual and Electronic Systems.
System Ex situ Conservation
Manual documentation Collection formsPassport Data BooksCharacterization and evaluation Data BookField BooksSeed movement logbookHerbarium specimens
Electronic documentation pcGRIN quinoaPassport data, characterization and evaluationData on nutritional and agro-food valueRegistration data on temperature and humidity of the storageroom BNGAData on the quantity of seed and percentage of germinationof the accessions
variables (size of starch granule, percentage ofinverted sugars, and water filling). Molecularinformation is organized in the electronic docu-mentation system and consists of DNA fragmentsof different sizes (base pairs) revealed with SSRand ISSR markers.
The quinoa germplasm management datacorresponds to the information generated frommonitoring of the percent germination, samplesize, initial seed moisture, number of regenera-tions and/or multiplications, temperature andhumidity recording in the storage chamber, anddistribution of seeds. Analysis of the informationthat has been generated and documented helpsin the decision making process to improve andoptimize the management of quinoa germplasm.In addition, using the genebank information,documents were produced and disseminated topromote the use of Bolivia quinoa germplasm.The following are some publications produced:document on the management strategy of theNational Genebank of Andean grains, germplasmcatalogs, technical bulletins, brochures, book-lets, calendars, banners, reading for secondaryschool biology books (conservation of our plantgenetic resources – genebanks), graduate andpost graduate theses, scientific articles, and presspublications.
Utilization of quinoa germplasm
The increasing population growth and reductionof land available for agriculture make it criticalto increase food production and attain a more
equitable distribution (FAO 1996). In orderto do this, plant genetic resources need to beutilized judiciously (Cadima et al. 2009). Theuse of germplasm depends on knowing where itcomes from, its characteristics and usefulness,and on keeping it viable and available (Jaramilloand Baena 2000). The strategy developed byPROINPA for the management of plant geneticresources involves three steps: direct use, indirectuse, and social use.
Direct use
The direct use of germplasm consists of identi-fying promising quinoa accessions with desirablecharacteristics, to introduce or reintroduce thesein their original form into other regions or com-munities. In the Bolivian quinoa genebank, directuse of germplasm began with the analysis of theresults of agromorphological characterizationand evaluation. Afterwards, quinoa accessionswith desirable traits (high yield, large grains,plant architecture, and place of origin) wereidentified and given to farmers for direct use.Training courses on the varied uses of quinoafor food processing were also developed by thegenebank for direct use by farmers and traditionalagro-food processors.
Procedure to apply participatory evaluationtechniques for quinoa
“Participatory evaluation techniques” are toolsthat allow farmers to be involved in the
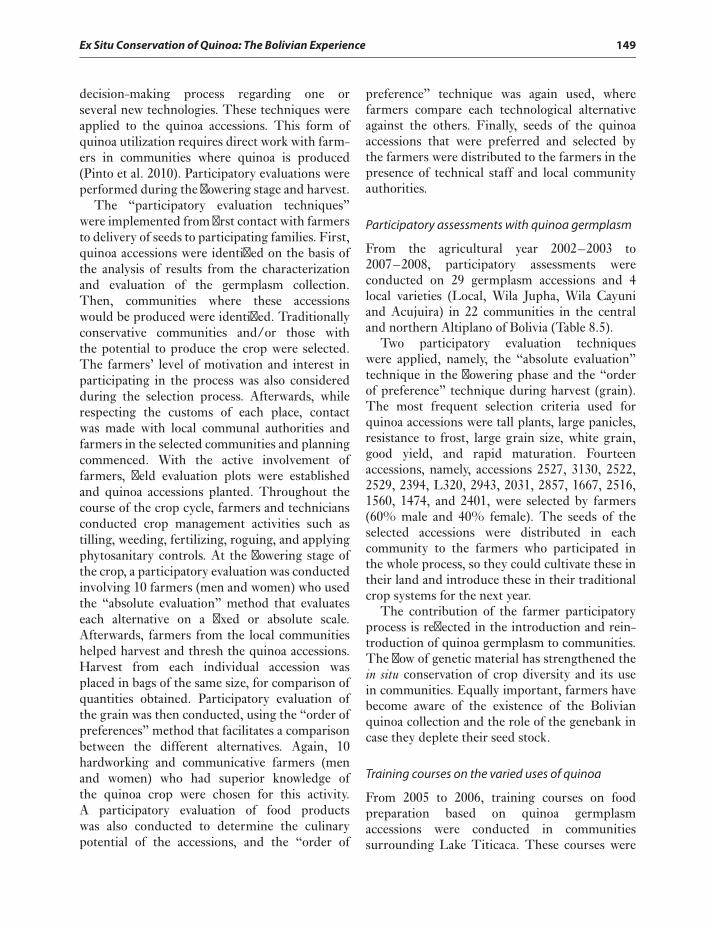
Ex Situ Conservation of Quinoa: The Bolivian Experience 149
decision-making process regarding one orseveral new technologies. These techniques wereapplied to the quinoa accessions. This form ofquinoa utilization requires direct work with farm-ers in communities where quinoa is produced(Pinto et al. 2010). Participatory evaluations wereperformed during the flowering stage and harvest.
The “participatory evaluation techniques”were implemented from first contact with farmersto delivery of seeds to participating families. First,quinoa accessions were identified on the basis ofthe analysis of results from the characterizationand evaluation of the germplasm collection.Then, communities where these accessionswould be produced were identified. Traditionallyconservative communities and/or those withthe potential to produce the crop were selected.The farmers’ level of motivation and interest inparticipating in the process was also consideredduring the selection process. Afterwards, whilerespecting the customs of each place, contactwas made with local communal authorities andfarmers in the selected communities and planningcommenced. With the active involvement offarmers, field evaluation plots were establishedand quinoa accessions planted. Throughout thecourse of the crop cycle, farmers and techniciansconducted crop management activities such astilling, weeding, fertilizing, roguing, and applyingphytosanitary controls. At the flowering stage ofthe crop, a participatory evaluation was conductedinvolving 10 farmers (men and women) who usedthe “absolute evaluation” method that evaluateseach alternative on a fixed or absolute scale.Afterwards, farmers from the local communitieshelped harvest and thresh the quinoa accessions.Harvest from each individual accession wasplaced in bags of the same size, for comparison ofquantities obtained. Participatory evaluation ofthe grain was then conducted, using the “order ofpreferences” method that facilitates a comparisonbetween the different alternatives. Again, 10hardworking and communicative farmers (menand women) who had superior knowledge ofthe quinoa crop were chosen for this activity.A participatory evaluation of food productswas also conducted to determine the culinarypotential of the accessions, and the “order of
preference” technique was again used, wherefarmers compare each technological alternativeagainst the others. Finally, seeds of the quinoaaccessions that were preferred and selected bythe farmers were distributed to the farmers in thepresence of technical staff and local communityauthorities.
Participatory assessments with quinoa germplasm
From the agricultural year 2002–2003 to2007–2008, participatory assessments wereconducted on 29 germplasm accessions and 4local varieties (Local, Wila Jupha, Wila Cayuniand Acujuira) in 22 communities in the centraland northern Altiplano of Bolivia (Table 8.5).
Two participatory evaluation techniqueswere applied, namely, the “absolute evaluation”technique in the flowering phase and the “orderof preference” technique during harvest (grain).The most frequent selection criteria used forquinoa accessions were tall plants, large panicles,resistance to frost, large grain size, white grain,good yield, and rapid maturation. Fourteenaccessions, namely, accessions 2527, 3130, 2522,2529, 2394, L320, 2943, 2031, 2857, 1667, 2516,1560, 1474, and 2401, were selected by farmers(60% male and 40% female). The seeds of theselected accessions were distributed in eachcommunity to the farmers who participated inthe whole process, so they could cultivate these intheir land and introduce these in their traditionalcrop systems for the next year.
The contribution of the farmer participatoryprocess is reflected in the introduction and rein-troduction of quinoa germplasm to communities.The flow of genetic material has strengthened thein situ conservation of crop diversity and its usein communities. Equally important, farmers havebecome aware of the existence of the Bolivianquinoa collection and the role of the genebank incase they deplete their seed stock.
Training courses on the varied uses of quinoa
From 2005 to 2006, training courses on foodpreparation based on quinoa germplasmaccessions were conducted in communitiessurrounding Lake Titicaca. These courses were
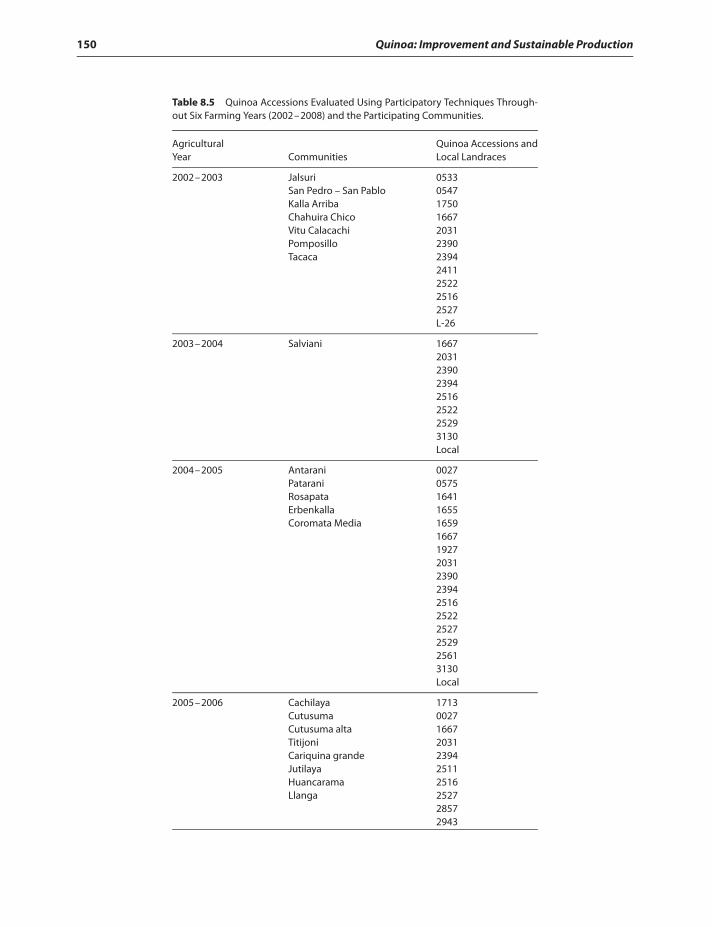
150 Quinoa: Improvement and Sustainable Production
Table 8.5 Quinoa Accessions Evaluated Using Participatory Techniques Through-out Six Farming Years (2002–2008) and the Participating Communities.
Agricultural Quinoa Accessions andYear Communities Local Landraces
2002–2003 JalsuriSan Pedro – San PabloKalla ArribaChahuira ChicoVitu CalacachiPomposilloTacaca
05330547175016672031239023942411252225162527L-26
2003–2004 Salviani 16672031239023942516252225293130Local
2004–2005 AntaraniPataraniRosapataErbenkallaCoromata Media
0027057516411655165916671927203123902394251625222527252925613130Local
2005–2006 CachilayaCutusumaCutusuma altaTitijoniCariquina grandeJutilayaHuancaramaLlanga
1713002716672031239425112516252728572943
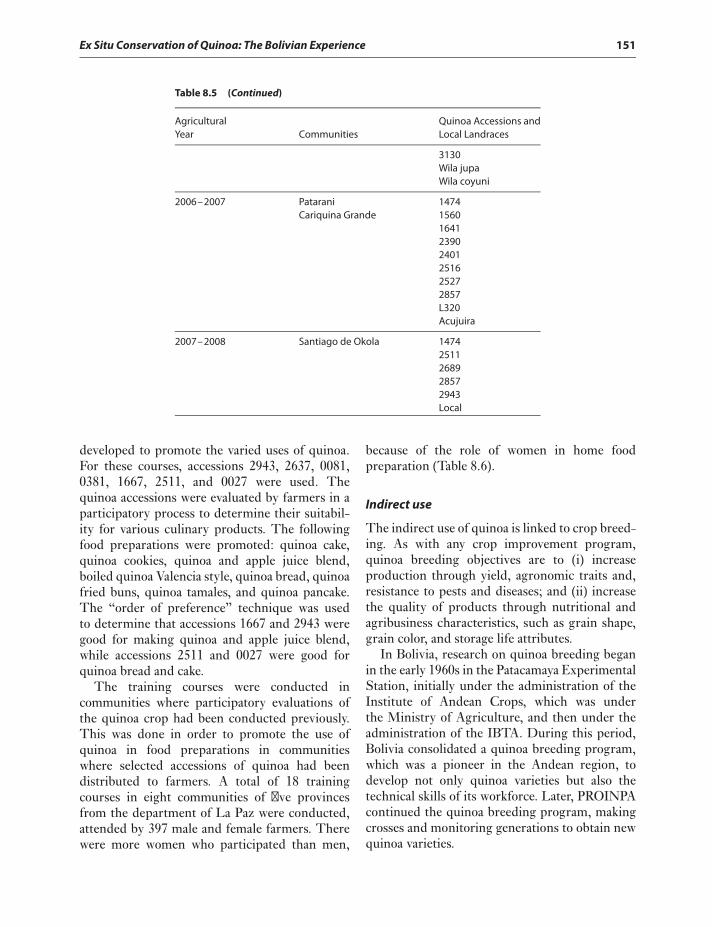
Ex Situ Conservation of Quinoa: The Bolivian Experience 151
Table 8.5 (Continued)
Agricultural Quinoa Accessions andYear Communities Local Landraces
3130Wila jupaWila coyuni
2006–2007 PataraniCariquina Grande
14741560164123902401251625272857L320Acujuira
2007–2008 Santiago de Okola 14742511268928572943Local
developed to promote the varied uses of quinoa.For these courses, accessions 2943, 2637, 0081,0381, 1667, 2511, and 0027 were used. Thequinoa accessions were evaluated by farmers in aparticipatory process to determine their suitabil-ity for various culinary products. The followingfood preparations were promoted: quinoa cake,quinoa cookies, quinoa and apple juice blend,boiled quinoa Valencia style, quinoa bread, quinoafried buns, quinoa tamales, and quinoa pancake.The “order of preference” technique was usedto determine that accessions 1667 and 2943 weregood for making quinoa and apple juice blend,while accessions 2511 and 0027 were good forquinoa bread and cake.
The training courses were conducted incommunities where participatory evaluations ofthe quinoa crop had been conducted previously.This was done in order to promote the use ofquinoa in food preparations in communitieswhere selected accessions of quinoa had beendistributed to farmers. A total of 18 trainingcourses in eight communities of five provincesfrom the department of La Paz were conducted,attended by 397 male and female farmers. Therewere more women who participated than men,
because of the role of women in home foodpreparation (Table 8.6).
Indirect use
The indirect use of quinoa is linked to crop breed-ing. As with any crop improvement program,quinoa breeding objectives are to (i) increaseproduction through yield, agronomic traits and,resistance to pests and diseases; and (ii) increasethe quality of products through nutritional andagribusiness characteristics, such as grain shape,grain color, and storage life attributes.
In Bolivia, research on quinoa breeding beganin the early 1960s in the Patacamaya ExperimentalStation, initially under the administration of theInstitute of Andean Crops, which was underthe Ministry of Agriculture, and then under theadministration of the IBTA. During this period,Bolivia consolidated a quinoa breeding program,which was a pioneer in the Andean region, todevelop not only quinoa varieties but also thetechnical skills of its workforce. Later, PROINPAcontinued the quinoa breeding program, makingcrosses and monitoring generations to obtain newquinoa varieties.
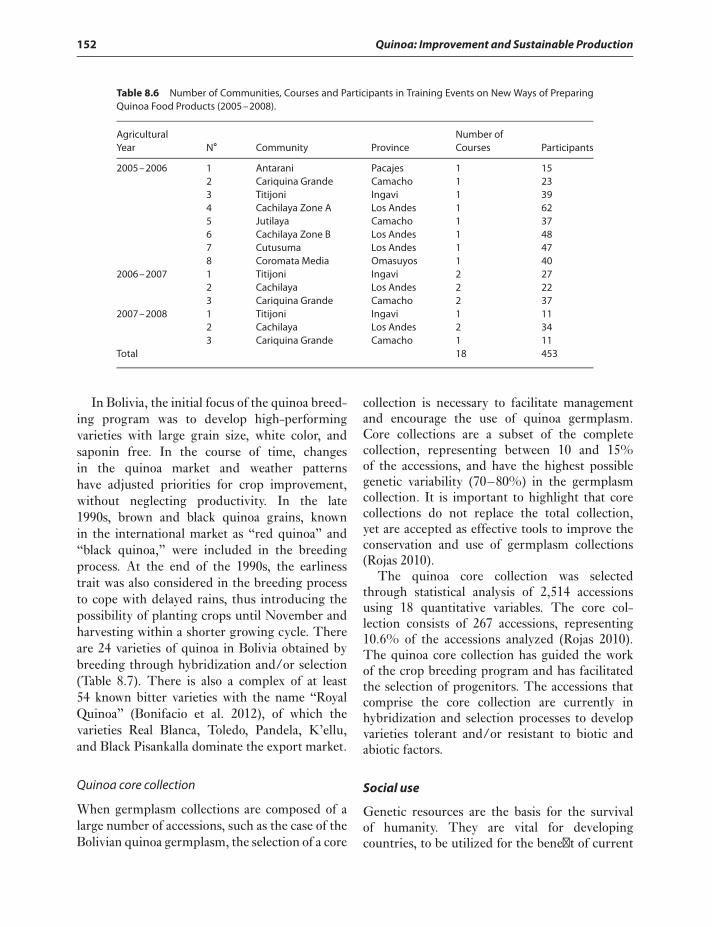
152 Quinoa: Improvement and Sustainable Production
Table 8.6 Number of Communities, Courses and Participants in Training Events on New Ways of PreparingQuinoa Food Products (2005–2008).
Agricultural Number ofYear N∘ Community Province Courses Participants
2005–2006 1 Antarani Pacajes 1 152 Cariquina Grande Camacho 1 233 Titijoni Ingavi 1 394 Cachilaya Zone A Los Andes 1 625 Jutilaya Camacho 1 376 Cachilaya Zone B Los Andes 1 487 Cutusuma Los Andes 1 478 Coromata Media Omasuyos 1 40
2006–2007 1 Titijoni Ingavi 2 272 Cachilaya Los Andes 2 223 Cariquina Grande Camacho 2 37
2007–2008 1 Titijoni Ingavi 1 112 Cachilaya Los Andes 2 343 Cariquina Grande Camacho 1 11
Total 18 453
In Bolivia, the initial focus of the quinoa breed-ing program was to develop high-performingvarieties with large grain size, white color, andsaponin free. In the course of time, changesin the quinoa market and weather patternshave adjusted priorities for crop improvement,without neglecting productivity. In the late1990s, brown and black quinoa grains, knownin the international market as “red quinoa” and“black quinoa,” were included in the breedingprocess. At the end of the 1990s, the earlinesstrait was also considered in the breeding processto cope with delayed rains, thus introducing thepossibility of planting crops until November andharvesting within a shorter growing cycle. Thereare 24 varieties of quinoa in Bolivia obtained bybreeding through hybridization and/or selection(Table 8.7). There is also a complex of at least54 known bitter varieties with the name “RoyalQuinoa” (Bonifacio et al. 2012), of which thevarieties Real Blanca, Toledo, Pandela, K’ellu,and Black Pisankalla dominate the export market.
Quinoa core collection
When germplasm collections are composed of alarge number of accessions, such as the case of theBolivian quinoa germplasm, the selection of a core
collection is necessary to facilitate managementand encourage the use of quinoa germplasm.Core collections are a subset of the completecollection, representing between 10 and 15%of the accessions, and have the highest possiblegenetic variability (70–80%) in the germplasmcollection. It is important to highlight that corecollections do not replace the total collection,yet are accepted as effective tools to improve theconservation and use of germplasm collections(Rojas 2010).
The quinoa core collection was selectedthrough statistical analysis of 2,514 accessionsusing 18 quantitative variables. The core col-lection consists of 267 accessions, representing10.6% of the accessions analyzed (Rojas 2010).The quinoa core collection has guided the workof the crop breeding program and has facilitatedthe selection of progenitors. The accessions thatcomprise the core collection are currently inhybridization and selection processes to developvarieties tolerant and/or resistant to biotic andabiotic factors.
Social use
Genetic resources are the basis for the survivalof humanity. They are vital for developingcountries, to be utilized for the benefit of current
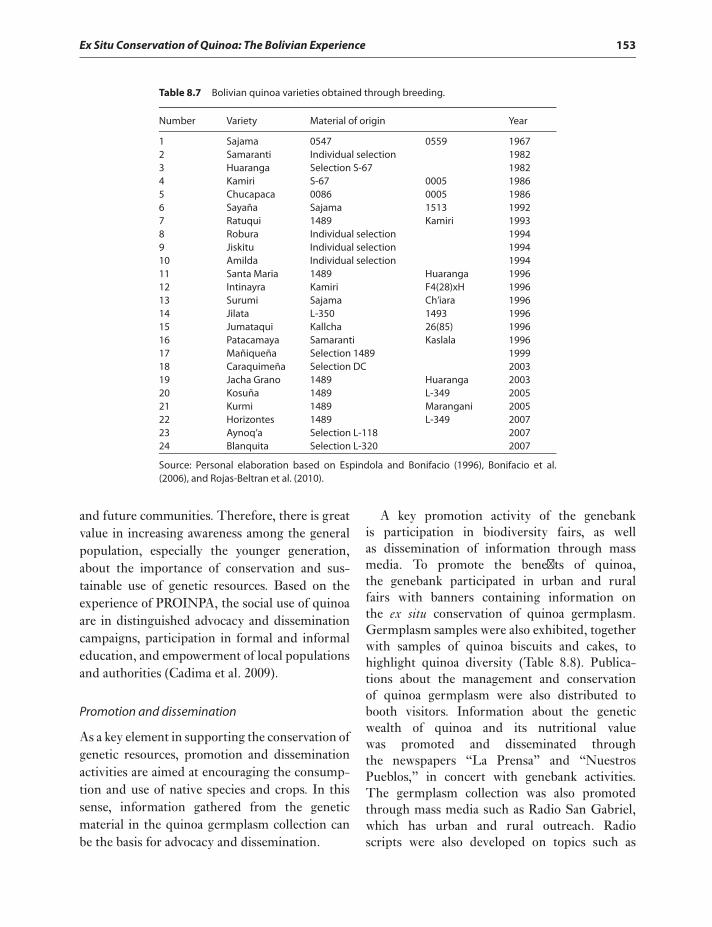
Ex Situ Conservation of Quinoa: The Bolivian Experience 153
Table 8.7 Bolivian quinoa varieties obtained through breeding.
Number Variety Material of origin Year
1 Sajama 0547 0559 19672 Samaranti Individual selection 19823 Huaranga Selection S-67 19824 Kamiri S-67 0005 19865 Chucapaca 0086 0005 19866 Sayaña Sajama 1513 19927 Ratuqui 1489 Kamiri 19938 Robura Individual selection 19949 Jiskitu Individual selection 199410 Amilda Individual selection 199411 Santa Maria 1489 Huaranga 199612 Intinayra Kamiri F4(28)xH 199613 Surumi Sajama Ch’iara 199614 Jilata L-350 1493 199615 Jumataqui Kallcha 26(85) 199616 Patacamaya Samaranti Kaslala 199617 Mañiqueña Selection 1489 199918 Caraquimeña Selection DC 200319 Jacha Grano 1489 Huaranga 200320 Kosuña 1489 L-349 200521 Kurmi 1489 Marangani 200522 Horizontes 1489 L-349 200723 Aynoq’a Selection L-118 200724 Blanquita Selection L-320 2007
Source: Personal elaboration based on Espindola and Bonifacio (1996), Bonifacio et al.(2006), and Rojas-Beltran et al. (2010).
and future communities. Therefore, there is greatvalue in increasing awareness among the generalpopulation, especially the younger generation,about the importance of conservation and sus-tainable use of genetic resources. Based on theexperience of PROINPA, the social use of quinoaare in distinguished advocacy and disseminationcampaigns, participation in formal and informaleducation, and empowerment of local populationsand authorities (Cadima et al. 2009).
Promotion and dissemination
As a key element in supporting the conservation ofgenetic resources, promotion and disseminationactivities are aimed at encouraging the consump-tion and use of native species and crops. In thissense, information gathered from the geneticmaterial in the quinoa germplasm collection canbe the basis for advocacy and dissemination.
A key promotion activity of the genebankis participation in biodiversity fairs, as wellas dissemination of information through massmedia. To promote the benefits of quinoa,the genebank participated in urban and ruralfairs with banners containing information onthe ex situ conservation of quinoa germplasm.Germplasm samples were also exhibited, togetherwith samples of quinoa biscuits and cakes, tohighlight quinoa diversity (Table 8.8). Publica-tions about the management and conservationof quinoa germplasm were also distributed tobooth visitors. Information about the geneticwealth of quinoa and its nutritional valuewas promoted and disseminated throughthe newspapers “La Prensa” and “NuestrosPueblos,” in concert with genebank activities.The germplasm collection was also promotedthrough mass media such as Radio San Gabriel,which has urban and rural outreach. Radioscripts were also developed on topics such as
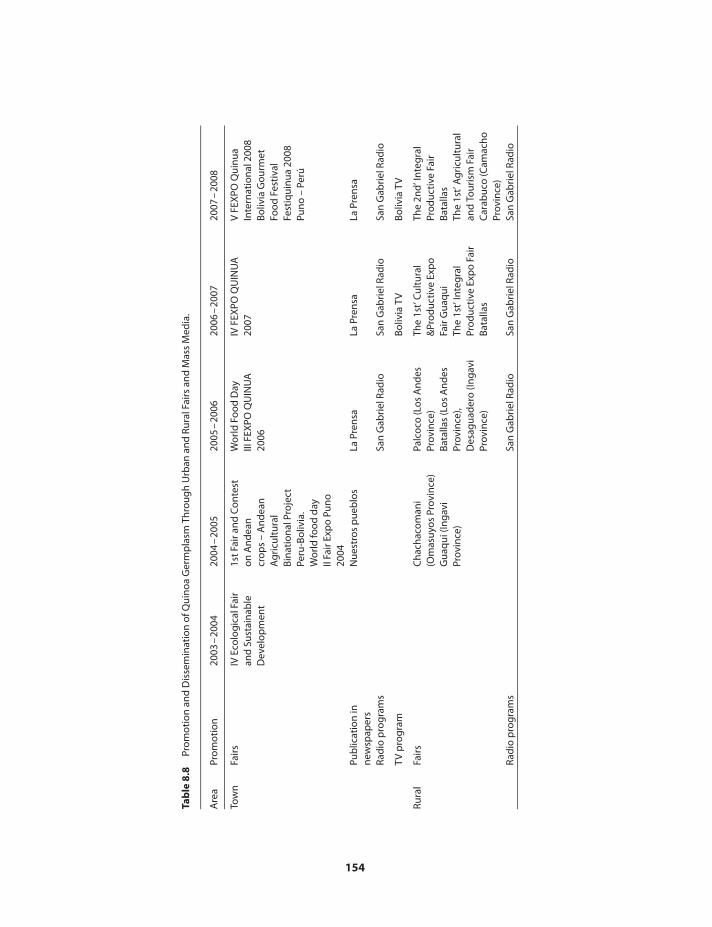
Tab
le8.
8Pr
omot
ion
and
Dis
sem
inat
ion
ofQ
uino
aG
erm
pla
smTh
roug
hU
rban
and
Rura
lFai
rsan
dM
ass
Med
ia.
Are
aPr
omot
ion
2003
–20
0420
04–
2005
2005
–20
0620
06–
2007
2007
–20
08
Tow
nFa
irsIV
Ecol
ogic
alFa
iran
dSu
stai
nab
leD
evel
opm
ent
1stF
aira
ndC
onte
ston
And
ean
crop
s–
And
ean
Agr
icul
tura
lBi
natio
nalP
roje
ctPe
ru-B
oliv
ia.
Wor
ldfo
odda
yII
Fair
Exp
oPu
no20
04
Wor
ldFo
odD
ayIII
FEX
POQ
UIN
UA
2006
IVFE
XPO
QU
INU
A20
07V
FEX
POQ
uinu
aIn
tern
atio
nal2
008
Boliv
iaG
ourm
etFo
odFe
stiv
alFe
stiq
uinu
a20
08Pu
no–
Perú
Pub
licat
ion
inne
wsp
aper
sN
uest
ros
pue
blo
sLa
Pren
saLa
Pren
saLa
Pren
sa
Radi
op
rogr
ams
San
Gab
rielR
adio
San
Gab
rielR
adio
San
Gab
rielR
adio
TVp
rogr
amBo
livia
TVBo
livia
TV
Rura
lFa
irsC
hach
acom
ani
(Om
asuy
osPr
ovin
ce)
Gua
qui(
Inga
viPr
ovin
ce)
Palc
oco
(Los
And
esPr
ovin
ce)
Bata
llas
(Los
And
esPr
ovin
ce),
Des
agua
dero
(Inga
viPr
ovin
ce)
The
1st’
Cul
tura
l&
Prod
uctiv
eEx
po
Fair
Gua
qui
The
1st’
Inte
gral
Prod
uctiv
eEx
po
Fair
Bata
llas
The
2nd’
Inte
gral
Prod
uctiv
eFa
irBa
talla
sTh
e1s
t’A
gric
ultu
ral
and
Tour
ism
Fair
Car
abuc
o(C
amac
hoPr
ovin
ce)
Radi
op
rogr
ams
San
Gab
rielR
adio
San
Gab
rielR
adio
San
Gab
rielR
adio
154
Ex Situ Conservation of Quinoa: The Bolivian Experience 155
“Quinoa Germplasm Bank,” “First Meetingof Farmers,” “Diversification of Quinoa-basedFood Uses,” “Participatory Evaluations,” “CropCultivation of Quinoa,” “Quinoa Seed Flowsin Fairs,” Diversity Contests,” “Testimonialson Diversity Contests,” “Biodiversity Fairs,”“Quinoa Planting,” “Quinoa Pest and Dis-ease Control,” “Quinoa Harvest,”“MedicinalValue of Quinoa,” Quinoa Nutritional Value,”and “Cultural Value of Quinoa,” for a totalof 28 scripts. The booklets were disseminatedthrough the “Agricultural” program in RadioSan Gabriel. Additionally, through the program“Palabra Rural” aired by Bolivia TV, documen-taries entitled “Quinoa germplasm bank andits role in the conservation of strategic geneticresources for the country” and “Diffusion ofquinoa varieties and accessions” were broadcast(Table 8.8).
Formal and informal education
More than 30 lectures and talks were given tofarmers; students and teachers from schools,colleges and, public and private universities; aswell as technicians and researchers from differentresearch institutions dedicated to Andean grains.Depending on the target audience, the lecturescovered the following topics: “Origin and Dis-tribution of Quinoa,” “Quinoa of Nutritional,Economic, Medical and Adaptive Importance,”“Training Quinoa Germplasm Bank,” “Con-ditions of Conservation of Genetic Material,”“Conservation ex situ,” “In situ Conservation,”and “Use of Genetic Material and Its NutritionalValue” (Table 8.9).
At conferences and lectures, seed samples ofthe quinoa germplasm collection were used toillustrate variation in shape, size, and color ofgrains. Quinoa panicles and plants were displayedto show differences in panicle shape and color,plant architecture, and other morphologicaltraits. Toward the middle part and end of thetalk, quinoa-based products such as biscuits,juice, pancakes, and nougats were tasted andappreciated by the audience.
CONCLUSIONS
Plant genetic resources are essential for foodsecurity and sovereignty of people groups world-wide, and contribute substantially to humanity’sbasic needs. These genetic resources are part ofthe ancestral and cultural heritage of countries.Their conservation and use is a responsibility thatmust be assumed by society in general, with theleadership of governments and the state. Thosetimes when the responsibility of managing geneticresources fell solely on particular institutions ororganizations are over. Now, all segments of theBolivian society must assume the responsibility,because it concerns everyone. We must start byvaluing this genetic heritage, recognizing that it ispart of our cultural identity, and be proud of thegenetic diversity under our stewardship. We needto teach our children the value and role played byplant genetic resources for the benefit of societyas a whole.
The conservation of plant genetic resourcesrequires institutional support through solidinfrastructures backed by clear policies andheaded by governments. State governments haveto provide sustained financial resources for vitalconservation activities. According to studies, theconservation of a sample of germplasm costsbetween 5 and 10 USD per year. No effort shouldbe spared when allocating annual budgets becausethese are valuable resources that should be passedon from generation to generation to support ourvery existence. Governments must also play aleading role in the specialized training of person-nel while ensuring work stability. At the sametime, governments must establish infrastructuresthat meet the minimum equipment conditionsrequired to manage and conserve germplasmcollections.
Management of the Bolivian quinoa germplasmcollection has allowed us to experience variedtechnical, social and financial situations. Vocationand commitment to work were the key elementsthat enabled us to make the Bolivian quinoagenebank the most important quinoa genebankin the world, with the greatest diversity andlargest number of accessions (FAO 2010). Thisis an exceptional achievement, especially in a
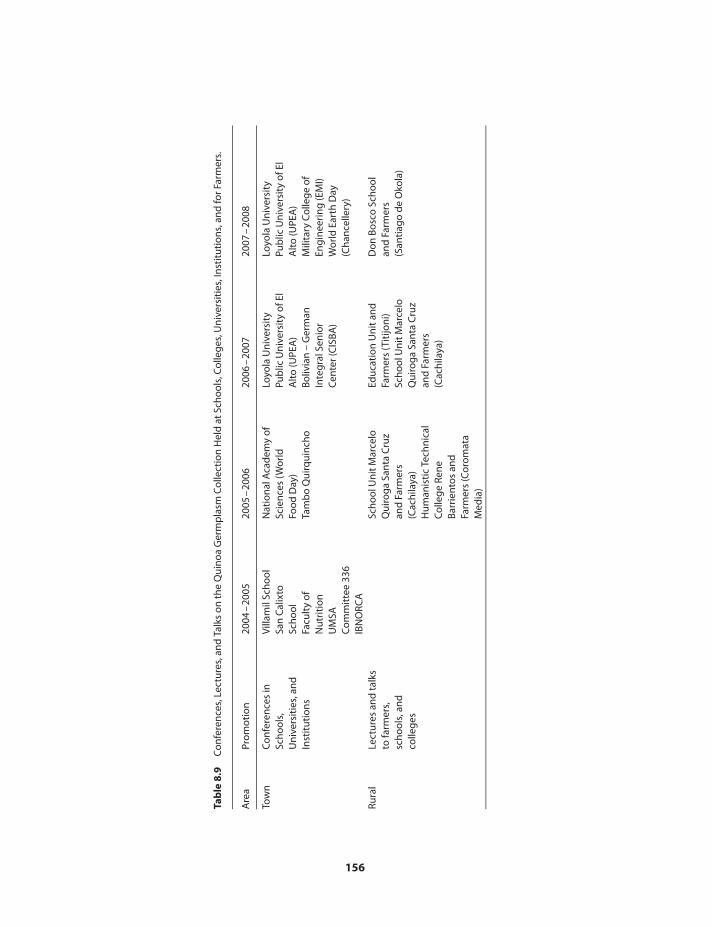
Tab
le8.
9C
onfe
renc
es,L
ectu
res,
and
Talk
son
the
Qui
noa
Ger
mp
lasm
Col
lect
ion
Hel
dat
Scho
ols,
Col
lege
s,U
nive
rsiti
es,I
nstit
utio
ns,a
ndfo
rFar
mer
s.
Are
aPr
omot
ion
2004
–20
0520
05–
2006
2006
–20
0720
07–
2008
Tow
nC
onfe
renc
esin
Scho
ols,
Uni
vers
ities
,and
Inst
itutio
ns
Villa
mil
Scho
olSa
nC
alix
toSc
hool
Facu
lty
ofN
utri
tion
UM
SAC
omm
ittee
336
IBN
ORC
A
Nat
iona
lAca
dem
yof
Scie
nces
(Wor
ldFo
odD
ay)
Tam
bo
Qui
rqui
ncho
Loyo
laU
nive
rsit
yPu
blic
Uni
vers
ity
ofEl
Alto
(UPE
A)
Boliv
ian
–G
erm
anIn
tegr
alSe
nior
Cen
ter(
CIS
BA)
Loyo
laU
nive
rsit
yPu
blic
Uni
vers
ity
ofEl
Alto
(UPE
A)
Mili
tary
Col
lege
ofEn
gine
erin
g(E
MI)
Wor
ldEa
rth
Day
(Cha
ncel
lery
)
Rura
lLe
ctur
esan
dta
lks
tofa
rmer
s,sc
hool
s,an
dco
llege
s
Scho
olU
nitM
arce
loQ
uiro
gaSa
nta
Cru
zan
dFa
rmer
s(C
achi
laya
)H
uman
istic
Tech
nica
lC
olle
geRe
neBa
rrie
ntos
and
Farm
ers
(Cor
omat
aM
edia
)
Educ
atio
nU
nita
ndFa
rmer
s(T
itijo
ni)
Scho
olU
nitM
arce
loQ
uiro
gaSa
nta
Cru
zan
dFa
rmer
s(C
achi
laya
)
Don
Bosc
oSc
hool
and
Farm
ers
(San
tiago
deO
kola
)
156
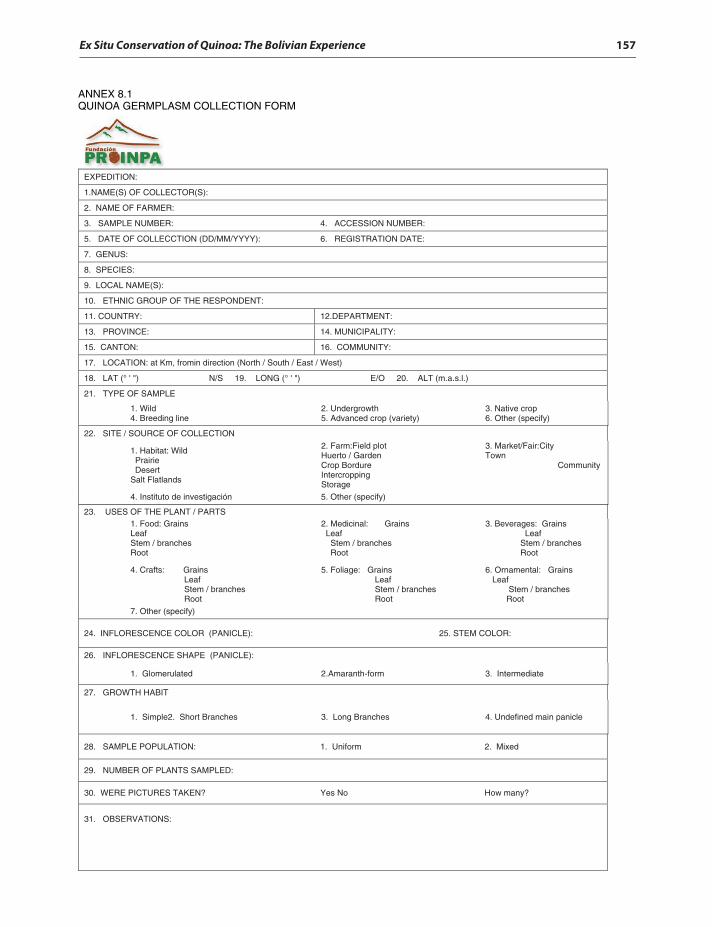
Ex Situ Conservation of Quinoa: The Bolivian Experience 157
EXPEDITION:
1.NAME(S) OF COLLECTOR(S):
2. NAME OF FARMER:
:REBMUN NOISSECCA .4 :REBMUN ELPMAS .3
5. DATE OF COLLECCTION (DD/MM/YYYY): 6. REGISTRATION DATE:
7. GENUS:
8. SPECIES:
9. LOCAL NAME(S):
10. ETHNIC GROUP OF THE RESPONDENT:
:TNEMTRAPED.21 :YRTNUOC .11
:YTILAPICINUM .41 :ECNIVORP .31
:YTINUMMOC .61 :NOTNAC .51
17. LOCATION: at Km, fromin direction (North / South / East / West)
18. LAT (° ' ") N/S 19. LONG (° ' ") E/O 20. ALT (m.a.s.l.)
21. TYPE OF SAMPLE
1. Wild 4. Breeding line
2. Undergrowth 5. Advanced crop (variety)
3. Native crop 6. Other (specify)
22. SITE / SOURCE OF COLLECTION
1. Habitat: Wild Prairie Desert Salt Flatlands
2. Farm:Field plot Huerto / Garden Crop Bordure Intercropping Storage
3. Market/Fair:City Town Community
)yficeps( rehtO .5 nóicagitsevni ed otutitsnI .4
23. USES OF THE PLANT / PARTS 1. Food: Grains
LeafStem / branches Root
2. Medicinal: Grains Leaf Stem / branches Root
3. Beverages: Grains Leaf Stem / branches Root
4. Crafts: Grains Leaf Stem / branches Root
5. Foliage: Grains Leaf Stem / branches Root
6. Ornamental: Grains Leaf Stem / branches Root
)yficeps( rehtO .7
24. INFLORESCENCE COLOR ( :ROLOC METS .52 :)ELCINAP
:)ELCINAP( EPAHS ECNECSEROLFNI .62
etaidemretnI .3 mrof-htnaramA.2 detaluremolG .1
27. GROWTH HABIT
elcinap niam denifednU .4 sehcnarB gnoL .3 sehcnarB trohS .2elpmiS .1
dexiM .2 mrofinU .1 :NOITALUPOP ELPMAS .82
:DELPMAS STNALP FO REBMUN .92
?ynam woH oN seY ?NEKAT SERUTCIP EREW .03
31. OBSERVATIONS:
ANNEX 8.1QUINOA GERMPLASM COLLECTION FORM
158 Quinoa: Improvement and Sustainable Production
developing country such as Bolivia, where con-servation of genetic resources and technologicaladvancements are not always a priority. We havelearned many valuable lessons from the wholeprocess of managing the quinoa collection. Thereare still many goals to be accomplished, and weshould be motivated to continue studying quinoaand other plant species, especially underutilizedspecies, such as cañahua, amaranth, and lupine.These species, owing to particular characteristics,can be grown for food in places of extreme povertyand adverse weather conditions. Thus, utilizationof these plant species should be a priority for allcountries worldwide.
REFERENCES
Aroni JC, Aroni G, Quispe R, Bonifacio A. 2003. Catálogo deQuinua Real. Cochabamba, Bolivia: Fundación PROINPA,51p.
Barriga P, Pessot R, Scaff R. 1994. Análisis de la diversidadgenética en el germoplasma de quinua (Chenopodium quinoaWilld.) recolectado en el sur de Chile. Agro Sur 22 (No. Esp.):4.
Bioversity International, FAO, PROINPA, INIAF, FIDA. 2013.Descriptores para quinua (Chenopodium quinoa Willd.) y susparientes silvestres. Bioversity International, Roma, Italia;Organización de las Naciones Unidas para la Agricultura y laAlimentación, Roma, Italia; Fundación PROINPA, La Paz,Bolivia; Instituto Nacional de Innovación Agropecuaria yForestal, La Paz, Bolivia; Fondo Internacional de DesarrolloAgrícola, Roma, Italia.
Bonifacio A, Mujica A, Alvarez A, Roca W. 2004. Mejoramientogenético, germoplasma y producción de semilla. Mujica A,Jacobsen S, Izquierdo J, Marathee JP, Quinua: ancestral cul-tivo andino, alimento del presente y futuro. FAO, UNA, CIP:Santiago, Chile. 125–187.
Bonifacio A, Rojas W, Saravia R, Aroni G, Gandarillas A.2006. PROINPA consolida un programa de mejoramientogenético y difusión de semilla de quinua. Informe Compendio2005–2006. Cochabamba, Bolivia: Fundación PROINPA.65–70.
Bonifacio A, Aroni G, Villca M. 2012. Catálogo etnobotánico dela Quinua Real. Cochabamba, Bolivia: Fundación PROINPA.1–123.
Bravo R, Catacora P. 2010. Situación actual de los bancosnacionales de germoplasma. Bravo R, Valdivia R, AndradeK, Padulosi S, Jagger M. Granos Andinos: avances, logros yexperiencias desarrolladas en quinua, cañihua y kiwicha enPerú. Roma, Italia: Bioversity International. 15–18.
Cadima X, Gabriel J, Terrazas F, Rojas W. 2009. MODULO 3:Usos de los recursos genéticos. En: Cursos semipresencial
sobre “Recursos Fitogenéticos, Riqueza Estratégica para elDesarrollo del País”. COSUDE – DANIDA, BioversityInternational, INIAF, Fundación PROINPA, pp. 1–35.
Cayoja MR. 1996. Caracterización de variables contínuas ydiscretas del grano de quinua (Chenopodium quinoa Willd.)del banco de germoplasma de la Estación ExperimentalPatacamaya. Tesis de Lic. en Agronomía. Oruro, Bolivia,Universidad Técnica Oruro, Facultad de Agronomía,pp. 1–129.
Ellis RH, Hong TD, Roberts EH. 1988. A low-moisture-contentlimit to logarithmic relations between seed moisture contentand longevity. Ann Botany 61: 405–408.
Engels JMM, Visser L 2003. A guide to effective management ofgermplasm collections. IPGRI Handbooks for Genebanks. 6.IPGRI, Rome, Italy.
Espindola G, Bonifacio A. 1996. Catálogo de variedades mejo-radas de quinua y recomendaciones para producción y uso desemilla certificada. Publicación conjunta IBTA/DNS: BoletínNo. 2, La Paz, Bolivia, 1–76.
[FAO/IPGRI] Food and Agriculture Organization of the UnitedNations/International Plant Genetic Resources Institute.1994. Genebanks standards. United Nations Food andAgriculture Organization & International Plant GeneticResources Institute, Rome, 1–13.
[FAO]Food and Agriculture Organization of the United Nations.1996. Informe sobre el estado de los recursos fitogenéticos enel mundo. Organización de las Naciones Unidas para la Agri-cultura y la Alimentación, Italia. 1–75.
[FAO] Food and Agriculture Organization of the United Nations.2010. The second report on the state of the world’s plantgenetic resources for food and agriculture. FAO, Rome, Italy.1–370.
Gallardo MG, Gonzalez JA. 1992. Efecto de algunos factoresambientales sobre la germinación de Chenopodium quinoaW. y sus posibilidades de cultivo en algunas zonas de laProvincia de Tucumán (Argentina). LILLOA XXXVIII.55–64.
Gandarillas H. 1968. Razas de quinua. Bolivia, Ministerio deAgricultura. División de Investigaciones Agrícolas. BoletínExperimental No. 4, 1–53.
Gandarillas H. 1979. Genética y origen. Tapia M. Quinua ykañiwa, cultivos andinos. Bogotá, Colombia: CIID, OficinaRegional para América Latina, 45–64.
Gandarillas H, Gandarillas C, Gandarillas A. 2001. HumbertoGandarillas. Historia de la investigación para el desarrolloagropecuario en Bolivia. Memorias de un investigador.Cochabamba, Bolivia. 139–142.
Genebank Standards. 1994. United Nations Food and Agricul-ture Organization and International Plant Genetic ResourcesInstitute [FAO/IPGRI], Rome, 1–13.
Guarino L, Ramanatha Rao V, Reid R. 1995. Collecting plantgenetic diversity. Technical Guidelines. CAB International,Wallingford, Reino Unido, a nombre del Instituto Interna-cional de Recursos Fitogenéticos (IPGRI) y en colaboración
Ex Situ Conservation of Quinoa: The Bolivian Experience 159
con la Organización de las Naciones Unidas para la Agricul-tura y la Alimentación (FAO), la Unión para la ConservaciónMundial (IUCN) y el Programa de las Naciones Unidas parael Medio Ambiente (PNUMA). Unidad 8.1.1 – Introduccióna la colecta de germoplasma y Unidad 8.2.1 – Planificación deuna colecta de germoplasma.
Gómez L, Eguiluz A. 2011. Catálogo del banco de germoplasmade quinua (Chenopodium quinoa Willd.). Universidad NacionalAgraria La Molina, Lima, Peru. 183.
Hawkes JG. 1980. Crop genetic resources field collection manual.IBPGR and EUCARPIA. University of Birmingham. Birm-ingham, England.
[IBPGR]International Board for Plant Genetic Resources. 1981.Descriptores de Quinua. Roma, Italy: IBPGR. 1–18.
[IPGRI]International Plant Genetic Resources Institute. 1996.Evaluation of seed storage containers used in genebanks.Report of a survey. Roma, Italia: IPGRI. 1–25.
[ISTA]International Seed Testing Association. 1993. Inter-national rules for seed testing. Seed Sci Technol,21(Supplement. Suiza: ISTA): 1–288.
Jacobsen SE, Sherwood S. 2002. Cultivo de granos Andinos enEcuador. Informe sobre los rubros quinua, chocho y amaranto.Organización de las Naciones Unidas para la Agricultura y laAlimentación (FAO), Centro Internacional de la Papa (CIP) yCatholic Relief Services (CRS). Quito, Ecuador. 1–89.
Jaramillo S, Baena M. 2000. Material de apoyo a la capacitación enconservación ex situ de recursos fitogenéticos. Instituto Inter-nacional de Recursos Fitogenéticos, Cali, Colombia. 1–210.
Leon R, Pinto M, Rojas W. 2007. Evaluación de parámetros detemperatura y humedad para la conservación de largo plazode quinua. Rojas W. Manejo, conservación y uso sosteniblede los recursos genéticos de granos altoandinos, en el marcodel SINARGEAA. Informe Anual 2006/2007. ProyectoSIBTA-SINARGEAA. MDRAMA - Fundación PROINPA,pp. 42–51.
Lescano JL. 1989. Avances sobre los recursos fitogenéticosaltoandinos. En: Curso: cultivos altoandinos. Potosí, Bolivia.17–21 de abril de 1989, pp. 19–35.
Lescano JL. 1994. Genética y mejoramiento de cultivosaltoandinos: quinua, kañihua, tarwi, kiwicha, papa amarga,olluco, mashua y oca. Programa Interinstitucional de WaruWaru, Convenio INADE/PELT - COTESU. Puno, Perú,pp. 1–459.
Mujica A. 1992. Granos y leguminosas andinas. Hernandez J,Bermejo J, Leon J. Cultivos marginados: otra perspectiva de1492. Organización de la Naciones Unidas para la Agriculturay la Alimentación. Roma: FAO. 129–146.
Pinto M, Poma S, Aroni G, Rojas W. 2009. Sistematizaciónde la información de manejo de la colección de quinua ycañahua para su actualización en el SIRGEN. Pinto M.Proyecto manejo, conservación y uso sostenible de losrecursos genéticos de granos Altoandinos, en el marco delSINARGEAA. Informe Final 2008–2009. La Paz, Bolivia:Fundación PROINPA. 30–36.
Pinto M, Polar V, Soto JL, Rojas W. 2010. Cerrando la brechaentre las prioridades de los productores y la de los investi-gadores: selección participativa de granos andinos. Rojas W,Pinto M, Soto JL, Jagger M, Padulosi S. Granos Andinos:avances, logros y experiencias desarrolladas en quinua,cañahua y amaranto en Bolivia. Roma, Italia: BioversityInternational. 94–111.
Querol D. 1988. Recursos genéticos, nuestro tesoro olvidado:aproximación técnica y socio-económica. Lima, Perú:Industrial Gráfica S. A. 1–218.
Rojas W, Bonifacio A, Aroni G, Aroni JC. 1999. Recolección denuevas accesiones de quinua y otras Chenopodiaceas. InformeAnual 1998–99. Fundación PROINPA, pp. 1–5.
Rojas W, Bonifacio A. 2001. Multiplicación de accesiones tardíasde quinua bajo condiciones de invernadero. Informe Anual2000/2001. Fundación PROINPA, pp.. 1–4.
Rojas W, Cayoja M, Espindola G. 2001. Catálogo de colección dequinua conservada en el Banco Nacional de Granos Altoandi-nos. La Paz, Bolivia: Fundación PROINPA, MAGDER,PPD-PNUD, SIBTA-UCEPSA, IPGRI, IFAD. 1–129.
Rojas W. 2002a. Distribución geográfica de la colección de germo-plasma de quinua. Informe Anual 2001/2002. Proyecto Mck-night. Fundación PROINPA, pp. 1–5.
Rojas W. 2002b. Recolección de germoplasma de cañahua yquinua. Informe Técnico Anual 2001–2002. Año 1. Proyecto“Elevar la contribución que hacen las especies olvidadas ysubutilizadas a la seguridad alimentaria y a los ingresos dela población rural de escasos recursos”. IPGRI – IFAD. LaPaz, Bolivia: Fundación PROINPA, pp. 13–21.
Rojas W, Camargo A. 2002. Reducción de la humedad del granode quinua para almacenamiento a largo plazo. Informe anual2001–2002 Proyecto Mcknight. Fundación PROINPA, pp.1–6.
Rojas W. 2003. Multivariate analysis of genetic diversity of Boli-vian quinoa germplasm. Food Reviews International 19:9–23.
Rojas W, Camargo A. 2003. Establecimiento de un método dereducción del contenido de la humedad del grano de quinua.Informe Anual 2002/2003. Proyecto Mcknight. FundaciónPROINPA, pp. 1–4.
Rojas W, Pinto M, Camargo A. 2003a. Recolección descentral-izada de germoplasma de cañahua y quinua. Informe TécnicoAnual 2002–2003. Año 2. Proyecto IPGRI - IFAD “Elevar lacontribución que hacen las especies olvidadas y subutilizadasa la seguridad alimentaria y a los ingresos de la población ruralde escasos recursos.” La Paz, Bolivia: Fundación PROINPA.9–18.
Rojas W, Pinto M, Camargo A. 2003b. Estandarización de listasde descriptores de quinua y cañahua. En: Informe TécnicoAnual 2002–2003. Año 2. Proyecto IPGRI-FAD “Elevar lacontribución que hacen las especies olvidadas y subutilizadasa la seguridad alimentaria y a los ingresos de la población ruralde escasos recursos.” La Paz, Bolivia: Fundación PROINPA.59–94.
Rojas W, Pinto M. 2004. Colecta descentralizada de quinuay cañahua. Informe Anual 2003/2004. Proyecto
160 Quinoa: Improvement and Sustainable Production
SIBTA-SINARGEAA “Manejo, conservación y usosostenible de los recursos genéticos de granos altoandinos,en el marco del SINARGEAA.” Fundación PROINPA,pp. 11–19.
Rojas W, Pinto M. 2006. Evaluación del valor nutritivo yagroindustrial de accesiones de quinua y cañahua. RojasW. Proyecto manejo, conservación y uso sostenible de losrecursos genéticos de granos Altoandinos, en el marco delSINARGEAA. Informe Final 2005–2006. La Paz, Bolivia:Fundación PROINPA. 32–42.
Rojas W, Pinto M, Alcocer E. 2007. Diversidad genética del valornutritivo y agroindustrial del germoplasma de quinua. Revistade Agricultura – Año 59 Nro. 41. Cochabamba, diciembre de2007, pp. 33–37.
Rojas W, Pinto M. 2008. Evaluación del valor nutritivo de acce-siones de quinua y cañahua silvestre. Pinto M. Proyecto imple-mentation of the UNEP-GEF project, “In situ conservationof crop wild relatives through enhanced information manage-ment and field application.” Informe de Fase 2005–2008. LaPaz, Bolivia: Fundación PROINPA. 54–60.
Rojas W, Pinto M, Mamani E. 2009. Logros e impactos delSubsistema Granos Altoandinos, periodo 2003 – 2008.En Encuentro Nacional de Innovación Tecnológica,Agropecuaria y Forestal. INIAF. Cochabamba, 29 y 30 dejunio de 2009, pp. 58–65.
Rojas W. 2010. Colección núcleo de granos Andinos. Rojas W,Pinto M, Soto JL, Jagger M, Padulosi S, Granos Andinos:avances, logros y experiencias desarrolladas en quinua,cañahua y amaranto en Bolivia. Roma, Italia: BioversityInternational. 54–72.
Rojas W, Pinto M, Bonifacio A, Gandarillas A. 2010a. Banco degermoplasma de granos Andinos. Rojas W, Pinto M, SotoJL, Jagger M, Padulosi S, Granos Andinos: avances, logros yexperiencias desarrolladas en quinua, cañahua y amaranto enBolivia. Roma, Italia: Bioversity International. 24–38.
Rojas W, Pinto M, Soto JL. 2010b. Distribución geográfica yvariabilidad genética de los granos andinos. Rojas W, PintoM, Soto JL, Jagger M, Padulosi S, Granos Andinos: avances,logros y experiencias desarrolladas en quinua, cañahua yamaranto en Bolivia. Roma, Italia: Bioversity International.p.11- 23.
Rojas W, Pinto M. 2013. La diversidad genética de quinua deBolivia. Vargas M. Congreso Científico de la Quinua (Memo-rias). Ministerio de Desarrollo Rural y Tierras - MDRyT,Viceministerio de Desarrollo Rural y Agropecuario -VDRA, Instituto Nacional de Innovación Agropecuaria yForestal - INIAF, Instituto Interamericano de Cooperaciónpara la Agricultura - IICA 14 y 15 de junio de 2013. La Paz,Bolivia. 77–92.
Rojas W, Pinto M, Alanoca C, Gómez L, León-Lobos P,Alercia A, Diulguerof S, Padulosi S. (2013). Estado de laconservación ex situ de los recursos genéticos de quinua.Bazile D, Bertero HD, Nieto C. Estado del arte de laquinua en el mundo en 2013. Santiago, Chile: PublicaciónFAO-RLC/Montpellier, Francia: CIRAD.
Rojas-Beltran J, Bonifacio A, Botani G, Maugham PJ. 2010.Obtención de nuevas variedades de quinua frente a los efectosdel cambio climático. Informe Compendio 2007–2010.Cochabamba, Bolivia: Fundación PROINPA. 67–69.
Sevilla R, Holle M. 2004. Recursos genéticos vegetales. Luis LeónAsociados S.R.L. Editores, Lima, Perú. 445 p.
Tapia M. 1977. Investigaciones en el banco de germoplasma dequinua. En: Universidad Nacional Técnica del Altiplano.Curso de Quinua. Fondo Simón Bolívar. Puno, Perú: IICA -UNTA. 66–70.
Tapia M. 1990. Cultivos Andinos subexplotados y su aporte a laalimentación. Instituto Nacional de Investigación Agraria yAgroindustrial INIAA – FAO, Oficina para América Latina yl Caribe, Santiago de Chile.
Valls JFM. 1992. Caracterización morfológica, reproductiva y bio-química del germoplasma vegetal. Capelo W. Memorias delcurso internacional sobre recolección y evaluación de germo-plasma forrajero andinodictado en. Riobambadel, 13al–23 deagosto de 1990. REPAAN. Riobamba, Ecuador. pp. 105–122.
Vavilov NI. 1951. Phytogeographic basis of plant breeding. Theorigin, variation, immunity and breeding of cultivated plants.Chronica Bot 13:1–316.
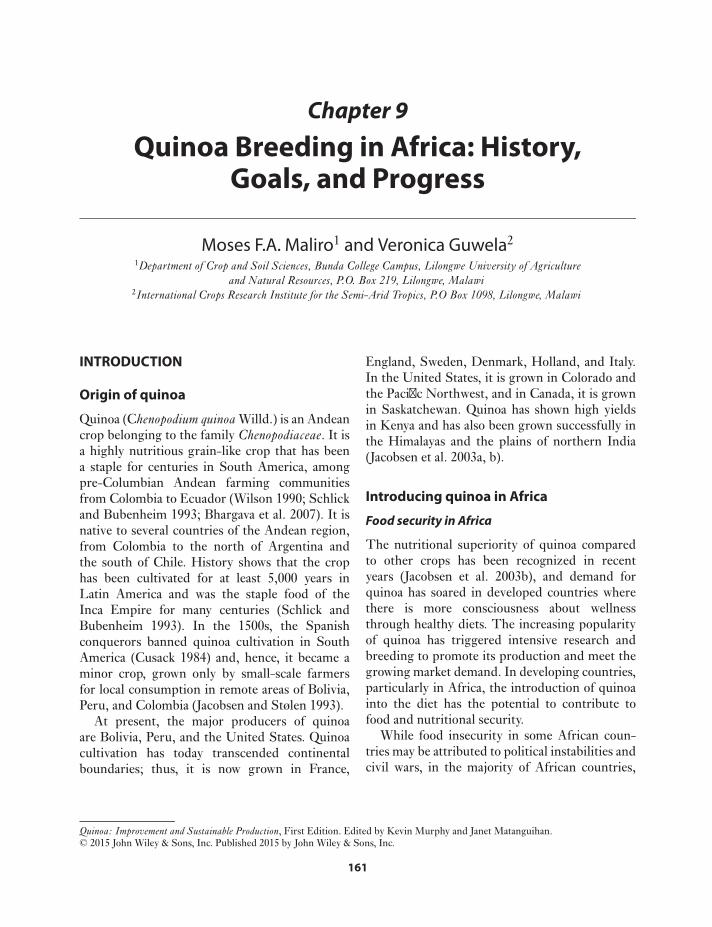
Chapter 9
Quinoa Breeding in Africa: History,Goals, and Progress
Moses F.A. Maliro1 and Veronica Guwela2
1Department of Crop and Soil Sciences, Bunda College Campus, Lilongwe University of Agricultureand Natural Resources, P.O. Box 219, Lilongwe, Malawi
2International Crops Research Institute for the Semi-Arid Tropics, P.O Box 1098, Lilongwe, Malawi
INTRODUCTION
Origin of quinoa
Quinoa (Chenopodium quinoa Willd.) is an Andeancrop belonging to the family Chenopodiaceae. It isa highly nutritious grain-like crop that has beena staple for centuries in South America, amongpre-Columbian Andean farming communitiesfrom Colombia to Ecuador (Wilson 1990; Schlickand Bubenheim 1993; Bhargava et al. 2007). It isnative to several countries of the Andean region,from Colombia to the north of Argentina andthe south of Chile. History shows that the crophas been cultivated for at least 5,000 years inLatin America and was the staple food of theInca Empire for many centuries (Schlick andBubenheim 1993). In the 1500s, the Spanishconquerors banned quinoa cultivation in SouthAmerica (Cusack 1984) and, hence, it became aminor crop, grown only by small-scale farmersfor local consumption in remote areas of Bolivia,Peru, and Colombia (Jacobsen and Stølen 1993).
At present, the major producers of quinoaare Bolivia, Peru, and the United States. Quinoacultivation has today transcended continentalboundaries; thus, it is now grown in France,
Quinoa: Improvement and Sustainable Production, First Edition. Edited by Kevin Murphy and Janet Matanguihan.© 2015 John Wiley & Sons, Inc. Published 2015 by John Wiley & Sons, Inc.
England, Sweden, Denmark, Holland, and Italy.In the United States, it is grown in Colorado andthe Pacific Northwest, and in Canada, it is grownin Saskatchewan. Quinoa has shown high yieldsin Kenya and has also been grown successfully inthe Himalayas and the plains of northern India(Jacobsen et al. 2003a, b).
Introducing quinoa in Africa
Food security in Africa
The nutritional superiority of quinoa comparedto other crops has been recognized in recentyears (Jacobsen et al. 2003b), and demand forquinoa has soared in developed countries wherethere is more consciousness about wellnessthrough healthy diets. The increasing popularityof quinoa has triggered intensive research andbreeding to promote its production and meet thegrowing market demand. In developing countries,particularly in Africa, the introduction of quinoainto the diet has the potential to contribute tofood and nutritional security.
While food insecurity in some African coun-tries may be attributed to political instabilities andcivil wars, in the majority of African countries,
161
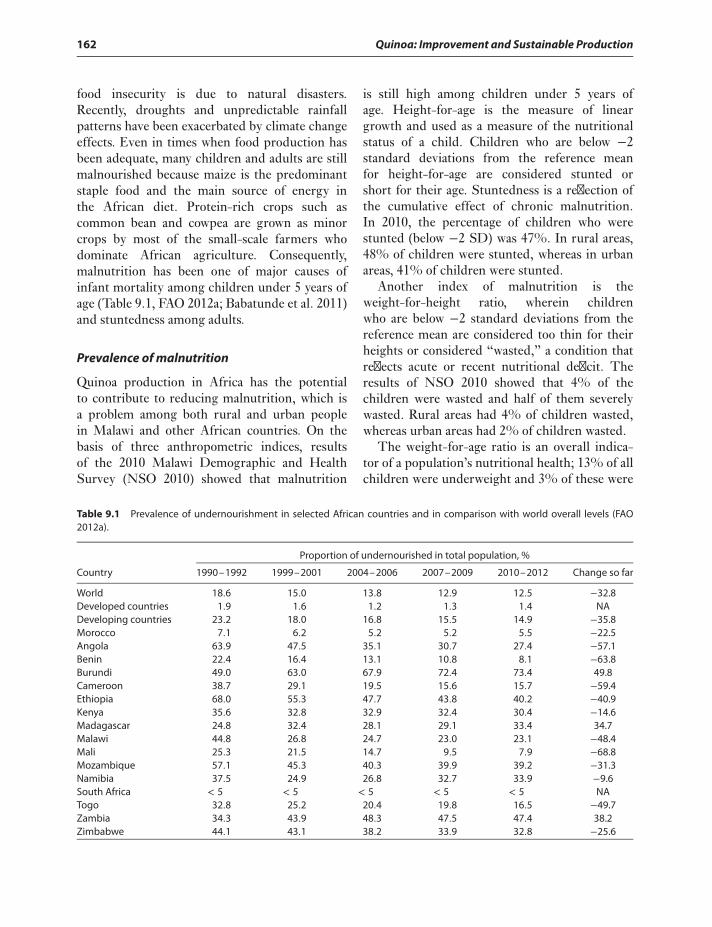
162 Quinoa: Improvement and Sustainable Production
food insecurity is due to natural disasters.Recently, droughts and unpredictable rainfallpatterns have been exacerbated by climate changeeffects. Even in times when food production hasbeen adequate, many children and adults are stillmalnourished because maize is the predominantstaple food and the main source of energy inthe African diet. Protein-rich crops such ascommon bean and cowpea are grown as minorcrops by most of the small-scale farmers whodominate African agriculture. Consequently,malnutrition has been one of major causes ofinfant mortality among children under 5 years ofage (Table 9.1, FAO 2012a; Babatunde et al. 2011)and stuntedness among adults.
Prevalence of malnutrition
Quinoa production in Africa has the potentialto contribute to reducing malnutrition, which isa problem among both rural and urban peoplein Malawi and other African countries. On thebasis of three anthropometric indices, resultsof the 2010 Malawi Demographic and HealthSurvey (NSO 2010) showed that malnutrition
is still high among children under 5 years ofage. Height-for-age is the measure of lineargrowth and used as a measure of the nutritionalstatus of a child. Children who are below −2standard deviations from the reference meanfor height-for-age are considered stunted orshort for their age. Stuntedness is a reflection ofthe cumulative effect of chronic malnutrition.In 2010, the percentage of children who werestunted (below −2 SD) was 47%. In rural areas,48% of children were stunted, whereas in urbanareas, 41% of children were stunted.
Another index of malnutrition is theweight-for-height ratio, wherein childrenwho are below −2 standard deviations from thereference mean are considered too thin for theirheights or considered “wasted,” a condition thatreflects acute or recent nutritional deficit. Theresults of NSO 2010 showed that 4% of thechildren were wasted and half of them severelywasted. Rural areas had 4% of children wasted,whereas urban areas had 2% of children wasted.
The weight-for-age ratio is an overall indica-tor of a population’s nutritional health; 13% of allchildren were underweight and 3% of these were
Table 9.1 Prevalence of undernourishment in selected African countries and in comparison with world overall levels (FAO2012a).
Proportion of undernourished in total population, %
Country 1990–1992 1999–2001 2004–2006 2007–2009 2010–2012 Change so far
World 18.6 15.0 13.8 12.9 12.5 −32.8Developed countries 1.9 1.6 1.2 1.3 1.4 NADeveloping countries 23.2 18.0 16.8 15.5 14.9 −35.8Morocco 7.1 6.2 5.2 5.2 5.5 −22.5Angola 63.9 47.5 35.1 30.7 27.4 −57.1Benin 22.4 16.4 13.1 10.8 8.1 −63.8Burundi 49.0 63.0 67.9 72.4 73.4 49.8Cameroon 38.7 29.1 19.5 15.6 15.7 −59.4Ethiopia 68.0 55.3 47.7 43.8 40.2 −40.9Kenya 35.6 32.8 32.9 32.4 30.4 −14.6Madagascar 24.8 32.4 28.1 29.1 33.4 34.7Malawi 44.8 26.8 24.7 23.0 23.1 −48.4Mali 25.3 21.5 14.7 9.5 7.9 −68.8Mozambique 57.1 45.3 40.3 39.9 39.2 −31.3Namibia 37.5 24.9 26.8 32.7 33.9 −9.6South Africa < 5 < 5 < 5 < 5 < 5 NATogo 32.8 25.2 20.4 19.8 16.5 −49.7Zambia 34.3 43.9 48.3 47.5 47.4 38.2Zimbabwe 44.1 43.1 38.2 33.9 32.8 −25.6
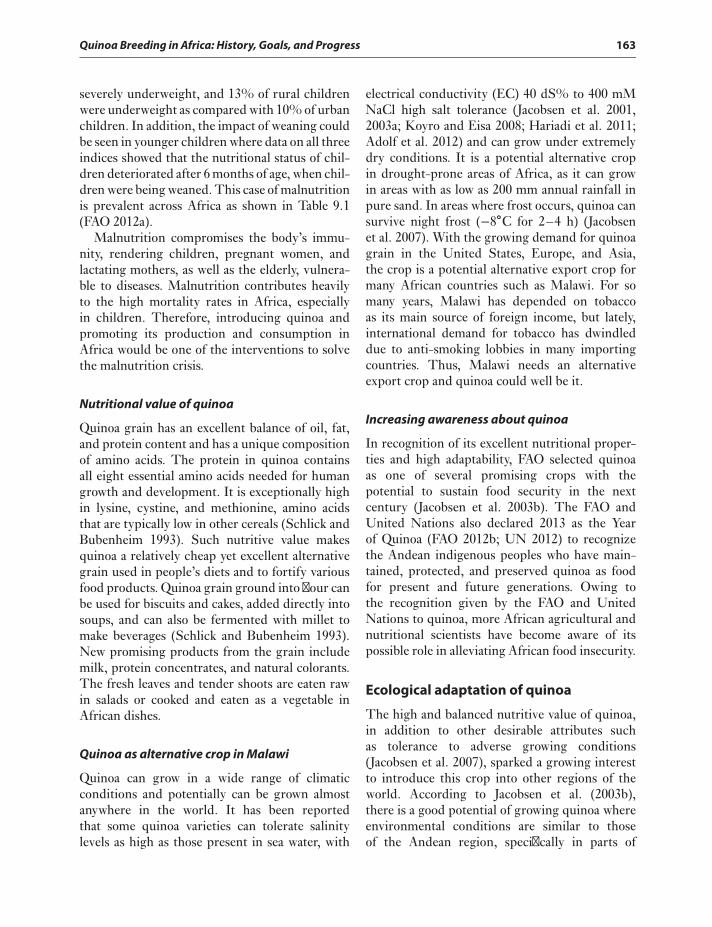
Quinoa Breeding in Africa: History, Goals, and Progress 163
severely underweight, and 13% of rural childrenwere underweight as compared with 10% of urbanchildren. In addition, the impact of weaning couldbe seen in younger children where data on all threeindices showed that the nutritional status of chil-dren deteriorated after 6 months of age, when chil-dren were being weaned. This case of malnutritionis prevalent across Africa as shown in Table 9.1(FAO 2012a).
Malnutrition compromises the body’s immu-nity, rendering children, pregnant women, andlactating mothers, as well as the elderly, vulnera-ble to diseases. Malnutrition contributes heavilyto the high mortality rates in Africa, especiallyin children. Therefore, introducing quinoa andpromoting its production and consumption inAfrica would be one of the interventions to solvethe malnutrition crisis.
Nutritional value of quinoa
Quinoa grain has an excellent balance of oil, fat,and protein content and has a unique compositionof amino acids. The protein in quinoa containsall eight essential amino acids needed for humangrowth and development. It is exceptionally highin lysine, cystine, and methionine, amino acidsthat are typically low in other cereals (Schlick andBubenheim 1993). Such nutritive value makesquinoa a relatively cheap yet excellent alternativegrain used in people’s diets and to fortify variousfood products. Quinoa grain ground into flour canbe used for biscuits and cakes, added directly intosoups, and can also be fermented with millet tomake beverages (Schlick and Bubenheim 1993).New promising products from the grain includemilk, protein concentrates, and natural colorants.The fresh leaves and tender shoots are eaten rawin salads or cooked and eaten as a vegetable inAfrican dishes.
Quinoa as alternative crop in Malawi
Quinoa can grow in a wide range of climaticconditions and potentially can be grown almostanywhere in the world. It has been reportedthat some quinoa varieties can tolerate salinitylevels as high as those present in sea water, with
electrical conductivity (EC) 40 dS% to 400 mMNaCl high salt tolerance (Jacobsen et al. 2001,2003a; Koyro and Eisa 2008; Hariadi et al. 2011;Adolf et al. 2012) and can grow under extremelydry conditions. It is a potential alternative cropin drought-prone areas of Africa, as it can growin areas with as low as 200 mm annual rainfall inpure sand. In areas where frost occurs, quinoa cansurvive night frost (−8∘C for 2–4 h) (Jacobsenet al. 2007). With the growing demand for quinoagrain in the United States, Europe, and Asia,the crop is a potential alternative export crop formany African countries such as Malawi. For somany years, Malawi has depended on tobaccoas its main source of foreign income, but lately,international demand for tobacco has dwindleddue to anti-smoking lobbies in many importingcountries. Thus, Malawi needs an alternativeexport crop and quinoa could well be it.
Increasing awareness about quinoa
In recognition of its excellent nutritional proper-ties and high adaptability, FAO selected quinoaas one of several promising crops with thepotential to sustain food security in the nextcentury (Jacobsen et al. 2003b). The FAO andUnited Nations also declared 2013 as the Yearof Quinoa (FAO 2012b; UN 2012) to recognizethe Andean indigenous peoples who have main-tained, protected, and preserved quinoa as foodfor present and future generations. Owing tothe recognition given by the FAO and UnitedNations to quinoa, more African agricultural andnutritional scientists have become aware of itspossible role in alleviating African food insecurity.
Ecological adaptation of quinoa
The high and balanced nutritive value of quinoa,in addition to other desirable attributes suchas tolerance to adverse growing conditions(Jacobsen et al. 2007), sparked a growing interestto introduce this crop into other regions of theworld. According to Jacobsen et al. (2003b),there is a good potential of growing quinoa whereenvironmental conditions are similar to thoseof the Andean region, specifically in parts of
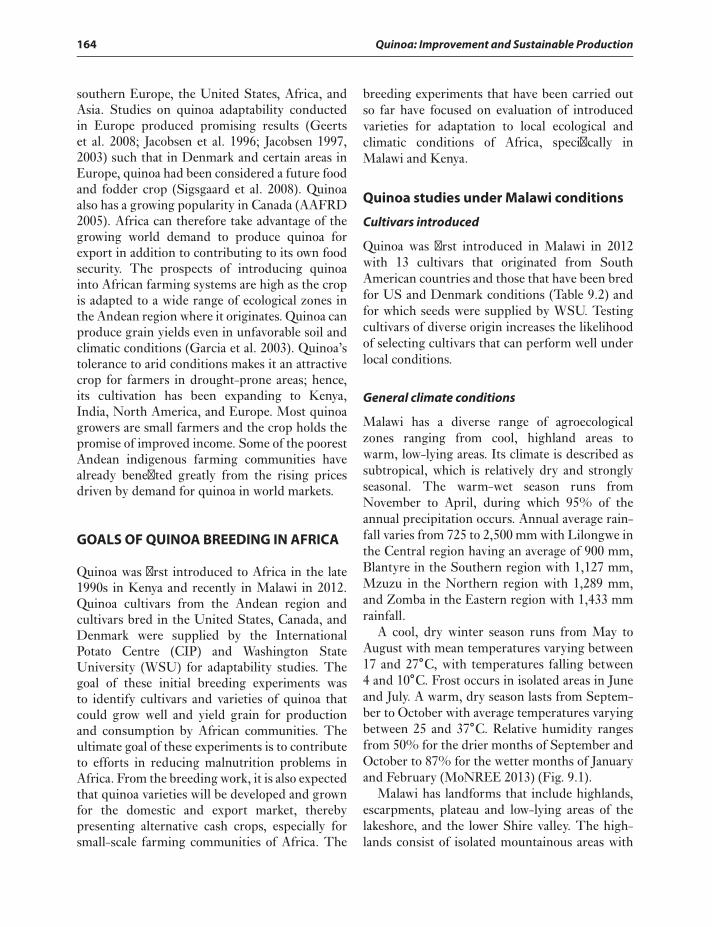
164 Quinoa: Improvement and Sustainable Production
southern Europe, the United States, Africa, andAsia. Studies on quinoa adaptability conductedin Europe produced promising results (Geertset al. 2008; Jacobsen et al. 1996; Jacobsen 1997,2003) such that in Denmark and certain areas inEurope, quinoa had been considered a future foodand fodder crop (Sigsgaard et al. 2008). Quinoaalso has a growing popularity in Canada (AAFRD2005). Africa can therefore take advantage of thegrowing world demand to produce quinoa forexport in addition to contributing to its own foodsecurity. The prospects of introducing quinoainto African farming systems are high as the cropis adapted to a wide range of ecological zones inthe Andean region where it originates. Quinoa canproduce grain yields even in unfavorable soil andclimatic conditions (Garcia et al. 2003). Quinoa’stolerance to arid conditions makes it an attractivecrop for farmers in drought-prone areas; hence,its cultivation has been expanding to Kenya,India, North America, and Europe. Most quinoagrowers are small farmers and the crop holds thepromise of improved income. Some of the poorestAndean indigenous farming communities havealready benefited greatly from the rising pricesdriven by demand for quinoa in world markets.
GOALS OF QUINOA BREEDING IN AFRICA
Quinoa was first introduced to Africa in the late1990s in Kenya and recently in Malawi in 2012.Quinoa cultivars from the Andean region andcultivars bred in the United States, Canada, andDenmark were supplied by the InternationalPotato Centre (CIP) and Washington StateUniversity (WSU) for adaptability studies. Thegoal of these initial breeding experiments wasto identify cultivars and varieties of quinoa thatcould grow well and yield grain for productionand consumption by African communities. Theultimate goal of these experiments is to contributeto efforts in reducing malnutrition problems inAfrica. From the breeding work, it is also expectedthat quinoa varieties will be developed and grownfor the domestic and export market, therebypresenting alternative cash crops, especially forsmall-scale farming communities of Africa. The
breeding experiments that have been carried outso far have focused on evaluation of introducedvarieties for adaptation to local ecological andclimatic conditions of Africa, specifically inMalawi and Kenya.
Quinoa studies under Malawi conditions
Cultivars introduced
Quinoa was first introduced in Malawi in 2012with 13 cultivars that originated from SouthAmerican countries and those that have been bredfor US and Denmark conditions (Table 9.2) andfor which seeds were supplied by WSU. Testingcultivars of diverse origin increases the likelihoodof selecting cultivars that can perform well underlocal conditions.
General climate conditions
Malawi has a diverse range of agroecologicalzones ranging from cool, highland areas towarm, low-lying areas. Its climate is described assubtropical, which is relatively dry and stronglyseasonal. The warm-wet season runs fromNovember to April, during which 95% of theannual precipitation occurs. Annual average rain-fall varies from 725 to 2,500 mm with Lilongwe inthe Central region having an average of 900 mm,Blantyre in the Southern region with 1,127 mm,Mzuzu in the Northern region with 1,289 mm,and Zomba in the Eastern region with 1,433 mmrainfall.
A cool, dry winter season runs from May toAugust with mean temperatures varying between17 and 27∘C, with temperatures falling between4 and 10∘C. Frost occurs in isolated areas in Juneand July. A warm, dry season lasts from Septem-ber to October with average temperatures varyingbetween 25 and 37∘C. Relative humidity rangesfrom 50% for the drier months of September andOctober to 87% for the wetter months of Januaryand February (MoNREE 2013) (Fig. 9.1).
Malawi has landforms that include highlands,escarpments, plateau and low-lying areas of thelakeshore, and the lower Shire valley. The high-lands consist of isolated mountainous areas with
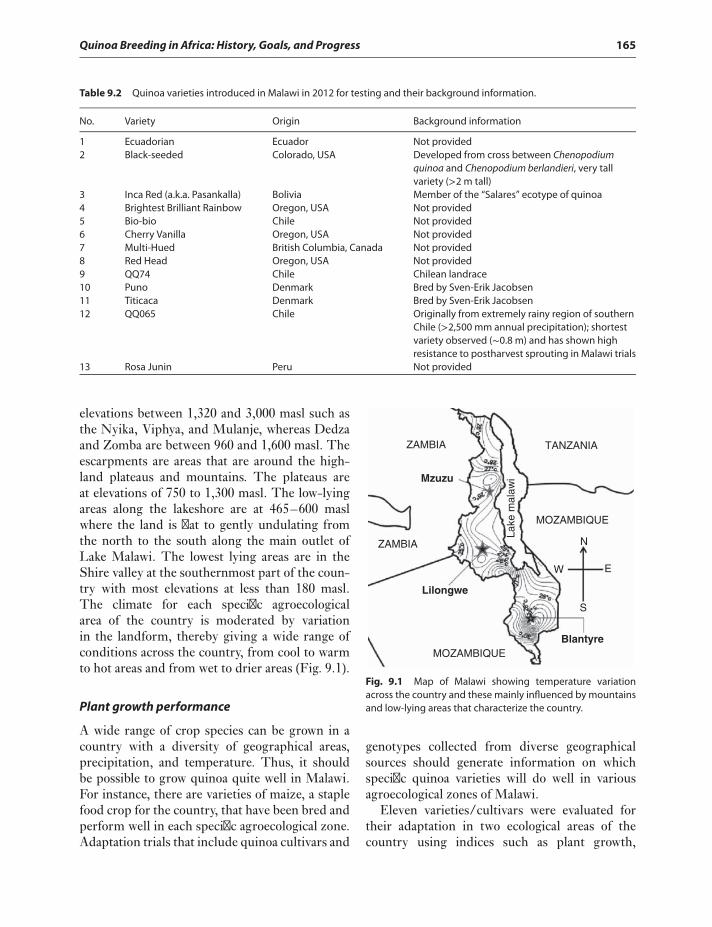
Quinoa Breeding in Africa: History, Goals, and Progress 165
Table 9.2 Quinoa varieties introduced in Malawi in 2012 for testing and their background information.
No. Variety Origin Background information
1 Ecuadorian Ecuador Not provided2 Black-seeded Colorado, USA Developed from cross between Chenopodium
quinoa and Chenopodium berlandieri, very tallvariety (>2 m tall)
3 Inca Red (a.k.a. Pasankalla) Bolivia Member of the “Salares” ecotype of quinoa4 Brightest Brilliant Rainbow Oregon, USA Not provided5 Bio-bio Chile Not provided6 Cherry Vanilla Oregon, USA Not provided7 Multi-Hued British Columbia, Canada Not provided8 Red Head Oregon, USA Not provided9 QQ74 Chile Chilean landrace10 Puno Denmark Bred by Sven-Erik Jacobsen11 Titicaca Denmark Bred by Sven-Erik Jacobsen12 QQ065 Chile Originally from extremely rainy region of southern
Chile (>2,500 mm annual precipitation); shortestvariety observed (∼0.8 m) and has shown highresistance to postharvest sprouting in Malawi trials
13 Rosa Junin Peru Not provided
elevations between 1,320 and 3,000 masl such asthe Nyika, Viphya, and Mulanje, whereas Dedzaand Zomba are between 960 and 1,600 masl. Theescarpments are areas that are around the high-land plateaus and mountains. The plateaus areat elevations of 750 to 1,300 masl. The low-lyingareas along the lakeshore are at 465–600 maslwhere the land is flat to gently undulating fromthe north to the south along the main outlet ofLake Malawi. The lowest lying areas are in theShire valley at the southernmost part of the coun-try with most elevations at less than 180 masl.The climate for each specific agroecologicalarea of the country is moderated by variationin the landform, thereby giving a wide range ofconditions across the country, from cool to warmto hot areas and from wet to drier areas (Fig. 9.1).
Plant growth performance
A wide range of crop species can be grown in acountry with a diversity of geographical areas,precipitation, and temperature. Thus, it shouldbe possible to grow quinoa quite well in Malawi.For instance, there are varieties of maize, a staplefood crop for the country, that have been bred andperform well in each specific agroecological zone.Adaptation trials that include quinoa cultivars and
ZAMBIA
ZAMBIA
Mzuzu
Lilongwe
MOZAMBIQUE
MOZAMBIQUE
Blantyre
S
EW
N
TANZANIA
Lake
mal
awi
Fig. 9.1 Map of Malawi showing temperature variationacross the country and these mainly influenced by mountainsand low-lying areas that characterize the country.
genotypes collected from diverse geographicalsources should generate information on whichspecific quinoa varieties will do well in variousagroecological zones of Malawi.
Eleven varieties/cultivars were evaluated fortheir adaptation in two ecological areas of thecountry using indices such as plant growth,
166 Quinoa: Improvement and Sustainable Production
flowering, and grain yield. The first site wasBunda (1,200 masl) in Lilongwe district, repre-senting the mid-altitude agroecological zones.The second site was Bembeke (1,560 masl) inDedza district, representing higher altitudeagroecological zones. The experiment was con-ducted from July through the warmer months ofAugust, September, and October under irrigationconditions. The cultivars were also evaluatedunder warm rain-fed conditions during theDecember to April 2012/2013 cropping season atthe Bunda site.
Results in the Bunda and Bembeke sites and therain-fed site at Bunda showed promise for quinoaintroduction in Malawi. In the mid-altitude site(Bunda), all cultivars grew slowly for the first21 days after sowing but grew rapidly when theweather started to warm up in mid-August. In theBembeke highland site, quinoa grew extremelyslowly for the first 2 months, probably due tothe prolonged cold period experienced duringthe trials. By the time the weather warmed up,the plants were close to physiological maturity.Consequently, quinoa plants at the highland sitewere short, reaching only 50 cm in height, whileall the 11 cultivars at the mid-altitude site grew toheights of 90–100 cm. Plant height significantlyaffected panicle length that in turn affected thenumber of inflorescence, ultimately determininggrain yield. The results suggested that therewill be severely reduced grain yield if quinoa isgrown in the highland areas of Malawi duringthe winter season. The results also highlight theneed to continue evaluating a diverse numberof cultivars to select for genotypes adapted tospecific agroecological areas across seasons inMalawi.
The slow plant growth attributed to very lowtemperatures also affected the period to maturity.At the mid-altitude or warmer site, the plants had100% flowering by the end of 30 days, whereasat the highland or cooler site, the plants took51 days to attain 100% flowering. The differentquinoa varieties at the cooler site (Bembeke) tooklonger to reach maturity (102–119 days), whereasthe quinoa genotypes at the warmer site (Bunda)reached maturity earlier (90 days) correspondingto earliness to flowering.
Genotype performance
The performance of the different genotypesshowed variation in plant height at harvest, num-ber of days to harvest (maturity period), paniclelength, grain yield (kg/ha), and harvest index(HI) (Fig. 9.2). Promising high yielding varietiesand genotypes that yielded up to or about 3 tonsper hectare (t/ha) were “Brightest Brilliant”and “Cherry Vanilla” (both bred in Oregon,USA), “Multi-Hued” (bred in British Columbia,Canada), “Titicaca” (bred in Denmark), andQQ74 (from Chile). These promising quinoacultivars could be recommended for commercialproduction under the climatic conditions ofMalawi. The 3 t/ha quinoa grain yield was higheror comparable to the maize yields that small-scalefarmers get (2 t/ha) under rain-fed conditions inMalawi. Moreover, the quinoa yields in Malawidid not differ from those reported in other regionsof the world (Bertero et al. 2004). This impliesthat if farmers allocate a piece of land to quinoaproduction in place of maize, they are likely toharvest the same or higher quantity of quinoagrain, with the added benefit that quinoa is morenutritious than maize.
Quinoa studies in Kenya
Experimental sites and climatic conditions
Quinoa breeding studies in Kenya were firstconducted as part of a multienvironment trialthat involved a diverse set of 24 cultivars tested in14 sites under irrigation conditions from 1999 to2000 (Bertero et al. 2004; Oyoo et al. 2010). Theother 13 sites were in Peru, Brazil, Bolivia, andVietnam. In Kenya, the cultivars were plantedat the Kabete Field Station of the University ofNairobi to determine their adaptability and yieldperformance. The site is located at an altitudeof 1,820 masl, with temperatures ranging from13 to 23∘C, and a bimodal rainfall pattern witha mean annual rainfall of 970 mm. The soilshave an average pH of 5.0–6.8, classified ashumic nitisols (Siderius and Muchena 1977). Thequinoa accessions were evaluated under both thelong rainy seasons of 1999 (March–June) and theshort rainy seasons of 1999 to 2000.
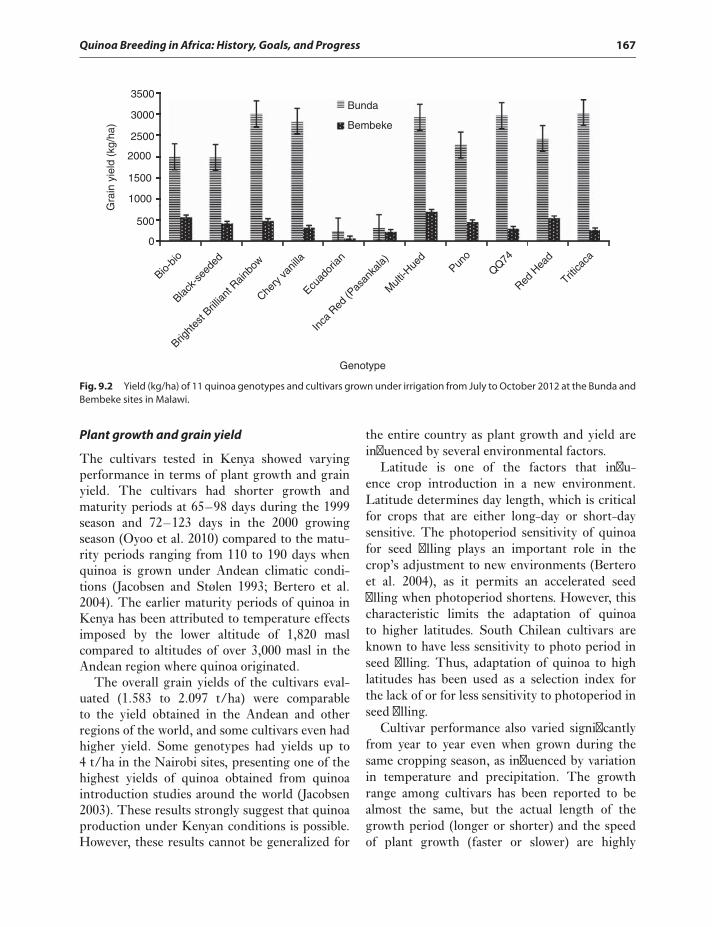
Quinoa Breeding in Africa: History, Goals, and Progress 167
0
3500
3000
2500
2000
1500
1000
500
Gra
in y
ield
(kg
/ha)
Bio-bio
Black-
seed
ed
Bright
est B
rillian
t Rain
bow
Chery
vanil
la
Ecuad
orian
Inca
Red
(Pas
anka
la)
Mult
i-Hue
dPun
o
QQ74
Red H
ead
Tritica
ca
Bunda
Bembeke
Genotype
Fig. 9.2 Yield (kg/ha) of 11 quinoa genotypes and cultivars grown under irrigation from July to October 2012 at the Bunda andBembeke sites in Malawi.
Plant growth and grain yield
The cultivars tested in Kenya showed varyingperformance in terms of plant growth and grainyield. The cultivars had shorter growth andmaturity periods at 65–98 days during the 1999season and 72–123 days in the 2000 growingseason (Oyoo et al. 2010) compared to the matu-rity periods ranging from 110 to 190 days whenquinoa is grown under Andean climatic condi-tions (Jacobsen and Stølen 1993; Bertero et al.2004). The earlier maturity periods of quinoa inKenya has been attributed to temperature effectsimposed by the lower altitude of 1,820 maslcompared to altitudes of over 3,000 masl in theAndean region where quinoa originated.
The overall grain yields of the cultivars eval-uated (1.583 to 2.097 t/ha) were comparableto the yield obtained in the Andean and otherregions of the world, and some cultivars even hadhigher yield. Some genotypes had yields up to4 t/ha in the Nairobi sites, presenting one of thehighest yields of quinoa obtained from quinoaintroduction studies around the world (Jacobsen2003). These results strongly suggest that quinoaproduction under Kenyan conditions is possible.However, these results cannot be generalized for
the entire country as plant growth and yield areinfluenced by several environmental factors.
Latitude is one of the factors that influ-ence crop introduction in a new environment.Latitude determines day length, which is criticalfor crops that are either long-day or short-daysensitive. The photoperiod sensitivity of quinoafor seed filling plays an important role in thecrop’s adjustment to new environments (Berteroet al. 2004), as it permits an accelerated seedfilling when photoperiod shortens. However, thischaracteristic limits the adaptation of quinoato higher latitudes. South Chilean cultivars areknown to have less sensitivity to photo period inseed filling. Thus, adaptation of quinoa to highlatitudes has been used as a selection index forthe lack of or for less sensitivity to photoperiod inseed filling.
Cultivar performance also varied significantlyfrom year to year even when grown during thesame cropping season, as influenced by variationin temperature and precipitation. The growthrange among cultivars has been reported to bealmost the same, but the actual length of thegrowth period (longer or shorter) and the speedof plant growth (faster or slower) are highly
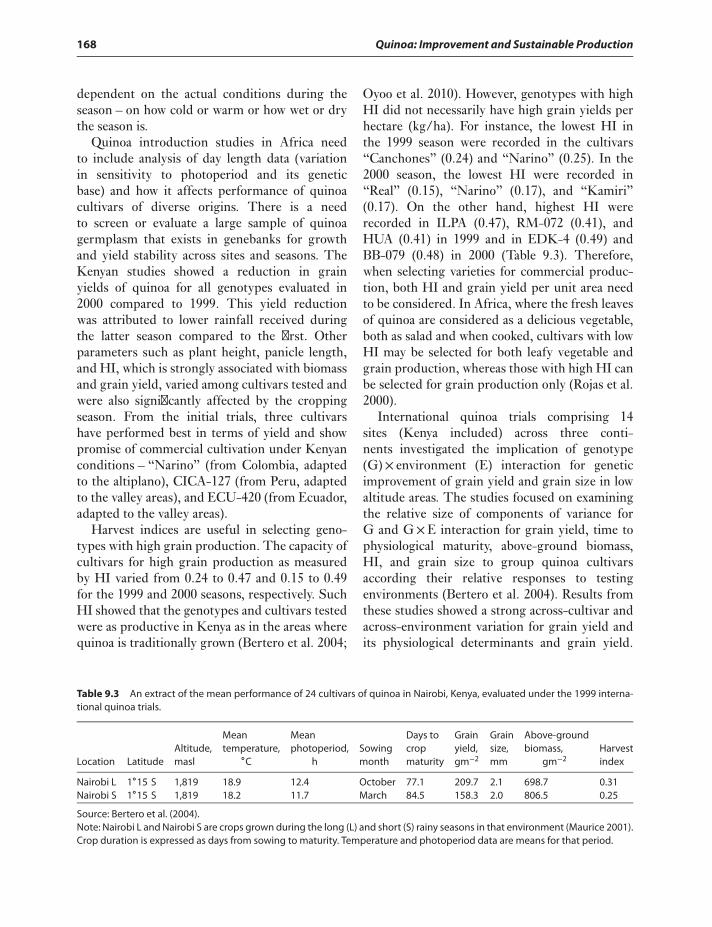
168 Quinoa: Improvement and Sustainable Production
dependent on the actual conditions during theseason – on how cold or warm or how wet or drythe season is.
Quinoa introduction studies in Africa needto include analysis of day length data (variationin sensitivity to photoperiod and its geneticbase) and how it affects performance of quinoacultivars of diverse origins. There is a needto screen or evaluate a large sample of quinoagermplasm that exists in genebanks for growthand yield stability across sites and seasons. TheKenyan studies showed a reduction in grainyields of quinoa for all genotypes evaluated in2000 compared to 1999. This yield reductionwas attributed to lower rainfall received duringthe latter season compared to the first. Otherparameters such as plant height, panicle length,and HI, which is strongly associated with biomassand grain yield, varied among cultivars tested andwere also significantly affected by the croppingseason. From the initial trials, three cultivarshave performed best in terms of yield and showpromise of commercial cultivation under Kenyanconditions – “Narino” (from Colombia, adaptedto the altiplano), CICA-127 (from Peru, adaptedto the valley areas), and ECU-420 (from Ecuador,adapted to the valley areas).
Harvest indices are useful in selecting geno-types with high grain production. The capacity ofcultivars for high grain production as measuredby HI varied from 0.24 to 0.47 and 0.15 to 0.49for the 1999 and 2000 seasons, respectively. SuchHI showed that the genotypes and cultivars testedwere as productive in Kenya as in the areas wherequinoa is traditionally grown (Bertero et al. 2004;
Oyoo et al. 2010). However, genotypes with highHI did not necessarily have high grain yields perhectare (kg/ha). For instance, the lowest HI inthe 1999 season were recorded in the cultivars“Canchones” (0.24) and “Narino” (0.25). In the2000 season, the lowest HI were recorded in“Real” (0.15), “Narino” (0.17), and “Kamiri”(0.17). On the other hand, highest HI wererecorded in ILPA (0.47), RM-072 (0.41), andHUA (0.41) in 1999 and in EDK-4 (0.49) andBB-079 (0.48) in 2000 (Table 9.3). Therefore,when selecting varieties for commercial produc-tion, both HI and grain yield per unit area needto be considered. In Africa, where the fresh leavesof quinoa are considered as a delicious vegetable,both as salad and when cooked, cultivars with lowHI may be selected for both leafy vegetable andgrain production, whereas those with high HI canbe selected for grain production only (Rojas et al.2000).
International quinoa trials comprising 14sites (Kenya included) across three conti-nents investigated the implication of genotype(G)× environment (E) interaction for geneticimprovement of grain yield and grain size in lowaltitude areas. The studies focused on examiningthe relative size of components of variance forG and G×E interaction for grain yield, time tophysiological maturity, above-ground biomass,HI, and grain size to group quinoa cultivarsaccording their relative responses to testingenvironments (Bertero et al. 2004). Results fromthese studies showed a strong across-cultivar andacross-environment variation for grain yield andits physiological determinants and grain yield.
Table 9.3 An extract of the mean performance of 24 cultivars of quinoa in Nairobi, Kenya, evaluated under the 1999 interna-tional quinoa trials.
Location LatitudeAltitude,masl
Meantemperature,
∘C
Meanphotoperiod,
hSowingmonth
Days tocropmaturity
Grainyield,gm−2
Grainsize,mm
Above-groundbiomass,
gm−2Harvestindex
Nairobi L 1∘15′S 1,819 18.9 12.4 October 77.1 209.7 2.1 698.7 0.31Nairobi S 1∘15′S 1,819 18.2 11.7 March 84.5 158.3 2.0 806.5 0.25
Source: Bertero et al. (2004).Note: Nairobi L and Nairobi S are crops grown during the long (L) and short (S) rainy seasons in that environment (Maurice 2001).Crop duration is expressed as days from sowing to maturity. Temperature and photoperiod data are means for that period.
Quinoa Breeding in Africa: History, Goals, and Progress 169
Both yield determinants, that is, HI and biomassalso showed large G×E interaction to the Gcomponent of variance ratio. From this study, theinvestigators classified the sites into four groupsof environments based on grain yield and Kenyawas in the group of warmer and low-altitudeenvironments. The Kenya sites were also reportedto be in the shortest crop duration areas. In termsof cultivar performance, it was reported that allthe valley type of cultivars showed their bestperformance in the valley sites, that is, Kenyasites, above the mean yields in the Atiplano sitesand below mean yields in other environments.These results suggest that these cultivars arebetter adapted to the warmer and low altitudeareas and can thus be adaptable in most of thetropics in Africa.
Pests and diseases
The varieties tested in Malawi did not have seri-ous infestation of pests and diseases. Insect pestsobserved during the trials were sucking insectssuch as aphids and shield or stinkbugs, but atlevels that did not warrant spraying of chemicalsto control them. The aphids seemed to be moreprevalent under dry weather as is the case in othercrops, though the infestation was light and did notseem to attract new waves of infesting aphids. Itmay be too early to conclude that quinoa does nothave serious pests and diseases under Malawianconditions until adaptation studies have beenconducted over several agroecological zones andseasons. Future trials need to include studies onquinoa pests and diseases to substantiate theseinitial observations.
CHALLENGES AND CONSIDERATIONS FORFUTURE RESEARCH
Plant lodging
Both irrigated and the rain-fed experimentsunder Malawi conditions showed that most ofthe quinoa varieties tested are susceptible tolodging, resulting to grain yield losses. Africanclimates are characterized by the occurrence of
heavy rain storms that may make the lodgingworse. Therefore, selecting and breeding forlodging-resistant varieties should be one of thegoals of quinoa breeding in Africa.
Acceptability
Acceptability of quinoa into African diets is a keyfactor for the successful introduction of the crop.Maize has been the staple food of Malawiansfor centuries. They do not consider that theyhave had a meal until maize-based food is eaten;other crop-based food products are consideredmerely as snacks. Such an attitude is reflectedeven at the national level, where the country isconsidered to have a food shortage whenevermaize harvests are lean, even if other food cropsare available. It is only in recent times that theurban populations are changing their eatinghabits and have begun to accept potato, rice, andwheat-based food products in their main meals.Malawians will likely have an attitude to quinoasimilar to their attitudes toward other food crops.Hence, in conjunction with quinoa breeding andadaptability studies, there should be studies inthe acceptability and incorporation of quinoain the Malawian and African diet. Recipes andquinoa-based products should be developed topromote quinoa consumption in Africa.
The majority of African farmers are small-scalefarmers who consider maize as the main foodcrop and allocate most or all of their resources ingrowing maize. The farmers’ priority is to plantmaize when the first rains come, as is the casefor tobacco in regions where it is grown as themain cash crop. Under rain-fed cropping con-ditions, maize and other cash crops are plantedfirst, followed by other important crops such asgroundnut, soybean, and millet. Crops with lessmarket value are planted last. However, withoutthe application of inorganic fertilizers, cropsplanted late in the season usually do not have avigorous take off compared to crops planted earlywith the first rains. In order to apply inorganicfertilizers to late-planted crops, farmers have tobe convinced that the new crop has a potential ofearning them income as well as being valuable intheir diets.
170 Quinoa: Improvement and Sustainable Production
Agronomic practices
The farming systems of Africa are dominated bysmall-scale farms characterized by land holdingsof less than 2 ha, almost no mechanization, andwith few input resources (Jayne et al. 2003).Successful promotion of quinoa as a new crop willneed technologies adapted to small-scale farmingconditions. For instance, most farm operationsare manually done and sowing of quinoa seed atvery close plant spacing of 10 cm would be timeconsuming. Farmers might opt to use the broad-cast sowing method to save time, but this sowingmethod is impractical as quinoa has extremelysmall seeds. Investigations on optimal seed ratesneed to be conducted and recommended tofarmers. Application of fertilizers in cereal cropsis recommended to boost productivity, but mostsmall-scale farmers can hardly afford inorganicfertilizers. Most of the inorganic fertilizers thatthey do manage to obtain are reserved for theirstaple crops such as maize. Alternative methodsof improving soil fertility for quinoa production,such as application of animal manure or greenmanure, need to be investigated.
Rain-fed versus irrigated croppingsystems
Crop production in small-scale farms is mostlyunder rain-fed conditions. In regions of Africawhere rains are limited to one season and only fora few months, quinoa may need to be producedunder irrigated conditions. Results from on-goingexperiments suggest that irrigated quinoa grownshortly after the end of the rainy season gives a bet-ter grain yield than under the rain-fed conditionsin Malawi. However, irrigation as practiced bymost small-scale farmers is with the use of water-ing cans. Irrigation technologies that would con-serve soil moisture (such as mulching) would makequinoa production more feasible and affordable.
CONCLUSION
Results of initial experiments in Malawi andKenya have shown that quinoa can grow well
under varying agroecological zones, from warmerto cooler areas. However, more genotypes fromthe Andean region and those that have been bredelsewhere need to be evaluated under the variousagroecological zones and seasons of Africa. Suchevaluations will allow selection of more cultivarsadapted to specific ecological zones and croppingseasons that prevail in the region. Studies haveshown that cultivars from South America andthose bred in North America can give the sameor higher grain yields (3–4 t/ha) when grown inMalawi and Kenya, comparable to the yields of thesame cultivars when grown in areas where quinoais traditionally grown. Such varieties can beadopted in Africa and promoted to alleviate foodinsecurity common in many African countries.
To facilitate the introduction and adoption ofquinoa in Africa, there should be more researchon cropping technologies relevant to small-scalefarms that characterize a large section of Africanagriculture. Aside from agronomic factors, socioe-conomic factors that affect the adoption of newcrops also need to be considered. For instance, theacceptability of a new grain crop can be influencedby grain color, taste, or the ease of processing ofthe grain for local dishes, even though the cropmay be high yielding and nutritious. Acceptabil-ity of quinoa into the African diet, and the fac-tors that influence the adoption of change, shouldalso be studied. Plant breeders and agronomistsshould work hand-in-hand with farmers, exten-sion agents, nutrition experts, government agen-cies, and relevant stakeholders to introduce quinoato Africa, taking into account not only the agro-nomic challenges but also the social, market, andpolitical challenges of introducing a new crop intothe African landscape and psyche.
REFERENCES
[AAFRD]Alberta Agriculture, Food and Rural Development.2005. Quinoa – the next cinderella crop for Alberta? Areport by Alberta Agriculture Food and Rural Development(AAFRD). Available from: http://www1.agric.gov.ab.ca/$department/deptdocs.nsf/all/afu9961
[FAO]Food and Agriculture Organization of the United Nations.2012a. Economic growth is necessary but not sufficient toaccelerate reduction of hunger and malnutrition. Rome:FAO.
Quinoa Breeding in Africa: History, Goals, and Progress 171
[FAO]Food and Agriculture Organization of the UnitedNations. 2012b. Master plan for the International Year ofQuinoa – a future sown thousands of years ago. Available fromhttp://www.fao.org/fileadmin/templates/aiq2013/res/en/master_plan.pdf
[MoNREE]Ministry of Natural Resources, Energy and Envi-ronment. 2013. Climate of Malawi. Department of ClimateChange and Meteorological Services (DCCMS) of theMinistry of Natural Resources, Energy and Environment(MoNREE). Accessed from http://www.metmalawi.com/climate/climate.php
[NSO]National Statistical Office. 2010. Malawi Demographicand Health Survey 2010. National Statistical Office Zomba,Malawi and MEASURE DHS, ICF Macro Calverton,Maryland, USA, pp. 1–51.
[UN]United Nations. 2012. United Nations Resolution on thedeclaration of the IYQ 2013. A resolution adopted by GeneralAssembly – A/RES/66/221 in March 2012. Accessed fromhttp://www.un-ngls.org/IMG/pdf/IYQ.pdf
Adolf VI, Shabala S, Andersen MN, Razzaghi F and Jacobsen SE.2012. Varietal differences of quinoa’s tolerance to saline con-ditions. Plant Soil 357:117–129.
Babatunde RO, Olungunju IF, Sola O. 2011. Prevalenceand determinants of malnutrition among under fivechildren of farming households in Kwara State, Nigeria.10.5539/jas.v3n3p173
Bertero HD, de la Vega AJ, Correa G, Jacobsen SE, Mujica A.2004. Genotype and genotype-by-environment interactioneffects for grain yield and grain size of quinoa (Chenopodiumquinoa Willd.) as revealed by pattern analysis of internationalmulti-environment trials. Field Crops Res 89:299–318.
Bhargava A, Shukla S, Rajan S, Ohri D. 2007. Genetic diversityfor morphological and quality traits in quinoa (Chenopodiumquinoa Willd.) germplasm. Genet Res Crop Evol 54:167–173.10.1007/s10722-005-3011-0
Cusack DF. 1984. Quinoa: grain of the Incas. Ecologist 14:21–23.Garcia M, Raes D, Jacobsen SE. 2003. Evapotranspiration
analysis and irrigation requirements of quinoa (Chenopodiumquinoa) in the Bolivian highlands. Agr Water Manage 60:119–134.
Geerts S, Dirk Raes D, Garcia M, Vacher J, Mamani R,Mendoza J, Huanca R, Morales B, Miranda R, Cusicanqui J,Taboada C. 2008. Introducing deficit irrigation to stabilizeyields of quinoa (Chenopodium quinoa Willd.). Eur J Agron28:427–436.
Hariadi Y, Marandon K, Tian Y, Jacobsen SE, Shabala S. 2011.Ionic and osmotic relations in quinoa (Chenopodium quinoaWilld.) plants grown at various salinity levels. J Exp Bot62:185–193.
Jacobsen SE. 1997. Adaptation of quinoa (Chenopodium quinoa)to Northern European agriculture: studies on developmentalpattern. Euphytica 96: 41–48.
Jacobsen SE. 2003. The worldwide potential for quinoa(Chenopodium quinoa Willd.). Food Rev Int 19:167–177.
Jacobsen SE, Stølen O. 1993. Quinoa morphology, phenology andprospects for its production as a new crop in Europe. Eur JAgron 2:19–29.
Jacobsen SE, Hill J, Stølen O. 1996. Stability of quantitativetraits in quinoa (Chenopodium quinoa). Theor Appl Genet93:110–116.
Jacobsen SE, Quispe H, Mujica A. 2001. Quinoa: an alternativecrop for saline soils in the Andes. In: CIP Program Report1999–2000. Lima, Peru: CIP. 403–408.
Jacobsen SE, Mujica A, Jensen CR. 2003a. The resistance ofquinoa (Chenopodium quinoa Willd.) to adverse abiotic factors.Food Rev Int 19:99–109.
Jacobsen SE, Mujica A, Ortiz R. 2003b. The global potential forquinoa and other Andean crops. Food Rev Int 19:139–148.
Jacobsen SE, Monteros C, Corcuera LJ, Bravo LA, ChristiansenJL, Mujica A. 2007. Frost resistance mechanisms in quinoa(Chenopodium quinoa Willd.). Eur J Agron 26:471–475.
Jayne TS, Yamano T, Weber MT, Tschirley D, Benfica R,Antony Chapoto A. 2003. Smallholder income and landdistribution in Africa: implications for poverty reductionstrategies. 10.1016/S0306-9192(03)00046-0
Koyro HW, Eisa SS. 2008. Effect of salinity on composition, via-bility and germination of seeds of Chenopodium quinoa Willd.Plant Soil 302:79–90.
Maurice OE. 2001. Adaptability of some quinoa genotypes toKenian highland conditions with special reference to Kiambudistrict. MSc Thesis. Faculty of Agronomy, University ofNairobi, Kenia, pp. 1–79.
Oyoo ME, Githiri SM, Ayiecho PO. 2010. Performance of somequinoa (Chenopodium quinoa Willd.) genotypes in Kenya. SAfr J Plant Soil 27:2.
Rojas W, Barriga P, Figueroa H. 2000. Multivariate analysis of thegenetic diversity of Bolivian quinoa germplasm. PGR Newsl122:16–23.
Schlick G, Bubenheim DL. 1993. Quinoa: an emerging “new”crop with potential for CELSS. NASA Technical Paper 3422.1–12.
Siderius W, Muchena FN. 1977. Soils and environmentalconditions of agricultural research stations in Kenya.Miscellaneous Soil Paper M5. Kenya Soil Survey. NationalAgricultural Research Laboratory, Nairobi.
Sigsgaard L, Jacobsen SE, Christiansen JL. 2008. Quinoa,Chenopodium quinoa, provides a new host for native her-bivores in Northern Europe: case studies of the moth,Scrobipalpa atriplicella, and the Tortoise Beetle, Cassidanebulosa. J Insect Sci 8: 1–4.
Wilson HD. 1990. Quinoa and relatives (Chenopodium sect.chenopodium subsect. cellulata) Econ Bot 44Supplement3:92–110.

Chapter 10
Quinoa Cultivation for Temperate NorthAmerica: Considerations and Areas for
Investigation
Adam J. Peterson and Kevin M. MurphyDepartment of Crop and Soil Sciences, Washington State University, Pullman, WA, USA
INTRODUCTION
Quinoa has a relatively recent history of commer-cial cultivation in North America. The first majorefforts at commercial cultivation were begun in1983 by a partnership between Colorado StateUniversity and Sierra Blanca Associates, focusingon growing quinoa in high altitude locations ofColorado (Johnson 1990). In addition, privateefforts to test and grow quinoa varieties inNorth America were begun by John Marcille innorthern Washington state and Emigdio Ballón innorthern New Mexico (Ballón 1990; Wilson andManhart 1993). Quinoa production expandedoutside Colorado to Wyoming and Northern NewMexico (Ward 1994). By the late 1980s, efforts togrow quinoa in Canada were underway (NationalResearch Council 1989; Tewari and Boyetchko1990; Small 1999).
Cultivation of quinoa in North America iscurrently centered in the San Luis Valley of Col-orado and in the Canadian Prairies through theNorthern Quinoa Corporation, with headquartersin Saskatoon, Saskatchewan. Despite efforts tocultivate quinoa in North America and other partsof the world, the majority of worldwide quinoa
Quinoa: Improvement and Sustainable Production, First Edition. Edited by Kevin Murphy and Janet Matanguihan.© 2015 John Wiley & Sons, Inc. Published 2015 by John Wiley & Sons, Inc.
cultivation is still concentrated in South America.In recent years, the large gap between the supplyof quinoa and the growing demand for it has ledto high prices and mounting concern about thesocial and environmental impacts of quinoa pro-duction in the major quinoa-producing countries(Jacobsen 2011; Romero and Shahriari 2011).These concerns, along with the desire in manyareas for regionally sourced food and interest inquinoa as a crop for improving food security, haveled to efforts to adapt and grow quinoa in variousparts of the world (Jacobsen 2003).
TOLERANCE TO ABIOTIC STRESSES
Heat tolerance
Quinoa production in North America has so farbeen limited to regions with cool summers, wheremaximum temperatures do not exceed 35∘C(95∘F). Initial trials in Colorado showed thatquinoa was unsuccessful at elevations lower than2,100 m (7,000 ft) due to pollen sterility and plantdormancy caused by high temperatures (Johnsonand Croissant 1985; Johnson 1990).
173
174 Quinoa: Improvement and Sustainable Production
Multiple reports exist indicating that high tem-peratures pose a constraint to quinoa productionin North America, namely in Minnesota (Oelkeet al. 1992), New York (Dyck 2012), Virginia(Bhardwaj et al. 1996), and Alberta (AAFRD2005). Oelke et al. (1992) suggested that heatsusceptibility would limit the expansion of quinoacultivation to coastal areas in central California,high altitude locations in central and northernWashington state, and parts of the Canadianprairies. High temperatures have been noted ashaving a detrimental effect on yield and seedfilling in locations outside of North Americasuch as Morocco (Benlhabib et al. 2004), Chile(Fuentes and Bhargava 2011), Greece (Iliadiset al. 2001), and Italy (Pulvento et al. 2010).
Chronic heat stress can also affect quinoa, incontrast to the acute heat stress events that canoften occur under field conditions. In an earlystudy of a variety of unspecified origin, Aguilar(1968) found that quinoa subjected to a constanttemperature of 32∘C (90∘F) had greatly reducedheight, biomass, and seed yield compared tomore mild temperature treatments. Overalldevelopment time was shortened, and red stemcolor present in the tested variety was enhancedat hotter temperatures.
Current work at Washington State University(WSU) has found maximum summer tempera-tures to be a major limiting factor for successfulseed set in quinoa. While temperatures did notexceed 35∘C (95∘F) during anthesis in a 2011 fieldexperiment, high temperatures during the seedfill stage may have caused significant reductions inyield. Many of the inflorescences lacked seeds orcontained empty seeds (Peterson 2013). Despitethe large reduction in yield in 2011, several vari-eties, namely Colorado 407D, QQ74, and Kaslaea,exhibited greater heat tolerance than others.
Variation in adaptation to hot, dry conditionshas also been observed among Chilean highlandvarieties grown in a field experiment in AtacamaDesert of northern Chile (Fuentes and Bhargava2011). The effect of heat stress on quinoa wasreviewed in detail by Bonifacio (1995), whonoted that heat stress could cause reabsorptionof the endosperm, a phenomenon recognizedby Bolivian farmers as “phuna” or “puna.” As
the endosperm of the quinoa seed is of minimalsize and the perisperm and embryo are the twolargest components of the seed (Prego et al.1998), this reabsorption likely extends to moreseed components than the endosperm. Bonifacioalso observed that high temperatures inhibitedanther dehiscence in outdoor plantings in Provo,Utah in 1993 and found varietal differences inheat tolerance.
Irrigation may be an important tool in quinoacultivation by ameliorating the effects of heatstress. Preliminary results from a WSU irriga-tion trial showed that irrigation substantiallyincreased yields under heat stressed growingconditions in eastern Washington state (HannahWalters, personal communication, 2013). Furtherinvestigation into the role of heat stress, wateravailability, and the interaction of these factors inquinoa is warranted.
As most areas of temperate North Americahave summer temperatures in excess of quinoa’sthreshold of tolerance (NCDC 2011), the devel-opment of heat tolerant varieties could greatlyexpand the area suitable for quinoa productionand increase harvest security in areas with damag-ing heat waves. Despite the heat susceptibility ofquinoa, closely related Chenopodium spp. inhabitparts of North America that experience intensesummer heat (Jellen et al. 2011). In addition,archeological evidence indicates the existence ofa domesticated chenopod pseudograin, analogousto quinoa, in the prehistoric Eastern NorthAmerican agricultural complex (Smith 1985).This implies the possibility of developing aheat-tolerant chenopod pseudocereal for NorthAmerica outside of high altitude or cool maritimelocations. If the existing variation for heat tol-erance within quinoa proves insufficient, relatedChenopodium spp. such as C. berlandieri and C.bushianum to which quinoa can hybridize mayprovide a promising source for introgression ofgenes for heat tolerance.
Drought tolerance
Quinoa is considered to have remarkable droughttolerance. It has been reported to grow with aslittle as 200 mm (8 in) annual precipitation in
Quinoa Cultivation for Temperate North America: Considerations and Areas for Investigation 175
pure sand (Aguilar and Jacobsen 2003). Yieldsexceeding 1,000 kg/ha (890 lbs/acre) have beenreported with as little as 50 mm (2 in) irrigation inthe Atacama Desert of northern Chile. However,yields are much improved in arid regions underirrigation (Martínez et al. 2009). Initial researchin Colorado found that quinoa had highest yieldswith 208 mm (8.2 in) of combined irrigation andrainfall on a sandy loam soil (Flynn 1990). Laterrecommendations to growers in the San LuisValley were 25–38 cm (10–15 in) of combinedirrigation and rainfall (Johnson and Croissant1985). The addition of organic matter has beenshown to be effective in increasing quinoa yieldunder arid conditions (Martínez et al. 2009).
The effect of drought on yield varies depend-ing on the stage of plant development. Geertset al. (2008) found that water use efficiencyimproved when there was adequate water supplyduring the initial germination phase and duringflowering and seed fill, even though droughtoccurred during vegetative growth. In contrast,there were severe negative effects on yield whendrought occurred during flowering and duringseed fill stages. Jensen et al. (2000) also foundyield decreases when drought was simulatedduring the flowering stage and during the seedfill stage. When drought was instead simulatedduring the early vegetative phase, yield increasedcompared to the control.
Sensitivity to drought in later developmentalstages may be responsible for the reported lackof seed set in cool growing locations. Quinoatrials in Sweden showed a total failure of seed setduring a year with a near absence of precipitationin July (Ohlsson 2000). This contrasts withfavorable performance the previous year, whenrainfall was more equally distributed (Ohlssonand Dahlstedt 1999). Some Chilean lowlandvarieties grown in cool locations at sites in mar-itime western Washington state failed to set seedin 2013 (unpublished data). As these sites arecharacterized by a mild oceanic Mediterraneanclimate with seasonal summer drought that wouldcoincide with later growth stages of quinoa, theimpact of drought on seed set deserves furtherinvestigation, as well as the variability for seed setamong Chilean lowland varieties.
In contrast, some reports indicate greaterdrought tolerance in later growth stages. Jacobsenand Stølen (1993) noted that in Denmark, thegreatest impact from drought occurs during thevegetative stage. Likewise, Darwinkel and Stølen(1997) reported greater drought tolerance inlater growth stages. Razzaghi et al. (2012) foundthat yield did not significantly decrease whensimulated drought was applied during the seedfilling stage.
Cold tolerance
Cold temperatures are an important limiting fac-tor for quinoa cultivation in many areas of NorthAmerica. The occurrence of frosts places limits onthe planting date of spring planted quinoa, whichis of particular importance where the long timeto maturity for quinoa is an issue. At high alti-tude locations, cooler temperatures favor quinoacultivation, although the frost-free growing periodis shorter. This limits cultivation to the earliestmaturing varieties and can place plants in the fieldat risk to early frosts during sensitive growth peri-ods (Johnson and Croissant 1985).
One untested possibility is the cultivationof quinoa as a winter crop in extreme southernlocations of the United States. Although heatwould not be an issue over the relatively coolwinters, the potential occurrence of damagingfrosts in many of these locations would likely limitany cultivation of quinoa to locations that do notexperience temperatures lower than the reportedlimits for quinoa, such as areas of southernFlorida that experience a tropical climate.
There are varying reports on the frost toler-ance of quinoa under field conditions. Risi andGalwey (1984) reviewed contradictory reportsregarding the frost tolerance of quinoa in SouthAmerica, with some sources indicating little or nofrost resistance and others reporting high frostresistance.
In a study by Jacobsen et al. (2007), frost toler-ance measured under controlled conditions variedbetween an Altiplano and a Valley-type variety.In addition, frost tolerance was found to correlatewith the ability of quinoa to produce more solublesugars and, to a lesser extent, proline, with
176 Quinoa: Improvement and Sustainable Production
exposure to cooler temperatures (Jacobsen et al.2007). Growth stage also affects tolerance to frost.Exposure to frost after the initiation of floweringproved far more damaging than exposure duringearlier growth stages. A 66% reduction in yieldwas seen when plants in anthesis were exposed to−4∘C (25∘F), whereas seedlings at the two-leafgrowth stage exposed to the same conditions onlyhad a 9% reduction in yield. Humidity also inter-acted with the impact of frost on quinoa, withdrier conditions resulting in lower percentage ofplant survival (Jacobsen et al. 2005).
There are a few accounts of frost tolerancein Chilean lowland varieties. In England, Risiand Galwey (1984) found that several Chileanvarieties tolerated several frosts in spring, oneof which reached −5∘C (23∘F). In Colorado,reports indicate that quinoa could withstand lightfrosts of −1 to 0∘C (30–32∘F). In accordancewith Jacobsen’s findings, a heavy frost of −4.4∘C(24∘F) during flowering caused losses exceeding70% (Johnson and Croissant 1985). Oelke et al.(1992) suggested that temperatures below −2∘C(28∘F) during flowering would cause significantlosses. However, once seeds are in the softdough stage, frost resistance increases and plantswere reported to withstand temperatures downto −7∘C (20∘F). Darwinkel and Stølen (1997)reported varietal differences in frost tolerance andnoted −3∘C (27∘F) as the threshold for quinoa.
Salinity tolerance
Soil salinity is a significant agricultural problemfor large parts of temperate North America. In theUnited States, there are 2.2 million hectare (Mha)(5.4 million acres (Mac)) of saline agriculturalland, with a further 30.8 Mha (76.1 Mac) of agri-cultural land under threat of salinization (USDA2011). The majority of these saline-affected soilsare confined to arid and semi-arid regions ofthe West (USDA 1989). In Canada, salinity is asignificant problem in the Prairie provinces ofAlberta, Saskatchewan, and Manitoba, affectingan estimated 2.19 Mha (5.4 Mac) (ARD 2004).
Quinoa is generally recognized as one of themost saline-tolerant crops known (Jacobsen 2007).In its native range, quinoa is cultivated in areas
with highly saline soils. For example, varieties ofthe Salares ecotype are grown around salt flats inSouthern Bolivia (Risi and Galwey 1984).
Quinoa has exhibited unparalleled levels ofsalinity tolerance under controlled conditions.Koyro and Eisa (2007) and Hariadi et al. (2011)demonstrated the ability of quinoa to survive andproduce seed under 500 mM NaCl, an equiva-lent concentration to that of seawater. Jacobsenet al. (2003) found that seeds of the variety“Kanckolla” were able to germinate at 57 mS/cm,a level exceeding that of seawater.
The salt tolerance of quinoa has been demon-strated to vary significantly within and betweenecotypes. In an analysis of Peruvian quinoagermplasm, Gómez-Pando et al. (2010) foundsignificant variation for saline tolerance at boththe seedling and the adult stages. Tolerance at theseedling stage was not necessarily correlated withtolerance during the adult stage (Jacobsen et al.1999b).
Adolf et al. (2012) investigated the response ofDanish, Bolivian, and Peruvian varieties to salin-ity and noted a considerable range in physiologicalresponses and relative salinity tolerance. Despitethe complex variation exhibited in the study, Dan-ish varieties of Chilean lowland background wereof average or lesser salinity tolerance as measuredby relative declines in height and biomass, whereasthe “Real”-type quinoa varieties from SouthernBolivia rated more tolerant for these measures.
Investigation of salinity tolerance withinChilean lowland germplasm will prove importantin the use of quinoa as a salt tolerant crop. Thesevarieties are most adapted to the conditionsfound in areas of North America affected bysoil salinity. Many salt-affected areas in westernNorth America experience high summer tem-peratures characteristic of a continental climate.Breeding varieties with greater heat tolerancewill be necessary as the susceptibility of quinoato heat precludes its cultivation in these areas.Chilean lowland varieties have the greatest heattolerance and characterizing their levels of salinitytolerance will be crucial in developing quinoa as asuccessful halophytic crop for these areas.
Two germination studies conducted withChilean germplasm provided evidence for a
Quinoa Cultivation for Temperate North America: Considerations and Areas for Investigation 177
significant geographical trend in salinity tol-erance (Delatorre-Herrera and Pinto 2009;Ruiz-Carrasco et al. 2011). Delatorre-Herreraand Pinto (2009) found higher tolerance among aChilean highland variety compared to a Chileanlowland variety, measured in terms of seedgermination, and related this to adaptationto the saline soils found in the highlands ofnorthern Chile. Ruiz-Carrasco et al. (2011)tested varieties within the range of the Chileanlowland ecotype, comparing varieties from centralChile with a variety from southern Chile. Theauthors found significant differences amongthese varieties in growth characteristics, prolineaccumulation, polyamine response, and expres-sion levels of sodium transporter genes CqSOS1and CqNHX1. These differences were generallyindicative of lower salinity tolerance in the quinoavariety from Southern Chile and were linked bythe authors to the gradient of decreasing exposureto salinity and increasing precipitation that runsnorth to south in Chile.
A recent study measured the salinity toleranceamong four quinoa varieties of Chilean lowlandorigin (Peterson 2013). All four varieties weresignificantly more tolerant to Na2SO4 than theywere to NaCl, as measured by yield decreasesat 32 dS/m relative to a nonsalt control. Yielddeclines for quinoa varieties ranged from 43.7%to 65.4% under 32 dS/m NaCl and from 10.8%to 51.9% under 32 dS/m Na2SO4. Of particularsignificance is that these differences generallyappeared to match the latitude of origin of thevarieties in Chile, in accordance to the findingsof previous studies. In terms of yield, the north-ernmost variety, UDEC-1, was generally mosttolerant and the southernmost variety, QQ065,was most susceptible to salinity (Peterson 2013).
Further investigation to confirm a geograph-ical gradient of saline tolerance among Chileanlowland accessions could prove invaluable inidentifying the most saline-tolerant Chilean low-land germplasm. In addition, given the increasingtemperatures that are also found at more north-ern and lower latitudes in Chile (Climatologia;Ruiz-Carrasco et al. 2011), greater heat tolerancemay be found in conjunction with greater salinitytolerance.
A field study performed in Southern Italyfound that the Danish quinoa variety “Titicaca”had no significant difference in yield whenirrigated with saline water of 22 dS/m, mixed toapproximate a 1 : 1 ratio of seawater to freshwater,compared to a fresh water control (Pulventoet al. 2012). In comparison, barley, considered asaline tolerant grain, has a salinity threshold of8 dS/m (Maas 1986). When quinoa was grownon a saline-sodic soil in Greece with an EC of6.5 dS/m, the seedlings had poor establishment,which the authors linked to high pH, high Na+,and poor soil physical characteristics due to soilsodicity. Varieties responded differently whengrown on a nonsaline soil, indicating varietaldifferences in tolerance. Overall, yield wassubstantially decreased, with the best performingvariety under saline-sodic conditions yielding1.27 t/ha (1,130 lbs/ac), whereas the bestperforming variety under nonsaline conditionsyielded 2.30 t/ha (2,050 lbs/ac) (Karyotis et al.2003). The added effects of sodicity to salinitylikely explain the large differences in yieldresponse in that experiment compared to thefindings by Pulvento et al. (2012). As soil crustingreduces quinoa emergence, the tendency of sodicsoils to form a crust may be an impediment to thepotential of quinoa to be grown on these soils.The larger effect of sodicity compared to salinityis supported by an early experiment by Torres(1955), which compared the response of quinoato saline, saline-sodic, and sodic soils. Sodicitywas found to have a more detrimental impacton quinoa biomass yield compared to salinity,though differences in sodicity tolerance were seenbetween the two varieties examined.
PRODUCTION ASPECTS
Variety selection
Quinoa is traditionally divided into five main eco-types: Valley, which is grown between 2,000 and4,000 m elevation from Central Peru northward;Altiplano, grown at 4,000 m elevation aroundLake Titicaca; Salar, grown at 4,000 m aroundsalt flats in southern Bolivia; Subtropical, from
178 Quinoa: Improvement and Sustainable Production
the Yungas region of Bolivia; and Sea level, fromtemperate latitudes in southern Chile (Tapia et al.1980 cited in Risi and Galwey 1984). The Sealevel ecotype, also referred to as Chilean lowlandecotype, is recognized as the best adapted to tem-perate latitudes and high summer temperatures.After initial trials, Chilean varieties were chosento form the basis of breeding programs in Europeand in Colorado (Johnson 1990; Jacobsen 1999).In initial trials, Chilean lowland varieties werethe best adapted to cultivation in Washingtonstate (unpublished data), and only Chilean andsouthern Bolivian varieties set seed in Colorado(Johnson 1990). Bertero (2003) concluded thatChilean lowland and Altiplano varieties, charac-terized by low photoperiod sensitivity and a shortbasic vegetative period, were most suited for cool,temperate latitudes.
However, there are reports of non-Chileanvarieties producing good yields at high latitudelocations in Europe. A wide range of Peruvian andBolivian varieties produced seed in a field trial inFinland, at two locations above 60∘N (Carmen1984). Likewise, Valley and Altiplano varietiesproduced significant yields in England, as didBolivian and Peruvian varieties in Denmark.However, non-Chilean varieties generally neededlonger times to reach maturity (Risi and Galwey1991b; Jacobsen and Stølen 1993; Jacobsen 1997).Christiansen et al. (2010) found that an 18-h-longphotoperiod induced a “stay green” reaction in“Real,” a Bolivian variety.
Overall, non-Chilean varieties failed to set seedin field trials in Washington state (unpublisheddata). Bertero (2003) also noted failure of thesevarieties to reach maturity in Argentina.
In an experiment using “Kanckolla,” anAltiplano variety, long daylength and high tem-peratures were found to decrease the amount ofseed filling. The two factors, taken separately, hadsmall but significant effects. However, when 16-hdaylength was combined with 28∘C (82∘F), seedsize decreased by 73% (Bertero et al. 1999). Thisrelatively low threshold for high temperatures,combined with the negative influence of longdaylength, suggests that most non-Chilean vari-eties likely have negligible potential for cultivationin temperate regions of North America.
Fertilization
Fertilizer recommendations for quinoa in Col-orado were 135 kg N/ha (120 lbs N/acre), basedon results from early trials (Johnson and Crois-sant 1985). However, after more extensive fieldresearch, the recommendation was increased to170–200 kg N/ha (150–180 lbs N/acre). Higherlevels of nitrogen were found to have adverseeffects, leading to lodging and delayed maturity(Oelke et al. 1992). Under Danish conditions,yield was generally highest at 160 kg N/ha(143 lbs N/ac) compared to the lower levelsof 120 kg N/ha (107 lbs N/ac), 80 kg N/ha(71 lbs N/ac), and 40 kg N/ha (36 lbs N/ac).However, increase in yield response under higherfertilization levels was minimal. At 40 kg N/ha,yield was only 24.1% lower than at 160 kg N/ha(Jacobsen et al. 1994). Trials in Denmark andthe Netherlands showed differences in nitrogenresponse across locations and years, althoughgeneral recommendations of 100–150 kg N/ha(89–134 lbs N/ha) were given. A fertilizationlevel of 50 kg N/ha resulted in poor yields,whereas nitrogen in excess of 150 kg N/ha wasfound to have meager benefits (Darwinkel andStølen 1997).
A study performed by Schulte auf’m Erleyet al. (2005) in southern Germany found quinoaquite responsive to increased nitrogen fer-tilization. Yields at no fertilization produced1,790 kg/ha (1,597 lbs/ac), whereas 120 kg N/ha(107 lbs N/ac) caused yields to almost double to3,495 kg/ha (3,118 lbs/ac). Nitrogen utilizationefficiency (g grain/g Nplant) did not change underincreasing fertilization, though a significantdifference was seen between the two varietiestested (Schulte auf’m Erley et al. 2005).
In another experiment, conducted undergreenhouse conditions, nitrogen utilizationefficiency showed significant decreases underincreasing N, in contrast to the results observedby Schulte auf’m Erley et al. (2005). This dif-ference is notable in that one of the varietiestested, “Faro,” was common to both experiments,indicating different nitrogen dynamics due toenvironment. Again, there was a significantdifference between varieties, but this time in
Quinoa Cultivation for Temperate North America: Considerations and Areas for Investigation 179
nitrogen uptake efficiency (g Nplant/g Nmineral)(Thanapornpoonpong 2004).
The large variation in nitrogen dynam-ics observed at different locations, as well assignificant varietal differences, pose severalchallenges and opportunities for breeding quinoafor increased nitrogen use efficiency. Quinoahas historically thrived in marginal areas, andvarieties that are adapted to low soil nitrogenmight prove valuable for low-input agriculture.Traditional cultivation of quinoa on the PeruvianAltiplano generally involves no fertilization. Incrop rotations, quinoa is grown after potatoesand scavenges for remaining nutrients in the soil(Aguilar and Jacobsen 2003).
As organic quinoa makes up the bulk of quinoademand, with organic quinoa constituting 69%of the total US quinoa imports in 2013 (Arcode Nuñez 2014), investigating the response ofquinoa varieties to fertilization and managementunder organic conditions is crucial. Scant dataexists in this area of study; however, Bilaliset al. (2012) reported yield increases of 6% withcompost application and of 10% with cow manureapplication compared to a nonfertilized control.
Seed composition is influenced by fertilization.In the aforementioned study by Bilalis et al.(2012), saponin content increased under organicfertilization as compared to a nonfertilized con-trol. Johnson and Ward (1993) found that proteincontent was responsive to nitrogen applications,increasing by 0.1% per kg of ammonium nitrate.
Soil texture is reported to have a major impacton nitrogen uptake and nitrogen use efficiency.In a lysimeter experiment where 120 kg N/ha(107 lbs N/ac) was applied, nitrogen uptakewas 134 kg N/ha (120 lbs N/ac) under a sandyclay loam but only 77 kg N/ha (69 lbs N/ac)under a sandy soil, leading to differing yields of3,300 kg/ha (2,900 lbs N/ac) and 2,300 kg/ha(2,100 lbs N/ac), respectively (Razzaghi et al.2012).
In most studies, nitrogen was applied in asingle application, although several studies reportsplitting applications between planting and alater stage (Aguilar and Jacobsen 2003; Schulteauf’m Erley et al. 2005; Pulvento et al. 2010).Darwinkel and Stølen (1997) suggest splitting
fertilizer applications exceeding 150 kg N/ha(134 lbs N/ac) to prevent excessive salt exposure.However, there is no published research on theeffects of split fertilizer applications on nitrogenuptake in quinoa.
There are contradictory reports on theresponse of quinoa to phosphorus fertilization.In Chile, yield increased with high levels ofphosphorus fertilization (100 and 200 kg N/ha,89 and 178 lbs N/ac) when accompanied bynitrogen fertilization (Delatorre-Herrera 2003).Recommendations from South America indicatethat quinoa responds well to 80 kg N/ha (71 lbsN/ac) and 80 kg P/ha (71 lbs P/ac) (Mujica 1977cited in Aguilar and Jacobsen 2003). However,Gandarillas (1982 cited in Johnson and Ward1993) found no yield response to phosphorus orpotassium application. In Colorado, phosphorusapplications of 34 kg P2O5/ha (30 lbs P2O5/acre)did not affect yield (Oelke et al. 1992). Darwinkeland Stølen (1997) reported requirements of 70 kgP2O5/ha (62 lbs P2O5/ac) for quinoa before seedfilling and noted that existing levels of phosphorusin many agricultural soils are likely sufficient.They also note a fairly large requirement forpotassium, with uptake of 500 kg K2O/ha(446 lbs K2O/ac) and recommend applicationof 100–200 kg K/ha (89–178 lbs K/ac). Dataon the micronutrient requirements of quinoais almost nonexistent. However, Darwinkel andStølen (1997) report that manganese is a criticalmicronutrient for quinoa.
Planting/spacing
Row spacing for quinoa varies widely. In SouthAmerica, a variety of planting techniques are used.When quinoa is planted in rows, spacing rangesfrom 0.4 m (16 in) and 0.8 m (31 in). Wide rangesof optimal sowing density have also been reported(Tapia et al. 1980 cited in Risi and Galwey 1984).
Recommendations for Colorado were basedon a plant density of 320,000 plants/ha(130,000 plants/acre) and a sowing densityof 0.6–0.8 kg/ha (0.5 to 0.75 lbs/acre). Therewas no set row spacing recommended, althoughspacing greater than 36 cm (14 in) was beneficial(Johnson and Croissant 1985). In experiments in
180 Quinoa: Improvement and Sustainable Production
England, highest yields were seen for the Chileanvariety ‘Baer’ under the closest row spacingtested, at 20 cm (8 in) spacing seeded at 20 kgseed/ha (18 lbs seed/ac). Increasing plant densitydecreased the amount of branching on plants andalso resulted in earlier maturity in the field (Risiand Galwey 1991a).
Jacobsen et al. (1994) investigated row spacingsof 50, 25, and 12.5 cm and found no significantdifferences in yield between them. The widestspacing of 50 cm (20 in) was combined withmechanical hoeing to control weeds, and plantsunder this spacing appeared healthiest, whereasplants at the 25 cm (10 in) and 12.5 cm (5 in)row spacings were best able to crowd out weeds.Moreover, optimal plant density was calculatedto be 327 plants/m2 (1,320,000 plants/acre) witha standard deviation of 220 plants/m2 (890,000plants/acre), leading the authors to conclude thatyield could remain stable over a wide range ofplant densities. On the basis of later experimentsin Denmark and the Netherlands, Darwinkel andStølen (1997) confirmed the stability of yieldacross a wide range of row spacings, rangingfrom 12.5 cm (5 in) to 75 cm (30 in), and plantdensities ranging from 30 to 250 plants/m2 (25 to210 plants/yd). On the basis of harvesting con-siderations and weed competition, a seeding rateof 6 kg/ha (5.4 lbs/ac) with target plant densitiesof 100 to 150 plants/m (85 to 125 plants/yd) wasrecommended for quinoa cultivation in northernEurope.
The large range of plant densities, row spacing,and seeding rates found in these studies indicatethe large influence that location and weed pres-sure, as well as variety characteristics, have onyield. Given the wide range of conditions foundacross temperate North America, further researchwill be necessary to determine the proper spacingand seeding rates for new locations.
Planting depth for quinoa is also variabledepending on soil type and conditions. Oelkeet al. (1992) recommended planting at a depthof 1.3 to 2.5 cm (0.5 to 1 in) in Colorado. Exces-sively deep sowings were noted to lead to pooremergence due to waterlogging, whereas plantingdepths that were too shallow left seeds vulnerableto soil drying. In Europe, high germination
required adequate contact of seeds with soil withthe proper moisture level (Darwinkel and Stølen1997). Aufhammer et al. (1994) found that soilcrusting had a highly damaging effect on seedlingemergence. They stressed the importance of alight-textured seedbed for successful germina-tion. Quinoa germination rates were reported todrop steeply at depths greater than 2 cm (0.8 in).At shallower depths, greater emergence wasobserved in a sandy soil than a loamy clay soil.
Reports from Europe confirm the need for afine-textured and even seedbed and likewise indi-cate that heavy clay soils can cause problems withearly establishment of the root system. Plantingdepths of 1 to 2 cm (0.4 to 0.8 in) were recom-mended (Darwinkel and Stølen 1997).
Temperature has a significant effect on thepercentage and rate of germination but there arevarying reports on the optimum temperatureneeded for successful germination. In Denmark,seed is usually planted when the soil temperatureis 7–8∘C (45–46∘F). An experiment with aDanish variety of Chilean lowland origin showedmaximum germination between 15 and 20∘C(59–68∘F). However, high rates of germinationwere seen for a wide range of temperatures,including 8∘C (46∘F), the lowest temperaturetested (Jacobsen and Bach 1998). Recommendedsoil temperatures for planting in Colorado were7–10∘C (45–50∘F) (Johnson and Croissant1985). For England, reports indicated that soiltemperatures of 5–8∘C (41–46∘F) were suitablefor planting quinoa in the spring (Galwey 1989).Darwinkel and Stølen (1997) recommended soiltemperatures exceeding 10∘C (50∘F) for plantingand note that lower temperatures inhibit propergermination and establishment.
In a germination experiment with the Danishvariety “Olav,” temperatures of 6∘C (43∘F)inhibited germination, resulting in only 25% ofthe germination found at 20∘C (68∘F) (Jacobsenet al. 1999a). The study also showed that the dateof harvest was a significant factor for germinationat low temperatures. For seed that had beenharvested early, there was 0% germination. Thegermination percentage increased to a maximumof 45% with a later time of harvest.
Quinoa Cultivation for Temperate North America: Considerations and Areas for Investigation 181
Christiansen et al. (1999) investigated fivePeruvian quinoa lines for their ability togerminate at low temperatures. In contrast to theresults reported by Jacobsen, high germinationwas seen at temperatures as low as 2∘C (36∘F),indicating that variation exists in quinoa forminimum germination temperature.
For some areas in North America, sufficientlyhigh soil temperatures may be the determin-ing factor for planting date. The temperaturegermination study by Jacobsen et al. (1999a)investigated only one variety of Chilean lowlandorigin. Further screening of a wide range ofChilean lowland varieties for their ability togerminate at lower temperatures could identifyvarieties suited for earlier planting. If this traitis not identified in the germplasm screened, itcould potentially be brought in from non-Chileanvarieties such as those identified by Christiansenet al. (1999). Earlier planting could mean earlierestablishment, enhanced competitiveness withweeds, and earlier harvest time. Germinationunder low temperatures would also need to becombined with seedling vigor and proper estab-lishment under such conditions. For instance,early seeding under northwestern Europeanconditions showed not only poor germinationbut also poor emergence and, subsequently, poorgrowth (Darwinkel and Stølen 1997).
Maturity and harvesting
Days-to-maturity is a critical yet highly variablefactor for the successful cultivation of quinoa. InColorado, days to maturity range from 90 to 125days (Johnson and Croissant 1985), whereas daysto maturity have ranged from 100 to 130 days fordifferent varieties grown in Eastern Washington.Maturity has been observed to vary significantlydepending on environmental variation in the field(unpublished data). In Greece, maturation timewas shown to vary from 110 to 116 days comparedto the 110 to 180 days reported for Denmark(Jacobsen 2003). Within the same location,maturity time has been shown to vary widelyfrom year to year (Gesinksi 2000; Jacobsen 1998).The wide range of maturity time by locationand environmental conditions emphasizes the
importance of testing quinoa in new locationsover multiple years.
Quinoa can be mechanically harvested throughthe use of a combine. However, adjustments areneeded for the small seed size and large stems. InColorado, quinoa harvest recommendations aresimilar to sorghum. Combining does not resultin a totally clean product and further processingis necessary after combining. Recommendationsinclude the use of a fanning mill and gravityseparator (Oelke et al. 1992). Darwinkel andStølen (1997) also confirm the necessity ofcleaning after combining, although they note thatthe percentage of chaff can be kept under 5%if done under optimum field conditions with aproperly adjusted combine.
Jacobsen et al. (1994) compared the efficacyof swathing compared to combining and foundno significant differences in yield between thetwo methods when performed at their respectiveoptimal harvest time. Swathing did allow forharvest earlier in the season than combining,when the plants were still somewhat green. Thiscould be advantageous in situations where earlyharvest is important, particularly during the stagewhen mature seed has formed but plants have notfully senesced and cannot be combined. This hasbeen an issue for quinoa grown in western Oregonand western Washington state, where early onsetof seasonal rains in late summer and early autumncan cause preharvest sprouting.
In Colorado, steady yields of 1,340 kg/ha(1,200 lbs/acre) were reported over a 3-yearperiod (Johnson and Croissant 1990). Withproper management, however, this can increaseto over 2,000 kg/ha (1,800 lbs/acre) (Oelkeet al. 1992). In Saskatchewan, yield is reportedto range from 840 to 1,400 kg/ha (750 to1,250 lbs/acre), although yields exceeding2,200 kg/ha (2,000 lbs/acre) have been reported.On the other hand, complete losses can also occur(AAFRD 2005).
Quinoa yields reported in Europe exceedthose of Colorado. Yields in Denmark typi-cally range from 2,000 to 3,000 kg/ha (1,800to 2,700 lbs/ac) (Jacobsen et al. 2010). Undertwo field experiments in England, the variety“Baer” yielded 5,140 kg/ha (4,590 lbs/ac) (Risi
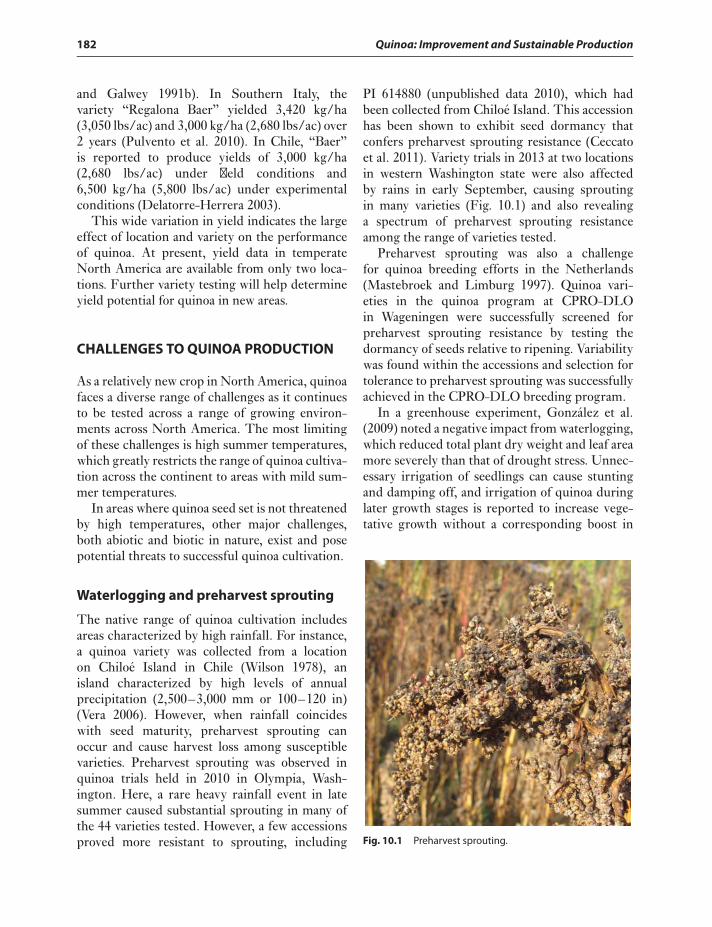
182 Quinoa: Improvement and Sustainable Production
and Galwey 1991b). In Southern Italy, thevariety “Regalona Baer” yielded 3,420 kg/ha(3,050 lbs/ac) and 3,000 kg/ha (2,680 lbs/ac) over2 years (Pulvento et al. 2010). In Chile, “Baer”is reported to produce yields of 3,000 kg/ha(2,680 lbs/ac) under field conditions and6,500 kg/ha (5,800 lbs/ac) under experimentalconditions (Delatorre-Herrera 2003).
This wide variation in yield indicates the largeeffect of location and variety on the performanceof quinoa. At present, yield data in temperateNorth America are available from only two loca-tions. Further variety testing will help determineyield potential for quinoa in new areas.
CHALLENGES TO QUINOA PRODUCTION
As a relatively new crop in North America, quinoafaces a diverse range of challenges as it continuesto be tested across a range of growing environ-ments across North America. The most limitingof these challenges is high summer temperatures,which greatly restricts the range of quinoa cultiva-tion across the continent to areas with mild sum-mer temperatures.
In areas where quinoa seed set is not threatenedby high temperatures, other major challenges,both abiotic and biotic in nature, exist and posepotential threats to successful quinoa cultivation.
Waterlogging and preharvest sprouting
The native range of quinoa cultivation includesareas characterized by high rainfall. For instance,a quinoa variety was collected from a locationon Chiloé Island in Chile (Wilson 1978), anisland characterized by high levels of annualprecipitation (2,500–3,000 mm or 100–120 in)(Vera 2006). However, when rainfall coincideswith seed maturity, preharvest sprouting canoccur and cause harvest loss among susceptiblevarieties. Preharvest sprouting was observed inquinoa trials held in 2010 in Olympia, Wash-ington. Here, a rare heavy rainfall event in latesummer caused substantial sprouting in many ofthe 44 varieties tested. However, a few accessionsproved more resistant to sprouting, including
PI 614880 (unpublished data 2010), which hadbeen collected from Chiloé Island. This accessionhas been shown to exhibit seed dormancy thatconfers preharvest sprouting resistance (Ceccatoet al. 2011). Variety trials in 2013 at two locationsin western Washington state were also affectedby rains in early September, causing sproutingin many varieties (Fig. 10.1) and also revealinga spectrum of preharvest sprouting resistanceamong the range of varieties tested.
Preharvest sprouting was also a challengefor quinoa breeding efforts in the Netherlands(Mastebroek and Limburg 1997). Quinoa vari-eties in the quinoa program at CPRO-DLOin Wageningen were successfully screened forpreharvest sprouting resistance by testing thedormancy of seeds relative to ripening. Variabilitywas found within the accessions and selection fortolerance to preharvest sprouting was successfullyachieved in the CPRO-DLO breeding program.
In a greenhouse experiment, González et al.(2009) noted a negative impact from waterlogging,which reduced total plant dry weight and leaf areamore severely than that of drought stress. Unnec-essary irrigation of seedlings can cause stuntingand damping off, and irrigation of quinoa duringlater growth stages is reported to increase vege-tative growth without a corresponding boost in
Fig. 10.1 Preharvest sprouting.
Quinoa Cultivation for Temperate North America: Considerations and Areas for Investigation 183
seed production (Oelke et al. 1992). Waterloggingin the germination phase had a deleterious impacton quinoa in a trial in the United Kingdom;varietal differences in tolerance to this stress wereobserved (Risi and Galwey 1989).
Disease
Owing to its geographical isolation, quinoa inNorth America has escaped many of the diseasepressures common to quinoa in its native range.However, at least one major pathogen of quinoa,Peronospora variabilis, which causes downymildew, has been reported in quinoa grown inCanada (Tewari and Boyetchko 1990). Downymildew has also been observed in field trialsin Washington state (unpublished data, 2012)and in Pennsylvania (Testen et al. 2012). Testenet al. (2014) identified widespread infection ofNorth American quinoa. Molecular screeningconfirmed P. variabilis infection in samples ofcommercially produced quinoa from Canada,Oregon, and Colorado. The strains of P. variabilisinfecting North American quinoa were also foundto be genetically distinct from P. variabilis strainsisolated from South America quinoa.
The downy mildew pathogen infecting quinoahas been shown to be closely related to strainsthat infect Chenopodium album, a common weedin North America (Choi et al. 2010). The authorssuggest the possibility that C. album may be apotential inoculum reservoir for downy mildewin quinoa. Using PCR-based methods, Testenet al. (2014) detected P. variabilis from a weedyC. album and an unidentified Chenopodium sp.collected in Ecuador. More investigation isneeded on the potential of C. album and otherclosely related Chenopodium spp. to host strains ofP. variabilis to which C. quinoa is susceptible. AsChoi et al. (2010) demonstrated, downy mildewexhibits a high level of host specificity. No threatis posed from strains of downy mildew that infectrelated crops such as spinach and beets, as thesestrains belong to Peronospora farinosa, a separatespecies from P. variabilis.
Variation for resistance to downy mildew existswithin the quinoa germplasm. Chilean lowlandvarieties have been reported to carry more
resistance to the pathogen than other ecotypes(Fuentes et al. 2008). However, reports fromDenmark of P. variabilis infecting Dutch andDanish varieties indicate that problematic levelsof susceptibility to P. variabilis do exist amongvarieties with a Chilean lowland background(Danielsen et al. 2002).
The close relative C. berlandieri has been notedto have high resistance to downy mildew (Jellenet al. 2011). The domesticate C. berlandieri subsp.nuttalliae has been crossed with quinoa with thegoal of introgressing downy mildew resistance(Bonifacio 2004). In a study screening downymildew resistance among quinoa varieties andChenopodium spp. under field conditions in India,accessions of C. berlandieri subsp. nuttalliae andthe North American species C. bushianum werereported to be immune to downy mildew (Kumaret al. 2006). The authors also observed diverseresponses, ranging from lack of disease to highsusceptibility, from a wide range of quinoa vari-eties, leading the authors to postulate the existenceof multiple pathotypes. Reports from breedingefforts in the CPRO-DLO program indicatedthat downy mildew resistance was dominantlyinherited (Mastebroek and van Loo 2000).
The reported diversity for downy mildew resis-tance should allow for the breeding of resistantvarieties. As C. berlandieri subsp. nuttalliae andC. bushianum have both been successfully crossedwith quinoa, these species represent anothersource for downy mildew resistance (Wilson1980).
Danielsen and Munk (2004) developed astandardized method, which they called the“three-leaf technique,” to determine the severityof downy mildew infection in terms of yieldreduction. They also noted the preference ofdowny mildew fungi for cool, moist conditions.The Salares-type variety “Utusaya” was found tobe highly susceptible to downy mildew. However,in its usual range of cultivation, “Utusaya” escapesinfection because of dry climate (Danielsen andMunk 2004). Escape from downy mildew infec-tion should be possible in western regions of theUnited States characterized by dry summers.This is supported by reports of reduced infection
184 Quinoa: Improvement and Sustainable Production
in Europe under dry summer conditions as com-pared to more humid summers (Jacobsen 1999).In semi-arid conditions of eastern Washingtonstate, downy mildew has been seen on youngplants after the early spring rains, but infectionstopped with seasonal summer drought andappears to be a minor issue. Areas characterizedby wetter conditions and high humidity through-out the growing season may find downy mildew tobe a more significant problem. As downy mildewin quinoa has been shown to be transmissibleby seed due to oospores that form in the seedpericarp, care must be taken when introducingquinoa in new areas to prevent introducing thepathogen as well (Danielsen et al. 2004).
Additional Peronospora spp. may threatenquinoa. Testen et al. (2014) report infectionof Ecuadorian quinoa from an undescribedPeronospora sp., which produce unique symptomsin plants characteristic of a systemic infection.
Other fungal pathogens have also been reportedto infect quinoa in North America. Sclerotiumrolfsii causes damping-off of quinoa seedlings,as well as seed rot in a fall quinoa variety trialin Southern California (Beckman 1980). Morerecently, two new pathogens, Passalora dubia andan Ascochyta sp., have been found on quinoa inPennsylvania (Testen et al. 2013a, 2013b). Thepotential impact of these pathogens for quinoacultivation is currently unknown, and no reportsexist of these pathogens outside of researchcontexts.
Insect pests
Many insect pests have been reported forquinoa in its native range in South America,the most damaging of these being the quinoamoth (Eurysacca melanocampta and Eurysaccaquinoae) (Rasmussen et al. 2003). The potentialfor transmission of pests from South Americato North America is currently unknown. Thisdeserves further investigation, particularly assome farmers trying to grow quinoa in NorthAmerica plant quinoa seed that have been soldas food. This presents a possible route for theintroduction of seed-borne pests of quinoa, and
also the potential spread of these pests to closelyrelated Chenopodium spp.
Existing reports of insect pest pressuresin quinoa from Colorado and South Americaindicate little overlap in species (Cranshaw et al.1990; Rasmussen et al. 2003). Although two insectspecies (Macrosiphum euphorbiae and Helicoverpazea) reported in Peru and Bolivia were also foundin fields in Colorado, these species originate fromNorth America. Subsequent pest identificationsfrom Washington and Maine (I. Milosavljevic,personal communication, 2013; Conant 2002)have not revealed pests in common with thosereported by Rasmussen et al. (2003). Thus,existing evidence suggests that transmission ofinsect pests from South America to temperatelocations in North America has not occurred.
As quinoa continues to be grown in NorthAmerica, it is likely that native pest species willextend their host range to include quinoa. Thishas occurred in Europe, where two pests thatnormally feed on C. album, Scrobipalpa atriplicellaand Cassida nebulosa, have begun to attack quinoa(Sigsgaard et al. 2008).
Oelke et al. (1992) reports that insect pressurewas not determined to be a significant factor forquinoa grown in Colorado. However, a study ofpest pressures in Colorado found a wide range ofinsect pests on quinoa several years after its intro-duction. Many of the reported pests were alsopests of C. album and Beta vulgaris. The majorinsect pests attacking seedlings were Melan-otrichus coagulatus (Uhler) and the false cinchbug, Nysius raphanus Howard. Beet armyworm,Spodoptera exigua (Hübner), caused large-scaledefoliation at one location near Crestone, Col-orado. Another damaging foliar feeder is theboat gall aphid Hayhurstia atriplicis (L.). Lygusspp. were noted as injurious seed feeding pests,whereas the sugarbeet root aphid (Pemphigus pop-ulivenae Fitch) caused yield declines (Cranshawet al. 1990). Oelke et al. (1992) recorded sugarbeetroot aphid as a significant quinoa pest whosepoints of entry are cracks in the soil. In addition,flea beetles and aphids were reported on quinoagrown in Minnesota (Robinson 1986). During aquinoa trial in Maine, a plutellid moth (species
Quinoa Cultivation for Temperate North America: Considerations and Areas for Investigation 185
unidentified) was found to attack plants (Conant2002).
Darwinkel and Stølen (1997) noted someoverlap in the pests of beets and quinoa inEurope. Beet flea beetles (Chaetocnema concinnaand Chaetocnema tibialis) and beet carrion beetles(Aclypea opaca) were found to feed on quinoagrown in sandy soil, though no data is given onthe relative seriousness of these pests. Black beanbeetle (Aphis fabae) was also reported as a pestlikely causing decreases in yield.
In Washington state, aphids and Lygus sp. havebeen the major pests at test plots throughout thestate since trials were initiated in 2010. Harvestingaphid-infested plants results in quinoa seed mixedwith honeydew particles, which are considerablydifficult to remove from harvested quinoa seed.Lygus sp. has been observed to take shelter in morecompact inflorescences (unpublished data, 2010).In 2013, buckthorn aphid (Aphis nasturtii), yellowstriped armyworm (Spodoptera ornithogalli), andCrambus sp. were identified as pests in the field (I.Milosavljevic, personal communication 2013).
Various control methods for quinoa pestsin South America have been recommended,although much research remains to be done todevelop appropriate IPM strategies. Current pestcontrol strategies that are most transferable toNorth American conditions are crop rotation,intercropping, and the use of biocontrol agents.Varietal resistance for pests such as quinoa mothhas been observed (Rasmussen et al. 2003).
As pest pressures change and develop withexpanding quinoa production in North America,strategies for pest control will likewise change.Given the current pest pressures reported, somerecommendations can be made. In Colorado,Cranshaw et al. (1990) noted the syrphid larvae(Diaeretiella rapae) and the convergent ladybird beetle (Hippodamia convergens) as predatorsof the Chenopod aphid, Hayhurstia atriplicis.Variations in aphid pressures between sites werealso observed. The aforementioned species andother aphid parasitoids should be investigatedas potential biocontrol agents. Furthermore,the factors that determine the severity of aphidinfestation require further study.
As quinoa and other Chenopodium species sharecommon pests, studying the potential of weedyChenopodium sp. as alternate hosts is warranted.Close rotations of quinoa with related crops suchas beets should be carefully monitored to ensurethat pests common to both crops do not spread.
Weed control
The slow growth of quinoa after germinationmakes weed management particularly challeng-ing. Related Chenopodium spp. often pose a majorweed pressure, due to their similarities to quinoain early growth habit and appearance. Commonlambsquarter was also noted as a major weedpressure in southern Colorado, along with pig-weed, kochia, and sunflower (Oelke et al. 1992). InColorado, weed management recommendationsfor growers included early sowing, plantingin areas of low weed pressure, and cultivation(Johnson and Croissant 1985). Tilling the soil forplanting after irrigating was found to be effective,particularly with controlling Chenopodium spp.(Oelke et al. 1992). Late planting of quinoa inEngland led to complete losses due to heavy weedpressure (Risi and Galwey 1991a), confirming theimportance of early establishment of quinoa.
Grasses were found to cause major yieldreductions in quinoa. Johnson and Ward (1993)saw reductions in yield from 1,822 kg/ha(1,626 lbs/ac) to 640 kg/ha (571 lbs/ac) due tocompetition from grassy weeds.
Jacobsen et al. (2010) compared the efficacyof inter-row hoeing and harrowing for weedcontrol under Danish conditions. They foundthat inter-row hoeing, when combined with a rowspacing of 50 cm, was most effective at reducingweed pressure. Harrowing had a significant butless pronounced impact. Although both methodshad a significant decrease on quinoa stands dur-ing one of the 2 years the study was conducted,yield significantly increased with both methods.Chenopodium album was the predominant weedspecies, indicating that these methods wereeffective in controlling weedy Chenopodium spp.
A study by Risi and Galwey (1991b) in which10 quinoa varieties were grown in Englandshowed distinct differences in the negative impact
186 Quinoa: Improvement and Sustainable Production
of weed pressure on plant height. Their observa-tions indicated that some quinoa varieties mighthave greater ability to compete with weeds.
Cross-pollination of C. quinoa with weedyC. berlandieri has been confirmed at a farm innorthern Washington state (Wilson and Manhart1993). Oelke et al. (1992) reported putativehybrids between quinoa and common lamb-squarter in Colorado (species unspecified). Suchpollination could have consequences in terms ofmaintaining purity of quinoa varieties. Controlof C. berlandieri will prove critical in preventingunwanted cross-pollination.
Saponins
Many varieties of quinoa contain saponins in theseed pericarp. Saponins give quinoa a bitter tasteand make it unpalatable. In addition, saponinshave potential negative health effects and havebeen shown to be disruptive to intestinal mem-branes in rats (Gee et al. 1993). For quinoa tobe marketable, saponins must be removed afterharvest. This is generally done through abrasionor by washing the saponin from the seed (Johnsonand Ward 1993). Alternatively, brushing has beenused as a saponin removal method (Darwinkel andStølen 1997). Removal of the saponin throughabrasion can result in loss of minerals such ascalcium (Konishi et al. 2004).
While industrial uses for quinoa saponin havebeen proposed (Jacobsen 2003), the presence ofsaponins currently poses postharvest difficultiesrather than an economic opportunity. The infras-tructure required for removal of saponins remainsa challenge for small-scale quinoa growers.Commercial production of quinoa in Coloradoonly began once machinery to remove saponinwas obtained (Johnson 1990).
Saponin-free varieties of quinoa do exist,though they are not found in the original Chileanlowland germplasm. The CPRO-DLO quinoabreeding program successfully introgressedthe saponin-free trait into improved varieties(Mastebroek and Marvin 1999). The presence ofsaponin is both qualitatively and quantitativelycontrolled. Its presence is governed by a singlegene with two alleles. Saponin production is
dominant, with homozygous recessive plantsproducing seeds lacking saponin (Ward 2001).When the dominant phenotype is expressed,saponin content is then governed quantitatively.Efforts to breed low saponin varieties quanti-tatively have not been successful, due to lackof sufficient response to selection (Ward 2000).Future efforts to develop saponin-free varietieswill likely rely on generating plants that arehomozygous recessive for the qualitative trait.However, this comes with the potential drawbackof saponin production being restored throughcross-pollination from other varieties that containsaponin. Proper separation of varieties lackingsaponin from those with saponin will be necessaryto prevent cross-pollination.
While the removal of saponin remains anobstacle for quinoa production, saponin-freevarieties have drawbacks. Reports from SouthAmerica and Europe indicate that saponin-freevarieties can suffer yield losses, some quite severe,due to feeding by birds (Risi and Galwey 1991b;Rasmussen et al. 2003; Darwinkel and Stølen1997). However, saponin-containing varietiesmay also suffer yield losses due to birds, as rainhas been reported to wash away saponins (Oelkeet al. 1992). This was observed at a trial site inChimacum, Washington, where feeding damagewas observed following rains in late summer(unpublished data, 2013)
Drought and salinity can have significanteffects on saponin content. Irrigation with salinewater resulted in a 30% increase in saponincontent compared to freshwater irrigation. At thelowest irrigation level, saponin content decreased42% in comparison to the full irrigation control(Gómez-Caravaca et al. 2012).
ALTERNATIVE USES OF QUINOA
Forage
In addition to the worldwide interest in quinoafor its seed, quinoa has also attracted attention asa forage crop. Carlsson et al. (1984) investigatedquinoa in southern Sweden and concluded thatit was a promising crop for the production of
Quinoa Cultivation for Temperate North America: Considerations and Areas for Investigation 187
green liquid protein concentrate. Dry matterproduction was found to increase with high levelsof fertilization, up to 470 kg N/ha (420 lbs N/ac).
Quinoa biomass had high crude protein andlow fiber when harvested near the floweringperiod and was competitive with alfalfa andgrass when compared on a cost basis. Quinoasilage was found to be an acceptable methodof storing quinoa fodder long term. Increasednitrogen applications were recommended forforage quinoa, with 100 kg N/ha (90 lbs N/ac)applied at sowing followed by an additional200 kg N/ha (180 lbs N/ha) applied 5 weeks later(Darwinkel and Stølen 1997). In contrast, tests inthe Netherlands showed that quinoa performedpoorly as a forage crop in comparison with grassand clover (van Schooten and Pinxterhuis 2003).
Feed
The balance of amino acids in quinoa seed hasgenerated interest in its utility as an animalfeed. However, the value of quinoa for humanconsumption currently exceeds its value as animalfeed. This would likely restrict any role of quinoaas a feed to low-quality quinoa and to organicfarmers looking for a high-quality, protein-richalternative to maize–soy mixes.
Carlson et al. (2012) tested quinoa hull meal,which contains the saponin-rich pericarp, as afeed additive for pigs. South American quinoahull meal was supplied at 100, 300, and 500 mg/kgand Danish-grown quinoa at 300 mg/kg; feedintake and utilization, as well as growth rate, wereall unaffected compared to those of pigs fed acontrol diet lacking quinoa hull meal, despite theeffects of South American quinoa hull meal onintestinal epithelial physiology detected ex vivo.
Several studies have been conducted on the useof quinoa as poultry feed but with mixed results.Improta and Kellems (2001) tested diets basedon raw, polished, and washed quinoa for broilerfeed. The survival and growth rates of chicks feda diet of raw quinoa were severely reduced, andthis effect was attributed to antinutritional factors(Improta and Kellems 2001). With the polishedquinoa diet, this effect was much reduced,whereas the effect of the washed quinoa diet
was comparable to that of the maize/soybeanmeal control diet. Improved performance wasalso seen in chicks fed diets with higher crudeprotein percentage, although this may also be dueto the lower percentage of quinoa provided withincreased supplementation of soybean meal.
Jacobsen et al. (1997) found that increasinglevels of both unprocessed and dehulled quinoa ina mixed broiler diet caused depression in broilergrowth. In contrast to the previous study, thechicks had poor growth when dehulled quinoawas included in the diet. The authors suggestedthat aside from the bitter saponins present inthe hulls, other antinutritional factors werealso responsible for this effect on the chicks.They recommended that quinoa comprise nomore than 150 g/kg (15% by weight) of broilerdiets. In a study investigating the combinationof two-layer diets with a supplemental foragerotation, a 34-day-long quinoa forage periodconsisting of two quinoa varieties, one of whichwas saponin-free, was included with no neg-ative effects on layers reported (Horsted andHermansen 2007).
CONCLUSION
Expanded production of quinoa in temperateareas of North America poses many challengesand opportunities. Despite the main obstacleof heat susceptibility, breeding efforts utilizingwithin-species diversity may result in varietieswith improved heat tolerance. Should that proveinsufficient, the North American Chenopodiumspp. within quinoa’s secondary gene pool mayprove to be a promising source for introgressionof heat tolerance genes. Existing genetic diversityhas been identified that should enable farmers andscientists to overcome challenges posed by downymildew, saponins, and preharvest sprouting.Many aspects of quinoa cultivation in NorthAmerica remain unknown, particularly diseaseand pest pressures, because of quinoa’s relativenovelty to North America and its geographicalisolation from pest pressures found in its nativerange of cultivation. The high level of abioticstress tolerance in quinoa may give it a distinct
188 Quinoa: Improvement and Sustainable Production
advantage in areas with marginal agriculturallands, specifically those affected by soil salinity.Interest and demand for domestically producedquinoa remains high, and with further researchand plant breeding efforts, there is considerablepotential for expanded quinoa production inNorth America.
ACKNOWLEDGMENTS
Special thanks go to Ivan Milosavljevic forinsect identification and to Hannah Walters forproviding preliminary findings. We would alsolike to acknowledge the dedication of the diversegroup of individuals who have helped lay thefoundational work for quinoa as a crop in NorthAmerica. Last but not least, we would like toexpress our sincere gratitude and respect for themany indigenous peoples of South America who,living in close relationship to quinoa, have grownand shaped this dynamic crop over millennia.
REFERENCES
Adolf VI, Shabala S, Andersen MN, Razzaghi F, Jacobsen SE.Varietal differences of quinoa’s tolerance to saline conditions.Plant Soil 2012;357(1–2):1–13.
Aguilar TN. 1968. Growth responses of Chenopodium quinoaWilld. to changes in temperature and oxygen tension.Master’s Thesis, University of Illinois, Chicago, Illinois,pp. 1–51.
Aguilar PC, Jacobsen SE. Cultivation of quinoa on the PeruvianAltiplano. Food Rev Int 2003;19(1–2):31–41.
[AAFRD] Alberta Agriculture, Food and Rural Development.Quinoa: the next cinderella crop for Alberta? Edmonton, AB:Alberta Agriculture, Food and Rural Development; 2005.
[ARD] Alberta - Agriculture and Rural Development. [Internet].2004. Salinity classification, mapping and management inAlberta. Edmonton, AB: Alberta Agriculture and RuralDevelopment (cited 2013 Jan 15). Available from http://www1.agric.gov.ab.ca/$department/deptdocs.nsf/all/sag3267#prairies
Arco de Nuñez S. 2014. Note: I don’t know the details of the cur-rent book to fill in the rest of the citation. Could you pleasecomplete this citation for me? Thanks!
Aufhammer W, Kaul H, Kruse M, Lee J, Schwesig D. Effectsof sowing depth and soil conditions on seedling emergence ofamaranth and quinoa. Eur J Agron 1994;3(3):205–210.
Ballón E. Low-input agriculture in the Southwestern UnitedStates. Fort Collins, CO: Rocky Mountain Forest and
Range Experiment Station. General Technical ReportRM-GTR-198. pp.; 1990. p 116–119.
Beckman PM. Seed rot and damping-off of Chenopodium quinoacaused by Sclerotium rolfsii. Plant Dis 1980;64(5):497.
Benlhabib O, Atifi M, Jellen EN, Jacobsen S. The introductionof a new Peruvian crop “quinoa” to a rural communityin Morocco. In: Jacobsen SE, Jensen CR, Porter JR,editors. VIII ESA congress: European agriculture in aglobal context; 2004 July 11–15. Copenhagen, Denmark:Samfundslitteratur; 2004. p 881–884.
Bertero HD. Response of developmental processes to temperatureand photoperiod in quinoa (Chenopodium quinoa Willd.). FoodRev Int 2003;19(1–2):87–97.
Bertero HD, King RW, Hall AJ. Photoperiod-sensitive develop-ment phases in quinoa (Chenopodium quinoa Willd.). FieldCrop Res 1999;60(3):231–243.
Bhardwaj HL, Hankins A, Mebrahtu T, Mullins J, Rangappa M,Abaye O, Welbaum GE. Alternative crops research in Vir-ginia. In: Janick J, editor. Progress in new crops. Alexandria,VA: ASHS Press; 1996. p 87–96.
Bilalis D, Kakabouki I, Karkanis A, Travlos I, TriantafyllidisV, Hela D. Seed and saponin production of organic quinoa(Chenopodium quinoa Willd.) for different tillage andfertilization. Not Bot Horti Agrobo 2012;40(1):42–46.
Bonifacio A. 1995. Interspecific and intergeneric hybridization inChenopod species. Master’s Thesis, Brigham Young Univer-sity, Provo, Utah.
Bonifacio A. 2004. Genetic variation in cultivated andwild Chenopodium species for quinoa breeding. Ph.D.Dissertation, Brigham Young University, Provo, Utah.
Carlson D, Fernandez JA, Poulsen HD, Nielsen B, JacobsenSE. Effects of quinoa hull meal on piglet performanceand intestinal epithelial physiology. J Anim Physiol An N2012;96(2):198–205.
Carlsson R, Hanczakowski P, Kaptur T. The quality of the greenfraction of leaf protein concentrate from Chenopodium quinoaWilld. grown at different levels of fertilizer nitrogen. AnimFeed Sci Tech 1984;11(4):239–245.
Carmen ML. Acclimatization of quinoa (Chenopodium quinoaWilld.) and canihua (Chenopodium pallidicaule Allen) toFinland. Ann Agr Fenn 1984;23:135–144.
Ceccato DV, Bertero DH, Batlla D. Environmental control ofdormancy in quinoa (Chenopodium quinoa) seeds: two poten-tial genetic resources for pre-harvest sprouting tolerance.Seed Sci Res 2011;21(2):133.
Choi YJ, Danielsen S, Lübeck M, Hong SB, Delhey R, ShinHD. Morphological and molecular characterization of thecausal agent of downy mildew on quinoa (Chenopodiumquinoa). Mycopathologia 2010;169(5):403–412.
Christiansen JL, Jacobsen SE, Jørgensen ST. Photoperiodic effecton flowering and seed development in quinoa (Chenopodiumquinoa Willd.). Acta Agr Scand B-S P 2010;60(6):539–544.
Christiansen JL, Ruiz-Tapia EN, Jornsgard B, Jacobsen SE.1999. Fast seed germination of quinoa (Chenopodium quinoa)at low temperature. In: Mela T, Christiansen J, Kontturi M,
Quinoa Cultivation for Temperate North America: Considerations and Areas for Investigation 189
Pahkala K, Partala A, Sahramaa M, Sankari H, Topi-HulmiM, Pithan K. Proceedings of COST 814-workshop: alter-native crops for sustainable agriculture; 1999 June 13–15;Turku, Finland. Luxembourg: Office of Official Publicationsof the European Communities. 220–225.
Climatología [Internet]. date unknown. Santiago, Chile: Direc-ción Meteorológica de Chile (cited 2013 Mar 23). Availablefrom http://164.77.222.61/climatologia/php/menuAnuarios.php
Conant N. Quinoa introduction in the River Valley,farmer/grower grant final report. College Park, MD:SARE; 2002. ; Project FNE02-406.
Cranshaw WS, Kondratieff BC, Qian T. Insects associated withquinoa, Chenopodium quinoa, in Colorado. J Kans EntomolSoc 1990;63(1):195–199.
Danielsen S, Jacobsen SE, Hockenhull J. First report of downymildew of quinoa caused by Peronospora farinosa f. sp.chenopodii in Denmark. Plant Dis 2002;86:1175.
Danielsen S, Mercado VH, Ames T, Munk L. Seed transmis-sion of downy mildew (Peronospora farinosa f.sp. chenopodii) inquinoa and effect of relative humidity on seedling infection.Seed Sci Technol 2004;32(1):91–98.
Danielsen S, Munk L. Evaluation of disease assessment methodsin quinoa for their ability to predict yield loss caused by downymildew. Crop Prot 2004;23(3):219–228.
Darwinkel A, Stølen O. Understanding the quinoa crop: guide-lines for growing in temperate regions of N.W. Europe. Brus-sels: European Commission; 1997.
Delatorre-Herrera J. Current use of quinoa in Chile. Food RevInt 2003;19(1–2):155–165.
Delatorre-Herrera J, Pinto M. Importance of ionic and osmoticcomponents of salt stress on the germination of four quinua(Chenopodium quinoa Willd.) selections. Chil J Agric Res2009;69(4):477–485.
Dyck E. 2012. Quinoa trial for Northeast upland farms [Internet].Report No.: FNE12-760. SARE, College Park, MD. Availablefrom: http://mysare.sare.org/mySARE/ProjectReport.aspx?do=viewRept&pn=FNE12-760&y=2012&t=0
Flynn RP. 1990. Growth characteristics of quinoa (Chenopodiumquinoa Willd.) and yield response to increasing soil waterdeficit. Master’s Thesis, Colorado State University, FortCollins, Colorado, pp. 69p.
Fuentes F, Bhargava A. Morphological analysis of quinoagermplasm grown under lowland desert conditions. J AgronCrop Sci 2011;197(2):124–134.
Fuentes FF, Martinez EA, Hinrichsen PV, Jellen EN, MaughanPJ. Assessment of genetic diversity patterns in Chileanquinoa (Chenopodium quinoa Willd.) germplasm usingmultiplex fluorescent microsatellite markers. Conserv Genet2008;10(2):369–377.
Galwey NW. Exploited plants - quinoa. Biologist 1989;36(5):267–274.
Gandarillas H. 1982. Quinoa production. IBTA-CIID (TransSierra-Blanca Assoc, Denver, CO. 1985).
Gee JM, Price KR, Ridout CL, Wortley GM, Hurrell RF,Johnson IT. Saponins of quinoa (Chenopodium quinoa):effects of processing on their abundance in quinoa productsand their biological effects on intestinal mucosal tissue. J SciFood Agric 1993;63(2):201–209.
Geerts S, Raes D, Garcia M, Vacher J, Mamani R, Men-doza J, Huanca R, Morales B, Miranda R, CusicanquiJ, Taboada C. Introducing deficit irrigation to stabilizeyields of quinoa (Chenopodium quinoa Willd.). Eur J Agron2008;28(3):427–436.
Gesinksi K. Potential for Chenopodium quinoa acclima-tisation in Poland. In: Parente G, Frame J, editors.Abstracts/Proceedings of COST 814 conference, cropdevelopment for cool and wet regions of Europe; 2000 May10–13; Pordenone, Italy. Luxembourg: Office of OfficialPublications of the European Communities; 2000. p 547–552.
Gómez-Caravaca AM, Iafelice G, Lavini A, Pulvento C, CaboniMF, Marconi E. Phenolic compounds and saponins in quinoasamples (Chenopodium quinoa Willd.) grown under differentsaline and nonsaline irrigation regimens. J Agric Food Chem2012;60(18):4620–4627.
Gómez-Pando LR, Álvarez-Castro R, Eguiluz-de la BarraA. SHORT COMMUNICATION: effect of salt stresson Peruvian germplasm of Chenopodium quinoa Willd.: apromising crop. J Agron Crop Sci 2010;196(5):391–396.
González JA, Gallardo M, Hilal M, Rosa M, Prado FE. Physi-ological responses of quinoa (Chenopodium quinoa Willd.) todrought and waterlogging stresses: dry matter partitioning.Bot Stud 2009;50(1):35–42.
Hariadi Y, Marandon K, Tian Y, Jacobsen SE, Shabala S.Ionic and osmotic relations in quinoa (Chenopodium quinoaWilld.) plants grown at various salinity levels. J Exp Bot2011;62(1):185–193.
Horsted K, Hermansen JE. Whole wheat versus mixed layer dietas supplementary feed to layers foraging a sequence of differ-ent forage crops. Animal 2007;1:575–585.
Iliadis C, Karyotis T, Jacobsen SE. Adaptation of quinoa underxerothermic conditions and cultivation for biomass and fibreproduction. In: Jacobsen SE, Portillo Z, editors. InternationalPotato Center (CIP) memorias, primer taller internacionalsobre quinua – recursos geneticos y sistemas de producción;1999 May 10–14. Lima: UNALM; 2001. p 371–378.
Improta F, Kellems RO. Comparison of raw, washed and pol-ished quinoa (Chenopodium quinoa Willd.) to wheat, sorghumor maize based diets on growth and survival of broiler chicks.Livest Res Rural Dev 2001;13:1–10.
Jacobsen SE. Adaptation of quinoa (Chenopodium quinoa) toNorthern European agriculture: studies on developmentalpattern. Euphytica 1997;96(1):41–48.
Jacobsen SE. Developmental stability of quinoa under Europeanconditions. Ind Crops Prod 1998;7:169–174.
Jacobsen SE. Potential for quinoa (Chenopodium quinoa Willd.)for cool and wet regions of Europe. In: Mela T, ChristiansenJ, Kontturi M, Pahkala K, Partala A, Sahramaa M, SankariH, Topi-Hulmi M, Pithan K, editors. Proceedings of COST
190 Quinoa: Improvement and Sustainable Production
814-workshop: alternative crops for sustainable agriculture;1999 June 13–15; Turku, Finland. Luxembourg: Office ofOfficial Publications of the European Communities; 1999.p 87–99.
Jacobsen SE. The worldwide potential for quinoa (Chenopodiumquinoa Willd.). Food Rev Int 2003;19(1–2):167–177.
Jacobsen SE. Quinoa’s world potential. In: Ochatt S, JainSM, editors. Breeding of neglected and under-utilizedcrops, spices and herbs. Enfield, New Hampshire: SciencePublishers; 2007. p 109–122.
Jacobsen SE. The situation for quinoa and its production in south-ern Bolivia: from economic success to environmental disaster.J Agron Crop Sci 2011;197(5):390–399.
Jacobsen SE, Bach AP. The influence of temperature on seedgermination rate in quinoa (Chenopodium quinoa Willd.).Seed Sci Technol 1998;26(2):515–524.
Jacobsen SE, Christiansen JL, Rasmussen J. Weed harrowingand inter-row hoeing in organic grown quinoa (Chenopodiumquinoa Willd.). Outlook Agr 2010;39(3):223–227.
Jacobsen SE, Jørgensen I, Stølen O. Cultivation of quinoa(Chenopodium quinoa) under temperate climatic conditions inDenmark. J Agri Sci 1994;122(1):47.
Jacobsen SE, Jørnsgård B, Christiansen JL, Stølen O. Effect ofharvest time, drying technique, temperature and light onthe germination of quinoa (Chenopodium quinoa). Seed SciTechnol 1999a;27:937–944.
Jacobsen SE, Monteros C, Christiansen JL, Bravo LA, CorcueraLJ, Mujica A. Plant responses of quinoa (Chenopodium quinoaWilld.) to frost at various phenological stages. Eur J Agron2005;22(2):131–139.
Jacobsen SE, Monteros C, Corcuera LJ, Bravo LA, Chris-tiansen JL, Mujica A. Frost resistance mechanismsin quinoa (Chenopodium quinoa Willd.). Eur J Agron2007;26(4):471–475.
Jacobsen SE, Mujica A, Jensen CR. The resistance of quinoa(Chenopodium quinoa Willd.) to adverse abiotic factors. FoodRev Int 2003;19(1–2):99–109.
Jacobsen EE, Skadhauge B, Jacobsen SE. Effect of dietary inclu-sion of quinoa on broiler growth performance. Anim Feed SciTech 1997;65:5–14.
Jacobsen SE, Stølen O. Quinoa – morphology, phenology andprospects for its production as a new crop in Europe. Eur JAgron 1993;2:19–29.
Jacobsen SE, Quispe H, Mujica A. 1999b. Quinoa: an alternativecrop for saline soils in the Andes. In: Scientists and farmer–partners in research for the 21st century. CIP Program Report1999–2000, pp. 403–408.
Jellen EN, Kolano BA, Sederberg MC, Bonifacio A, MaughanPJ. Wild crop relatives: genomic and breeding resources. In:Kole C, editor. Chenopodium. Berlin: Springer; 2011. p35–61.
Jensen CR, Jacobsen SE, Andersen MN, Núñez N, Andersen SD,Rasmussen L, Mogensen VO. Leaf gas exchange and waterrelation characteristics of field quinoa Chenopodium quinoaWilld.) during soil drying. Eur J Agron 2000;13(1):11–25.
Johnson DL. New grains and pseudograins. In: Janick J, SimonJE, editors. Advances in new crops. Portland, Oregon: TimberPress; 1990. p 122–127.
Johnson DL, Croissant RL. Quinoa production in Colorado. FortCollins, Colorado: Colorado State University CooperativeExtension; Service-In-Action Sheet: No.112; 1985.
Johnson DL, Croissant RL. Alternate crop production and mar-keting in Colorado. Fort Collins, Colorado: Colorado StateUniversity Cooperative Extension; 1990. ; Technical BulletinLTB90-3.
Johnson DL, Ward S. Quinoa. In: Janick J, Simon JE, editors.New crops. New York, NY: Wiley; 1993. p 219–221.
Karyotis TH, Iliadis C, Noulas CH, Mitsibonas TH. Prelimi-nary research on seed production and nutrient content forcertain quinoa varieties in a saline–sodic soil. J Agron CropSci 2003;189(6):402–408.
Konishi Y, Hirano S, Tsuboi H, Wada M. Distribution ofminerals in quinoa (Chenopodium quinoa Willd.) seeds. BiosciBiotechnol Biochem 2004;68(1):231–234.
Koyro HW, Eisa SS. Effect of salinity on composition, viabilityand germination of seeds of Chenopodium quinoa Willd. PlantSoil 2007;302:79–90.
Kumar A, Bhargava A, Shukla S, Singh HB, Ohri D. Screen-ing of exotic Chenopodium quinoa accessions for downy mildewresistance under mid-eastern conditions of India. Crop Prot2006;25(8):879–889.
Maas EV. Salt tolerance of plants. Appl Agric Res1986;1(1):12–26.
Martínez EA, Veas E, Jorquera C, San Martín R, Jara P.Re-introduction of quínoa into arid Chile: cultivation of twolowland races under extremely low irrigation. J Agron CropSci 2009;195(1):1–10.
Mastebroek HD, Limburg H. Breeding harvest security inChenopodium quinoa. In: Stølen O, Bruhn K, Pithan K,Hill J, editors. Proceedings of the COST 814 workshop onsmall grain cereals and pseudo-cereals; 1996 Feb 22–24;Copenhagen, Denmark. Luxembourg: Office of OfficialPublications of the European Communities; 1997. p 79–86.
Mastebroek HD, Marvin H. 1999. Progress in breeding of sweetquinoa. Mela T, Christiansen J, Kontturi M, Pahkala K,Partala A, Sahramaa M, Sankari H, Topi-Hulmi M, PithanK. Proceedings of COST 814-workshop: alternative crops forsustainable agriculture; 1999 June 13–15; Turku, Finland.Luxembourg: Office of Official Publications of the EuropeanCommunities. 100–107.
Mastebroek HD, van Loo R. 2000. Breeding of quinoa – state ofthe art. Parente G, Frame J. Abstracts/Proceedings of COST814 conference, crop development for cool and wet regionsof Europe; 2000 May 10–13; Pordenone, Italy. Luxembourg:Office of Official Publications of the European Communities.491–496.
Mujica A. Tecnología del cultivo de la quinua. Fondo SimónBolivar. Ministerio de Alimentación. Zona Agraria XII.Puno: IICA, UNTA; 1977.
Quinoa Cultivation for Temperate North America: Considerations and Areas for Investigation 191
National Research Council. Lost crops of the Incas: little-knownplants of the Andes with promise for worldwide cultivation.Washington, DC: National Academy Press; 1989. p 1–415.
NCDC. 2011. Annual mean extreme maximum temperature[Internet]. Asheville, NC: NCDC (cited 2013 March 23).Available from http://hurricane.ncdc.noaa.gov/climaps/tmp13a13.pdf
Oelke EA, Putnam DH, Teynor TM, Oplinger ES. 1992. Quinoa.Alternative field crops manual. University of WisconsinCooperative Extension Service, University of MinnesotaExtension Service, Center for Alternative Plant & AnimalProducts.
Ohlsson I. During late development stages the quinoa cropis not always successful. In: Parente G, Frame J, editors.Abstracts/Proceedings of COST 814 conference, cropdevelopment for cool and wet regions of Europe; 2000 May10–13; Pordenone, Italy. Luxembourg: Office of OfficialPublications of the European Communities; 2000. p 497–499.
Ohlsson I, Dahlstedt L. Quinoa - potential in Sweden. In: Mela T,Christiansen J, Kontturi M, Pahkala K, Partala A, SahramaaM, Sankari H, Topi-Hulmi M, Pithan K, editors. Proceed-ings of COST 814-workshop: alternative crops for sustainableagriculture; 1999 June 13–15; Turku, Finland. Luxembourg:Office of Official Publications of the European Communities;1999. p 139–145.
Peterson A. 2013. Salinity tolerance and nitrogen use efficiencyof quinoa for expanded production in temperate North Amer-ica. Master’s Thesis, Washington State University, Pullman,Washington, DC, pp. 1–189.
Prego I, Maldonado S, Otegui M. Seed structure and localizationof reserves in Chenopodium quinoa. Ann Bot 1998;82:481–488.
Pulvento C, Riccardi M, Lavini A, d’ Andria R, Iafelice G,Marconi E. Field trial evaluation of two Chenopodium quinoagenotypes grown under rain-fed conditions in a typicalMediterranean environment in South Italy. J Agron CropSci 2010;196(6):407–411.
Pulvento C, Riccardi M, Lavini A, Iafelice G, Marconi E, d’Andria R. Yield and quality characteristics of quinoa grownin open field under different saline and non-saline irrigationregimes. J Agron Crop Sci 2012;198(4):254–263.
Rasmussen C, Lagnaoui A, Esbjerg P. Advances in the knowledgeof quinoa pests. Food Rev Int 2003;19(1–2):61–75.
Razzaghi F, Plauborg F, Jacobsen SE, Jensen CR, Andersen MN.Effect of nitrogen and water availability of three soil typeson yield, radiation use efficiency and evapotranspiration infield-grown quinoa. Agr Water Manage 2012;109:20–29.
Risi JC, Galwey NW. The Chenopodium grains of theAndes – Inca crops for modern agriculture. Adv Appl Biol1984;10:145–216.
Risi JC, Galwey NW. The pattern of genetic diversity inthe Andean grain crop quinoa (Chenopodium quinoaWilld). I. Associations between characteristics. Euphytica1989;41(1):147–162.
Risi JC, Galwey NW. Effects of sowing date and sowingrate on plant development and grain yield of quinoa
(Chenopodium quinoa) in a temperate environment. J Agr Sci1991a;117(03):325.
Risi JC, Galwey NW. Genotype x environment interaction in theAndean grain crop quinoa (Chenopodium quinoa) in temperateenvironments. Plant Breed 1991b;107(2):141–147.
Robinson RG. Amaranth, quinoa, ragi, tef, and niger: tiny seedsof ancient and modern interest. St. Paul, MN: AgriculturalExperiment Station, University of Minnesota; 1986. ; StationBulletin AD-SB-2949.
Romero S, Shahriari S. A food’s global success creates a quandaryat home. The New York Times 2011, March 20, Sect A:6.
Ruiz-Carrasco K, Antognoni F, Coulibaly AK, Lizardi S,Covarrubias A, Martínez EA, Molina-Montenegro MA,Biondi S, Zurita-Silva A. Variation in salinity tolerance of fourlowland genotypes of quinoa (Chenopodium quinoa Willd.) asassessed by growth, physiological traits, and sodium trans-porter gene expression. Plant Physiol Biochem 2011;49(11):1333–1341.
van Schooten HA, Pinxterhuis JB. 2003. Quinoa as an alternativeforage crop in organic dairy farming. Kirilov A, Todorov N,Katerov I. Optimal forage systems for animal production andthe environment: proceedings of the 12th symposium of theEuropean Grassland Federation; 2003 May 26–28; Pleven,Bulgaria pp. 445–448.
Schulte auf’m Erley G, Kaul HP, Kruse M, Aufhammer W. Yieldand nitrogen utilization efficiency of the pseudocereals ama-ranth, quinoa, and buckwheat under differing nitrogen fertil-ization. Eur J Agron 2005;22(1):95–100.
Sigsgaard L, Jacobsen SE, Christiansen JL. Quinoa, Chenopodiumquinoa, provides a new host for native herbivores in NorthernEurope: case studies of the moth, Scrobipalpa atriplicella,and the Tortoise Beetle, Cassida nebulosa. J Insect Sci2008;8(50):1–4.
Small E. New crops for Canadian agriculture. In: Janick J,editor. Perspectives on new crops and new uses. Alexandria,VA: ASHS Press; 1999. p 15–52.
Smith BD. Chenopodium berlandieri ssp. jonesianum: evidence fora Hopewellian domesticate from Ash Cave, Ohio. SE Archae-ology 1985;4(2):107–133.
Swenson EM. 2006. Genetic diversity of Bolivian Peronosporafarinosa f. sp. chenopodii (downy mildew) and quinoa’sresistance response. Master’s Thesis, Brigham YoungUniversity, Provo, Utah.
Tapia ME, Mujica S, Canahua A. Origen distribución geográficay sistemas de producción en quinua. Primera Reunion sobreGenética y Fitomejoramiento de la Quinua. Puno: ProyectoPISCA/UNTA/IBTA/IICA/CIID; 1980. p A1–A8.
Testen AL, del Mar Jiménez-Gasco M, Ochoa JB, BackmanPA. Molecular detection of Peronospora variabilis in quinoaseed and phylogeny of the quinoa downy mildew pathogenin South America and in the United States. Phytopathology2014;104(4):379–386.
Testen AL, McKemy JM, Backman PA. First report of quinoadowny mildew caused by Peronospora variabilis in the UnitedStates. Plant Dis 2012;96(1):146.
192 Quinoa: Improvement and Sustainable Production
Testen AL, McKemy JM, Backman PA. First report of Passaloraleaf spot of quinoa caused by Passalora dubia in the UnitedStates. Plant Dis 2013a;97(1):139.
Testen AL, McKemy JM, Backman PA. First report of Ascochytaleaf spot of quinoa caused by Ascochyta sp. in the UnitedStates. Plant Dis 2013b;97(6):844.
Tewari JP, Boyetchko SM. Occurrence of Peronospora farinosaf. sp. chenopodii on quinoa in Canada. Can Plant Dis Surv1990;70(2):127–128.
Thanapornpoonpong S. 2004. Effect of nitrogen fertilizeron nitrogen assimilation and seed quality of amaranth(Amaranthus spp.) and quinoa (Chenopodium quinoa Willd.).Ph.D. Dissertation, Georg-August University of Göttingen,Göttingen, Germany.
Torres JD. 1955. Comparative study of resistance of alfalfa, bromegrass and quinoa seedlings to synthetic saline soils, saline alkaliand alkali soils. Master’s Thesis. Cornell University, Ithaca,NY.
USDA. The second RCA appraisal: soil, water, and relatedresources on nonfederal land in the United States.Washington, DC: U.S. Government Printing Office; 1989.
USDA. 2011 RCA appraisal. Washington, DC: USDA; 2011.Vera RR. [Internet]. 2006. Chile. Rome: FAO (cited 2013 Mar 11).
Available from: http://www.fao.org/ag/AGP/AGPC/doc/Counprof/Chile/cile.htm
Ward SM. 1994. Developing improved quinoa varieties forColorado. Ph.D. Dissertation, Colorado State University,Fort Collins, CO.
Ward SM. Response to selection for reduced grain saponin con-tent in quinoa (Chenopodium quinoa Willd.). Field Crop Res2000;68(2):157–163.
Ward SM. A recessive allele inhibiting saponin synthesis in twolines of Bolivian quinoa (Chenopodium quinoa Willd.). J Hered2001;92(1):83–86.
Wilson HD. Chenopodium quinoa Willd.: variation and rela-tionships in southern South America. Natl Geogr Res Rep1978;19:711–721.
Wilson HD. Artificial hybridization among species ofChenopodium sect. Chenopodium. Syst Bot 1980;5(3):253–263.
Wilson HD, Manhart J. Crop/weed gene flow: Chenopodiumquinoa Willd. and C. berlandieri Moq. Theor Appl Genet1993;86(5):642–648.
Chapter 11
Nutritional Properties of Quinoa
Geyang WuSchool of Food Science, Washington State University, Pullman, WA, USA
INTRODUCTION
Quinoa is known as a “complete food” andhas been called “mother grain” in the Andes(Abugoch 2009; Vega-Gálvez et al. 2010) due toits high nutritional value (Table 11.1) (Jancurováet al. 2009). The quinoa seed is as small as a milletseed, flat and oval shaped, with color rangingfrom dark red to pale yellow. The protein contentin quinoa is higher than that in other cereals andaccounts for about 16.5% of its dry weight. Lipidsare about 6.3% and higher than the lipid contentin other cereals. Carbohydrates are the majorcomposition in quinoa and comprise around69%. The fiber and ash content of quinoa are3.8%, comparable to those in other cereals.
In this chapter, the chemical composition andnutritional properties of quinoa is reviewed. Thecontent, composition and quality of protein, car-bohydrates, lipids, vitamins, minerals, antinutri-tional factors, and bioactive compounds are alsosummarized.
PROTEIN
Quinoa seed is considered a complete food(Abugoch 2009), primarily because its proteinis high in content and quality, with a balancedamino acid profile. The net protein utilization(NPU) of quinoa is 68, digestibility (TD) is 95,biological value (BV) is 71, and all of these are
Quinoa: Improvement and Sustainable Production, First Edition. Edited by Kevin Murphy and Janet Matanguihan.© 2015 John Wiley & Sons, Inc. Published 2015 by John Wiley & Sons, Inc.
indicators of the high quality of quinoa protein(Ruales et al. 2002).
The protein content of quinoa rangesfrom 8% to 22% among different varieties(Valencia-Chamorro 2003), higher than that ofother cereals such as wheat (9–14%) (Khanand Shewry 2009; Jancurová et al. 2009), barley(8–14%) (Cai et al. 2013), and rice (6–15%)(Juliano 1985) and lower than that of soy beans(28–36%) (Table 11.2). The reason for the highvariability in protein content among quinoa vari-eties is not clear yet, though both the genotypeand the growing environment can affect proteincontent.
About 57% protein exists in the embryo ofquinoa seed, 39% in the perisperm, and only 4%in the bran (including seed coat and pericarp)(Ando et al. 2002) (Table 11.2). Prego et al. (1998)studied the structural form of protein in quinoaseed. Fig. 11.1 shows protein bodies (PBs) (blackparticles) in spongy tissue of a quinoa cotyledon(a) and in endosperm cells (b). The diameterof the PBs in the cotyledon ranges from 0.3 to3 μm and 1 to 3 μm in the endosperm. These PBscontain one or more globoid crystals that storeminerals P, K, and Mg.
The amino acids of quinoa are well balancedand comparable to those of soy protein, casein,and wheat (Table 11.3) (Wang et al. 1999; USDA2011, 2005; Tang et al. 2006; Abugoch et al. 2008).Quinoa seed has high levels of arginine, glycine,lysine, methionine, threonine, and tryphtophan
193
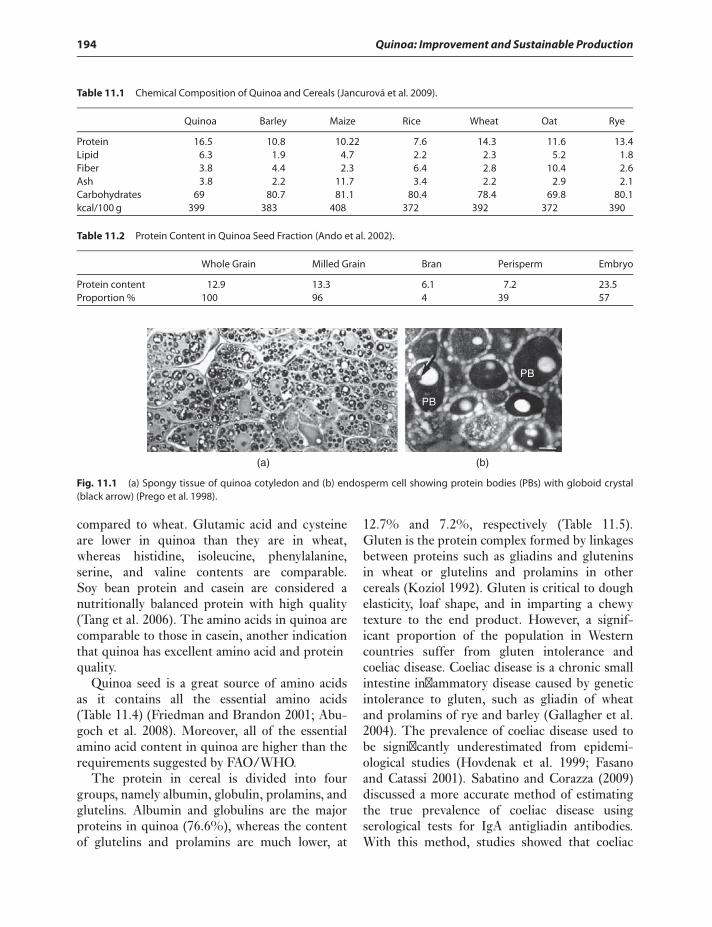
194 Quinoa: Improvement and Sustainable Production
Table 11.1 Chemical Composition of Quinoa and Cereals (Jancurová et al. 2009).
Quinoa Barley Maize Rice Wheat Oat Rye
Protein 16.5 10.8 10.22 7.6 14.3 11.6 13.4Lipid 6.3 1.9 4.7 2.2 2.3 5.2 1.8Fiber 3.8 4.4 2.3 6.4 2.8 10.4 2.6Ash 3.8 2.2 11.7 3.4 2.2 2.9 2.1Carbohydrates 69 80.7 81.1 80.4 78.4 69.8 80.1kcal/100 g 399 383 408 372 392 372 390
Table 11.2 Protein Content in Quinoa Seed Fraction (Ando et al. 2002).
Whole Grain Milled Grain Bran Perisperm Embryo
Protein content 12.9 13.3 6.1 7.2 23.5Proportion % 100 96 4 39 57
PB
PB
(a) (b)
Fig. 11.1 (a) Spongy tissue of quinoa cotyledon and (b) endosperm cell showing protein bodies (PBs) with globoid crystal(black arrow) (Prego et al. 1998).
compared to wheat. Glutamic acid and cysteineare lower in quinoa than they are in wheat,whereas histidine, isoleucine, phenylalanine,serine, and valine contents are comparable.Soy bean protein and casein are considered anutritionally balanced protein with high quality(Tang et al. 2006). The amino acids in quinoa arecomparable to those in casein, another indicationthat quinoa has excellent amino acid and proteinquality.
Quinoa seed is a great source of amino acidsas it contains all the essential amino acids(Table 11.4) (Friedman and Brandon 2001; Abu-goch et al. 2008). Moreover, all of the essentialamino acid content in quinoa are higher than therequirements suggested by FAO/WHO.
The protein in cereal is divided into fourgroups, namely albumin, globulin, prolamins, andglutelins. Albumin and globulins are the majorproteins in quinoa (76.6%), whereas the contentof glutelins and prolamins are much lower, at
12.7% and 7.2%, respectively (Table 11.5).Gluten is the protein complex formed by linkagesbetween proteins such as gliadins and gluteninsin wheat or glutelins and prolamins in othercereals (Koziol 1992). Gluten is critical to doughelasticity, loaf shape, and in imparting a chewytexture to the end product. However, a signif-icant proportion of the population in Westerncountries suffer from gluten intolerance andcoeliac disease. Coeliac disease is a chronic smallintestine inflammatory disease caused by geneticintolerance to gluten, such as gliadin of wheatand prolamins of rye and barley (Gallagher et al.2004). The prevalence of coeliac disease used tobe significantly underestimated from epidemi-ological studies (Hovdenak et al. 1999; Fasanoand Catassi 2001). Sabatino and Corazza (2009)discussed a more accurate method of estimatingthe true prevalence of coeliac disease usingserological tests for IgA antigliadin antibodies.With this method, studies showed that coeliac
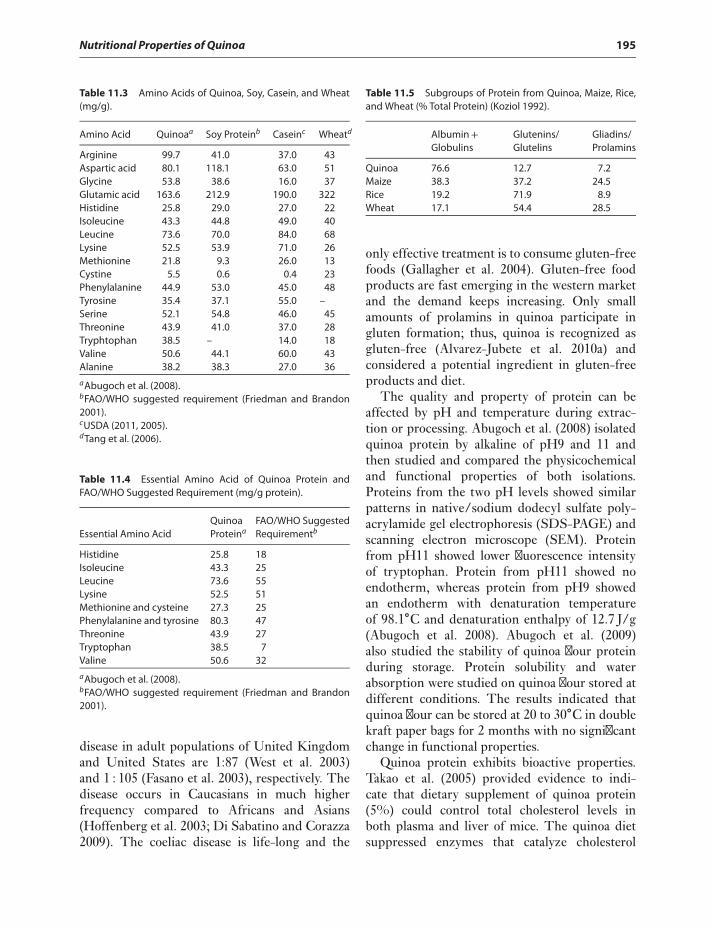
Nutritional Properties of Quinoa 195
Table 11.3 Amino Acids of Quinoa, Soy, Casein, and Wheat(mg/g).
Amino Acid Quinoaa Soy Proteinb Caseinc Wheatd
Arginine 99.7 41.0 37.0 43Aspartic acid 80.1 118.1 63.0 51Glycine 53.8 38.6 16.0 37Glutamic acid 163.6 212.9 190.0 322Histidine 25.8 29.0 27.0 22Isoleucine 43.3 44.8 49.0 40Leucine 73.6 70.0 84.0 68Lysine 52.5 53.9 71.0 26Methionine 21.8 9.3 26.0 13Cystine 5.5 0.6 0.4 23Phenylalanine 44.9 53.0 45.0 48Tyrosine 35.4 37.1 55.0 –Serine 52.1 54.8 46.0 45Threonine 43.9 41.0 37.0 28Tryphtophan 38.5 – 14.0 18Valine 50.6 44.1 60.0 43Alanine 38.2 38.3 27.0 36
aAbugoch et al. (2008).bFAO/WHO suggested requirement (Friedman and Brandon2001).cUSDA (2011, 2005).dTang et al. (2006).
Table 11.4 Essential Amino Acid of Quinoa Protein andFAO/WHO Suggested Requirement (mg/g protein).
Essential Amino AcidQuinoaProteina
FAO/WHO SuggestedRequirementb
Histidine 25.8 18Isoleucine 43.3 25Leucine 73.6 55Lysine 52.5 51Methionine and cysteine 27.3 25Phenylalanine and tyrosine 80.3 47Threonine 43.9 27Tryptophan 38.5 7Valine 50.6 32
aAbugoch et al. (2008).bFAO/WHO suggested requirement (Friedman and Brandon2001).
disease in adult populations of United Kingdomand United States are 1:87 (West et al. 2003)and 1 : 105 (Fasano et al. 2003), respectively. Thedisease occurs in Caucasians in much higherfrequency compared to Africans and Asians(Hoffenberg et al. 2003; Di Sabatino and Corazza2009). The coeliac disease is life-long and the
Table 11.5 Subgroups of Protein from Quinoa, Maize, Rice,and Wheat (% Total Protein) (Koziol 1992).
Albumin+Globulins
Glutenins/Glutelins
Gliadins/Prolamins
Quinoa 76.6 12.7 7.2Maize 38.3 37.2 24.5Rice 19.2 71.9 8.9Wheat 17.1 54.4 28.5
only effective treatment is to consume gluten-freefoods (Gallagher et al. 2004). Gluten-free foodproducts are fast emerging in the western marketand the demand keeps increasing. Only smallamounts of prolamins in quinoa participate ingluten formation; thus, quinoa is recognized asgluten-free (Alvarez-Jubete et al. 2010a) andconsidered a potential ingredient in gluten-freeproducts and diet.
The quality and property of protein can beaffected by pH and temperature during extrac-tion or processing. Abugoch et al. (2008) isolatedquinoa protein by alkaline of pH9 and 11 andthen studied and compared the physicochemicaland functional properties of both isolations.Proteins from the two pH levels showed similarpatterns in native/sodium dodecyl sulfate poly-acrylamide gel electrophoresis (SDS-PAGE) andscanning electron microscope (SEM). Proteinfrom pH11 showed lower fluorescence intensityof tryptophan. Protein from pH11 showed noendotherm, whereas protein from pH9 showedan endotherm with denaturation temperatureof 98.1∘C and denaturation enthalpy of 12.7 J/g(Abugoch et al. 2008). Abugoch et al. (2009)also studied the stability of quinoa flour proteinduring storage. Protein solubility and waterabsorption were studied on quinoa flour stored atdifferent conditions. The results indicated thatquinoa flour can be stored at 20 to 30∘C in doublekraft paper bags for 2 months with no significantchange in functional properties.
Quinoa protein exhibits bioactive properties.Takao et al. (2005) provided evidence to indi-cate that dietary supplement of quinoa protein(5%) could control total cholesterol levels inboth plasma and liver of mice. The quinoa dietsuppressed enzymes that catalyze cholesterol
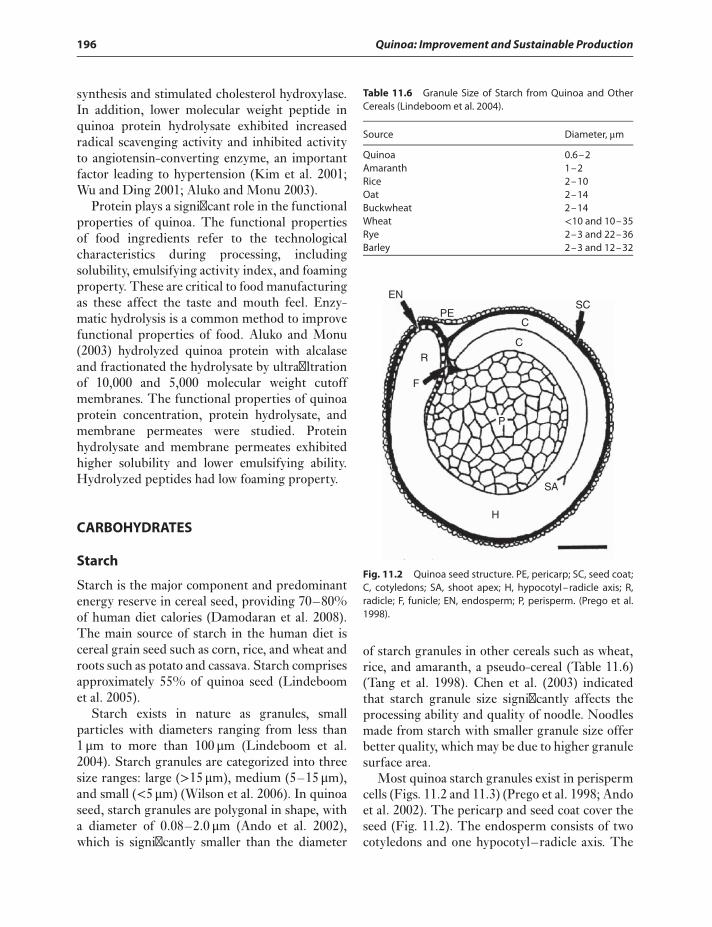
196 Quinoa: Improvement and Sustainable Production
synthesis and stimulated cholesterol hydroxylase.In addition, lower molecular weight peptide inquinoa protein hydrolysate exhibited increasedradical scavenging activity and inhibited activityto angiotensin-converting enzyme, an importantfactor leading to hypertension (Kim et al. 2001;Wu and Ding 2001; Aluko and Monu 2003).
Protein plays a significant role in the functionalproperties of quinoa. The functional propertiesof food ingredients refer to the technologicalcharacteristics during processing, includingsolubility, emulsifying activity index, and foamingproperty. These are critical to food manufacturingas these affect the taste and mouth feel. Enzy-matic hydrolysis is a common method to improvefunctional properties of food. Aluko and Monu(2003) hydrolyzed quinoa protein with alcalaseand fractionated the hydrolysate by ultrafiltrationof 10,000 and 5,000 molecular weight cutoffmembranes. The functional properties of quinoaprotein concentration, protein hydrolysate, andmembrane permeates were studied. Proteinhydrolysate and membrane permeates exhibitedhigher solubility and lower emulsifying ability.Hydrolyzed peptides had low foaming property.
CARBOHYDRATES
Starch
Starch is the major component and predominantenergy reserve in cereal seed, providing 70–80%of human diet calories (Damodaran et al. 2008).The main source of starch in the human diet iscereal grain seed such as corn, rice, and wheat androots such as potato and cassava. Starch comprisesapproximately 55% of quinoa seed (Lindeboomet al. 2005).
Starch exists in nature as granules, smallparticles with diameters ranging from less than1 μm to more than 100 μm (Lindeboom et al.2004). Starch granules are categorized into threesize ranges: large (>15 μm), medium (5–15 μm),and small (<5 μm) (Wilson et al. 2006). In quinoaseed, starch granules are polygonal in shape, witha diameter of 0.08–2.0 μm (Ando et al. 2002),which is significantly smaller than the diameter
Table 11.6 Granule Size of Starch from Quinoa and OtherCereals (Lindeboom et al. 2004).
Source Diameter, μm
Quinoa 0.6–2Amaranth 1–2Rice 2–10Oat 2–14Buckwheat 2–14Wheat <10 and 10–35Rye 2–3 and 22–36Barley 2–3 and 12–32
EN
PE
R
F
P
H
SA
C
C
SC
Fig. 11.2 Quinoa seed structure. PE, pericarp; SC, seed coat;C, cotyledons; SA, shoot apex; H, hypocotyl–radicle axis; R,radicle; F, funicle; EN, endosperm; P, perisperm. (Prego et al.1998).
of starch granules in other cereals such as wheat,rice, and amaranth, a pseudo-cereal (Table 11.6)(Tang et al. 1998). Chen et al. (2003) indicatedthat starch granule size significantly affects theprocessing ability and quality of noodle. Noodlesmade from starch with smaller granule size offerbetter quality, which may be due to higher granulesurface area.
Most quinoa starch granules exist in perispermcells (Figs. 11.2 and 11.3) (Prego et al. 1998; Andoet al. 2002). The pericarp and seed coat cover theseed (Fig. 11.2). The endosperm consists of twocotyledons and one hypocotyl–radicle axis. The
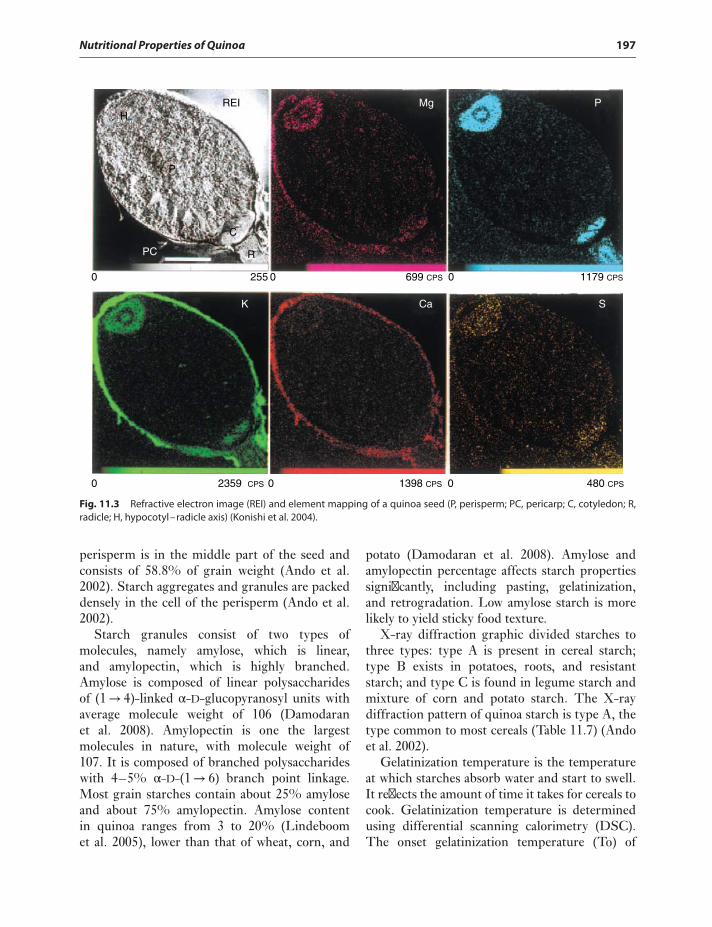
Nutritional Properties of Quinoa 197
REIH
P
C
RPC
K Ca
Mg P
S
0 0 0255 699 CPS 1179 CPS
0 0 02359 CPS 1398 CPS 480 CPS
Fig. 11.3 Refractive electron image (REI) and element mapping of a quinoa seed (P, perisperm; PC, pericarp; C, cotyledon; R,radicle; H, hypocotyl–radicle axis) (Konishi et al. 2004).
perisperm is in the middle part of the seed andconsists of 58.8% of grain weight (Ando et al.2002). Starch aggregates and granules are packeddensely in the cell of the perisperm (Ando et al.2002).
Starch granules consist of two types ofmolecules, namely amylose, which is linear,and amylopectin, which is highly branched.Amylose is composed of linear polysaccharidesof (1→ 4)-linked α-D-glucopyranosyl units withaverage molecule weight of 106 (Damodaranet al. 2008). Amylopectin is one the largestmolecules in nature, with molecule weight of107. It is composed of branched polysaccharideswith 4–5% α-D-(1→ 6) branch point linkage.Most grain starches contain about 25% amyloseand about 75% amylopectin. Amylose contentin quinoa ranges from 3 to 20% (Lindeboomet al. 2005), lower than that of wheat, corn, and
potato (Damodaran et al. 2008). Amylose andamylopectin percentage affects starch propertiessignificantly, including pasting, gelatinization,and retrogradation. Low amylose starch is morelikely to yield sticky food texture.
X-ray diffraction graphic divided starches tothree types: type A is present in cereal starch;type B exists in potatoes, roots, and resistantstarch; and type C is found in legume starch andmixture of corn and potato starch. The X-raydiffraction pattern of quinoa starch is type A, thetype common to most cereals (Table 11.7) (Andoet al. 2002).
Gelatinization temperature is the temperatureat which starches absorb water and start to swell.It reflects the amount of time it takes for cereals tocook. Gelatinization temperature is determinedusing differential scanning calorimetry (DSC).The onset gelatinization temperature (To) of
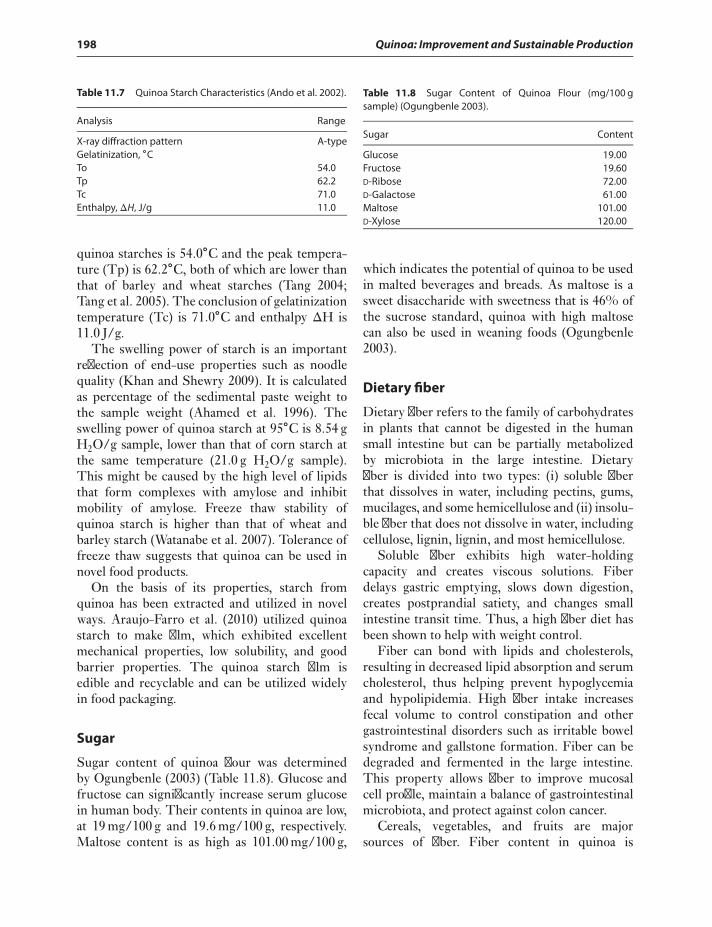
198 Quinoa: Improvement and Sustainable Production
Table 11.7 Quinoa Starch Characteristics (Ando et al. 2002).
Analysis Range
X-ray diffraction pattern A-typeGelatinization, ∘CTo 54.0Tp 62.2Tc 71.0Enthalpy, ΔH, J/g 11.0
quinoa starches is 54.0∘C and the peak tempera-ture (Tp) is 62.2∘C, both of which are lower thanthat of barley and wheat starches (Tang 2004;Tang et al. 2005). The conclusion of gelatinizationtemperature (Tc) is 71.0∘C and enthalpy ΔH is11.0 J/g.
The swelling power of starch is an importantreflection of end-use properties such as noodlequality (Khan and Shewry 2009). It is calculatedas percentage of the sedimental paste weight tothe sample weight (Ahamed et al. 1996). Theswelling power of quinoa starch at 95∘C is 8.54 gH2O/g sample, lower than that of corn starch atthe same temperature (21.0 g H2O/g sample).This might be caused by the high level of lipidsthat form complexes with amylose and inhibitmobility of amylose. Freeze thaw stability ofquinoa starch is higher than that of wheat andbarley starch (Watanabe et al. 2007). Tolerance offreeze thaw suggests that quinoa can be used innovel food products.
On the basis of its properties, starch fromquinoa has been extracted and utilized in novelways. Araujo-Farro et al. (2010) utilized quinoastarch to make film, which exhibited excellentmechanical properties, low solubility, and goodbarrier properties. The quinoa starch film isedible and recyclable and can be utilized widelyin food packaging.
Sugar
Sugar content of quinoa flour was determinedby Ogungbenle (2003) (Table 11.8). Glucose andfructose can significantly increase serum glucosein human body. Their contents in quinoa are low,at 19 mg/100 g and 19.6 mg/100 g, respectively.Maltose content is as high as 101.00 mg/100 g,
Table 11.8 Sugar Content of Quinoa Flour (mg/100 gsample) (Ogungbenle 2003).
Sugar Content
Glucose 19.00Fructose 19.60D-Ribose 72.00D-Galactose 61.00Maltose 101.00D-Xylose 120.00
which indicates the potential of quinoa to be usedin malted beverages and breads. As maltose is asweet disaccharide with sweetness that is 46% ofthe sucrose standard, quinoa with high maltosecan also be used in weaning foods (Ogungbenle2003).
Dietary fiber
Dietary fiber refers to the family of carbohydratesin plants that cannot be digested in the humansmall intestine but can be partially metabolizedby microbiota in the large intestine. Dietaryfiber is divided into two types: (i) soluble fiberthat dissolves in water, including pectins, gums,mucilages, and some hemicellulose and (ii) insolu-ble fiber that does not dissolve in water, includingcellulose, lignin, lignin, and most hemicellulose.
Soluble fiber exhibits high water-holdingcapacity and creates viscous solutions. Fiberdelays gastric emptying, slows down digestion,creates postprandial satiety, and changes smallintestine transit time. Thus, a high fiber diet hasbeen shown to help with weight control.
Fiber can bond with lipids and cholesterols,resulting in decreased lipid absorption and serumcholesterol, thus helping prevent hypoglycemiaand hypolipidemia. High fiber intake increasesfecal volume to control constipation and othergastrointestinal disorders such as irritable bowelsyndrome and gallstone formation. Fiber can bedegraded and fermented in the large intestine.This property allows fiber to improve mucosalcell profile, maintain a balance of gastrointestinalmicrobiota, and protect against colon cancer.
Cereals, vegetables, and fruits are majorsources of fiber. Fiber content in quinoa is
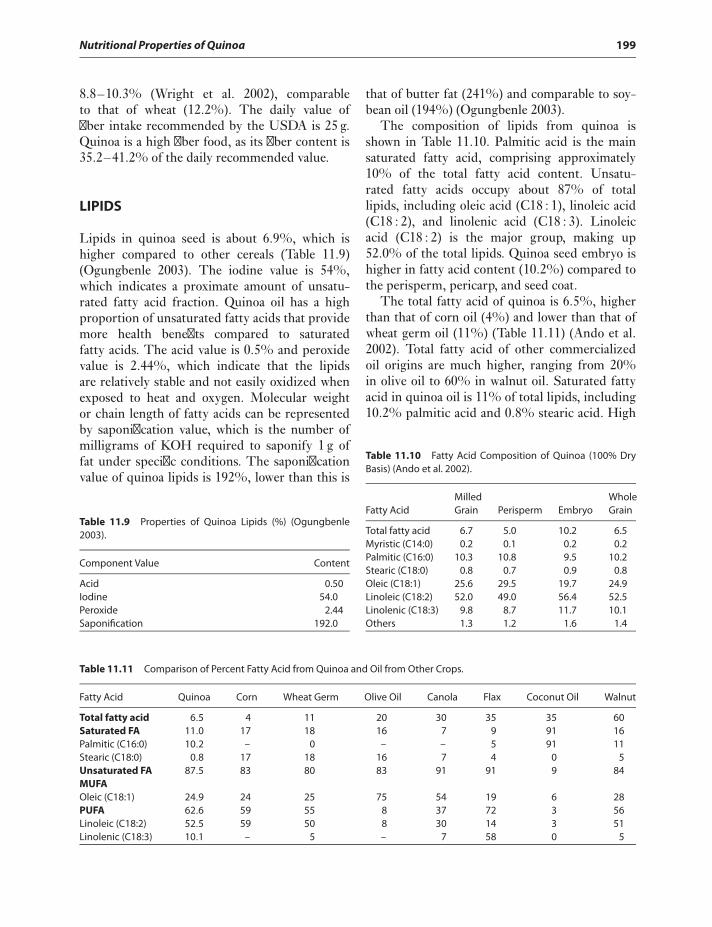
Nutritional Properties of Quinoa 199
8.8–10.3% (Wright et al. 2002), comparableto that of wheat (12.2%). The daily value offiber intake recommended by the USDA is 25 g.Quinoa is a high fiber food, as its fiber content is35.2–41.2% of the daily recommended value.
LIPIDS
Lipids in quinoa seed is about 6.9%, which ishigher compared to other cereals (Table 11.9)(Ogungbenle 2003). The iodine value is 54%,which indicates a proximate amount of unsatu-rated fatty acid fraction. Quinoa oil has a highproportion of unsaturated fatty acids that providemore health benefits compared to saturatedfatty acids. The acid value is 0.5% and peroxidevalue is 2.44%, which indicate that the lipidsare relatively stable and not easily oxidized whenexposed to heat and oxygen. Molecular weightor chain length of fatty acids can be representedby saponification value, which is the number ofmilligrams of KOH required to saponify 1 g offat under specific conditions. The saponificationvalue of quinoa lipids is 192%, lower than this is
Table 11.9 Properties of Quinoa Lipids (%) (Ogungbenle2003).
Component Value Content
Acid 0.50Iodine 54.0Peroxide 2.44Saponification 192.0
that of butter fat (241%) and comparable to soy-bean oil (194%) (Ogungbenle 2003).
The composition of lipids from quinoa isshown in Table 11.10. Palmitic acid is the mainsaturated fatty acid, comprising approximately10% of the total fatty acid content. Unsatu-rated fatty acids occupy about 87% of totallipids, including oleic acid (C18 : 1), linoleic acid(C18 : 2), and linolenic acid (C18 : 3). Linoleicacid (C18 : 2) is the major group, making up52.0% of the total lipids. Quinoa seed embryo ishigher in fatty acid content (10.2%) compared tothe perisperm, pericarp, and seed coat.
The total fatty acid of quinoa is 6.5%, higherthan that of corn oil (4%) and lower than that ofwheat germ oil (11%) (Table 11.11) (Ando et al.2002). Total fatty acid of other commercializedoil origins are much higher, ranging from 20%in olive oil to 60% in walnut oil. Saturated fattyacid in quinoa oil is 11% of total lipids, including10.2% palmitic acid and 0.8% stearic acid. High
Table 11.10 Fatty Acid Composition of Quinoa (100% DryBasis) (Ando et al. 2002).
Fatty AcidMilledGrain Perisperm Embryo
WholeGrain
Total fatty acid 6.7 5.0 10.2 6.5Myristic (C14:0) 0.2 0.1 0.2 0.2Palmitic (C16:0) 10.3 10.8 9.5 10.2Stearic (C18:0) 0.8 0.7 0.9 0.8Oleic (C18:1) 25.6 29.5 19.7 24.9Linoleic (C18:2) 52.0 49.0 56.4 52.5Linolenic (C18:3) 9.8 8.7 11.7 10.1Others 1.3 1.2 1.6 1.4
Table 11.11 Comparison of Percent Fatty Acid from Quinoa and Oil from Other Crops.
Fatty Acid Quinoa Corn Wheat Germ Olive Oil Canola Flax Coconut Oil Walnut
Total fatty acid 6.5 4 11 20 30 35 35 60Saturated FA 11.0 17 18 16 7 9 91 16Palmitic (C16:0) 10.2 – 0 – – 5 91 11Stearic (C18:0) 0.8 17 18 16 7 4 0 5Unsaturated FA 87.5 83 80 83 91 91 9 84MUFAOleic (C18:1) 24.9 24 25 75 54 19 6 28PUFA 62.6 59 55 8 37 72 3 56Linoleic (C18:2) 52.5 59 50 8 30 14 3 51Linolenic (C18:3) 10.1 – 5 – 7 58 0 5
200 Quinoa: Improvement and Sustainable Production
intake of saturated fatty acid causes human healthissues such as obesity (van Dijk et al. 2009),cardiovascular disease (CVD) (Sacks and Katan2002), and type II diabetes (Hunnicutt et al.1994). Stearic acid was reported to decrease levelsof high-density lipoprotein (HDL), the goodlipoprotein that protects against CVD (Hu et al.2001). Saturated fatty acid proportion in quinoaoil is lower than that of other oils except for canolaand flax seed oil. Steric acid is only 0.8%, muchlower than that found in other oils.
Unsaturated fatty acid is divided into twocategories, monounsaturated fatty acid (MUFA)and polyunsaturated fatty acid (PUFA). TheMUFA has only one double carbon bond in lipidchain, for example, oleic acid (C18 : 1). On theother hand, PUFA has two or more double carbonbonds, such as linoleic (C18 : 2) and linoleic(C18 : 2). MUFA has been reported to exhibit anegative correlation to total mortality and CVDdeath (Jacobs et al. 1992). Olive oil is rich inMUFA (75%) and is the major source of fat in theMediterranean diet. The death rate due to heartdisease in Mediterranean populations is verylow, which can be explained by their MUFA-richdiet (Chait et al. 1993). MUFA in quinoa oil isapproximately 25%, lower than that of olive oiland canola but comparable to other oils.
Healthy PUFAs normally refer to n-6 polyun-saturated fatty acid linoleic (C18:2) and n-3polyunsaturated fatty acid linoleic (C18:2). Onthe basis of the metabolic studies, increasingintake of linoleic acid can improve lipid profile,lower cholesterol (Chait et al. 1993), and enhanceinsulin sensitivity (Lovejoy and DiGirolamo1992; Lovejoy 1999). Taking linoleic fatty acidnot only decreases the risk of coronary heartdisease (Chait et al. 1993) and significantlyreduces incidence of type II diabetes (Salmerónet al. 2001) but also decreases the risk of heartarrhythmia (Abeywardena et al. 1991). Linoleicacid content in quinoa oil is 52.5%, comparableto that in corn oil (59%), wheat germ oil (55%),and walnut oil (51%) and much higher than thatin olive oil, canola, flax oil, and coconut oil.
n-3 fatty acid α-linoleic (C18:2) (shortenedas ALA) is another functional food componentthat has been drawing attention from consumers
and the food industry. It is even more essentialto infants and children, because of its criticalfunction on brain and nerve development (Cun-nane and Thompson 1995). ALA can generatelong-chain n-3 fatty acid such as docosahexaenoic(DHA) and eicosapentaenoic (EPA) throughdesaturation-chain elongation pathway (Cunnaneand Thompson 1995). This effect of ALA isimportant because DHA and EPA enhances brainfunction and boosts the immune system. ALAalso inhibits the transformation of linoleic acidto arachidonic acid (C20:4, n-6) and controlsinflammation in the human body (Renaud andNordøy 1983). Excessive inflammation can leadto obesity (Wymann and Solinas 2013), type IIdiabetes (Oliver et al. 2010), CVD (Crumpacker2010), and gastrointestinal diseases (Ohmanand Simrén 2010). Epidemiologic studies haveprovided convincing evidence for the associationof ALA’s effect against CVD and arrhythmia(Hu et al. 1999). Although ALA in quinoa oil(10.1%) is lower than that in flaxseed oil (58%), itis relatively rich in ALA when compared to otheroil products, such as wheat germ oil (5%), canolaoil (7%), coconut oil (0%), and walnut oil (5%)(Table 11.11).
Linoleic acid and ALA compete for thedesaturation and chain elongation pathway (Garget al. 1989; Cunnane and Thompson 1995); thus,the balance between linoleic acid and ALA iscritical for human health (Chan et al. 1993). AnALA:linoleic ratio of between 1 : 10 to 1 : 5 hasbeen shown to help control coronary heart disease(Hu et al. 1999). The ratio of ALA and linoleicacid in quinoa oil is close to 1 : 5.
As a whole, the components of quinoa oil arewell balanced and beneficial to human health.Quinoa oil is low in saturated fatty acids and highin MUFA and PUFAs. Quinoa can be considereda potential oil seed with quality comparable toother commercialized functional oils.
VITAMINS
Cereals are one of the major sources of vitaminB complex. Cereal-based food products, such asbread and ready-to-eat cereal and rice, contribute
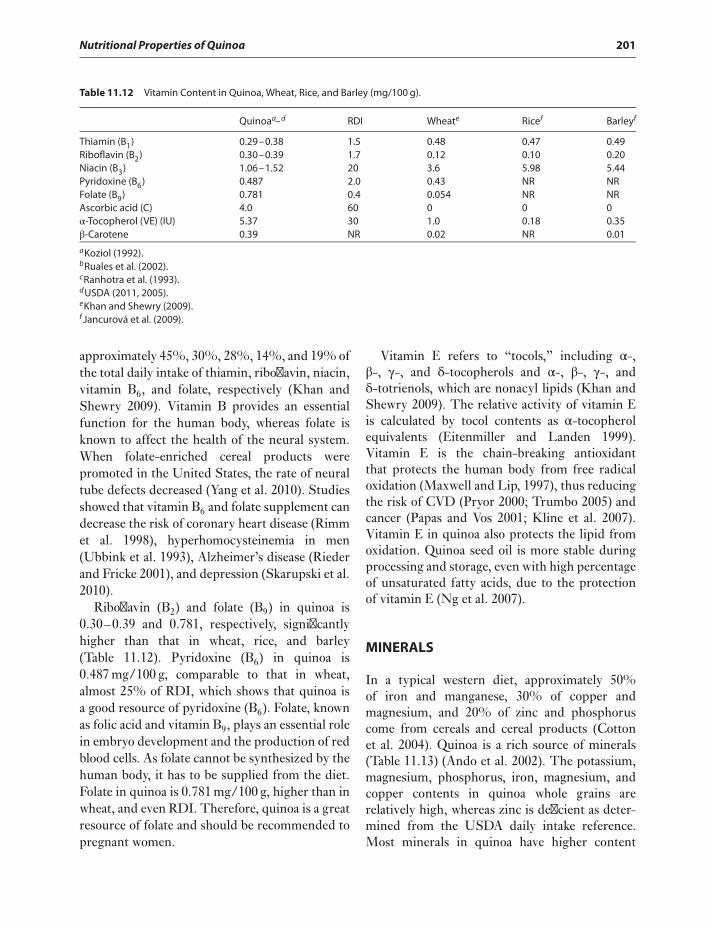
Nutritional Properties of Quinoa 201
Table 11.12 Vitamin Content in Quinoa, Wheat, Rice, and Barley (mg/100 g).
Quinoaa– d RDI Wheate Ricef Barleyf
Thiamin (B1) 0.29–0.38 1.5 0.48 0.47 0.49Riboflavin (B2) 0.30–0.39 1.7 0.12 0.10 0.20Niacin (B3) 1.06–1.52 20 3.6 5.98 5.44Pyridoxine (B6) 0.487 2.0 0.43 NR NRFolate (B9) 0.781 0.4 0.054 NR NRAscorbic acid (C) 4.0 60 0 0 0α-Tocopherol (VE) (IU) 5.37 30 1.0 0.18 0.35β-Carotene 0.39 NR 0.02 NR 0.01
aKoziol (1992).bRuales et al. (2002).cRanhotra et al. (1993).dUSDA (2011, 2005).eKhan and Shewry (2009).f Jancurová et al. (2009).
approximately 45%, 30%, 28%, 14%, and 19% ofthe total daily intake of thiamin, riboflavin, niacin,vitamin B6, and folate, respectively (Khan andShewry 2009). Vitamin B provides an essentialfunction for the human body, whereas folate isknown to affect the health of the neural system.When folate-enriched cereal products werepromoted in the United States, the rate of neuraltube defects decreased (Yang et al. 2010). Studiesshowed that vitamin B6 and folate supplement candecrease the risk of coronary heart disease (Rimmet al. 1998), hyperhomocysteinemia in men(Ubbink et al. 1993), Alzheimer’s disease (Riederand Fricke 2001), and depression (Skarupski et al.2010).
Riboflavin (B2) and folate (B9) in quinoa is0.30–0.39 and 0.781, respectively, significantlyhigher than that in wheat, rice, and barley(Table 11.12). Pyridoxine (B6) in quinoa is0.487 mg/100 g, comparable to that in wheat,almost 25% of RDI, which shows that quinoa isa good resource of pyridoxine (B6). Folate, knownas folic acid and vitamin B9, plays an essential rolein embryo development and the production of redblood cells. As folate cannot be synthesized by thehuman body, it has to be supplied from the diet.Folate in quinoa is 0.781 mg/100 g, higher than inwheat, and even RDI. Therefore, quinoa is a greatresource of folate and should be recommended topregnant women.
Vitamin E refers to “tocols,” including α-,β-, γ-, and δ-tocopherols and α-, β-, γ-, andδ-totrienols, which are nonacyl lipids (Khan andShewry 2009). The relative activity of vitamin Eis calculated by tocol contents as α-tocopherolequivalents (Eitenmiller and Landen 1999).Vitamin E is the chain-breaking antioxidantthat protects the human body from free radicaloxidation (Maxwell and Lip, 1997), thus reducingthe risk of CVD (Pryor 2000; Trumbo 2005) andcancer (Papas and Vos 2001; Kline et al. 2007).Vitamin E in quinoa also protects the lipid fromoxidation. Quinoa seed oil is more stable duringprocessing and storage, even with high percentageof unsaturated fatty acids, due to the protectionof vitamin E (Ng et al. 2007).
MINERALS
In a typical western diet, approximately 50%of iron and manganese, 30% of copper andmagnesium, and 20% of zinc and phosphoruscome from cereals and cereal products (Cottonet al. 2004). Quinoa is a rich source of minerals(Table 11.13) (Ando et al. 2002). The potassium,magnesium, phosphorus, iron, magnesium, andcopper contents in quinoa whole grains arerelatively high, whereas zinc is deficient as deter-mined from the USDA daily intake reference.Most minerals in quinoa have higher content
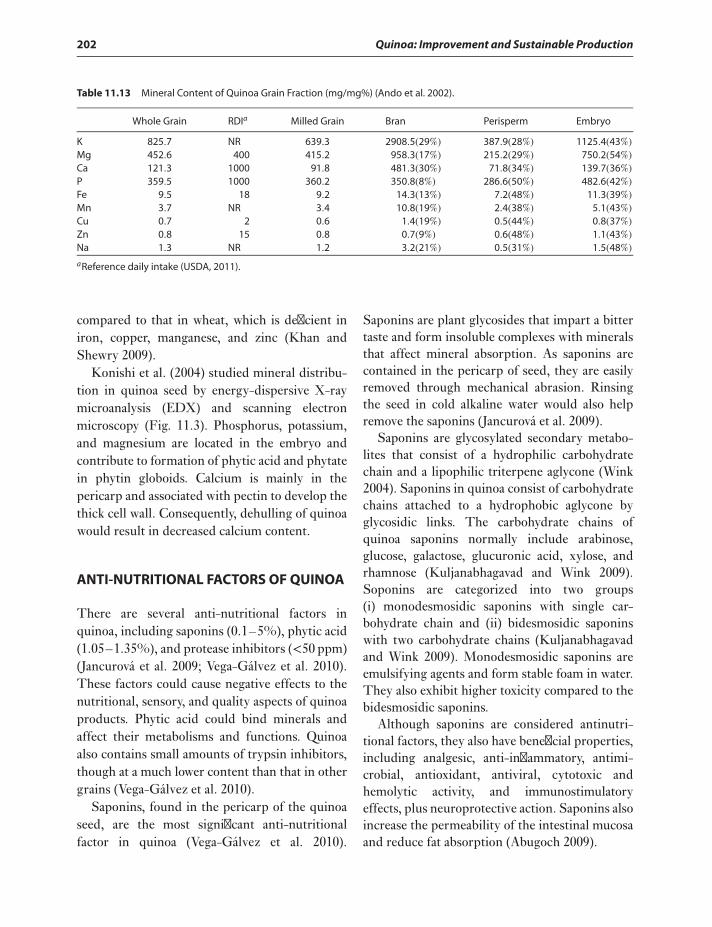
202 Quinoa: Improvement and Sustainable Production
Table 11.13 Mineral Content of Quinoa Grain Fraction (mg/mg%) (Ando et al. 2002).
Whole Grain RDIa Milled Grain Bran Perisperm Embryo
K 825.7 NR 639.3 2908.5(29%) 387.9(28%) 1125.4(43%)Mg 452.6 400 415.2 958.3(17%) 215.2(29%) 750.2(54%)Ca 121.3 1000 91.8 481.3(30%) 71.8(34%) 139.7(36%)P 359.5 1000 360.2 350.8(8%) 286.6(50%) 482.6(42%)Fe 9.5 18 9.2 14.3(13%) 7.2(48%) 11.3(39%)Mn 3.7 NR 3.4 10.8(19%) 2.4(38%) 5.1(43%)Cu 0.7 2 0.6 1.4(19%) 0.5(44%) 0.8(37%)Zn 0.8 15 0.8 0.7(9%) 0.6(48%) 1.1(43%)Na 1.3 NR 1.2 3.2(21%) 0.5(31%) 1.5(48%)aReference daily intake (USDA, 2011).
compared to that in wheat, which is deficient iniron, copper, manganese, and zinc (Khan andShewry 2009).
Konishi et al. (2004) studied mineral distribu-tion in quinoa seed by energy-dispersive X-raymicroanalysis (EDX) and scanning electronmicroscopy (Fig. 11.3). Phosphorus, potassium,and magnesium are located in the embryo andcontribute to formation of phytic acid and phytatein phytin globoids. Calcium is mainly in thepericarp and associated with pectin to develop thethick cell wall. Consequently, dehulling of quinoawould result in decreased calcium content.
ANTI-NUTRITIONAL FACTORS OF QUINOA
There are several anti-nutritional factors inquinoa, including saponins (0.1–5%), phytic acid(1.05–1.35%), and protease inhibitors (<50 ppm)(Jancurová et al. 2009; Vega-Gálvez et al. 2010).These factors could cause negative effects to thenutritional, sensory, and quality aspects of quinoaproducts. Phytic acid could bind minerals andaffect their metabolisms and functions. Quinoaalso contains small amounts of trypsin inhibitors,though at a much lower content than that in othergrains (Vega-Gálvez et al. 2010).
Saponins, found in the pericarp of the quinoaseed, are the most significant anti-nutritionalfactor in quinoa (Vega-Gálvez et al. 2010).
Saponins are plant glycosides that impart a bittertaste and form insoluble complexes with mineralsthat affect mineral absorption. As saponins arecontained in the pericarp of seed, they are easilyremoved through mechanical abrasion. Rinsingthe seed in cold alkaline water would also helpremove the saponins (Jancurová et al. 2009).
Saponins are glycosylated secondary metabo-lites that consist of a hydrophilic carbohydratechain and a lipophilic triterpene aglycone (Wink2004). Saponins in quinoa consist of carbohydratechains attached to a hydrophobic aglycone byglycosidic links. The carbohydrate chains ofquinoa saponins normally include arabinose,glucose, galactose, glucuronic acid, xylose, andrhamnose (Kuljanabhagavad and Wink 2009).Soponins are categorized into two groups(i) monodesmosidic saponins with single car-bohydrate chain and (ii) bidesmosidic saponinswith two carbohydrate chains (Kuljanabhagavadand Wink 2009). Monodesmosidic saponins areemulsifying agents and form stable foam in water.They also exhibit higher toxicity compared to thebidesmosidic saponins.
Although saponins are considered antinutri-tional factors, they also have beneficial properties,including analgesic, anti-inflammatory, antimi-crobial, antioxidant, antiviral, cytotoxic andhemolytic activity, and immunostimulatoryeffects, plus neuroprotective action. Saponins alsoincrease the permeability of the intestinal mucosaand reduce fat absorption (Abugoch 2009).
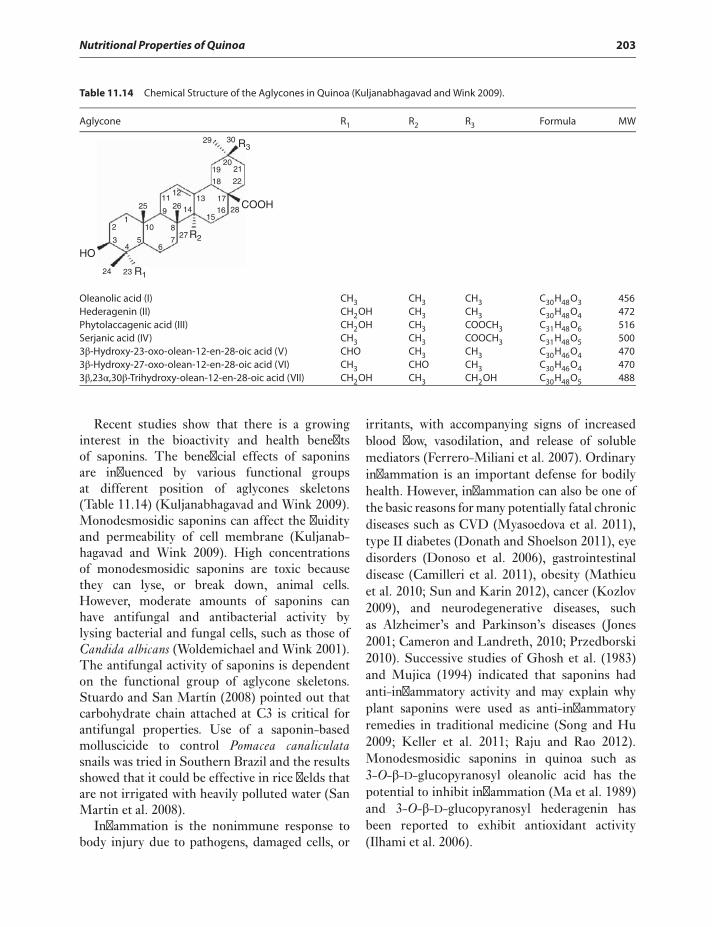
Nutritional Properties of Quinoa 203
Table 11.14 Chemical Structure of the Aglycones in Quinoa (Kuljanabhagavad and Wink 2009).
Aglycone R1 R2 R3 Formula MW
HO
24 23
12
3 54
10 8
76
25
27
1516
17131426
9
1112
28 COOH
22
21
18
1920
3029 R3
R2
R1
Oleanolic acid (I) CH3 CH3 CH3 C30H48O3 456Hederagenin (II) CH2OH CH3 CH3 C30H48O4 472Phytolaccagenic acid (III) CH2OH CH3 COOCH3 C31H48O6 516Serjanic acid (IV) CH3 CH3 COOCH3 C31H48O5 5003β-Hydroxy-23-oxo-olean-12-en-28-oic acid (V) CHO CH3 CH3 C30H46O4 4703β-Hydroxy-27-oxo-olean-12-en-28-oic acid (VI) CH3 CHO CH3 C30H46O4 4703β,23α,30β-Trihydroxy-olean-12-en-28-oic acid (VII) CH2OH CH3 CH2OH C30H48O5 488
Recent studies show that there is a growinginterest in the bioactivity and health benefitsof saponins. The beneficial effects of saponinsare influenced by various functional groupsat different position of aglycones skeletons(Table 11.14) (Kuljanabhagavad and Wink 2009).Monodesmosidic saponins can affect the fluidityand permeability of cell membrane (Kuljanab-hagavad and Wink 2009). High concentrationsof monodesmosidic saponins are toxic becausethey can lyse, or break down, animal cells.However, moderate amounts of saponins canhave antifungal and antibacterial activity bylysing bacterial and fungal cells, such as those ofCandida albicans (Woldemichael and Wink 2001).The antifungal activity of saponins is dependenton the functional group of aglycone skeletons.Stuardo and San Martín (2008) pointed out thatcarbohydrate chain attached at C3 is critical forantifungal properties. Use of a saponin-basedmolluscicide to control Pomacea canaliculatasnails was tried in Southern Brazil and the resultsshowed that it could be effective in rice fields thatare not irrigated with heavily polluted water (SanMartin et al. 2008).
Inflammation is the nonimmune response tobody injury due to pathogens, damaged cells, or
irritants, with accompanying signs of increasedblood flow, vasodilation, and release of solublemediators (Ferrero-Miliani et al. 2007). Ordinaryinflammation is an important defense for bodilyhealth. However, inflammation can also be one ofthe basic reasons for many potentially fatal chronicdiseases such as CVD (Myasoedova et al. 2011),type II diabetes (Donath and Shoelson 2011), eyedisorders (Donoso et al. 2006), gastrointestinaldisease (Camilleri et al. 2011), obesity (Mathieuet al. 2010; Sun and Karin 2012), cancer (Kozlov2009), and neurodegenerative diseases, suchas Alzheimer’s and Parkinson’s diseases (Jones2001; Cameron and Landreth, 2010; Przedborski2010). Successive studies of Ghosh et al. (1983)and Mujica (1994) indicated that saponins hadanti-inflammatory activity and may explain whyplant saponins were used as anti-inflammatoryremedies in traditional medicine (Song and Hu2009; Keller et al. 2011; Raju and Rao 2012).Monodesmosidic saponins in quinoa such as3-O-β-D-glucopyranosyl oleanolic acid has thepotential to inhibit inflammation (Ma et al. 1989)and 3-O-β-D-glucopyranosyl hederagenin hasbeen reported to exhibit antioxidant activity(Ilhami et al. 2006).
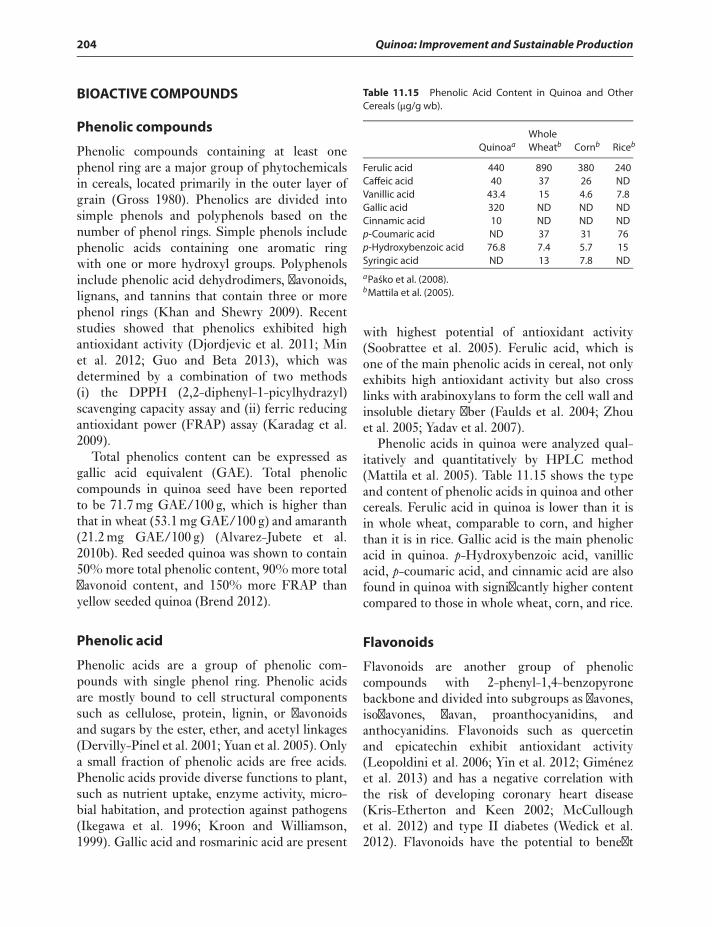
204 Quinoa: Improvement and Sustainable Production
BIOACTIVE COMPOUNDS
Phenolic compounds
Phenolic compounds containing at least onephenol ring are a major group of phytochemicalsin cereals, located primarily in the outer layer ofgrain (Gross 1980). Phenolics are divided intosimple phenols and polyphenols based on thenumber of phenol rings. Simple phenols includephenolic acids containing one aromatic ringwith one or more hydroxyl groups. Polyphenolsinclude phenolic acid dehydrodimers, flavonoids,lignans, and tannins that contain three or morephenol rings (Khan and Shewry 2009). Recentstudies showed that phenolics exhibited highantioxidant activity (Djordjevic et al. 2011; Minet al. 2012; Guo and Beta 2013), which wasdetermined by a combination of two methods(i) the DPPH (2,2-diphenyl-1-picylhydrazyl)scavenging capacity assay and (ii) ferric reducingantioxidant power (FRAP) assay (Karadag et al.2009).
Total phenolics content can be expressed asgallic acid equivalent (GAE). Total phenoliccompounds in quinoa seed have been reportedto be 71.7 mg GAE/100 g, which is higher thanthat in wheat (53.1 mg GAE/100 g) and amaranth(21.2 mg GAE/100 g) (Alvarez-Jubete et al.2010b). Red seeded quinoa was shown to contain50% more total phenolic content, 90% more totalflavonoid content, and 150% more FRAP thanyellow seeded quinoa (Brend 2012).
Phenolic acid
Phenolic acids are a group of phenolic com-pounds with single phenol ring. Phenolic acidsare mostly bound to cell structural componentssuch as cellulose, protein, lignin, or flavonoidsand sugars by the ester, ether, and acetyl linkages(Dervilly-Pinel et al. 2001; Yuan et al. 2005). Onlya small fraction of phenolic acids are free acids.Phenolic acids provide diverse functions to plant,such as nutrient uptake, enzyme activity, micro-bial habitation, and protection against pathogens(Ikegawa et al. 1996; Kroon and Williamson,1999). Gallic acid and rosmarinic acid are present
Table 11.15 Phenolic Acid Content in Quinoa and OtherCereals (μg/g wb).
QuinoaaWholeWheatb Cornb Riceb
Ferulic acid 440 890 380 240Caffeic acid 40 37 26 NDVanillic acid 43.4 15 4.6 7.8Gallic acid 320 ND ND NDCinnamic acid 10 ND ND NDp-Coumaric acid ND 37 31 76p-Hydroxybenzoic acid 76.8 7.4 5.7 15Syringic acid ND 13 7.8 ND
aPasko et al. (2008).bMattila et al. (2005).
with highest potential of antioxidant activity(Soobrattee et al. 2005). Ferulic acid, which isone of the main phenolic acids in cereal, not onlyexhibits high antioxidant activity but also crosslinks with arabinoxylans to form the cell wall andinsoluble dietary fiber (Faulds et al. 2004; Zhouet al. 2005; Yadav et al. 2007).
Phenolic acids in quinoa were analyzed qual-itatively and quantitatively by HPLC method(Mattila et al. 2005). Table 11.15 shows the typeand content of phenolic acids in quinoa and othercereals. Ferulic acid in quinoa is lower than it isin whole wheat, comparable to corn, and higherthan it is in rice. Gallic acid is the main phenolicacid in quinoa. p-Hydroxybenzoic acid, vanillicacid, p-coumaric acid, and cinnamic acid are alsofound in quinoa with significantly higher contentcompared to those in whole wheat, corn, and rice.
Flavonoids
Flavonoids are another group of phenoliccompounds with 2-phenyl-1,4-benzopyronebackbone and divided into subgroups as flavones,isoflavones, flavan, proanthocyanidins, andanthocyanidins. Flavonoids such as quercetinand epicatechin exhibit antioxidant activity(Leopoldini et al. 2006; Yin et al. 2012; Giménezet al. 2013) and has a negative correlation withthe risk of developing coronary heart disease(Kris-Etherton and Keen 2002; McCulloughet al. 2012) and type II diabetes (Wedick et al.2012). Flavonoids have the potential to benefit
Nutritional Properties of Quinoa 205
cognitive performance both acutely and chron-ically (Lamport et al. 2012). Evidence indicatesthat flavonoids have potential to reduce the riskof cervical cancer (Ju et al. 2012), lung cancer(Khan et al. 2012), leukemia (Spagnuolo et al.2012), breast cancer (Zamora-Ros et al. 2013a),colorectal cancer (Zamora-Ros et al. 2013b), andprostate cancer (Adhami et al. 2012).
Flavonoids in quinoa include quercetin gly-cosides (43.4 μmol/100 g dw) and kaempferolglycosides (36.7 43.4 μmol/100 g dw) andare higher than that in buckwheat, whichhas 30.1 μmol/100 g dw quercetin glycosidesand nondetectable kaempferol glycosides(Alvarez-Jubete et al. 2010b). The tempera-ture and length of process can cause the lossof flavonoids in cereals (Sensoy et al. 2006).However, bread made from 100% quinoa flourmaintained most of the flavonoids content(Sensoy et al. 2006).
Isoflavones are a group of flavonoids that actas phytoestrogens in animals and human beings.They also stimulate osteoprogerin secretion,improve bone health, reduce arterial resistance,and exhibit antioxidant activities (Hsu et al. 2001;Teede et al. 2003; Li et al. 2013). Quinoa seed hasbeen shown to contain isoflavones, particularlydaidzein and genistein (Vega-Gálvez et al. 2010).
Anthocyanins are a group of flavonoid con-stituents that provide the bright red-orange toblue-violet colors in the plants. Epidemiologicalstudies showed that intake of anthocyaninsdecreases the development of CVD (Mink et al.2007). The role of anthocyanins in CVD relatestrongly with protection against oxidative stress(Wallace 2011). They provide protection fromDNA cleavage, estrogenic activity, enzyme inhi-bition, increased cytokine production, decreasedcapillary permeability and fagility, and membranestrengthening (Ramirez-Tortosa 2001; Acquavivaet al. 2003; Lazze et al. 2003; Rossi, et al. 2003;Lefevre et al. 2008). A low dose of anthocyaninsintake can reduce ischemia, lower blood pressureand lipid levels, and reduce inflammation inpatients with CVD. Anthocyanin content inquinoa has been reported at 102.4 mg CGE/100 gDW (Pasko et al. 2009), higher than that of
jasmine rice, amaranth, soy bean (Gorinstein et al.2007), and sorghum (Awika et al. 2005).
Carotenoids
Carotenoids are antioxidants, presenting provi-tamin A activity, colorants, and essentialcomponents of plant (Dini et al. 2010). They canquench singlet oxygen, which is an importantreactive oxygen species in light-induced oxy-gen. Carotenoids are also reported to preventage-related macular degeneration (AMD) andbenefit eye health (Alves-Rodrigues and Shao2004). They can reduce the risk of coronary heartdisease, protect from ischemic stroke, and protectskin from UV-induced damage (Alves-Rodriguesand Shao 2004). The carotenoids content in sweetquinoa is 0.4 mg/10 g, greater than the content ineinkorn (0.1 mg/10 g) (Hidalgo and Brandolini2008) and corn (0.07 mg/10 g) (Scot and Eldridge2005). The carotenoids in bitter quinoa are about0.08 mg/10 g.
SUMMARY
Quinoa is called “a complete food” for severalreasons. First, quinoa is high in protein, bothquantitatively and qualitatively. It contains all theessential amino acids, whereas many other cropsare deficient in some of them. For this reason,quinoa is a perfect protein supplement, especiallyfor vegetarians. Second, the lipids of quinoa arecomposed of a large proportion of unsaturatedfatty acids, which bring more health benefitsthan saturated fatty acids. Third, quinoa is richin vitamin B complex, vitamin E, and minerals,which are essential to human health. Last butnot least, bioactive compounds such as phenoliccompounds, flavonoids, and carotenoids in quinoaare the critical antioxidants in diet and providevital health benefits.
REFERENCES
Abeywardena MY, McLennan PL, Charnock JS. 1991. Differen-tial effects of dietary fish oil on myocardial prostaglandin I2and thromboxane A2 production. Am J Physiol - Heart CircPhysiol 260(2):379–385.
206 Quinoa: Improvement and Sustainable Production
Abugoch LEJ. 2009. Chapter 1: Quinoa (Chenopodium quinoaWilld.). Adv Food Nutr Res 58:1–31.
Abugoch LE, Castro E, Tapia C, Añón MC, Gajardo P,Villarroel A. 2009. Stability of quinoa flour proteins(Chenopodium quinoa Willd.) during storage. Int J Food SciTech 44(10):2013–2020.
Abugoch LE, Romero N, Tapia CA, Silva J, Rivera M. 2008.Study of some physicochemical and functional propertiesof quinoa (Chenopodium quinoa Willd) protein isolates.J Agric Food Chem 56(12):4745–4750.
Acquaviva R, Russo A, Galvano F, Galvano G, BarcellonaML, Li VG, Vanella A. 2003. Cyanidin and cyanidin3-O-beta-D-glucoside as DNA cleavage protectors andantioxidants. Cell Biol Toxicol 19(4):243–252.
Adhami VM, Syed DN, Khan N, Mukhtar H. 2012. Dietaryflavonoid fisetin: a novel dual inhibitor of Pi3k/Akt andMtor for prostate cancer management. Biochem Pharmacol84(10):1277–1281.
Ahamed NT, Singhal RS, Kulkami PR, Palb M. 1996. Physic-ochemical and functional properties of Chenopodium orcinoastarch. Carbohyd Polym 31:99–103.
Aluko RE, Monu E. 2003. Functional and bioactive prop-erties of quinoa seed protein hydrolysates. J Food Sci68(4):1254–1258.
Alvarez-Jubete L, Arendt EK, Gallagher E. 2010a. Nutri-tive value of pseudocereals and their increasing use asfunctional gluten-free ingredients. Trends Food Sci Tech21(2):106–113.
Alvarez-Jubete L, Wijngaard H, Arendt EK, Gallagher E. 2010b.Polyphenol composition and in vitro antioxidant activity ofamaranth, quinoa, buckwheat and wheat as affected by sprout-ing and baking. Food Chem 119(2):770–778.
Alves-Rodrigues A, Shao A. 2004. The science behind lutein.Toxicol Lett 150(1):57–83.
Ando H, Chen YC, Tang H, Shimizu M, Watanabe K, MitsunagaT. 2002. Food components in fractions of quinoa seed. FoodSci Technol 8(1):80–84.
Araujo-Farro PC, Podadera G, Sobral GAP, Menegalli FC. 2010.Development of films based on quinoa (Chenopodium quinoaWilld.) starch. Carbohyd Polym 81(4):839–848.
Awika JM, Rooney LW, Waniska RD. 2005. Anthocyanins fromblack sorghum and their antioxidant properties. Food Chem90(2):293–301.
Brend Y. 2012. Total phenolic content and antioxidant activityof red and yellow quinoa (Chenopodium quinoa Willd.) seedsas affected by baking and cooking conditions. Food Nutr Sci3(08):1150–1155.
Cai S, Yu G, Chen X, Huang Y, Jiang X, Zhang G, Jin X. 2013.Grain protein content variation and its association analysis inbarley. BMC Plant Biol 13:35.
Cameron B, Landreth GE. 2010. Inflammation, microglia, andAlzheimer’s Disease. Neurobiol Dis 37(3):503–509.
Camilleri M, Carlson P, McKinzie S, Zucchelli M, D’AmatoM, Busciglio I, Burton D, Zinsmeister AR. 2011. Geneticsusceptibility to inflammation and colonic transit in lower
functional gastrointestinal disorders: preliminary analysis.Neurohastroenterol Motil: Off J Eur Gastrointest Motil Soc23(10):e935–e938.
Chait A, Brunzell JD, Denke MA, Eisenberg D, Ernst ND,Franklin FA, Ginsberg H. 1993. Rationale of the diet-heartstatement of the American Heart Association. Report ofNutrition Committee. Circulation 88(6):3008–3029.
Chan JK, McDonald BE, Gerrard JM, Bruce VM, Weaver BJ,Holub BJ. 1993. Effect of dietary alpha-linolenic acid and itsratio to linoleic acid on platelet and plasma fatty acids andthrombogenesis. Lipids 28(9):811–817.
Chen Z, Schols HA, Voragen AGJ. 2003. Starch granule sizestrongly determines starch noodle processing and noodlequality. Food Chem Toxicol 68(5):1584–1589.
Cotton PA, Subar AF, Friday JE, Cook A. 2004. Dietary sourcesof nutrients among us adults, 1994 to 1996. J Am Diet Assoc104(6):921–930.
Crumpacker CS. 2010. Invited commentary: humancytomegalovirus, inflammation, cardiovascular disease,and mortality. Am J Epidem 172(4):372–374.
Cunnane SC, Thompson LU. 1995. Flaxseed in human nutri-tion. In: Chamberlain JG, Nelson GJ, editors. The effect ofdietary alpha-linolenic acid on blood lipids and lipoproteinsin humans. Champaign, IL: AOAC Press. 1–458.
Damodaran S, Parkin KL, Fennema OR. 2008. Fennema’s foodchemistry. Boca Raton, FL: CRC Press. 1–1160.
Dervilly-Pinel G, Rimsten L, Saulnier L, Andersson R, Åman P.2001. Water-extractable arabinoxylan from pearled flours ofwheat, barley, rye and triticale. Evidence for the presence offerulic acid dimers and their involvement in gel formation.J Cereal Sci 34(2):207–214.
van Dijk SJ, Feskens EJ, Bos MB, Hoelen DW, HeijligenbergR, Bromhaar MG, de Groot LC, de Vries JH, Müller M,Afman LA. 2009. A saturated fatty acid-rich diet induces anobesity-linked proinflammatory gene expression profile inadipose tissue of subjects at risk of metabolic syndrome. AmJ Clin Nutr 90(6):1656–1664.
Dini I, Tenore GC, Dini A. 2010. Antioxidant compound con-tents and antioxidant activity before and after cooking in sweetand bitter Chenopodium quinoa seeds. LWT - Food Sci Tech-nol 43(3):447–451.
Di Sabatino A, Corazza GR. 2009. Coeliac disease. Lancet 373:1480–1493.
Djordjevic TM, Šiler-Marinkovic SS, Dimitrijevic-Brankovic SI.2011. Antioxidant activity and total phenolic content in somecereals and legumes. Int J Food Prop 14(1):175–184.
Donath MY, Shoelson SE. 2011. Type 2 diabetes as an inflamma-tory disease. Nature Rev Immunol 11(2):98–107.
Donoso LA, Kim D, Frost A, Callahan A, Hageman G. 2006. Therole of inflammation in the pathogenesis of age-related macu-lar degeneration. Surv Ophthalmol 51(2):137–152.
Eitenmiller RR, Landen WO. 1999. Vitamin analysis for thehealth and food Sciences. Boca Raton, FL: CRC Press.1–518.
Nutritional Properties of Quinoa 207
Fasano A, Berti I, Gerarduzzi T, Tarcisio Not, Colletti RB, DragoS, Elitsur Y, Green PHR, Guandalini S, Hill ID, Pietzak M,Ventura A, Thorpe M, Kryszak D, Fornaroli F, WassermanSS, Murray JA, Horvath K. 2003. Prevalence of celiac diseasein at-risk and not-at-risk groups in the United States: a largemulticenter study. Arch Intern Med 163(3):286–292.
Fasano A, Catassi C. 2001. Current approaches to diagnosis andtreatment of celiac disease: an evolving spectrum. Gastroen-terology 120(3):636–651.
Faulds CB, Mandalari G, LoCurto R, Bisignano G, WaldronKW. 2004. Arabinoxylan and mono-and dimeric ferulicacid release from brewer’s grain and wheat bran by feruloylesterases and glycosyl hydrolases from Humicola insolens. AppMicrobiol Biotechnol 64(5):644–650.
Ferrero-Miliani L, Nielsen OH, Andersen PS, Girardin SE.2007. Chronic inflammation: importance of Nod2 and Nalp3in interleukin-1& beta generation. Clini Exp Immunol147(2):227–235.
Friedman M, Brandon DL. 2001. Nutritional and health benefitsof soy proteins. J Agric Food Chem 49(3):1069–1086.
Gallagher E, Gormley TR, Arendt EK. 2004. Recent advances inthe formulation of gluten-free cereal-based products. TrendsFood Sci Technol 15(3–4):143–152.
Garg ML, Wierzbicki AA, Thomson AB, Clandinin MT. 1989.Dietary saturated fat level alters the competition betweenalpha-linolenic and linoleic acid. Lipids 24(4):334–339.
Ghosh D, Thejomoorthy P, Veluchamy P 1983. Anti-inflammatoryand analgesic activities of oleanolic acid 3-/3-glucoside(Rdg-1) from Randia dumetorum (Rubiaceae). Indian JPharmacol 15(4):331–342.
Giménez B, Moreno S, López-Caballero ME, Montero P,Gómez-Guillén MC. 2013. Antioxidant properties of greentea extract incorporated to fish gelatin films after simulatedgastrointestinal enzymatic digestion. LWT - Food SciTechnol 53(2):445–451.
Gorinstein S, Vargas OJM, Jaramillo NO, Salas IA, Ayala ALM,Arancibia-Avila P, Toledo F, Katrich E, Trakhtenberg S.2007. The total polyphenols and the antioxidant potentialsof some selected cereals and pseudocereals. Eur Food ResTechnol 225(3–4):321–328.
Gross GG. 1980. Phenolic acids. In: Stumpf PK, Conn Eric E,editors. The biochemistry of plants: a comprehensive treatise.New York, NY: Academic Press. 707 p.
Guo WW, Beta T. 2013. Phenolic acid composition andantioxidant potential of insoluble and soluble dietary fibreextracts derived from select whole-grain cereals. Food ResInt 51(2):518–525.
Hidalgo A, Brandolini A. 2008. Protein, ash, lutein and tocolsdistribution in einkorn (Triticum monococcum L. subsp. mono-coccum) seed fractions. Food Chem 107(1):444–448.
Hoffenberg EJ, MacKenzie T, Barriga KJ, Eisenbarth GS, BaoF, Haas JE, Erlich H, Bugawan TL, Sokol RJ, Taki I, NorrisJM, Rewers M. 2003. A prospective study of the incidence ofchildhood celiac disease. J Pediatr 143(3):308–314.
Hovdenak N, Hovlid E, Aksnes L, Fluge G, Erichsen MM,Eide J. 1999. High prevalence of asymptomatic coeliac diseasein Norway. Eur J Gastroenterol Hepatol 11(2):185–188.
Hsu CS, Shen WW, Hsueh YM, Yeh SL. 2001. Soy isoflavonesupplementation in postmenopausal women. Effects onplasma lipids, antioxidant enzyme activities and bone density.J Reprod Med 46(3):221–226.
Hu FB, Manson JE, Willett WC. 2001. Types of dietary fat andrisk of coronary heart disease: a critical review. J Am Coll Nutr20(1):5–19.
Hu FB, Stampfer MJ, Manson JE, Rimm EB, Wolk A, ColditzGA, Hennekens CH, Willett WC. 1999. Dietary intake ofa-linolenic acid and risk of fatal ischemic heart disease amongwomen. Am J Clin Nutr 69(5):890–897.
Hunnicutt JW, Hardy RW, Williford J, McDonald JM. 1994. Sat-urated fatty acid-induced insulin resistance in rat adipocytes.Diabetes 43(4):540–545.
Ikegawa T, Mayama S, Nakayashiki H, Kato H. 1996. Accumula-tion of diferulic acid during the hypersensitive response of oatleaves Topuccinia coronata f.sp. avenae and its role in the resis-tance of oat tissues to cell wall degrading enzymes. PhysiolMol Plant Pathol 48(4):245–256.
Ilhami AU, Mshvildadze V, Gepdiremen A, Elias R.2006. The antioxidant activity of a triterpenoid gly-coside isolated from the berries of Hedera colchica:3-O-(B-D-Glucopyranosyl)-Hederagenin. Phytother Res20(2):130–134.
Jacobs D, Blackburn H, Higgins M, Reed D, Iso H, McMillan G,Neaton J, Potter J, Rifkind B. 1992. Report of the conferenceon low blood cholesterol: mortality associations. Circulation86(3):1046–1060.
Jancurová M, Minarovicova L, Dandar A. 2009. Quinoa – areview. Czech J Food Sci 27(2):71–79.
Jones RW. 2001. Inflammation and Alzheimer’s disease. Lancet358(9280):436–437.
Ju HK, Lee HW, Chung KS, Choi JH, Cho JG, Baek NI, ChungHG, Lee TK. 2012. Standardized flavonoid-rich fraction ofArtemisia princeps Pampanini cv. Sajabal induces apoptosis viamitochondrial pathway in human cervical cancer Hela cells.J Ethnopharmacol 141(1):460–468.
Juliano BO. 1985. Rice: chemistry and technology. Saint Paul,MN: American Association of Cereal Chemists. 774 p.
Karadag A, Ozcelik B, Saner S. 2009. Review of methods to deter-mine antioxidant capacities. Food Anal Methods 2(1):41–60.
Keller AC, Ma J, Kavalier A, He K, Brillantes AM, KennellyEJ. 2011. Saponins from the traditional medicinal plantMomordica charantia stimulate insulin secretion in vitro.Phytomed 19(1):32–37.
Khan N, Afaq F, Khusro FH, Mustafa Adhami V, Suh Y,Mukhtar H. 2012. Dual inhibition of phosphatidylinositol3-kinase/Akt and mammalian target of rapamycin signalingin human non-small cell lung cancer cells by a dietaryflavonoid fisetin. Int J Cancer 130(7):1695–1705.
Khan K, Shewry PR. 2009. Wheat: chemistry and technology.Saint Paul, MN: AACC International. 1–476.
208 Quinoa: Improvement and Sustainable Production
Kim SK, Byun HG, Park PJ, Shahidi F. 2001. Angiotensin I con-verting enzyme inhibitory peptides purified from bovine skingelatin hydrolysate. J Agric Food Chem 49(6):2992–2997.
Kline K, Lawson KA, Yu W, Sanders BG. 2007. Vitamin E andcancer. Vitam Horm 76:435–461.
Konishi Y, Hirano S, Tsuboi H, Wada M. 2004. Distribution ofminerals in quinoa (Chenopodium quinoa Willd.) seeds. BiosciBiotechnol Biochem 68(1):231–234.
Koziol MJ. 1992. Chemical composition and nutritional evalu-ation of quinoa (Chenopodium quinoa Willd.). J Food CompAnal 5:35–68.
Kozlov SV. 2009. Inflammation and cancer methods and proto-cols. [Internet] New York, NY: Humana Press. Available from:10.1007/978-1-60327-530-9
Kris-Etherton PM, Keen CL. 2002. Evidence that the antioxidantflavonoids in tea and cocoa are beneficial for cardiovascularhealth. Curr Op Lipidol 13(1):41–49.
Kroon PA, Williamson G. 1999. Hydroxycinnamates in plantsand food: current and future perspectives. J Sci Food Agric79(3):355.
Kuljanabhagavad T, Wink M. 2009. Biological activities andchemistry of saponins from Chenopodium quinoa Willd.Phytochem Rev 8(2): 473–490.
Lamport DJ, Dye L, Wightman JD, Lawton CL. 2012. Theeffects of flavonoid and other polyphenol consumptionon cognitive performance: a systematic research review ofhuman experimental and epidemiological studies. NutrAging 1(1):5–25.
Lazze MC, Pizzala R, Savio M, Stivala LA, Prosperi E, BianchiL. 2003. Anthocyanins protect against DNA damage inducedby tert-butyl-hydroperoxide in rat smooth muscle andhepatoma cells. Mutat Res Genet Toxicol Environ Mutagen535(1):103–115.
Lefevre M, Wiles JE, Zhang X, Howard LR, Gupta S, Smith AA,Ju ZY, DeLany JP. 2008. Gene expression microarray anal-ysis of the effects of grape anthocyanins in mice: a test of ahypothesis-generating paradigm. Metabolism 57:S52-S57.
Leopoldini M, Russo N, Chiodo S, Toscano M. 2006. Iron chela-tion by the powerful antioxidant flavonoid quercetin. J AgricFood Chem 54(17):6343–6351.
Li Y, Kong D, Ahmad A, Bao B, Sarkar FH. 2013. Antioxidantfunction of isoflavone and 3,3-diindolylmethane: are theyimportant for cancer prevention and therapy? Antioxid RedoxSignaling 19 (2):139–150.
Lindeboom N, Chang PR, Falk KC, Tyler RT. 2005. Char-acteristics of starch from eight quinoa lines. Cereal Chem82(2):216–222.
Lindeboom N, Chang PR, Tyler RT. 2004. Analytical, biochem-ical and physicochemical aspects of starch granule size, withemphasis on small granule starches: a review. Starch - Stärke56(34):89–99.
Lovejoy JC. 1999. Dietary fatty acids and insulin resistance. CurrAtheroscler Rep 1(3):215–220.
Lovejoy JC, DiGirolamo M. 1992. Habitual dietary intake andinsulin sensitivity in lean and obese adults. Am J Clin Nutr55(6):1174–1179.
Ma WW, Heinstein PF, McLaughlin JL. 1989. Additional toxic,bitter saponins from the seeds of Chenopodium quinoa. J NatProd 52(5):1132–1135.
Mathieu P, Lemieux I, Després JP. 2010. Obesity, inflammation,and cardiovascular risk. Clin Pharmacol Ther 87(4):407–416.
Mattila P, Pihlava JM, Hellström J. 2005. Contents of phenolicacids, alkyl- and alkenylresorcinols, and avenanthramidesin commercial grain products. J Agric Food Chem53(21):8290–8295.
Maxwell SRJ, Lip GYH. 1997. Free radicals and antioxidants incardiovascular disease. Br J Clin Pharmacol 44(4):307.
McCullough ML, Peterson JJ, Patel R, Jacques PF, Shah R,Dwyer JT. 2012. Flavonoid intake and cardiovascular diseasemortality in a prospective cohort of us adults. Am J ClinNutr 95(2):454–464.
Min B, Gu LW, McClung AM, Bergman CJ, Chen MH. 2012.Free and bound total phenolic concentrations, antioxidantcapacities, and profiles of proanthocyanidins and antho-cyanins in whole grain rice (Oryza sativa L.) of different brancolours. Food Chem 133(3):715–722.
Mink PJ, Scrafford CG, Barraj LM, Harnack L, Hong CP, Net-tleton JA, Jacobs DR. 2007. Flavonoid intake and cardiovascu-lar disease mortality: a prospective study in postmenopausalwomen. Am J Clin Nutr 85(3):895–909.
Mujica A. 1994. Andean grains and legumes. Leon J, BermejoJEH. Neglected crops: 1492 from a different perspective.Rome: FAO, Plant Production and Protection. 1–341.
Myasoedova E, Crowson CS, Kremers HM, Roger VL,Fitz-Gibbon PD, Therneau TM, Gabriel SE. 2011. Lipidparadox in rheumatoid arthritis: the impact of serumlipid measures and systemic inflammation on the risk ofcardiovascular disease. Ann Rheum Dis 70(3):482–487.
Ng SC, Anderson A, Coker J, Ondrus M. 2007. Characterizationof lipid oxidation products in quinoa (Chenopodium quinoa).Food Chem 101(1):185–192.
Ogungbenle HN. 2003. Nutritional evaluation and functionalproperties of quinoa (Chenopodium quinoa) flour. Int J FoodSci Nutr 54(2):153–158.
Ohman L, Simrén M. 2010. Pathogenesis of Ibs: role ofinflammation, immunity and neuroimmune interactions.Nature Reviews. Gastroenterol Hepatol 7(3):163–173.
Oliver E, McGillicuddy F, Phillips C, Toomey S, Roche HM.2010. Postgraduate symposium: the role of inflammation andmacrophage accumulation in the development of obesity-induced Type 2 Diabetes mellitus and the possible therapeuticeffects of long-chain N-3. Proc Nutr Soc 69(2):232–243.
Papas A, Vos E. 2001. Vitamin E, cancer, and apoptosis. Am J ClinNutr 73(5):1113–1114.
Pasko P, Barton H, Zagrodzki P, Gorinstein S, Fołta M, Zach-wieja Z. 2009. Anthocyanins, total polyphenols and antioxi-dant activity in amaranth and quinoa seeds and sprouts duringtheir growth. Food Chem 115(3):994–998.
Nutritional Properties of Quinoa 209
Pasko P, Sajewicz M, Gorinstein S, Zachwieja Z. 2008. Analysis ofselected phenolic acids and flavonoids in Amaranthus cruentusand Chenopodium quinoa seeds and sprouts by HPLC. ActaChromatogr 20(4):661–672.
Prego I, Maldonado S, Otegui M. 1998. Seed structure andlocalization of reserves in Chenopodium quinoa. Ann Bot82:481–488.
Pryor WA. 2000. Vitamin E and heart disease: basic sci-ence to clinical intervention trials. Free Radic Biol Med28(1):141–164.
Przedborski S. 2010. Inflammation and Parkinson’s Diseasepathogenesis. Mov Disord 25(1):55–57.
Raju J, Rao CV. 2012. Diosgenin, a steroid saponin constituentof yams and fenugreek: emerging evidence for applications inmedicine. [Internet]. INTECH Open Access Publisher. Avail-able from: http://www.intechopen.com/articles/show/title/diosgenin-a-steroid-saponin-constituent-of-yams-and-fenugreek-emerging-evidence-for-applications-in-
Ramirez-Tortosa C. 2001. Anthocyanin-rich extract decreasesindices of lipid peroxidation and DNA damage in vitaminE-depleted rats. Free Radic Biol Med 31(9):1033–1037.
Ranhotra GS, Gelroth JA, Glaser BK, Lorenz KJ, Johnson DL.1993. Composition and protein nutritional quality of quinoa.Cereal Chem 70(3):303–305.
Renaud S, Nordøy A. 1983. Small is beautiful: alpha-linolenicacid and eicosapentaenoic acid in man. Lancet 1(8334):1169.
Rieder CR, Fricke D. 2001. Vitamin B12 and folate in relationto the development of Alzheimer’s Disease. Neurology57(9):1742–1743.
Rimm EB, Willett WC, Hu FB, Sampson L, Colditz GA,Manson JE, Hennekens C, Stampfer MJ. 1998. Folate andvitamin B6 from diet and supplements in relation to risk ofcoronary heart disease among women. JAMA: J Am MedAssoc 279(5):359–364.
Rossi A, Serraino I, Dugo P, Di Paola R, Mondello L, GenoveseT, Morabito D, Dugo G, Sautebin L, Caputi AP, CuzzocreaS. 2003. Protective effects of anthocyanins from blackberryin a rat model of acute lung inflammation. Free Radic Res37(8):891–900.
Ruales J, de Grijalva Y, Lopez-Jaramillo P, Nair BM. 2002. Thenutritional quality of an infant food from quinoa and its effecton the plasma level of insulin-like growth factor-1 (Igf-1) inundernourished children. Int J Food Sci Nutr 53(2):143–154.
Sacks FM, Katan M. 2002. Randomized clinical trials on theeffects of dietary fat and carbohydrate on plasma lipoproteinsand cardiovascular disease. Am J Med 113(9B):13–24.
Salmerón J, Hu FB, Manson JE, Stampfer MJ, Colditz GA,Rimm EB, Willett WC. 2001. Dietary fat intake and risk ofType 2 diabetes in women. Am J Clin Nutr 73:1019–1026.
San Martin R, Ndjoko K, Hostettmann K. 2008. Novelmolluscicide against Pomacea canaliculata based on quinoa(Chenopodium quinoa) saponins. Crop Prot 27(3–5):310–319.
Scot CE, Eldridge AL. 2005. Comparison of carotenoid contentin fresh, frozen and canned corn. J Food Comp Anal18(6):551–559.
Sensoy I, Rosen RT, Ho CT, Mukund VK. 2006. Effect of pro-cessing on buckwheat phenolics and antioxidant activity. FoodChem 99(2):388–393.
Skarupski KA, Tangney C, Li H, Ouyang B, Evans DA, MorrisMC. 2010. Longitudinal association of vitamin B-6, folate,and vitamin B-12 with depressive symptoms among olderadults over time. Am J Clin Nutr 92(2):330–335.
Song XM, Hu SH. 2009. Adjuvant activities of saponins from tra-ditional Chinese medicinal herbs. Vaccine 27(36):4883–4890.
Soobrattee MA, Neergheen VS, Luximon-Ramma A, AruomaOI, Bahorun T. 2005. Phenolics as potential antioxidant ther-apeutic agents: mechanism and actions. Mutat Res Fund MolMech Mut 579(1–2):200–213.
Spagnuolo C, Russo M, Bilotto S, Tedesco I, Laratta B, RussoGL. 2012. Dietary polyphenols in cancer prevention: theexample of the flavonoid quercetin in leukemia. Ann NYAcad Sci 1259(1):95–103.
Stuardo M, San Martín R. 2008. Antifungal properties of quinoa(Chenopodium quinoa Willd.) alkali treated saponins againstBotrytis cinerea. Ind Crop Prod 27(3):296–302.
Sun B, Karin M. 2012. Obesity, inflammation and liver cancer.J Hepatol 56(3):704–713.
Takao T, Watanabe N, Yuhara K, Itoh S, Suda S, Tsuruoka Y,Nakatsugawa K, Konishi Y. 2005. Hypocholesterolemic effectof protein isolated from quinoa (Chenopodium quinoa Willd.)seeds. Food Sci Technol Res 11(2):161–167.
Tang H. 2004. Relationship between functionality and structurein barley starches. Carbohydr Polym 57(2):145–152.
Tang H, Mitsunaga T, Kawamura Y. 2005. Functionality ofstarch granules in milling fractions of normal wheat grain.Carbohydr Polym 59(1):11–17.
Tang CH, Ten Z, Wang XS, Yang XQ. 2006. Physicochemical andfunctional properties of hemp (Cannabis sativa L.) protein iso-late. J Agric Food Chem 54(23):8945–8950.
Tang H, Yoshida T, Watanabe K, Mitsunaga T. 1998. Someproperties of starch granules in various plants. KinkiDaigaku Nougaku Sougou Kenkyusho Houkoku 6:83–89 [inJapanese].
Teede HJ, McGrath BP, DeSilva L, Cehun M, Fassoulakis A,Nestel PJ. 2003. Isoflavones reduce arterial stiffness: aplacebo-controlled study in men and postmenopausalwomen. Arterioscler Thromb Vasc Biol 23(6):1066–1071.
Trumbo PR. 2005. The level of evidence for permitting aqualified health claim: FDA’s review of the evidence forselenium and cancer and Vitamin E and heart Disease. J Nutr135(2):354–356.
Ubbink JB, Vermaak WJ, van der Merwe A, Becker PJ. 1993.Vitamin B-12, Vitamin B-6, and folate nutritional status inmen with hyperhomocysteinemia. Am J Clin Nutr 57(1):47–53.
[USDA] U.S. Department of Agriculture, Agricultural ResearchService. (2011) [Internet]. USDA national nutrient databasefor standard reference, Release 18. Nutrient Data LaboratoryHome Page. Available from: http://ndb.nal.usda.gov/.
210 Quinoa: Improvement and Sustainable Production
[USDA] U.S. Department of Agriculture, Agricultural ResearchService. (2005) [Internet]. Dietary reference intakes:macronutrients. National Academy of Sciences. Instituteof Medicine. Food and Nutrition Board. Available from:http://www.nal.usda.gov/fnic/DRI/DRI_Energy/energy_full_report.pdf.
Valencia-Chamorro SA. 2003. Quinoa. Caballero B. Encyclopediaof food science and nutrition, 8. Amsterdam, The Nether-lands: Academic Press. 4895–4902.
Vega-Gálvez A, Miranda M, Vergara J, Uribe E, Puente L,Martínez EA. 2010. Nutrition facts and functional potentialof quinoa (Chenopodium quinoa Willd.), an ancient Andeangrain: a review. J Sci Food Agric 90(15):2541–2547.
Wallace TC. 2011. Anthocyanins in cardiovascular disease. AdvNutr 2(1):1–7.
Wang M, Hettiarachchy NS, Qi M, Burks W, Siebenmorgen T.1999. Preparation and functional properties of rice bran pro-tein isolate. J Agric Food Chem 47(2):411–416.
Watanabe K, Peng NL, Tang H, Misunaga T. 2007. Molecularstructural characteristics of quinoa starch. Food Sci TechnolRes 13(1):73–76.
Wedick NM, Pan A, Cassidy A, Rimm EB, Sampson L, RosnerB, Willett W, Hu FB, Sun Q, van Dam RM. 2012. Dietaryflavonoid intakes and risk of Type 2 diabetes in US men andwomen. Am J Clin Nutr 95(4):925–933.
West J, Logan RFA, Hill PG, Lloyd A, Lewis S, Hubbard R,Reader R, Holmes GKT, Khaw KT. 2003. Seroprevalence,correlates, and characteristics of undetected coeliac disease inEngland. Gut 52(7):960–965.
Wilson JD, Bechtel DB, Todd TC, Seib PA. 2006. Measurementof wheat starch granule size distribution using imageanalysis and laser diffraction technology. Cereal Chem J83(3):259–268.
Wink M. 2004. Phytochemical diversity of secondary metabolites.Encyclopedia of plant & crop science. New York, NY: MarcelDekker. 1–1329.
Woldemichael GM, Wink M. 2001. Identification and biologicalactivities of triterpenoid saponins from Chenopodium quinoa.J Agric Food Chem 49(5):2327–2332.
Woldemichael GM, Wink M. 2009. Biological activities andchemistry of saponins from Chenopodium quinoa Willd.Phytochem Rev 8(2):473–490.
Wright KH, Pike OA, Fairbanks DJ, Huber CS. 2002. Composi-tion of Atriplex hortensis, sweet and bitter Chenopodium quinoaseeds. J Food Sci 67(4):1383–1385.
Wu J, Ding X. 2001. Hypotensive and physiological effect ofangiotensin converting enzyme inhibitory peptides derivedfrom soy protein on spontaneously hypertensive rats. J AgricFood Chem 49(1):501–506.
Wymann MP, Solinas G. 2013. Inhibition of phosphoinositide3-kinase attenuates inflammation, obesity, and cardiovascularrisk factors. Ann NY Acad Sci 1280(1):44–47.
Yadav MP, Moreau RA, Hicks KB. 2007. Phenolic acids, lipids,and proteins associated with purified corn fiber arabinoxylans.J Agric Food Chem 55(3):943–947.
Yang Q, Cogswell ME, Hamner HC, Carriquiry A, BaileyLB, Pfeiffer CM, Berry RJ. 2010. Folic acid source, usualintake, and folate and Vitamin B-12 status in US adults:national health and nutrition examination survey (Nhanes)2003–2006. Am J Clin Nutr 91(1):64–72.
Yin J, Becker EM, Andersen ML, Skibsted LH. 2012. Green teaextract as food antioxidant. Synergism and antagonism withA-tocopherol in vegetable oils and their colloidal systems.Food Chem 135(4):2195–2202.
Yuan XP, Wang J, Yao H. 2005. Antioxidant activity of fer-uloylated oligosaccharides from wheat bran. Food Chem90(4):759–764.
Zamora-Ros R, Ferrari P, González CA, Tjønneland A, OlsenA, Bredsdorff L, Overvad K, Touillaud M, Perquier F,Fagherazzi G, Lukanova A, Tikk K, Aleksandrova K, BoeingH, Trichopoulou A, Trichopoulos D, Dilis V, Masala G, SieriS, Mattiello A, Tumino R, Ricceri F, Bueno-de-MesquitaHB, Peeters PH, Weiderpass E, Skeie G, Engeset D,Menéndez V, Travier N, Molina-Montes E, Amiano P,Chirlaque MD, Barricarte A, Wallström P, Sonestedt E,Sund M, Landberg R, Khaw KT, Wareham NJ, Travis RC,Scalbert A, Ward HA, Riboli E, Romieu I. 2013a. Dietaryflavonoid and lignan intake and breast cancer risk accordingto menopause and hormone receptor status in the EuropeanProspective Investigation into Cancer and Nutrition (EPIC)study. Breast Cancer Res Treat 139(1):163–176.
Zamora-Ros R, Not C, Guinó E, Luján-Barroso L, García RM,Biondo S, Salazar R, Moreno V. 2013b. Association betweenhabitual dietary flavonoid and lignan intake and colorectalcancer in a Spanish case–control study (the BellvitgeColorectal Cancer study). Cancer Causes Control 24(3):549–557.
Zhou K, Yin JJ, Yu LL. 2005. Phenolic acid, tocopherol andcarotenoid compositions, and antioxidant functions of hardred winter wheat bran. J Agric Food Chem 53(10):3916–3922.
Chapter 12
Quinoa’s Calling
Sergio Núñez de ArcoQuinoa Specialist and Co-Founder, Andean Naturals, Inc., 393 Catamaran St., Foster City, CA, USA
INTRODUCTION
It is February 20, 2013, at the General Assemblyof the United Nations in New York. Quinoa, therediscovered staple of the Andean civilizations, isthrust into the limelight. It is the launching of theInternational Year of Quinoa (IYQ). The actingpresident of the UN opens the 64th Plenary Meet-ing with these words:
Too often in the past, we have heard extrava-gant claims for the benefits of different foods,but it is my opinion that, in quinoa, we trulyhave a plant that deserves the title of ‘superfood.’ In many ways, this traditional staple ofthe Andes region represents many of the ide-als and goals of the United Nations. It has animportant role to play in ensuring food secu-rity, boosting nutrition and, ultimately, erad-icating poverty. It also brings attention to theimportance that the United Nations attachesto indigenous knowledge and practice.
José Graziano da Silva, head of the FAO, fur-ther emphasizes the role that quinoa is expectedto play: “We are here to recruit a new ally in com-bating hunger and food insecurity – quinoa.”
Fast forward to December 31, 2013, the lastday of the Year of Quinoa. A storekeeper in a smallopen market in La Paz, Bolivia complains thatprices for quinoa have gone up so much that sales
Quinoa: Improvement and Sustainable Production, First Edition. Edited by Kevin Murphy and Janet Matanguihan.© 2015 John Wiley & Sons, Inc. Published 2015 by John Wiley & Sons, Inc.
are slow for this item. “People complain aboutthe price. They can get three bags of rice insteadof one of quinoa.” Bolivia is the second poorestcountry in the Western Hemisphere and theworld’s leading producer of quinoa. Even there,quinoa prices have doubled in 2013 reaching ahistorical high of $4/lb.
In the United States, the main consumer ofquinoa worldwide, quinoa prices are also set todouble. Quinoa packed for retail is going from$4/lb in September 2013 to $6–9/lb dependingon the presentation and retailer (Fig. 12.1).Quinoa is quickly gaining the reputation of anexclusive fancy food, a food for the wealthy:exactly the opposite of what the United Nationsenvisions.
As 2013 came to an end, the quinoa market wasrife with speculation. Prices were at a peak andno one can predict how this will impact demand.The 2014 quinoa crops in both Peru and Boliviawere expected to be at least 30% larger thanthose of previous years, and there will be addedcompetition on the market from nontraditionalquinoa-producing countries.
This is the quinoa conundrum: The UN desiresquinoa to be cheap, widespread, and accessible tothe poor; yet 45,000 smallholder farmers in theAndes recently lifted out of poverty are gratefulfor high prices. Could quinoa both provide fairincomes for thousands of smallholder farmers andbecome a healthy, inexpensive staple to the poor ofthe world?
211
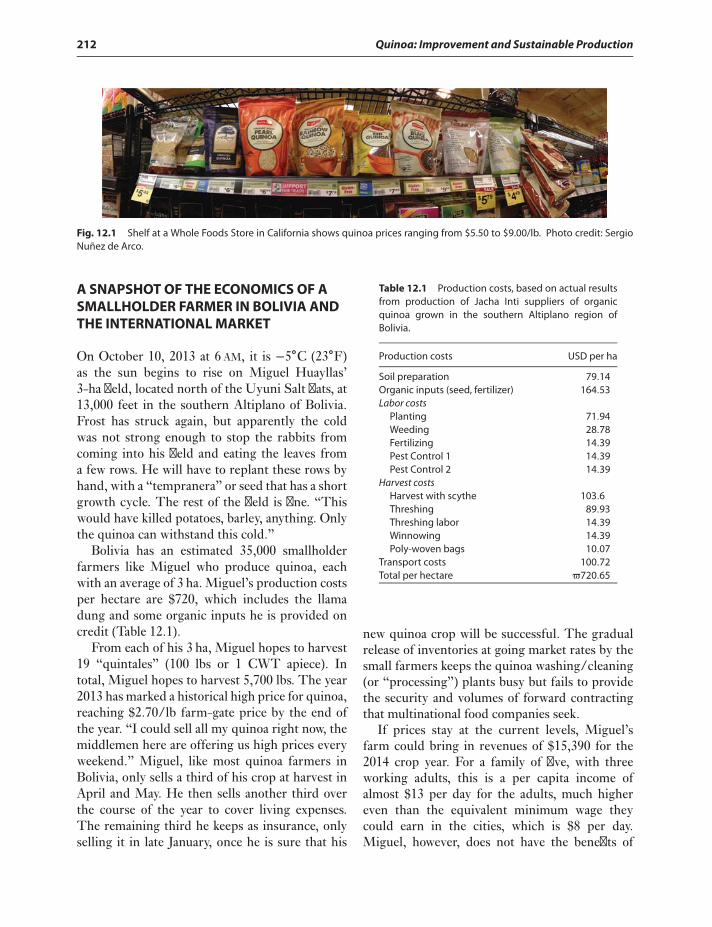
212 Quinoa: Improvement and Sustainable Production
Fig. 12.1 Shelf at a Whole Foods Store in California shows quinoa prices ranging from $5.50 to $9.00/lb. Photo credit: SergioNuñez de Arco.
A SNAPSHOT OF THE ECONOMICS OF ASMALLHOLDER FARMER IN BOLIVIA ANDTHE INTERNATIONAL MARKET
On October 10, 2013 at 6 AM, it is −5∘C (23∘F)as the sun begins to rise on Miguel Huayllas’3-ha field, located north of the Uyuni Salt flats, at13,000 feet in the southern Altiplano of Bolivia.Frost has struck again, but apparently the coldwas not strong enough to stop the rabbits fromcoming into his field and eating the leaves froma few rows. He will have to replant these rows byhand, with a “tempranera” or seed that has a shortgrowth cycle. The rest of the field is fine. “Thiswould have killed potatoes, barley, anything. Onlythe quinoa can withstand this cold.”
Bolivia has an estimated 35,000 smallholderfarmers like Miguel who produce quinoa, eachwith an average of 3 ha. Miguel’s production costsper hectare are $720, which includes the llamadung and some organic inputs he is provided oncredit (Table 12.1).
From each of his 3 ha, Miguel hopes to harvest19 “quintales” (100 lbs or 1 CWT apiece). Intotal, Miguel hopes to harvest 5,700 lbs. The year2013 has marked a historical high price for quinoa,reaching $2.70/lb farm-gate price by the end ofthe year. “I could sell all my quinoa right now, themiddlemen here are offering us high prices everyweekend.” Miguel, like most quinoa farmers inBolivia, only sells a third of his crop at harvest inApril and May. He then sells another third overthe course of the year to cover living expenses.The remaining third he keeps as insurance, onlyselling it in late January, once he is sure that his
Table 12.1 Production costs, based on actual resultsfrom production of Jacha Inti suppliers of organicquinoa grown in the southern Altiplano region ofBolivia.
Production costs USD per ha
Soil preparation 79.14Organic inputs (seed, fertilizer) 164.53Labor costs
Planting 71.94Weeding 28.78Fertilizing 14.39Pest Control 1 14.39Pest Control 2 14.39
Harvest costsHarvest with scythe 103.6Threshing 89.93Threshing labor 14.39Winnowing 14.39Poly-woven bags 10.07
Transport costs 100.72Total per hectare ϖ720.65
new quinoa crop will be successful. The gradualrelease of inventories at going market rates by thesmall farmers keeps the quinoa washing/cleaning(or “processing”) plants busy but fails to providethe security and volumes of forward contractingthat multinational food companies seek.
If prices stay at the current levels, Miguel’sfarm could bring in revenues of $15,390 for the2014 crop year. For a family of five, with threeworking adults, this is a per capita income ofalmost $13 per day for the adults, much highereven than the equivalent minimum wage theycould earn in the cities, which is $8 per day.Miguel, however, does not have the benefits of
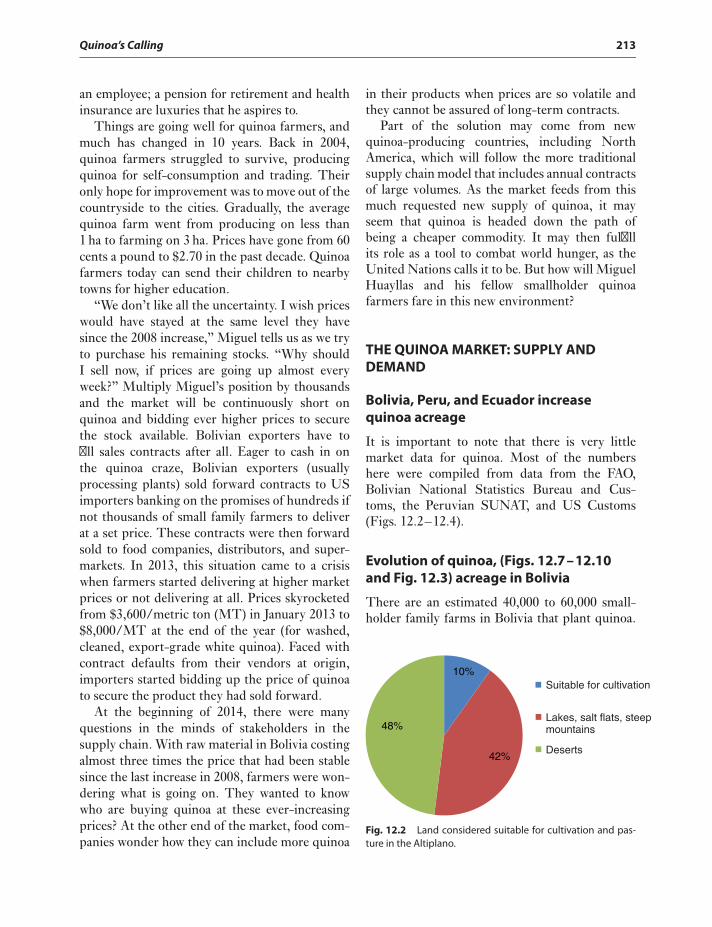
Quinoa’s Calling 213
an employee; a pension for retirement and healthinsurance are luxuries that he aspires to.
Things are going well for quinoa farmers, andmuch has changed in 10 years. Back in 2004,quinoa farmers struggled to survive, producingquinoa for self-consumption and trading. Theironly hope for improvement was to move out of thecountryside to the cities. Gradually, the averagequinoa farm went from producing on less than1 ha to farming on 3 ha. Prices have gone from 60cents a pound to $2.70 in the past decade. Quinoafarmers today can send their children to nearbytowns for higher education.
“We don’t like all the uncertainty. I wish priceswould have stayed at the same level they havesince the 2008 increase,” Miguel tells us as we tryto purchase his remaining stocks. “Why shouldI sell now, if prices are going up almost everyweek?” Multiply Miguel’s position by thousandsand the market will be continuously short onquinoa and bidding ever higher prices to securethe stock available. Bolivian exporters have tofill sales contracts after all. Eager to cash in onthe quinoa craze, Bolivian exporters (usuallyprocessing plants) sold forward contracts to USimporters banking on the promises of hundreds ifnot thousands of small family farmers to deliverat a set price. These contracts were then forwardsold to food companies, distributors, and super-markets. In 2013, this situation came to a crisiswhen farmers started delivering at higher marketprices or not delivering at all. Prices skyrocketedfrom $3,600/metric ton (MT) in January 2013 to$8,000/MT at the end of the year (for washed,cleaned, export-grade white quinoa). Faced withcontract defaults from their vendors at origin,importers started bidding up the price of quinoato secure the product they had sold forward.
At the beginning of 2014, there were manyquestions in the minds of stakeholders in thesupply chain. With raw material in Bolivia costingalmost three times the price that had been stablesince the last increase in 2008, farmers were won-dering what is going on. They wanted to knowwho are buying quinoa at these ever-increasingprices? At the other end of the market, food com-panies wonder how they can include more quinoa
in their products when prices are so volatile andthey cannot be assured of long-term contracts.
Part of the solution may come from newquinoa-producing countries, including NorthAmerica, which will follow the more traditionalsupply chain model that includes annual contractsof large volumes. As the market feeds from thismuch requested new supply of quinoa, it mayseem that quinoa is headed down the path ofbeing a cheaper commodity. It may then fulfillits role as a tool to combat world hunger, as theUnited Nations calls it to be. But how will MiguelHuayllas and his fellow smallholder quinoafarmers fare in this new environment?
THE QUINOA MARKET: SUPPLY ANDDEMAND
Bolivia, Peru, and Ecuador increasequinoa acreage
It is important to note that there is very littlemarket data for quinoa. Most of the numbershere were compiled from data from the FAO,Bolivian National Statistics Bureau and Cus-toms, the Peruvian SUNAT, and US Customs(Figs. 12.2–12.4).
Evolution of quinoa, (Figs. 12.7–12.10and Fig. 12.3) acreage in Bolivia
There are an estimated 40,000 to 60,000 small-holder family farms in Bolivia that plant quinoa.
Suitable for cultivation
Lakes, salt flats, steepmountains
Deserts
48%
10%
42%
Fig. 12.2 Land considered suitable for cultivation and pas-ture in the Altiplano.
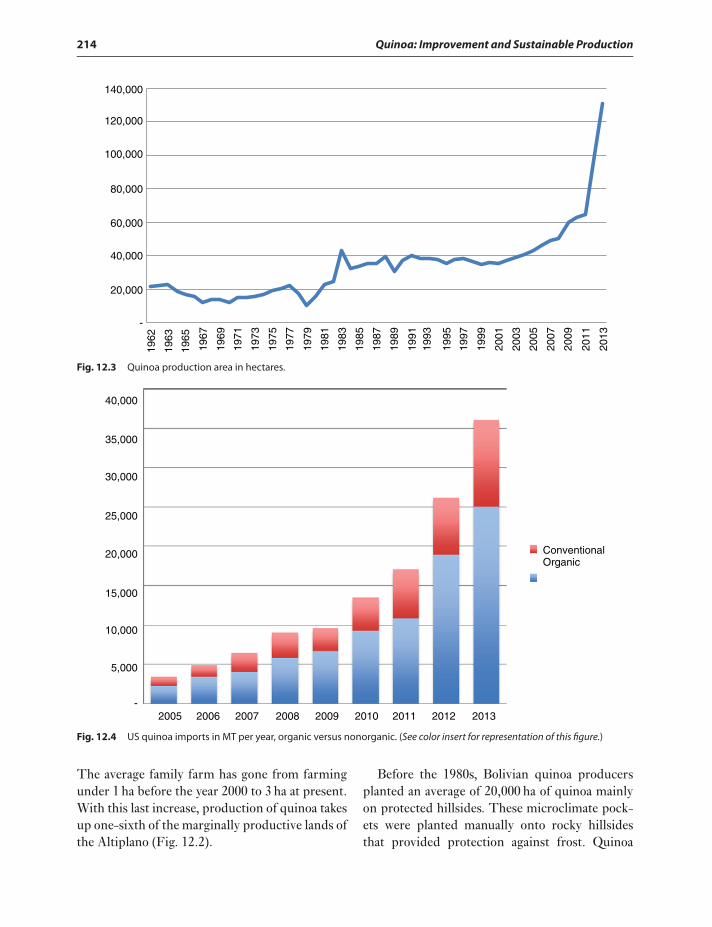
214 Quinoa: Improvement and Sustainable Production
-
140,000
120,000
100,000
80,000
60,000
40,000
20,000
1962
1963
1965
1967
1969
1971
1973
1975
1977
1979
1981
1983
1985
1987
1989
1991
1993
1995
1997
1999
2001
2003
2005
2007
2009
2011
2013
Fig. 12.3 Quinoa production area in hectares.
40,000
35,000
30,000
25,000
20,000
15,000
10,000
5,000
-2005 2006 2007 2008 2009 2010 2011 2012 2013
ConventionalOrganic
Fig. 12.4 US quinoa imports in MT per year, organic versus nonorganic. (See color insert for representation of this figure.)
The average family farm has gone from farmingunder 1 ha before the year 2000 to 3 ha at present.With this last increase, production of quinoa takesup one-sixth of the marginally productive lands ofthe Altiplano (Fig. 12.2).
Before the 1980s, Bolivian quinoa producersplanted an average of 20,000 ha of quinoa mainlyon protected hillsides. These microclimate pock-ets were planted manually onto rocky hillsidesthat provided protection against frost. Quinoa
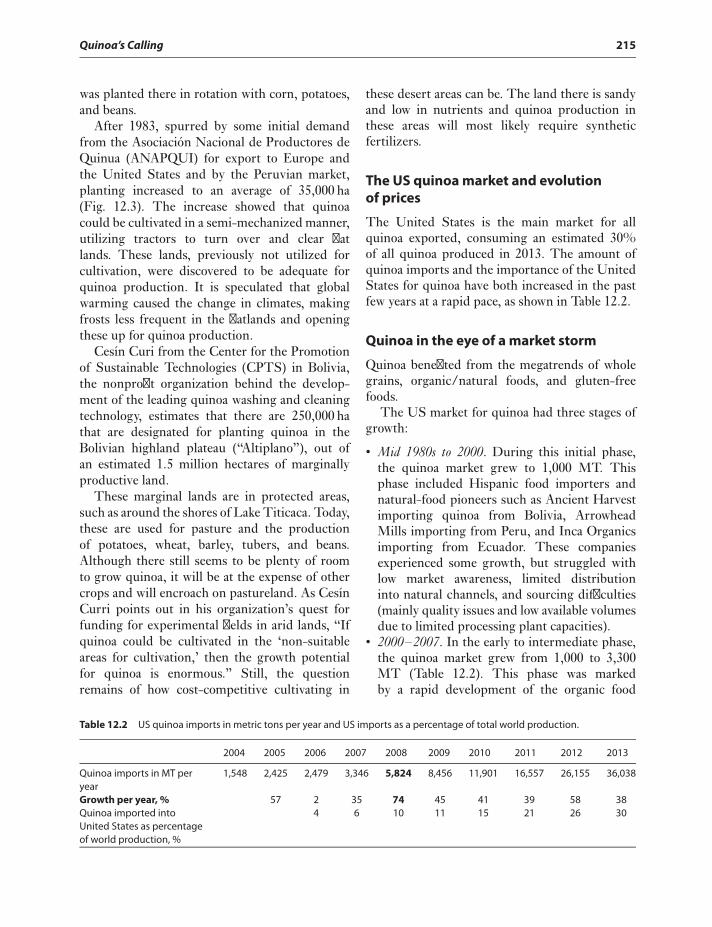
Quinoa’s Calling 215
was planted there in rotation with corn, potatoes,and beans.
After 1983, spurred by some initial demandfrom the Asociación Nacional de Productores deQuinua (ANAPQUI) for export to Europe andthe United States and by the Peruvian market,planting increased to an average of 35,000 ha(Fig. 12.3). The increase showed that quinoacould be cultivated in a semi-mechanized manner,utilizing tractors to turn over and clear flatlands. These lands, previously not utilized forcultivation, were discovered to be adequate forquinoa production. It is speculated that globalwarming caused the change in climates, makingfrosts less frequent in the flatlands and openingthese up for quinoa production.
Cesín Curi from the Center for the Promotionof Sustainable Technologies (CPTS) in Bolivia,the nonprofit organization behind the develop-ment of the leading quinoa washing and cleaningtechnology, estimates that there are 250,000 hathat are designated for planting quinoa in theBolivian highland plateau (“Altiplano”), out ofan estimated 1.5 million hectares of marginallyproductive land.
These marginal lands are in protected areas,such as around the shores of Lake Titicaca. Today,these are used for pasture and the productionof potatoes, wheat, barley, tubers, and beans.Although there still seems to be plenty of roomto grow quinoa, it will be at the expense of othercrops and will encroach on pastureland. As CesínCurri points out in his organization’s quest forfunding for experimental fields in arid lands, “Ifquinoa could be cultivated in the ‘non-suitableareas for cultivation,’ then the growth potentialfor quinoa is enormous.” Still, the questionremains of how cost-competitive cultivating in
these desert areas can be. The land there is sandyand low in nutrients and quinoa production inthese areas will most likely require syntheticfertilizers.
The US quinoa market and evolutionof prices
The United States is the main market for allquinoa exported, consuming an estimated 30%of all quinoa produced in 2013. The amount ofquinoa imports and the importance of the UnitedStates for quinoa have both increased in the pastfew years at a rapid pace, as shown in Table 12.2.
Quinoa in the eye of a market storm
Quinoa benefited from the megatrends of wholegrains, organic/natural foods, and gluten-freefoods.
The US market for quinoa had three stages ofgrowth:
• Mid 1980s to 2000. During this initial phase,the quinoa market grew to 1,000 MT. Thisphase included Hispanic food importers andnatural-food pioneers such as Ancient Harvestimporting quinoa from Bolivia, ArrowheadMills importing from Peru, and Inca Organicsimporting from Ecuador. These companiesexperienced some growth, but struggled withlow market awareness, limited distributioninto natural channels, and sourcing difficulties(mainly quality issues and low available volumesdue to limited processing plant capacities).
• 2000–2007. In the early to intermediate phase,the quinoa market grew from 1,000 to 3,300MT (Table 12.2). This phase was markedby a rapid development of the organic food
Table 12.2 US quinoa imports in metric tons per year and US imports as a percentage of total world production.
2004 2005 2006 2007 2008 2009 2010 2011 2012 2013
Quinoa imports in MT peryear
1,548 2,425 2,479 3,346 5,824 8,456 11,901 16,557 26,155 36,038
Growth per year, % 57 2 35 74 45 41 39 58 38Quinoa imported intoUnited States as percentageof world production, %
4 6 10 11 15 21 26 30
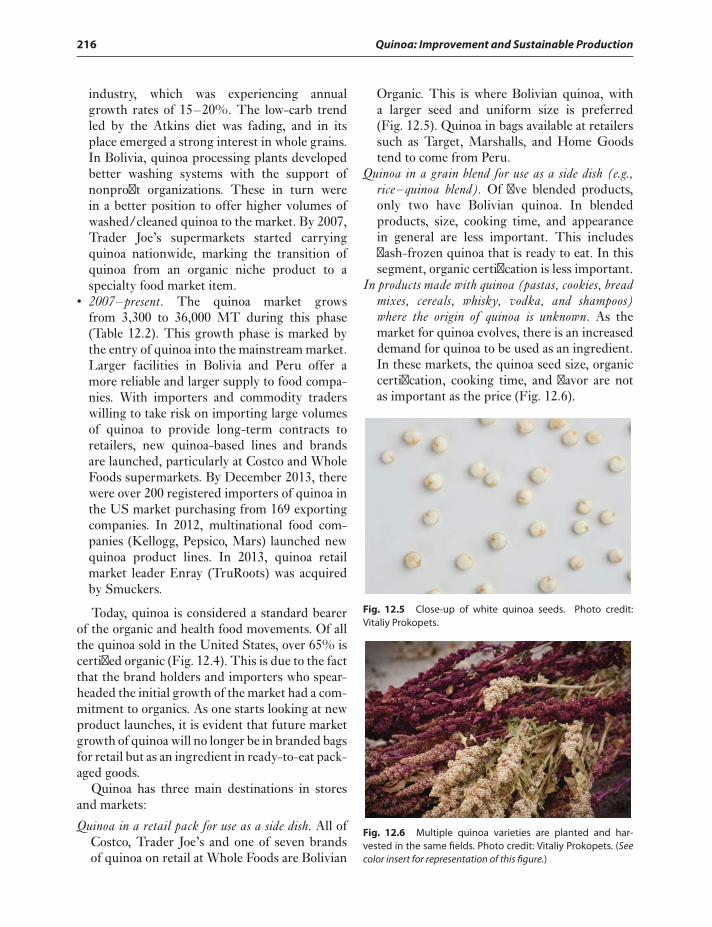
216 Quinoa: Improvement and Sustainable Production
industry, which was experiencing annualgrowth rates of 15–20%. The low-carb trendled by the Atkins diet was fading, and in itsplace emerged a strong interest in whole grains.In Bolivia, quinoa processing plants developedbetter washing systems with the support ofnonprofit organizations. These in turn werein a better position to offer higher volumes ofwashed/cleaned quinoa to the market. By 2007,Trader Joe’s supermarkets started carryingquinoa nationwide, marking the transition ofquinoa from an organic niche product to aspecialty food market item.
• 2007–present. The quinoa market growsfrom 3,300 to 36,000 MT during this phase(Table 12.2). This growth phase is marked bythe entry of quinoa into the mainstream market.Larger facilities in Bolivia and Peru offer amore reliable and larger supply to food compa-nies. With importers and commodity traderswilling to take risk on importing large volumesof quinoa to provide long-term contracts toretailers, new quinoa-based lines and brandsare launched, particularly at Costco and WholeFoods supermarkets. By December 2013, therewere over 200 registered importers of quinoa inthe US market purchasing from 169 exportingcompanies. In 2012, multinational food com-panies (Kellogg, Pepsico, Mars) launched newquinoa product lines. In 2013, quinoa retailmarket leader Enray (TruRoots) was acquiredby Smuckers.
Today, quinoa is considered a standard bearerof the organic and health food movements. Of allthe quinoa sold in the United States, over 65% iscertified organic (Fig. 12.4). This is due to the factthat the brand holders and importers who spear-headed the initial growth of the market had a com-mitment to organics. As one starts looking at newproduct launches, it is evident that future marketgrowth of quinoa will no longer be in branded bagsfor retail but as an ingredient in ready-to-eat pack-aged goods.
Quinoa has three main destinations in storesand markets:
Quinoa in a retail pack for use as a side dish. All ofCostco, Trader Joe’s and one of seven brandsof quinoa on retail at Whole Foods are Bolivian
Organic. This is where Bolivian quinoa, witha larger seed and uniform size is preferred(Fig. 12.5). Quinoa in bags available at retailerssuch as Target, Marshalls, and Home Goodstend to come from Peru.
Quinoa in a grain blend for use as a side dish (e.g.,rice–quinoa blend). Of five blended products,only two have Bolivian quinoa. In blendedproducts, size, cooking time, and appearancein general are less important. This includesflash-frozen quinoa that is ready to eat. In thissegment, organic certification is less important.
In products made with quinoa (pastas, cookies, breadmixes, cereals, whisky, vodka, and shampoos)where the origin of quinoa is unknown. As themarket for quinoa evolves, there is an increaseddemand for quinoa to be used as an ingredient.In these markets, the quinoa seed size, organiccertification, cooking time, and flavor are notas important as the price (Fig. 12.6).
Fig. 12.5 Close-up of white quinoa seeds. Photo credit:Vitaliy Prokopets.
Fig. 12.6 Multiple quinoa varieties are planted and har-vested in the same fields. Photo credit: Vitaliy Prokopets. (Seecolor insert for representation of this figure.)
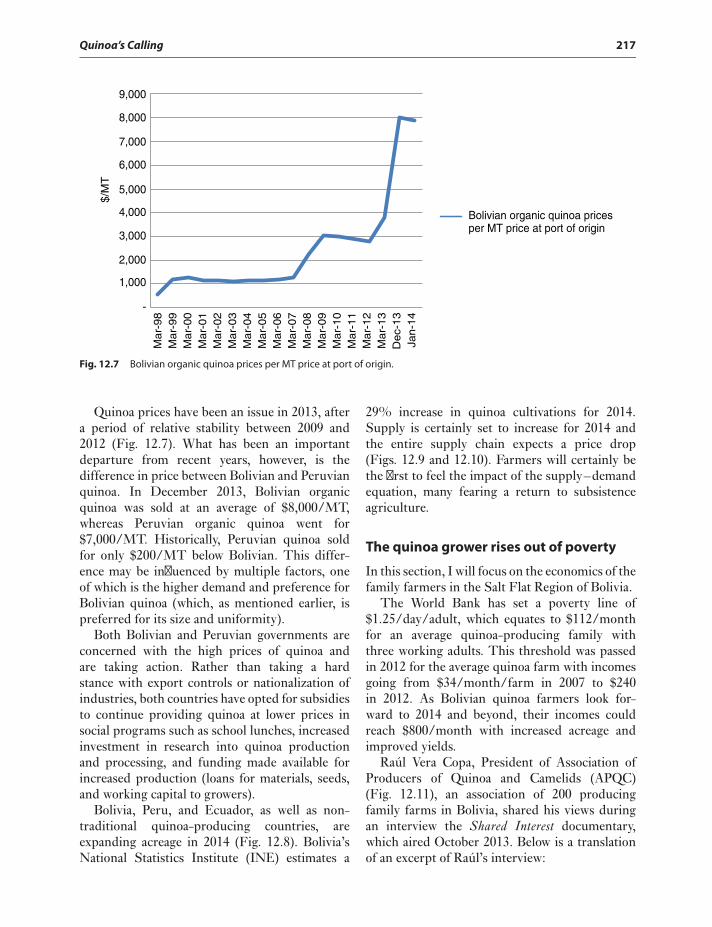
Quinoa’s Calling 217
-
$/M
T9,000
8,000
7,000
6,000
5,000
4,000
3,000
1,000
2,000
Mar-
98
Mar-
99
Mar-
00
Mar-
01
Mar-
02
Mar-
03
Mar-
04
Mar-
05
Mar-
06
Mar-
07
Mar-
08
Mar-
09
Mar-
10
Mar-
11
Mar-
12
Mar-
13
Dec-
13
Jan-1
4
Bolivian organic quinoa prices per MT price at port of origin
Fig. 12.7 Bolivian organic quinoa prices per MT price at port of origin.
Quinoa prices have been an issue in 2013, aftera period of relative stability between 2009 and2012 (Fig. 12.7). What has been an importantdeparture from recent years, however, is thedifference in price between Bolivian and Peruvianquinoa. In December 2013, Bolivian organicquinoa was sold at an average of $8,000/MT,whereas Peruvian organic quinoa went for$7,000/MT. Historically, Peruvian quinoa soldfor only $200/MT below Bolivian. This differ-ence may be influenced by multiple factors, oneof which is the higher demand and preference forBolivian quinoa (which, as mentioned earlier, ispreferred for its size and uniformity).
Both Bolivian and Peruvian governments areconcerned with the high prices of quinoa andare taking action. Rather than taking a hardstance with export controls or nationalization ofindustries, both countries have opted for subsidiesto continue providing quinoa at lower prices insocial programs such as school lunches, increasedinvestment in research into quinoa productionand processing, and funding made available forincreased production (loans for materials, seeds,and working capital to growers).
Bolivia, Peru, and Ecuador, as well as non-traditional quinoa-producing countries, areexpanding acreage in 2014 (Fig. 12.8). Bolivia’sNational Statistics Institute (INE) estimates a
29% increase in quinoa cultivations for 2014.Supply is certainly set to increase for 2014 andthe entire supply chain expects a price drop(Figs. 12.9 and 12.10). Farmers will certainly bethe first to feel the impact of the supply–demandequation, many fearing a return to subsistenceagriculture.
The quinoa grower rises out of poverty
In this section, I will focus on the economics of thefamily farmers in the Salt Flat Region of Bolivia.
The World Bank has set a poverty line of$1.25/day/adult, which equates to $112/monthfor an average quinoa-producing family withthree working adults. This threshold was passedin 2012 for the average quinoa farm with incomesgoing from $34/month/farm in 2007 to $240in 2012. As Bolivian quinoa farmers look for-ward to 2014 and beyond, their incomes couldreach $800/month with increased acreage andimproved yields.
Raúl Vera Copa, President of Association ofProducers of Quinoa and Camelids (APQC)(Fig. 12.11), an association of 200 producingfamily farms in Bolivia, shared his views duringan interview the Shared Interest documentary,which aired October 2013. Below is a translationof an excerpt of Raúl’s interview:
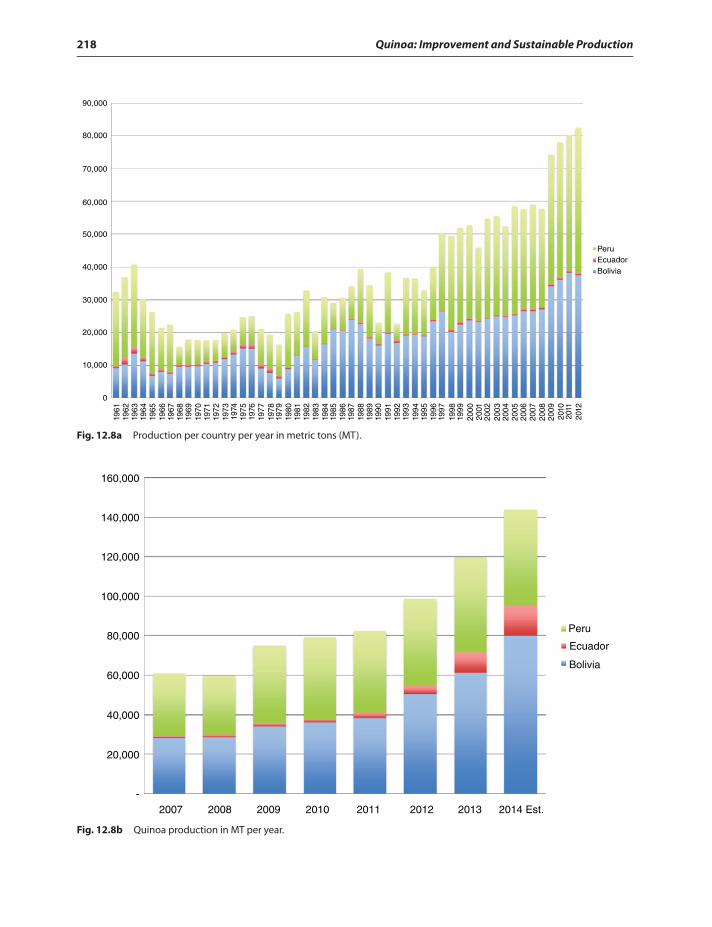
218 Quinoa: Improvement and Sustainable Production
90,000
80,000
70,000
60,000
50,000
40,000
30,000
20,000
10,000
0
1961
1962
1963
1964
1965
1966
1967
1968
1969
1970
1971
1972
1973
1974
1975
1976
1977
1978
1979
1980
1981
1982
1983
1984
1985
1986
1987
1988
1989
1990
1991
1992
1993
1994
1995
1996
1997
1998
1999
2000
2001
2002
2003
2004
2005
2006
2007
2008
2009
2010
2011
2012
PeruEcuadorBolivia
Fig. 12.8a Production per country per year in metric tons (MT).
160,000
140,000
120,000
100,000
80,000
60,000
40,000
20,000
-
2007 2008 2009 2010 2011 2012 2013 2014 Est.
Peru
Ecuador
Bolivia
Fig. 12.8b Quinoa production in MT per year.
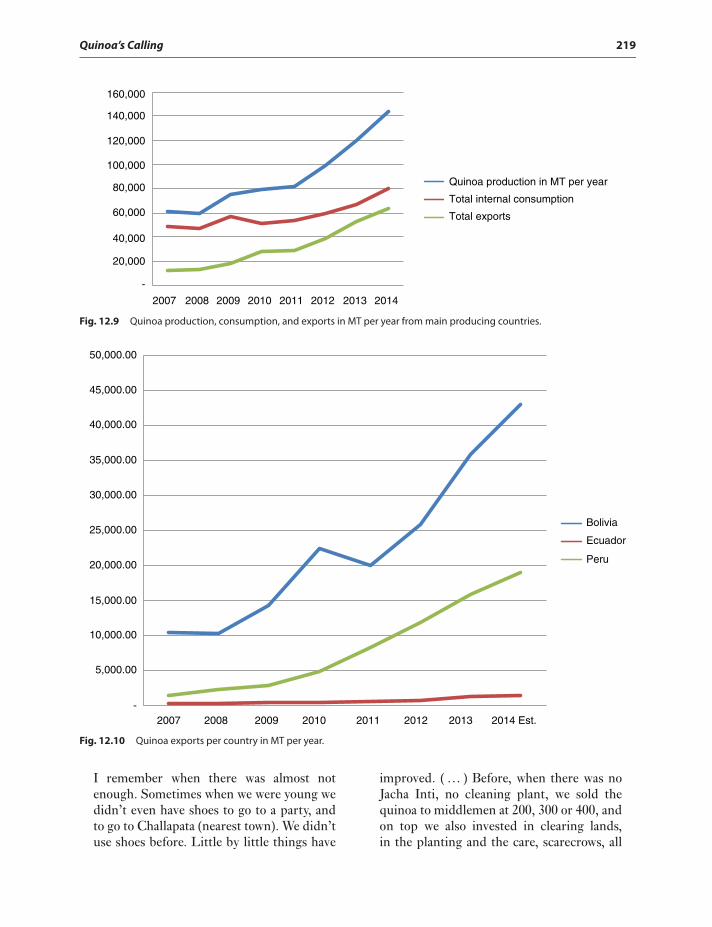
Quinoa’s Calling 219
-
160,000
140,000
120,000
100,000
80,000
60,000
40,000
20,000
2007 2008 2009 2010 2011 2012 2013 2014
Quinoa production in MT per year
Total internal consumption
Total exports
Fig. 12.9 Quinoa production, consumption, and exports in MT per year from main producing countries.
-
50,000.00
45,000.00
40,000.00
35,000.00
30,000.00
25,000.00
20,000.00
15,000.00
10,000.00
5,000.00
2007 2008 2009 2010 2011 2012 2013 2014 Est.
Bolivia
Ecuador
Peru
Fig. 12.10 Quinoa exports per country in MT per year.
I remember when there was almost notenough. Sometimes when we were young wedidn’t even have shoes to go to a party, andto go to Challapata (nearest town). We didn’tuse shoes before. Little by little things have
improved. (… ) Before, when there was noJacha Inti, no cleaning plant, we sold thequinoa to middlemen at 200, 300 or 400, andon top we also invested in clearing lands,in the planting and the care, scarecrows, all
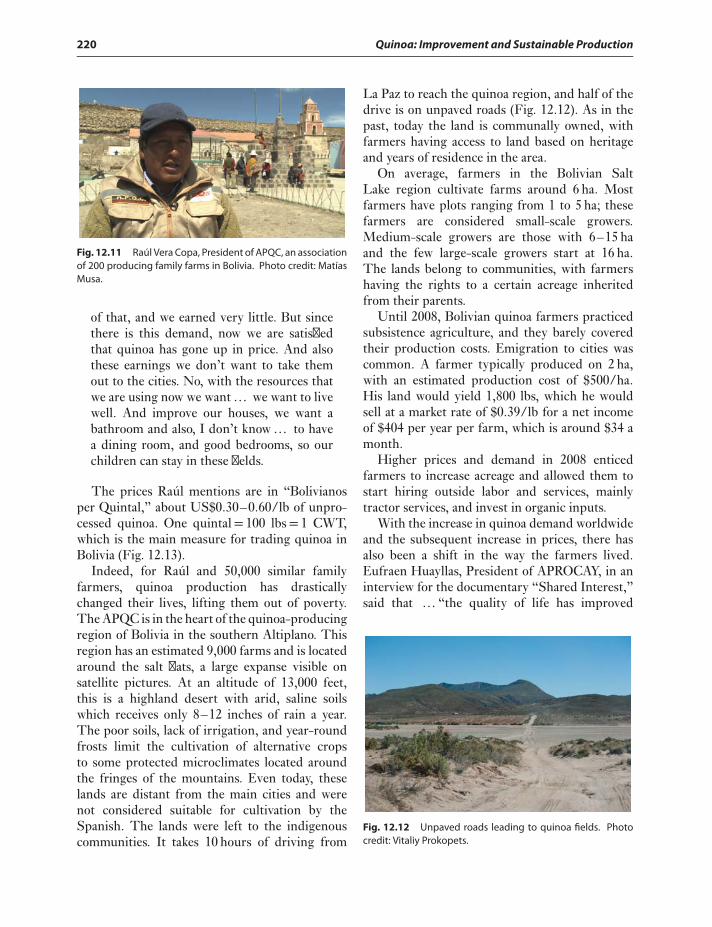
220 Quinoa: Improvement and Sustainable Production
Fig. 12.11 Raúl Vera Copa, President of APQC, an associationof 200 producing family farms in Bolivia. Photo credit: MatíasMusa.
of that, and we earned very little. But sincethere is this demand, now we are satisfiedthat quinoa has gone up in price. And alsothese earnings we don’t want to take themout to the cities. No, with the resources thatwe are using now we want… we want to livewell. And improve our houses, we want abathroom and also, I don’t know… to havea dining room, and good bedrooms, so ourchildren can stay in these fields.
The prices Raúl mentions are in “Bolivianosper Quintal,” about US$0.30–0.60/lb of unpro-cessed quinoa. One quintal= 100 lbs= 1 CWT,which is the main measure for trading quinoa inBolivia (Fig. 12.13).
Indeed, for Raúl and 50,000 similar familyfarmers, quinoa production has drasticallychanged their lives, lifting them out of poverty.The APQC is in the heart of the quinoa-producingregion of Bolivia in the southern Altiplano. Thisregion has an estimated 9,000 farms and is locatedaround the salt flats, a large expanse visible onsatellite pictures. At an altitude of 13,000 feet,this is a highland desert with arid, saline soilswhich receives only 8–12 inches of rain a year.The poor soils, lack of irrigation, and year-roundfrosts limit the cultivation of alternative cropsto some protected microclimates located aroundthe fringes of the mountains. Even today, theselands are distant from the main cities and werenot considered suitable for cultivation by theSpanish. The lands were left to the indigenouscommunities. It takes 10 hours of driving from
La Paz to reach the quinoa region, and half of thedrive is on unpaved roads (Fig. 12.12). As in thepast, today the land is communally owned, withfarmers having access to land based on heritageand years of residence in the area.
On average, farmers in the Bolivian SaltLake region cultivate farms around 6 ha. Mostfarmers have plots ranging from 1 to 5 ha; thesefarmers are considered small-scale growers.Medium-scale growers are those with 6–15 haand the few large-scale growers start at 16 ha.The lands belong to communities, with farmershaving the rights to a certain acreage inheritedfrom their parents.
Until 2008, Bolivian quinoa farmers practicedsubsistence agriculture, and they barely coveredtheir production costs. Emigration to cities wascommon. A farmer typically produced on 2 ha,with an estimated production cost of $500/ha.His land would yield 1,800 lbs, which he wouldsell at a market rate of $0.39/lb for a net incomeof $404 per year per farm, which is around $34 amonth.
Higher prices and demand in 2008 enticedfarmers to increase acreage and allowed them tostart hiring outside labor and services, mainlytractor services, and invest in organic inputs.
With the increase in quinoa demand worldwideand the subsequent increase in prices, there hasalso been a shift in the way the farmers lived.Eufraen Huayllas, President of APROCAY, in aninterview for the documentary “Shared Interest,”said that … “the quality of life has improved
Fig. 12.12 Unpaved roads leading to quinoa fields. Photocredit: Vitaliy Prokopets.
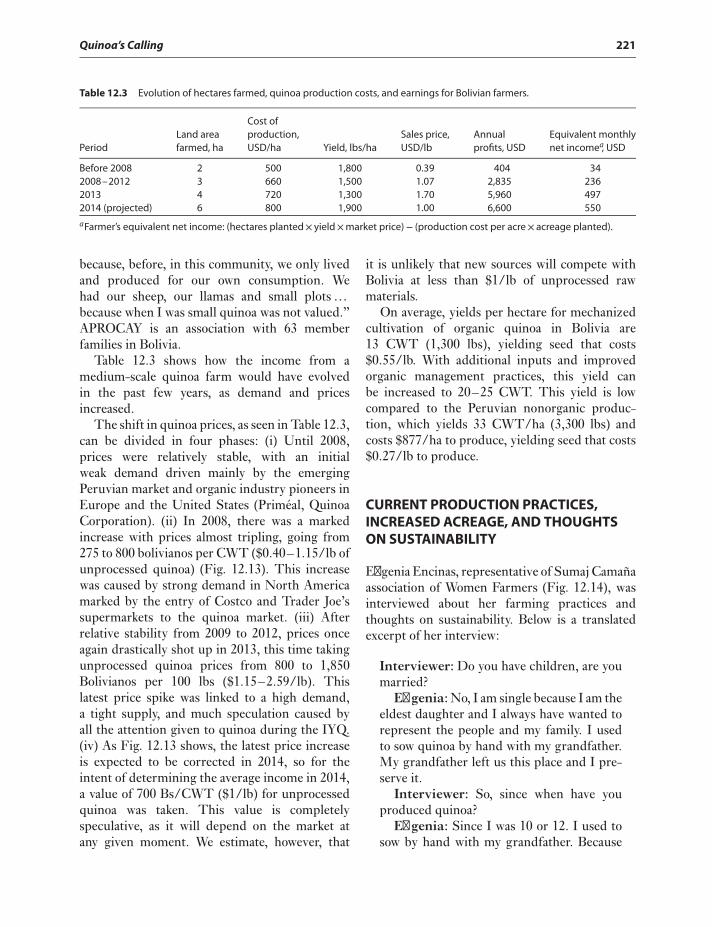
Quinoa’s Calling 221
Table 12.3 Evolution of hectares farmed, quinoa production costs, and earnings for Bolivian farmers.
PeriodLand areafarmed, ha
Cost ofproduction,USD/ha Yield, lbs/ha
Sales price,USD/lb
Annualprofits, USD
Equivalent monthlynet incomea, USD
Before 2008 2 500 1,800 0.39 404 342008–2012 3 660 1,500 1.07 2,835 2362013 4 720 1,300 1.70 5,960 4972014 (projected) 6 800 1,900 1.00 6,600 550
aFarmer’s equivalent net income: (hectares planted× yield×market price)− (production cost per acre× acreage planted).
because, before, in this community, we only livedand produced for our own consumption. Wehad our sheep, our llamas and small plots…because when I was small quinoa was not valued.”APROCAY is an association with 63 memberfamilies in Bolivia.
Table 12.3 shows how the income from amedium-scale quinoa farm would have evolvedin the past few years, as demand and pricesincreased.
The shift in quinoa prices, as seen in Table 12.3,can be divided in four phases: (i) Until 2008,prices were relatively stable, with an initialweak demand driven mainly by the emergingPeruvian market and organic industry pioneers inEurope and the United States (Priméal, QuinoaCorporation). (ii) In 2008, there was a markedincrease with prices almost tripling, going from275 to 800 bolivianos per CWT ($0.40–1.15/lb ofunprocessed quinoa) (Fig. 12.13). This increasewas caused by strong demand in North Americamarked by the entry of Costco and Trader Joe’ssupermarkets to the quinoa market. (iii) Afterrelative stability from 2009 to 2012, prices onceagain drastically shot up in 2013, this time takingunprocessed quinoa prices from 800 to 1,850Bolivianos per 100 lbs ($1.15–2.59/lb). Thislatest price spike was linked to a high demand,a tight supply, and much speculation caused byall the attention given to quinoa during the IYQ.(iv) As Fig. 12.13 shows, the latest price increaseis expected to be corrected in 2014, so for theintent of determining the average income in 2014,a value of 700 Bs/CWT ($1/lb) for unprocessedquinoa was taken. This value is completelyspeculative, as it will depend on the market atany given moment. We estimate, however, that
it is unlikely that new sources will compete withBolivia at less than $1/lb of unprocessed rawmaterials.
On average, yields per hectare for mechanizedcultivation of organic quinoa in Bolivia are13 CWT (1,300 lbs), yielding seed that costs$0.55/lb. With additional inputs and improvedorganic management practices, this yield canbe increased to 20–25 CWT. This yield is lowcompared to the Peruvian nonorganic produc-tion, which yields 33 CWT/ha (3,300 lbs) andcosts $877/ha to produce, yielding seed that costs$0.27/lb to produce.
CURRENT PRODUCTION PRACTICES,INCREASED ACREAGE, AND THOUGHTSON SUSTAINABILITY
Efigenia Encinas, representative of Sumaj Camañaassociation of Women Farmers (Fig. 12.14), wasinterviewed about her farming practices andthoughts on sustainability. Below is a translatedexcerpt of her interview:
Interviewer: Do you have children, are youmarried?
Efigenia: No, I am single because I am theeldest daughter and I always have wanted torepresent the people and my family. I usedto sow quinoa by hand with my grandfather.My grandfather left us this place and I pre-serve it.
Interviewer: So, since when have youproduced quinoa?
Efigenia: Since I was 10 or 12. I used tosow by hand with my grandfather. Because
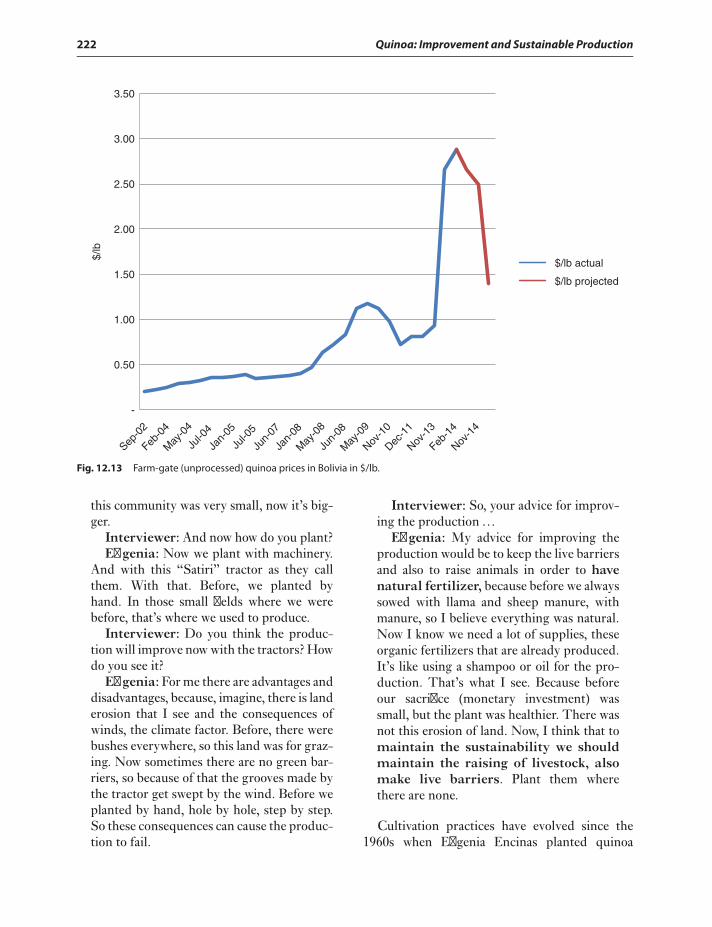
222 Quinoa: Improvement and Sustainable Production
-
$/lb
3.00
3.50
2.50
2.00
1.50
1.00
0.50
Sep-0
2
Feb-0
4
May
-04
Jul-0
4
Jan-
05
Jul-0
5
Jun-
07
Jan-
08
May
-08
Jun-
08
May
-09
Nov-1
0
Dec-1
1
Nov-1
3
Feb-1
4
Nov-1
4
$/lb actual
$/lb projected
Fig. 12.13 Farm-gate (unprocessed) quinoa prices in Bolivia in $/lb.
this community was very small, now it’s big-ger.
Interviewer: And now how do you plant?Efigenia: Now we plant with machinery.
And with this “Satiri” tractor as they callthem. With that. Before, we planted byhand. In those small fields where we werebefore, that’s where we used to produce.
Interviewer: Do you think the produc-tion will improve now with the tractors? Howdo you see it?
Efigenia: For me there are advantages anddisadvantages, because, imagine, there is landerosion that I see and the consequences ofwinds, the climate factor. Before, there werebushes everywhere, so this land was for graz-ing. Now sometimes there are no green bar-riers, so because of that the grooves made bythe tractor get swept by the wind. Before weplanted by hand, hole by hole, step by step.So these consequences can cause the produc-tion to fail.
Interviewer: So, your advice for improv-ing the production…
Efigenia: My advice for improving theproduction would be to keep the live barriersand also to raise animals in order to havenatural fertilizer, because before we alwayssowed with llama and sheep manure, withmanure, so I believe everything was natural.Now I know we need a lot of supplies, theseorganic fertilizers that are already produced.It’s like using a shampoo or oil for the pro-duction. That’s what I see. Because beforeour sacrifice (monetary investment) wassmall, but the plant was healthier. There wasnot this erosion of land. Now, I think that tomaintain the sustainability we shouldmaintain the raising of livestock, alsomake live barriers. Plant them wherethere are none.
Cultivation practices have evolved since the1960s when Efigenia Encinas planted quinoa
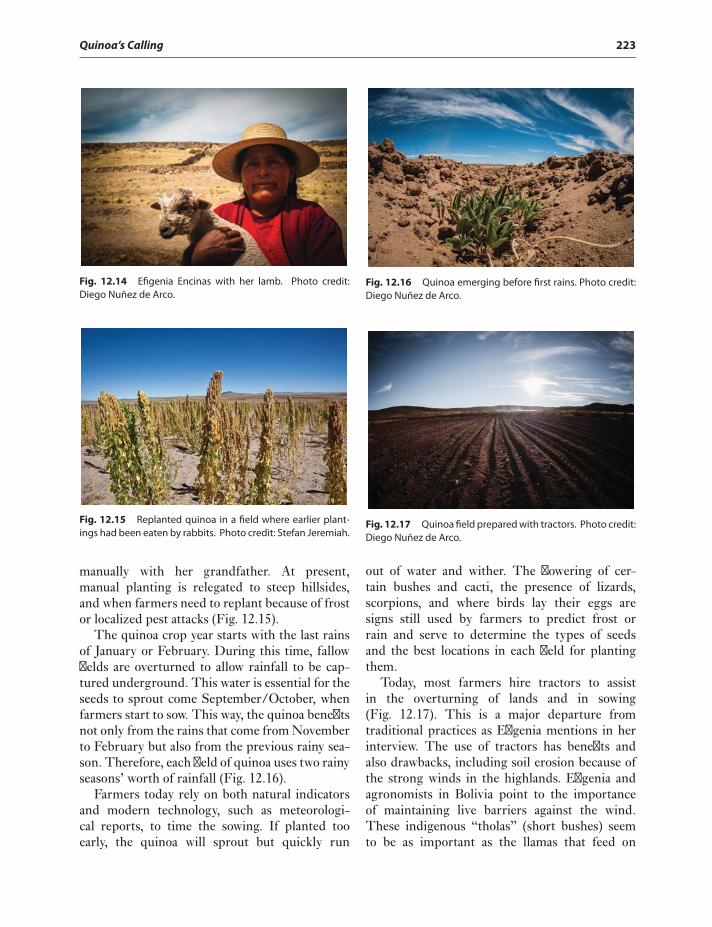
Quinoa’s Calling 223
Fig. 12.14 Efigenia Encinas with her lamb. Photo credit:Diego Nuñez de Arco.
Fig. 12.15 Replanted quinoa in a field where earlier plant-ings had been eaten by rabbits. Photo credit: Stefan Jeremiah.
manually with her grandfather. At present,manual planting is relegated to steep hillsides,and when farmers need to replant because of frostor localized pest attacks (Fig. 12.15).
The quinoa crop year starts with the last rainsof January or February. During this time, fallowfields are overturned to allow rainfall to be cap-tured underground. This water is essential for theseeds to sprout come September/October, whenfarmers start to sow. This way, the quinoa benefitsnot only from the rains that come from Novemberto February but also from the previous rainy sea-son. Therefore, each field of quinoa uses two rainyseasons’ worth of rainfall (Fig. 12.16).
Farmers today rely on both natural indicatorsand modern technology, such as meteorologi-cal reports, to time the sowing. If planted tooearly, the quinoa will sprout but quickly run
Fig. 12.16 Quinoa emerging before first rains. Photo credit:Diego Nuñez de Arco.
Fig. 12.17 Quinoa field prepared with tractors. Photo credit:Diego Nuñez de Arco.
out of water and wither. The flowering of cer-tain bushes and cacti, the presence of lizards,scorpions, and where birds lay their eggs aresigns still used by farmers to predict frost orrain and serve to determine the types of seedsand the best locations in each field for plantingthem.
Today, most farmers hire tractors to assistin the overturning of lands and in sowing(Fig. 12.17). This is a major departure fromtraditional practices as Efigenia mentions in herinterview. The use of tractors has benefits andalso drawbacks, including soil erosion because ofthe strong winds in the highlands. Efigenia andagronomists in Bolivia point to the importanceof maintaining live barriers against the wind.These indigenous “tholas” (short bushes) seemto be as important as the llamas that feed on
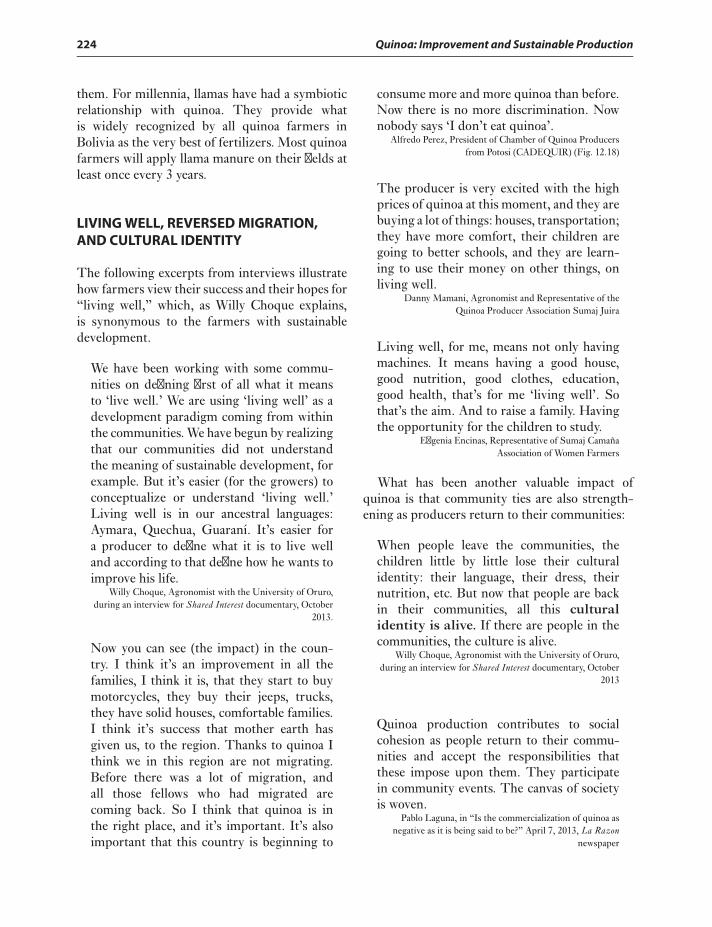
224 Quinoa: Improvement and Sustainable Production
them. For millennia, llamas have had a symbioticrelationship with quinoa. They provide whatis widely recognized by all quinoa farmers inBolivia as the very best of fertilizers. Most quinoafarmers will apply llama manure on their fields atleast once every 3 years.
LIVING WELL, REVERSED MIGRATION,AND CULTURAL IDENTITY
The following excerpts from interviews illustratehow farmers view their success and their hopes for“living well,” which, as Willy Choque explains,is synonymous to the farmers with sustainabledevelopment.
We have been working with some commu-nities on defining first of all what it meansto ‘live well.’ We are using ‘living well’ as adevelopment paradigm coming from withinthe communities. We have begun by realizingthat our communities did not understandthe meaning of sustainable development, forexample. But it’s easier (for the growers) toconceptualize or understand ‘living well.’Living well is in our ancestral languages:Aymara, Quechua, Guaraní. It’s easier fora producer to define what it is to live welland according to that define how he wants toimprove his life.
Willy Choque, Agronomist with the University of Oruro,during an interview for Shared Interest documentary, October
2013.
Now you can see (the impact) in the coun-try. I think it’s an improvement in all thefamilies, I think it is, that they start to buymotorcycles, they buy their jeeps, trucks,they have solid houses, comfortable families.I think it’s success that mother earth hasgiven us, to the region. Thanks to quinoa Ithink we in this region are not migrating.Before there was a lot of migration, andall those fellows who had migrated arecoming back. So I think that quinoa is inthe right place, and it’s important. It’s alsoimportant that this country is beginning to
consume more and more quinoa than before.Now there is no more discrimination. Nownobody says ‘I don’t eat quinoa’.
Alfredo Perez, President of Chamber of Quinoa Producersfrom Potosi (CADEQUIR) (Fig. 12.18)
The producer is very excited with the highprices of quinoa at this moment, and they arebuying a lot of things: houses, transportation;they have more comfort, their children aregoing to better schools, and they are learn-ing to use their money on other things, onliving well.
Danny Mamani, Agronomist and Representative of theQuinoa Producer Association Sumaj Juira
Living well, for me, means not only havingmachines. It means having a good house,good nutrition, good clothes, education,good health, that’s for me ‘living well’. Sothat’s the aim. And to raise a family. Havingthe opportunity for the children to study.
Efigenia Encinas, Representative of Sumaj CamañaAssociation of Women Farmers
What has been another valuable impact ofquinoa is that community ties are also strength-ening as producers return to their communities:
When people leave the communities, thechildren little by little lose their culturalidentity: their language, their dress, theirnutrition, etc. But now that people are backin their communities, all this culturalidentity is alive. If there are people in thecommunities, the culture is alive.
Willy Choque, Agronomist with the University of Oruro,during an interview for Shared Interest documentary, October
2013
Quinoa production contributes to socialcohesion as people return to their commu-nities and accept the responsibilities thatthese impose upon them. They participatein community events. The canvas of societyis woven.
Pablo Laguna, in “Is the commercialization of quinoa asnegative as it is being said to be?” April 7, 2013, La Razon
newspaper
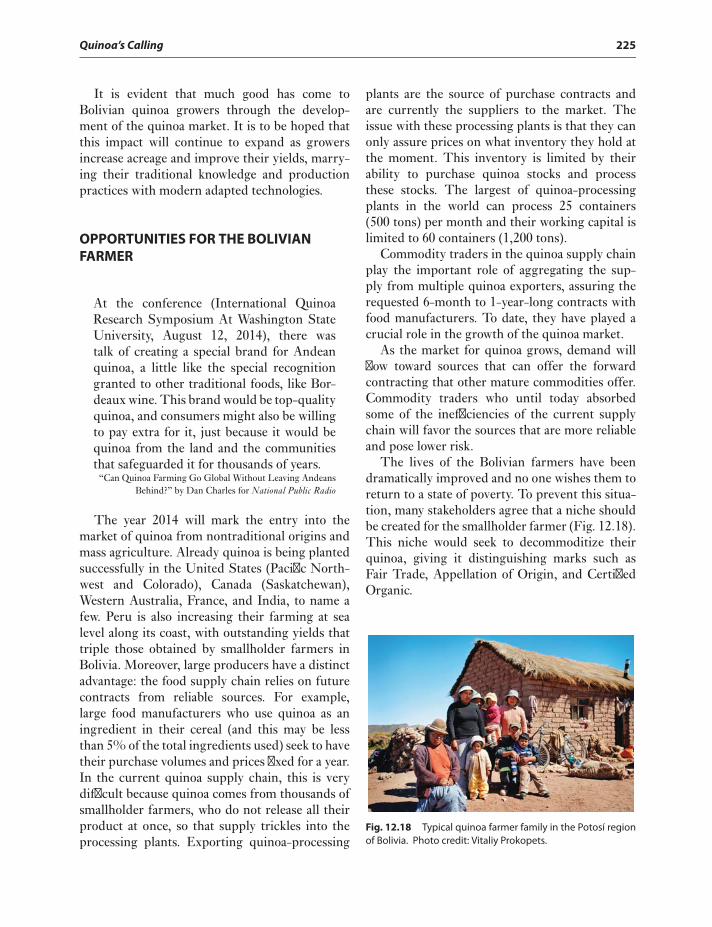
Quinoa’s Calling 225
It is evident that much good has come toBolivian quinoa growers through the develop-ment of the quinoa market. It is to be hoped thatthis impact will continue to expand as growersincrease acreage and improve their yields, marry-ing their traditional knowledge and productionpractices with modern adapted technologies.
OPPORTUNITIES FOR THE BOLIVIANFARMER
At the conference (International QuinoaResearch Symposium At Washington StateUniversity, August 12, 2014), there wastalk of creating a special brand for Andeanquinoa, a little like the special recognitiongranted to other traditional foods, like Bor-deaux wine. This brand would be top-qualityquinoa, and consumers might also be willingto pay extra for it, just because it would bequinoa from the land and the communitiesthat safeguarded it for thousands of years.
“Can Quinoa Farming Go Global Without Leaving AndeansBehind?” by Dan Charles for National Public Radio
The year 2014 will mark the entry into themarket of quinoa from nontraditional origins andmass agriculture. Already quinoa is being plantedsuccessfully in the United States (Pacific North-west and Colorado), Canada (Saskatchewan),Western Australia, France, and India, to name afew. Peru is also increasing their farming at sealevel along its coast, with outstanding yields thattriple those obtained by smallholder farmers inBolivia. Moreover, large producers have a distinctadvantage: the food supply chain relies on futurecontracts from reliable sources. For example,large food manufacturers who use quinoa as aningredient in their cereal (and this may be lessthan 5% of the total ingredients used) seek to havetheir purchase volumes and prices fixed for a year.In the current quinoa supply chain, this is verydifficult because quinoa comes from thousands ofsmallholder farmers, who do not release all theirproduct at once, so that supply trickles into theprocessing plants. Exporting quinoa-processing
plants are the source of purchase contracts andare currently the suppliers to the market. Theissue with these processing plants is that they canonly assure prices on what inventory they hold atthe moment. This inventory is limited by theirability to purchase quinoa stocks and processthese stocks. The largest of quinoa-processingplants in the world can process 25 containers(500 tons) per month and their working capital islimited to 60 containers (1,200 tons).
Commodity traders in the quinoa supply chainplay the important role of aggregating the sup-ply from multiple quinoa exporters, assuring therequested 6-month to 1-year-long contracts withfood manufacturers. To date, they have played acrucial role in the growth of the quinoa market.
As the market for quinoa grows, demand willflow toward sources that can offer the forwardcontracting that other mature commodities offer.Commodity traders who until today absorbedsome of the inefficiencies of the current supplychain will favor the sources that are more reliableand pose lower risk.
The lives of the Bolivian farmers have beendramatically improved and no one wishes them toreturn to a state of poverty. To prevent this situa-tion, many stakeholders agree that a niche shouldbe created for the smallholder farmer (Fig. 12.18).This niche would seek to decommoditize theirquinoa, giving it distinguishing marks such asFair Trade, Appellation of Origin, and CertifiedOrganic.
Fig. 12.18 Typical quinoa farmer family in the Potosí regionof Bolivia. Photo credit: Vitaliy Prokopets.
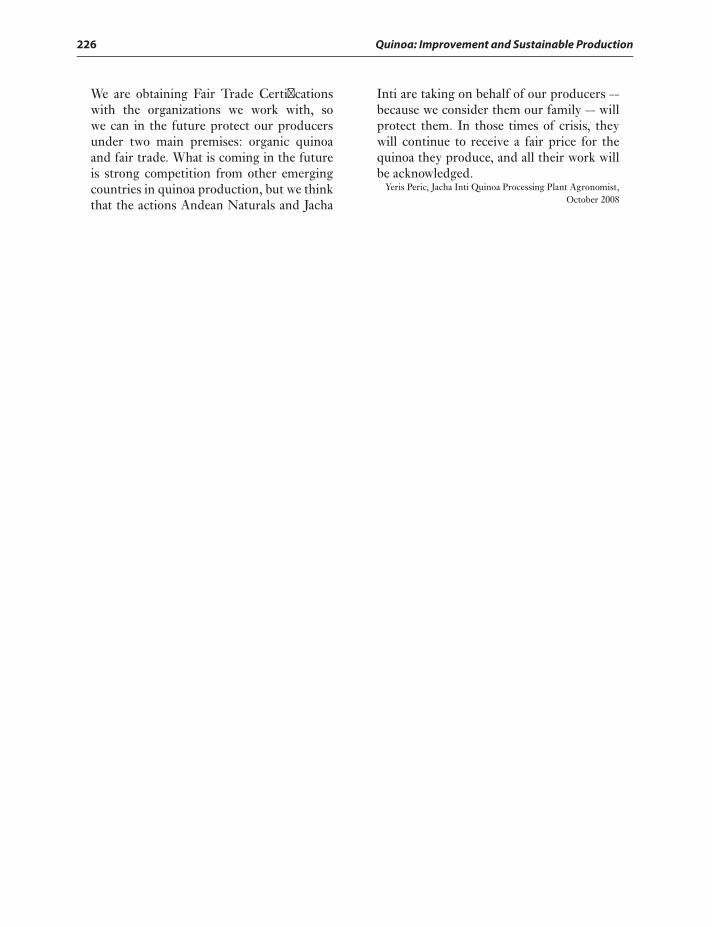
226 Quinoa: Improvement and Sustainable Production
We are obtaining Fair Trade Certificationswith the organizations we work with, sowe can in the future protect our producersunder two main premises: organic quinoaand fair trade. What is coming in the futureis strong competition from other emergingcountries in quinoa production, but we thinkthat the actions Andean Naturals and Jacha
Inti are taking on behalf of our producers --because we consider them our family -- willprotect them. In those times of crisis, theywill continue to receive a fair price for thequinoa they produce, and all their work willbe acknowledged.
Yeris Peric, Jacha Inti Quinoa Processing Plant Agronomist,October 2008
Index
abiotic stress see environmentacreage increases in South America,
213–15, 217, 221–4Africa, 161–71
challenges and considerations forfuture research, 169–70
goals of breeding, 164–9introduction into, 161–3, 164
agro-food variables (germplasmcollections), 143–4
documentation, 147–8see also food security
agroecology see ecologyagroecosystems and insect pests, 63, 64,
77, 78, 79, 80agromorphology see morphological and
agromorphologicalcharacteristics
agronomicsAfrica, 170South America, 30–2
albumin, 194, 195allogamy see out-crossingallotetraploid, 6, 29, 97, 109, 111, 112,
114Altiplano (Andean highland
plateau/plain of Bolivia andPeru), 30, 34, 47–62
ecotype, 5, 19, 26, 29, 49, 87–8, 90,92, 99, 126
in temperate regions (incl. NorthAmerica), 177, 178
sowing, 35–6yields, trends, 47–62
Amachuma cultivar, 97Amaranthaceae, 5, 28American and European test of quinoa,
90, 93, 99amino acids, 193–4
essential, 4, 143, 163, 194, 195, 205
Quinoa: Improvement and Sustainable Production, First Edition. Edited by Kevin Murphy and Janet Matanguihan.© 2015 John Wiley & Sons, Inc. Published 2015 by John Wiley & Sons, Inc.
amplified fragment lengthpolymorphisms, 113, 117,119
ANAPQUI (National Association ofQuinoa Producers), 40, 215
Andes (of South America incl. Boliviaand Peru), 19–20, 34
breeding, 87–107genebanks, 128–30highland plateau/plains see Altiplanohistory, 19–20, 26valley ecotype see valley quinoa
animal forage and feed, 186–7anthesis, 37–8, 96, 100anthocyanins, 76, 204, 205antifungal activity, saponins, 203anti-inflammatory effects of saponins,
203antinutritional factors, 202–3Apelawa cultivar, 97aphids and Aphidae, 66–7
Malawi, 169North America, 184–5South America, 66–7
APQC (Association of Producers ofQuinoa and Camelids), 217,220
APROCAY, 220archeological studies, 2, 26, 101, 174Argentina, 116, 118, 119, 120
distribution, 128genetic structure in Northern
regions, 118germplasm, 91insect pests, 64, 65, 71, 77seed genebanks, 130
arid regions/conditions in SouthAmerica, 27, 32
Chile, reintroduction after localextinction, 20–1
see also droughtAscochyta, 184assassin bugs, 72association mapping, 113Association of Producers of Quinoa and
Camelids (APQC), 217, 220Atriplex, 10
A. hortensis, 102autogamy (self/auto-pollination), 6, 27,
96, 97autopollination (self-pollination;
autogamy), 6, 27, 96, 97aynokas, 16, 29, 89
backcrossing, 102Baer, 98, 130, 180, 181–2barley, chemical/nutrient composition,
194vitamins, 201
beet pests, 185behavioural strategies of insect pests,
73Bembeke (Malawi), 166bioactivity, 195–6, 203, 204–5biochemical strategies to resist stress
(incl. herbivory), 73biodiversity see diversityBiodiversity International (IPGRA;
International Plant GeneticResource Institute), 131, 133,141
biological control of insect pests, 63–85biological value, 4
industry and consumer requirements,95
biomechanical strategies to resist stress(incl. herbivory), 73
biotic stress and threats, 38–9resistance to, 94see also diseases; pests
227
228 Index
birds, 39, 94, 186see also poultry feed
Boliviaacreage increases, 213–15, 217,
221–4Andes see Altiplano; Andesbulk/mass selection, 101distribution in, 127farmers in
economic snapshot, 212–13opportunities, 225–6production practices/increased
acreage/thoughts onsustainability, 221–4
germplasm bank, 128, 130–58characterization and evaluation of
germplasm, 140–4current status, 132history and management, 130–2steps for management, 132–55utilization, 148–55
morphological variations, 91, 141–3poverty in, impact on, 217–21prices, 217PROINPA Foundation, 29, 88–9,
101, 126, 131, 132, 136, 148,151, 153
temperate regions (incl. NorthAmerica) and varieties from,176, 178
Bolivian Yungas (subtropical) ecotype, 5,19, 88, 90, 115, 127, 177–8
botany, 5–7, 26, 27–8breeding, 87–107
Africa, goals, 164–9germplasm collections and, 151–2goals, 92–7methods, 92–103
in genetic improvement, 96–103Brigham Young University (BYU), 103,
112bulk selection see mass selectionBunda (Malawi), 166
calcium, 202calcium oxalate glands, 27, 32Canada, 164, 173, 176, 193canola, fatty acids, 199Carabidae, predatory, 70, 71carbohydrate, 3
germplasm collections, 143see also sugar
carbon dioxide/H20 gas exchange andenvironmental stress, 10
carbon-13 values, 6cardiovasuclar disease (CVD), 200, 201,
203
carotenoids, 93, 95–6, 205β-caroyphyllene, 75casein, amino acids, 195centers of origin, 26, 28, 30, 34, 89, 116,
119, 126–7, 133centralized collection method
(germplasm samples), 133Centre for Plant Breeding and
Reproduction Research(CPRO-DLO) breedingprogram, 182, 183, 186
cereals, quinoa compared withbotany, 27chemical and nutrient composition,
193, 194lipid, 199phenolic acid, 204starch, 196vitamins, 200–1
cerros (steep slopes), 47, 51, 56, 57, 58chemical defences to pests, 73–6chemical fertilizer (inorganic fertilizer),
Africa, 169, 170Chenopodium (non-C. quinoa), 6, 19, 89,
116, 174, 183distinguishing characteristics, 90interspecific crosses/outcrossing
with, 102, 111–12, 186downy mildew resistance and, 183heat tolerance and, 174
as weeds, 185Chenopodium album, 111, 112, 117, 183,
184, 185Chenopodium ambrosioides, 28, 89, 117Chenopodium berlandieri, 6, 109, 111,
112crossing with, 111–12, 186downy mildew resistance, 183var. macrocalycium, 112
Chenopodium hircinum, 6, 19, 28, 89, 109,112, 113, 117
chicken feed, 187children in Africa, malnutrition, 162–3Chile
distribution, 127–8history in
expansion to southern latitudes in,20–1
reintroduction to arid regions afterlocal extinction, 20–1
lowland ecotype see lowland ecotypemorphological variations, 92temperate regions (incl. North
America) and varieties from,175–81
chlorophyll content and environmentalstress, 11
chloroplast photochemical reactions andenvironmental stress, 11
Choque, Willy, 224chromomycin A3, 110chromosomes, 109, 110, 111
polyploidy level, 97Chrysomelidae, 66Chrysopidae, 67
predator, 70, 71, 77CICA cultivar, 5, 6, 8–10, 11, 168climate change (incl. global warming), 1,
215yield in Southern Bolivian Altiplano
and projections of, 47, 48,52–4, 57, 59–60
see also environmentcoastal ecotype see lowland ecotypeCoccinellidae, 66
predatory, 70, 71, 77coconut oil, fatty acids, 199coeliac disease, 194–5Coipasa, 5, 49cold temperatures (and tolerance)
North America, 175–6South America, 33see also frost; hail
Coleoptera, 65, 66predatory, 71, 77
Colombia, 19, 30, 31, 34, 36, 115, 118,130, 161
distribution in, 127color
plant (germplasm collection), 142seed/grain, 28, 40, 87
breeding and, 87, 91, 95–6, 98,103
germplasm collection, 142industry and consumer
requirements, 95–6mutagenesis affecting, 103social use and, 152
Colorado, 102, 173, 176, 178, 179, 181,183, 184, 185, 186
San Luis Valley, 97, 173, 175combine harvesting
North America, 181South America, 39
commerce and industry, South America,40
requirements of, 95–6see also economics
commodity traders, 216, 225community training courses of varied
uses, 149–51conditioning of germplasm samples, 138conferences, 155, 156conservation strategies, 115
ex situ see ex situ collections
Index 229
in situ, 89, 120, 132, 149consumer requirements, 95–6Copa, Raúl Vera, 217Copitarsia sp., 64, 65, 77Coquimbo regions, 20–2core collections, 90, 116, 140, 152corn see maizecoronary heart disease, 200, 201CPRO-DLO breeding program, 182,
183, 186crop
cycle, 30, 35, 141insect pests and cropping systems and
crop management, 64, 79–80productivity, Southern Bolivian
Altiplano, 58water requirements, 37–8
cross-pollination see out-crossingculinary use
community training courses, 151US, 216
cultivars and varieties, 6–7, 88Bolivia, obtained through breeding,
152, 153Kenya, 167–9Malawi, 164, 165
growth performance, 165–6yield, 166, 167
nutritional content and, 4, 5see also genotypes
cultivation and productionAfrica, 161–71North America, 173–92, 173–92South America, 30–2, 34–41
Bolivian farmer’s costs, 212Bolivian farmer’s current
production practices, 221–4cultural practices, 37history, 2, 19–24, 26, 87–8
see also acreage; yieldscultural identity, 224Curi, Cesın, 215cytogenetics, 109–11
Danish varieties, 176, 177, 180, 183day length, 20
Africa, 168Kenya, 167
North America, 178days to maturity see maturitydecentralized collection method
(germplasm samples), 133, 136defences to pests, chemical, 73–6Denmark, 9, 164, 175, 178, 180, 181, 183
varieties (Danish) from, 176, 177,180, 183
density (sowing/planting) in temperateregions (incl. North America),179–81
depth of planting in temperate regions(incl. North America), 180
descriptors for collections, 116, 140, 141diet
animal, 187human, 195, 196, 198–9, 201
African, 161, 162, 169see also nutritional deficiencies;
nutritional valueDiptera, 97
as parasitoids of pests, 71as pests, 66, 70
diseaseshuman, quinoa’s beneficial effects,
200, 201, 203, 205quinoa
fungal, 39, 90, 94, 183–4Malawi, 169
dissemination of information on use,153–4
diversification, 19–24diversity (biodiversity), 115–18, 126
Bolivian germplasm collection, 144centers and subcenters, 19, 115,
126–7genetic, 29, 88, 89, 115, 116, 117–18,
119–20, 126, 127, 134germplasm, molecular markers, 92molecular markers and, 92, 117, 119phenotypic, 115–16
DNApolymorphisms see polymorphismsrepetitive see repetitive DNA
sequencesequence evidence for genomic
origins, 112–13documentation (germplasm samples),
134, 147–8domestication, 6
Andean, 26–7downy mildew (Peronospora farinosa and
P. variabilis), 38, 90, 94, 126,183–4
drought (and tolerance), 7–12in Malawi, quinoa as alternative crop
for regions prone to, 163in South America, 32–3
Southern Bolivian Altiplano, 52,54–5
in temperate regions (incl. NorthAmerica), 174–5
see also arid regionsDurable Resistance Project in the
Andean Region (PREDUZAproject), 101, 103, 131
ecdysteroids, 75ecology (agroecology)
adaptation to different ecologicalzones
Africa, 163–4South America, 7
biological pest control and, 77–80Malawi, 16, 164–6, 170South America, 5, 26, 30
economics, 211–26see also commerce and industry
ecotypes, 5, 19, 26, 28, 87–8, 90–1,126–7
temperate regions (incl. NorthAmerica)
cold tolerance and, 175–6variety selection and, 177–8
see also specific ecotypesEcuador, 26, 29, 30, 31, 34, 94, 118, 135,
184acreage increases, 213, 217distribution, 127germplasm, 89, 91
education, 155, 156electronic documentation of germplasm,
147, 148β-elemene, 75emasculation, 100Encalilla, 5Encinas, Efigenia, 221, 222, 223, 224England, 99, 176, 180, 181, 185entomopathogens, 72entomophagous insects, 65–72, 76–80environment (incl. climate)
Kenya, 166Malawi, 164–5nutritional content and, 4stressful, incl. abiotic factors (and
tolerance/resistance), 7–12, 22,27, 32–4, 94–5
North America, 173–7South America, 27, 32–4, 54–5
essential amino acids, 4, 143, 163, 194,195, 205
Europe, 164, 178, 180, 181–2, 184market, 215, 221see also American and European test
of quinoaEurysacca melanocampta and E. quinoae
(quinoa moth), 64, 65, 77, 80,184, 185
ex situ (germplasm and genebank)collections, 29, 88–92, 120,125–60
Andean Region, 128–30Bolivia see Boliviacharacterization and evaluation,
140–4
230 Index
ex situ (germplasm and genebank)collections (continued)
core collections, 90, 116, 140, 152descriptors, 116, 140, 141history and evolution, 134–6multiplication see multiplicationPeru (Illpa), 7, 29, 89, 128–30samples see samplessteps for ex situ management, 132–55utilization, 148–55
experimental sites in Kenya, 166
fairs, 153, 154faldas (gentle slopes in piedmonts), 47,
51, 52, 56farmers
African, maize vs. quinoa, 169Bolivian see Boliviabreeding requirements, 92–5participation by see participation
fatty acids, 3, 199–200unsaturated, 143, 199, 200, 201see also lipid
feed, animal, 186–7fertilizer, 36–7
Africa, inorganic/chemical, 169, 170organic see organic quinoaSouth America, 31, 36–7temperate regions (incl. North
America), 178–9ferulic acid, 204fiber, dietary, 198–9field plots (for germplasm
multiplication), 145–6flavonoids, 22, 76, 204–5flax, fatty acids, 199flower types, 96
see also inflorescenceflowering, 27–8, 31, 100
anthesis, 37–8, 96, 100fluorescence in situ hybridization
(FISH), 110, 111, 112folate, 3, 201Food and Agricultural Organization
(FAO)Africa and, 163ecotypes, 26nutritional content, 3, 4, 5, 22, 194,
195promotion by, 22, 25, 163
food security in Africa, 161–2see also agro-food variables
forage crop, quinoa, 186–7freeze–thaw stability of starch, 198frost
Africa, 163, 164North America, 175–6
South America, 26, 27, 33, 48, 49, 50,51, 55, 59, 60
fructose, 198fruit, 6, 28, 87functional properties, 196fungal diseases and pathogens, 39, 90,
94, 183–4see also antifungal activity
gallic acid, 204gas exchange and environmental stress,
10gelatinization temperature of starch,
197–8genebanks see ex situ collectionsgenera, crosses between, 102, 117generalist behavioral strategies of insect
pests, 73genetic diversity, 29, 88, 89, 115, 116,
117–18, 119–20, 126, 127, 134genetic maps, 103, 113, 114genetic markers and molecular markers,
103, 113–14, 117diversity and, 92, 117, 119germplasm collection, 144
genetic resources, collection see ex situcollections
genetics (in general), 5–7, 28–30, 96,109–23
breeding and, 96–103molecular, 109–23
genomeDNA sequence evidence for origins,
112–13structure, 109–11
genotypes, 93KASPar™ genotyping chemistry,
114Kenya, performance, 168–9Malawi, performance, 166, 167nutritional content and, 4saponins and, 4see also cultivars and varieties;
ecotypesgeographical distribution
(phytogeography), 30, 127–8,161
germplasm collections, 136outside South America, 136, 161
germinationfor germplasm collection
analysis, 139initial samples, 138monitoring of samples, 140, 145
postharvest studies, 40germplasm
Argentina, 91
collections see ex situ collectionsdiversity, molecular markers, 92ectotypes see ecotypesforeign, introduction, 99multiplication see multiplicationstorage, 138–40utilization, 148–55
gliadins, 194, 195global warming see climate changeglobulins, 194, 195glucose, 198glutelins, 194, 195gluten and glutenins, 194, 195glycosylated secondary metabolites see
saponinsgrain see seedgrassy weeds in temperate regions (incl.
North America), 185Graziano da Silva, José, 211Greece, 90, 93, 177, 181greenhouse (for germplasm
multiplication), 145–6greenhouse gases, 1
see also climate changegrowth
habit, germplasm collection, 142performance
Kenya, 167–9Malawi, 165–6
gynomonoecy, 106
hail, 34halophytes, 7, 32harrowing, 37
temperate regions (incl. NorthAmerica), 185
harvestingNorth America and other temperate
regions, 181–2sprouting before, 182–3
South America, 39–40Bolivian farmer’s costs, 212mechanized, 39, 95
heart disease, coronary, 200, 201heat tolerance, North America, 173–4,
176, 177, 187height of plant required by farmers, 93Hemiptera, 66
predator, 70, 71herbivorous insects see insectsherbivory-associated molecular patterns
(HAMPs), 76heterochromatin, 110heterosis, 102–3highlands
Andean see AltiplanoMalawi, 164–5
Index 231
historical perspectives (cultivation), 2,19–24, 26, 87–8
Bolivian germplasm collection,130–2, 134–6
see also originshoeing, inter-row, temperate regions
(incl. North America), 185Holland (Netherlands), 178, 180, 182,
187hot temperatures, tolerance in North
America, 173–4, 176, 177, 187Huayllas, Eufraen Huayllas, 220–1humidity
frost and, 176Malawi, 164storage and, 138, 139
hybrid(s)identifying, 117sterility, 102vigor, 102–3
hybridization, 99–102Hymenoptera, 67
parasitoid, 70, 71
IBTA (Bolivian Institute of AgriculturalTechnology), 131, 135, 151
identification of germplasm sample,correct, 140
Illpa (Puno in Peru), germplasm bank,7, 29, 89
in situ conservation, 89, 120, 132, 149Incas, 2, 26
Spanish conquest, 2, 25India, 92, 94, 99, 116, 183individual (pedigree) selection, 98,
101combined mass and, 102
industry see commerce and industryinflammation and saponins, 203inflorescence, selfing, 98information (germplasm), 147–8
dissemination, 153–4INIA see Institute of Agricultural
ResearchINIAF (National Institute for
Agricultural and ForestryResearch), 29, 89, 128, 131,132, 136
insects, 64–72beneficial (attacking phytophagous
insects), 65–72, 76–80as pests (herbivorous/phytophagous
insects), 63–86, 94Malawi, 169natural enemies, 63–86temperate regions (incl. North
America), 184–5
insoluble fiber, 198Institute of Agricultural Research
(INIA)Chile, 130, 135Peru, 89, 128, 130
INTA (National Institute ofAgricultural Technology), 130
inter simple sequence repeats (ISSR),144, 148
intercropping and insect pests, 79intergeneric cross, 102, 117intergenic spacer (IGS), NOR, 112International Plant Genetic Resource
Institute (IPGRI), 131, 133, 141International Quinoa Research
Symposium (2014), 225International Year of Quinoa, 22, 163,
211interspecific cross see Chenopodium
(non-C. quinoa)inverted sugars, 143, 144IPGRA (International Plant Genetic
Resource Institute), 131, 133,141
irrigationAfrica, 170South America, 37–8temperate regions (incl. North
America)heat stress and, 174saponins and, 186
isoflavones, 22, 205Italy, 90, 93, 177, 182
jasmonic acid, 75
Kabete Field Station, 166kaempferol, 73, 76, 205Kanckolla, 176, 178KASPar™ genotyping chemistry, 114Kenya, 166–9
La Pazgermplasm collection, 131, 136training courses, 151
labor costs for a Bolivian farmer, 212Laguna, Pablo, 224land use changes and yield in Southern
Bolivian Altiplano, 47, 48, 51,58, 60
see also acreagelandscape
natural pests and, 63yield in Southern Bolivian Altiplano
at landscape level, 47, 49, 51,56–7, 59, 60
latitude, 178
Bolivia, 136Chile, Southern, 20Kenya, 167
leaves, 27, 31succulence, and environmental stress,
11lectures and talks, 155, 156Lepidopteran pests, 39, 65, 67, 71, 75,
77see also moths
life cycle, farmers’ requirements, 94light saturation point and environmental
stress, 11–12limonene, 75linkage maps, 113–14linoleic acid (LA), 3, 75, 200α-linolenic acid (ALA), 3, 199, 200lipid (fat) content, 2–3, 199–200
germplasm collections, 143living well, 224–5llamas, 35, 80, 223–4
dung/manure, 31, 35, 59, 212, 222,224
local scale, time variation of yield inSouthern Bolivian Altiplano,54–6
lodging, 169resistance to, 94, 169
lowland (sea level) ecotype, Chilean, 5,19, 20, 26, 88, 90, 117, 119, 127
in temperate regions (incl. NorthAmerica), 175, 176, 177, 178,181
Lygaeidae, predatory, 70, 72Lygus, 184, 185
McKnight Foundation and projects,101, 103, 131
MAGDER (former name for MDRyT;Ministry of Rural Developmentand Land), 131
maize (corn)in African diet, 169chemical/nutrient composition,
194fatty acids, 199phenolic acid, 204protein, 195
Malawi, 163, 164–6pests and diseases, 169
male sterility, 97, 101malnutrition in Africa, 162–3maltose, 198Mamani, Danny, 224manual documentation of germplasm,
147, 148, 157
232 Index
manual labour, 77Africa, 170South America
harvesting, 39sowing/planting, 35, 223
marker-assisted selection, 103, 113see also genetic markers and
molecular markersmarketing, 211–26mass (bulk) selection, 98, 101
combined individual and, 102maturity, days to/period to
Kenya, 167, 168Malawi, 166temperate regions (incl. North
America), 175, 181–2MDRyT (Ministry of Rural
Development and Land-formerly MAGDER andMDRAyMA), 131
mechanizationNorth America (and other temperate
regions), harvesting, 181South America, 48, 72, 221
harvesting, 39, 95sowing, 34, 35
microsatellites (simple sequencerepeats), 103, 113, 117–18, 119,144, 148
migration, reverses, 224–5mildew, downy (Peronospora farinosa and
P. variabilis), 38, 90, 94, 126,183–4
minerals, 201–2Ministry of Rural Development and
Land (MDRyT; formerlyMAGDER and MDRAyMA),131
Miridae, predatory, 70, 72mixed cropping and insect pests, 79mobile DNA elements, 111moisture content of seed (in germplasm
collection)initial, 139reduction, 139
molecular genetics, 109–23see also genetic markers and
molecular markersmolluscicidal activity of saponins, 203monoculture, South America, 31, 79monophagous behavioral strategies of
insect pests, 73monounsaturated fatty acids (MUFA),
199, 200morphological and agromorphological
characteristicsdocumentation of germplasm
collections, 147
genetic diversity and, 116mechanized harvesting and, 95variations, 91
germplasm collections, 141–3moths
quinoa (Eurysacca melanocampta andE. quinoae), 64, 65, 77, 80, 184,185
ticona complex, 38, 64, 65, 77multiplication of germplasm, 144–6
preliminary, 136–8mutagenesis, 103
Nabidae, predatory, 70, 72Nairobi, 166, 167, 168National Association of Quinoa
Producers (ANAPQUI), 40,215
National Institute for Agricultural andForestry Research (INIAF), 29,89, 128, 131, 132, 136
National Institute of AgriculturalTechnology (INTA), 130
National System of Genetic Resourcesfor Food and Agriculture(SINARGEAA), 131
natural enemies and chemical responsesto insect herbivory, 63–85
Neotropical region, insect pests, 64, 65,68, 72, 77
Netherlands, 178, 180, 182, 187Neuroptera, 67
parasitoid, 70, 77nitrogen (N) fertilization, 36
temperate regions (incl. NorthAmerica), 178–9
nontranscribed spacer (NTS) regions of5S rRNA gene, 112
NOR intergenic spacer (IGS), 112North America, 173–92nutritional deficiencies in Africa, 162–3nutritional value/properties, 2–5, 163,
193–216Africa and, 163FAO on, 3, 4, 5, 22, 194, 195germplasm collections, 143–4
documentation/information,147–8, 153
see also diet
oat, chemical/nutrient composition, 194Olav, 180oligophagous behavioral strategies of
insect pests, 73olive oil, fatty acids, 199organic quinoa (using organic fertilizer),
31, 36–7, 80
Bolivian prices, 217temperate regions (incl. North
America), 179origin(s), 19–24, 161
centers of, 26, 28, 30, 34, 89, 116,119, 126–7, 133
orthodox vs. recalcitrant seed behavior,132
Oruro, Technical University (UTO), 88,128, 135
out-crossing (cross-pollination;allogamy), 27, 96–7, 117, 119,186
in germplasm collections, reducing,146
intergeneric, 102, 117interspecific/with allied taxa see
Chenopodium (non-C. quinoa)see also hybrids
packing of germplasm samples, 138,139–40
pampas (flat plains), 47, 48, 51, 52, 56,58, 59, 112
panicle shape and density (germplasmcollection), 142
parasitoids, 65, 70, 71, 76–7parents, selection of, 99–100participation (farmers and other
stakeholders)in breeding, 98–9in evaluation, 148–51
Patacamaya, 5, 7, 88, 93, 102, 131, 135,151, 153
pedigree (individual) selection, 98, 101Perez, Alfredo, 224Peric, Yeris Peric, 226Peronospora farinosa and P. variabilis
(and downy mildew), 38, 90, 94,126, 183–4
Peruacreage increases, 213, 217Andes see Altiplano; Andesgermplasm bank, 7, 29, 89, 128–30morphological variations, 91prices, 217temperate regions (incl. North
America) and varieties from,178, 181
pestsinsect see insectMalawi, 169non-insect, 39
birds, 39, 94, 186temperate regions (incl. North
America), 184–5PGRFA (Plant Genetic Resources for
Food and Agriculture), 125
Index 233
pHprotein content and, during
processing, 195soil, South America, 31
Pharastrepia sp. (thola), 80, 223phenolic compounds (incl. phenolic
acid), 76, 204phenological stages, 30, 32, 33, 34
predators of insects and, 77phenotypic diversity, 115–16phenylalanine ammonia lyase, 76phosphorus (P) fertilization
North America, 179South America, 36, 179
photoperiod (and photoperiodsensitivity), 6, 33–4, 96, 178
Africa, 168Kenya, 167, 168
photosynthesis and salinity, 9–11phytic acid, 76, 202phytoecdysteroids, 75phytogeography see geographical
distributionphytophagous insects see insectspig feed, 187Plant Genetic Resources for Food and
Agriculture (PGRFA), 125planting see sowing/plantingplateau, Andean see Altiplanoploidy level, 97plot scale, time variation of yield in
Southern Bolivian Altiplano,54–6
pollen exchange (in germplasmcollections), prevention, 146
pollinationartificial, 100, 101cross see out-crossingself-/auto- (autogamy), 6, 27, 96, 97
polyculture, 79polymorphisms (DNA), 113, 117
amplified fragment length, 113, 117,119
single-nucleotide, 103, 112, 113–14polyphagous (generalist) behavioral
strategies of insect pests, 73polyphenol, 76, 204polyploidy level, 97polysomaty, 111polyunsaturated fatty acids (PUFA),
199, 200Pomacea canaliculata, 203potassium (K), 37
applicationNorth America, 179South America, 36
poultry feed, 187
poverty, Bolivia farmers lifted out of,217–21
precipitationChilean arid areas, 21, 22Southern Bolivian Altiplano,
projections, 48, 49–50, 58see also hail; rainfall
predatorsof insect pests, insects as, 70, 71–2,
75, 76–7on quinoa see pests
PREDUZA project, 101, 103, 131prices, 215, 217, 221, 225
rising/higher, 164, 211, 212, 213,217, 220, 221, 224
production see acreage; cultivation;yields
productivity (crop/plant), SouthernBolivian Altiplano, 58
PROINPA Foundation, 29, 88–9, 101,126, 131, 132, 136, 148, 151,153
prolamins, 194, 195proline and drought resistance, 32promotion (of use), 153–5protease inhibitors, 75, 202protein (content and composition), 4, 5,
193–6germplasm collections, 143industry and consumer requirements,
95pseudograins and pseudocereals, 27, 28,
174pulse-reserve model, 58puna, 49, 118pyridoxine, 201
quality of life, 224–5quality traits and genetic diversity, 116quercetin, 73, 76, 204, 205quinoa moth (Eurysacca melanocampta
and E. quinoae), 64, 65, 77, 80,184, 185
radiationmutagenesis using, 103tolerance to, 33
rainfallAfrica, crops fed by, 170waterlogging and, 182
Real (Royal Quinoa), 5, 30, 127, 142, 152recalcitrant vs. orthodox seed behavior,
132Regalona, 20Regalona-Baer, 117, 182regeneration (rejuvenation) of
germplasm, 125, 144–5, 145,145–7
rejuvenation (regeneration) ofgermplasm, 125, 144–5, 145,145–7
repetitive DNA sequence, 110–11microsatellites (simple/single
sequence repeats), 103, 113,117–18, 119, 144, 148
reproduction, 96allogamous see out-crossingautogamous (self-/auto-pollination),
6, 27, 96, 97respiration and environmental stress, 12retail packs, 216retrotransposons, 111riboflavin, 201ribosomal RNA genes, 110, 111, 112rice, chemical/nutrient composition,
194phenolic acid, 204protein, 195vitamins, 201
RNA, ribosomal, genes, 110, 111, 112rodent pests, 39root/shoot ratio and drought resistance,
32rows
hoeing between, 185spacing, 179–80
Royal Quinoa (Real), 5, 30, 127, 142, 152rural areas
education, 156promotion and dissemination, 153,
154rutin, 73, 76rye, chemical/nutrient composition, 194
amino acids, 195
Sajama cultivar, 4, 101salar ecotype, 5, 19, 20, 26, 87–8, 90,
126–7temperate regions (incl. North
America), 183salinity and salt tolerance, 7–12
halophytes, 7, 32North America (and other temperate
regions), 176South America, 27, 32
salivary secretions of insects, 75–6salt flats
Bolivian farmers’ economics, 217–21ecotype see salar ecotype
Salt Overly Sensitive 1 (SOS1), 112–13salt tolerance see salinitysamples (germplasm)
characterization and evaluation,140–4
collection (sampling), 133–4
234 Index
samples (germplasm) (continued)sources, 134strategy, 134
conditioning, 138documentation, 134, 147–8germination of initial sample, 138handling, 134handling and documentation, 134packing, 138, 139–40seed number per, 137–8size, monitoring for, 145
San Luis Valley (Colorado), 97, 173, 175saponins, 3–4, 22, 75, 96, 186, 202–3
beneficial properties, 202–3bird predation and, 94, 186industry and consumer requirements,
95removal, 40temperate regions (incl. North
America), 186saturated fatty acids, 199–200Sclerotium rolfsii, 198sea level ecotype see lowland ecotypesecondary metabolites (SMs), 3, 72, 73,
74–6glycosylated see saponins
seed (and grain)color see colorexchanges, 20, 117, 118, 119–20fertilization affecting composition of,
179filling, 34, 167, 174, 178, 179
early, 31late, 31
genebanks see ex situ collectionsgermination see germinationharvest, South America, 39–40moisture content see moisturenumber/quantity (in germplasm
collection), 137–8monitoring, 145
nutritional content, 2–5amino acids, 194
orthodox vs. recalcitrant behavior,132
packing of samples, 138, 139–40saponin see saponinsize/diameter
germplasm collection, 142industry and consumer
requirements, 96sowing see sowingyield see yieldsee also single-seed descent
seed coat, saponins in, 3, 4, 22selection (in breeding), 98
bulk or mass see mass selection
individual/pedigree see individualselection
marker-assisted, 103of parents, 99–100
self-pollination (autopollination;autogamy), 6, 27, 96, 97
selfing of inflorescence, 98sexual reproduction see reproductionside-dishes, 216silage, 187simple (single) sequence repeats
(microsatellites), 103, 113,117–18, 119, 144, 148
SINARGEAA (National System ofGenetic Resources for Food andAgriculture), 131
single-nucleotide polymorphisms(SNPS), 103, 112, 113–14
single-seed descent, 102single-sequence (simple-sequence)
repeats (microsatellites), 103,113, 117–18, 119, 144, 148
social use, 152–5sodicity, 177soil conditions
South America, 31–2Southern Bolivian Altiplano soil
water storage, 52–4temperate regions (incl. North
America)fertilization affected by, 179planting affected by, 180
soluble fiber, 198SOS (Salt Overly Sensitive 1), 112–13South America, 25–45
acreage increases, 213–15, 217,221–4
agroecological conditions andregions, 5, 26, 30
agronomics, 30–2Andes of see Andesbreeding, 87–107cultivation see cultivationgeographical distribution see
geographical distributionhistory, 2, 19–24, 26, 87–8
Spanish conquest, 2, 20–1, 22, 25,26, 88, 112, 161
mechanization, 48, 72, 221monoculture, 31, 79pest control, 63–85see also specific countries and regions
sowing/plantingSouth America, 34–6, 223temperate regions (incl. North
America), 179–81soy, amino acids, 195spacing, row, 179–80
Spanish conquest of South America, 2,20–1, 22, 25, 26, 88, 112, 161
specialist behavioral strategies of insectpests, 73
species of Chenopodium, non-quinoa seeChenopodium
sprouting (preharvest), temperateregions (incl. North America),182–3
stalk strength, 94see also lodging
Standard for Genebanks, 137, 138, 139,140, 145, 146
Standardized PrecipitationEvapo-transpiration Index,Southern Bolivian Altiplano,49–50, 52, 53, 57
starch (and starch granules), 3, 196–8germplasm collections, 143
stearic acid, 199, 200sterility
hybrid, 102male, 97, 101
stomata and environmental stress, 8, 9,10, 11
storage of germplasm, 138–40subtropical (Bolivian Yungas) ecotype, 5,
19, 88, 90, 115, 127, 177–8sugar, 198
inverted, 143, 144see also carbohydrate
supply and demand, 213–15sustainability, woman farmer’s thoughts
on, 221–4Swaeda foliosa, 89, 102swathing, 181Sweden, 175, 186swelling power of starch, 198Syrphidae, predatory, 70, 185systemin, 75
talks and lectures, 155, 156taxonomy, 27–8Technical University of Oruro (UTO),
88, 128, 135telomeric repeat, 110–11temperate regions incl. North America,
173–92temperature
drought resistance and, SouthAmerica, 33–4
gelatinization (of starch), 197–8germination and, temperate regions
(incl. North America), 180–1processing, effects on protein, 195see also cold temperatures; heat
tolerance
Index 235
terpenoids, 74–6tetraploid taxa, crossability with other
species of see out-crossingthola (Pharastrepia sp.), 80, 223threshing, South America, 39ticona complex (moths), 38, 64, 65, 77Titicaca, Lake, 5, 27, 28, 29, 88, 90, 115,
119, 131, 215community training courses of varied
uses, 149–51Titicaca cultivar, 9, 166, 177tocopherol (vitamin E), 3, 201Toralapa Centre (INIAF), 89, 128, 132towns see urban areastractors, 223training courses of varied uses, 149–51transpiration and environmental stress,
10transposons, 111Tucuman (Argentina), insect pests, 65,
77
UMSA (Universidad Mayor de SanAndres), 27, 88, 128, 131
United Nations’ International Year ofQuinoa, 22, 163, 211
United States, 89, 96, 225market, 211, 215, 215–16, 221
unsaturated fatty acids, 143, 199, 200,201
urban (town) areaseducation, 156promotion and dissemination, 153,
154uses/utilization, 186–7
alternative (to human foodstuff),186–7
germplasm, 148–55UTO (Technical University of Oruro),
88, 128, 135Utusaya variety, 9, 183Uyuni, 5, 47, 49, 99
valley quinoa, 5, 19, 26, 30, 88, 126in temperate regions (incl. North
America), 175, 177, 178varieties see cultivars and varietiesvegetative period/cycle, 6, 8
drought and, 175germplasm collection, 142–3low temperatures and, 33
ventilation, 39–40vigor, hybrid, 102–3viruses, entomopathogenic, 72vitamins, 200–1
vitamin E (tocopherol), 3, 201volatile compounds, 76, 80
antiherbivore, 73, 75
walnut, fatty acids, 199Washington state, 173, 174, 175, 178,
181, 182, 183, 184, 185, 186Washington State University (WSU),
164, 174International Quinoa Research
Symposium (2014), 225water
South Americacrop requirements, 37–8Southern Bolivian Altiplano soil
water storage, 52–4stress, 33, 34
see also arid regions; drought; frost;hail; humidity; irrigation;moisture; precipitation; rainfall
water (H2O)/CO2 gas exchange andenvironmental stress, 10
water filling, 144waterlogging, 180, 182–3weeding
South America, 37temperate regions (incl. North
America), 185–6wheat, chemical/nutrient composition,
194fatty acids, 199phenolic acid, 204protein, 195vitamins, 201
windpollination by, 97protection from, 223
winter crop in US, 175women farmers production practices,
221–4
yields (grain)germplasm collection, 143higher, required by farmers, 92–3Kenya, 167–9Malawi, 166, 167Southern Bolivia Altiplano, trends,
47–62temperate regions (incl. North
America), 181–2Yungas (subtropical) ecotype, 5, 19, 88,
90, 115, 127, 177–8
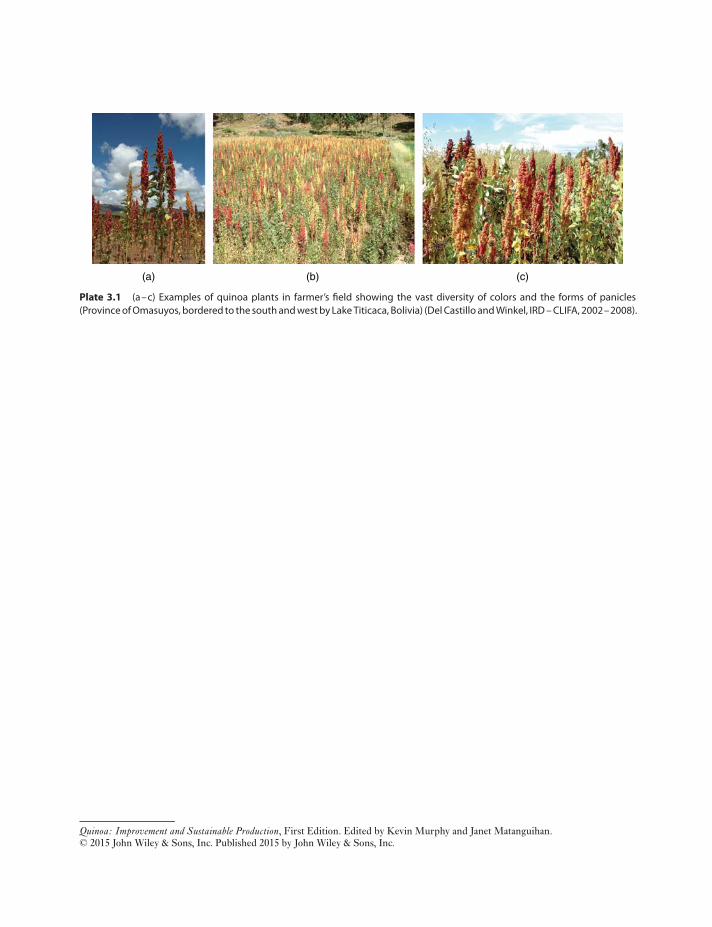
(a) (b) (c)
Plate 3.1 (a–c) Examples of quinoa plants in farmer’s field showing the vast diversity of colors and the forms of panicles(Province of Omasuyos, bordered to the south and west by Lake Titicaca, Bolivia) (Del Castillo and Winkel, IRD – CLIFA, 2002–2008).
Quinoa: Improvement and Sustainable Production, First Edition. Edited by Kevin Murphy and Janet Matanguihan.© 2015 John Wiley & Sons, Inc. Published 2015 by John Wiley & Sons, Inc.
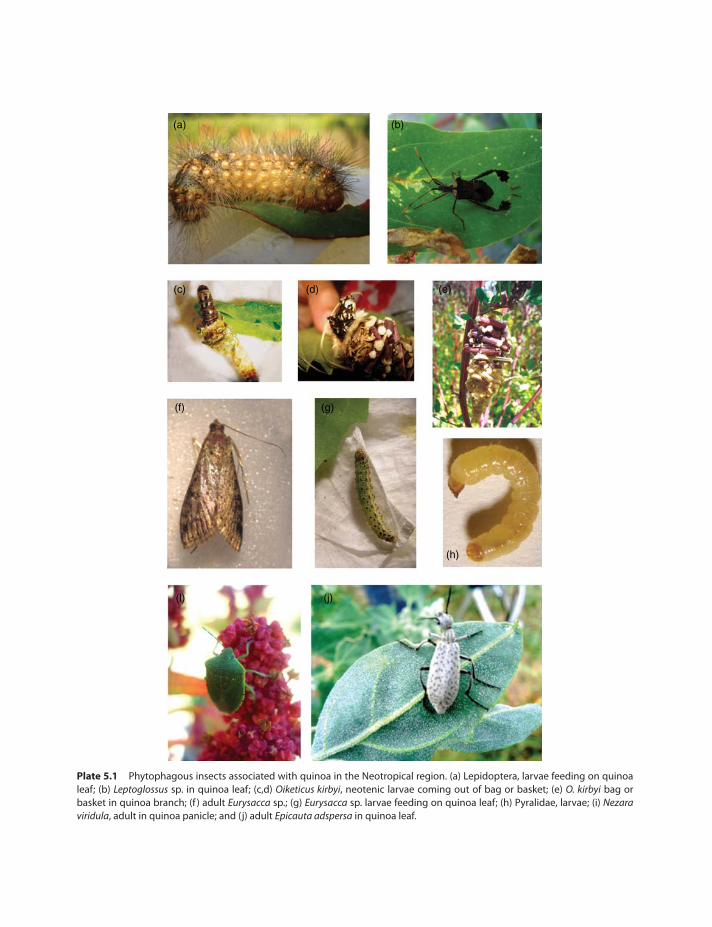
(a)
(c)
(f) (g)
(h)
(j)(l)
(d) (e)
(b)
Plate 5.1 Phytophagous insects associated with quinoa in the Neotropical region. (a) Lepidoptera, larvae feeding on quinoaleaf; (b) Leptoglossus sp. in quinoa leaf; (c,d) Oiketicus kirbyi, neotenic larvae coming out of bag or basket; (e) O. kirbyi bag orbasket in quinoa branch; (f ) adult Eurysacca sp.; (g) Eurysacca sp. larvae feeding on quinoa leaf; (h) Pyralidae, larvae; (i) Nezaraviridula, adult in quinoa panicle; and (j) adult Epicauta adspersa in quinoa leaf.
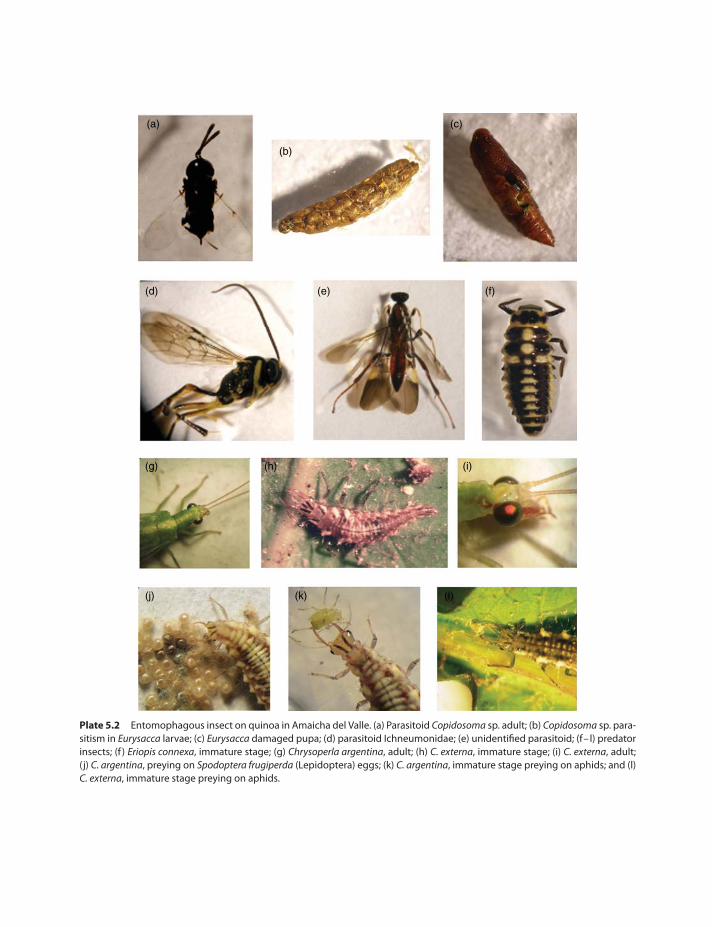
(a)
(d)
(g) (h) (i)
(l)(k)(j)
(e) (f)
(b)
(c)
Plate 5.2 Entomophagous insect on quinoa in Amaicha del Valle. (a) Parasitoid Copidosoma sp. adult; (b) Copidosoma sp. para-sitism in Eurysacca larvae; (c) Eurysacca damaged pupa; (d) parasitoid Ichneumonidae; (e) unidentified parasitoid; (f–l) predatorinsects; (f ) Eriopis connexa, immature stage; (g) Chrysoperla argentina, adult; (h) C. externa, immature stage; (i) C. externa, adult;(j) C. argentina, preying on Spodoptera frugiperda (Lepidoptera) eggs; (k) C. argentina, immature stage preying on aphids; and (l)C. externa, immature stage preying on aphids.
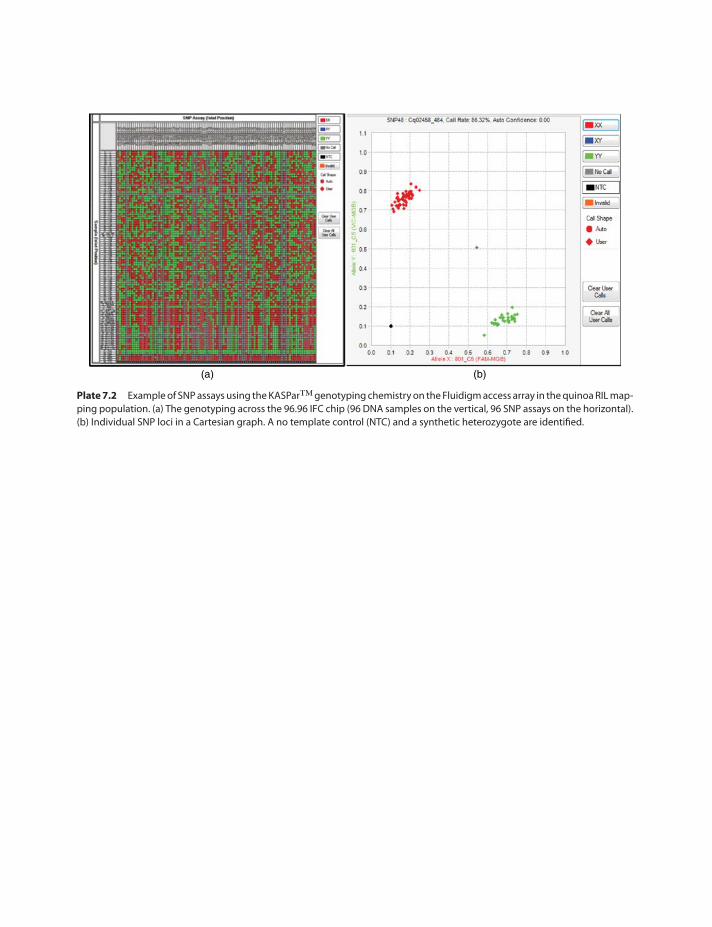
(a) (b)
Plate 7.2 Example of SNP assays using the KASPar™ genotyping chemistry on the Fluidigm access array in the quinoa RIL map-ping population. (a) The genotyping across the 96.96 IFC chip (96 DNA samples on the vertical, 96 SNP assays on the horizontal).(b) Individual SNP loci in a Cartesian graph. A no template control (NTC) and a synthetic heterozygote are identified.
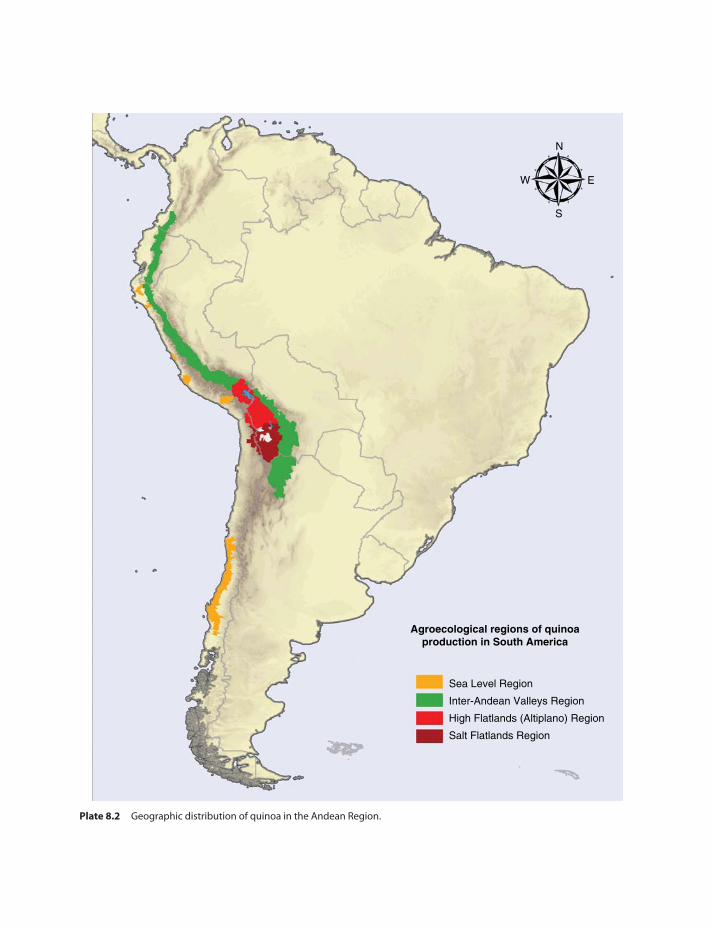
Agroecological regions of quinoaproduction in South America
Sea Level Region
Inter-Andean Valleys Region
High Flatlands (Altiplano) Region
Salt Flatlands Region
W
N
E
S
Plate 8.2 Geographic distribution of quinoa in the Andean Region.
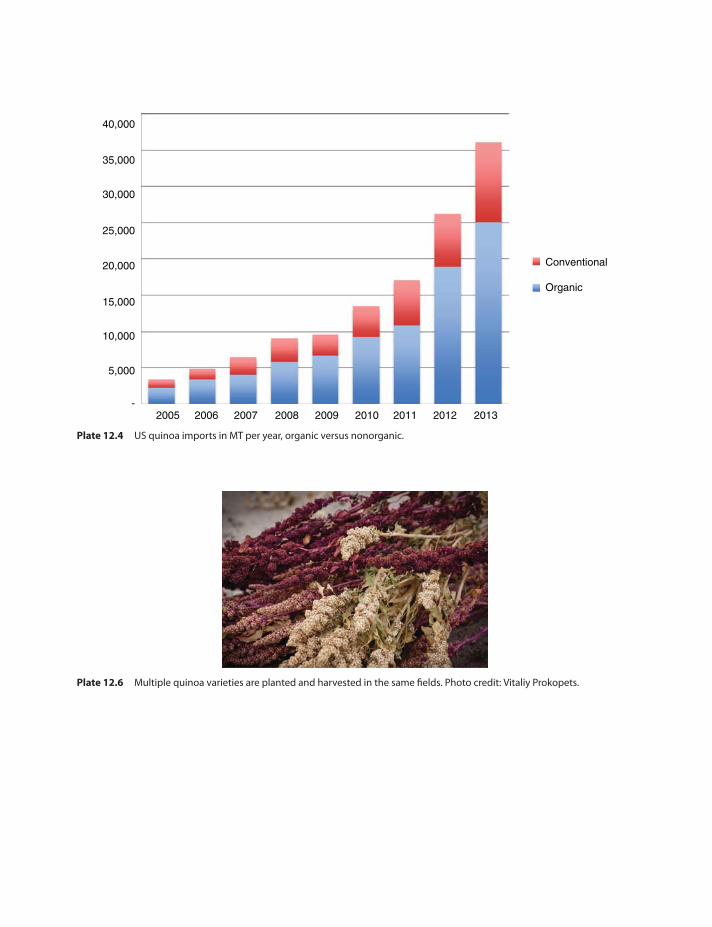
40,000
35,000
30,000
25,000
20,000
15,000
10,000
5,000
-2005 2006 2007 2008 2009 2010 2011 2012 2013
Conventional
Organic
Plate 12.4 US quinoa imports in MT per year, organic versus nonorganic.
Plate 12.6 Multiple quinoa varieties are planted and harvested in the same fields. Photo credit: Vitaliy Prokopets.

WILEY END USER LICENSE AGREEMENTGo to www.wiley.com/go/eula to access Wiley’s ebook EULA.