Embed Size (px)
Citation preview

Q u i l p i e S h i r e C o u n c i l
B u d g e t 2 0 1 9 / 2 0
T A B L E o f C O N T E N T S
1 MESSAGE FROM THE MAYOR .................................................................................................... 1
2 BUDGET OVERVIEW ................................................................................................................ 3
2.1 INTRODUCTION ........................................................................................................................................ 3
2.2 REVENUE STATEMENT 2019/2020 ........................................................................................................... 3
2.3 LONG TERM FINANCIAL FORECAST .......................................................................................................... 3
2.4 FINANCIAL SUSTAINABILITY RATIOS ......................................................................................................... 4
2.5 EXTERNAL INFLUENCES ............................................................................................................................ 4
2.6 FINANCIAL MANAGEMENT STRATEGY ..................................................................................................... 5
3 BUDGET SUMMARY ................................................................................................................ 5
3.1 INTRODUCTION ........................................................................................................................................ 5
3.2 REVENUE .................................................................................................................................................. 6
3.3 RATES REVENUE ....................................................................................................................................... 6
3.4 EXPENDITURE ........................................................................................................................................... 7
4 CAPITAL WORKS .................................................................................................................... 7
5 STATEMENT OF COMPREHENSIVE INCOME .................................................................................... 9
6 BALANCE SHEET ................................................................................................................... 13
7 STATEMENT OF CHANGES IN EQUITY ......................................................................................... 15
8 STATEMENT OF CASHFLOW ..................................................................................................... 17
9 STATEMENT OF CAPITAL FUNDING ............................................................................................ 19
10 SUSTAINABILITY RATIOS ......................................................................................................... 21
APPENDIX 1 – REVENUE STATEMENT 2018/19 ................................................................................. 22
APPENDIX 2 – REVENUE POLICY .................................................................................................... 31
APPENDIX 3 – DEBT POLICY ...........................................................................................................39
APPENDIX 4 – INVESTMENT POLICY .................................................................................................43
APPENDIX 5 – CAPITAL WORKS PROGRAM ........................................................................................49
APPENDIX 6 - SCHEDULE OF FEES & CHARGES ....................................................................................52

Q u i l p i e S h i r e C o u n c i l
B u d g e t 2 0 1 9 / 2 0
1 Message from the Mayor
The Quilpie Shire Council has had another solid year,
financially, in the 2018-19 year. We have seen our budget
forecasts from a year ago being met and, in fact, our
financial position is significantly better than we
estimated when the 2018-19 budget was brought down
12 months ago. Our cash position is about $5.4M ahead
of our budget forecast although, in real terms, because
of grant pre-payments, this figure is around $4.0M, still a
great result. As I stated last year, Council has a lot of
confidence in our financial management. That
confidence comes from consistently, year after year,
seeing our financial position matching or improving on
what was forecast in our budget 12 months previously.
This strong financial forecasting, and adherence to that forecasting, is occurring in a period of substantial capital
improvements and asset replacement and maintenance. Strong cash positions can sometimes be obtained by
reducing spending on capital works and asset maintenance but this is flawed financial management as, eventually,
the lack of spending will catch up with you as your assets deteriorate and/or your public infrastructure fails to sustain
the quality of life that the rest of the country enjoys.
I noted, with some frustration, a QAO (Queensland Audit Office) report to the State Government recently where a
large number of councils, predominately rural and regional, were assessed as financially unsustainable in the
medium to long term. This included Quilpie Shire. In the 22 years since I have been on the council I have seen our
cash reserve grow from around $1M to $20M and substantial capital improvements and social investment has
occurred in that time. All of this has happened without incurring any debt. With the State Government’s debt in
excess of $80 Billion (and growing), the highest of any state in the country, I would suggest the QAO concentrate on
the sustainability of their government and let those of us in the regions who know what they are doing get on with
our sustainable future.
CAPITAL WORKS
We have an expanded capital works budget this next financial year of $9.7M up on last year’s figure of $7.8M. This
figure is blown out somewhat by the allocation of $4M towards the ENHM Stage 2 construction, 90% of which is
funded by external grants. Council has also allocated funds to continue to develop the business case for the Quilpie
Wellspring project. We have also had success in sourcing external funding to construct a new town bore to replace
the old original one which is well past it’s “use by” date. Other capital works are listed below but we are, in essence,
adhering to Council’s commitment to maintain our critical infrastructure in good or upgraded condition.
RATES AND CHARGES
In recognition of the particularly difficult year that our shire businesses and ratepayers have endured, Council will
not have our normal CPI rate increase this year. We are also very mindful of the fact that our rural and resources
sectors have had to absorb wildly fluctuating valuation increases brought down last year. Some of those ratepayers
will still see an increase in their individual rates purely because the two mechanisms that we put in place last year,
a 25% cap and land valuation averaging, will mean there will be some catching up to do. We have reduced the cap
to 10% so that none of the individual ratepayers affected by these large valuation increases should see an increase
of more than that. Minimum rates have been increased slightly by around CPI.
Charges will continue to attract a CPI increase of around 1.5% but, as I remind everyone each year, we are in the
strong position where the majority of our services that council offers are self-funding, as they should be. These
Quilpie Shire Council Budget 2019-2020 1 | Page

Q u i l p i e S h i r e C o u n c i l
B u d g e t 2 0 1 9 / 2 0
services are water, sewage and waste disposal. Many of council costs are increasing by more than CPI so the full
funding of our service provision needs to be closely monitored.
In closing, on behalf of Council, I would like to congratulate our staff on bringing in another financial year on budget,
while maintaining, or in some cases, increasing the level and standard of service that they provide to our community.
The challenges never go away but the methodical and controlled financial methods that are implemented to meet
them continue to deliver.
I am happy to discuss any budget issues any time.
Kind regards,
Stuart Mackenzie
Mayor
Quilpie Shire Council Budget 2019-2020 2 | Page

Q u i l p i e S h i r e C o u n c i l
B u d g e t 2 0 1 9 / 2 0
2 Budget Overview
2.1 INTRODUCTION
Council is pleased to present its Annual Budget that converts the strategies and initiatives contained in Council’s Corporate Plan and Operational Plan into financial terms to ensure that there are sufficient resources for their achievement while ensuring financial sustainability.
The budget must:
- Be prepared on an accrual basis;
- Include the following statements for 2019/2020, 2020/21 and 2021/2022:
Financial Position (Balance Sheet) including changes in equity;
Cash Flow; and
Income and Expenditure.
- Include a Long-Term Financial Forecast;
- Be accompanied by its Revenue Statement;
- Include the following measures of financial sustainability:
Asset sustainability ratio;
Net financial liabilities ratio; and
Operating surplus ratio.
- Include total value of the change, expressed as a percentage, in the rates and utility charges levied for 2018/19 compared with the rates and utility charges levied in the previous budget; and
- Be consistent with the corporate plan and annual operational plan.
2.2 REVENUE STATEMENT 2019/2020
The Revenue Statement is an explanatory statement that outlines and explains the revenue measures adopted in the budget. The document includes the following matters:
- How rates and charges are determined;
- Details on all rebates and concessions;
- Details on any limitations in increases on rates and charges;
- Criteria used to decide the amount of the cost-recovery fees;
- Criteria for approval of early payment discount for late payments;
- Details on collection of outstanding rates including the process for arrangements to pay; and
- Details of payment methods.
The document will be of particular interest to ratepayers, community groups, government departments and other interested parties who seek to understand the revenue policies and practices of the Council.
2.3 LONG TERM FINANCIAL FORECAST
A Long-Term Financial Plan for the years 2019/2020 to 2028/2029 has been developed to assist Council in adopting its 2019/2020 budget within a longer-term financial framework. The key objective of the Financial Plan is to deliver operational surpluses in the medium to long-term, whilst still achieving the Council’s strategic outcomes as specified in the Corporate Plan.
While certain assumptions were made in preparing forecasts for the Financial Plan, they are based on current knowledge available and are generally conservative in nature:
- Minimal growth in fees and charges revenue;
Quilpie Shire Council Budget 2019-2020 3 | Page

Q u i l p i e S h i r e C o u n c i l
B u d g e t 2 0 1 9 / 2 0
- General rate revenue has been based on a 2% increase from 2020/2021 onwards;
- Continuation of the Pest Management (Pest Animal) Levy;
- Service and utility charges have been based on a 2% increase annually. Sewerage charges are expected to cover all operational costs however water charges and waste management charges do not and rely on a cross subsidy or Community Service Obligation;
- Federal Financial Assistance Grant have been indexed by CPI for 2019/2020 and then indexed by 2% for future years.
- Federal Roads to Recovery is set to continue in the medium term and is dependent on the Federal Government’s commitment. Allowance has been made for these to continue over the 10 year forecast.
- Staffing levels are under regular review in response to growth in assets and service delivery expectations. Wages and employee costs are forecast to increase by 2.5% annually; and
- Levels for capital works in forward budgets are relatively consistent.
The long-term financial forecast indicates Council delivering operating deficits over most of the 10 year reporting period. With the assistance of loans for two major projects, Council’s cash position is anticipated to remain relatively stable through the reporting period, albeit lower than current levels.
2.4 FINANCIAL SUSTAINABILITY RATIOS
In relation to the three identified financial sustainability ratios, the financial forecast indicates the following:
- Operating Surplus Ratio: With a lower limit target of 0% and an upper limit target of 15%, the forecast indicates negative returns for all but two years in the reporting period of ten years. Whilst of some concern in the first two years of the reporting period, the ratios are quite modest negatives for the balance.
- Net Financial Asset / Liability Ratio: With a upper limit target of 60%, the forecast indicates this will be achieved over the reporting period.
- Asset Sustainability Ratio: With a lower limit target of 90%, the forecast indicates this will not be achieved over the reporting period of ten years. Council will have to review their proposed asset replacement / asset renewal strategy in coming years.
2.5 EXTERNAL INFLUENCES
In preparing the 2019/2020 budget a number of external influences have been taken into consideration because of their significant impact on Council’s ability to fund the services delivered during the budget period:
- The Valuer-General undertook a general revaluation of land in 2017/18 and new valuations were issued for 2018/2019. The new valuations provided for some very significant increases and decreases in valuations and made it challenging for Council to strike an equitable rate in the dollar, particularly in the rural categories in 2018/2019. New valuations were not issued for the 2019/2020 year.
- Local Government financial sustainability in rural and regional areas is challenged by the reduction in State and Federal Grants and limited capacity for increasing or extending the rate base. Council has been buoyed by the recent rounds of the Works for Queensland Program initiated by the State Government.
- In recent years the Federal Government has pre-paid approximately 50% of the Financial Assistance Grant (FAGs). The Government has not announced its intention to continue that practice for the coming financial year at the time of finalising this budget.
- Council undertook a comprehensive review of their long-term financial plan in 2017/18 and will undertake a further review in 2019/2020 to ensure its long-term sustainability.
- The reduction in grant monies from State and Federal Government requires a pro-active approach to ensure we pursue opportunities to maximise our grant and subsidy revenues.
Quilpie Shire Council Budget 2019-2020 4 | Page

Q u i l p i e S h i r e C o u n c i l
B u d g e t 2 0 1 9 / 2 0
- Council has continued to strengthen its relationship with the Department of Transport and Main Roads and will continue to pursue contracts for roadworks within and out of the Shire.
- Significant parts of the shire are frequently subject to flooding and this has a substantial effect on the Council’s financial performance and the cost of provision of most of its services. Overall, a major flood event has three impacts on the Council. Firstly, there is a significant loss of assets, which appears as a cost in the Council’s accounts. Secondly, the Council rebuilds the affected assets, either with its own workforce or, where that is not feasible, with contractors. Thirdly, the State and Commonwealth Governments provide funding to pay for a substantial element of the cost of rebuilding.
The financial effect of these events is complex, and the timing (together with the requirements of the Accounting Standards) means that expenditure in respect of a flood event is not normally matched with the income from the grant in the same financial year.
Because the timing and size of flood events cannot be predicted, such events occurring in the future have not been included in the financial projections.
2.6 FINANCIAL MANAGEMENT STRATEGY
Providing Council can maintain its budgetary constraint, it will be in a strong financial position throughout the forecasting period, with sufficient positive cash flow to maintain its asset base and to meet community expectations in respect of the range and quality of its services. Council regularly reviews its programmes with a view to eliminating unnecessary costs, and looking for opportunities to increase its revenue streams.
It is reasonable to anticipate that additional funding may become available, which would allow Council to spend additional amounts on asset replacement and renewal. Where realistic opportunities arise, these would be included in future budget revisions.
Council intends to fully fund its depreciation, with the resulting funds available for reinvesting in assets.
3 Budget Summary
3.1 INTRODUCTION
The 2019/2020 budget has been prepared and presented by the Mayor in accordance with the Local Government Act 2009.
The budget gives council authority to raise $23.2M of revenue to fund its operations and planned capital spends.
With planned expenditure of $23.4M, Council’s 2019/2020 operating result will be a deficit of $157,788 subsequent to a 2018/2019 (forecasted) surplus of $2,943,248. The forecast surplus for 2018/2019 compares favourably to the originally budgeted surplus of $619,701 as a result of local economic conditions, organisational efficiencies and the prepayment of various grants.
The budget is consistent with the Corporate Plan 2017-2022 as reviewed by Council in May 2019.
The budgeted financial statements are provided in Tables 1, 2, 3 and 4.
A Statement of Capital Funding is provided in Table 5 and a summary of the legislated financial sustainability ratios is provided in Table 6.
Council has a range of financial policies that complement the budget, these include:
- Revenue Statement Appendix 1
- Revenue Policy Appendix 2
- Debt Policy Appendix 3
- Investment Policy Appendix 4
Other documents that support the budget are:
- Capital Works Program Appendix 5
- Schedule of Fees and Charges Appendix 6
Quilpie Shire Council Budget 2019-2020 5 | Page

Q u i l p i e S h i r e C o u n c i l
B u d g e t 2 0 1 9 / 2 0
3.2 REVENUE
Council’s revenue statement can be viewed at Appendix 1. Council is required to revise its revenue policy and revenue statement each financial year.
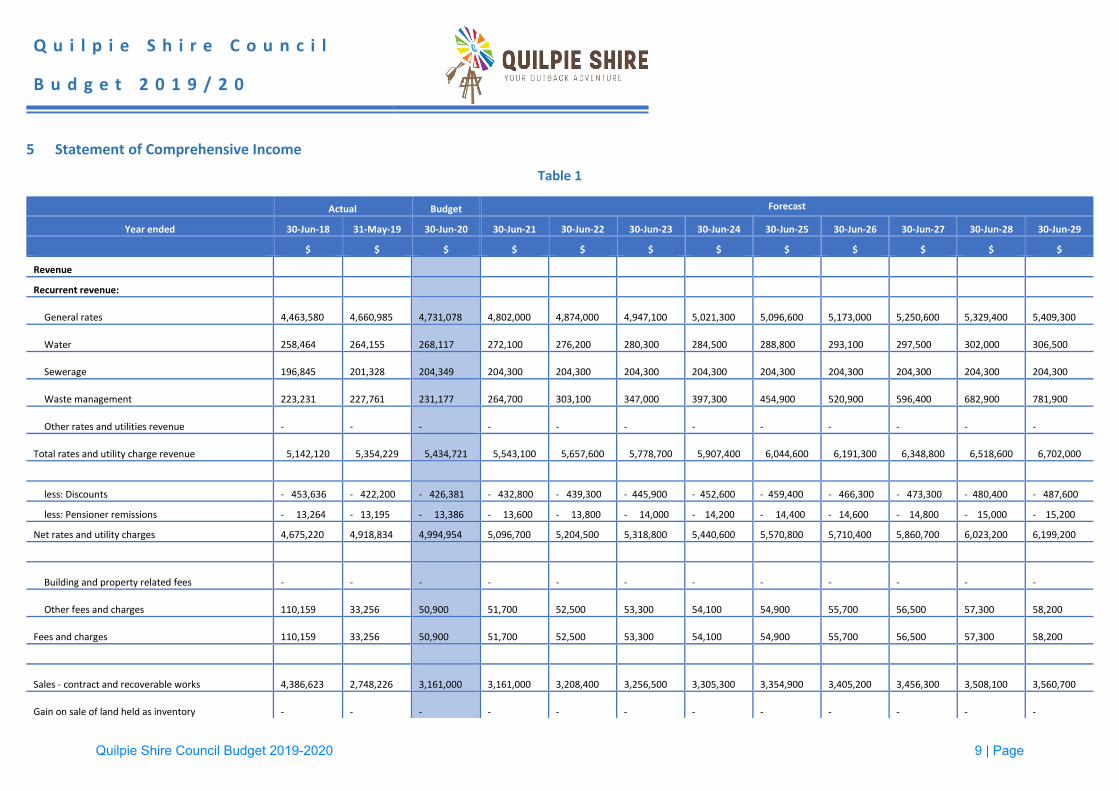
The income statement at Table 1 includes the expected revenue for 2019/2020 and the forward ten year reporting period. It provides an overview of the total expected revenue for rates and utility charges, less discounts and concessions and council’s fees and charges. The investment income relates to interest on bank balances and investments.
Government grants and contributions include all monies received from state and federal sources for the purposes of funding the delivery of council’s services to ratepayers. This includes the Financial Assistance Grant and other miscellaneous grants.
Other Revenue consists of revenue not separately categorised above. It includes, but is not limited to, revenues such as legal recoveries, bad debt recoveries, private works and sponsorships.
3.3 RATES REVENUE
Rates and charges revenue account for approximately 19% of Council’s income.
Due to the large fluctuations in rural land valuations in 2018/2019, valuation averaging over two years and capping has been continued to offset the impacts on rural ratepayers.
The following table summarises the changes for 2019/2020 in relation to the previous financial year.
2018/2019 Rates Levied 2019/2020 Budget Change
General Rates $4,660,984 $4,733,864 1.56%
Water Charges $264,155 $269,397 1.98%
Quilpie Shire Council Budget 2019-2020 6 | Page

Q u i l p i e S h i r e C o u n c i l
B u d g e t 2 0 1 9 / 2 0
Sewerage Charges $201,328 $205,247 1.73%
Waste Charges $227,761 $232,463 1.21%
Total $5,354,228 $5,440,971 1.62%
Total value of the change, expressed as a percentage, in the rates and utility charges levied for 2019/2020 compared with the rates and utility charges levied in the previous budget is 1.6%
3.4 EXPENDITURE
Expenditure includes employee costs, materials and services, depreciation and finance costs.
Employee costs include all labour related expenditure such as wages and salaries and associated allowances, leave entitlements and employer superannuation. It also includes payments for external labour hire where the position or skill cannot be filled by internal staff.
Materials and Services includes but is not limited to, costs relating to council buildings maintenance, employee related costs such as training and uniforms, plant hire, purchasing of equipment, software licences and other IT costs, marketing, repairs and maintenance to council’s infrastructure, water pumping costs for the Haughton pipeline, utilities and insurance and donations given to the community.
Depreciation is an accounting measure which reflects the consumption of the council’s infrastructure, property plant and equipment. Finance costs relate to interest and fees on borrowings.
4 Capital Works
The 2019/2020 capital works program totals $9,750,500 across a range of infrastructure projects. 68% of this is new capital projects and 32% is replacement of existing assets.
Key initiative include:
- $4M for the Eromanga Natural History Museum Stage 2A with the balance to be budgeted for in the 2020/2021 financial year;
- $543,000 in various other building projects;
- $987,000 in various structures and park facilities;
- $1,147,000 in plant replacement and upgrades;
- $1,430,000 in various local road rehabilitation and upgrades;
- $1,248,500 for a new town water supply bore in Quilpie;
- $200,000 in water main replacements.
These works are funded from $4,204,100 of capital income contained within the operating budget and from depreciation.
Quilpie Shire Council Budget 2019-2020 7 | Page

Q u i l p i e S h i r e C o u n c i l
B u d g e t 2 0 1 9 / 2 0
Quilpie Shire Council Budget 2019-2020 8 | Page
Q u i l p i e S h i r e C o u n c i l
B u d g e t 2 0 1 9 / 2 0
5 Statement of Comprehensive Income
Table 1
Actual Budget Forecast
Year ended 30-Jun-18 31-May-19 30-Jun-20 30-Jun-21 30-Jun-22 30-Jun-23 30-Jun-24 30-Jun-25 30-Jun-26 30-Jun-27 30-Jun-28 30-Jun-29
$ $ $ $ $ $ $ $ $ $ $ $
Revenue
Recurrent revenue:
General rates 4,463,580
4,660,985
4,731,078
4,802,000
4,874,000
4,947,100
5,021,300
5,096,600
5,173,000
5,250,600
5,329,400
5,409,300
Water 258,464
264,155
268,117
272,100
276,200
280,300
284,500
288,800
293,100
297,500
302,000
306,500
Sewerage 196,845
201,328
204,349
204,300
204,300
204,300
204,300
204,300
204,300
204,300
204,300
204,300
Waste management 223,231
227,761
231,177
264,700
303,100
347,000
397,300
454,900
520,900
596,400
682,900
781,900
Other rates and utilities revenue -
-
-
-
-
-
-
-
-
-
-
-
Total rates and utility charge revenue
5,142,120
5,354,229
5,434,721
5,543,100
5,657,600
5,778,700
5,907,400
6,044,600
6,191,300
6,348,800
6,518,600
6,702,000
less: Discounts - 453,636 - 422,200 - 426,381 - 432,800 - 439,300 - 445,900 - 452,600 - 459,400 - 466,300 - 473,300 - 480,400 - 487,600
less: Pensioner remissions - 13,264 - 13,195 - 13,386 - 13,600 - 13,800 - 14,000 - 14,200 - 14,400 - 14,600 - 14,800 - 15,000 - 15,200
Net rates and utility charges 4,675,220 4,918,834 4,994,954 5,096,700 5,204,500 5,318,800 5,440,600 5,570,800 5,710,400 5,860,700 6,023,200 6,199,200
Building and property related fees -
-
-
-
-
-
-
-
-
-
-
-
Other fees and charges 110,159
33,256
50,900
51,700
52,500
53,300
54,100
54,900
55,700
56,500
57,300
58,200
Fees and charges 110,159
33,256
50,900
51,700
52,500
53,300
54,100
54,900
55,700
56,500
57,300
58,200
Sales - contract and recoverable works 4,386,623
2,748,226
3,161,000
3,161,000
3,208,400
3,256,500
3,305,300
3,354,900
3,405,200
3,456,300
3,508,100
3,560,700
Gain on sale of land held as inventory -
-
-
-
-
-
-
-
-
-
-
-
Quilpie Shire Council Budget 2019-2020 9 | Page

Q u i l p i e S h i r e C o u n c i l
B u d g e t 2 0 1 9 / 2 0
Actual Budget Forecast
Year ended 30-Jun-18 31-May-19 30-Jun-20 30-Jun-21 30-Jun-22 30-Jun-23 30-Jun-24 30-Jun-25 30-Jun-26 30-Jun-27 30-Jun-28 30-Jun-29
$ $ $ $ $ $ $ $ $ $ $ $
General purpose grants 6,381,125
4,688,970
5,000,000
5,000,500
5,001,000
5,001,500
5,002,000
5,002,500
5,003,000
5,003,500
5,004,000
5,004,500
State government grants and subsidies -
-
4,862,186
4,862,700
4,863,200
4,863,700
4,864,200
4,864,700
4,865,200
4,865,700
4,866,200
4,866,700
Other non-government subsidies -
-
250,000
250,000
250,000
250,000
250,000
250,000
250,000
250,000
250,000
250,000
Grants, subsidies, contributions and donations 6,381,125
4,688,970
10,112,186
10,113,200
10,114,200
10,115,200
10,116,200
10,117,200
10,118,200
10,119,200
10,120,200
10,121,200
Interest from overdue rates and utility charges -
-
364,520
370,000
375,600
381,200
386,900
392,700
398,600
404,600
410,700
416,900
Interest received from investments 433,144
394,319
-
-
-
-
-
-
-
-
-
-
Other sources -
-
-
-
-
-
-
-
-
-
-
-
Interest received 433,144
394,319
364,520
370,000
375,600
381,200
386,900
392,700
398,600
404,600
410,700
416,900
Profit/(loss) from investments - - - - - - - - - - - -
Rental income 302,382
272,095
300,000
304,500
309,100
313,700
318,400
323,200
328,000
332,900
337,900
343,000
Other operating revenue -
57,598
33,191
33,700
34,200
34,700
35,200
35,700
36,200
36,700
37,300
37,900
Other recurrent income -
57,598
33,191
33,700
34,200
34,700
35,200
35,700
36,200
36,700
37,300
37,900
Total recurrent revenue 16,288,653
13,113,298
19,016,751
19,130,800
19,298,500
19,473,400
19,656,700
19,849,400
20,052,300
20,266,900
20,494,700
20,737,100
Capital revenue:
Grants, subsidies, contributions and donations 3,271,829
3,539,911
4,204,100
2,280,000
100,000
4,000,000
4,000,000
-
-
-
4,000,000
4,000,000
Other capital contributions -
-
-
-
-
-
-
-
-
-
-
-
Total capital revenue 3,271,829
3,539,911
4,204,100
2,280,000
100,000
4,000,000
4,000,000
-
-
-
4,000,000
4,000,000
Quilpie Shire Council Budget 2019-2020 10 | Page

Q u i l p i e S h i r e C o u n c i l
B u d g e t 2 0 1 9 / 2 0
Actual Budget Forecast
Year ended 30-Jun-18 31-May-19 30-Jun-20 30-Jun-21 30-Jun-22 30-Jun-23 30-Jun-24 30-Jun-25 30-Jun-26 30-Jun-27 30-Jun-28 30-Jun-29
$ $ $ $ $ $ $ $ $ $ $ $
Capital income:
Gain on sale of property, plant and equipment 212,953
27,717
-
-
-
-
-
-
-
-
-
-
Other capital income -
-
25,000
-
-
-
-
-
-
-
-
-
Total capital income 212,953
27,717
25,000
-
-
-
-
-
-
-
-
-
Total capital revenue and capital income 3,484,782
3,567,628
4,229,100
2,280,000
100,000
4,000,000
4,000,000
-
-
-
4,000,000
4,000,000
Total income 19,773,435
16,680,926
23,245,851
21,410,800
19,398,500
23,473,400
23,656,700
19,849,400
20,052,300
20,266,900
24,494,700
24,737,100
Expenses
Recurrent expenses:
Total staff wages and salaries 5,366,177 3,982,255 7,698,755 7,391,200 6,876,000
7,047,900
7,224,100
6,904,700
6,577,300
6,741,700
7,410,200
7,595,500
Councillors remuneration 303,093
282,960
394,100
404,000
414,100
424,500
435,100
446,000
457,200
468,600
480,300
492,300
Other employee costs 154,279
146,428
225,300
228,700
232,100
235,600
239,100
242,700
246,300
250,000
253,800
257,600
Employee benefits 5,823,549
4,411,643
8,318,155
8,023,900
7,522,200
7,708,000
7,898,300
7,593,400
7,280,800
7,460,300
8,144,300
8,345,400
Materials and services - Sales, contract and
recoverable works 4,984,145
3,168,355
6,239,082
5,332,700
4,412,700
4,478,900
4,546,100
4,114,300
3,676,000
3,731,100
4,787,100
4,858,900
Materials and services - Council maintenance 1,141,557
675,534
1,562,150
1,585,600
1,609,400
1,633,500
1,658,000
1,682,900
1,708,100
1,733,700
1,759,700
1,786,100
Audit services 49,500
34,289
60,000
60,900
61,800
62,700
63,600
64,600
65,600
66,600
67,600
68,600
Materials and services 6,175,202
3,878,178
7,861,232
6,979,200
6,083,900
6,175,100
6,267,700
5,861,800
5,449,700
5,531,400
6,614,400
6,713,600
Loss on sale of land held as inventory -
-
-
-
-
-
-
-
-
-
-
-
Depreciation on Buildings 729,420
584,776
1,321,780
1,221,482
1,184,382
1,358,132
1,493,632
1,614,282
1,659,932
1,665,932
1,722,432
1,830,932
Quilpie Shire Council Budget 2019-2020 11 | Page

Q u i l p i e S h i r e C o u n c i l
B u d g e t 2 0 1 9 / 2 0
Actual Budget Forecast
Year ended 30-Jun-18 31-May-19 30-Jun-20 30-Jun-21 30-Jun-22 30-Jun-23 30-Jun-24 30-Jun-25 30-Jun-26 30-Jun-27 30-Jun-28 30-Jun-29
$ $ $ $ $ $ $ $ $ $ $ $
Depreciation on Plant & Equipment 439,668
415,813
513,419
513,419
413,419
513,419
513,419
566,700
668,700
773,700
878,700
978,700
Depreciation on Furniture and Fittings 27,559
28,416
24,573
26,800
26,800
26,800
26,800
26,800
26,800
26,800
26,800
26,800
Depreciation on Roads, Drainage & Bridge Network 4,293,106
4,054,850
4,978,876
4,979,500
4,479,500
4,979,500
4,979,500
4,311,250
4,311,250
4,252,904
4,036,484
3,772,984
Depreciation on Water 75,837
69,604
106,053
128,328
129,661
129,661
129,661
129,661
78,328
78,328
78,328
78,328
Depreciation on Sewerage 40,227
36,831
123,394
122,750
124,500
125,500
126,500
135,000
143,500
194,500
295,500
346,500
Depreciation on Other 93,262
250,467
131,423
167,053
190,218
282,554
283,554
284,554
96,900
101,900
106,900
111,900
Depreciation on WIP -
-
5,234
6,946
8,500
10,238
11,972
13,587
15,208
16,856
18,481
20,087
Depreciation and amortisation 5,699,079
5,440,757
7,204,752
7,166,278
6,556,980
7,425,804
7,565,038
7,081,834
7,000,618
7,110,920
7,163,625
7,166,231
Finance costs charged by Queensland Treasury
Corporation -
-
-
-
-
-
-
-
-
-
-
-
Bank fees 20,455 17,920 19,500 19,791 22,585 20,385 21,688 20,999 21,314 21,633 21,958 22,287
Interest and admin fees on loans - - - - - - - 43,154 115,077 115,077 143,846 201,385
Finance costs 20,455
17,920
19,500
19,791
22,585
20,385
21,688
64,153
136,391
136,710
165,804
223,672
Total expenses 17,718,285 13,748,498 23,403,639 22,189,169 20,185,665 21,329,289 21,752,726 20,601,187 19,867,509 20,239,330 22,088,129 22,448,903
Result from ordinary activities 2,055,150 2,932,428 - 157,788 - 778,369 - 787,165 2,144,111 1,903,974 - 751,787 184,791 27,570 2,406,571 2,288,197
Other non-recurrent items 9,635,421 - - - - - - - - - - -
Net result attributable to Council 11,690,571
2,932,428 - 157,788 - 778,369 - 787,165
2,144,111
1,903,974 - 751,787
184,791
27,570
2,406,571
2,288,197
Quilpie Shire Council Budget 2019-2020 12 | Page

Q u i l p i e S h i r e C o u n c i l
B u d g e t 2 0 1 9 / 2 0
6 Balance Sheet
The balance sheet details council’s current assets, non-current assets and liabilities. It also details the total community equity with further detail provided in the statements of
changes in equity shown in Table 3.
Table 2
Actual Budget Forecast
Year ended 30-Jun-18 31-May-19 30-Jun-20 30-Jun-21 30-Jun-22 30-Jun-23 30-Jun-24 30-Jun-25 30-Jun-26 30-Jun-27 30-Jun-28 30-Jun-29
$ $ $ $ $ $ $ $ $ $ $ $
Current assets
Restricted component 19,553,725 23,007,593 - - - - - - - - - -
Unrestricted component - - 20,472,265 17,153,048 13,773,237 13,853,026 13,255,912 13,338,333 14,606,116 15,876,980 15,479,550 14,716,352
Cash assets and cash equivalents 19,553,725 23,007,593 20,472,265 17,153,048 13,773,237 13,853,026 13,255,912 13,338,333 14,606,116 15,876,980 15,479,550 14,716,352
Other inventory 398,256 453,270 453,270 453,270 453,270 453,270 453,270 453,270 453,270 453,270 453,270 453,270
Inventories 398,256 453,270 453,270 453,270 453,270 453,270 453,270 453,270 453,270 453,270 453,270 453,270
Receivables 2,175,900 1,274,757 - - - - - - - - - -
Tax assets - - 500,000 200,000 600,000 850,000 550,000 550,000 550,000 550,000 550,000 550,000
Other current assets-Provision - - (250) (250) (250) (250) (250) (250) (250) (250) (250) (250)
Total current assets 22,127,881 24,735,620 21,425,285 17,806,068 14,826,257 15,156,046 14,258,932 14,341,353 15,609,136 16,880,000 16,482,570 15,719,372
Non-current assets
Receivables 54,174 54,174 54,174 54,174 54,174 54,174 54,174 54,174 54,174 54,174 54,174 54,174
Other non-current assets - - (3,750) (7,500) (11,250) (15,000) (18,750) (22,500) (26,250) (30,000) (33,750) (37,500)
54,174 54,174 50,424 46,674 42,924 39,174 35,424 31,674 27,924 24,174 20,424 16,674
Property, plant and equipment
Capital works in progress 1,467,883 4,059,134 3,909,134 3,859,134 3,809,134 3,759,134 3,709,134 3,659,134 3,609,134 3,559,134 3,509,134 3,459,134
Total non-current assets 189,778,254 202,926,269 205,397,567 208,212,539 210,386,809 212,177,255 216,458,467 218,027,883 216,723,515 216,258,845 220,791,470 223,471,489
Total assets 211,960,309 227,716,063 226,822,852 226,018,607 225,213,066 227,333,301 230,717,399 232,369,236 232,332,651 233,138,845 237,274,040 239,190,861
Quilpie Shire Council Budget 2019-2020 13 | Page

Q u i l p i e S h i r e C o u n c i l
B u d g e t 2 0 1 9 / 2 0
Actual Budget Forecast
Year ended 30-Jun-18 31-May-19 30-Jun-20 30-Jun-21 30-Jun-22 30-Jun-23 30-Jun-24 30-Jun-25 30-Jun-26 30-Jun-27 30-Jun-28 30-Jun-29
$ $ $ $ $ $ $ $ $ $ $ $
Current liabilities
Trade and other payables 825,590 655,465 - - - - - - - - - -
Borrowings - - - - - - 75,000 200,000 200,000 250,000 350,000 330,478
Employee payables/provisions - - - - - - - - - - - -
Other provisions 388,413 321,613 300,737 279,861 258,985 238,109 217,233 196,357 175,481 154,605 133,729 112,853
Other - - - - - - - - - - - -
Total current liabilities 1,214,003 977,078 300,737 279,861 258,985 238,109 292,233 396,357 375,481 404,605 483,729 443,331
Non-current liabilities
Loans - - - - - - 1,425,000 3,725,000 3,525,000 4,275,000 5,925,000 5,594,522
Borrowings - - - - - - 1,425,000 3,725,000 3,525,000 4,275,000 5,925,000 5,594,522
Employee payables/provisions - - - - - - - - - - - -
Other provisions 136,996 136,996 132,088 127,088 129,588 126,588 127,588 127,088 126,588 126,088 125,588 125,088
Other - - - - - - - - - - - -
Total non-current liabilities 136,996 136,996 132,088 127,088 129,588 126,588 1,552,588 3,852,088 3,651,588 4,401,088 6,050,588 5,719,610
Total liabilities 1,350,999 1,114,074 432,825 406,949 388,573 364,697 1,844,821 4,248,445 4,027,069 4,805,693 6,534,317 6,162,941
Net community assets 210,555,136 226,547,815 226,390,027 225,611,658 224,824,493 226,968,604 228,872,578 228,120,791 228,305,582 228,333,152 230,739,723 233,027,920
Community equity
Asset revaluation reserve 107,745,259 120,805,510 120,805,510 120,805,510 120,805,510 120,805,510 120,805,510 120,805,510 120,805,510 120,805,510 120,805,510 120,805,510
Other reserves - - - - - - - - - - - -
Retained surplus (deficiency) 102,809,877 105,742,305 105,584,517 104,806,148 104,018,983 106,163,094 108,067,068 107,315,281 107,500,072 107,527,642 109,934,213 112,222,410
Total community equity 210,555,136 226,547,815 226,390,027 225,611,658 224,824,493 226,968,604 228,872,578 228,120,791 228,305,582 228,333,152 230,739,723 233,027,920
Quilpie Shire Council Budget 2019-2020 14 | Page

Q u i l p i e S h i r e C o u n c i l
B u d g e t 2 0 1 9 / 2 0
7 Statement of Changes in Equity
Table 3
Total Retained surplus Asset revaluation
reserve Other reserves
$ $ $ $
Balance at 30 Jun 2017 198,864,564 91,119,306 107,745,258 -
Net result for the period 11,690,571 11,690,571
Transfers to reserves - - - -
Transfers from reserves - - - -
Asset revaluation adjustment 1 1
Asset recognition - -
Balance at 30 Jun 2018 210,555,136 102,809,877 107,745,259 -
Net result for the period 2,932,428 2,932,428
Transfers to reserves - - - -
Transfers from reserves - - - -
Asset revaluation adjustment 13,060,251 13,060,251
Asset recognition - -
Balance at 30 Jun 2019 226,547,815 105,742,305 120,805,510 -
Net result for the period (157,788) (157,788)
Transfers to reserves - - -
Transfers from reserves - - -
Asset revaluation adjustment - -
Balance at 30 Jun 2020 226,390,027 105,584,517 120,805,510 -
Net result for the period (778,369) (778,369)
Transfers to reserves - - -
Transfers from reserves - - -
Asset revaluation adjustment - -
Balance at 30 Jun 2021 225,611,658 104,806,148 120,805,510 -
Net result for the period (787,165) (787,165)
Transfers to reserves - - -
Transfers from reserves - - -
Asset revaluation adjustment - -
Balance at 30 Jun 2022 224,824,493 104,018,983 120,805,510 -
Net result for the period 2,144,111 2,144,111
Transfers to reserves - - -
Transfers from reserves - - -
Asset revaluation adjustment - -
Balance at 30 Jun 2023 226,968,604 106,163,094 120,805,510 -
Quilpie Shire Council Budget 2019-2020 15 | Page

Q u i l p i e S h i r e C o u n c i l
B u d g e t 2 0 1 9 / 2 0
Total Retained surplus Asset revaluation
reserve Other reserves
Net result for the period 1,903,974 1,903,974
Transfers to reserves - - -
Transfers from reserves - - -
Asset revaluation adjustment - -
Balance at 30 Jun 2024 228,872,578 108,067,068 120,805,510 -
Net result for the period (751,787) (751,787)
Transfers to reserves - - -
Transfers from reserves - - -
Asset revaluation adjustment - -
Balance at 30 Jun 2025 228,120,791 107,315,281 120,805,510 -
Net result for the period 184,791 184,791
Transfers to reserves - - -
Transfers from reserves - - -
Asset revaluation adjustment - -
Balance at 30 Jun 2026 228,305,582 107,500,072 120,805,510 -
Net result for the period 27,570 27,570
Transfers to reserves - - -
Transfers from reserves - - -
Asset revaluation adjustment - -
Balance at 30 Jun 2027 228,333,152 107,527,642 120,805,510 -
Net result for the period 2,406,571 2,406,571
Transfers to reserves - - -
Transfers from reserves - - -
Asset revaluation adjustment - -
Balance at 30 Jun 2028 230,739,723 109,934,213 120,805,510 -
Net result for the period 2,288,197 2,288,197
Transfers to reserves - - -
Transfers from reserves - - -
Asset revaluation adjustment - -
Balance at 30 Jun 2029 233,027,920 112,222,410 120,805,510 -
Quilpie Shire Council Budget 2019-2020 16 | Page

Q u i l p i e S h i r e C o u n c i l
B u d g e t 2 0 1 9 / 2 0
8 Statement of Cashflow Table 4
Actual Budget Forecast
Year ended 30-Jun-18 31-May-19 30-Jun-20 30-Jun-21 30-Jun-22 30-Jun-23 30-Jun-24 30-Jun-25 30-Jun-26 30-Jun-27 30-Jun-28 30-Jun-29
$ $ $ $ $ $ $ $ $ $ $ $
Cash flows from operating activities:
Receipts from customers 10,500,949 10,224,627 19,926,988 18,760,800 18,922,900 19,092,200 19,269,800 19,456,700 19,653,700 19,862,300 20,084,000 20,320,200
Payment to suppliers and employees (12,368,853) (8,540,561) (16,854,352) (15,022,891) (13,626,185) (13,903,485) (14,186,688) (13,519,353) (12,866,891) (13,128,410) (14,924,504) (15,282,672)
Interest received 430,267 394,143 364,520 370,000 375,600 381,200 386,900 392,700 398,600 404,600 410,700 416,900
Income from investments 302,382 272,095 - - - - - - - - - -
Distribution from joint venture 6,381,125 - - - - - - - - - - -
Other - 3,060,660 (525,784) 274,124 (420,876) (273,876) 279,124 (21,376) (21,376) (21,376) (21,376) (21,376)
Net cash inflow (outflow) from operating activities 5,245,870 5,410,964 2,911,372 4,382,033 5,251,439 5,296,039 5,749,136 6,308,671 7,164,033 7,117,114 5,548,820 5,433,052
Cash flows from investing activities:
Payments for property, plant and equipment (5,584,987) (5,528,474) (9,679,800) (9,985,000) (8,735,000) (9,220,000) (11,850,000) (8,655,000) (5,700,000) (6,650,000) (11,700,000) (9,850,000)
Subsidies, donations and contributions for new capital expenditure - - 4,204,100 2,280,000 100,000 4,000,000 4,000,000 - - - 4,000,000 4,000,000
Proceeds from sale of property, plant and equipment 310,960 27,717 - - - - - - - - - -
Net transfer (to) from cash investments 5,825 3,750 - - - - - - - - - -
Net movement in loans and advances - - - - - - - - - - - -
Other 3,271,829 3,539,911 29,000 3,750 3,750 3,750 3,750 3,750 3,750 3,750 3,750 3,750
Net cash inflow (outflow) from investing activities (1,996,373) (1,957,096) (5,446,700) (7,701,250) (8,631,250) (5,216,250) (7,846,250) (8,651,250) (5,696,250) (6,646,250) (7,696,250) (5,846,250)
Cash flows from financing activities
Proceeds from borrowings - - - - - - 1,500,000 2,500,000 - 1,000,000 2,000,000 -
Repayment of borrowings - - - - - - - (75,000) (200,000) (200,000) (250,000) (350,000)
Repayments made on finance leases - - - - - - - - - - - -
Quilpie Shire Council Budget 2019-2020 17 | Page

Q u i l p i e S h i r e C o u n c i l
B u d g e t 2 0 1 9 / 2 0
Actual Budget Forecast
Year ended 30-Jun-18 31-May-19 30-Jun-20 30-Jun-21 30-Jun-22 30-Jun-23 30-Jun-24 30-Jun-25 30-Jun-26 30-Jun-27 30-Jun-28 30-Jun-29
$ $ $ $ $ $ $ $ $ $ $ $
Net cash inflow (outflow) from financing activities - - - - - - 1,500,000 2,425,000 (200,000) 800,000 1,750,000 (350,000)
Net increase (decrease) in cash held 3,249,497 3,453,868 (2,535,328) (3,319,217) (3,379,811) 79,789 (597,114) 82,421 1,267,783 1,270,864 (397,430) (763,198)
Cash at beginning of reporting period 16,304,228 19,553,725 23,007,593 20,472,265 17,153,048 13,773,237 13,853,026 13,255,912 13,338,333 14,606,116 15,876,980 15,479,550
Cash at end of reporting period 19,553,725 23,007,593 20,472,265 17,153,048 13,773,237 13,853,026 13,255,912 13,338,333 14,606,116 15,876,980 15,479,550 14,716,352
Quilpie Shire Council Budget 2019-2020 18 | Page

Q u i l p i e S h i r e C o u n c i l
B u d g e t 2 0 1 9 / 2 0
9 Statement of Capital Funding
Table 5
Budget Forecast
Year ended 30-Jun-20 30-Jun-21 30-Jun-22 30-Jun-23 30-Jun-24 30-Jun-25 30-Jun-26 30-Jun-27 30-Jun-28 30-Jun-29
$ $ $ $ $ $ $ $ $ $
Sources of capital funding
General revenue used for capital purposes (1,729,052) 538,722 2,078,020 (2,205,804) (1,215,038) (851,834) (1,100,618) (1,260,920) (1,213,625) (966,231)
Depreciation charges funded 7,204,752 7,166,278 6,556,980 7,425,804 7,565,038 7,081,834 7,000,618 7,110,920 7,163,625 7,166,231
Loan borrowings used:
New capex - - - - 1,500,000 2,500,000 - 1,000,000 2,000,000 -
Replacement capex - - - - - - - - - -
Cash capital grants, subsidies and contributions:
New capex 4,204,100 2,280,000 - 4,000,000 4,000,000 - - - 4,000,000 4,000,000
Replacement capex - - 100,000 - - - - - - -
Total sources of capital funding 9,679,800 9,985,000 8,735,000 9,220,000 11,850,000 8,730,000 5,900,000 6,850,000 11,950,000 10,200,000
Application of capital funding
Non current capital assets New Capex:
Land - - - - - - 2,000,000 - - -
Buildings 4,274,000 4,385,000 1,345,000 5,455,000 5,790,000 1,425,000 90,000 90,000 5,105,000 5,150,000
Plant and equipment 130,000 100,000 100,000 100,000 100,000 140,000 100,000 120,000 100,000 100,000
Furniture & Fittings 50,000 - - - - - - - - -
Road, drainage and bridge Network 325,000 1,408,000 1,270,000 2,220,000 1,140,000 930,000 650,000 1,200,000 950,000 950,000
Water 998,800 - - - - - - - - -
Sewerage - - - - - 120,000 - 800,000 800,000 -
Quilpie Shire Council Budget 2019-2020 19 | Page

Q u i l p i e S h i r e C o u n c i l
B u d g e t 2 0 1 9 / 2 0
Budget Forecast
Year ended 30-Jun-20 30-Jun-21 30-Jun-22 30-Jun-23 30-Jun-24 30-Jun-25 30-Jun-26 30-Jun-27 30-Jun-28 30-Jun-29
$ $ $ $ $ $ $ $ $ $
Other assets 746,000 880,000 410,000 150,000 150,000 150,000 150,000 150,000 150,000 150,000
6,523,800 6,773,000 3,125,000 7,925,000 7,180,000 2,765,000 2,990,000 2,360,000 7,105,000 6,350,000
Non current capital assets Replacement Capex:
Land - - - - - - - - - -
Buildings 268,600 280,000 280,000 295,000 2,010,000 2,840,000 210,000 210,000 245,000 350,000
Plant and equipment 1,017,000 900,000 900,000 900,000 900,000 900,000 900,000 980,000 900,000 900,000
Road, drainage and bridge Network 1,105,000 1,802,000 4,330,000 - 1,660,000 1,870,000 1,500,000 1,800,000 2,150,000 2,150,000
Water 499,400 80,000 80,000 80,000 80,000 80,000 80,000 80,000 80,000 80,000
Sewerage 20,000 50,000 20,000 20,000 20,000 200,000 20,000 1,220,000 1,220,000 20,000
Other assets 246,000 100,000 - - - - - - - -
3,156,000
3,212,000
5,610,000
1,295,000
4,670,000
5,890,000
2,710,000
4,290,000
4,595,000
3,500,000
Increase in capital work in progress - - - - - - - - - -
Principal loan redemptions:
Existing loans - - - - - - - - - -
Loans for new capex - - - - - 75,000 200,000 200,000 250,000 350,000
Loans for replacement capex - - - - - - - - - -
- - - - - 75,000 200,000 200,000 250,000 350,000
Total applications of capital funding
9,679,800
9,985,000
8,735,000
9,220,000
11,850,000
8,730,000
5,900,000
6,850,000
11,950,000
10,200,000
Quilpie Shire Council Budget 2019-2020 20 | Page

Q u i l p i e S h i r e C o u n c i l
B u d g e t 2 0 1 9 / 2 0
10 Sustainability Ratios
Table 6
Budget Forecast
Year ended 30/06/2020 30/06/2021 30/06/2022 30/06/2023 30/06/2024 30/06/2025 30/06/2026 30/06/2027 30/06/2028 30/06/2029
1 Operating Surplus Ratio
(Net Operating Surplus / Total Operating Revenue) (%) (23.1)% (16.0)% (4.6)% (9.5)% (10.7)% (3.8)% 0.9% 0.1% (7.8)% (8.3)%
Target Ratio Lower Limit (%) 0.0% 0.0% 0.0% 0.0% 0.0% 0.0% 0.0% 0.0% 0.0% 0.0%
Target Ratio Upper Limit (%) 15.0% 15.0% 15.0% 15.0% 15.0% 15.0% 15.0% 15.0% 15.0% 15.0%
Does Operating Surplus Ratio fall between the target band? No No No No No No Yes Yes No No
2 Net Financial Asset / Liability Ratio
((Total Liabilities - Current Assets) / Total Operating Revenue)
(110.4)% (90.9)% (74.8)% (76.0)% (63.2)% (50.8)% (57.8)% (59.6)% (48.5)% (46.1)%
Target Ratio Upper Limit (%) 60.0% 60.0% 60.0% 60.0% 60.0% 60.0% 60.0% 60.0% 60.0% 60.0%
Does Net Financial Asset / Liability Ratio fall below the upper limit?
Yes Yes Yes Yes Yes Yes Yes Yes Yes Yes
3 Asset Sustainability Ratio
(Capital Expenditure on the Replacement of Assets (renewals) / Depreciation Expense)
29.7% 32.3% 71.8% 5.3% 49.8% 70.5% 25.9% 45.6% 51.6% 36.3%
Target Ratio Lower Limit (%) 90.0% 90.0% 90.0% 90.0% 90.0% 90.0% 90.0% 90.0% 90.0% 90.0%
Does Asset Sustainability Ratio fall above the lower limit? No No No No No No No No No No
Quilpie Shire Council Budget 2019-2020 21 | Page

Q u i l p i e S h i r e C o u n c i l
B u d g e t 2 0 1 9 / 2 0
Appendix 1 – Revenue Statement 2018/19
Quilpie Shire Council Budget 2019-2020 22 | Page

We Value: Respect | Communication | Fun & Humour | Pride | Trust | Teamwork
F.04 Revenue Statement
1 OBJECTIVE ................................................................................................................................. 1
2 MAKING AND LEVYING OF GENERAL RATES RATIONALE .............................................................. 1
3 DIFFERENTIAL GENERAL RATING ................................................................................................ 1
4 RATEABLE VALUE OF LAND......................................................................................................... 4
5 LIMITATION OF INCREASE IN RATES ........................................................................................... 4
6 SEPARATE RATES AND CHARGES ................................................................................................ 4
7 SPECIAL RATES AND CHARGES .................................................................................................... 4
8 UTILITY CHARGES ....................................................................................................................... 4
9 TIME WITHIN WHICH RATE MUST BE PAID.................................................................................. 6
10 PAYING RATES AND CHARGES BY INSTALMENTS ......................................................................... 6
11 DISCOUNT ................................................................................................................................. 6
12 CONCESSIONS ............................................................................................................................ 6
13 COST RECOVERY FEES ................................................................................................................ 6
14 DEFINITIONS .............................................................................................................................. 7
15 RELATED POLICIES | LEGISLATION | OTHER DOCUMENTS............................................................ 7
Date Adopted by Council 14 June 2019 Council Resolution No.
Effective Date 01 July 2019 Review Date 14 June 2020
Policy Owner Council Responsible Officer CEO
Policy Number F.04 IX Reference 91650
Version Number V1 10-Jun-14 Developed and adopted
V2 14-Jul-15 Reviewed and adopted
V3 08-Jul-16 Reviewed and adopted
V4 14-Jul-17 Reviewed and adopted
V5 22-Jun-18 Reviewed and adopted
V6 14-Jun-19 Reviewed and adopted
CEO Chief Executive Officer
MCCS Manager Corporate & Community Services
MES Manager Engineering Services
MFS Manager Financial Services
13-06-19
Quilpie Shire Council Budget 2019-2020 23 | Page

F.04 Revenue Statement
1 OBJECTIVE
Section 169(2) of the Local Government Regulation 2012 requires the Council to adopt a Revenue Statement. The Revenue Statement will be an explanatory document accompanying the Budget outlining and explaining the revenue measures adopted in the budget process. This document should be read in conjunction with Council’s Revenue Policy.
It is not intended that this Revenue Statement reproduce all related policies. Related policies will be referred to where appropriate and will take precedence if clarification is required.
2 MAKING AND LEVYING OF GENERAL RATES RATIONALE
General rates are for services, facilities and activities that are supplied or undertaken for the benefit of the community in general (rather than a particular person). The council is required to raise an appropriate amount of revenue to maintain assets and provide services to the region as a whole.
Under State legislation, land valuation is used as the basis for levying general rates in Queensland. The general rate could be determined by dividing the income needed from general rates by the rateable valuation of lands, however that would be inequitable because of the considerable diversity in the Quilpie Shire region in terms of land use and location, land values, access to, and actual and potential demands for, services and facilities. To provide a more equitable and reasonable basis for its revenue raising, council has adopted a general rating system that takes into account a combination of specific user charges, special rates and differential general rates.
In summary, rates and charges are determined after consideration of:
i) Council’s legislative obligations;
ii) The needs and expectations of the general community;
iii) The expected cost of providing services; and
iv) Equity – that is, ensuring the fair and consistent approach of lawful rating and charging principles,taking account of all relevant considerations, and disregarding irrelevancies such as the perceivedpersonal wealth of individual ratepayers or ratepayer classes.
3 DIFFERENTIAL GENERAL RATING
The differential rating categories have been determined having regard to:
- Land use as determined by Council and the Department of Natural Resources and Mines “Land UseCodes”;
- Location;
- Availability of services;
- Consumption of and demand for services; and
- Whether any attribute of the land (including the status of the land under the Planning Scheme) givesrise to, or is likely to give rise to, increased costs for the council, whether at that land or elsewhere.
Pursuant to Chapter 4 of the Local Government Regulation 2012, the council has decided that:
a) There will be 16 categories of rateable land for 2019/2020 as stated and described in Table 1;
b) The description of each of the rating categories of rateable land in the local government area is set outin Table 1;
c) The differential rates, limitations on increases and minimum general rates to be levied for each of the16 differential general rating categories are detailed in Table 2.
Quilpie Shire Council Budget 2019-2020 24 | Page

F.04 Revenue Statement
Category Number
Category Name Category Description
1 Town of Quilpie - Residential Land within the township of Quilpie used, or capable of being used, for residential purposes which is or can be serviced with urban infrastructure, other than land used for commercial, industrial, grazing, agriculture, petroleum, mineral or extractive industry production.
2 Township of Eromanga Land within the township of Eromanga used, or capable of being used, for residential, commercial or industrial purposes which is or can be serviced with urban infrastructure, other than land used for grazing, agriculture, petroleum, mineral or extractive industry production.
3 Other Rural Towns Land within the townships of Adavale, Toompine and Cheepie used, or capable of being used, for residential, commercial or industrial purposes which is or can be serviced with urban infrastructure, other than land used for grazing, agriculture, petroleum, mineral or extractive industry production
4 Opal Mines Land, held under the Mineral Resources Act 1989 used for the purpose of extracting opals and other precious metals and gemstones.
5 Other Land not included in any other category.
6 Rural - Grazing and Agriculture <7$/ha
Land used, or capable of being used, for rural purposes, including grazing and agriculture, with a rateable value of less than $7 per hectare.
7 Town of Quilpie - Commercial and Industrial
Land used, or capable of being used in whole or part, for commercial or industrial purposes which is or can be serviced with urban infrastructure, other than land used for residential, grazing, agriculture, petroleum, mineral or extractive industry production.
8 Rural - Grazing and Agriculture 7-12$/ha
Land used, or capable of being used, for rural purposes, including grazing and agriculture, with a rateable value of between $7 and $12 per hectare.
9 Rural - Grazing and Agriculture >12$/ha
Land used, or capable of being used, for rural purposes, including grazing and agriculture, with a rateable value of more than $12 per hectare.
10 Rural-Pumps, bore sites and communication facilities
Land used for the purposes of pumps, bore site or communication facility.
Quilpie Shire Council Budget 2019-2020 25 | Page

F.04 Revenue Statement
11 Mining and Oil Production <5000ha Land, held under the Mineral Resources Act 1989 or Petroleum Act 1923, with an area less than 5,000 hectares other than land included in category 4.
12 Mining and Oil Production 5000-10000ha
Land, held under the Mineral Resources Act 1989 or Petroleum Act 1923, with an area between 5,000 and 10,000 hectares other than land included in category 4.
13 Mining and Oil Production 10000-20000ha
Land, held under the Mineral Resources Act 1989 or Petroleum Act 1923, with an area between 10,000 and 20,000 hectares other than land included in category 4.
14 Mining and Oil Production 20000-50000ha
Land, held under the Mineral Resources Act 1989 or Petroleum Act 1923, with an area between 20,000 and 50,000 hectares other than land included in category 4.
15 Mining and Oil Production >50000ha Land, held under the Mineral Resources Act 1989 or Petroleum Act 1923, with an area more than 50,000 hectares other than land included in category 4.
16 Oil Distillation/Refining Land used for, or in association or connection with the:-
- distillation of crude oil or natural gas; and
- storage or transport of crude oil or naturalgas.
TABLE 1
Category Description Minimum Rate in $ Limitation (cap)
1 Town of Quilpie - Residential $364.73 1.743 10%
2 Town of Eromanga $364.73 5.070 10%
3 Other Rural Towns $321.01 71.300 10%
4 Opal Mines $359.33 43.000 10%
5 Other $561.38 109.924 10%
6 Rural - Grazing and Agriculture <7$/ha $299.58 2.870 10%
7 Town of Quilpie - Commercial and Industrial
$364.73 1.750 10%
8 Rural - Grazing and Agriculture 7 - 12$/ha
$299.58 2.870 10%
9 Rural - Grazing and Agriculture >12$/ha
$299.58 2.870 10%
10 Rural-Pumps, bore sites and communication facilities
$306.37 37.300 10%
11 Mining and Oil Production <5000ha $45,777.87 291.000 10%
Quilpie Shire Council Budget 2019-2020 26 | Page

F.04 Revenue Statement
12 Mining and Oil Production 5000-10000ha
$107,712.61 224.500 10%
13 Mining and Oil Production 10000-20000ha
$140,026.40 88.560 10%
14 Mining and Oil Production 20000-50000ha
$150,797.66 88.560 10%
15 Mining and Oil Production >50000ha $161,568.92 88.560 10%
16 Oil Distillation/Refining $32,313.78 234.4333 10%
TABLE 2
4 RATEABLE VALUE OF LAND
To determine the rateable value of land, council uses the unimproved capital or site valuation as advised by the Department of Natural Resources and Mines. The last valuation of the shire was carried out on 1 March 2018 with the valuation being applied from 1 July 2018.
5 LIMITATION OF INCREASE IN RATES
Council has applied capping to all categories of land. All categories will not exceed the amount of general rates levied for the property for the previous financial year (year ending 30 June 2019) plus a percentage increase resolved by council.
The differential general rate for eligible land will not exceed the higher of:
- The relevant minimum rate for the property; or
- The amount of general rates levied for the property for the year ending 30 June 2019, plus an increaseof 10%.
This is subject to a minimum rate for each category and the following conditions:
- Capping will apply only to general rates;
- Capping will apply to all categories of land;
- Capping is not available retrospectively and will only apply from the beginning of a financial year;
6 SEPARATE RATES AND CHARGES
Council does not presently levy separate rates and charges.
7 SPECIAL RATES AND CHARGES
A “Wild Dog Control Levy” equal to 5% of general rates will be levied on all rural properties (category 6, 8 and 9).
8 UTILITY CHARGES
Council levies utility charges for the provision of waste management, sewerage and water services on premises to which these services are supplied, or are capable of being supplied.
A specific number of "charging units" is assessed for each category of land use and a dollar charge per unit is set by the Council annually at its budget meeting.
It is proposed that in accordance with Section 99 of the Local Government Regulation 2012 the following utility charges be made and levied for the year ending 30 June 2018.
Quilpie Shire Council Budget 2019-2020 27 | Page

F.04 Revenue Statement
Pursuant to section 101(1)(a) and section 101(2) of the Local Government Regulation 2012, Council levies water charges wholly according to the water used by each ratepayer. Council has estimated each ratepayer's likely water usage, by determining the average amount of water used for each different land use referred to below.
For the 2017/18 financial year, the applicable charging units are as follows:
Waste Management $28.02 per unit, plus $50.84 per extra bin
Sewerage $14.22 per unit
Water $14.86 per unit
In accordance with the following unit schedule:
Description Garbage Units Sewer Units Water Units
Vacant Land – Infrastructure 15 15
Occupied Residential Land 20 30 30
For Each Extra Pedestal 5 5
Occupied Residential Land – Cheepie 40
Flat, Unit, Aged Persons Home (each) 20 20 20
Motel 20 20 20
For Each Extra Pedestal/Cistern 5 5
Hotel, Hotel/Motel, Club 20 20 20
For Each Extra Pedestal/Cistern 10 10
Fire Brigade/SES 20 15 150
Church/Residence 20 30 30
For Each Extra Pedestal/Cistern 5 5
Other Businesses 20 25 25
For Each Extra Pedestal/Cistern 5 5
Other Businesses with attached dwelling 20 30 30
School 20 20 20
For Each Extra Pedestal/Cistern 10 10
CWA, Cultural Society, Non Profit 20 20 20
Convent, Church, Residence 20 30 30
For Each Extra Pedestal/Cistern 5 5
Railway Station Yards 20 100
Trucking Yards 100
Swimming Pool 20 200 200
JW Park Tennis/Netball Courts 20 300 600
Bulloo Park 20 300 600
Shire Office/Public Toilets 20 20 20
For Each Extra Pedestal/Cistern 10 10
Quilpie Shire Council Budget 2019-2020 28 | Page

F.04 Revenue Statement
Median Strips 600
Wash-down Bay – Quilpie 100
Industrial Blocks 30
Rural/Residential Blocks 30
Bowling Green 100
Caravan Park 20 300 300
Refinery 30 450
For Each Extra Pedestal/Cistern 5
Oil Wash down – Eromanga 120
For clarity, it is not Council’s intent that a property containing a business with an attached premises should be charged for both uses. Utilities will be charged for the use producing the highest charge only.
TABLE 3
9 TIME WITHIN WHICH RATE MUST BE PAID
It is proposed that in accordance with section 118 of the Local Government Regulation 2012, Council has determined that the due date for payment of rates and charges is 30 days after the date the rates notice is issued.
Council has determined that, pursuant to section 133 of the Local Government Regulation 2012, interest is payable on overdue rates and charges from the day rates and charges become overdue. Interest will be calculated at a rate of 11% per annum, on daily rests and as compound interest.
10 PAYING RATES AND CHARGES BY INSTALMENTS
Council has decided, pursuant to section 129(1) of the Local Government Regulation 2012, to allow ratepayers to pay rates and charges by instalments.
The period for payment of each instalment of rates and charges is monthly.
It is a requirement for persons paying rates and charges by instalments that they enter a written agreement with Council.
11 DISCOUNT
Council has decided, in accordance with section 130 of the Local Government Regulation 2012, that a discount of 10% is allowed on all rates and charges if paid in full, including overdue rates, by the due date.
12 CONCESSIONS
Council has decided, pursuant to section 119 and section 120 of the Local Government Regulation 2012, to grant a 50% rebate of rates and charges, up to a total of $450 per annum for land which is owned or occupied by a pensioner, in accordance with Council's “Rates and Utility Charges - Pensioner Rebate and Concession Policy”.
13 COST RECOVERY FEES
Council’s policy is to structure cost recovery fees so that the costs of each service, facility or activity provided are recovered, however, Council provides services, facilities or activities that are not fully cost recoverable but are deemed to be provided as a Community Service Obligation and are cross subsidised.
Quilpie Shire Council Budget 2019-2020 29 | Page

F.04 Revenue Statement
14 DEFINITIONS
Nil
15 RELATED POLICIES | LEGISLATION | OTHER DOCUMENTS
Local Government Act 2009
Local Government Regulation 2012
IX # Details
91119 F.03 Revenue Policy
Quilpie Shire Council Budget 2019-2020 30 | Page

Q u i l p i e S h i r e C o u n c i l
B u d g e t 2 0 1 9 / 2 0
Appendix 2 – Revenue Policy
Quilpie Shire Council Budget 2019-2020 31 | Page

We Value: Respect | Communication | Fun & Humour | Pride | Trust | Teamwork
F.03 Revenue Policy
1 OBJECTIVE ................................................................................................................................. 1
2 SCOPE ....................................................................................................................................... 1
3 STATEMENT ............................................................................................................................... 1
3.1 The levying of rates and charges ................................................................................................. 1
3.2 Rates Strategy ............................................................................................................................. 2
3.3 Link Between Property Valuations and Rates ............................................................................. 3
3.4 Subject to Change ....................................................................................................................... 3
3.5 Long Term Sustainability ............................................................................................................. 3
3.6 Concessions for rates and charges .............................................................................................. 5
3.7 Recovery of rates and charges .................................................................................................... 5
3.8 Cost-Recovery Fees ..................................................................................................................... 6
3.9 Funding of Physical and Social Infrastructure Costs ................................................................... 6
4 DEFINITIONS .............................................................................................................................. 6
5 RELATED POLICIES | LEGISLATION | OTHER DOCUMENTS............................................................ 6
Date Adopted by Council 22 June 2018 Council Resolution No. 11-06-19
Effective Date 01 July 2017 Review Date 14 June 2020
Policy Owner Council Responsible Officer CEO
Policy Number F.03 IX Reference 91119
Version Number V1 16-Jun-15 Developed and adopted
V2 08-Jul-16 Reviewed and adopted
V3 14-Jul-17 Reviewed and adopted
V4 22-Jun-18 Reviewed and adopted
V5 14-June-19 Reviewed and adopted
CEO Chief Executive Officer
MCCS Manager Corporate & Community Services
MES Manager Engineering Services
MFS Manager Financial Services
Quilpie Shire Council Budget 2019-2020 32 | Page

F.03 Revenue Policy
1 OBJECTIVE
The objective of this Revenue Policy is to set out the principles used by Council for:-
- The levying of rates and charges; and
- The setting of Council’s rates strategy; and
- The long term sustainability of Council; and
- The granting of concessions for rates and charges; and
- The recovery of overdue rates and charges; and
- Cost recovery fees; and
- The funding of physical and social infrastructure.
2 SCOPE
This policy applies to all rates and charges levied by Council.
3 STATEMENT
3.1 THE LEVYING OF RATES AND CHARGES
Council levies rates and charges to fund the provision of valuable services to our community. When adopting its annual budget, Council will set rates and charges at a level that will provide for both current and future community requirements. Council will apply the principle of transparency in making rates and charges.
In general, Council will be guided by the principle of user pays in the making of rates and charges so as to minimise the impact of rating on the efficiency of the local economy.
Council will also have regard to the following principles in the making of rates and charges:
- Transparency in the making of rates and charges; and
- Administering a simple and inexpensive rating regime; and
- Equity by ensuring the fair and consistent application of lawful rating and charging principles andtaking into account all relevant considerations: and
- Flexibility to take account of changes in the local economy, extraordinary circumstances and impactsthat different industries may have on Council infrastructure and service delivery.
In levying rates Council will be guided by the following principles of:
- Making clear what is the Council’s and each ratepayers’ responsibility to the rating system; and
- Making the levying system simple and inexpensive to administer; and
- Timing the levy of rates to take into account the financial cycle of local economic activity, in order toassist smooth running of the local economy; and
- Equity through flexible payment arrangements for ratepayers with a lower capacity to pay; and
- Communication by advising ratepayers about rate notice issue dates and discount dates; and
- Clarity by providing meaningful information on rate notices to enable ratepayers to clearly understandtheir responsibilities.
Quilpie Shire Council Budget 2019-2020 33 | Page

F.03 Revenue Policy
3.2 RATES STRATEGY
3.2.1 General Rates
General Rates are used, in conjunction with other sources of income such as untied grants, to funds the operations of the Council and to deliver the services detailed in the Operational Plan.
General Rates differ from other rates and charges and project specific grants that are used to fund specific projects or initiatives.
3.2.2 Economic and Environmental Factors
The economic and environmental factors that will influence Council’s rates decisions over the next ten years are:
- The local economy;
- The Gross Regional Product, particularly in relation to agriculture and the resources sector;
- Asset management requirements;
- Sustainability objectives and ratios, in particular the Operating Surplus Ratio, the Nett FinancialLiabilities Ratio and the Asset Sustainability Ratio; and
- The level of debt and any requirement to repay the debt.
3.2.3 Rates Property Mix
Rates properties can be broadly divided into urban, rural and resource sector. The approximate rate income from each sector for 2019/2020 is shown below:
3.2.4 Rating Mechanisms
There are various mechanisms available to Council to levy rates and charges. These include:
- General Rates (differential);
- Separate Charge;
- Separate Rate;
- Special Charge;
- Special Rate;
4%
32%
64%
Urban
Rural
Resources
Quilpie Shire Council Budget 2019-2020 34 | Page

F.03 Revenue Policy
- Sewerage Utility Charge;
- Water Utility Charge; and
- Waste Management Utility Charge.
In the 2019/2020 budget Council is proposing to use the following rates and charges mechanisms:
- General Rates (differential);
- Special Rate;
- Sewerage Utility Charge;
- Water Utility Charge; and
- Waste Management Utility Charge
The Special Rate is applicable only to rural properties and is for the express purpose of partly funding wild dog control measures.
Council allocates properties to a particular rating category based on the predominant land use of each property. Full details of rating categories can be found in Council’s Revenue Statement.
Council’s goal is to minimize the number of rating categories. To this end the rural categories were effectively reduced from five to four in the 2016/17 budget and from four to two in the 2018/19 budget through the rationalisation of the rates in the dollar.
The rating categories are reviewed annually as part of the budget process for the upcoming financial year. Any changes are communicated to ratepayers in their rates notice and budget update provided by Council after adopting the annual budget.
3.3 LINK BETWEEN PROPERTY VALUATIONS AND RATES
Property valuations and determined by the State Government and can fluctuate from year to year. In setting rates, Council determines how much income is required to be generated from rates balanced against the principles outlined in section 3.1.
Council can use averaging and capping options if property valuations fluctuate severely.
3.4 SUBJECT TO CHANGE
The following factors may cause Council to review and amend this rates strategy over the next ten years:
- The number of rateable properties;
- Particular tensions or industry issues within the rural and resource sectors;
- Future sustainability ratios;
- Asset management strategies and requirements;
- New projects or initiatives that the community wishes to pursue.
These changes will be communicated to ratepayers through an amendment to this policy and the annual budget update.
3.5 LONG TERM SUSTAINABILITY
Council’s rates strategy impacts on Council’s long term sustainability.
Council tracks various ratios over time that provide insight into the long term sustainability and, from a financial management perspective, the following in particular.
Quilpie Shire Council Budget 2019-2020 35 | Page

F.03 Revenue Policy
2010/11 2011/12 2012/13 2013/14 2014/15 2015/16 2016/17 2017/18
Operating Surplus Ratio %
0 - 10% 19 5.5 -2 -10.2 25.8 -1.12 13.38
-8.78
Net Financial Liabilities Ratio % < 60% -87.9 -66.1 -28 -24.5 -51.4 -55.83 -92.85
-127.55
Asset Sustainability Ratio % > 90% 88 161.7 151 181 71.32
36.0
Working Capital Ratio
4 times 22.6 10.1 4.9 3.3 6.1 8.81 11.92
11.92
Asset Consumption Ratio % > 75% 70.7 70.1 71.3 70.8 73.1 75.55 76.28
76.28
These are represented graphically as follows:
Council will consider the impact of their rates strategy on these long term sustainability indicators when setting their annual budget.
Quilpie Shire Council Budget 2019-2020 36 | Page

F.03 Revenue Policy
3.6 CONCESSIONS FOR RATES AND CHARGES
3.6.1 General
In considering the application of concessions, Council will be guided by the principles of:-
- Transparency by making clear the requirements necessary to receive concessions;
- Communication by raising the awareness of target groups that may qualify for these concessions; and
- Equity by ensuring that all applicants of the same type receive the same concession. Council may giveconsideration to granting a class concession in the event the State Government declares all or part ofthe local government area a natural disaster area.
3.6.2 Pensioner Concessions
This clause refers specifically to s120 (1) (a) of the Local Government Regulation 2012.
Council has determined that pensioners as defined in Section 2 (Dictionary) of the Local Government Regulation 2012 are entitled to receive concessions on rates and various other services that Council provides to the community. The purpose of the concessions for pensioners is to assist pensioner property owners to remain in their own home by reducing the financial impact of rates and charges.
3.6.3 Hardship Concessions
This clause refers specifically to s120 (1) (c) of the Local Government Regulation 2012.
Council will consider applications for a concession on the payment of the rates or charges if such payment
will cause hardship to the land owner. Specifically the land owner must:
- Submit an application in writing;
- Provide details of the land in question;
- Provide details of the specific hardship and how this impacts on their capacity to pay the rates or
charges;
- Provide details of the amount of concession being requested and the duration of the concession being
requested;
- Advise whether the concession is a deferment of payment;
- Advise whether the concession is an agreement to accept a transfer of unencumbered land in full or
part payment of the rates or charges.
3.6.4 Other Concessions
All other concessions allowable under s120 of the Local Government Regulation 2012 will be considered on a case-by-case basis.
3.7 RECOVERY OF RATES AND CHARGES
Council requires payment of rates and charges within the specified period and it is Council policy to pursue the collection of outstanding rates and charges diligently, but with due concern for the financial hardship faced by some members of the community.
Council will exercise its rate recovery powers pursuant to the provisions of Chapter 4 Part 12 of the Local Government Regulation 2012 in order to reduce the overall rate burden on ratepayers, and will be guided by the principles of:
- Equity by treating all ratepayers in similar circumstances in the same manner and by having regard totheir capacity to pay;
- Transparency by making clear the obligations of ratepayers and the processes used by Council inassisting them to meet their financial obligations; and
Quilpie Shire Council Budget 2019-2020 37 | Page
F.03 Revenue Policy
- Flexibility by accommodating ratepayers’ needs through short-term payment arrangements.
- Making the processes used to recover outstanding rates and charges clear, simple to administer andcost effective.
3.8 COST-RECOVERY FEES
Section 97 of the Local Government Act 2009 allows Council to set cost-recovery fees.
The Council recognises the validity of fully imposing the user pays principle for its cost-recovery fees, unless the imposition of the fee is contrary to its express social, economic, environmental and other corporate goals. This is considered to be the most equitable and effective revenue approach, and is founded on the basis that the Council's rating base cannot subsidise the specific users or clients of Council's regulatory products and services.
However, in setting its cost-recovery fees, Council will be cognisant of the requirement that such a fee must not be more than the cost to Council of providing the service or taking the action to which the fee applies.
3.9 FUNDING OF PHYSICAL AND SOCIAL INFRASTRUCTURE COSTS
Council requires developers to pay reasonable and relevant contributions towards the cost of infrastructure required to support the development. Specific charges are detailed in the policies and other material supporting Council’s town planning scheme.
These policies are based on normal anticipated growth rates. Where a new development is of sufficient magnitude to accelerate the growth rate of a specific community within the Shire, it may be necessary to bring forward social infrastructure projects. Where this occurs, Council expects developers to meet sufficient costs so that the availability of facilities are not adversely affected and so that existing ratepayers are not burdened with the cost of providing the additional infrastructure.
4 DEFINITIONS
Nil
5 RELATED POLICIES | LEGISLATION | OTHER DOCUMENTS
Local Government Act 2009
Local Government Regulation 2012
IX # Details
91650 F.04 Revenue Statement
Quilpie Shire Council Budget 2019-2020 38 | Page

Q u i l p i e S h i r e C o u n c i l
B u d g e t 2 0 1 9 / 2 0
Appendix 3 – Debt Policy
Quilpie Shire Council Budget 2019-2020 39 | Page

We Value: Respect | Communication | Fun & Humour | Pride | Trust | Teamwork
F.06 Debt Policy
1 OBJECTIVE ................................................................................................................................. 1
2 SCOPE ....................................................................................................................................... 1
3 STATEMENT ............................................................................................................................... 1
3.1 Borrowing Principles ................................................................................................................... 1
3.2 Ten Year Loan Program ............................................................................................................... 1
4 DEFINITIONS .............................................................................................................................. 2
5 RELATED POLICIES | LEGISLATION | OTHER DOCUMENTS............................................................ 2
Date Adopted by Council 22 June 2018 Council Resolution No. 09-06-19
Effective Date 01 July 2017 Review Date 14 June 2020
Policy Owner Council Responsible Officer CEO
Policy Number F.06 IX Reference 91113
Version Number V1 22-Jan-13 Developed and adopted
V2 01-Jul-13 Reviewed and adopted
V3 10-Jun-14 Reviewed and adopted
V4 16-Jun-15 Reviewed and adopted
V5 08-Jul-16 Reviewed and adopted
V6 14-Jul-17 Reviewed and adopted
V7 22-Jun-18 Reviewed and adopted
V8 14-Jun-19 Reviewed and adopted
CEO Chief Executive Officer
MCCS Manager Corporate & Community Services
MES Manager Engineering Services
MFS Manager Financial Services
Quilpie Shire Council Budget 2019-2020 40 | Page

F.06 Debt Policy
1 OBJECTIVE
To adopt a policy on borrowings that provides for responsible financial management on the loan funding of infrastructure and other capital projects by ensuring the level of Council indebtedness is within limits acceptable to Council, its ratepayers and interested external parties.
2 SCOPE
This policy applies to all borrowings of Council.
3 STATEMENT
3.1 BORROWING PRINCIPLES
- Council will in general, seek to minimise its dependence on borrowings in order to minimise futurerevenue committed to debt servicing and redemption charges.
- Council will only borrow funds for the purpose of acquiring assets, improving facilities, services orinfrastructure and/or substantially extending their useful life. In no circumstances should funds beborrowed for recurrent expenditure.
- Council may borrow to meet strategic needs or to take advantage of opportunities for developmentproviding there is a demonstrably good return in economic and/or social terms.
- Redemption and interest charges on borrowings, excluding those relating to water and sewerage willnot exceed twenty percent of predicted general rates revenue.
- Borrowing’s in program areas such as water, sewerage or cleansing are to be repaid from revenueand depreciation generated in those areas and the full costs are to be taken to account in these areas.
- Where borrowings are to be repaid by special rates, the revenue and repayments will be matched asfar as is practical. Borrowings will only be repaid early should revenue exceed scheduled repaymentsand there is a demonstrable benefit to Council.
- Borrowings will only be from Queensland Treasury Corporation (QTC).
- Borrowings will be for a maximum period of twenty years and the term of any loan will not exceedthe expected life of the asset being funded. Shorter borrowing periods and earlier repayments will betaken where possible and appropriate.
3.2 TEN YEAR LOAN PROGRAM
Financial Year Debt Details Loan Term
2019/2020 No new borrowings -
2020/2021 No new borrowings -
2021/2022 No new borrowings -
2022/2023 No new borrowings -
2023/2024 No new borrowings -
2024/2025 $3,000,000 – new pool complex Quilpie 20 years
2025/2026 No new borrowings -
2026/2027 $1,000,000 – new sewage treatment plant Quilpie 20 years
2027/2028 $2,000,000 – new sewage treatment plant Quilpie 20 years
2028/2029 No new borrowings -
Quilpie Shire Council Budget 2019-2020 41 | Page
F.06 Debt Policy
4 DEFINITIONS
Nil
5 RELATED POLICIES | LEGISLATION | OTHER DOCUMENTS
Local Government Act 2009
Local Government Regulation 2012
IX # Details
Quilpie Shire Council Budget 2019-2020 42 | Page

Q u i l p i e S h i r e C o u n c i l
B u d g e t 2 0 1 9 / 2 0
Appendix 4 – Investment Policy
Quilpie Shire Council Budget 2019-2020 43 | Page

We Value: Respect | Communication | Fun & Humour | Pride | Trust | Teamwork
F.08 Investment Policy
1 OBJECTIVE ................................................................................................................................. 1
2 SCOPE ....................................................................................................................................... 1
3 STATEMENT ............................................................................................................................... 1
3.1 Legislative Authority ................................................................................................................... 1
3.2 Background ................................................................................................................................. 1
3.3 Investment Objectives ................................................................................................................ 1
3.4 Investment Guidelines ................................................................................................................ 2
3.5 Internal Control ........................................................................................................................... 3
4 DEFINITIONS .............................................................................................................................. 4
5 RELATED POLICIES | LEGISLATION | OTHER DOCUMENTS............................................................ 4
Date Adopted by Council 22 June 2018 Council Resolution No. 10-06-19
Effective Date 08 July 2016 Review Date 14 June 2020
Policy Owner Council Responsible Officer CEO
Policy Number F.08 IX Reference 91115
Version Number V1 22-Jan-13 Developed and adopted
V2 01-Jul-13 Reviewed and adopted
V3 10-Jun-14 Reviewed and adopted
V4 16-Jun-15 Reviewed and adopted
V5 08-Jul-16 Reviewed and adopted
V6 22-Jun-18 Reviewed and adopted
V7 14-Jun-19 Reviewed and adopted
CEO Chief Executive Officer
MCCS Manager Corporate & Community Services
MES Manager Engineering Services
MFS Manager Financial Services
Quilpie Shire Council Budget 2019-2020 44 | Page

F.08 Investment Policy
1 OBJECTIVE
This policy provides Council with a contemporary investment policy based on the legislative framework of
the Statutory Bodies Financial Arrangements Act 1982 and the Statutory Bodies Financial Arrangements
Regulations 2007.
The objectives of this policy are:
- To invest Council funds not immediately required for financial commitments.- To maximise earnings from authorised investments of cash reserves after assessing counterparty,
market and liquidity risks.- To ensure that appropriate records are kept and that adequate internal controls are in place to
safeguard public monies.
2 SCOPE
This policy applies to all investments made by Council.
3 STATEMENT
3.1 LEGISLATIVE AUTHORITY
Section 104(5) of the Local Government Act 2009 under Chapter 4 Finances and Accountability requires as part of the Long Term Financial Plan an Investment Policy.
Section 191 of the Local Government Regulation 2012 sets out the requirements of the policy and states that a local government must prepare an investment policy each financial year.
Statutory Bodies Financial Arrangements Act 1982 sets out investment powers for statutory bodies.
Schedule 3 of Statutory Bodies Financial Arrangements Regulation 2007 allocates Quilpie Shire Council category 1 investment powers.
3.2 BACKGROUND
Council has a number of responsibilities when investing funds. These responsibilities are outlined in Section 47 and Section 48 of the Statutory Bodies Financial Arrangements Act 1982.
Section 47states:
(1) A statutory body must use its best efforts to invest in funds:
(a) At the most advantageous interest rate available to it at the time of the investment for aninvestment of the proposed type; and
(b) In a way it considers most appropriate in all the circumstances.
(2) The statutory body must keep records that show it has invested in the way most appropriate inall the circumstances.
Section 48 states that:
A security, safe custody acknowledgment or other document evidencing title accepted, guaranteed or issued for an investment arrangement must be held by the statutory body or in another way approved by the Treasurer.
3.3 INVESTMENT OBJECTIVES
Quilpie Shire Council’s overall objective is to invest its funds at the most advantageous rate of interest available to it at the time, for that investment type, and in a way that it considers most appropriate given the circumstances.
Quilpie Shire Council Budget 2019-2020 45 | Page

F.08 Investment Policy
In priority, the order of investment activities shall be preservation of capital, liquidity, and return.
3.4 INVESTMENT GUIDELINES
3.4.1 Types of Investments
Section 44 of the Statutory Bodies Financial Arrangements Act 1982 states Council’s investment power as follows:
1. Category 1 investment power is the power to invest in all or any of the following—
a. deposits with a financial institution;
b. investment arrangements accepted, guaranteed or issued by or for the Commonwealth or a Stateor a financial institution;
c. other investment arrangements secured by investment arrangements accepted, guaranteed orissued by or for the Commonwealth or a State or a financial institution;
d. investment arrangements, managed or offered by QIC or QTC, prescribed under a regulation forthis paragraph;
e. an investment arrangement with a rating prescribed under a regulation for this paragraph;
f. other investment arrangements prescribed under a regulation for this paragraph.
2. However, the investment must be—
a. at call; or
b. for a fixed time of not more than 1 year.
3.4.2 Limitation on Investment Power
Section 43 of the Statutory Bodies Financial Arrangements Act 1982 states that investments must be:
1. in Australian money; and
2. undertaken in Australia.
3.4.3 Portfolio Investment Parameters and Credit Requirements
The following table shows the credit ratings and counterparty limits for Quilpie Shire Council:
Short Term Rating (Standard & Poor’s) or equivalent
Individual counterparty Limit Total Limit (Max % of Portfolio)
A1+ 100% 100%
A1 10%-20% 50%
A2 – Financial Institutions only 5%-15% 30%
A3 – Financial Institutions only 2%-7% 10%
Unrated Nil Nil
QIC/QTC Pooled Cash Management Funds
100% 100%
A Financial Institution is defined as an authorised deposit taking institution within the meaning of the Banking Act 1959 (Commonwealth), Section 5.
Quilpie Shire Council Budget 2019-2020 46 | Page

F.08 Investment Policy
It is noted that for the purpose of this investment portfolio, the percentage limits apply effective from the date of purchase as a percentage of the total value of the portfolio.
Whenever an investment is proposed, a minimum of two (2) quotes will be obtained from authorised institutions achieving as Standard & Poors or Moody rating of “AA” or better.
The institution offering the best quotation, net of costs, will generally be successful in attracting Council’s investment. However Council may deviate from this arrangement in situations where it wishes to support local financial institutions, whose investment interest rate may not match its competitors.
Investments held with the Queensland Treasury Corporation Cash Fund will be benchmarked against other investments or quoted investment rates at the end of each calendar month to ensure Council is receiving the most advantageous rate given the risk/return trade off.
3.4.4 Investments with Local Banks
Notwithstanding any other clause in this policy the investment officers/employees shall give preference to lodging Council cash investments through any bank that maintains a full time branch presence in Quilpie Shire. In making this decision Council acknowledges that the intention is to maintain the viability of a local bank hence in turn providing full banking services to the residents of Quilpie Shire.
3.4.5 Maturity
The maturity structure of the portfolio will reflect a maximum term to maturity of one year and includes an interest rate reset of no longer than six months.
3.4.6 Liquidity Requirement
Given the nature of the funds invested, at least 10 percent of the portfolio is to be available with 24 hours’ notice.
3.4.7 Breaches
Any breach of this Investment Policy is to be reported to the Chief Executive Officer and, if required, rectified as soon as practicable. The Finance Manager will report any breach that needs to be rectified to Council at the next meeting.
Where Council holds an investment that is downgraded below the minimum acceptable rating level, as prescribed under regulation for the investment arrangement, Council shall within 28 days after the change becomes known, either obtain Treasurer’s approval for continuing with the investment arrangement or sell the investment arrangement (including, for example, withdrawing a deposit).
3.4.8 Records
For audit purposes, certificates must be obtained from the financial institution holding the funds, confirming the amounts of investment held on Council’s behalf at 30 June each year or alternatively certificates of deposits as and when made will be held on file.
3.4.9 Reporting
If there is a change to the make-up of the investment portfolio, Council will be advised at the next Council meeting.
On an annual basis, the Investment Policy will be reviewed and amended where required; any amendments are to be approved by Council prior to the implementation of the revised investment policy.
3.5 INTERNAL CONTROL
Council is at all times to have in place appropriate controls to prevent the fraudulent use of public monies. The following controls detail the minimum that is required:
Quilpie Shire Council Budget 2019-2020 47 | Page

F.08 Investment Policy
- A person is to be identified as the responsible officer for the investment function;
- All investments are to be authorised by the Finance Manager or in that person’s absence, the ChiefExecutive Officer;
- Confirmation advices from the Financial Institution are to be recorded in Council’s RecordManagement System;
- Investment Officers shall refrain from personal activities that would conflict with the proper executionof Council’s investment portfolio. This policy requires Investment Officers to disclose to the ChiefExecutive Officer any conflict of interest that could be related to the investment portfolio.
Council is at all times to comply with the legislation applicable to the investment function within Local Government. Council will utilise its Category 1 investment powers to earn interest revenue on its operating funds to supplement Council’s other sources of revenue. Further, Council will maintain appropriate internal controls to prevent the fraudulent use of public monies.
The policy for the investment of Council funds is to be documented and followed at all times.
4 DEFINITIONS
Nil
5 RELATED POLICIES | LEGISLATION | OTHER DOCUMENTS
Local Government Act 2009
Local Government Regulation 2012
Statutory Bodies Financial Arrangements Act 1982
Statutory Bodies Financial Arrangements Regulations 2007
IX # Details
Quilpie Shire Council Budget 2019-2020 48 | Page

Q u i l p i e S h i r e C o u n c i l
B u d g e t 2 0 1 9 / 2 0
Appendix 5 – Capital Works Program
Category Details Year New Replace Estimated
Cost
2019-20
New
2019-20
Replace
1. Land Land development - Purchase
old depot site land 2020 100% 0% 150,000 150,000 0
1. Land Total 150,000 150,000 0
2. Buildings &
Other Struct
Depot - cement shed (erect
only) 2020 100% 0% 25,000 25,000 0
2. Buildings &
Other StructENHM Stage 2 2020 100% 0% 4,000,000 4,000,000 0
2. Buildings &
Other Struct
Eromanga tennis court
rehabilitation 2020 40% 60% 120,000 48,000 72,000
2. Buildings &
Other Struct
Housing - 41 Pegler Street -
carport and front awning 2020 70% 30% 12,000 8,400 3,600
2. Buildings &
Other Struct
Housing - Gyrica Gardens -
Rusted poles and AC frames 2020 0% 100% 25,000 0 25,000
2. Buildings &
Other Struct
Housing - 34 Kookaburra Street
- exterior paint and from
landing
2020 0% 100% 20,000 0 20,000
2. Buildings &
Other Struct
Housing - 57 Jabiru Street -
exterior paint 2020 0% 100% 15,000 0 15,000
2. Buildings &
Other Struct
Signage incl Amy Johnson,
tourism trails and major
roadside
2020 50% 50% 60,000 30,000 30,000
2. Buildings &
Other Struct
Quilpie VIC - paint inside and
outside 3 buildings 2020 0% 100% 60,000 0 60,000
2. Buildings &
Other Struct
SES shed - various refurb and
upgrades 2020 50% 50% 86,000 43,000 43,000
2. Buildings &
Other StructSolar power - depot 2020 100% 0% 120,000 120,000 0
2. Bld & Other
Struc Total4,543,000 4,274,400 268,600
3. Other Airport Quilpie mulga trail C/O 2020 100% 0% 20,000 20,000 0
3. Other IT new corporate system 2020 50% 50% 100,000 50,000 50,000
3. Other Landfill Quilpie - pit covers 2020 100% 0% 100,000 100,000 0
3. Other NDRP flood gauge stations 2020 70% 30% 220,000 154,000 66,000
3. OtherParks Quilpie Bi-centennial -
replace softfall 2020 0% 100% 10,000 0 10,000
3. OtherParks Quilpie JWP - upgrade
fence 2020 50% 50% 140,000 70,000 70,000
3. OtherParks Quilpie JWP - upgrade
playing surface and irrigation 2020 50% 50% 100,000 50,000 50,000
3. Other Rick M memorial C/O 2020 100% 0% 207,000 207,000 0
Quilpie Shire Council Budget 2019-2020 49 | Page

Q u i l p i e S h i r e C o u n c i l
B u d g e t 2 0 1 9 / 2 0
Category Details Year New Replace Estimated
Cost
2019-20
New
2019-20
Replace
3. Other Towns minor projects 2020 100% 0% 90,000 90,000 0
3. Other Total 987,000 741,000 246,000
4. Furniture &
FittingsParks Quilpie Bulloo - fans 2020 100% 0% 10,000 10,000 0
4. Furniture &
Fittings
IT servers - VM Ware Host and
Back up server 2020 100% 0% 40,000 40,000 0
4. Furniture &
Fittings Total50,000 50,000 0
5. Plant &
EquipmentCan-Am 2020 0% 100% 25,000 0 25,000
5. Plant &
EquipmentUnit 48 medium truck 2020 20% 80% 180,000 36,000 144,000
5. Plant &
Equipment
Unit 60 heavy trailer (2nd hand
low loader) 2020 0% 100% 160,000 0 160,000
5. Plant &
Equipment
Unit 53 heavy truck (trade for
prime mover) 2020 20% 80% 320,000 64,000 256,000
5. Plant &
EquipmentUnit 18 Toyota Hilux 2020 0% 100% 52,000 0 52,000
5. Plant &
EquipmentUnit 93 Ford Ranger 2020 0% 100% 55,000 0 55,000
5. Plant &
EquipmentUnit 55 light truck 2020 0% 100% 85,000 0 85,000
5. Plant &
EquipmentUnit 56 light truck 2020 0% 100% 95,000 0 95,000
5. Plant &
Equipment
Unit 222 heavy trailer (trade
for new water tanker) 2020 0% 100% 150,000 0 150,000
5. Plant &
EquipmentTrade all units 2020 0% 100% -100,000 0 -100,000
5. Plant &
EquipmentData Fuel upgrade 2020 30% 70% 100,000 30,000 70,000
5. Plant &
Equip Total1,122,000 130,000 992,000
6. Transport
InfrastructureAll roads - grid replacements 2020 20% 80% 100,000 20,000 80,000
6. Transport
InfrastructureAll streets - concrete footpaths 2020 100% 0% 120,000 120,000 0
6. Transport
Infrastructure
Black road culvert
rehabilitation 2020 0% 100% 60,000 0 60,000
6. Transport
Infrastructure
Brolga St centre median
upgrade stage 2 2020 50% 50% 150,000 75,000 75,000
6. Transport
Infrastructure
Gravel road resheeting / heavy
maintenance (supplement FD) 2020 20% 80% 300,000 60,000 240,000
Quilpie Shire Council Budget 2019-2020 50 | Page

Q u i l p i e S h i r e C o u n c i l
B u d g e t 2 0 1 9 / 2 0
Category Details Year New Replace Estimated
Cost
2019-20
New
2019-20
Replace
6. Transport
InfrastructureLocal road / drainage projects 2020 50% 50% 100,000 50,000 50,000
6. Transport
InfrastructureReseals various roads / streets 2020 0% 100% 600,000 0 600,000
6. Transport
Infrastructure
Total
1,430,000 325,000 1,105,000
7. Water
InfrastructureBore replacement and rehab 2020 80% 20% 1,248,500 998,800 249,700
7. Water
Infrastructure
Mains replacement Pegler
Street 450m 2020 0% 100% 200,000 0 200,000
7. Water Infra
Total1,448,500 998,800 449,700
8. Sewerage
Infrastructure
Various mech and elec
replacements 2020 0% 100% 20,000 0 20,000
8. Sewerage
Infra Total20,000 0 20,000
Grand Total 9,750,500 6,669,200 3,081,300
Quilpie Shire Council Budget 2019-2020 51 | Page

Q u i l p i e S h i r e C o u n c i l
B u d g e t 2 0 1 9 / 2 0
Appendix 6 - Schedule of Fees & Charges
Quilpie Shire Council Budget 2019-2020 52 | Page

Schedule of Fees and
Charges
1 July 2019 – 30 June 2020
Quilpie Shire Council Budget 2019-2020 53 | Page

TABLE OF CONTENTS
GOVERNANCE 1
PLANNING ASSESSMENT 1
BUILDING WORKS 1
ANIMAL CONTROL 3
OTHER LICENCE FEES 6
REGULATED WASTE FEES 8
UNREGULATED WASTE FEES 8
CORPORATE 9
COPIES OF DOCUMENTS 9
RIGHT TO INFORMATION 9
*FEES AND CHARGES FOR RIGHT TO INFORMATION DOCUMENTATION ARE SET BY STATE REGULATION.
HTTP://WWW.RTI.QLD.GOV.AU/FEES-AND-CHARGES 9
PHOTOCOPYING 10
PROPERTY SEARCHES 11
RENTAL ACCOMMODATION 11
COMMUNITY SERVICES 13
COMMERCIAL CHARGES USE OF ROADS / STREETS 13
HIRE OF HALLS 13
TABLECLOTHS & CHAIR COVERS 14
REPLACEMENT LOCKS / KEYS 14
BULLOO PARK 14
JOHN WAUGH PARK 14
PORTABLE TOILETS 14
OUTDOOR THEATRE EQUIPMENT 15
CEMETERIES 15
VET - BULLOO PARK 15
LIBRARY SERVICES 15
BUS HIRE 16
SWIMMING POOLS 16
RENTAL COMMERCIAL BUILDING 16
ENGINEERING 17
WATER & SEWERAGE 17
QUILPIE AERODROME 17
PLANT HIRE RATES 17
Quilpie Shire Council Budget 2019-2020 54 | Page

Page 1
Cost Recovery Fees GL No: Unit 2019/20 GST
GOVERNANCE
PLANNING ASSESSMENT
Reconfiguring a Lot 4100-1500-0000 Per application
$600.00 GST free
Material Change of Use - Code Assessable 4100-1500-0000 Per application
$600.00 GST free
Material Change of Use - Impact Assessable 4100-1500-0000 Per application
$1,050.00 GST free
Advertising 4100-1500-0000 Per application
$570.00 Included
Certificate 4100-1500-0000 Per application
Cost + $100.00 admin fee
Included
Certificate of Town Plan Approval—Commercial Only 4100-1500-0000 Per application
$155.00 Included
*Note: Council to determine additional charges prior to DA approval / town Planning externalprocessing - Actual cost plus 30%
BUILDING WORKS
NEW CONSTRUCTIONS Registered Builder
Owner Builder
CLASS 1 – DWELLINGS
<300m² GFA 4150-1501-0000 $750.00 $1,020.00 Included
> 300m² GFA 4150-1501-0000 $2.18/m2 + $848.00
$3.10/m2 + $1130.00
Included
CLASS 2 & 3 – FLATS, MOTELS, ACCOMMODATION UNITS
<300m² GFA 4150-1501-0000 $1040.00 Included
> 300m² GFA 4150-1501-0000 $3.12/m2 + $1137
Included

Page 2
Cost Recovery Fees GL No: Unit 2019/20 GST
CLASS 4 – 9 – COMMERCIAL & INDUSTRIAL BUILDING Included
<300m² GFA 4150-1501-0000 $1020 Included
300m² - 500m² GFA 4150-1501-0000 $1647.00 Included
500m² - 800m² GFA 4150-1501-0000 $3000 Included
>800m² GFA 4150-1501-0000 $3.64/m2 + $3100
Included
CLASS 10 – GARDEN SHEDS, UNROOFED PERGOLAS & DECKS ETC Included
<10m² GFA 4150-1501-0000 $124.00 $181.00 Included
10m² - 120m² GFA 4150-1501-0000 $306.00 $374.00 Included
120m² - 300m² GFA 4150-1501-0000 $436.00 $494.00 Included
If >300m² GFA – it will be Class 7 & 8 not 10 4150-1501-0000
CLASS 10 – SWIMMING POOL & FENCING
Fee (including inspection) 4150-1501-0000 $556.00 $692.00 Included
Swimming pool inspection fee (including certificate) 4150-1501-0000 $255.00 $255.00 Included
AWNINGS & ADVERTISING SIGNS
Minimum Fee 4150-1501-0000 $369.00 $369.00 Included
UNCLASSIFIED BUILDINGS
Minimum Fee 4150-1501-0000 $369.00 $369.00 Included
EXTENSIONS & RENOVATIONS Registered Builder
Owner Builder
CLASS 1 - DWELLINGS
<150m² GFA 4150-1501-0000 $602.00 $749.00 Included
>150m² addition 4150-1501-0000 $3.38/m2 + $702.00
$4.36/m² +$846.00 Included
CLASS 2 & 3– FLATS, MOTELS, ACCOMMODATION UNITS
<150m² GFA 4150-1501-0000 $749.00 Included

Page 3
Cost Recovery Fees GL No: Unit 2019/20 GST
>150m² addition 4150-1501-0000 $4.36/m2 + $96.00
Included
CLASS 4 – 9 – COMMERCIAL & INDUSTRIAL BUILDING
<300m² GFA 4150-1501-0000 $748.00 Included
300m² - 500m² GFA 4150-1501-0000 $993.00 Included
>500m² GFA 4150-1501-0000 $1622.00 Included
CLASS 10 – GARDEN SHEDS, UNROOFED PERGOLAS & DECKS ETC
<10m² GFA 4150-1501-0000 $122.00 $122.00 Included
10m² - 120m² GFA 4150-1501-0000 $244.00 $300.00 Included
>120m² GFA 4150-1501-0000 $494.00 $556.00 Included
If >300m² GFA – it will be Class 7 & 8 not 10 4150-1501-0000
CLASS 10 – SWIMMING POOL & FENCING
Minimum Fee 4150-1501-0000 $436.00 $556.00 Included
AWNINGS & ADVERTISING SIGNS
Minimum Fee 4150-1501-0000 $436.00 $556.00 Included
UNCLASSIFIED BUILDINGS
Minimum Fee 4150-1501-0000 $436.00 $556.00 Included
DEMOLITION OR REMOVAL
Minimum Fee 4150-1501-0000 $300.00 $374.00 Included
Note: Building fees are made up of Processing Fee, Final inspection and archival fee
ANIMAL CONTROL
Animal Registration Period ( Cats & Dogs) - 1st October to 30th September
DOGS
Puppy (under 6 months of age recognising most vets won’t desex until at 6 months)
All
tran
sact
i
on
s to
be
rece
ipte
d
thro
ugh
An
imal
Re
gist
er
Per annum $30.00 GST free
De-sexed and micro chipped dog Per annum $30.00 GST free

Page 4
Cost Recovery Fees GL No: Unit 2019/20 GST
De-sexed and micro chipped dog - Aged Pensioner - (card required) Per annum $20.00 GST free
Micro chipped dog Per annum $60.00 GST free
Micro chipped dog - Aged Pensioner (entitlement card required) Per annum $20.00 GST free
Whole dog (Over 3 months) Per annum $102.00 GST free
Whole dog – Aged Pensioners (entitlement card required)
All
tran
sact
ion
s to
be
re
ceip
ted
thro
ugh
An
imal
Re
gist
er
Per annum $30.00 GST free
De-sexed dog (over 3 months - evidence required) Per annum $40.00 GST free
De-sexed dog – Aged Pensioners (evidence of entitlement card required) Per annum $20.00 GST free
Regulated (restricted or dangerous) dogs Per annum $255.00 GST free
Regulated (menacing) dogs Per annum $155.00 GST free
Working dog - (as defined by the Act) Per annum $20.00 GST free
Assistance Dog Per annum $0 GST free
Kennel permit (per year - by application to Council) Per annum $255.00 GST free
Replacement registration tag 4330-1500-0000 Per tag $5.00 Included
Discount if paid within 2 months Per animal $10.00 GST free
Kennel fee 4330-1500-0000 Per animal per day
$30.00 Included
Cat trap bond 0300-5480-0017 Per trap $30.00 GST free
Barking collar refundable deposit
If collar not returned replacement cost less deposit to be invoiced
0300-5480-0017 Per collar $50.00 GST free
Where a dog is currently registered with another Australian local government and satisfactory proof of registration is presented, no fee will be charged.
IMPOUNDMENT
Impoundment Fees - Dog & Cat
1st impoundment 4330-1700-0000 Per animal $104.00 GST free
2nd impoundment 4330-1700-0000 Per animal $158.00 GST free

Page 5
Cost Recovery Fees GL No: Unit 2019/20 GST
3rd impoundment 4330-1700-0000 Per animal $208.00 GST free
Micro-chipping fee for all impounded animals not micro-chipped 4330-1700-0000 $104.00 Included
Sustenance fee - per day or part thereof for detained animals 4330-1700-0000 Per animal / day
$25.00 GST free
Impoundment Fees - Other Animals
Entire bull 4330-1700-0000 Per animal $104.00 GST free
Entire stallion 4330-1700-0000 Per animal $260.00 GST free
All other horses and cattle 4330-1700-0000 Per animal $104.00 GST free
Sheep 4330-1700-0000 Per animal $10.00 GST free
Goats 4330-1700-0000 Per animal $104.00 GST free
Sustenance fee - all other animals (except sheep) 4330-1700-0000 Per animal/day
$30.00 GST free
Sustenance fee - sheep 4330-1700-0000 Per animal/day
$10.00 GST free
Driving fees for leading, transporting etc. to pound 4330-1700-0000 At Cost Plus GST
WILD DOG BONUS PAYMENTS
A statutory declaration must be signed by the property owner on which the wild dog was destroyed. All statutory declarations must be signed by an Authorised Officer and witnessed by a Justice of the Peace A copy of the claimant's licence must be attached to the statutory declaration GPS points or a map indicating the location the dog was destroyed must be attached to the statutory declaration form
The Pest and Livestock Co-ordinator / CCSM must authorise all wild dog bonus applications. No Wild Dog Bonus payments will be made to properties that have not participated in the whole of shire bait and do not practice wild dog control.
Wild dog bonus payment - inside wild dog fence Per animal $50.00 GST free
Wild dog bonus payment - outside wild dog fence (within the shire) Per animal $50.00 GST free
Major baiting program (1) Wild Dog Levy Per year No cost GST free

Page 6
Cost Recovery Fees GL No: Unit 2019/20 GST
Baiting meat subsidy (to approved applicants)
*Meat sourced from Council
*Meat supplied by landholder
Per kg $1.00 GST free
Aeroplane subsidy
*Invoice must be made out to Quilpie Shire Council (Claimable by syndicates or approved pilots)
Per hour Full cost GST exc
Avgas – full reimbursement
*Invoice must be made out to Quilpie Shire Council
*Receipts must be submitted
Per drum or per litre
QUILPIE COMMON PERMIT
Application fee / annual fee Debtors Per annum $56.00 GST free
Mustering fee – per permit Debtors Bi annual At cost Plus GST
Out of hours call outs deemed non-urgent by the CEO or delegated officer Debtors Per event Full cost recovery
Chemical / herbicide subsidy
Upon presentation of receipt / purchase of chemical or herbicide to treat pest weeds, Council will reimburse 50% of total cost up to a maximum of $1,000.00
Debtors % 50% Included
RESERVES - AGISTMENT
Warrabin Lane (upon approved application to Council) 4320-1800-0000 Per month $255.00 Included
Dillon’s Well (upon approved application to Council) 4320-1800-0000 Per month $255.00 Included
PORTABLE FENCING PANELS
Hire fee per panel $200 refundable deposit. Damaged or lost panels replaced through Council at cost + 20%. One month hire per application unless approved otherwise.
Deposit – 0300-5480-0024
Fee – 4320-1600-0000
Per week $5.00 Included
OTHER LICENCE FEES
OTHER LICENCE FEES
Food licence application (new food premises) (includes annual fee)
All
tran
sact
ion
s
to b
e
rece
ipte
d
thro
ugh
De
bto
r Per premise $255.00 GST free
Food premise licence renewal fee (annual) Per premise $132.00 GST free
Amendment (change address/minor) Per premise $51.00 GST free

Page 7
Cost Recovery Fees GL No: Unit 2019/20 GST
Amendment to premises (major) Per premise At cost GST free
Copy/replacement of licence Per premise $10.00 GST free
Additional inspection Per premise $120.00/hour GST free
Volunteer group (eg sporting/school Per group $10.00 GST free
Home based catering service Per premise $30.00 GST free
Accrediting a food safety program
All
tran
sact
ion
s to
be
rece
ipte
d t
hro
ugh
De
bto
rs
Per premise $104.00 GST free
Auditing a food safety program Per premise At cost GST free
Amending a Food Safety Program Per premise $51.00 GST free
Environmental Health Search only Per premise $104.00 GST free
Apiary Site Application Fee Per application
$260.00
Apiary Site yearly fee Per Site $104.00
BEAUTY THERAPY (Inc. Permanent Marking)
Beauty therapy licence application (new) All transactions to be receipted through Debtors
Per premise $140.00 GST free
Beauty therapy licence application (renewal) Per annum $104.00 GST free
ENVIRONMENTALLY RELEVANT ACTIVITIES
All other ERA's 4520-1400-0000 Per annum $320.00 GST free
Registration of motor vehicle workshop N/A Per annum $320.00 GST free
HEALTH COMPLIANCE INSPECTIONS
Health compliance inspection 4520-1400-0000 $140.00 GST free
*Plus travel costs if applicable
VISITOR INFORMATION CENTRE / GALLERY
VIC town bus tours 5520-1530-0000 Per person $12.00 Included
VIC to ENHM Tours 5520-1530-0000 Per Person $45.00 Included
Bus companies who require a tour guide on the bus 5520-1530-0000 Per person $5.50 Included

Page 8
Cost Recovery Fees GL No: Unit 2019/20 GST
Gallery - commission on all gallery sales See Finance Per item 15% Included
(Except charitable organisations or at the discretion of the CEO)
REGULATED WASTE FEES
Disposal of carcass (cattle) - during working hours 4250-1500-0010 Per carcass $140.00 Included
Disposal of carcass (cattle ) - outside working hours + employee costs 4250-1500-0010 $180.00 Included
Trade waste - application See BEPO $312.00 Included
Trade waste - category 1 See BEPO $364.00 Included
Trade waste - category 2 See BEPO $364.00 Included
Burial of Trade asbestos / CCA treated timber or other waste greater than 10m2 4250-1500-0040 Per hour $285.00 Included
Asbestos 10m2 or less MUST CONTACT COUNCIL PRIOR 4250-1500-0040 $100.00
Contaminated soil (low level) 4250-1500-0040 Per tonne $41.00 Included
Contaminated soil (High level) 4250-1500-0040 POA
Disposal of septic or grey water waste (2,000 litres or less) All transactions to be receipted through Debtors
Per litre $0.05 Included
Disposal of bulk septic or grey water waste (greater than 2,000 litres) Per litre $0.10 Included
UNREGULATED WASTE FEES
Commercial / Industrial and Demolition waste fee All transactions to be receipted through Debtors
Per Tonne
Per m3
$49.00
$15.00
Included
Included

Page 9
Cost Recovery Fees GL No: Unit 2019/2020 GST
CORPORATE
COPIES OF DOCUMENTS
Annual Report 2300-1510-0000 Per copy $12.00 Included
Budget & Revenue Statement 2300-1510-0000 Per copy $12.00 Included
Corporate Plan 2300-1510-0000 Per copy $12.00 Included
Operational Plan 2300-1510-0000 Per copy $12.00 Included
Minutes - monthly 2300-1510-0000 Per copy $12.00 Included
Local Laws 2300-1510-0000 Per copy $12.00 Included
Archive fee 2300-1510-0000 Per document $35.00 Included
Planning Scheme - complete hard copy 2300-1510-0000 Per document $55.00 Included
Planning Scheme - complete electronic copy 2300-1510-0000 Per document $12.00 Included
Planning Scheme - sections (hardcopy / electronic) 2300-1510-0000 Per section $12.00 Included
RIGHT TO INFORMATION
*Fees and charges for Right to Information documentation are set by State Regulation. http://www.rti.qld.gov.au/fees-and-charges
Application fee for access to documents not related to an individual’s personal information 2300-1510-0000 Per application http://www.rti.qld.gov.au/fees-and-charges
GST free
Processing fee where total processing is 5 hours or less 2300-1510-0000 http://www.rti.qld.gov.au/fees-and-charges
GST free
Processing fee for each 15 minutes or part thereof where the processing is greater than 5 hours (note charge is for total time including first 5 hours)
2300-1510-0000 Per 15 minutes http://www.rti.qld.gov.au/fees-and-charges
GST free
Access charge for each black and white copy of an A4 document 2300-1510-0000 Per page http://www.rti.qld.gov.au/fees-and-charges
GST free
*Please note: Photocopying of funeral booklets will be charged at the standard photocopy rates.

Page 10
Cost Recovery Fees GL No: Unit 2019/2020 GST
A4 single sided - black & white (Council paper) 2300-1510-0000 Per copy $0.65 Included
A4 single sided - black & white (own paper) 2300-1510-0000 Per copy $0.45 Included
A4 single sided - colour (council paper) 2300-1510-0000 Per copy $1.10 Included
PHOTOCOPYING
A4 single sided - colour (own paper) 2300-1500-0000 Per copy $0.90 Included
A4 double sided - black & white (council paper) 2300-1500-0000 Per copy $0.85 Included
A4 double sided - black & white (own paper) 2300-1500-0000 Per copy $0.65 Included
A4 double sided - colour (council paper) 2300-1500-0000 Per copy $2.10 Included
A4 double sided - colour (own paper) 2300-1500-0000 Per copy $1.90 Included
A3 single sided - black & white (council paper) 2300-1500-0000 Per copy $0.85 Included
A3 single sided - black & white (own paper) 2300-1500-0000 Per copy $0.65 Included
A3 single sided - colour (council paper) 2300-1500-0000 Per copy $1.25 Included
A3 single sided - colour (own paper) 2300-1500-0000 Per copy $1.10 Included
A3 double sided - black & white (council paper) 2300-1500-0000 Per copy $1.05 Included
A3 double sided - black & white (own paper) 2300-1500-0000 Per copy $0.85 Included
A3 double sided - colour (council paper) 2300-1500-0000 Per copy $1.55 Included
A3 double sided - colour (own paper) 2300-1500-0000 Per copy $1.40 Included
LAMINATING
A4 laminating 2300-1500-0000 Per page $3.50 Included
A3 laminating 2300-1500-0000 Per page $5.60 Included
Larger than A3 2300-1500-0000 Per page $8.00 Included
BINDING
All sizes 2300-1500-0000 Per binder $3.00 Included
FACSIMILE SERVICES
Facsimile - up to 3 pages 2300-1500-0000 $3.60 Included

Page 11
Cost Recovery Fees GL No: Unit 2019/2020 GST
Facsimile - additional pages (4 pages +) 2300-1500-0000 Per page $0.55 Included
PROPERTY SEARCHES
Property Search - full rate search 2300-1510-0000 Per assessment $155.00 No GST
Property Search - full rate search (24 hour reply) 2300-1510-0000 Per assessment $255.00 No GST
RENTAL ACCOMMODATION
Quilpie Houses # Bedrooms Per wk
10 Boobook Street, Quilpie (house-timber) All transactions to be receipted through Debtors
3 bedroom $285.00 GST free
30 Boonkai Street, Quilpe (house-brick)
Lease Agreement - Catholic Education
3 bedroom $168.00 GST free
58 Boonkai Street, Quilpie (house-timber)
All
tran
sact
ion
s to
be
re
ceip
ted
th
rou
gh D
eb
tors
3 bedroom $168.00 GST free
51 Dukamurra Street, Quilpie (house-timber)
Employment Contract
4 bedroom $326.00 GST free
41 Galah Street, Quilpie (house-brick)
Employment Contract
3 bedroom $306.00 GST free
53 Galah Street, Quilpie (house-brick) 3 bedroom $168.00 GST free
57 Galah Street, Quilpie (house-brick)
Lease Agreement - Ergon Energy
3 bedroom $336.00 GST free
65-67 Galah Street, Quilpie (house-timber)
Lease Agreement - Queensland Health
4 bedroom $500.00 GST free
57 Jabiru Street, Quilpie (house-timber) 3 bedroom $168.00 GST free
Lot 34 Kookaburra Street, Quilpie (house-timber) 3 bedroom $168.00 GST free
41 Pegler Street, Quilpie (house-timber) 3 bedroom $168.00 GST free
64 Pegler Street, Quilpie (house-timber) 3 bedroom $168.00 GST free
66 Pegler Street, Quilpie (house-timber) 3 bedroom $168.00 GST free
74 Pegler Street, Quilpie (house-brick) Lease Agreement - Ergon Energy 4 bedroom $392.00 GST free

Page 12
Cost Recovery Fees GL No: Unit 2019/2020 GST
Eromanga Housing # Bedrooms Per wk
Lot 5, Neal Street, Eromanga (house-timber) 3 bedroom $138.00 GST free
Lot 6, Neal Street, Eromanga (house-timber) 3 bedroom $138.00 GST free
Units / Duplex # Bedrooms Per Wk
60 Pegler Street, Quilpie - Unit 1 2 bedroom $148.00 GST free
60 Pegler Street, Quilpie - Unit 2 2 bedroom $148.00 GST free
88 Quarrion Street, Quilpie - Unit 1 2 bedroom $148.00 GST free
88 Quarrion Street, Quilpie - Unit 2 2 bedroom $148.00 GST free
67 Boonkai Street, Quilpie - Unit 1 2 bedroom $148.00 GST free
67 Boonkai Street, Quilpie - Unit 2 2 bedroom $148.00 GST free
43 Galah Street, Quilpie - Unit 1 2 bedroom $175.00 GST free
(Fully furnished for consultants)
43 Galah Street, Quilpie - Unit 2
(Fully furnished for consultants)
2 bedroom $175.00 GST free
2 Boobook Street, Quilpie (Duplex 1) 2 bedroom $204.00 GST free
2 Boobook Street, Quilpie (Duplex 2)
All
tran
sact
ion
s to
be
re
ceip
ted
thro
ugh
De
bto
rs
2 bedroom $204.00 GST free
x Boobook Street, Quilpie (Duplex 1) NEW 2 bedroom $210.00 GST free
x Boobook Street, Quilpie (Duplex 2) NEW 2 bedroom $210.00 GST free
Aged Persons Housing # Bedrooms Per Wk
1-17 Gyrica Gardens, Quilpie (unit-brick) 2 bedroom $128.00 GST free
Eligible tenants at Gyrica Gardens who do not receive assistance from the Government may be subject to market rent.
2 bedroom $148.00 GST free
Unit 3 - Furnished 2 bedroom $175.00 GST free
Unit 4 - Unfurnished 2 bedroom $128.00 GST free
Eligible tenants who do not receive assistance from the Government may be subject to market rent - $145.00 per week

Page 13
Cost Recovery Fees GL No: Unit 2019/2020 GST
COMMUNITY SERVICES
* A deposit is required for each booking of a facility (no seasonal bookings) EFT details are required for deposit refunds where possible
*Where a deposit does not cover the value of the breakage or cleaning, the hirer will be charged at cost price for service or replacement* Hirers are responsible for leaving the facility, plant or equipment in a clean, acceptable condition- including refuelling, filling gas cylinders etc.
*Applications for any waiver of deposits / fees must be submitted in writing to the Chief Executive Officer.
COMMERCIAL CHARGES USE OF ROADS / STREETS
Permit See BEPO Per week $156.00 No GST
Permit See BEPO Per year $342.00 No GST
Business activities - sale of good - traders / itinerant vendors See BEPO $650.00 GST Inc
HIRE OF HALLS
Quilpie Shire Hall - covers minor breakages & cleaning (Deposit $150 plus non-refundable hire fee $75)
0300-5480 - $150.00
5150-1500 - $75.00
$225.00 / $75.00
GST Free Included
Quilpie Shire Hall Supper Room – covers minor breakages & cleaning (Deposit $150 plus non-refundable hire fee $75)
0300-5480 - $150.00
5150-1500 - $75.00
$225.00 / $75.00
GST Free Included
Quilpie Shire Hall & Supper Room - covers minor breakages & cleaning (Deposit $200 plus non-refundable hire fee $125)
0300-5480 - $200.00
5150-1500 - $125.00
$325.00 / $125.00
GST Free Included
Quilpie Shire Hall - crockery & cutlery (Deposit $100.00 plus non-refundable hire fee $100.00) 0300-5480 - $100.00
5150-1500 - $100.00
$100.00 / $100.00
GST Free Included
Eromanga Hall (to hire please contact QSC) (Deposit $125 plus non-refundable hire fee $75) 0300-5480 - $125.00
5150-1500 - $75.00
$200.00 / $75.00
GST Free Included
Toompine Hall (Deposit $125 plus non-refundable hire fee $75)
Contact: Toompine Hotel - 07 46564863
0300-5480 - $125.00
5150-1500 - $75.00
$200.00 / $75.00
GST Free Included
Adavale Hall (Deposit $125 plus non-refundable hire fee $75)
Contact: Narelle Mandusiak - 07 4656 3396
0300-5480 - $125.00
5150-1500 - $75.00
$200.00 / $75.00
GST Free Included

Page 14
Cost Recovery Fees GL No: Unit 2019/2020 GST
CWA Hall, visiting trades – use of power (eg Jacko’s trim shop)
*Tables & Chairs at the Quilpie Shire Hall can only be hired with the facility and are not availablefor hire separately
See Finance Per week $75.00 Included
TABLECLOTHS & CHAIR COVERS
Tablecloths (round or rectangular)
Chair covers
OR
Tablecloths and chair covers (regardless of number)
5150-1500
CONT OVER PAGE
$6.00 each
$2.00 each
OR
$100.00
Included
REPLACEMENT LOCKS / KEYS
*All lost / damaged locks or keys to Shire Facilities or equipment will be charged to the hirer at replacement cost.
BULLOO PARK
Furniture hire - covers minor breakages & cleaning (Deposit $100 plus non-refundable hire fee $100.00)
0300-5480 - $100.00
3370-1500 - $100.00
$100.00 / $100.00
GST Free Included
Complete complex hire inc tables & chairs - covers minor breakages & cleaning (Deposit $200 plus non-refundable hire fee $300.00)
0300-5480 - $200.00
3370-1500 - $300.00
$200.00 / $300.00
GST Free Included
Microphone / PA (Deposit $100.00 plus non-refundable hire fee $30.00) (only to be used at the venue)
0300-5480 - $100.00
3370-1500 - $30.00
$100.00 / $30.00
GST Free Included
Complex (with or without lights) (Deposit $150.00 plus non-refundable hire fee $100.00) 0300-5480 - $150.00
3370-1500 - $100.00
$150.00 / $100.00
GST Free Included
JOHN WAUGH PARK
Kiosk hire (Fully refundable deposit) 0300-5480 $210.00 GST free
PORTABLE TOILETS
*Two single units available - Please check the condition of the toilets with the Plumber before confirming any bookings (eg. Not favourable to betowed over dirt roads)
Portable toilet - hire fees (per day / weekend / event to a maximum of 3 days) 2300-1500-0000 Per toilet $55.00 Included
Portable toilet – hire fees (per week) 2300-1500-0000 Per toilet $80.00 Included

Page 15
Cost Recovery Fees GL No: Unit 2019/2020 GST
Portable toilets - refundable deposit 0300-5480 Per toilet $220.00 GST free
Portable toilets - cleaning fee (non-refundable) 2300-1500-0000 Per toilet $102.00 Included
Portable toilets trailer unit - hire fees (per day / weekend / event to a maximum of 3 days) 2300-1500-0000 Per unit $102.00 Included
Portable toilets trailer unit – hire fees (per week) 2300-1500-0000 Per unit $153.00 Included
Portable toilets trailer unit - refundable deposit 0300-5480 Per unit $408.00 GST free
Portable toilets trailer unit - cleaning fee (non-refundable) 2300-1500-0000 Per unit $204.00 Included
OUTDOOR THEATRE EQUIPMENT
Outdoor theatre equipment – deposit
(screen and system)
0300-5480 $122.00 GST free
CEMETERIES
Grave digging fee Quilpie (Monday – Friday) 5830-1500-0000 Per site $1020.00 Included
Grave Digging Fee Quilpie (Weekends and Public Holidays) 5830-1500-0000 Per Site $2040.00 Included
Grave Digging Fee Toompine, Eromanga and Adavale 5830-1500-0000 Per Site At cost Included
Grave site reservation fee 5830-1510-0000 Per site $122.00 Included
Columbarium niche fee 5830-1500-0000 Per site $153.00 Included
Columbarium reservation fee 5830-1510-0000 Per site $122.00
Columbarium plaque fixing fee 5830-1500-0000 Per site $122.00 Included
Ashes to be interred into grave
(32.5cm long x 20cm wide x 17.5cm deep)
5830-1500-0000 Per site $255.00 Included
VET - BULLOO PARK
VET hire fee 3370-1500-0000 $60.00 Included
LIBRARY SERVICES
Library membership Per person Free
Internet usage 5710-1600-0000 Per ½ hour / min
$5.00 Included

Page 16
Cost Recovery Fees GL No: Unit 2019/2020 GST
Wifi / Ipads / BOYD (Bring your own device) Free
Library bag 5710-1600-0000 Per bag $5.00 Included
Lost / damaged library books All transactions receipted through Debtors
Replacement cost
Included
BUS HIRE
Community Bus (either) commercial use & non-Quilpie Shire community groups (either bus)
All
tran
sact
ion
s
rece
ipte
d
thro
ugh
De
bto
rs
Per km $1.58 Included
Community Bus (either) Quilpie Shire community non-profit use (either bus) Per km $0.42 Included
Minimum charge (either bus) Per day $40.00 Included
Cleaning of buses At cost $60.00 Included
Bus hire deposit refundable fee 0300-5480-0000 $60.00 GST free
SWIMMING POOLS
Entry Fee – Quilpie Pool Nil Included
Entry Fee – Eromanga Pool Nil Included
Full Day Hire Quilpie (9.00am to 5.00pm) Per day $100.00 Included
After Hours Hire Quilpie Per hour $25.00 Included
Quilpie Swimming Club As negotiated with pool manager
School swimming sessions
RENTAL COMMERCIAL BUILDING
Please Note: Exceptions to fees and charges may only be granted by resolution of Council or delegated officer. Each hire application must be accompanied by a deposit fee for the relevant facility / equipment. Bookings are not confirmed until form and deposit are submitted

Page 17
Cost Recovery Fees GL No: Unit 2019/ 2020 GST
ENGINEERING
WATER & SEWERAGE
Water - connection charge 3100-1500-0000 Per connection $520.00 GST free
Water - disconnection charge 3100-1500-0000 Per connection Quote GST free
Bulk water supply – access fee*
All
tran
sact
ion
s
rece
ipte
d
thro
ugh
De
bto
rs
Per annum $1040.00 GST free
Bulk water supply – consumption* Per litre $0.10 GST free
Special Water Agreement (ENHM, D&L Hoch,) Per annum $874.00 GST free
Sewerage - connection charge 3200-1510 – Quilpie
3210-1500 – Eromanga
Per connection $520.00 GST free
Sewerage - disconnection charge As above Per connection Quote GST free
*Please refer also Regulated Waste Charges
*Bulk water supply charge comprises both an annual access fee in addition to per litre consumption charge.
QUILPIE AERODROME
Aerodrome Operations (out of ordinary working hours) Actual + 40% Actual + 40% Included
PLANT HIRE RATES
Plant/Machinery Council (hr) Main Roads / Contract (hr)
Grader A
ll tr
ansa
ctio
ns
rece
ipte
d
thro
ugh
De
bto
rs
$145.00 $166.00 Included
Multi tyred rollers $104.00 $120.00 Included
Backhoe $104.00 $120.00 Included
Skidsteer loader/bobcat $94.00 $107.00 Included
Trucks - prime mover, tipper and water trucks $115.00 $131.00 Included
Water tanker (trailer) $32.00 $36.00 Included
Trucks - (small and medium) $62.00 $72.00 Included

Page 18
Cost Recovery Fees GL No: Unit 2019/ 2020 GST
Low loader model JSST-3-20 $45.00 $52.00 Included
Loaders $156.00 $179.00 Included
Concrete agitator $94.00 $107.00 Included
Excavator $67.00 $78.00 Included
Forklift
All
tran
sact
ion
s re
ceip
ted
th
rou
gh D
eb
tors
$67.00 $78.00 Included
Tractor $88.00 $101.00 Included
Ride on mowers $13.00 $16.00 Included
4WD light utilities $21.00 $24.00 Included
2WD light utilities $13.00 $16.00 Included
Other vehicles - wagons $17.00 $19.00 Included
Labour
Manager $200.00 $204.00 Included
Works Manager/Supervisor $125.00 $127.50 Included
Trade - qualified $83.00 $85.00 Included
Trade - unqualified $72.00 $75.00 Included
Plant operator $72.00 $75.00 Included
Labourer $53.00 $55.00 Included
Recoverable Private Works
Labour As above As above Included
Plant hire As above As above Included
Parts and materials At cost + 30% At cost + 30% Included
Accommodation Council Staff Contractors
Adavale permanent camp (per room per day) $56.50 $56.50 Included
Cheepie permanent camp (per room per day) $56.50 $56.50 Included
Thylungra permanent camp (per room per day) $56.50 $56.50 Included

Page 19
Cost Recovery Fees GL No: Unit 2019/ 2020 GST
Eromanga permanent camp (per room per day) $56.50 $56.50 Included
Transportable/floating accommodation units (per room per day) $56.50 $56.50 Included
Caravan (per day) N/A $21.00 Included
Own facilities using Council camp (all camps) N/A $12.50/day Included


![Operational Plan - Shire of Quilpie · Doc ID: 98637 [ 2 ] 1 – OPERATIONAL PLANNING PROCESS About the Operational Plan Council’s Operational Plan is the detailed business and](https://img.pdfslide.us/doc/110x75/5b512dd87f8b9a56588bc16c/operational-plan-shire-of-quilpie-doc-id-98637-2-1-operational-planning.jpg)