Embed Size (px)
Citation preview

forman
Expert Choice
5/9/2013
Quick Start Guide For Comparion

1
Table of Contents
I. Logging in .................................................................................................................... 2 II. Creating a New Project …………………………………………..……….………………….………………… 5III. Adding Objectives ……………………………………..………….……….……………………………………… 6IV. Adding Alternatives ………………………………………………………….……………………………………. 9V. Alternatives Contributions ………………………………………………….………………………………… 11VI. Participants Roles …………………………………………………………….…………………………………… 12VII. Save As, Archive, Download ……………………………………………….………………………………… 14VIII. Inviting Participants to an AnyTime Evaluation ……………………..……………………………… 16IX. AnyTime Evaluation – Collect My Input ………………………………………………………..……… 20X. Synthesis Overall Results and Sensitivity Analysis ………………………………………………… 22
Notes:
These instructions are for users registered at comparion.expertchoice.com. If you are using another site (including self-hosted sites), ask your system administrator for details that may differ. These instructions are for getting started and are not intended to replace the detailed instructions found in the on-line help.
2
I. Logging in (for registered users only)
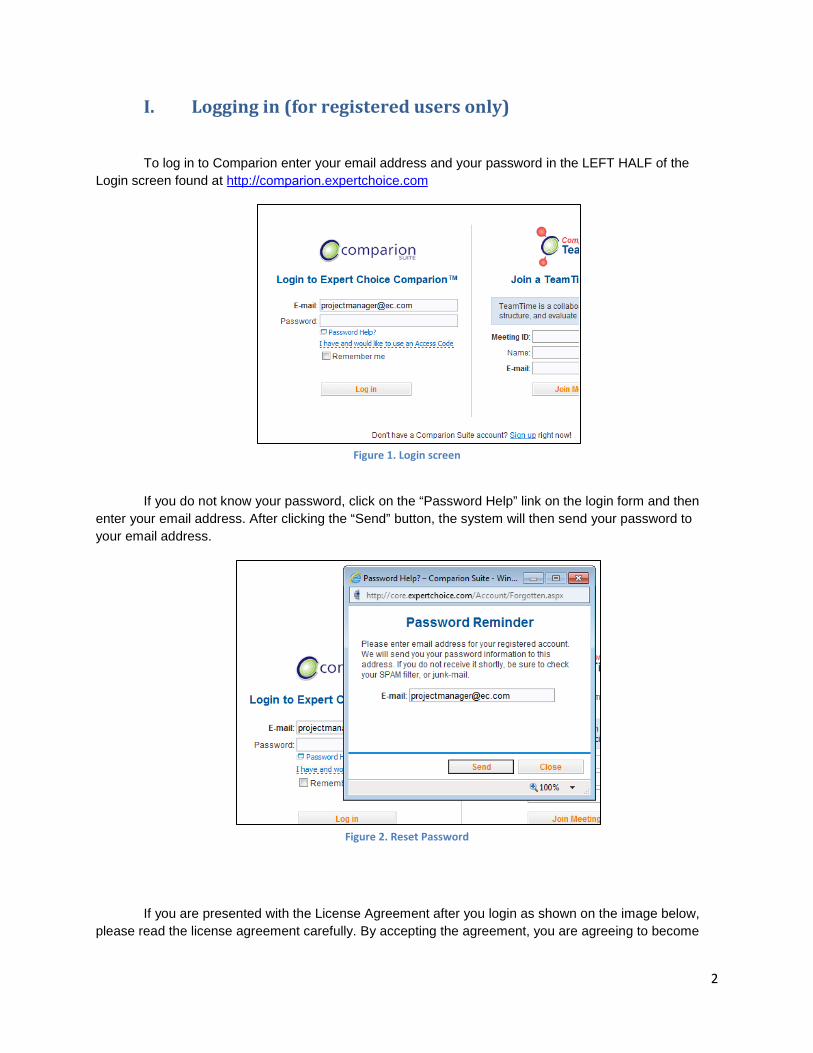
To log in to Comparion enter your email address and your password in the LEFT HALF of the Login screen found at http://comparion.expertchoice.com
Figure 1. Login screen
If you do not know your password, click on the “Password Help” link on the login form and then enter your email address. After clicking the “Send” button, the system will then send your password to your email address.
Figure 2. Reset Password
If you are presented with the License Agreement after you login as shown on the image below, please read the license agreement carefully. By accepting the agreement, you are agreeing to become

3
the licensee and expressing your complete acceptance of all the terms and conditions of the license agreement.
Figure 3. License Agreement
After accepting the license agreement, you will then be presented with the opening screen that shows useful links on getting started with Comparion including reference videos and projects. This opening screen is turned ON by default. You can choose not to show this anymore by clicking on the option at the bottom of the window.
Figure 4. Comparion opening screen

4
It is advisable that you change your password after your first login. You can change your password by clicking on the Home icon / Preferences / Personal Settings. Note that in many cases, your password is initially set to “no password”, just fill in the “Change Password” fields to update your password.
Figure 5. Personal Settings

5
II. Creating a New Project
After you have completed changing your password, go to Project Management / Projects.
Make sure that you are starting a new project on a correct Workgroup. Most users will be members of only one workgroup. If you are a member of more than one workgroup, then you will be able to select which Workgroup you want to work with using the select Workgroup pull-down menu as shown in the figure below:
Figure 6. Workgroup drop-down
Comparion provides you three options to create projects:
Figure 7. Create new project buttons
• New Project -- creates a new project without any information. • New from Template -- creates a project from one of the stored templates. • New From File -- creates a project from either a file previously downloaded from a
Comparion project and stored on your computer or from an Expert Choice Desktop file. This is explained in the online help.

6
III. Adding Objectives
We can add objectives to a created project from the Structure / Objectives screen:
Figure 8. Objectives screen
A new project will show only "Goal:" The 'Goal' is an overall statement of the decision. You can edit this Goal by selecting it and then clicking the “Edit” button. You can also do this by double clicking on the Goal.
Figure 9. Goal
We can add information document associated to the Goal by clicking on the “Edit Information Document” button.
Figure 10. Edit Information document

7
Additional elements (objectives, sub-objectives, scenarios, ...) can be added either at the same level of the currently selected node by pressing Add at Same Level button, or below the currently selected node, by pressing Add (level below) button. From our example, since we only have “Goal”, we can select only the option “Add (level below)”.
Figure 11. Add (level below) button
Clicking the “Add (level below) button will open a new window where we can add objective/s in two ways:
• Enter one or more elements, along with brief (optional) descriptions • The Paste from clipboard button will paste elements that have been previously placed
on the clipboard into the hierarchy.
Here we will add the objectives “Style” and “Performance” as shown in the figure below.
Figure 12. Add new objectives window

8
The resulting hierarchy will be:
Figure 13. Objectives hierarchy
Adding one or more spaces before an element name, will indicate that the element should be added at a lower level in the hierarchy as shown below:
Figure 14. Add objectives below
The objectives “Initial Purchase Price” and “Maintenance Cost” will be below the objective “Cost”:
Figure 15. Objectives hierarchy 2
You can view a more detailed explanation with videos of Structuring Objectives on the On-line Help.

9
IV. Adding Alternatives
We can add alternatives from Structure / Alternatives.
Figure 16. Alternatives screen
From the Alternatives screen, simply click the “Add” button. A window will be displayed where we can type in the alternatives and their description (optional). We can also add alternatives by the “Paste from Clipboard” option.
Figure 17. Add alternatives window

10
Here we see the alternative hierarchy after adding the alternatives above:
Figure 18. Alternatives hierarchy
A more detailed explanation for managing the alternatives is explained in the online help.

11
V. Alternatives Contributions
The Contributions screen allows you to map which alternatives contribute to which covering objectives. The default is that all alternatives contribute to all covering objectives. As you from the figure below, all of the checkboxes are checked.
Figure 19. Contributions screen
An alternative that does not contribute to a covering objective will have zero priority for that covering objective.
The figure below shows that Toyota Camry does not contribute to the objective Style, but does contribute to Performance, Cost: Initial Purchase Price and Cost: Maintenance Cost.
Figure 20. Contributions

12
VI. Participant Roles
Roles can be assigned to groups (custom groups or a pre-defined group called 'All Participants') as well as to individual participants. We can change roles from the Structure / Participant Roles screen.
Figure 21. Participant Roles screen
The role represented by the background color is determined implicitly by groups -- the 'All Participants' group, as well as any custom defined groups. The figure below shows the roles of the participant named “Kris” for evaluating Objectives.
Figure 22. Objective Roles
You will notice that all of the nodes in the figure above have a background of green, because by default, the "All Participants" group has an 'allow role' for everything, and we have not defined any custom groups that might have had one or more 'restrict' roles.
13
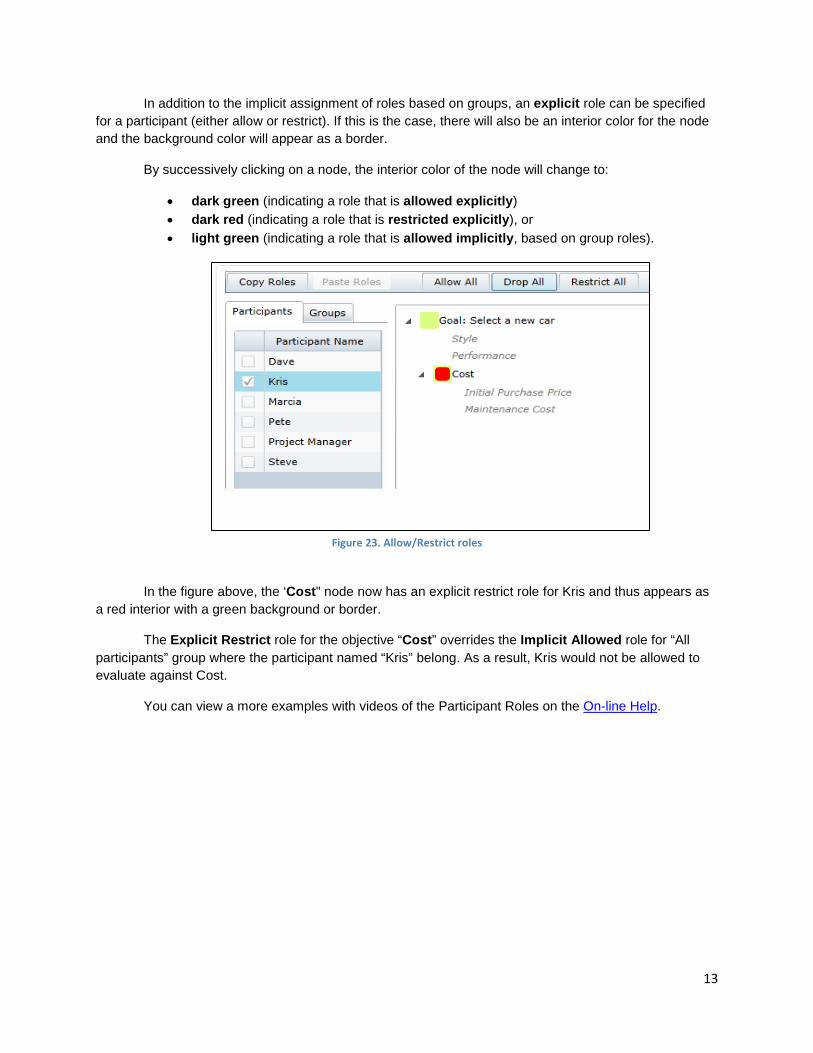
In addition to the implicit assignment of roles based on groups, an explicit role can be specified for a participant (either allow or restrict). If this is the case, there will also be an interior color for the node and the background color will appear as a border.
By successively clicking on a node, the interior color of the node will change to:
• dark green (indicating a role that is allowed explicitly) • dark red (indicating a role that is restricted explicitly), or • light green (indicating a role that is allowed implicitly, based on group roles).
Figure 23. Allow/Restrict roles
In the figure above, the ‘Cost" node now has an explicit restrict role for Kris and thus appears as a red interior with a green background or border.
The Explicit Restrict role for the objective “Cost” overrides the Implicit Allowed role for “All participants” group where the participant named “Kris” belong. As a result, Kris would not be allowed to evaluate against Cost.
You can view a more examples with videos of the Participant Roles on the On-line Help.

14
VII. Save As, Archive, Download
You can do a “Save As”, archive, and download your project from the Home / Projects screen.
To open a project file, click the Open button. Alternatively, you can double click the project name.
Figure 24. Projects screen
If you single click on a project name, you will see commands below the name:
Figure 25. Commands
The Save As command allow us to have a copy of our project:
Figure 26. Save As

15
You can change the project name as you desire. This is very useful if you want to have a back-up
of your projects. The CreateTemplate command will create a project template from the original project. The
created template has no judgments but the alternatives and the objectives of the original project are saved. This project templates are can be used in building your future projects.
The Evaluation progress command allows you to go directly to the overall results page where
you can view the results of the evaluation. The Download command allows you to download the project to your hard disk drive as either desktop or Comparion file. You could also create a project link for the project or to delete the project

16
VIII. Inviting Participants to an AnyTime Evaluation
You can invite participants to your evaluation from the Measure / AnyTime Evaluation / Invite Participants screen.
Figure 27. Invite Participants screen
Comparion has several ways to invite participants to an anytime evaluation -- both for unregistered participants as well as those already registered in the project.
Figure 28. Invite Participants options
1. Comparion Sends E-mail
This option is used to select one or more participant already registered in the project and then have Comparion send an email to each of the selected participants. First, is you need to select the participants that you want to participate:

17
Figure 29. Select participants to receive the invite
And then click the Send Invite button:
The selected participants will then receive an email. The email looks like this:
Figure 30. Email sample
The participants need only to click on the evaluation link and they will be taken to their evaluation.
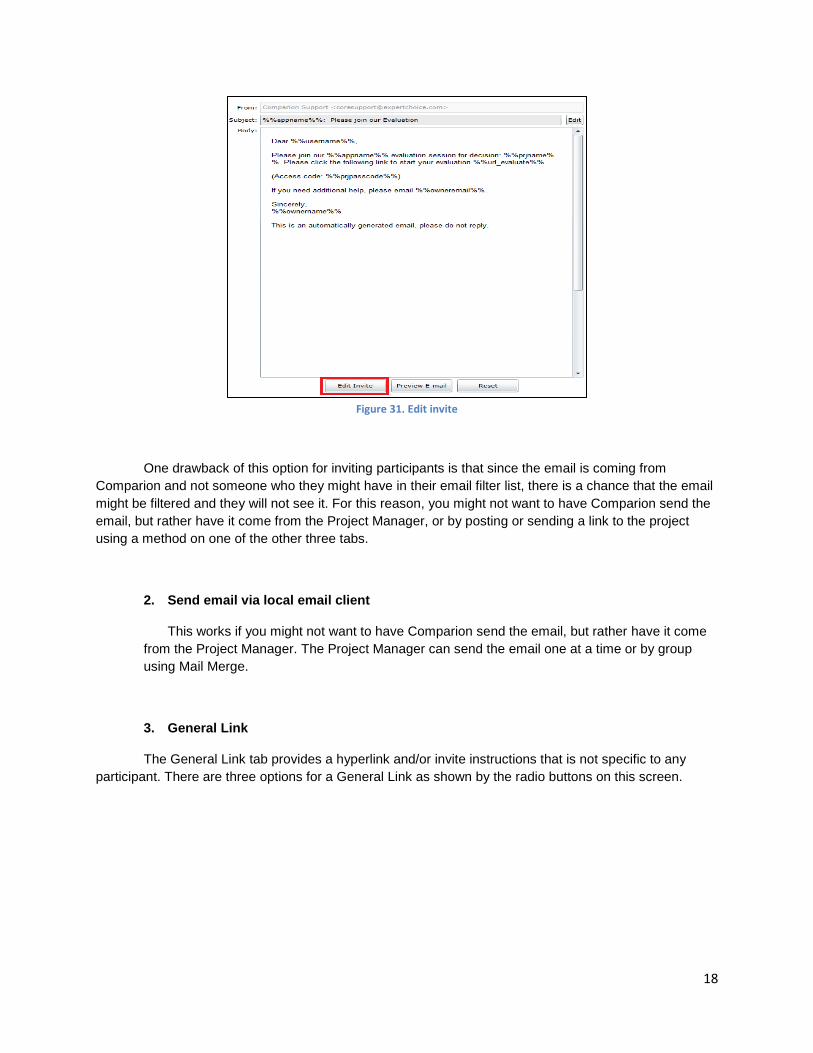
To edit the invitation template, simply click on the Edit Invite button and update the content:
18
Figure 31. Edit invite
One drawback of this option for inviting participants is that since the email is coming from Comparion and not someone who they might have in their email filter list, there is a chance that the email might be filtered and they will not see it. For this reason, you might not want to have Comparion send the email, but rather have it come from the Project Manager, or by posting or sending a link to the project using a method on one of the other three tabs.
2. Send email via local email client
This works if you might not want to have Comparion send the email, but rather have it come from the Project Manager. The Project Manager can send the email one at a time or by group using Mail Merge.
3. General Link
The General Link tab provides a hyperlink and/or invite instructions that is not specific to any participant. There are three options for a General Link as shown by the radio buttons on this screen.

19
Figure 32. General Links
4. Participant Specific Links
The Participant Specific Links tab provides a (unique) link and email address is generated for every participant in the project. The Project Manager can use these links in any way that they desires.
Figure 33. Participant Specific Links
You can view a more detailed explanation with videos of Inviting Participants on the online help.
20
IX. Anytime Evaluation – Collect My Input
You can provide your input as a Project Manager from Measure / AnyTime Evaluation / Collect My Input.
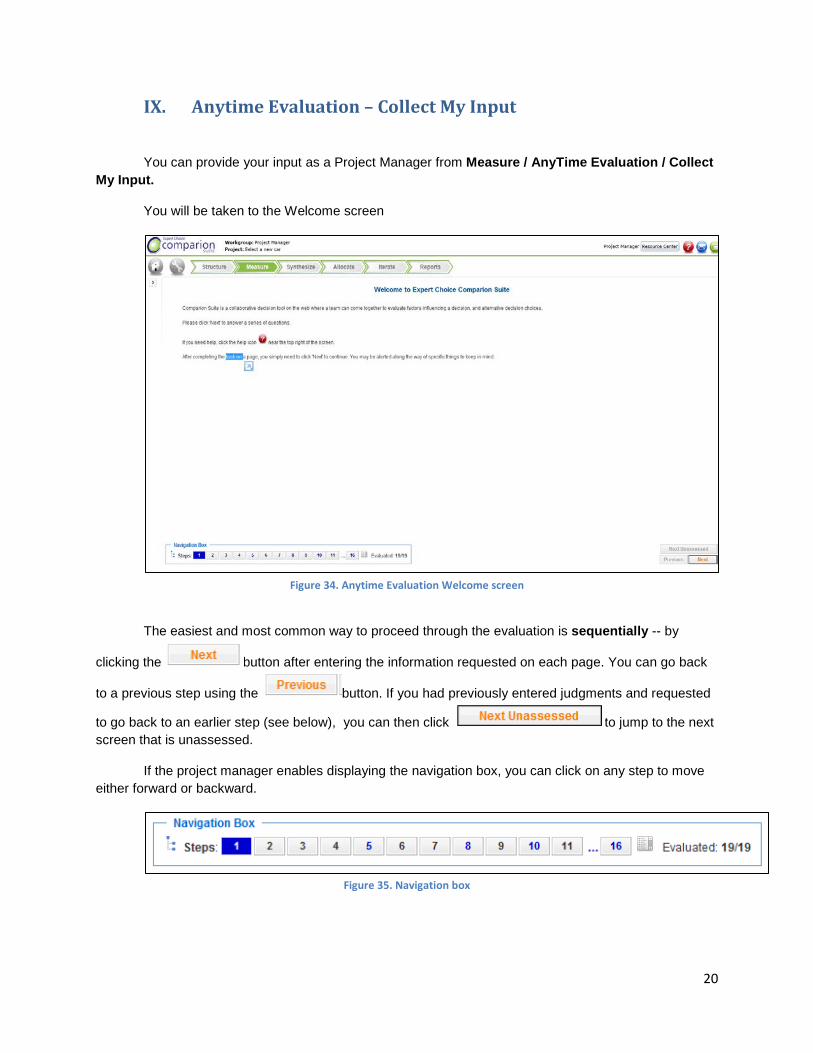
You will be taken to the Welcome screen
Figure 34. Anytime Evaluation Welcome screen
The easiest and most common way to proceed through the evaluation is sequentially -- by
clicking the button after entering the information requested on each page. You can go back
to a previous step using the button. If you had previously entered judgments and requested
to go back to an earlier step (see below), you can then click to jump to the next screen that is unassessed.
If the project manager enables displaying the navigation box, you can click on any step to move either forward or backward.
Figure 35. Navigation box

21
The 'Where Am I' icon at the bottom left of the screen can be used to display a pop up a view of the hierarchy. By clicking on any element in the hierarchy, you will jump to the first screen that elicits judgments' with respect to' that element. The 'with respect to' for the current step is shown in blue.
An even more useful navigation aid is the List icon that lists all of the evaluation steps from which you jump to any step.
Figure 36. View step list

22
X. Synthesis Overall Results and Sensitivity Analysis
The priorities of the alternatives for “all participants” is shown in the Synthesize / Overall Results screen.
Figure 37. Overall Results screen
You can display the local and/or global priorities of the objectives by clicking on the two icons at the left in the figure below:
Figure 38. Display Local and Global priorities
You can also display results for individual participants as well as defined groups of participants.
23
Figure 39. View results for groups Figure 40. View results for individuals
You can view sensitivity analyses from Synthesize / Sensitivity:
Figure 41. Sensitivity results
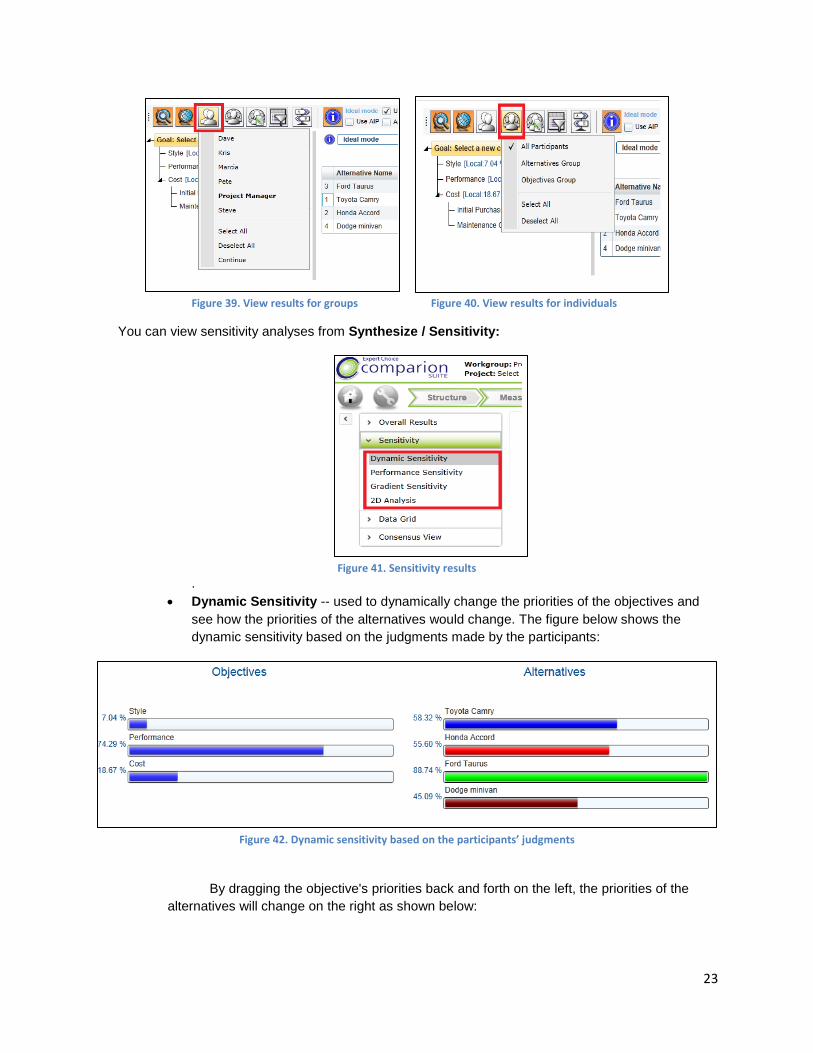
. • Dynamic Sensitivity -- used to dynamically change the priorities of the objectives and
see how the priorities of the alternatives would change. The figure below shows the dynamic sensitivity based on the judgments made by the participants:
Figure 42. Dynamic sensitivity based on the participants’ judgments
By dragging the objective's priorities back and forth on the left, the priorities of the alternatives will change on the right as shown below:

24
Figure 43. Dynamic Sensitivity (modified)
Dodge minivan becomes the preferred alternative if the priority of the cost objective is increased sufficiently.
The changes you made on the sensitivity screens will retained unless you reset to the original objective priorities as determined by participants’ judgments by clicking the reset
button
• Performance Sensitivity – Can be very ‘busy’, but shows more information than any of the other sensitivity screens. It shows the priorities of the objectives, the performance of each alternative with respect to each of the objectives, as well as the overall priorities of the alternatives at the right of the screen.

25
Figure 44. Performance Sensitivity based on participants' judgments
Figure 45. Performance Sensitivity (modified)
By dragging any of the objectivity bars up or down, the overall priorities (and possibly their ranks) will change at the right of the screen. The figure on the right shows that the Dodge minivan is the preferred alternative as well when Cost is increased by priority.
• Gradient Sensitivity-- shows the rate of change of the priorities of the alternatives with respect to changes in priority of one of the objectives.

26
Figure 46. Gradient Sensitivity based on participants’ judgments
The curves shown in the figure above are the alternatives. The red vertical bar depicts the priorities of the alternatives. The chosen objective on the x-axis is the “Cost”. This can be changed from the pull down menu
Figure 47. Objectives drop down
If we will increase the importance of Cost as depicted by the blue vertical line, Dodge minivan will also have the highest priority.
Figure 48. Gradient sensitivity (modified)
27
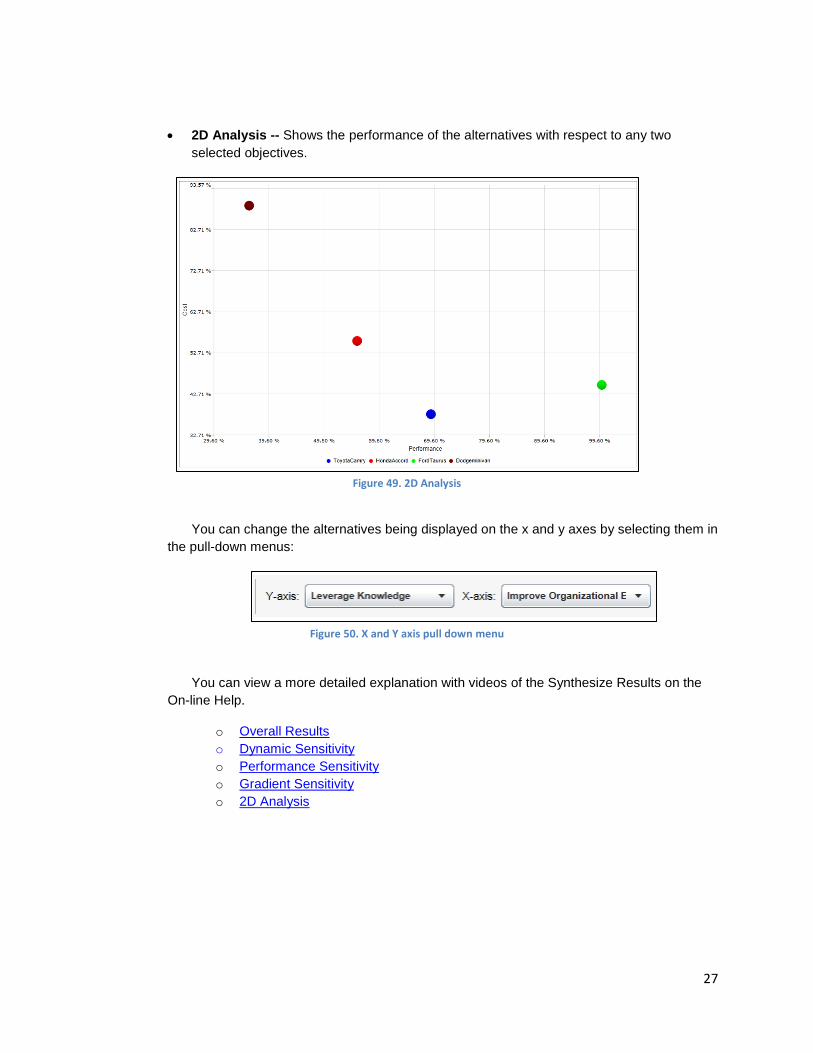
• 2D Analysis -- Shows the performance of the alternatives with respect to any two selected objectives.
Figure 49. 2D Analysis
You can change the alternatives being displayed on the x and y axes by selecting them in the pull-down menus:
Figure 50. X and Y axis pull down menu
You can view a more detailed explanation with videos of the Synthesize Results on the On-line Help.
o Overall Results o Dynamic Sensitivity o Performance Sensitivity o Gradient Sensitivity o 2D Analysis