Embed Size (px)
Citation preview

https://isma13in.wordpress.com
Quick Function Point
The Joint 13th CSI/IFPUG International Software Measurement & Analysis (ISMA13) Conference
Mumbai (India) – March 6, 2017
Bhawna Thakur
Bhawna has 16 years of core IT Services experience of
successful Program Management, Project Implementation,
Participation in RFPs through Estimation & Cost framework
build tools and process for account/organization, bid
consultancy, establish metrication for organization through
Benchmarking and Baselining, SLA , KPI negotiations with
customer and customer interaction at leadership level
across the globe.
Bhawna is currently working with CGI. She is a corporate
member of CGI’s Global Estimation Centre.
CGI Group Inc. more commonly known as CGI, is a Canadian
Global information technology (IT) consulting, systems integration,
outsourcing, and solutions company headquartered in Montreal,
Quebec, Canada with an employee strength of 71000 spread across
globe.
Accelerate your sizing process
© CGI Group Inc.
Quick Function Point (QFP)To accelerate your Sizing Process
Bhawna Thakur
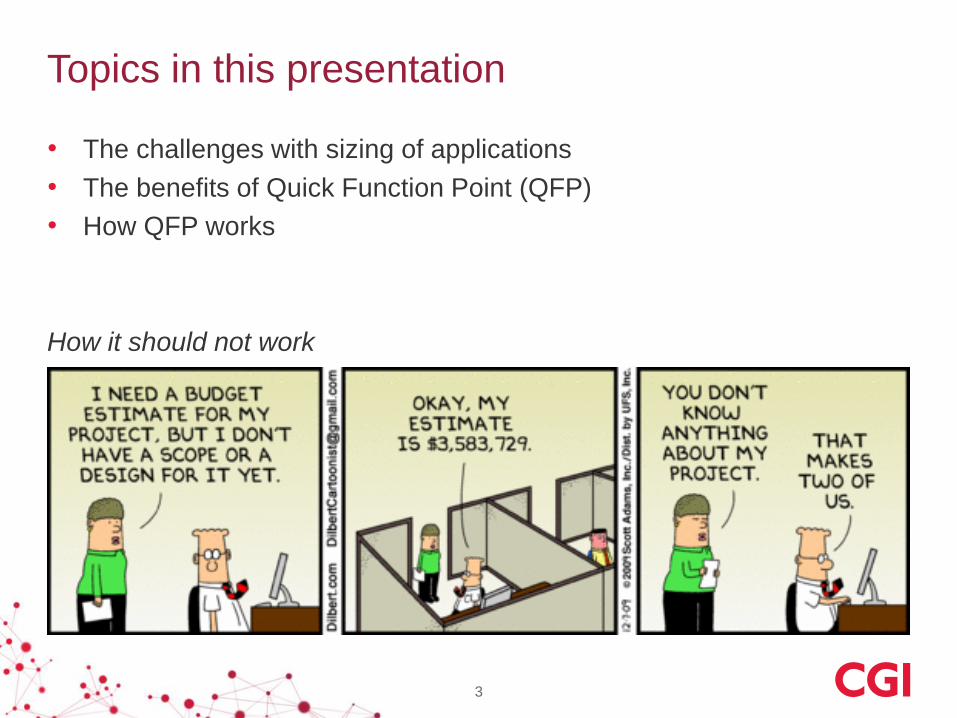
Topics in this presentation
• The challenges with sizing of applications
• The benefits of Quick Function Point (QFP)
• How QFP works
How it should not work
3

• Solution defined by architects
• First sizing for ROM Estimate
4
Ideally we follow the Estimation Lifecycle
• Detailed sizing
• Size based estimates
• Estimation reviews
• Effort, duration, quality, peak staff
• Reporting
• Engagement control
• Collection of actual data
• Re-estimations due to scope changes
• Collect and analyze actual data
• Verify performance (benchmarking)
• Maintain data as input for new estimates
EAS
Solution
Estimating
Engagement execution
and control
Metrics collection
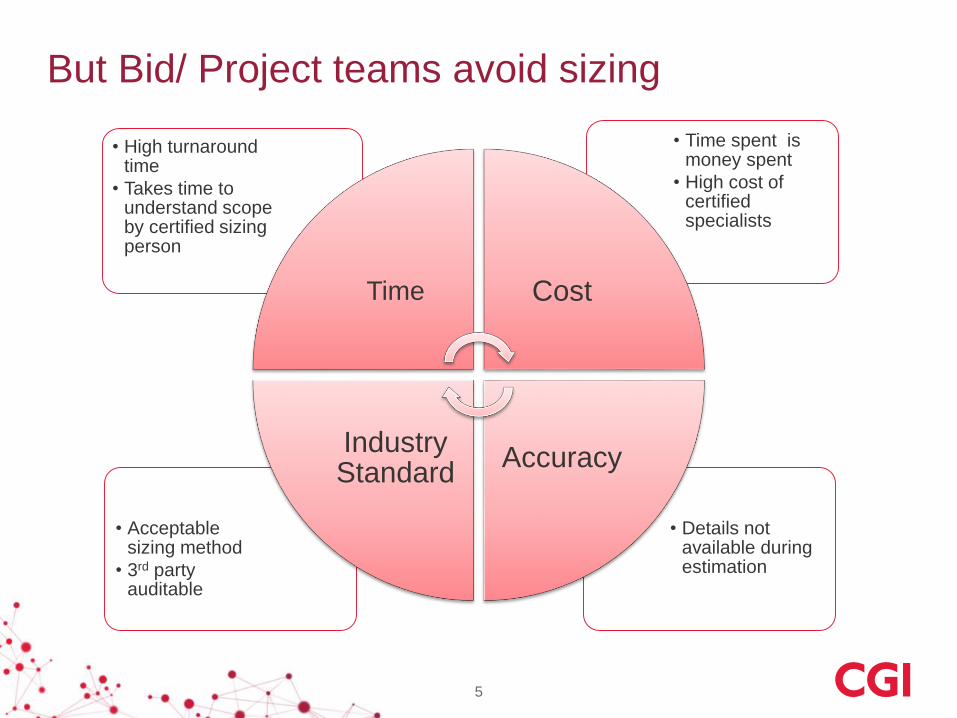
But Bid/ Project teams avoid sizing
5
• Details not available during estimation
• Acceptable sizing method
• 3rd party auditable
• Time spent is money spent
• High cost of certified specialists
• High turnaround time
• Takes time to understand scope by certified sizing person
Time Cost
AccuracyIndustry Standard
6
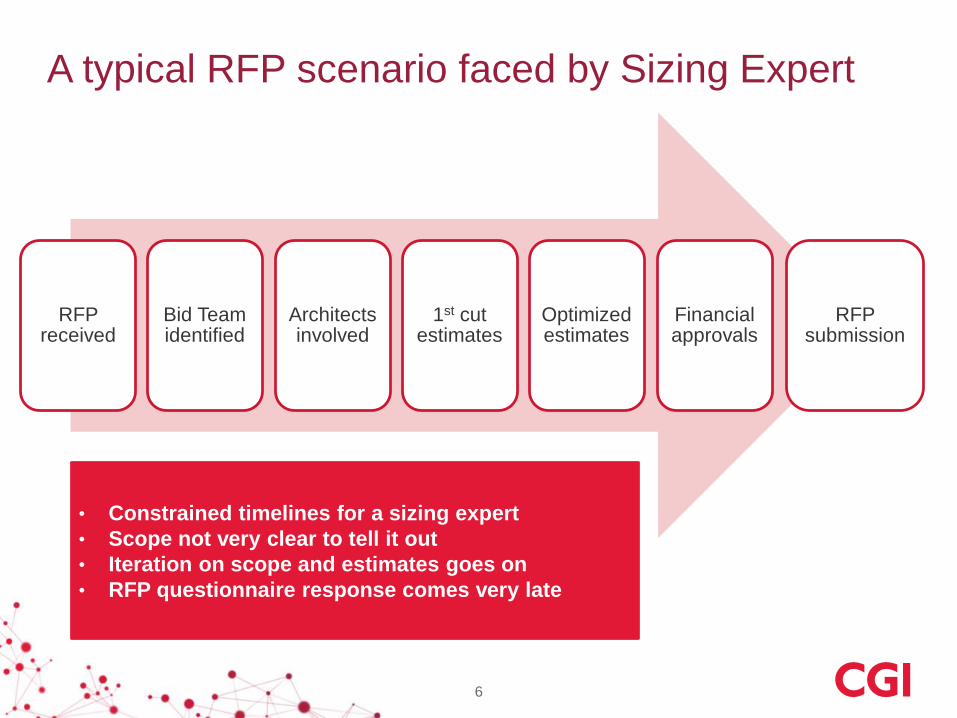
A typical RFP scenario faced by Sizing Expert
RFP received
Bid Team identified
Architects involved
1st cut estimates
Optimized estimates
Financial approvals
RFP submission
• Constrained timelines for a sizing expert
• Scope not very clear to tell it out
• Iteration on scope and estimates goes on
• RFP questionnaire response comes very late
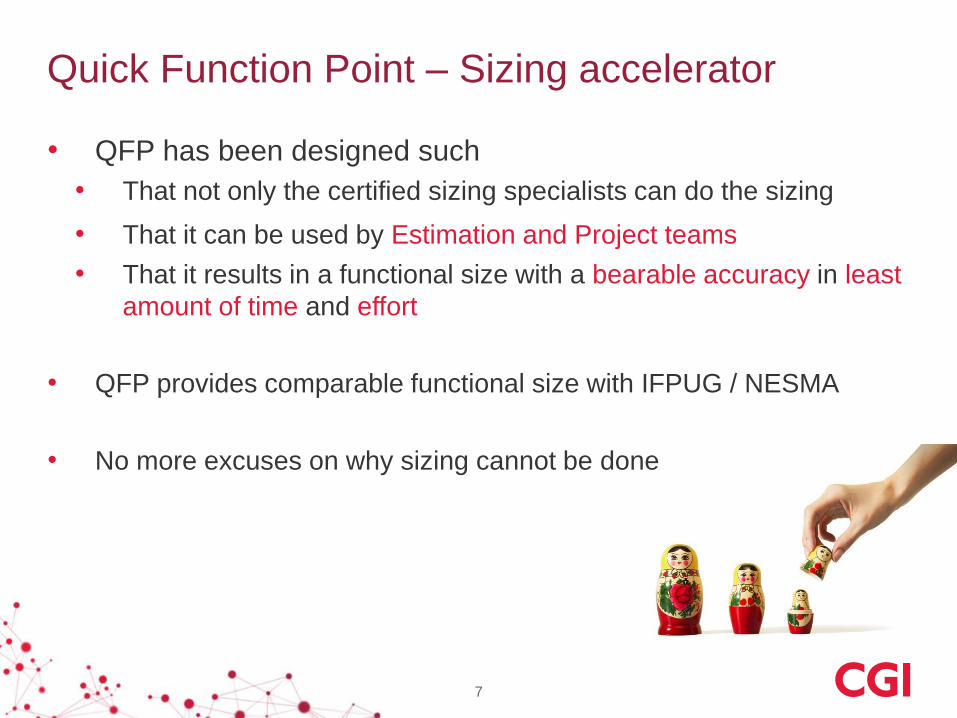
Quick Function Point – Sizing accelerator
• QFP has been designed such
• That not only the certified sizing specialists can do the sizing
• That it can be used by Estimation and Project teams
• That it results in a functional size with a bearable accuracy in least
amount of time and effort
• QFP provides comparable functional size with IFPUG / NESMA
• No more excuses on why sizing cannot be done
7

• Reduced training effort by 50%
• Difference of +/- 8% on size
Benefits compared with IFPUG FPA
8
• Reduced sizing effort (cost) by 73%
• Possibilities of functional sizing by everyone

Quick Function Point (QFP)
9
A Functional Sizing method
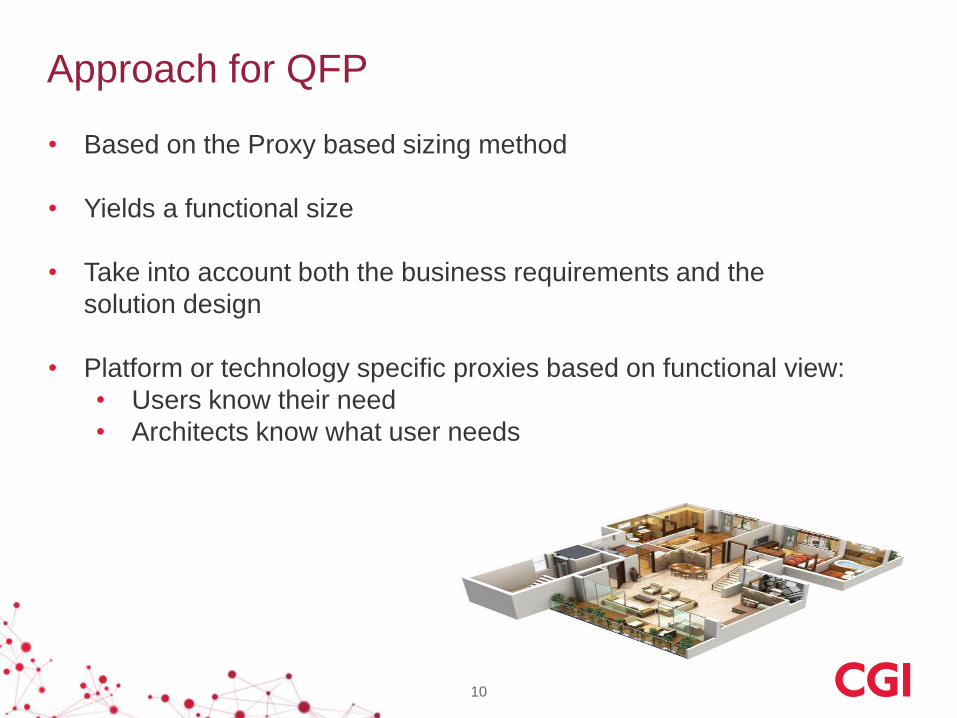
Approach for QFP
10
• Based on the Proxy based sizing method
• Yields a functional size
• Take into account both the business requirements and the
solution design
• Platform or technology specific proxies based on functional view:
• Users know their need
• Architects know what user needs

What is a Proxy
• A Proxy is a component or element of software which is recognized in
order to build or enhance software projects and it is
• Meaningful to local estimators
• Correlates with business / functional requirements, design elements
or software components
• Can be used to size a system without expert knowledge of
(standard) functional sizing method
• Proxies are also defined as:
• a customized measurement for software size
• a way to relate the software being developed (or enhanced) with
the effort required
11

Functional Proxies :Transaction & Data
12
OTHER OUTPUTS
• REPORTS
• FILES
• XML
• VIEWS
• XML
• FICHE
• TAPE
• DISKETTES
• LETTERS
• NOTICES
• ALARMS
APPLICATION
BOUNDARY
INTERNAL LOGICAL FILES
(TABLES, DATA FILES,
CONTROL FILES)
INPUT FILES AND INPUT
TRANSACTIONS
(BATCH INTERFACES,
WEB SERVICES)
CONTROL
INFORMATION
Logical
Entities -
Internal
EXTERNAL
TABLES & FILES
REFERENCED from other
applications
(Not Maintained)
OUTPUT FILES
AND OUTPUT
TRANSACTIONS
(BATCH
INTERFACES, WEB
SERVICES)
Background
Processes – Batch -
Inbound
Search /
View /
Query /
Reports
Logical
Entities -
External
Background
Processes –
Batch -
Outbound
Web
Services /
Interfaces -
Inbound
Web
Services /
Interfaces -
Outbound
SCREENS
(ADDS, CHANGES,
DELETES, QUERIES)User
Interfaces
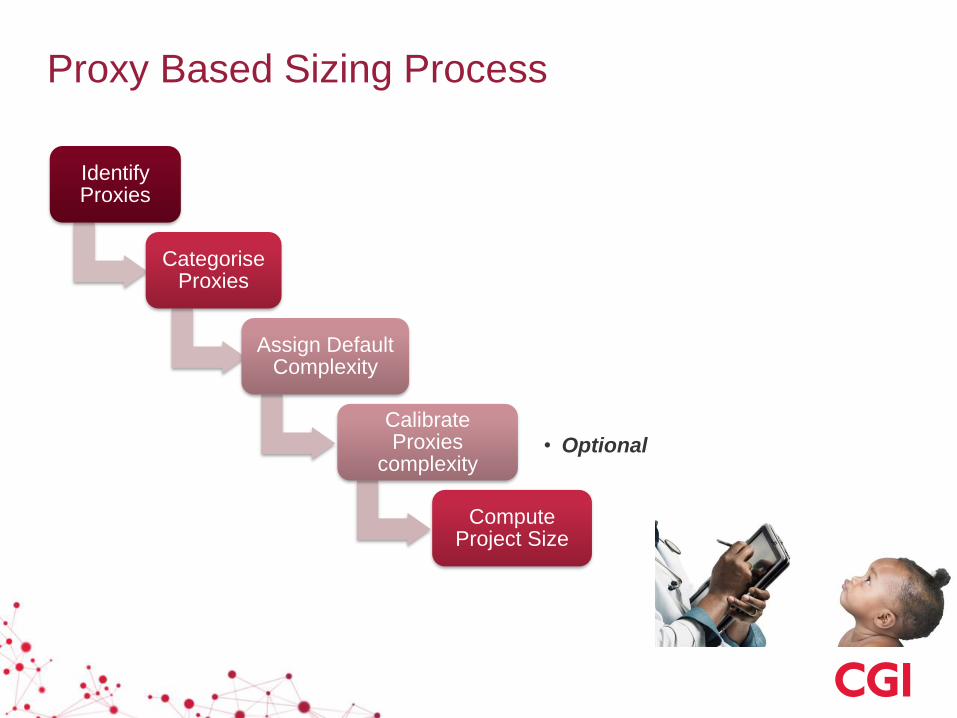
Proxy Based Sizing Process
Identify Proxies
Categorise Proxies
Assign Default Complexity
Calibrate Proxies
complexity• Optional
Compute Project Size

Identify Proxies - 1
• Estimation Teams shall build functional proxies based on platforms or
scenarios to relate with
• List of Generic Proxies that can be used in most of the situations
• Internal Logical Data Entity
• External Logical Data Entity
• User Input Interface
• Search / View / Query
• Reports
• Background process
• Message
• Web Services
• Interface

• Solution Specific proxies: SAP, SharePoint, Data Warehouse
• Example of SAP Proxies
Identify Proxies - 2
Proxy Definition
R Report Accounted for any report with code related work
I Interface – Inbound Accounted when data is being fetched from an external source to store within the module / submodule
Interface – Outbound Accounted when data is being sent to an external application
C Data Conversion One-time Interface – Inbound with data transformation logic
E Enhancement Accounted for any development work to enhance a standard elementaty function, or add a new elementary function
F Forms Accounted when a form is required to display or report data
W Workflow Accounted for each customised workflow level
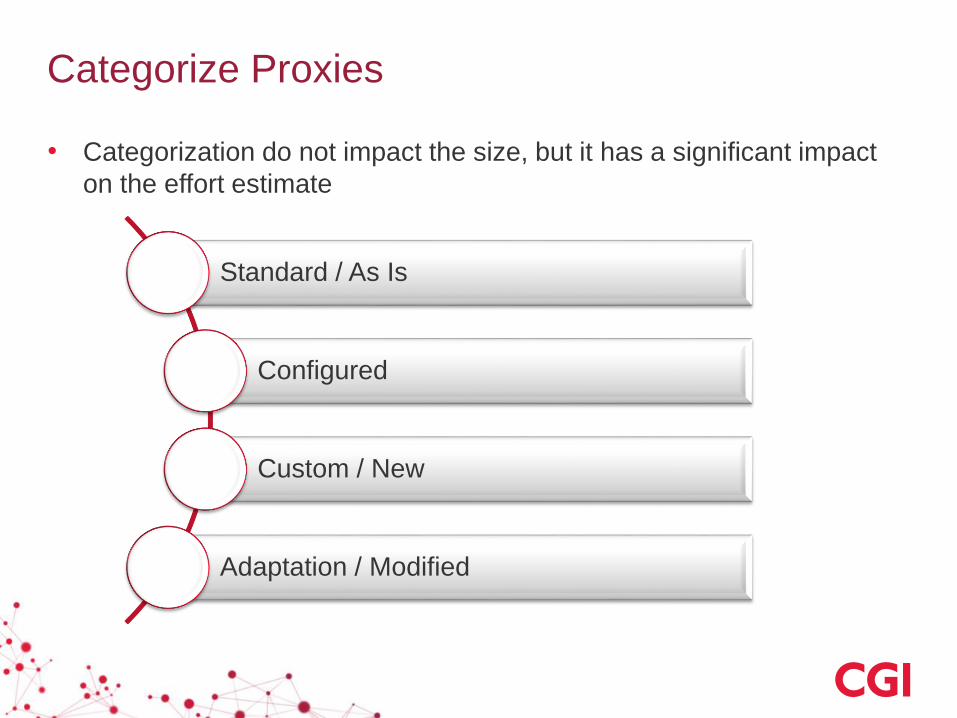
Categorize Proxies
• Categorization do not impact the size, but it has a significant impact
on the effort estimate
Standard / As Is
Configured
Custom / New
Adaptation / Modified
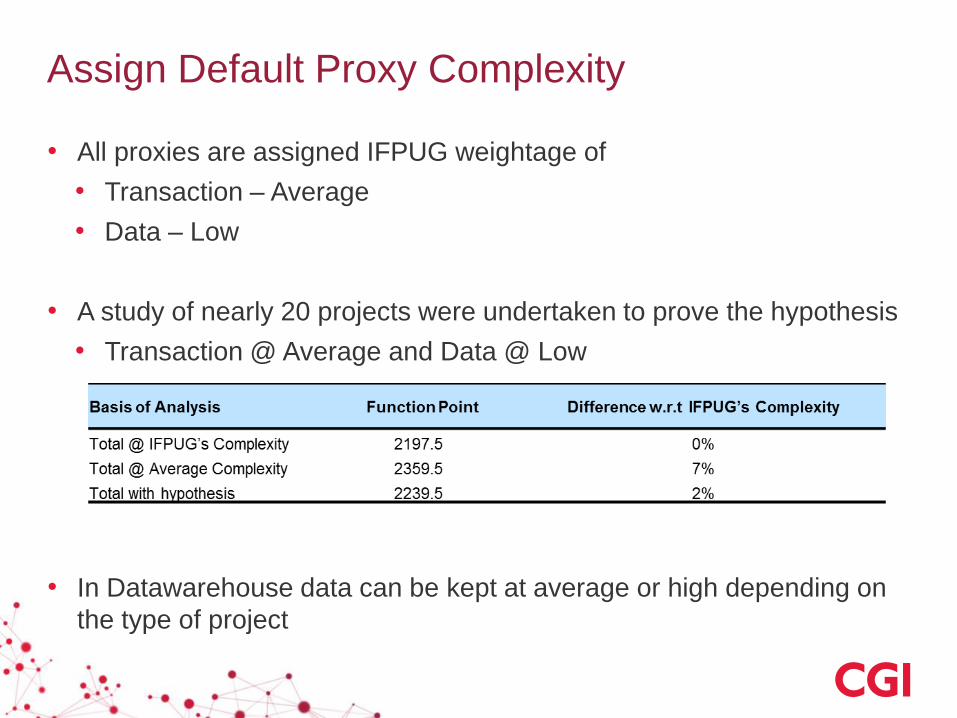
Assign Default Proxy Complexity
• All proxies are assigned IFPUG weightage of
• Transaction – Average
• Data – Low
• A study of nearly 20 projects were undertaken to prove the hypothesis
• Transaction @ Average and Data @ Low
• In Datawarehouse data can be kept at average or high depending on
the type of project
Calibrate Proxy Complexity - Optional
• Defining Proxy complexity is an optional step that will help to refine
the size
• The level of complexity is based on the assessment of the number of
Data Elements addressed by the proxies
• which can be Low, Average or High,

Compute Project Size
• Project size in computed in Function Points and broken down per
category (Standard, Configuration, Adaption, Custom-Made)
• Example:
Standard proxies: 0
Configuration proxies: 320 FP
Adaptation proxies: 120 FP
Custom-made proxies: 205 FP
Total Size: 645 FP

QFP vs. IFPUG – Recent study
Product/Team IFPUG FP Count Ideal QFP %diff
Project A 319 339 6%
Project B 131 138 5%
Project C 133 144 8%
Project D 46 43 -7%
Product/Team IFPUG FP Count Team Counted QFP %diff
Project A 319 377 15%
Project B 131 128 -2%
Project C 133 126 -6%
Project D 46 39 -18%
Product/Team IFPUG FP Count Project LOCBackfired FP -Through Caper
Jones tables
Project A 319
Project B 131 7100 323
Project C 133 8500 262
Project D 46
Ideal PBM : PBM is done by a person who has practiced Function Point on few projects in past and is either a certified candidate or well
versed with IFPUG FP so that the Data and Transaction identified is same for IFPUG and PBM
Team Counted PBM : The size displayed by PBM is from the real time project which is undertaken just after the training is over. We let
participants count with QFP without any interference from trainer and record the results.
Project LOC : It is used to prove that backfiring with caper jones table is not a good idea. We need to find a representative gearing factor
if really we want LOC to FP conversion
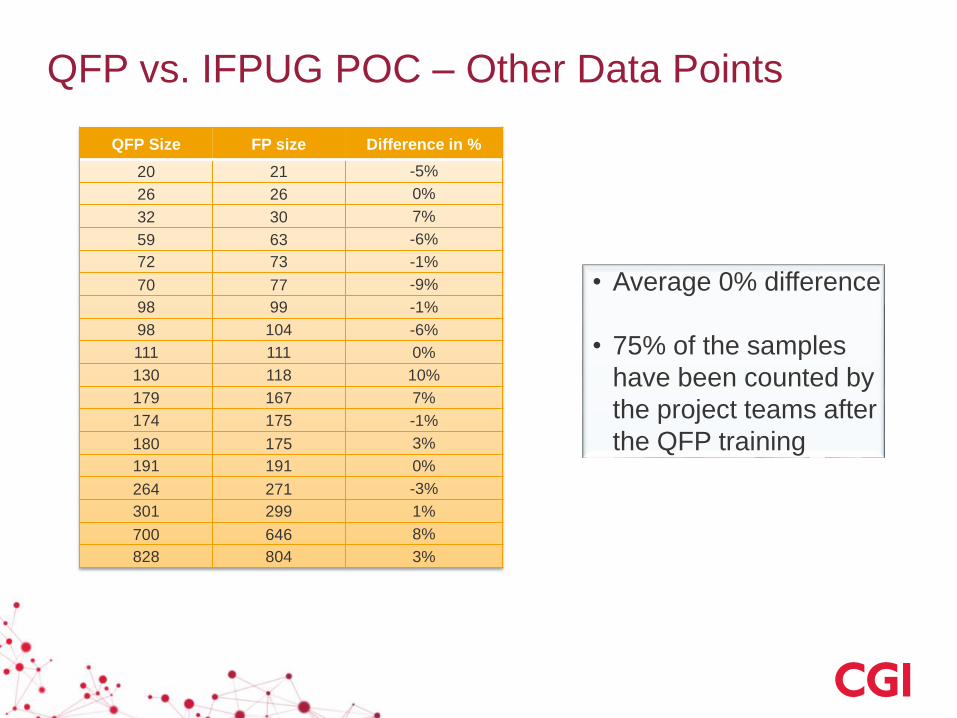
QFP vs. IFPUG POC – Other Data Points
• Average 0% difference
• 75% of the samples
have been counted by
the project teams after
the QFP training
QFP Size FP size Difference in %
20 21 -5%
26 26 0%
32 30 7%
59 63 -6%
72 73 -1%
70 77 -9%
98 99 -1%
98 104 -6%
111 111 0%
130 118 10%
179 167 7%
174 175 -1%
180 175 3%
191 191 0%
264 271 -3%
301 299 1%
700 646 8%
828 804 3%
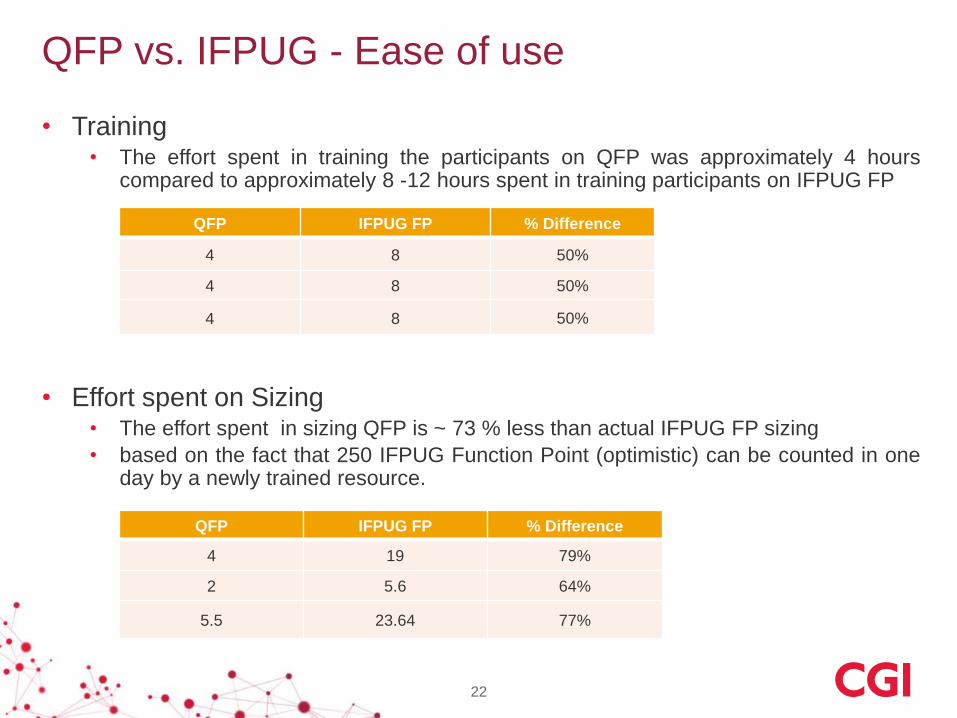
QFP vs. IFPUG - Ease of use
22
• Training• The effort spent in training the participants on QFP was approximately 4 hours
compared to approximately 8 -12 hours spent in training participants on IFPUG FP
• Effort spent on Sizing• The effort spent in sizing QFP is ~ 73 % less than actual IFPUG FP sizing
• based on the fact that 250 IFPUG Function Point (optimistic) can be counted in oneday by a newly trained resource.
QFP IFPUG FP % Difference
4 8 50%
4 8 50%
4 8 50%
QFP IFPUG FP % Difference
4 19 79%
2 5.6 64%
5.5 23.64 77%

23
Conclusion
• QFP is a functional sizing method and tool that has potential to be
broadbased across organization unlike detailed (ISO standardized)
sizing methods
• Its ability to provide platform specific proxies makes it popular within
the architect and project communities as they relate their solution very
well with proxies
• It has helped project teams convince the customer on effort, cost and
productivity
• QFP has been a success story when implemented. It has been
implemented in 3 large organization having more than 1,50,000
employees including CGI
24
So…
• Are ISO Standardized methods not required anymore?
Definitely required !
For a method like QFP to be based on and relate with.
• Do you still need certified people?
Yes!
Only Certified people can validate the method and in many cases
(contracts) formal methods are required.
25
Next Steps – Calibration Results
Calibration is a concept of refining the complexity of proxies so that
computed size moves
• Closer to project size
• Closer to IFPUG FP size
Data points collection to prove the calibration results in
progress……………..
Thank You
For more details on QFP, please mail me at [email protected]
https://in.linkedin.com/in/thakurbhawna
Questions?