Embed Size (px)
Citation preview

Environ. Chem. 2015, 12, 527-538 ©CSIRO 2015 ©CSIRO 2014 doi:10.1071/EN15012_AC
Page 1 of 34
Supplementary material
Questions of size and numbers in environmental research on microplastics: methodological and conceptual aspects
Montserrat FilellaA,B
AInstitute F.-A. Forel, University of Geneva, Route de Suisse 10, CH-1290 Versoix, Switzerland.
Email: [email protected]
BSCHEMA, Rue Principale 92, L-6990 Rameldange, Luxembourg.
Environ. Chem. 2015 ©CSIRO 2015 doi:10.1071/EN15012_AC
Page 2 of 34
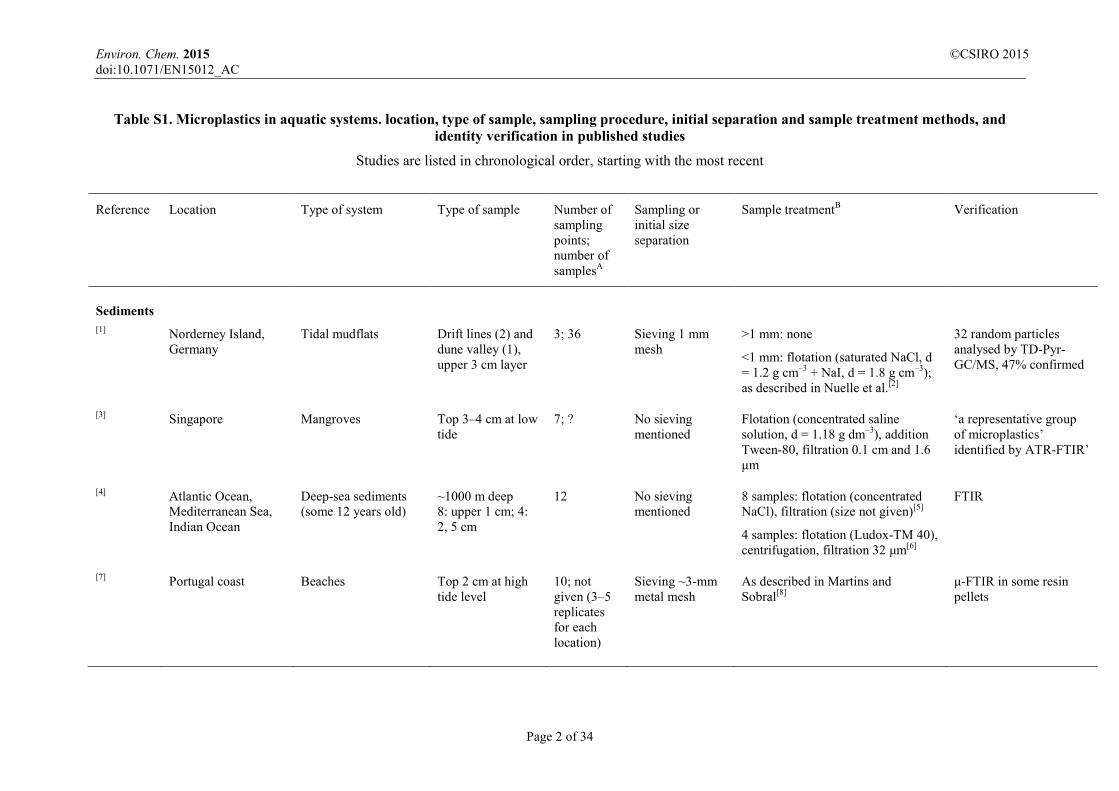
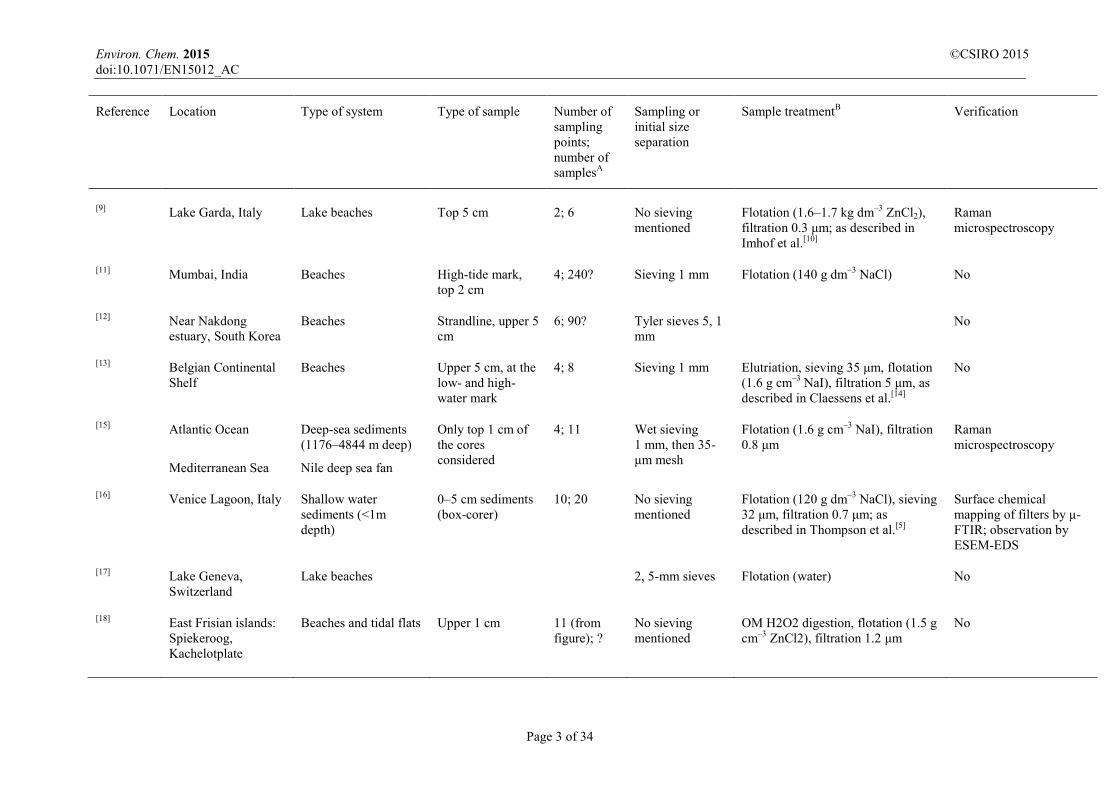
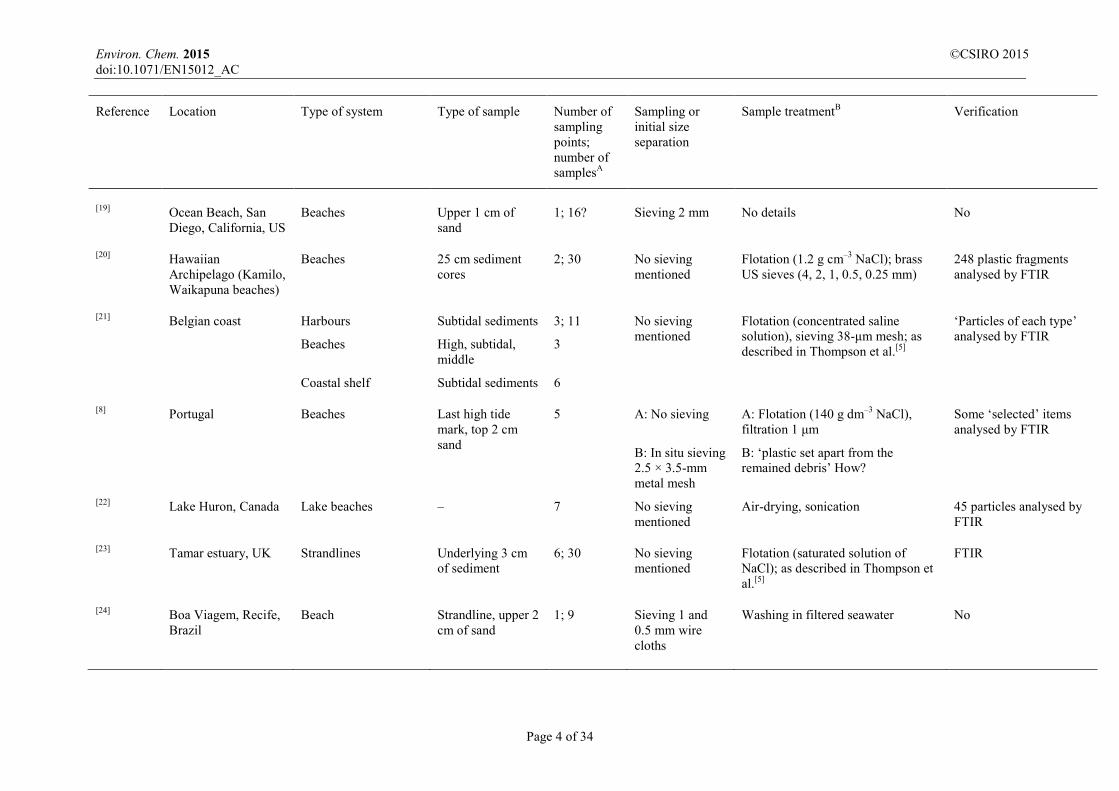
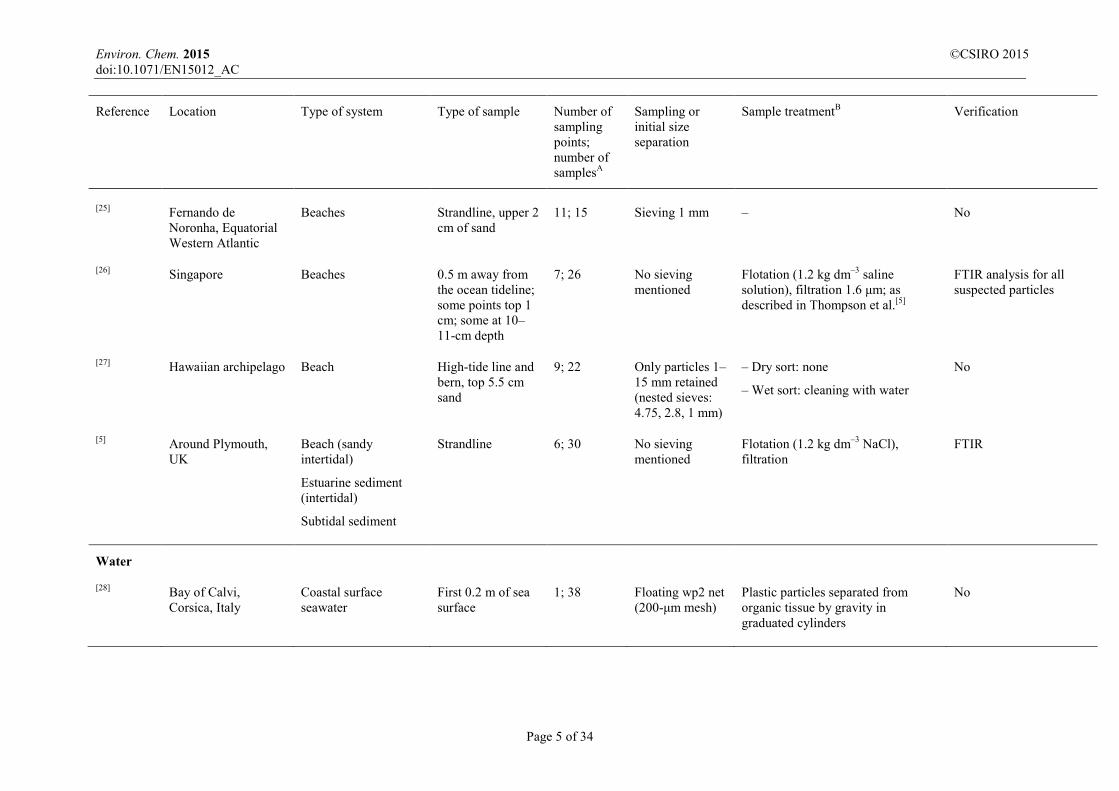
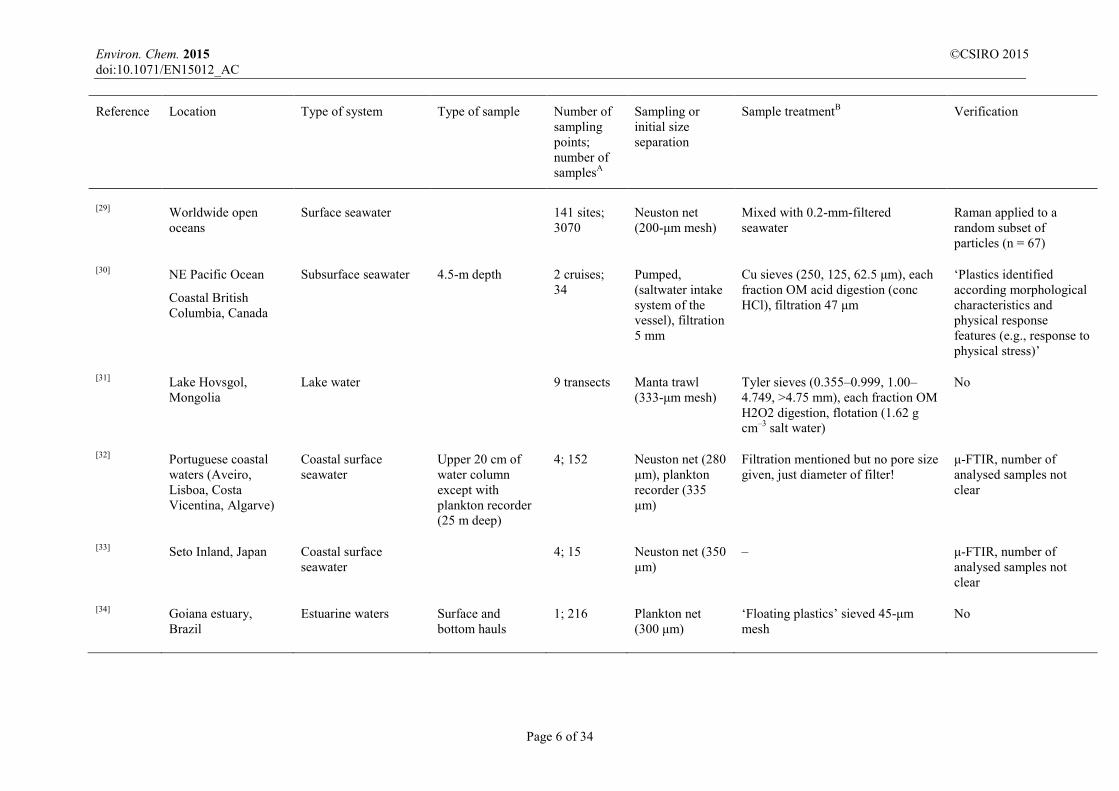
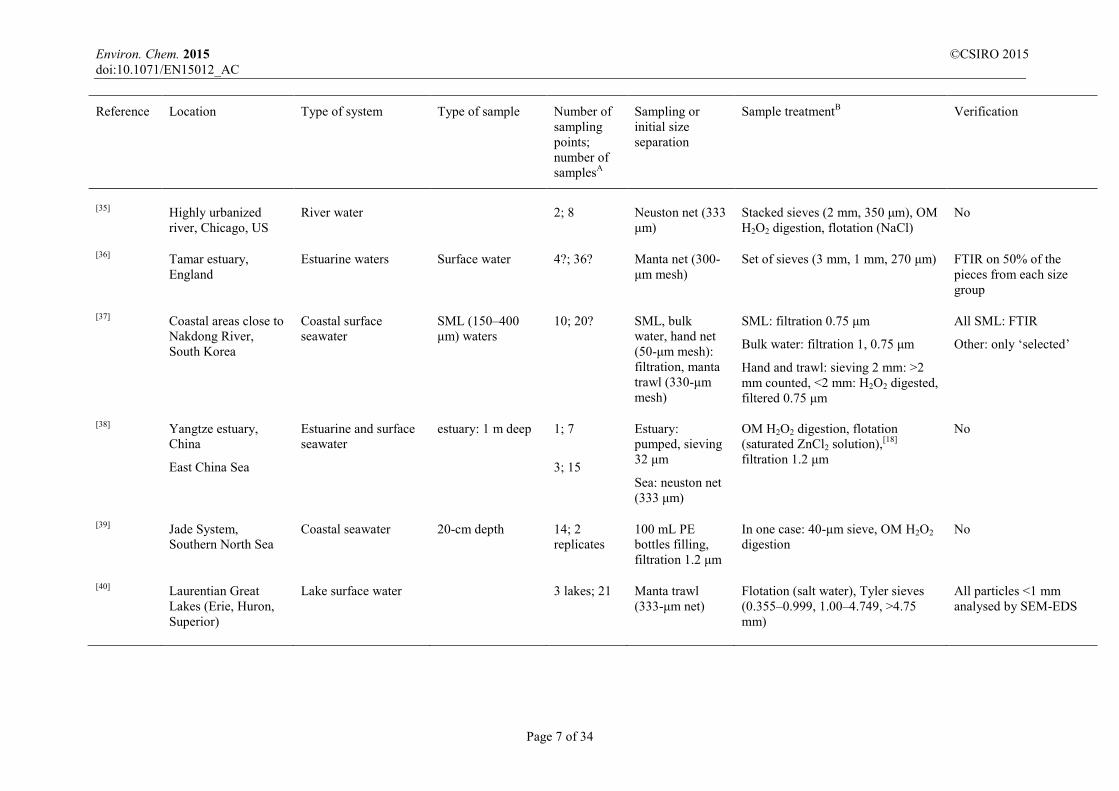
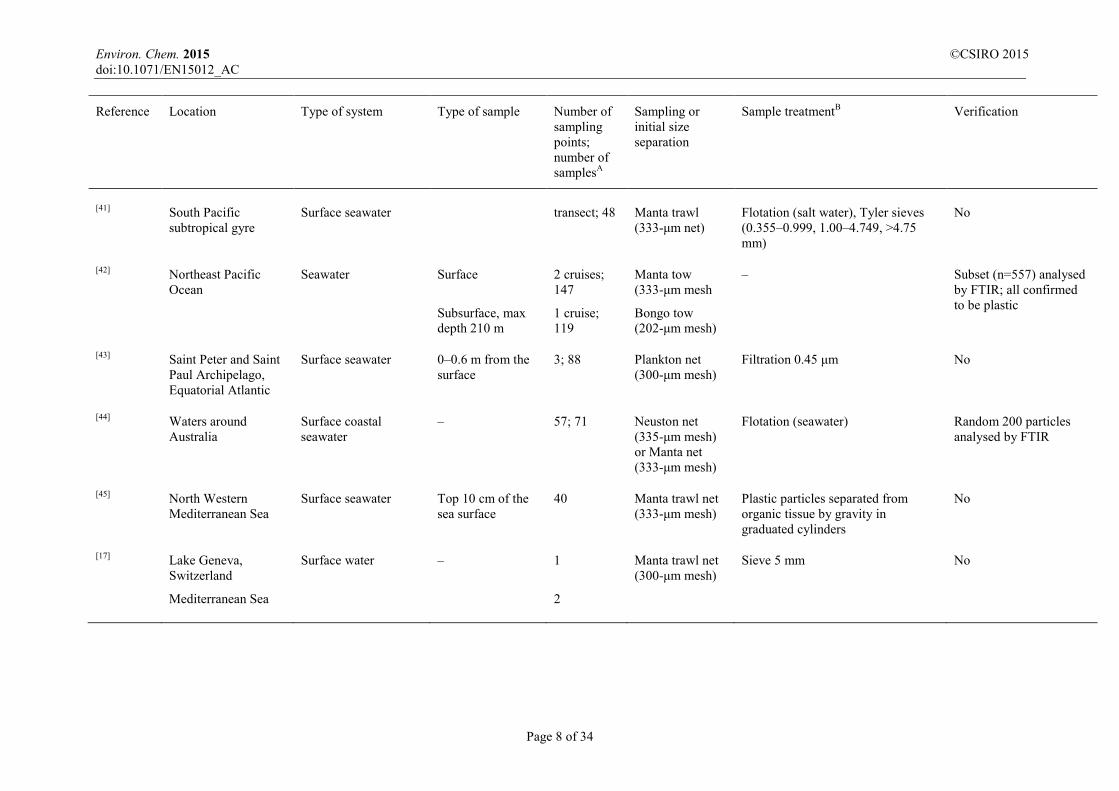
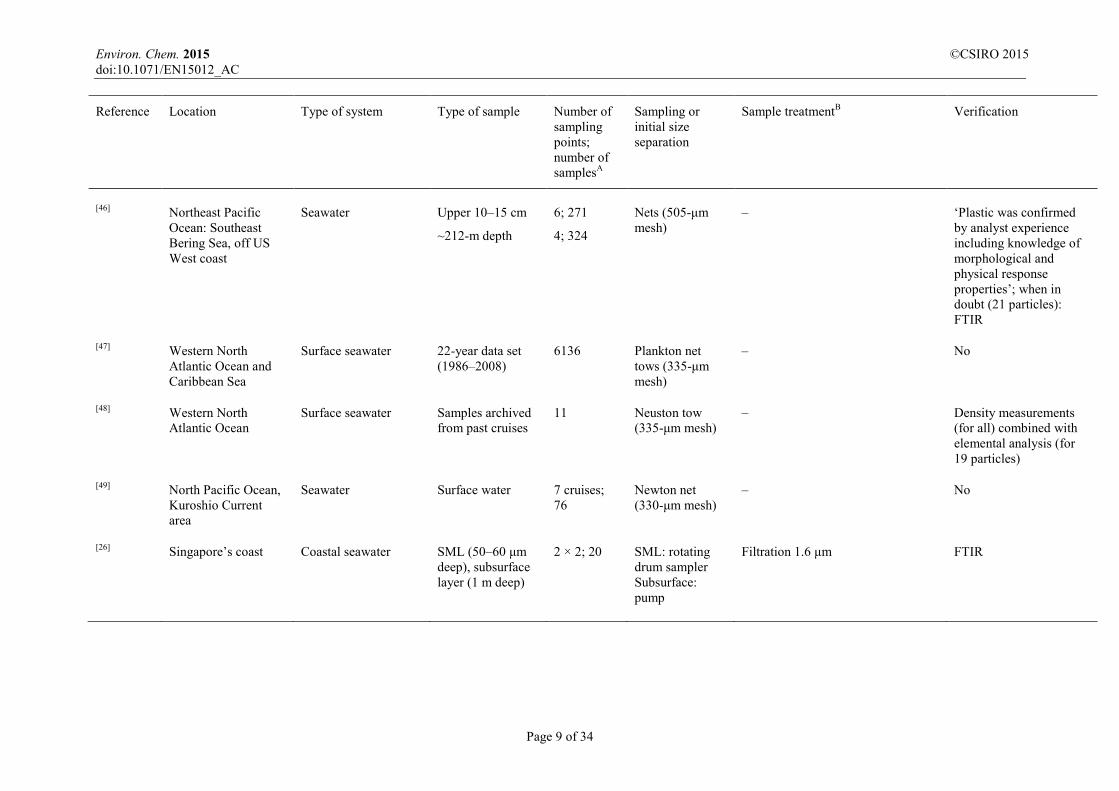
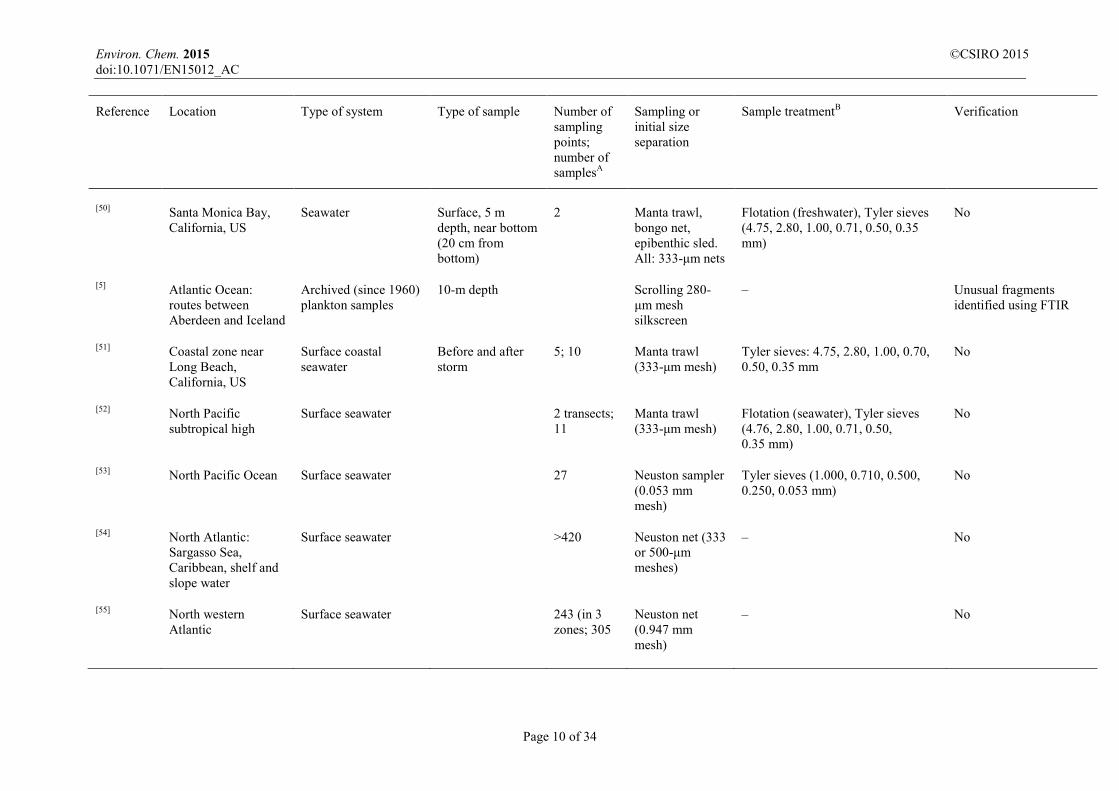
Table S1. Microplastics in aquatic systems. location, type of sample, sampling procedure, initial separation and sample treatment methods, and
identity verification in published studies
Studies are listed in chronological order, starting with the most recent
Reference Location Type of system Type of sample Number of sampling points; number of samplesA
Sampling or initial size separation
Sample treatmentB Verification
Sediments [1] Norderney Island,
Germany Tidal mudflats Drift lines (2) and
dune valley (1), upper 3 cm layer
3; 36 Sieving 1 mm mesh
>1 mm: none
<1 mm: flotation (saturated NaCl, d = 1.2 g cm–3 + NaI, d = 1.8 g cm–3); as described in Nuelle et al.[2]
32 random particles analysed by TD-Pyr-GC/MS, 47% confirmed
[3] Singapore Mangroves Top 3–4 cm at low tide
7; ? No sieving mentioned
Flotation (concentrated saline solution, d = 1.18 g dm–3), addition Tween-80, filtration 0.1 cm and 1.6 μm
‘a representative group of microplastics’ identified by ATR-FTIR’
[4] Atlantic Ocean, Mediterranean Sea, Indian Ocean
Deep-sea sediments (some 12 years old)
~1000 m deep 8: upper 1 cm; 4: 2, 5 cm
12 No sieving mentioned
8 samples: flotation (concentrated NaCl), filtration (size not given)[5]
4 samples: flotation (Ludox-TM 40), centrifugation, filtration 32 μm[6]
FTIR
[7] Portugal coast Beaches Top 2 cm at high tide level
10; not given (3–5 replicates for each location)
Sieving ~3-mm metal mesh
As described in Martins and Sobral[8]
μ-FTIR in some resin pellets
Environ. Chem. 2015 ©CSIRO 2015 doi:10.1071/EN15012_AC
Page 3 of 34
Reference Location Type of system Type of sample Number of sampling points; number of samplesA
Sampling or initial size separation
Sample treatmentB Verification
[9] Lake Garda, Italy Lake beaches Top 5 cm 2; 6 No sieving mentioned
Flotation (1.6–1.7 kg dm–3 ZnCl2), filtration 0.3 μm; as described in Imhof et al.[10]
Raman microspectroscopy
[11] Mumbai, India Beaches High-tide mark, top 2 cm
4; 240? Sieving 1 mm Flotation (140 g dm–3 NaCl) No
[12] Near Nakdong estuary, South Korea
Beaches Strandline, upper 5 cm
6; 90? Tyler sieves 5, 1 mm
No
[13] Belgian Continental Shelf
Beaches Upper 5 cm, at the low- and high-water mark
4; 8 Sieving 1 mm Elutriation, sieving 35 μm, flotation (1.6 g cm–3 NaI), filtration 5 μm, as described in Claessens et al.[14]
No
[15] Atlantic Ocean
Mediterranean Sea
Deep-sea sediments (1176–4844 m deep)
Nile deep sea fan
Only top 1 cm of the cores considered
4; 11 Wet sieving 1 mm, then 35-μm mesh
Flotation (1.6 g cm–3 NaI), filtration 0.8 μm
Raman microspectroscopy
[16] Venice Lagoon, Italy Shallow water sediments (<1m depth)
0–5 cm sediments (box-corer)
10; 20 No sieving mentioned
Flotation (120 g dm–3 NaCl), sieving 32 μm, filtration 0.7 μm; as described in Thompson et al.[5]
Surface chemical mapping of filters by μ-FTIR; observation by ESEM-EDS
[17] Lake Geneva, Switzerland
Lake beaches 2, 5-mm sieves Flotation (water) No
[18] East Frisian islands: Spiekeroog, Kachelotplate
Beaches and tidal flats Upper 1 cm 11 (from figure); ?
No sieving mentioned
OM H2O2 digestion, flotation (1.5 g cm–3 ZnCl2), filtration 1.2 μm
No
Environ. Chem. 2015 ©CSIRO 2015 doi:10.1071/EN15012_AC
Page 4 of 34
Reference Location Type of system Type of sample Number of sampling points; number of samplesA
Sampling or initial size separation
Sample treatmentB Verification
[19] Ocean Beach, San Diego, California, US
Beaches Upper 1 cm of sand
1; 16? Sieving 2 mm No details No
[20] Hawaiian Archipelago (Kamilo, Waikapuna beaches)
Beaches 25 cm sediment cores
2; 30 No sieving mentioned
Flotation (1.2 g cm–3 NaCl); brass US sieves (4, 2, 1, 0.5, 0.25 mm)
248 plastic fragments analysed by FTIR
[21] Belgian coast Harbours
Beaches
Coastal shelf
Subtidal sediments
High, subtidal, middle
Subtidal sediments
3; 11
3
6
No sieving mentioned
Flotation (concentrated saline solution), sieving 38-μm mesh; as described in Thompson et al.[5]
‘Particles of each type’ analysed by FTIR
[8] Portugal Beaches Last high tide mark, top 2 cm sand
5 A: No sieving
B: In situ sieving 2.5 × 3.5-mm metal mesh
A: Flotation (140 g dm–3 NaCl), filtration 1 μm
B: ‘plastic set apart from the remained debris’ How?
Some ‘selected’ items analysed by FTIR
[22] Lake Huron, Canada Lake beaches – 7 No sieving mentioned
Air-drying, sonication 45 particles analysed by FTIR
[23] Tamar estuary, UK Strandlines Underlying 3 cm of sediment
6; 30 No sieving mentioned
Flotation (saturated solution of NaCl); as described in Thompson et al.[5]
FTIR
[24] Boa Viagem, Recife, Brazil
Beach Strandline, upper 2 cm of sand
1; 9 Sieving 1 and 0.5 mm wire cloths
Washing in filtered seawater No
Environ. Chem. 2015 ©CSIRO 2015 doi:10.1071/EN15012_AC
Page 5 of 34
Reference Location Type of system Type of sample Number of sampling points; number of samplesA
Sampling or initial size separation
Sample treatmentB Verification
[25] Fernando de Noronha, Equatorial Western Atlantic
Beaches Strandline, upper 2 cm of sand
11; 15 Sieving 1 mm – No
[26] Singapore Beaches 0.5 m away from the ocean tideline; some points top 1 cm; some at 10–11-cm depth
7; 26 No sieving mentioned
Flotation (1.2 kg dm–3 saline solution), filtration 1.6 μm; as described in Thompson et al.[5]
FTIR analysis for all suspected particles
[27] Hawaiian archipelago Beach High-tide line and bern, top 5.5 cm sand
9; 22 Only particles 1–15 mm retained (nested sieves: 4.75, 2.8, 1 mm)
– Dry sort: none
– Wet sort: cleaning with water
No
[5] Around Plymouth, UK
Beach (sandy intertidal)
Estuarine sediment (intertidal)
Subtidal sediment
Strandline 6; 30 No sieving mentioned
Flotation (1.2 kg dm–3 NaCl), filtration
FTIR
Water
[28] Bay of Calvi, Corsica, Italy
Coastal surface seawater
First 0.2 m of sea surface
1; 38 Floating wp2 net (200-μm mesh)
Plastic particles separated from organic tissue by gravity in graduated cylinders
No
Environ. Chem. 2015 ©CSIRO 2015 doi:10.1071/EN15012_AC
Page 6 of 34
Reference Location Type of system Type of sample Number of sampling points; number of samplesA
Sampling or initial size separation
Sample treatmentB Verification
[29] Worldwide open oceans
Surface seawater 141 sites; 3070
Neuston net (200-μm mesh)
Mixed with 0.2-mm-filtered seawater
Raman applied to a random subset of particles (n = 67)
[30] NE Pacific Ocean
Coastal British Columbia, Canada
Subsurface seawater 4.5-m depth 2 cruises; 34
Pumped, (saltwater intake system of the vessel), filtration 5 mm
Cu sieves (250, 125, 62.5 μm), each fraction OM acid digestion (conc HCl), filtration 47 μm
‘Plastics identified according morphological characteristics and physical response features (e.g., response to physical stress)’
[31] Lake Hovsgol, Mongolia
Lake water 9 transects Manta trawl (333-μm mesh)
Tyler sieves (0.355–0.999, 1.00–4.749, >4.75 mm), each fraction OM H2O2 digestion, flotation (1.62 g cm–3 salt water)
No
[32] Portuguese coastal waters (Aveiro, Lisboa, Costa Vicentina, Algarve)
Coastal surface seawater
Upper 20 cm of water column except with plankton recorder (25 m deep)
4; 152 Neuston net (280 μm), plankton recorder (335 μm)
Filtration mentioned but no pore size given, just diameter of filter!
μ-FTIR, number of analysed samples not clear
[33] Seto Inland, Japan Coastal surface seawater
4; 15 Neuston net (350 μm)
– μ-FTIR, number of analysed samples not clear
[34] Goiana estuary, Brazil
Estuarine waters Surface and bottom hauls
1; 216 Plankton net (300 μm)
‘Floating plastics’ sieved 45-μm mesh
No
Environ. Chem. 2015 ©CSIRO 2015 doi:10.1071/EN15012_AC
Page 7 of 34
Reference Location Type of system Type of sample Number of sampling points; number of samplesA
Sampling or initial size separation
Sample treatmentB Verification
[35] Highly urbanized river, Chicago, US
River water 2; 8 Neuston net (333 μm)
Stacked sieves (2 mm, 350 μm), OM H2O2 digestion, flotation (NaCl)
No
[36] Tamar estuary, England
Estuarine waters Surface water 4?; 36? Manta net (300-μm mesh)
Set of sieves (3 mm, 1 mm, 270 μm) FTIR on 50% of the pieces from each size group
[37] Coastal areas close to Nakdong River, South Korea
Coastal surface seawater
SML (150–400 μm) waters
10; 20? SML, bulk water, hand net (50-μm mesh): filtration, manta trawl (330-μm mesh)
SML: filtration 0.75 μm
Bulk water: filtration 1, 0.75 μm
Hand and trawl: sieving 2 mm: >2 mm counted, <2 mm: H2O2 digested, filtered 0.75 μm
All SML: FTIR
Other: only ‘selected’
[38] Yangtze estuary, China
East China Sea
Estuarine and surface seawater
estuary: 1 m deep 1; 7
3; 15
Estuary: pumped, sieving 32 μm
Sea: neuston net (333 μm)
OM H2O2 digestion, flotation (saturated ZnCl2 solution),[18] filtration 1.2 μm
No
[39] Jade System, Southern North Sea
Coastal seawater 20-cm depth 14; 2 replicates
100 mL PE bottles filling, filtration 1.2 μm
In one case: 40-μm sieve, OM H2O2 digestion
No
[40] Laurentian Great Lakes (Erie, Huron, Superior)
Lake surface water 3 lakes; 21 Manta trawl (333-μm net)
Flotation (salt water), Tyler sieves (0.355–0.999, 1.00–4.749, >4.75 mm)
All particles <1 mm analysed by SEM-EDS
Environ. Chem. 2015 ©CSIRO 2015 doi:10.1071/EN15012_AC
Page 8 of 34
Reference Location Type of system Type of sample Number of sampling points; number of samplesA
Sampling or initial size separation
Sample treatmentB Verification
[41] South Pacific subtropical gyre
Surface seawater transect; 48 Manta trawl (333-μm net)
Flotation (salt water), Tyler sieves (0.355–0.999, 1.00–4.749, >4.75 mm)
No
[42] Northeast Pacific Ocean
Seawater Surface
Subsurface, max depth 210 m
2 cruises; 147
1 cruise; 119
Manta tow (333-μm mesh
Bongo tow (202-μm mesh)
– Subset (n=557) analysed by FTIR; all confirmed to be plastic
[43] Saint Peter and Saint Paul Archipelago, Equatorial Atlantic
Surface seawater 0–0.6 m from the surface
3; 88 Plankton net (300-μm mesh)
Filtration 0.45 μm No
[44] Waters around Australia
Surface coastal seawater
– 57; 71 Neuston net (335-μm mesh) or Manta net (333-μm mesh)
Flotation (seawater) Random 200 particles analysed by FTIR
[45] North Western Mediterranean Sea
Surface seawater Top 10 cm of the sea surface
40 Manta trawl net (333-μm mesh)
Plastic particles separated from organic tissue by gravity in graduated cylinders
No
[17] Lake Geneva, Switzerland
Mediterranean Sea
Surface water – 1
2
Manta trawl net (300-μm mesh)
Sieve 5 mm No
Environ. Chem. 2015 ©CSIRO 2015 doi:10.1071/EN15012_AC
Page 9 of 34
Reference Location Type of system Type of sample Number of sampling points; number of samplesA
Sampling or initial size separation
Sample treatmentB Verification
[46] Northeast Pacific Ocean: Southeast Bering Sea, off US West coast
Seawater Upper 10–15 cm
~212-m depth
6; 271
4; 324
Nets (505-μm mesh)
– ‘Plastic was confirmed by analyst experience including knowledge of morphological and physical response properties’; when in doubt (21 particles): FTIR
[47] Western North Atlantic Ocean and Caribbean Sea
Surface seawater 22-year data set (1986–2008)
6136 Plankton net tows (335-μm mesh)
– No
[48] Western North Atlantic Ocean
Surface seawater Samples archived from past cruises
11 Neuston tow (335-μm mesh)
– Density measurements (for all) combined with elemental analysis (for 19 particles)
[49] North Pacific Ocean, Kuroshio Current area
Seawater Surface water 7 cruises; 76
Newton net (330-μm mesh)
– No
[26] Singapore’s coast Coastal seawater SML (50–60 μm deep), subsurface layer (1 m deep)
2 × 2; 20 SML: rotating drum sampler Subsurface: pump
Filtration 1.6 μm FTIR
Environ. Chem. 2015 ©CSIRO 2015 doi:10.1071/EN15012_AC
Page 10 of 34
Reference Location Type of system Type of sample Number of sampling points; number of samplesA
Sampling or initial size separation
Sample treatmentB Verification
[50] Santa Monica Bay, California, US
Seawater Surface, 5 m depth, near bottom (20 cm from bottom)
2 Manta trawl, bongo net, epibenthic sled. All: 333-μm nets
Flotation (freshwater), Tyler sieves (4.75, 2.80, 1.00, 0.71, 0.50, 0.35 mm)
No
[5] Atlantic Ocean: routes between Aberdeen and Iceland
Archived (since 1960) plankton samples
10-m depth Scrolling 280-μm mesh silkscreen
– Unusual fragments identified using FTIR
[51] Coastal zone near Long Beach, California, US
Surface coastal seawater
Before and after storm
5; 10 Manta trawl (333-μm mesh)
Tyler sieves: 4.75, 2.80, 1.00, 0.70, 0.50, 0.35 mm
No
[52] North Pacific subtropical high
Surface seawater 2 transects; 11
Manta trawl (333-μm mesh)
Flotation (seawater), Tyler sieves (4.76, 2.80, 1.00, 0.71, 0.50, 0.35 mm)
No
[53] North Pacific Ocean Surface seawater 27 Neuston sampler (0.053 mm mesh)
Tyler sieves (1.000, 0.710, 0.500, 0.250, 0.053 mm)
No
[54] North Atlantic: Sargasso Sea, Caribbean, shelf and slope water
Surface seawater >420 Neuston net (333 or 500-μm meshes)
– No
[55] North western Atlantic
Surface seawater 243 (in 3 zones; 305
Neuston net (0.947 mm mesh)
– No
Environ. Chem. 2015 ©CSIRO 2015 doi:10.1071/EN15012_AC
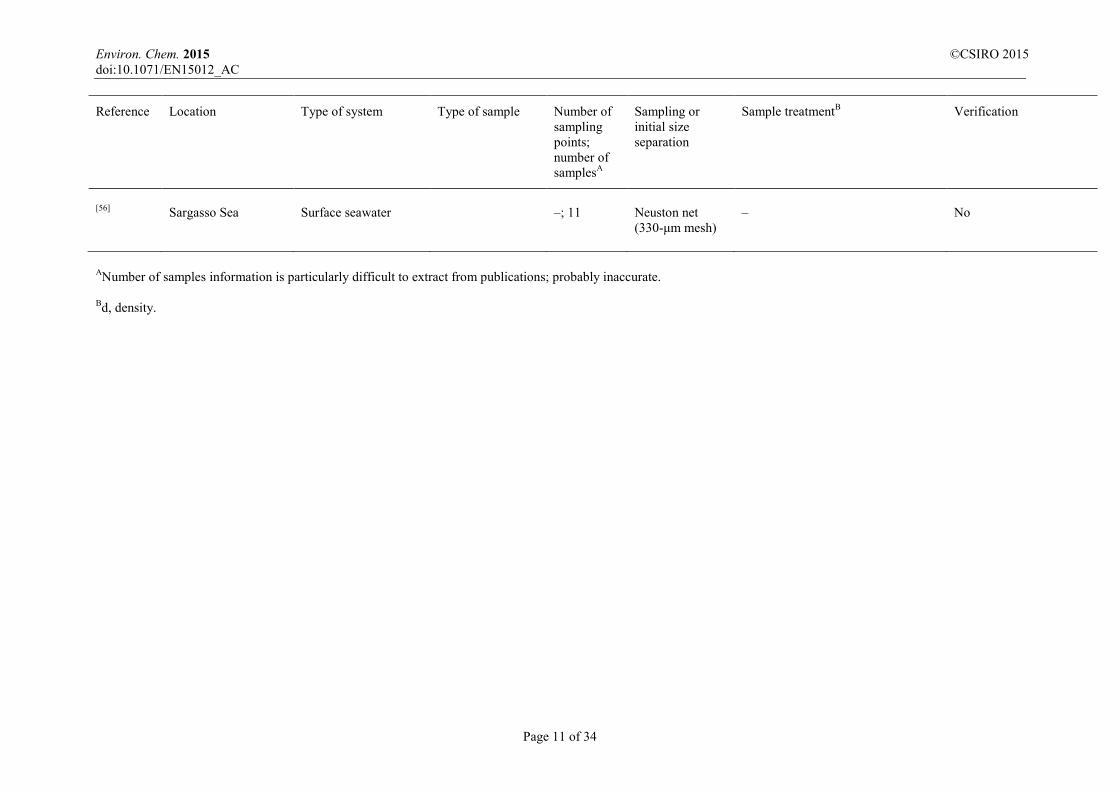
Page 11 of 34
Reference Location Type of system Type of sample Number of sampling points; number of samplesA
Sampling or initial size separation
Sample treatmentB Verification
[56] Sargasso Sea Surface seawater –; 11 Neuston net (330-μm mesh)
– No
ANumber of samples information is particularly difficult to extract from publications; probably inaccurate.
Bd, density.
Environ. Chem. 2015 ©CSIRO 2015 doi:10.1071/EN15012_AC
Page 12 of 34
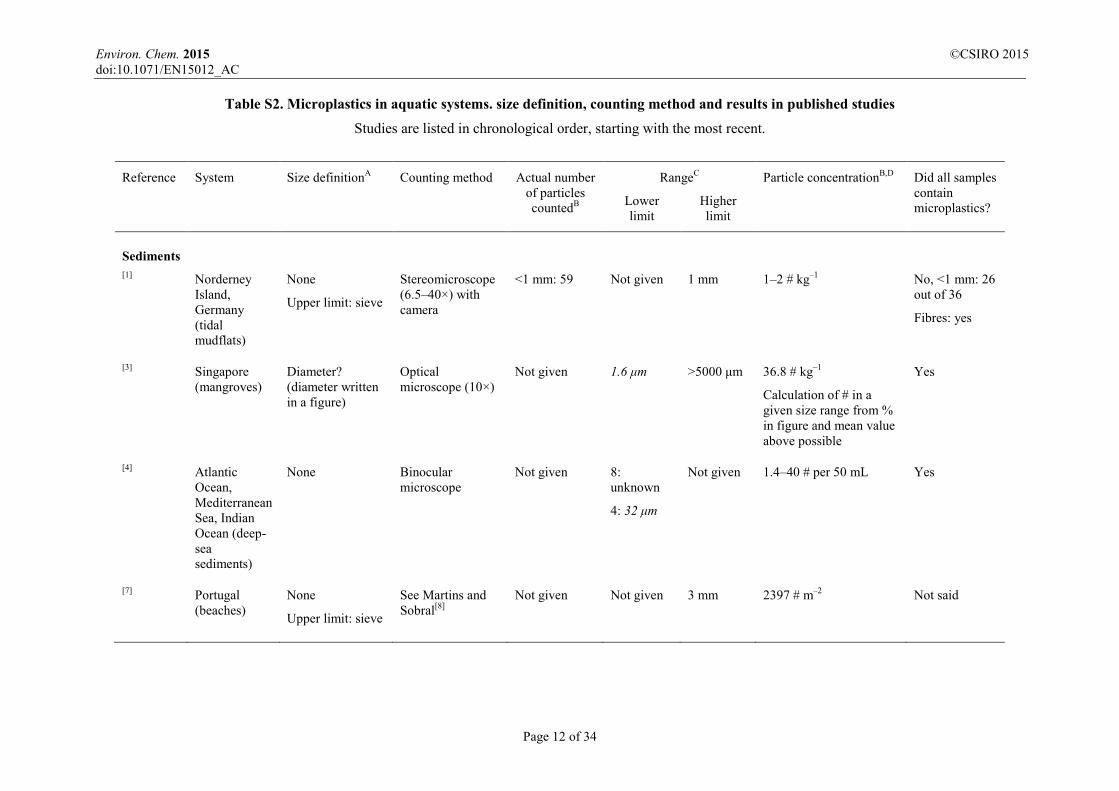
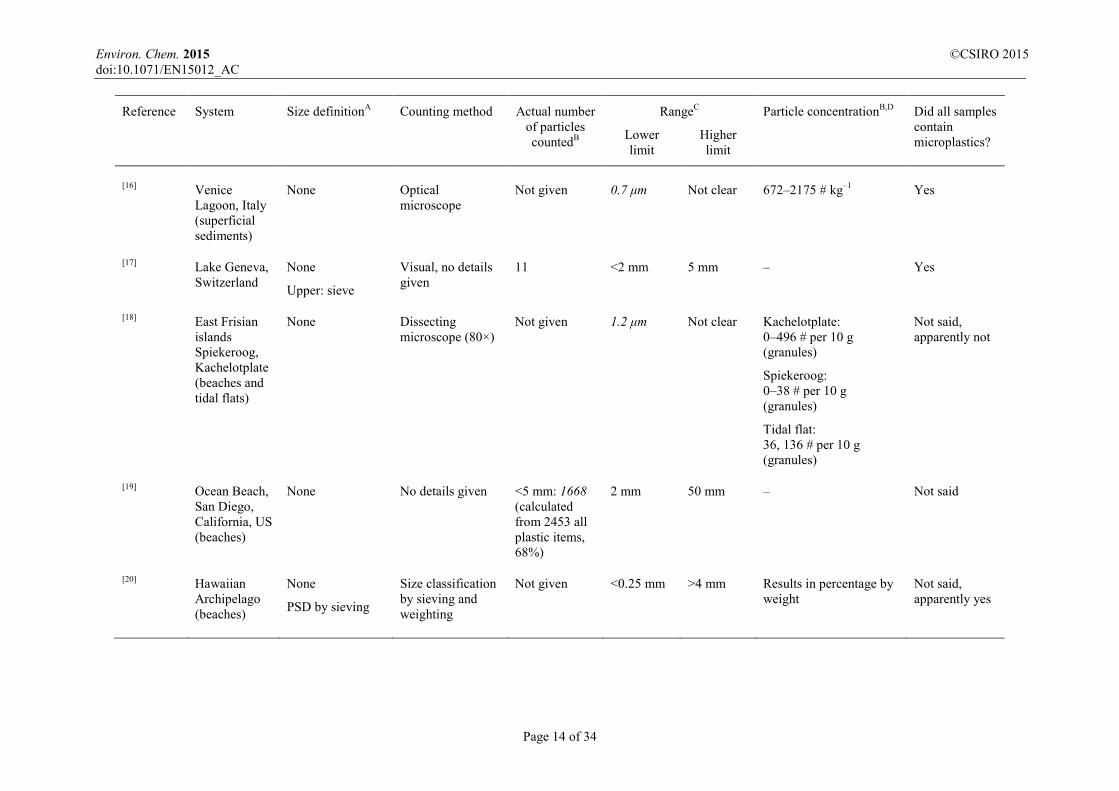
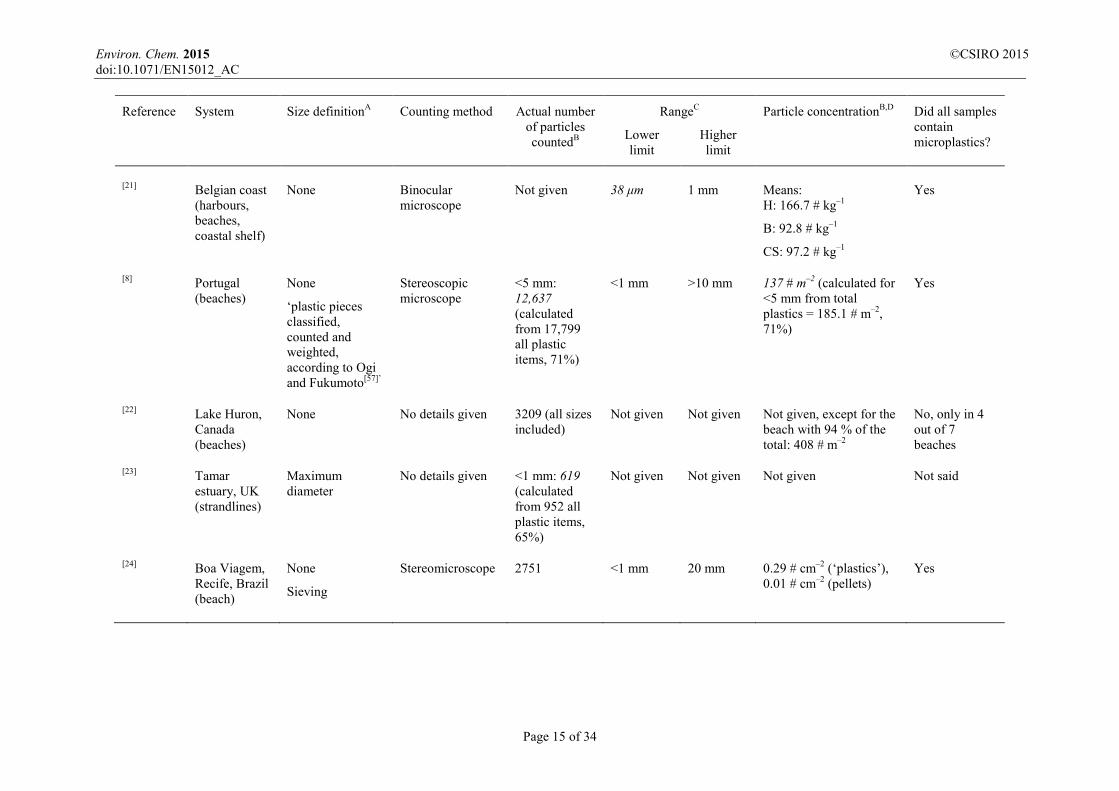
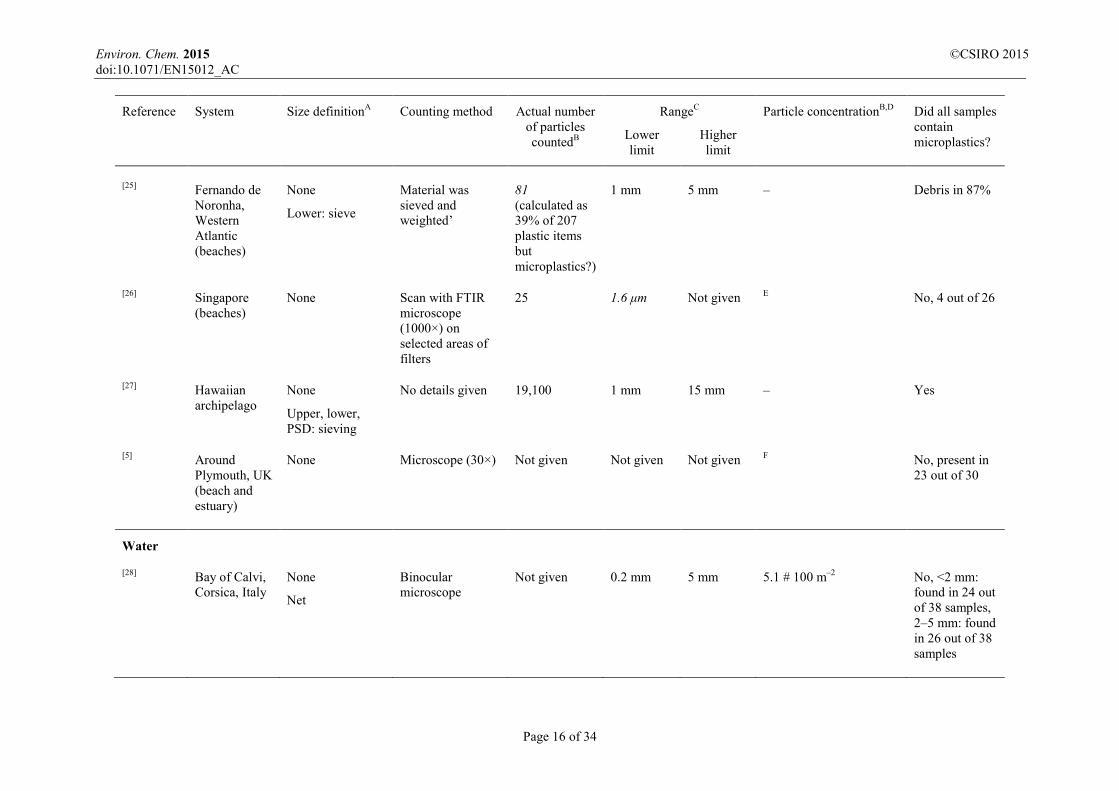
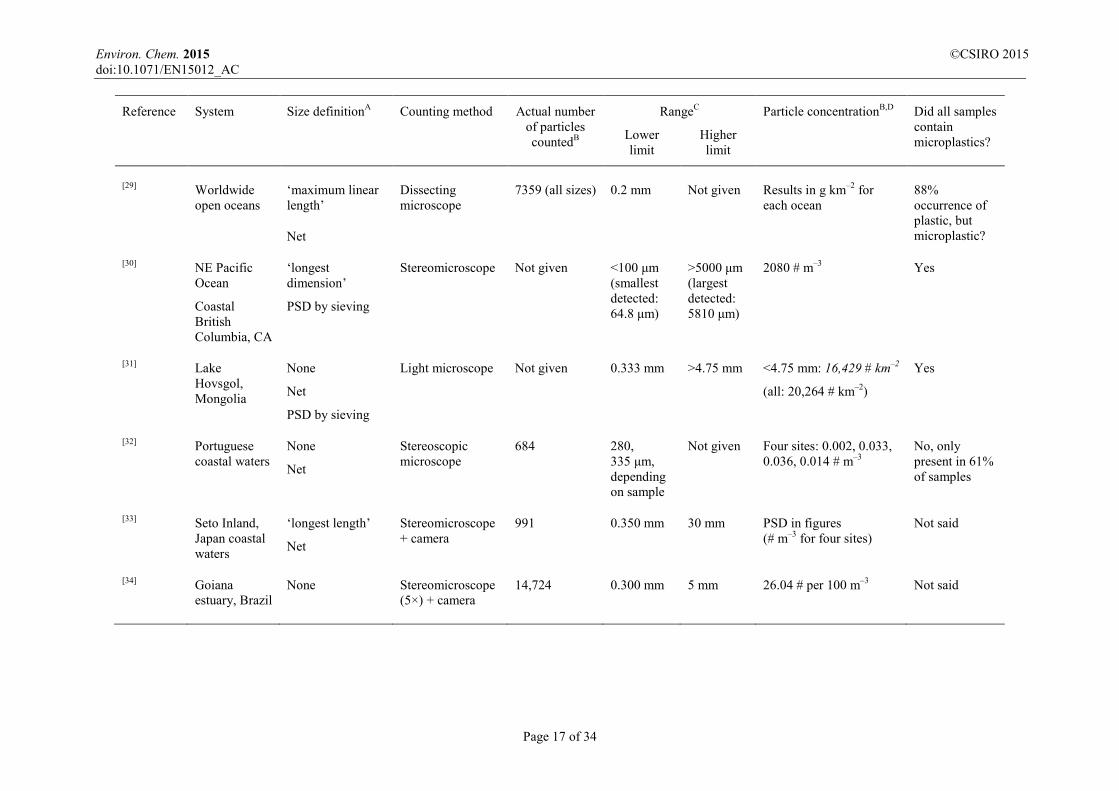
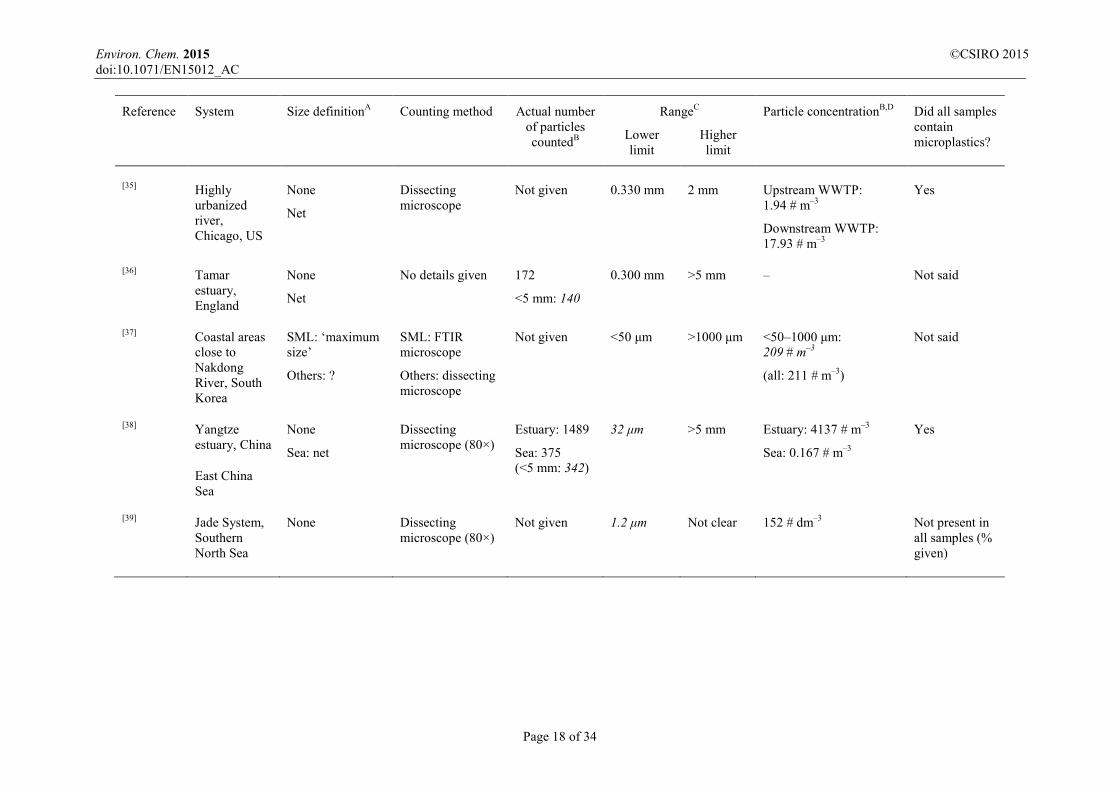
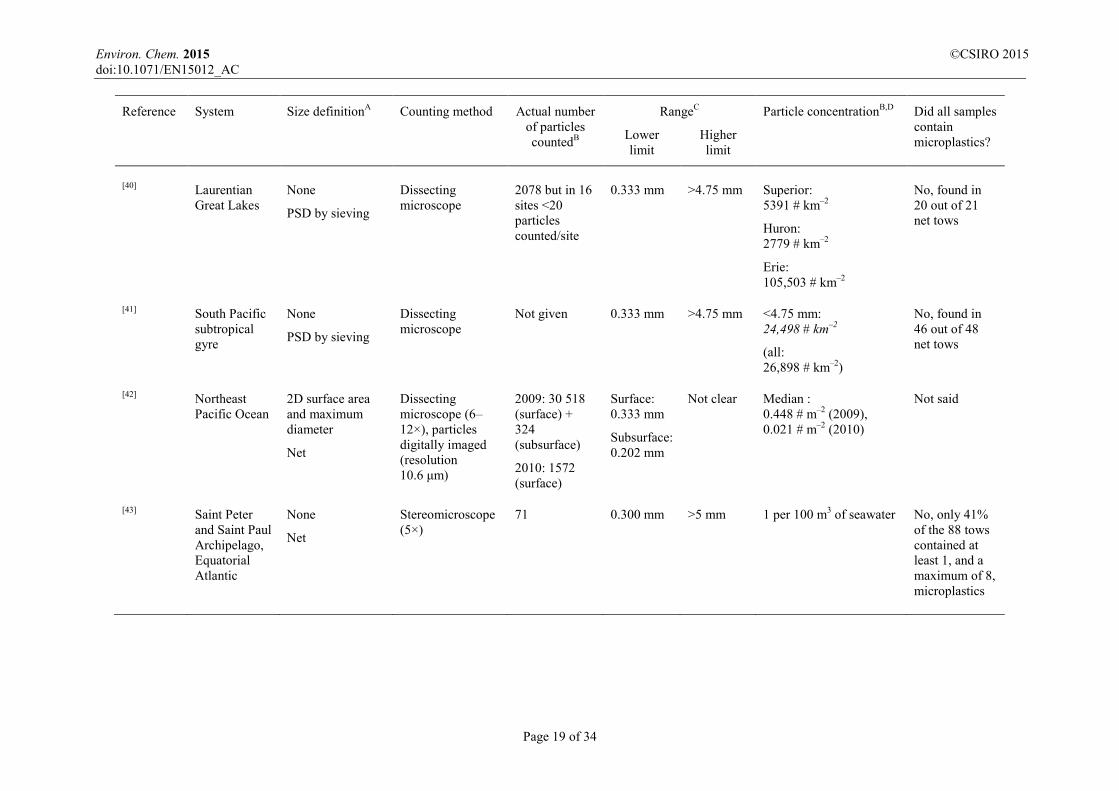
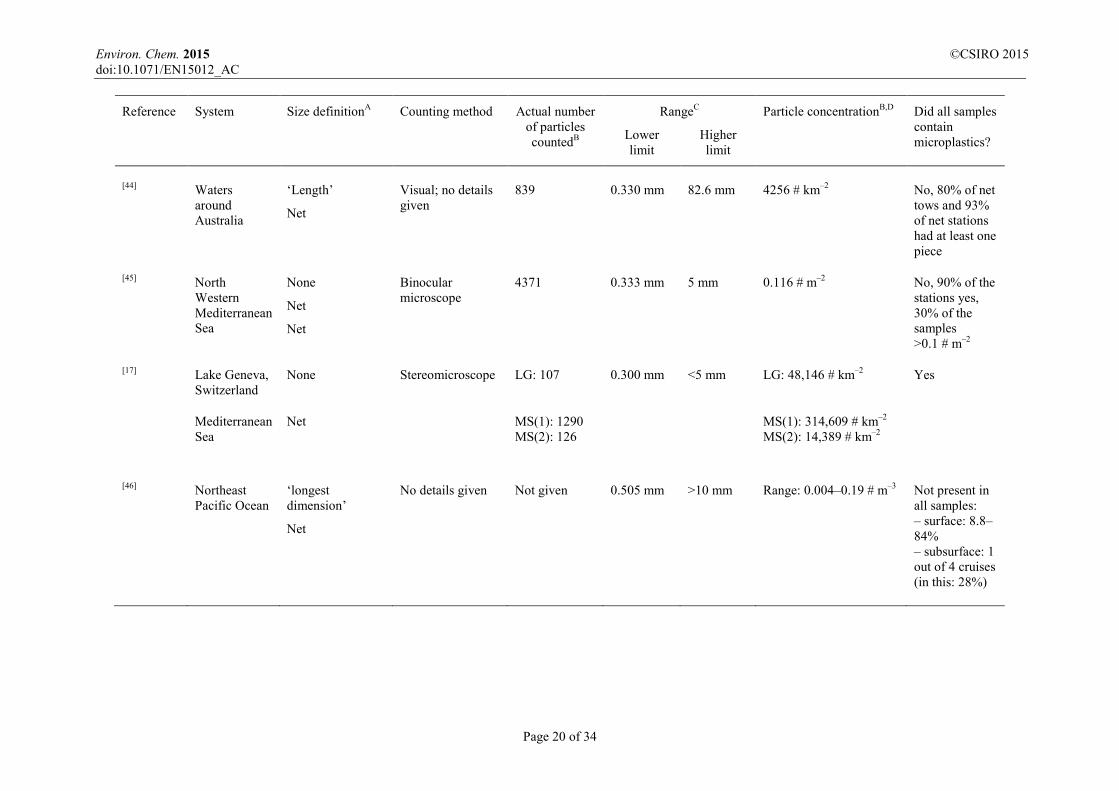
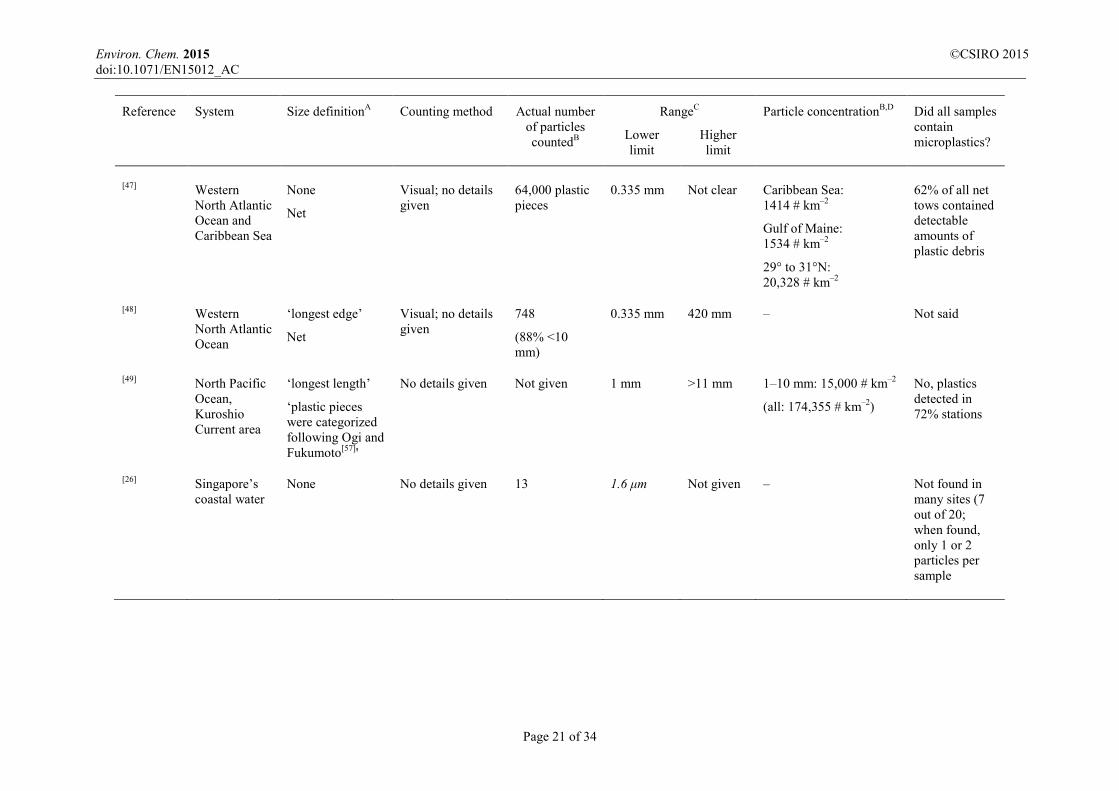
Table S2. Microplastics in aquatic systems. size definition, counting method and results in published studies
Studies are listed in chronological order, starting with the most recent.
Reference System Size definitionA Counting method Actual number of particles countedB
RangeC Particle concentrationB,D Did all samples contain microplastics? Lower
limit Higher limit
Sediments [1] Norderney
Island, Germany (tidal mudflats)
None
Upper limit: sieve
Stereomicroscope (6.5–40×) with camera
<1 mm: 59 Not given 1 mm 1–2 # kg–1 No, <1 mm: 26 out of 36
Fibres: yes
[3] Singapore (mangroves)
Diameter? (diameter written in a figure)
Optical microscope (10×)
Not given 1.6 μm >5000 μm 36.8 # kg–1
Calculation of # in a given size range from % in figure and mean value above possible
Yes
[4] Atlantic Ocean, Mediterranean Sea, Indian Ocean (deep-sea sediments)
None Binocular microscope
Not given 8: unknown
4: 32 μm
Not given 1.4–40 # per 50 mL Yes
[7] Portugal (beaches)
None
Upper limit: sieve
See Martins and Sobral[8]
Not given Not given 3 mm 2397 # m–2 Not said
Environ. Chem. 2015 ©CSIRO 2015 doi:10.1071/EN15012_AC
Page 13 of 34
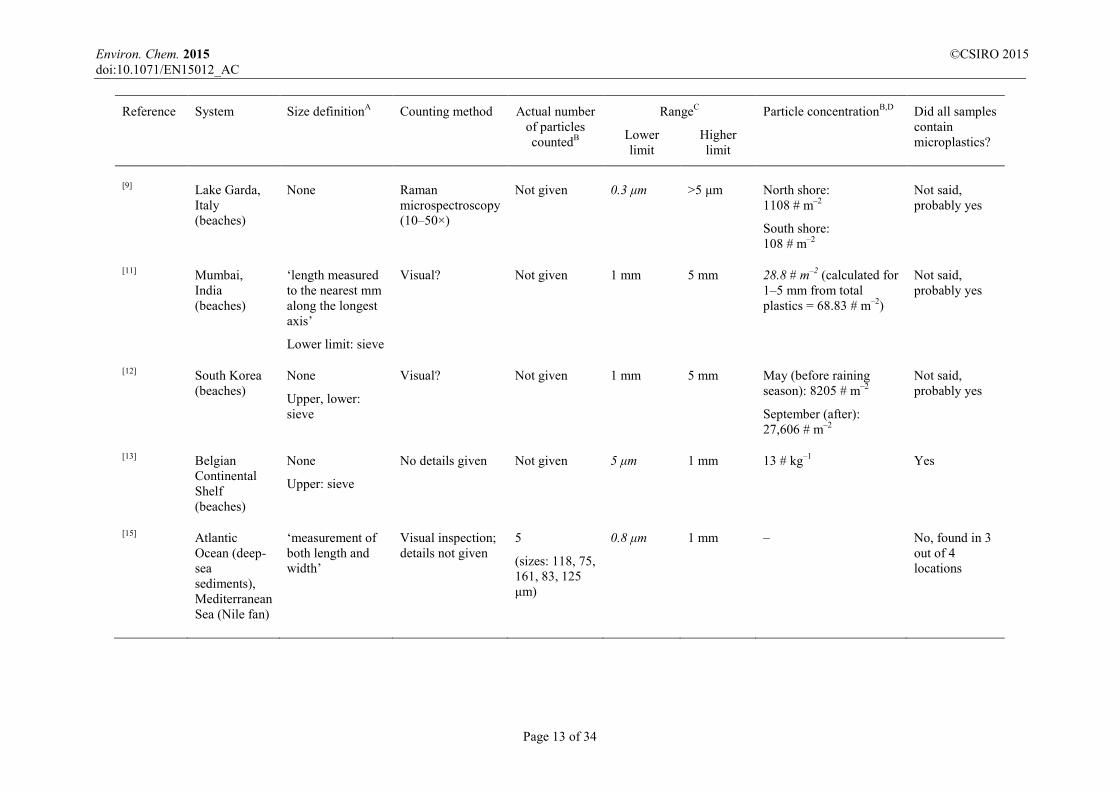
Reference System Size definitionA Counting method Actual number of particles countedB
RangeC Particle concentrationB,D Did all samples contain microplastics? Lower
limit Higher limit
[9] Lake Garda, Italy (beaches)
None Raman microspectroscopy (10–50×)
Not given 0.3 μm >5 μm North shore: 1108 # m–2
South shore: 108 # m–2
Not said, probably yes
[11] Mumbai, India (beaches)
‘length measured to the nearest mm along the longest axis’
Lower limit: sieve
Visual? Not given 1 mm 5 mm 28.8 # m–2 (calculated for 1–5 mm from total plastics = 68.83 # m–2)
Not said, probably yes
[12] South Korea (beaches)
None
Upper, lower: sieve
Visual? Not given 1 mm 5 mm May (before raining season): 8205 # m–2
September (after): 27,606 # m–2
Not said, probably yes
[13] Belgian Continental Shelf (beaches)
None
Upper: sieve
No details given Not given 5 μm 1 mm 13 # kg–1 Yes
[15] Atlantic Ocean (deep-sea sediments), Mediterranean Sea (Nile fan)
‘measurement of both length and width’
Visual inspection; details not given
5
(sizes: 118, 75, 161, 83, 125 μm)
0.8 μm 1 mm – No, found in 3 out of 4 locations
Environ. Chem. 2015 ©CSIRO 2015 doi:10.1071/EN15012_AC
Page 14 of 34
Reference System Size definitionA Counting method Actual number of particles countedB
RangeC Particle concentrationB,D Did all samples contain microplastics? Lower
limit Higher limit
[16] Venice Lagoon, Italy (superficial sediments)
None Optical microscope
Not given 0.7 μm Not clear 672–2175 # kg–1 Yes
[17] Lake Geneva, Switzerland
None
Upper: sieve
Visual, no details given
11 <2 mm 5 mm – Yes
[18] East Frisian islands Spiekeroog, Kachelotplate (beaches and tidal flats)
None Dissecting microscope (80×)
Not given 1.2 μm Not clear Kachelotplate: 0–496 # per 10 g
(granules)
Spiekeroog: 0–38 # per 10 g
(granules)
Tidal flat: 36, 136 # per 10 g (granules)
Not said, apparently not
[19] Ocean Beach, San Diego, California, US (beaches)
None No details given <5 mm: 1668 (calculated from 2453 all plastic items, 68%)
2 mm 50 mm – Not said
[20] Hawaiian Archipelago (beaches)
None
PSD by sieving
Size classification by sieving and weighting
Not given <0.25 mm >4 mm Results in percentage by weight
Not said, apparently yes
Environ. Chem. 2015 ©CSIRO 2015 doi:10.1071/EN15012_AC
Page 15 of 34
Reference System Size definitionA Counting method Actual number of particles countedB
RangeC Particle concentrationB,D Did all samples contain microplastics? Lower
limit Higher limit
[21] Belgian coast (harbours, beaches, coastal shelf)
None Binocular microscope
Not given 38 μm 1 mm Means: H: 166.7 # kg–1
B: 92.8 # kg–1
CS: 97.2 # kg–1
Yes
[8] Portugal (beaches)
None
‘plastic pieces classified, counted and weighted, according to Ogi and Fukumoto[57]’
Stereoscopic microscope
<5 mm: 12,637 (calculated from 17,799 all plastic items, 71%)
<1 mm >10 mm 137 # m–2 (calculated for <5 mm from total plastics = 185.1 # m–2, 71%)
Yes
[22] Lake Huron, Canada (beaches)
None No details given 3209 (all sizes included)
Not given Not given Not given, except for the beach with 94 % of the total: 408 # m–2
No, only in 4 out of 7 beaches
[23] Tamar estuary, UK (strandlines)
Maximum diameter
No details given <1 mm: 619 (calculated from 952 all plastic items, 65%)
Not given Not given Not given Not said
[24] Boa Viagem, Recife, Brazil (beach)
None
Sieving
Stereomicroscope 2751 <1 mm 20 mm 0.29 # cm–2 (‘plastics’), 0.01 # cm–2 (pellets)
Yes
Environ. Chem. 2015 ©CSIRO 2015 doi:10.1071/EN15012_AC
Page 16 of 34
Reference System Size definitionA Counting method Actual number of particles countedB
RangeC Particle concentrationB,D Did all samples contain microplastics? Lower
limit Higher limit
[25] Fernando de Noronha, Western Atlantic (beaches)
None
Lower: sieve
Material was sieved and weighted’
81 (calculated as 39% of 207 plastic items but microplastics?)
1 mm 5 mm – Debris in 87%
[26] Singapore (beaches)
None Scan with FTIR microscope (1000×) on selected areas of filters
25 1.6 μm Not given E No, 4 out of 26
[27] Hawaiian archipelago
None
Upper, lower, PSD: sieving
No details given 19,100 1 mm 15 mm – Yes
[5] Around Plymouth, UK (beach and estuary)
None Microscope (30×) Not given Not given Not given F No, present in 23 out of 30
Water
[28] Bay of Calvi, Corsica, Italy
None
Net
Binocular microscope
Not given 0.2 mm 5 mm 5.1 # 100 m–2 No, <2 mm: found in 24 out of 38 samples, 2–5 mm: found in 26 out of 38 samples
Environ. Chem. 2015 ©CSIRO 2015 doi:10.1071/EN15012_AC
Page 17 of 34
Reference System Size definitionA Counting method Actual number of particles countedB
RangeC Particle concentrationB,D Did all samples contain microplastics? Lower
limit Higher limit
[29] Worldwide open oceans
‘maximum linear length’
Net
Dissecting microscope
7359 (all sizes) 0.2 mm Not given Results in g km–2 for each ocean
88% occurrence of plastic, but microplastic?
[30] NE Pacific Ocean
Coastal British Columbia, CA
‘longest dimension’
PSD by sieving
Stereomicroscope Not given <100 μm (smallest detected: 64.8 μm)
>5000 μm (largest detected: 5810 μm)
2080 # m–3 Yes
[31] Lake Hovsgol, Mongolia
None
Net
PSD by sieving
Light microscope Not given 0.333 mm >4.75 mm <4.75 mm: 16,429 # km–2
(all: 20,264 # km–2)
Yes
[32] Portuguese coastal waters
None
Net
Stereoscopic microscope
684 280, 335 μm, depending on sample
Not given Four sites: 0.002, 0.033, 0.036, 0.014 # m–3
No, only present in 61% of samples
[33] Seto Inland, Japan coastal waters
‘longest length’
Net
Stereomicroscope + camera
991 0.350 mm 30 mm PSD in figures (# m–3 for four sites)
Not said
[34] Goiana estuary, Brazil
None Stereomicroscope (5×) + camera
14,724 0.300 mm 5 mm 26.04 # per 100 m–3 Not said
Environ. Chem. 2015 ©CSIRO 2015 doi:10.1071/EN15012_AC
Page 18 of 34
Reference System Size definitionA Counting method Actual number of particles countedB
RangeC Particle concentrationB,D Did all samples contain microplastics? Lower
limit Higher limit
[35] Highly urbanized river, Chicago, US
None
Net
Dissecting microscope
Not given 0.330 mm 2 mm Upstream WWTP: 1.94 # m–3
Downstream WWTP: 17.93 # m–3
Yes
[36] Tamar estuary, England
None
Net
No details given 172
<5 mm: 140
0.300 mm >5 mm – Not said
[37] Coastal areas close to Nakdong River, South Korea
SML: ‘maximum size’
Others: ?
SML: FTIR microscope
Others: dissecting microscope
Not given <50 μm >1000 μm <50–1000 μm: 209 # m–3
(all: 211 # m–3)
Not said
[38] Yangtze estuary, China
East China Sea
None
Sea: net
Dissecting microscope (80×)
Estuary: 1489
Sea: 375 (<5 mm: 342)
32 μm >5 mm Estuary: 4137 # m–3
Sea: 0.167 # m–3
Yes
[39] Jade System, Southern North Sea
None Dissecting microscope (80×)
Not given 1.2 μm Not clear 152 # dm–3 Not present in all samples (% given)
Environ. Chem. 2015 ©CSIRO 2015 doi:10.1071/EN15012_AC
Page 19 of 34
Reference System Size definitionA Counting method Actual number of particles countedB
RangeC Particle concentrationB,D Did all samples contain microplastics? Lower
limit Higher limit
[40] Laurentian Great Lakes
None
PSD by sieving
Dissecting microscope
2078 but in 16 sites <20 particles counted/site
0.333 mm >4.75 mm Superior: 5391 # km–2
Huron: 2779 # km–2
Erie: 105,503 # km–2
No, found in 20 out of 21 net tows
[41] South Pacific subtropical gyre
None
PSD by sieving
Dissecting microscope
Not given 0.333 mm >4.75 mm <4.75 mm: 24,498 # km–2
(all: 26,898 # km–2)
No, found in 46 out of 48 net tows
[42] Northeast Pacific Ocean
2D surface area and maximum diameter
Net
Dissecting microscope (6–12×), particles digitally imaged (resolution 10.6 μm)
2009: 30 518 (surface) + 324 (subsurface)
2010: 1572 (surface)
Surface: 0.333 mm
Subsurface: 0.202 mm
Not clear Median : 0.448 # m–2 (2009), 0.021 # m–2 (2010)
Not said
[43] Saint Peter and Saint Paul Archipelago, Equatorial Atlantic
None
Net
Stereomicroscope (5×)
71 0.300 mm >5 mm 1 per 100 m3 of seawater No, only 41% of the 88 tows contained at least 1, and a maximum of 8, microplastics
Environ. Chem. 2015 ©CSIRO 2015 doi:10.1071/EN15012_AC
Page 20 of 34
Reference System Size definitionA Counting method Actual number of particles countedB
RangeC Particle concentrationB,D Did all samples contain microplastics? Lower
limit Higher limit
[44] Waters around Australia
‘Length’
Net
Visual; no details given
839 0.330 mm 82.6 mm 4256 # km–2 No, 80% of net tows and 93% of net stations had at least one piece
[45] North Western Mediterranean Sea
None
Net
Net
Binocular microscope
4371 0.333 mm 5 mm 0.116 # m–2 No, 90% of the stations yes, 30% of the samples >0.1 # m–2
[17] Lake Geneva, Switzerland
None Stereomicroscope LG: 107 0.300 mm <5 mm LG: 48,146 # km–2 Yes
Mediterranean Sea
Net MS(1): 1290 MS(2): 126
MS(1): 314,609 # km–2 MS(2): 14,389 # km–2
[46] Northeast Pacific Ocean
‘longest dimension’
Net
No details given Not given 0.505 mm >10 mm Range: 0.004–0.19 # m–3 Not present in all samples: – surface: 8.8–84% – subsurface: 1 out of 4 cruises (in this: 28%)
Environ. Chem. 2015 ©CSIRO 2015 doi:10.1071/EN15012_AC
Page 21 of 34
Reference System Size definitionA Counting method Actual number of particles countedB
RangeC Particle concentrationB,D Did all samples contain microplastics? Lower
limit Higher limit
[47] Western North Atlantic Ocean and Caribbean Sea
None
Net
Visual; no details given
64,000 plastic pieces
0.335 mm Not clear Caribbean Sea: 1414 # km–2
Gulf of Maine: 1534 # km–2
29° to 31°N: 20,328 # km–2
62% of all net tows contained detectable amounts of plastic debris
[48] Western North Atlantic Ocean
‘longest edge’
Net
Visual; no details given
748
(88% <10 mm)
0.335 mm 420 mm – Not said
[49] North Pacific Ocean, Kuroshio Current area
‘longest length’
‘plastic pieces were categorized following Ogi and Fukumoto[57]'
No details given Not given 1 mm >11 mm 1–10 mm: 15,000 # km–2
(all: 174,355 # km–2)
No, plastics detected in 72% stations
[26] Singapore’s coastal water
None No details given 13 1.6 μm Not given – Not found in many sites (7 out of 20; when found, only 1 or 2 particles per sample

Environ. Chem. 2015 ©CSIRO 2015 doi:10.1071/EN15012_AC
Page 22 of 34
Reference System Size definitionA Counting method Actual number of particles countedB
RangeC Particle concentrationB,D Did all samples contain microplastics? Lower
limit Higher limit
[50] Santa Monica Bay, California, US
None
Net
PSD by sieving
No details given Not given 0.355 mm >4.75 mm 3.92 # m–3 Yes
[5] Atlantic Ocean
None
Net
No details given Not given 0.280 mm Not given G Not said
[51] Coastal zone near Long Beach, California, US
None
Net
PSD by sieving
Dissecting microscope
Not given 0.355 mm >4.750 mm
7.25 # m–3
(PSD available in %; most in the >4.750 fraction in many cases!)
Yes
[52] North Pacific subtropical high
None
Net
PSD by sieving
Dissecting microscope
27,698 (including >4.760 mm)
0.355 mm >4.760 mm
<4.760 mm: 309,506 # km–2 H
(all: 334,271 # km–2)
Not said
[53] North Pacific Ocean
None
Net
PSD by sieving
Light microscope Not given 0.053 mm >10 mm Results for size classes No, 11 out of 27 locations
[54] North Atlantic: Sargasso Sea, Caribbean, Shelf and slope water
None
Net
No details given Not given 0.330 or 0.500 mm
No upper limit
2100 # km–2 No, present in 68% of all tows
Environ. Chem. 2015 ©CSIRO 2015 doi:10.1071/EN15012_AC
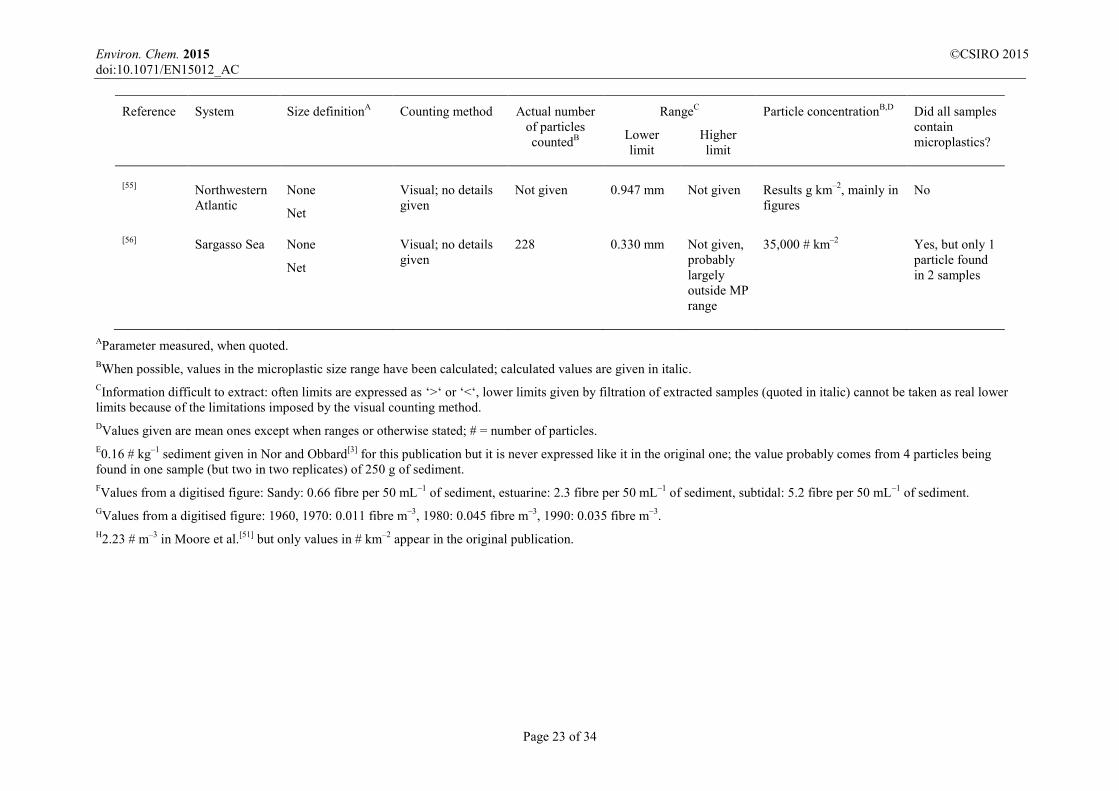
Page 23 of 34
Reference System Size definitionA Counting method Actual number of particles countedB
RangeC Particle concentrationB,D Did all samples contain microplastics? Lower
limit Higher limit
[55] Northwestern Atlantic
None
Net
Visual; no details given
Not given 0.947 mm Not given Results g km–2, mainly in figures
No
[56] Sargasso Sea None
Net
Visual; no details given
228 0.330 mm Not given, probably largely outside MP range
35,000 # km–2 Yes, but only 1 particle found in 2 samples
AParameter measured, when quoted. BWhen possible, values in the microplastic size range have been calculated; calculated values are given in italic. CInformation difficult to extract: often limits are expressed as ‘>‘ or ‘<‘, lower limits given by filtration of extracted samples (quoted in italic) cannot be taken as real lower limits because of the limitations imposed by the visual counting method. DValues given are mean ones except when ranges or otherwise stated; # = number of particles. E0.16 # kg–1 sediment given in Nor and Obbard[3] for this publication but it is never expressed like it in the original one; the value probably comes from 4 particles being found in one sample (but two in two replicates) of 250 g of sediment. FValues from a digitised figure: Sandy: 0.66 fibre per 50 mL–1 of sediment, estuarine: 2.3 fibre per 50 mL–1 of sediment, subtidal: 5.2 fibre per 50 mL–1 of sediment. GValues from a digitised figure: 1960, 1970: 0.011 fibre m–3, 1980: 0.045 fibre m–3, 1990: 0.035 fibre m–3. H2.23 # m–3 in Moore et al.[51] but only values in # km–2 appear in the original publication.
Environ. Chem. 2015 ©CSIRO 2015 doi:10.1071/EN15012_AC
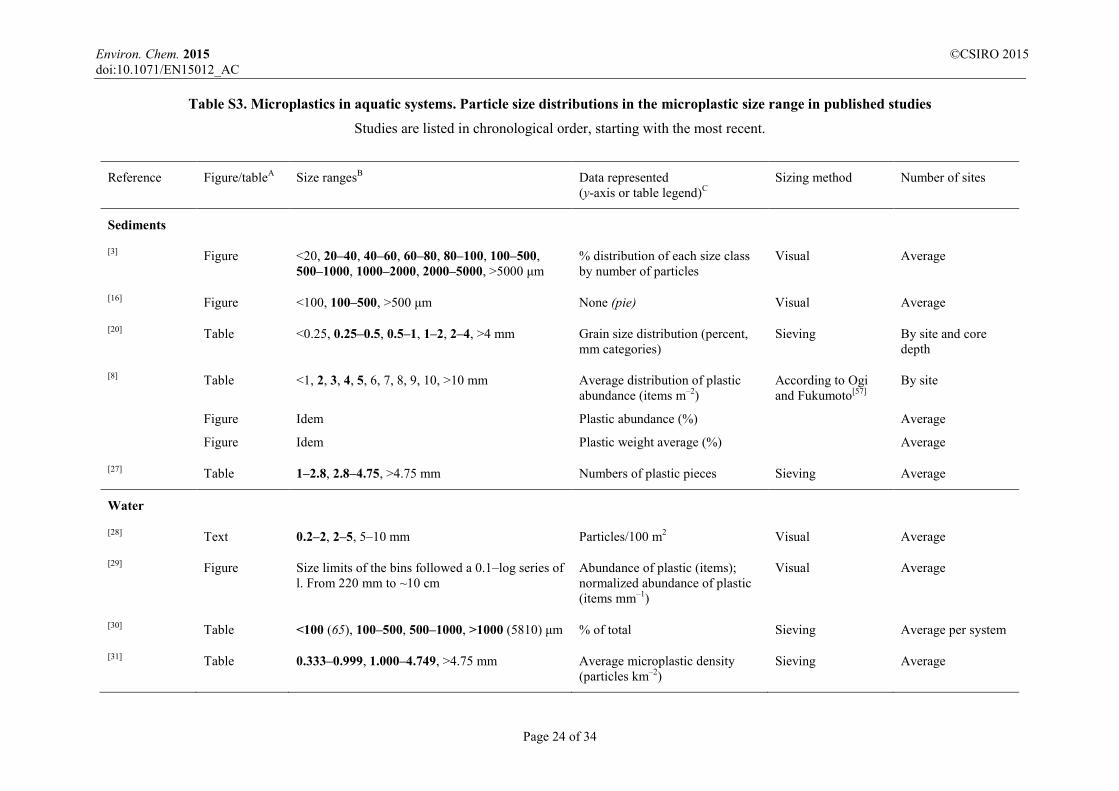
Page 24 of 34
Table S3. Microplastics in aquatic systems. Particle size distributions in the microplastic size range in published studies
Studies are listed in chronological order, starting with the most recent.
Reference Figure/tableA Size rangesB Data represented (y-axis or table legend)C
Sizing method Number of sites
Sediments
[3] Figure <20, 20–40, 40–60, 60–80, 80–100, 100–500, 500–1000, 1000–2000, 2000–5000, >5000 μm
% distribution of each size class by number of particles
Visual Average
[16] Figure <100, 100–500, >500 μm None (pie) Visual Average
[20] Table <0.25, 0.25–0.5, 0.5–1, 1–2, 2–4, >4 mm Grain size distribution (percent, mm categories)
Sieving By site and core depth
[8] Table
Figure
Figure
<1, 2, 3, 4, 5, 6, 7, 8, 9, 10, >10 mm
Idem
Idem
Average distribution of plastic abundance (items m–2)
Plastic abundance (%)
Plastic weight average (%)
According to Ogi and Fukumoto[57]
By site
Average
Average
[27] Table 1–2.8, 2.8–4.75, >4.75 mm Numbers of plastic pieces Sieving Average
Water
[28] Text 0.2–2, 2–5, 5–10 mm Particles/100 m2 Visual Average
[29] Figure Size limits of the bins followed a 0.1–log series of l. From 220 mm to ~10 cm
Abundance of plastic (items); normalized abundance of plastic (items mm–1)
Visual Average
[30] Table <100 (65), 100–500, 500–1000, >1000 (5810) μm % of total Sieving Average per system
[31] Table 0.333–0.999, 1.000–4.749, >4.75 mm Average microplastic density (particles km–2)
Sieving Average
Environ. Chem. 2015 ©CSIRO 2015 doi:10.1071/EN15012_AC
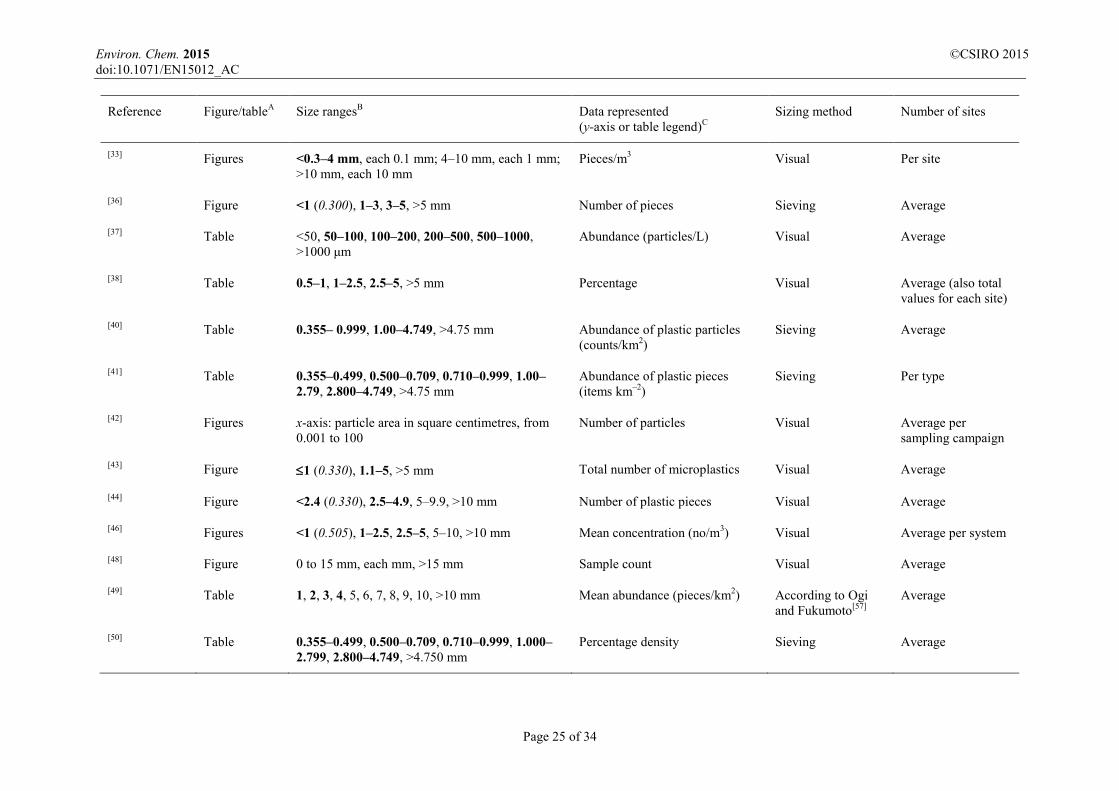
Page 25 of 34
Reference Figure/tableA Size rangesB Data represented (y-axis or table legend)C
Sizing method Number of sites
[33] Figures <0.3–4 mm, each 0.1 mm; 4–10 mm, each 1 mm; >10 mm, each 10 mm
Pieces/m3 Visual Per site
[36] Figure <1 (0.300), 1–3, 3–5, >5 mm Number of pieces Sieving Average
[37] Table <50, 50–100, 100–200, 200–500, 500–1000, >1000 μm
Abundance (particles/L) Visual Average
[38] Table 0.5–1, 1–2.5, 2.5–5, >5 mm Percentage Visual Average (also total values for each site)
[40] Table 0.355– 0.999, 1.00–4.749, >4.75 mm Abundance of plastic particles (counts/km2)
Sieving Average
[41] Table 0.355–0.499, 0.500–0.709, 0.710–0.999, 1.00–2.79, 2.800–4.749, >4.75 mm
Abundance of plastic pieces (items km–2)
Sieving Per type
[42] Figures x-axis: particle area in square centimetres, from 0.001 to 100
Number of particles Visual Average per sampling campaign
[43] Figure 1 (0.330), 1.1–5, >5 mm Total number of microplastics Visual Average
[44] Figure <2.4 (0.330), 2.5–4.9, 5–9.9, >10 mm Number of plastic pieces Visual Average
[46] Figures <1 (0.505), 1–2.5, 2.5–5, 5–10, >10 mm Mean concentration (no/m3) Visual Average per system
[48] Figure 0 to 15 mm, each mm, >15 mm Sample count Visual Average
[49] Table 1, 2, 3, 4, 5, 6, 7, 8, 9, 10, >10 mm Mean abundance (pieces/km2) According to Ogi and Fukumoto[57]
Average
[50] Table 0.355–0.499, 0.500–0.709, 0.710–0.999, 1.000–2.799, 2.800–4.749, >4.750 mm
Percentage density Sieving Average
Environ. Chem. 2015 ©CSIRO 2015 doi:10.1071/EN15012_AC
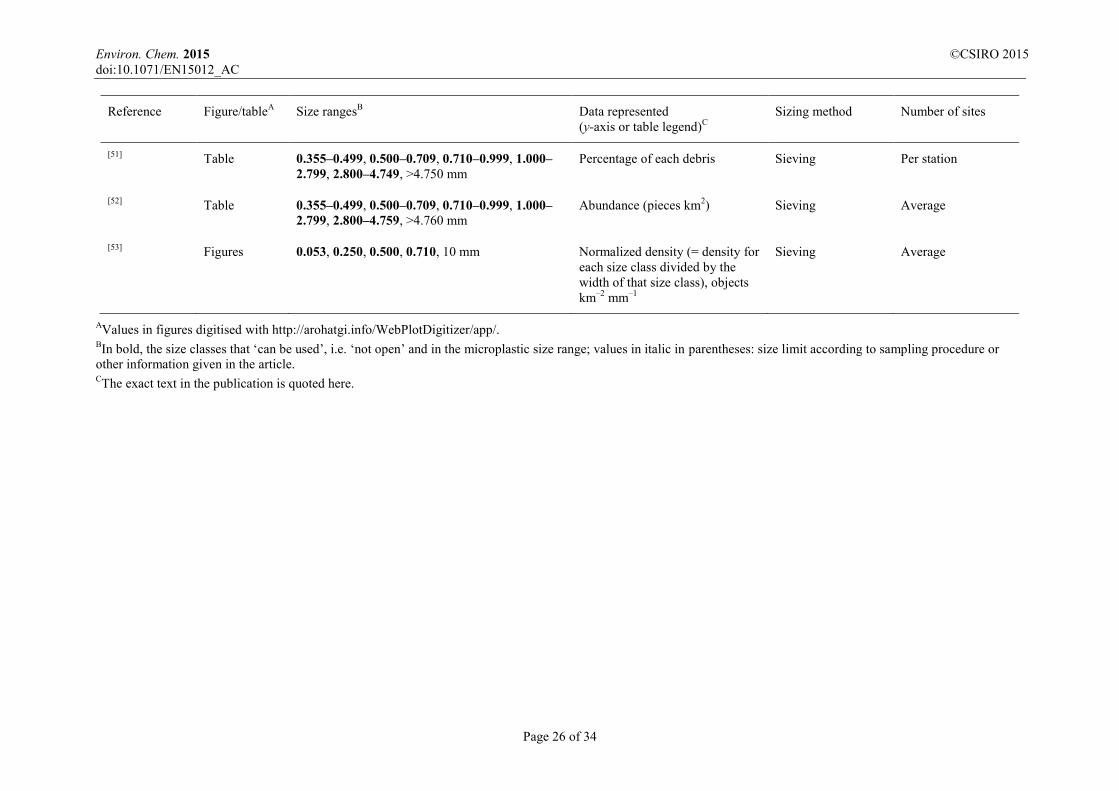
Page 26 of 34
Reference Figure/tableA Size rangesB Data represented (y-axis or table legend)C
Sizing method Number of sites
[51] Table 0.355–0.499, 0.500–0.709, 0.710–0.999, 1.000–2.799, 2.800–4.749, >4.750 mm
Percentage of each debris Sieving Per station
[52] Table 0.355–0.499, 0.500–0.709, 0.710–0.999, 1.000–2.799, 2.800–4.759, >4.760 mm
Abundance (pieces km2) Sieving Average
[53] Figures 0.053, 0.250, 0.500, 0.710, 10 mm Normalized density (= density for each size class divided by the width of that size class), objects km–2 mm–1
Sieving Average
AValues in figures digitised with http://arohatgi.info/WebPlotDigitizer/app/. BIn bold, the size classes that ‘can be used’, i.e. ‘not open’ and in the microplastic size range; values in italic in parentheses: size limit according to sampling procedure or other information given in the article. CThe exact text in the publication is quoted here.

Environ. Chem. 2015 ©CSIRO 2015 doi:10.1071/EN15012_AC
Page 27 of 34
Fig. S1. Examples of variation of the shape factor (SF = 4π area/perimeter) of geometric objects. Reproduced
with permission from Mavrocordatos et al.[58]
Fig. S2. Schematic illustration of dimensions of a particle and its equivalent sieve diameter.

Environ. Chem. 2015 ©CSIRO 2015 doi:10.1071/EN15012_AC
Page 28 of 34
Fig. S3. Different types of representation for the same particle size distribution. Conditions: spherical particles
following a power-law distribution with β = 4, total mass: 0.5 mg dm–3, particle density: 3 × 10–12 g μm–3.
Environ. Chem. 2015 ©CSIRO 2015 doi:10.1071/EN15012_AC
Page 29 of 34
List of abbreviations
ATR- FTIR, attenuated total reflectance–Fourier transform infrared
β, slope of a power law distribution (n(dp) = (ΔN/Δdp) = Adp–β) where ΔN is the number of
particles with a diameter in the size interval Δdp per unit volume of fluid.
d, density
DT-Pyr-GC/MS, thermal desorption pyrolysis gas chromatography mass spectrometry
ESEM-EDS, environmental scanning electron microscopy–energy dispersive spectroscopy
FTIR, Fourier transform infrared
OM, organic matter
PE, polyethylene
PSD, particle size distribution
SEM, scanning electron microscopy
SF, shape factor
SML, surface microlayer
WWTP, waste water treatment plant
Environ. Chem. 2015 ©CSIRO 2015 doi:10.1071/EN15012_AC
Page 30 of 34
References [1] J. H. Dekiff, D. Remy, J. Klasmeier, E. Fries, Occurrence and spatial distribution of microplastics in
sediments from Norderney. Environ. Pollut. 2014, 186, 248. doi:10.1016/j.envpol.2013.11.019
[2] M.-T. Nuelle, J. H. Dekiff, D. Remy, E. Fries, A new analytical approach for monitoring microplastics
in marine sediments. Environ. Pollut. 2014, 184, 161. doi:10.1016/j.envpol.2013.07.027
[3] N. H. M. Nor, J. P. Obbard, Microplastics in Singapore’s coastal mangrove ecosystems. Mar. Pollut.
Bull. 2014, 79, 278. doi:10.1016/j.marpolbul.2013.11.025
[4] L. C. Woodall, A. Sanchez-Vidal, M. Canals, G. L. J. Paterson, R. Coppock, V. Sleight, A. Calafat, A.
D. Rogers, B. E. Narayanaswamy, R. C. Thompson, The deep sea is a major sink for microplastic debris.
Roy. Soc. Open Sci. 2014, 1, 140317. doi:10.1098/rsos.140317
[5] R. C. Thompson, Y. Olsen, R. P. Mitchell, A. Davis, S. J. Rowland, A. W. G. John, D. McGonigle, A.
E. Russell, Lost at sea: Where is all the plastic? Science 2004, 304, 838. doi:10.1126/science.1094559
[6] B. S. Griffiths, B. Boag, R. Neilson, L. Palmer, The use of colloidal silica to extract nematodes from
small samples of soil or sediment. Nematologica 1990, 36, 465. doi:10.1163/002925990X00437
[7] J. C. Antunes, J. G. L. Frias, A. C. Micaelo, P. Sobral, Resin pellets from beaches of the Portuguese
coast and adsorbed persistent organic pollutants. Estuar. Coast. Shelf Sci. 2013, 130, 62.
doi:10.1016/j.ecss.2013.06.016
[8] J. Martins, P. Sobral, Plastic marine debris on the Portuguese coastline: A matter of size? Mar. Pollut.
Bull. 2011, 62, 2649. doi:10.1016/j.marpolbul.2011.09.028
[9] H. K. Imhof, N. P. Ivleva, J. Schmid, R. Niessner, C. Laforsch, Contamination of beach sediments of a
subalpine lake with microplastic particles. Curr. Biol. 2013, 23, R867. doi:10.1016/j.cub.2013.09.001
[10] H. K. Imhof, J. Schmid, R. Niessner, N. P. Ivleva, C. Laforsch, A novel, highly efficient method for the
separation and quantification of plastic particles in sediments of aquatic environments. Limnol. Oceanogr.
Methods 2012, 10, 524.
[11] H. B. Jayasiri, C. S. Purushothaman, A. Vennila, Quantitative analysis of plastic debris on recreational
beaches in Mumbai, India. Mar. Pollut. Bull. 2013, 77, 107. doi:10.1016/j.marpolbul.2013.10.024
[12] J. Lee, S. Hong, Y. K. Song, S. H. Hong, Y. C. Jang, M. Jang, N. W. Heo, G. M. Han, M. J. Lee, D.
Kang, W. J. Shim, Relationships among the abundances of plastic debris in different size classes on beaches
in South Korea. Mar. Pollut. Bull. 2013, 77, 349. doi:10.1016/j.marpolbul.2013.08.013
[13] L. Van Cauwenberghe, M. Claessens, M. B. Vandegehuchte, J. Mees, C. R. Janssen, Assessment of
marine debris on the Belgian Continental Shelf. Mar. Pollut. Bull. 2013, 73, 161.
doi:10.1016/j.marpolbul.2013.05.026
[14] M. Claessens, L. Van Cauwenberghe, M. B. Vandegehuchte, C. R. Janssen, New techniques for the
detection of microplastics in sediments and field collected organisms. Mar. Pollut. Bull. 2013, 70, 227.
doi:10.1016/j.marpolbul.2013.03.009
Environ. Chem. 2015 ©CSIRO 2015 doi:10.1071/EN15012_AC
Page 31 of 34
[15] L. Van Cauwenberghe, A. Vanreusel, J. Mees, C. R. Janssen, Microplastic pollution in deep-sea
sediments. Environ. Pollut. 2013, 182, 495. doi:10.1016/j.envpol.2013.08.013
[16] A. Vianello, A. Boldrin, P. Guerriero, V. Moschino, R. Rella, A. Sturaro, L. Da Ros, Microplastic
particles in sediments of Lagoon of Venice, Italy: First observations on occurrence, spatial patterns and
identification. Estuar. Coast. Shelf Sci. 2013, 130, 54. doi:10.1016/j.ecss.2013.03.022
[17] F. Faure, M. Corbaz, H. Baecher, L. F. De Alencastro, Pollution due to plastics and microplastics in
Lake Geneva and in the Mediterranean Sea. Arch. Sci. 2012, 65, 157.
[18] G. Liebezeit, F. Dubaish, Microplastics in beaches of the East Frisian Islands Spiekeroog and
Kachelotplate. Bull. Environ. Contam. Toxicol. 2012, 89, 213. doi:10.1007/s00128-012-0642-7
[19] A. Van, C. M. Rochman, E. M. Flores, K. L. Hill, E. Vargas, S. A. Vargas, E. Hoh, Persistent organic
pollutants in plastic marine debris found on beaches in San Diego, California. Chemosphere 2012, 86, 258.
doi:10.1016/j.chemosphere.2011.09.039
[20] H. S. Carson, S. L. Colbert, M. J. Kaylor, K. J. McDermid, Small plastic debris changes water
movement and heat transfer through beach sediments. Mar. Pollut. Bull. 2011, 62, 1708.
doi:10.1016/j.marpolbul.2011.05.032
[21] M. Claessens, S. De Meester, L. Van Landuyt, K. De Clerck, C. R. Janssen, Occurrence and
distribution of microplastics in marine sediments along the Belgian coast. Mar. Pollut. Bull. 2011, 62, 2199.
doi:10.1016/j.marpolbul.2011.06.030
[22] M. Zbyszewski, P. Corcoran, Distribution and degradation of fresh water plastic particles along the
beaches of Lake Huron, Canada. Water Air Soil Pollut. 2011, 220, 365. doi:10.1007/s11270-011-0760-6
[23] M. A. Browne, T. S. Galloway, R. C. Thompson, Spatial patterns of plastic debris along estuarine
shorelines. Environ. Sci. Technol. 2010, 44, 3404. doi:10.1021/es903784e
[24] M. F. Costa, J. A. Ivar do Sul, J. S. Silva-Cavalcanti, M. C. B. Araujo, A. Spengler, P. S. Tourinho, On
the importance of size of plastic fragments and pellets on the strandline: a snapshot of a Brazilian beach.
Environ. Monit. Assess. 2010, 168, 299. doi:10.1007/s10661-009-1113-4
[25] J. A. Ivar do Sul, A. Spengler, M. F. Costa, Here, there and everywhere. Small plastic fragments and
pellets on beaches of Fernando de Noronha (equatorial western Atlantic). Mar. Pollut. Bull. 2009, 58, 1236.
doi:10.1016/j.marpolbul.2009.05.004
[26] K. L. Ng, J. P. Obbard, Prevalence of microplastics in Singapore’s coastal marine environment. Mar.
Pollut. Bull. 2006, 52, 761. doi:10.1016/j.marpolbul.2005.11.017
[27] K. J. McDermid, T. L. McMullen, Quantitative analysis of small-plastic debris on beaches in the
Hawaiian archipelago. Mar. Pollut. Bull. 2004, 48, 790. doi:10.1016/j.marpolbul.2003.10.017
[28] A. Collignon, J.-H. Hecq, F. Galgani, F. Collard, A. Goffart, Annual variation in neustonic micro- and
meso-plastic particles and zooplankton in the Bay of Calvi (Mediterranean-Corsica). Mar. Pollut. Bull. 2014,
79, 293. doi:10.1016/j.marpolbul.2013.11.023
Environ. Chem. 2015 ©CSIRO 2015 doi:10.1071/EN15012_AC
Page 32 of 34
[29] A. Cozar, F. Echevarria, J. I. Gonzalez-Gordillo, X. Irigoien, B. Ubeda, S. Hernandez-Leon, A. T.
Palma, S. Navarro, J. García-de-Lomas, A. Ruiz, M. L. Fernández-de-Puelles, C. M. Duarte, Plastic debris in
the open ocean. Proc. Natl. Acad. Sci. USA 2014, 111, 10239. doi:10.1073/pnas.1314705111
[30] J.-P. W. Desforges, M. Galbraith, N. Dangerfield, P. S. Ross, Widespread distribution of microplastics
in subsurface seawater in the NE Pacific Ocean. Mar. Pollut. Bull. 2014, 79, 94.
doi:10.1016/j.marpolbul.2013.12.035
[31] C. M. Free, O. P. Jensen, S. A. Mason, M. Eriksen, N. J. Williamson, B. Boldgiv, High-levels of
microplastic pollution in a large, remote, mountain lake. Mar. Pollut. Bull. 2014, 85, 156.
doi:10.1016/j.marpolbul.2014.06.001
[32] J. P. G. L. Frias, V. Otero, P. Sobral, Evidence of microplastics in samples of zooplankton from
Portuguese coastal waters. Mar. Environ. Res. 2014, 95, 89. doi:10.1016/j.marenvres.2014.01.001
[33] A. Isobe, K. Kubo, Y. Kamura, S. i. Kako, E. Nakashima, N. Fujii, Selective transport of microplastics
and mesoplastics by drifting in coastal waters. Mar. Pollut. Bull. 2014, 48, 11863.
doi:10.1016/j.marpolbul.2014.09.041
[34] A. R. A. Lima, M. F. Costa, M. Barletta, Distribution patterns of microplastics within the plankton of a
tropical estuary. Environ. Res. 2014, 132, 146. doi:10.1016/j.envres.2014.03.031
[35] A. McCormick, T. Hoellein, S. A. Mason, J. Schluep, J. J. Kelly, Microplastic is an abundant and
distinct microbial habitat in an urban river. Environ. Sci. Technol. 2014, 89, 324. doi:10.1021/es503610r
[36] S. S. Sadri, R. C. Thompson, On the quantity and composition of floating plastic debris entering and
leaving the Tamar Estuary, Southwest England. Mar. Pollut. Bull. 2014, 81, 55.
doi:10.1016/j.marpolbul.2014.02.020
[37] Y. K. Song, S. H. Hong, M. Jang, J. H. Kang, O. Y. Kwon, G. M. Han, W. J. Shim, Large
accumulation of micro-sized synthetic polymer particles in the sea surface microlayer. Environ. Sci. Technol.
2014, 48, 9014. doi:10.1021/es501757s
[38] S. Zhao, L. Zhu, T. Wang, D. Li, Suspended microplastics in the surface water of the Yangtze Estuary
System, China: First observations on occurrence, distribution. Mar. Pollut. Bull. 2014, 86, 562.
doi:10.1016/j.marpolbul.2014.06.032
[39] F. Dubaish, G. Liebezeit, Suspended microplastics and black carbon particles in the Jade System,
Southern North Sea. Water Air Soil Pollut. 2013, 224, 13.
[40] M. Eriksen, S. Mason, S. Wilson, C. Box, A. Zellers, W. Edwards, H. Farley, S. Amato, Microplastic
pollution in the surface waters of the Laurentian Great Lakes. Mar. Pollut. Bull. 2013, 77, 177.
doi:10.1016/j.marpolbul.2013.10.007
[41] M. Eriksen, N. Maximenko, M. Thiel, A. Cummins, G. Lattin, S. Wilson, J. Hafner, A. Zellers, S.
Rifman, Plastic pollution in the South Pacific subtropical gyre. Mar. Pollut. Bull. 2013, 68, 71.
doi:10.1016/j.marpolbul.2012.12.021
Environ. Chem. 2015 ©CSIRO 2015 doi:10.1071/EN15012_AC
Page 33 of 34
[42] M. C. Goldstein, A. J. Titmus, M. Ford, Scales of spatial heterogeneity of plastic marine debris in the
Northeast Pacific Ocean. PLOS One 2013, 8, e80020. doi:10.1371/journal.pone.0080020
[43] J. A. Ivar do Sul, M. F. Costa, M. Barletta, F. J. A. Cysneiros, Pelagic microplastics around an
archipelago of the Equatorial Atlantic. Mar. Pollut. Bull. 2013, 75, 305. doi:10.1016/j.marpolbul.2013.07.040
[44] J. Reisser, J. Shaw, C. Wilcox, B. D. Hardesty, M. Proietti, M. Thums, C. Pattiaratchi, Marine plastic
pollution in waters around Australia: Characteristics, concentrations, and pathways. PLOS One 2013, 8,
e80466. doi:10.1371/journal.pone.0080466
[45] A. Collignon, J.-H. Hecq, F. Galgani, P. Voisin, F. Collard, A. Goffart, Neustonic microplastic and
zooplankton in the North Western Mediterranean Sea. Mar. Pollut. Bull. 2012, 64, 861.
doi:10.1016/j.marpolbul.2012.01.011
[46] M. J. Doyle, W. Watson, N. M. Bowlin, S. B. Sheavly, Plastic particles in coastal pelagic ecosystems
of the Northeast Pacific ocean. Mar. Environ. Res. 2011, 71, 41. doi:10.1016/j.marenvres.2010.10.001
[47] K. L. Law, S. Morét-Ferguson, N. A. Maximenko, G. Proskurowski, E. E. Peacock, J. Hafner, C. M.
Reddy, Plastic accumulation in the North Atlantic Subtropical Gyre. Science 2010, 329, 1185.
doi:10.1126/science.1192321
[48] S. K. Morét-Ferguson, G. Lavender Law, E. K. Proskurowski, E. E. Murphy, C. M. Peacock, Reddy.
The size, mass, and composition of plastic debris in the western North Atlantic Ocean. Mar. Pollut. Bull.
2010, 60, 1873. doi:10.1016/j.marpolbul.2010.07.020
[49] R. Yamashita, A. Tanimura, Floating plastic in the Kuroshio current area, Western North Pacific
Ocean. Mar. Pollut. Bull. 2007, 54, 485. doi:10.1016/j.marpolbul.2006.11.012
[50] G. L. Lattin, C. J. Moore, A. F. Zellers, S. L. Moore, S. B. Weisberg, A comparison of neustonic
plastic and zooplankton at different depths near the southern California shore. Mar. Pollut. Bull. 2004, 49,
291. doi:10.1016/j.marpolbul.2004.01.020
[51] C. J. Moore, S. L. Moore, S. B. Weisberg, G. W. Lattin, A. F. Zellers, A comparison of neustonic
plastic and zooplankton abundance in Southern California’s coastal waters. Mar. Pollut. Bull. 2002, 44, 1035.
doi:10.1016/S0025-326X(02)00150-9
[52] C. J. Moore, S. L. Moore, K. Leecaster, S. B. Weisberg, A comparison of plastic and plankton in the
North Pacific Central Gyre. Mar. Pollut. Bull. 2001, 42, 1297. doi:10.1016/S0025-326X(01)00114-X
[53] D. G. Shaw, R. H. Day, Colour- and form-dependent loss of plastic micro-debris from the North
Pacific Ocean. Mar. Pollut. Bull. 1994, 28, 39. doi:10.1016/0025-326X(94)90184-8
[54] R. J. Wilber, Plastic in the North Atlantic. Oceanus 1987, 30, 61.
[55] J. B. J. Colton, F. D. Knapp, B. R. Burns, Plastic particles in surface waters of the Northwest Atlantic.
Science 1974, 185, 491. doi:10.1126/science.185.4150.491
[56] E. J. Carpenter, K. L. Smith, Plastics on the Sargasso Sea surface. Sci. Total Environ. 1972, 178, 1240.
Environ. Chem. 2015 ©CSIRO 2015 doi:10.1071/EN15012_AC
Page 34 of 34
[57] H. Ogi, Y. Fukumoto, A sorting method for small plastic debris floating on the sea surface and stranded
on sandy beaches. Bull. Fac. Fish. Hokkaido Univ. 2000, 51, 71.
[58] D. Mavrocordatos, D. Perret, G. G. Leppard, in Environmental Colloids and Particles: Behaviour,
Separation and Characterisation (Eds K. J. Wilkinson, J. R. Lead) 2007, pp. 345–404 (Wiley: New York).