Embed Size (px)
Citation preview
Questions concerning the Halloween Flood in Onion
Creek
Presentation by David R. MaidmentCenter for Research in Water Resources
University of Texas at Austin
Public Safety CommissionCity of Austin
7 July 2014
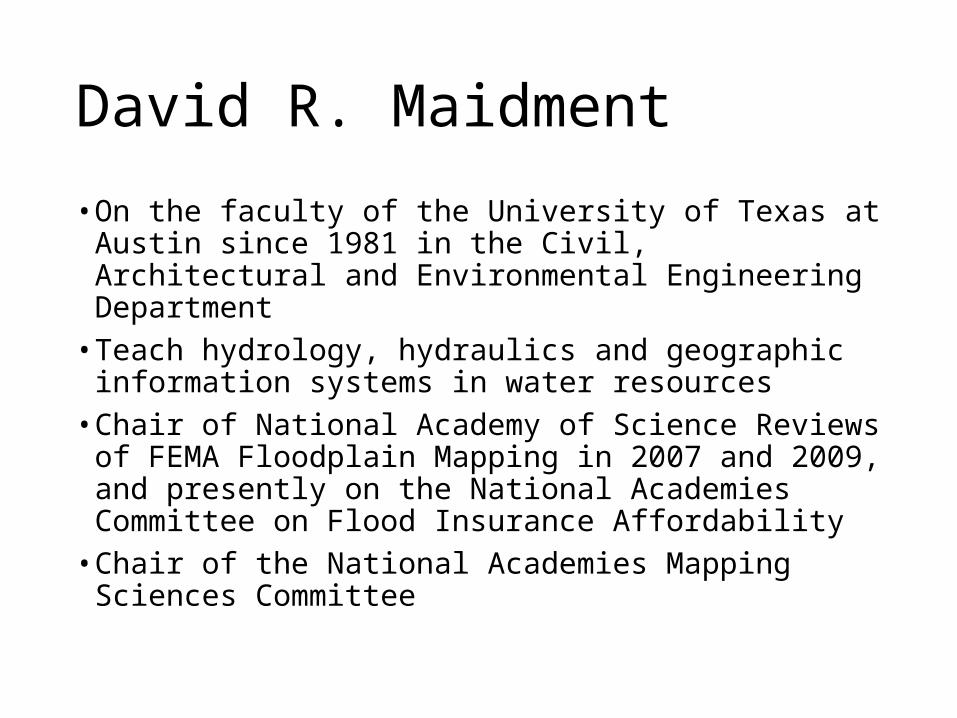
David R. Maidment
• On the faculty of the University of Texas at Austin since 1981 in the Civil, Architectural and Environmental Engineering Department
• Teach hydrology, hydraulics and geographic information systems in water resources
• Chair of National Academy of Science Reviews of FEMA Floodplain Mapping in 2007 and 2009, and presently on the National Academies Committee on Flood Insurance Affordability
• Chair of the National Academies Mapping Sciences Committee
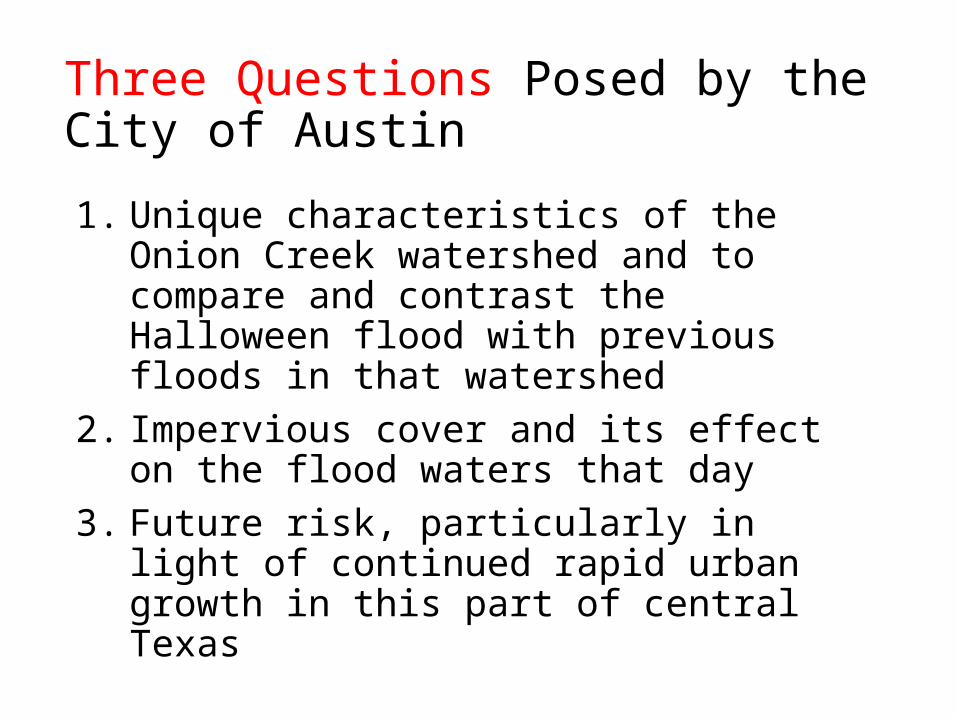
Three Questions Posed by the City of Austin
1. Unique characteristics of the Onion Creek watershed and to compare and contrast the Halloween flood with previous floods in that watershed
2. Impervious cover and its effect on the flood waters that day
3. Future risk, particularly in light of continued rapid urban growth in this part of central Texas
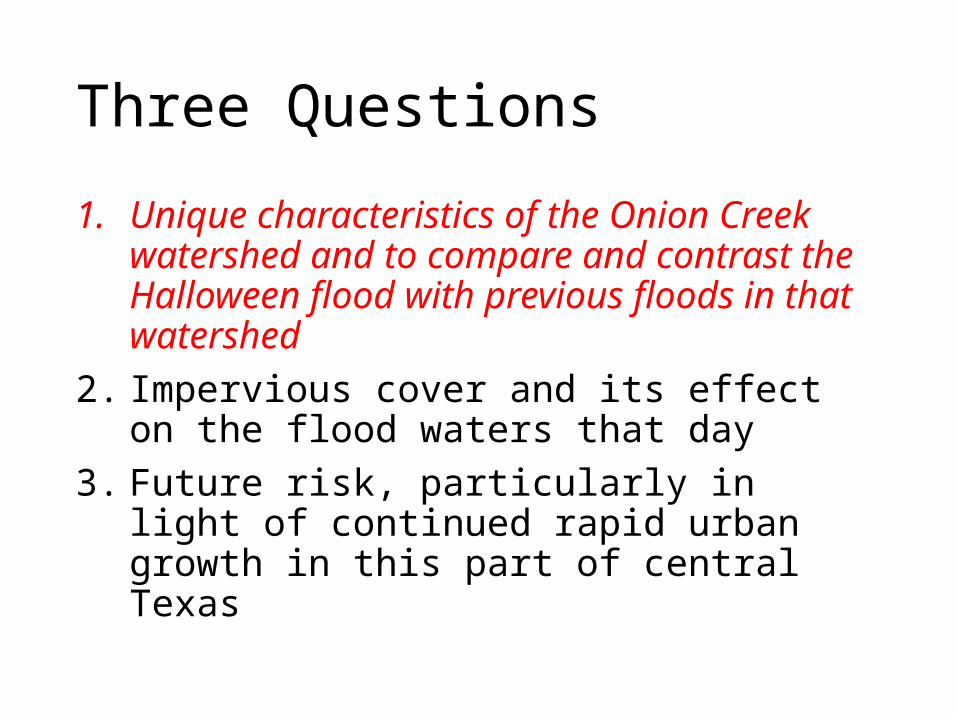
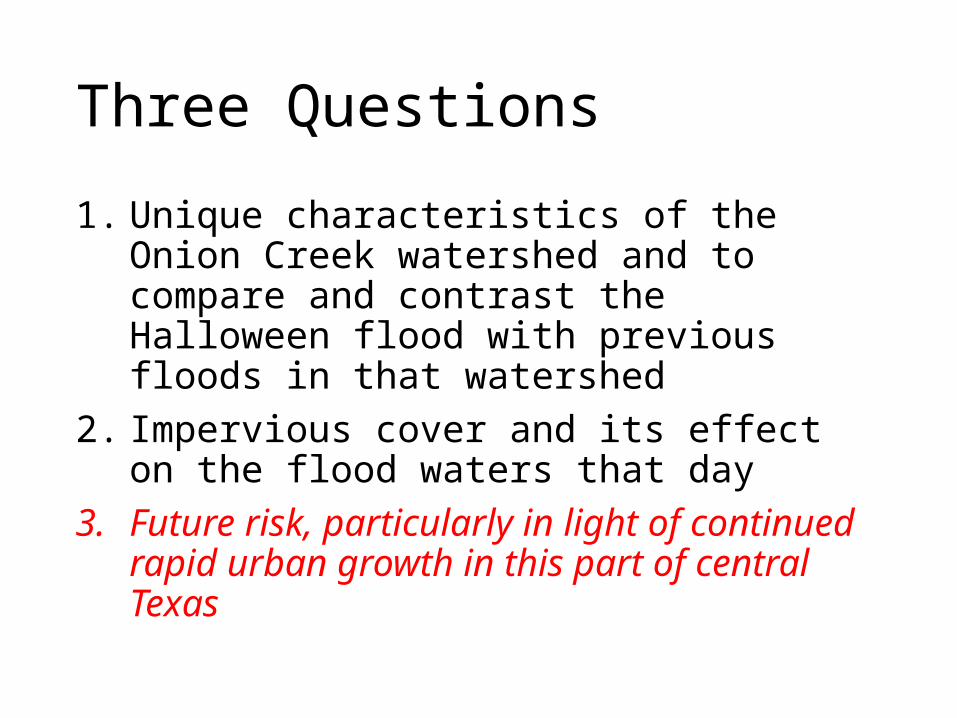
Three Questions
1. Unique characteristics of the Onion Creek watershed and to compare and contrast the Halloween flood with previous floods in that watershed
2. Impervious cover and its effect on the flood waters that day
3. Future risk, particularly in light of continued rapid urban growth in this part of central Texas
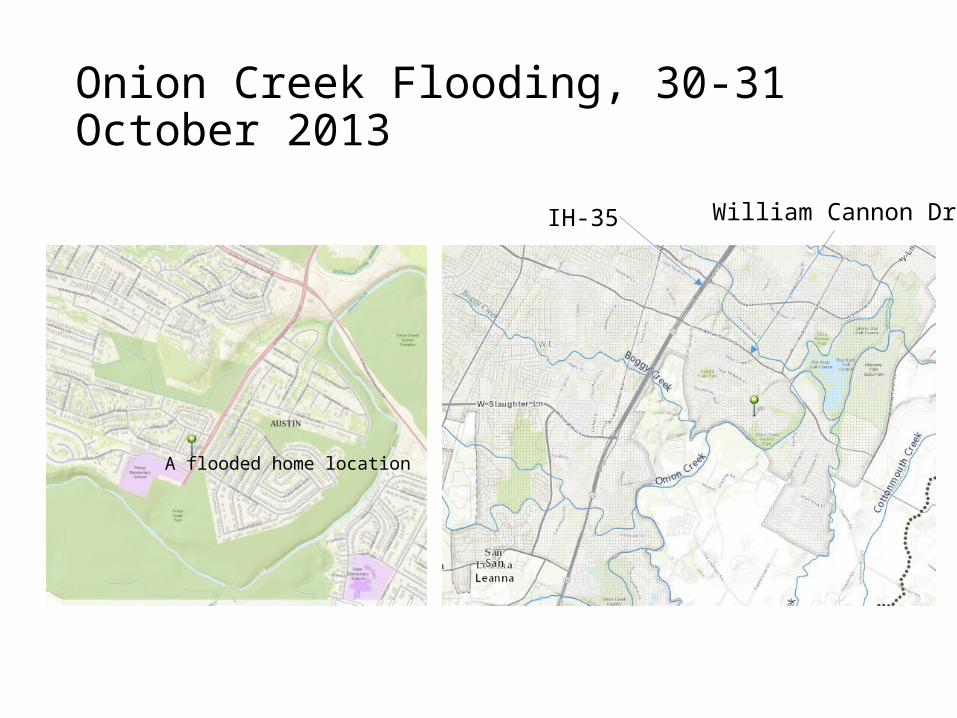
Onion Creek Flooding, 30-31 October 2013
A flooded home location
IH-35 William Cannon Dr

FEMA Flood Hazard Zone
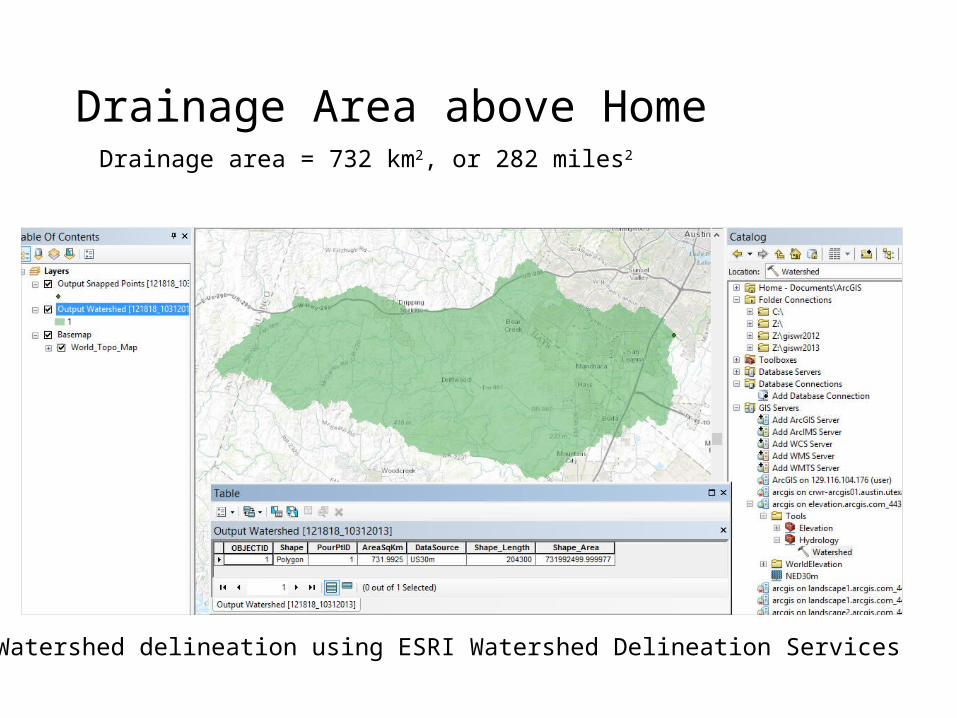
Drainage Area above HomeDrainage area = 732 km2, or 282 miles2
Watershed delineation using ESRI Watershed Delineation Services
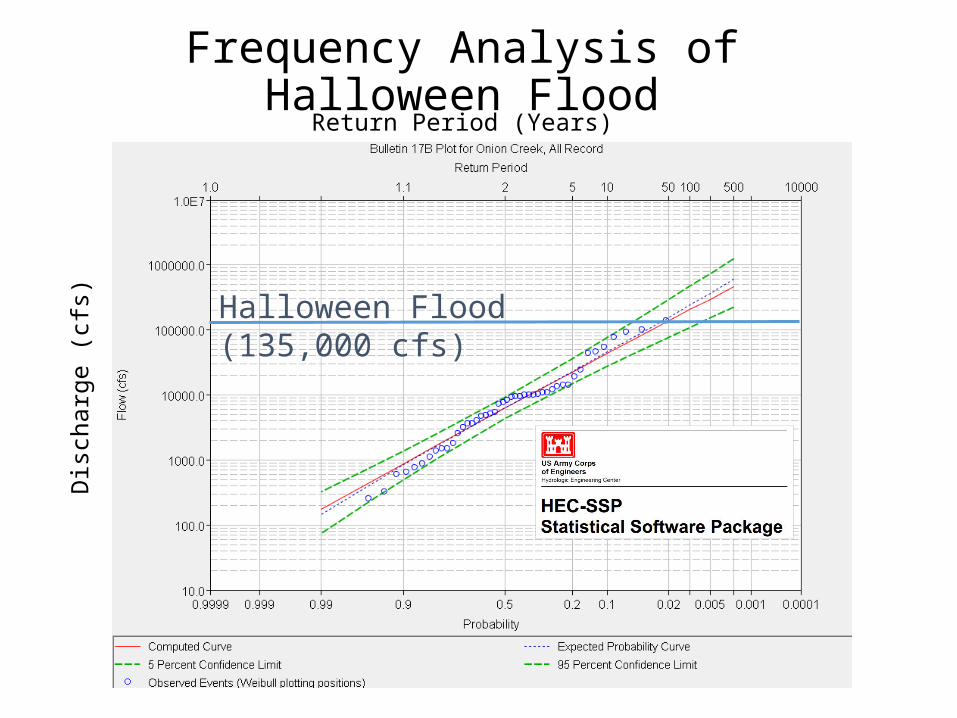
Frequency Analysis of Halloween Flood
Halloween Flood (135,000 cfs)
Dis
char
ge (c
fs)
Return Period (Years)
Variation in SLOSH Model Storm Surge Elevations at Developed Shoreline
0.0
5.0
10.0
15.0
20.0
25.0
30.0
35.0
Shoreline Locations - Not to scale
Stor
m S
urge
Ele
vatio
n (ft
msl
)
Cat 5Cat 3
Cat 1
PRELIMINARYsource: FEMA MAT, 2-26-06
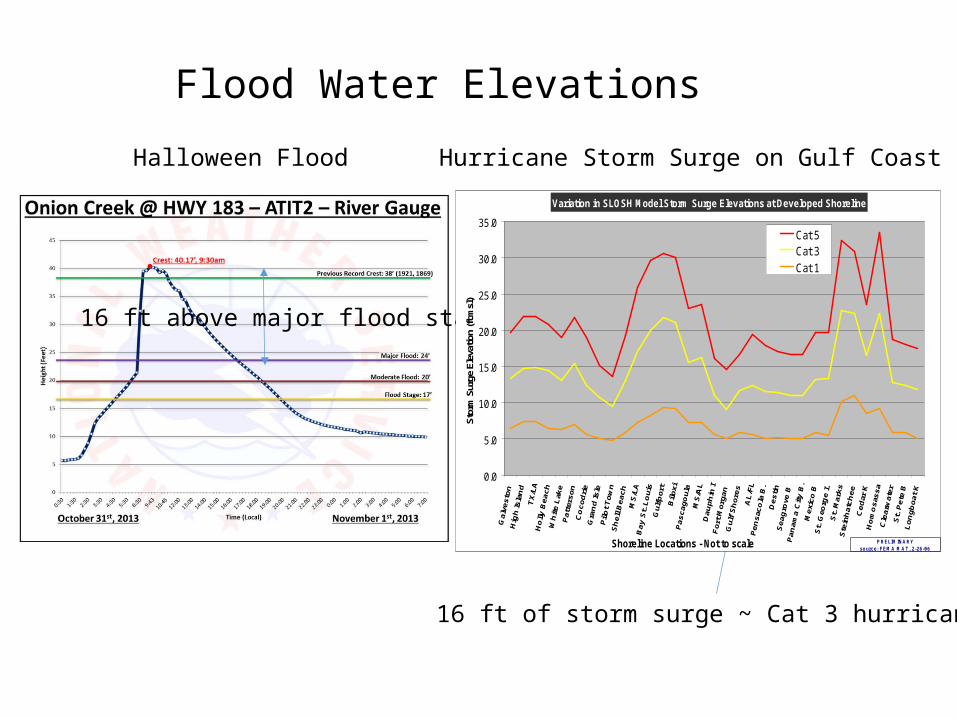
Flood Water Elevations
Halloween Flood Hurricane Storm Surge on Gulf Coast
16 ft above major flood stage
16 ft of storm surge ~ Cat 3 hurricane
Responses to Question One
Unique characteristics of the Onion Creek watershed and to compare and contrast the Halloween flood with previous floods in that watershed
• Onion Creek has a huge watershed equivalent in area to the entire City of Austin
• The area flooded during the Halloween flood is within the 100-year floodplain defined by FEMA
• The magnitude of the observed flood is within the range that could have been anticipated from past flood events. It is not “off the charts”
• The flood peak stage was about 16 ft above “major flood stage” ~ Category 3 hurricane storm surge on the Gulf Coast

Three Questions
1. Unique characteristics of the Onion Creek watershed and to compare and contrast the Halloween flood with previous floods in that watershed
2. Impervious cover and its effect on the flood waters that day
3. Future risk, particularly in light of continued rapid urban growth in this part of central Texas
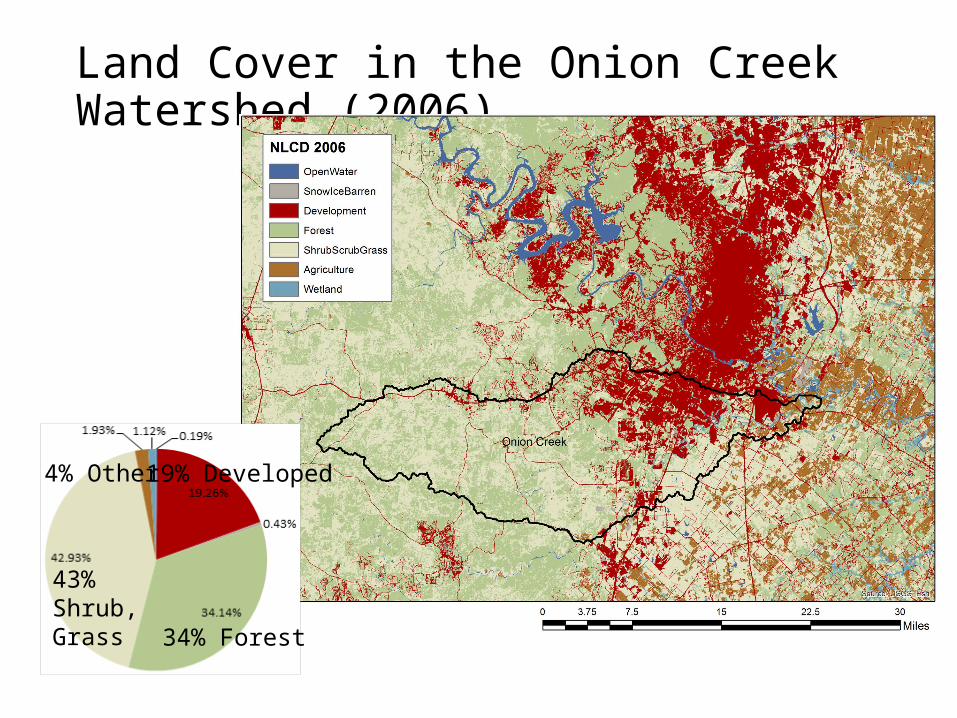
Land Cover in the Onion Creek Watershed (2006)
34% Forest
43% Shrub,Grass
19% Developed4% Other
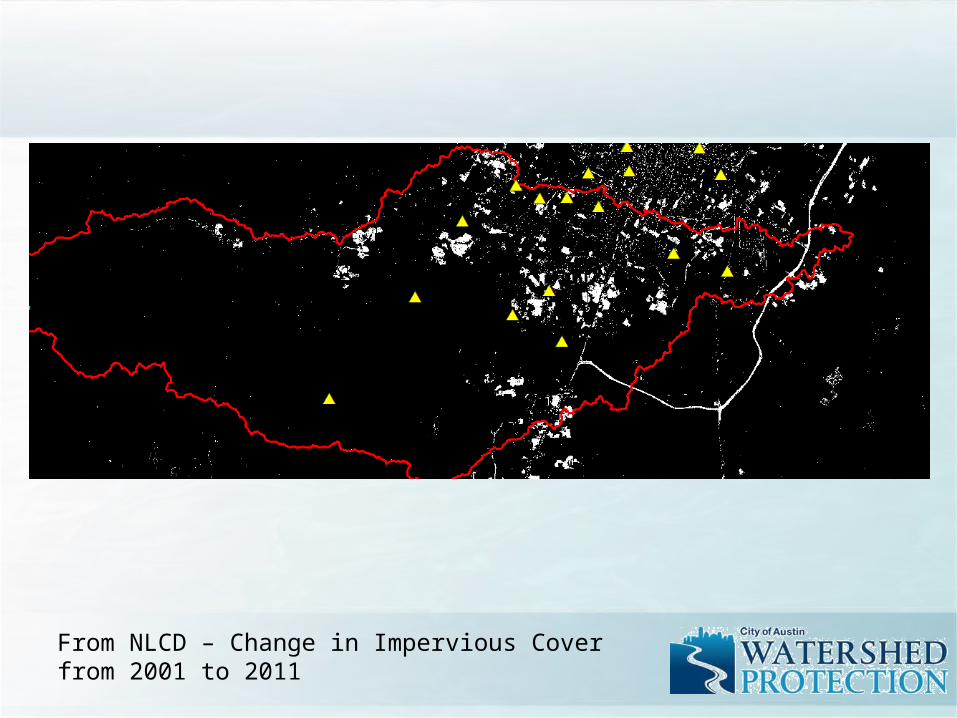
From NLCD – Change in Impervious Cover from 2001 to 2011
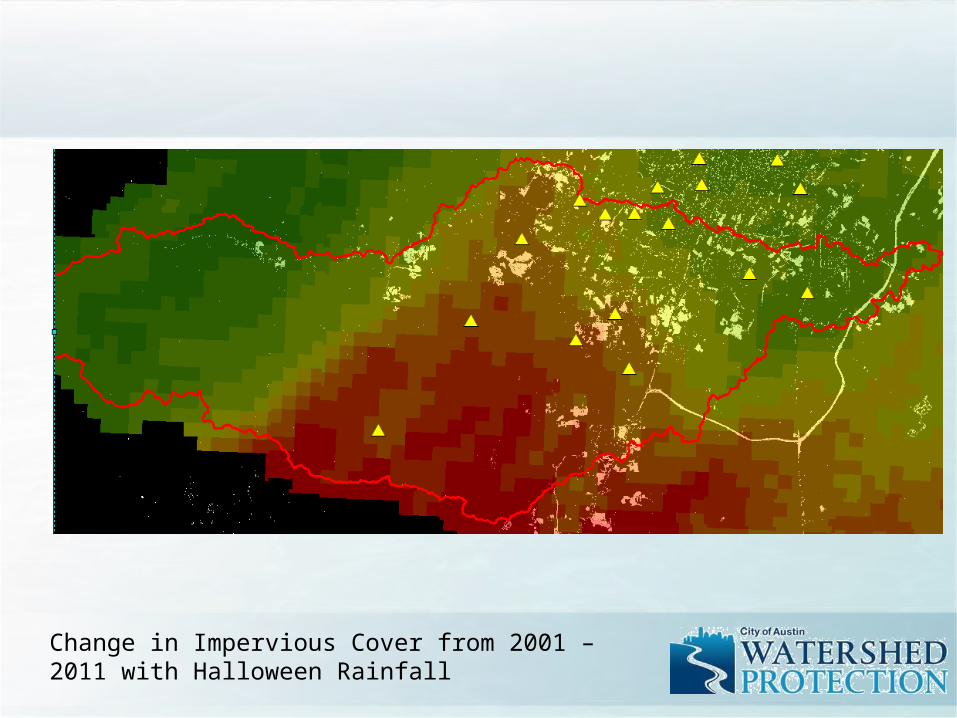
Change in Impervious Cover from 2001 – 2011 with Halloween Rainfall
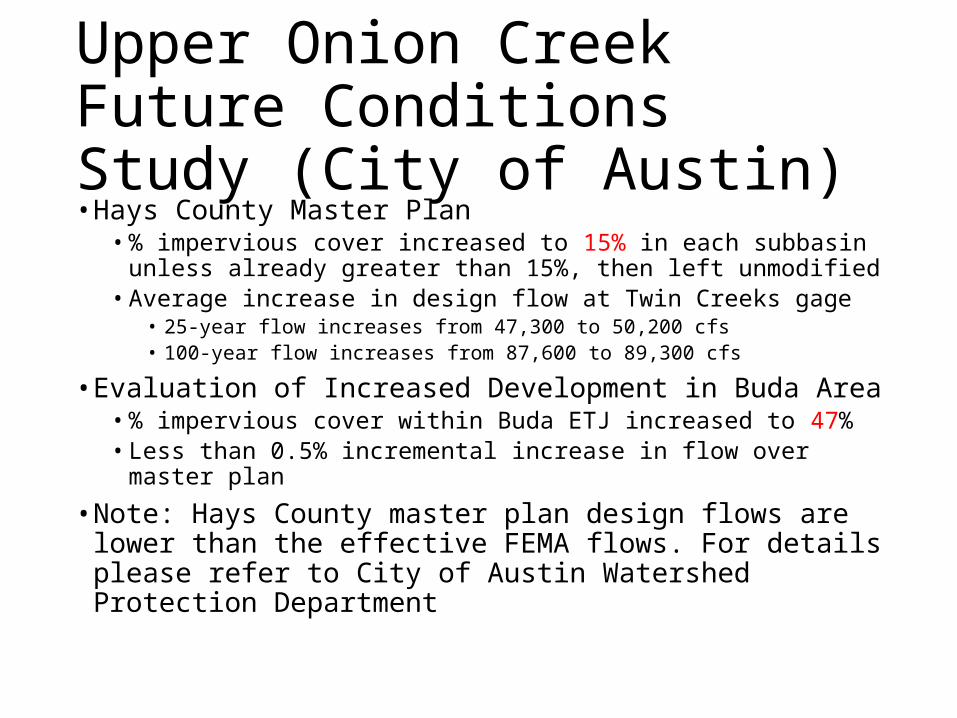
Upper Onion Creek Future Conditions Study (City of Austin)• Hays County Master Plan
• % impervious cover increased to 15% in each subbasin unless already greater than 15%, then left unmodified
• Average increase in design flow at Twin Creeks gage• 25-year flow increases from 47,300 to 50,200 cfs• 100-year flow increases from 87,600 to 89,300 cfs
• Evaluation of Increased Development in Buda Area• % impervious cover within Buda ETJ increased to 47%• Less than 0.5% incremental increase in flow over master plan
• Note: Hays County master plan design flows are lower than the effective FEMA flows. For details please refer to City of Austin Watershed Protection Department
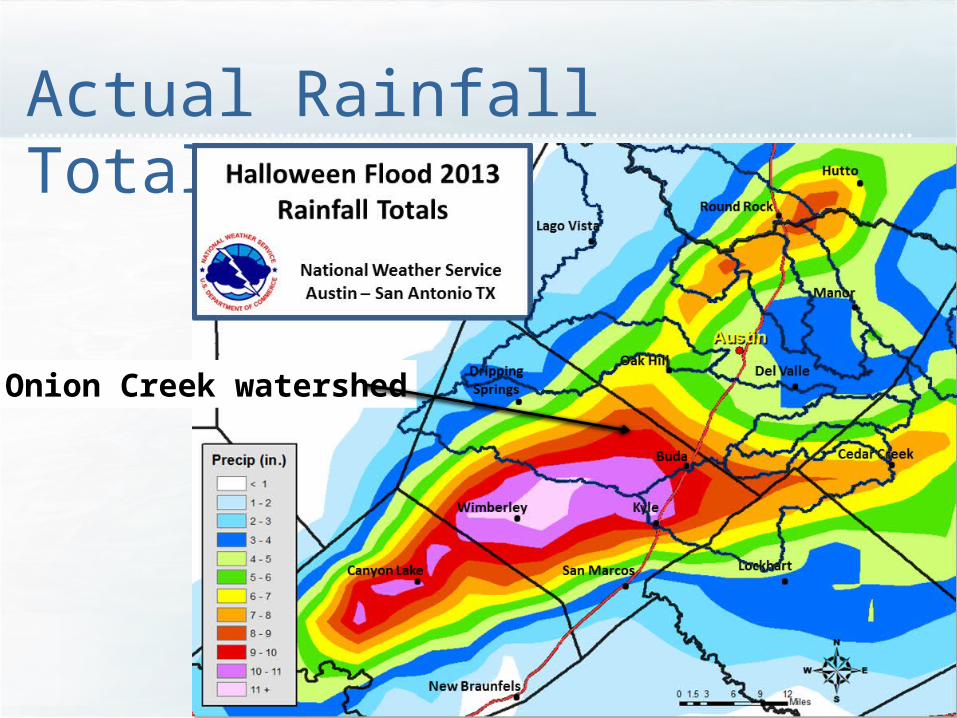
Actual Rainfall Totals
Onion Creek watershed

Onion Creek and the Blanco River
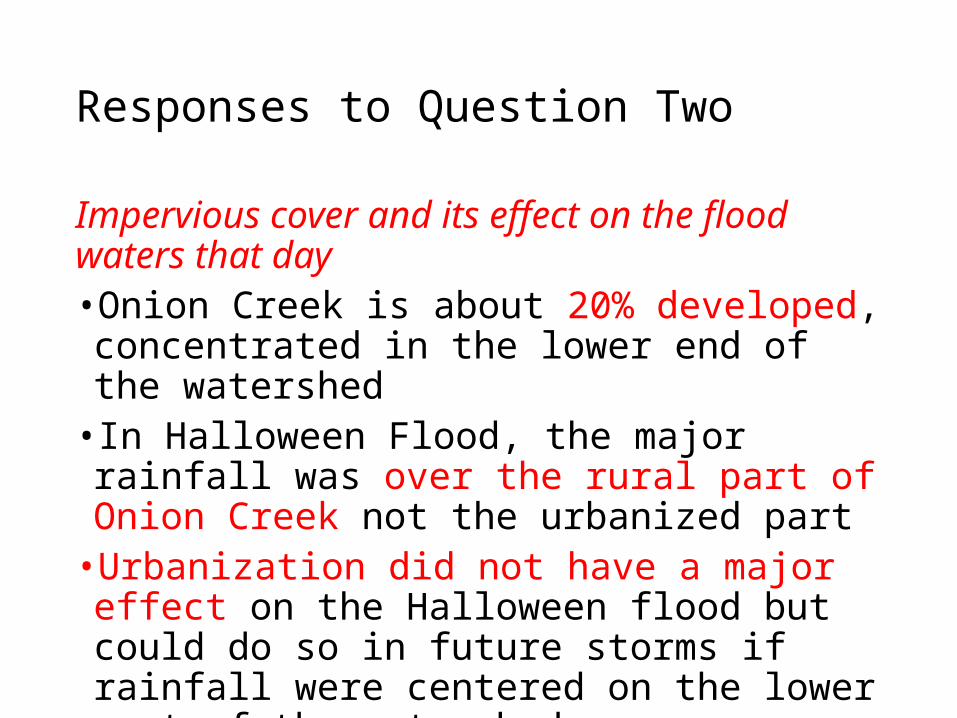
Responses to Question Two
Impervious cover and its effect on the flood waters that day• Onion Creek is about 20% developed, concentrated
in the lower end of the watershed• In Halloween Flood, the major rainfall was over the
rural part of Onion Creek not the urbanized part• Urbanization did not have a major effect on the
Halloween flood but could do so in future storms if rainfall were centered on the lower part of the watershed
Three Questions
1. Unique characteristics of the Onion Creek watershed and to compare and contrast the Halloween flood with previous floods in that watershed
2. Impervious cover and its effect on the flood waters that day
3. Future risk, particularly in light of continued rapid urban growth in this part of central Texas

Anne Castle, Asst Secretary for Water and Science, Dept of Interior
• “Today we have unprecedented opportunities to use science and technology to create a better understanding of one of our most precious resources – water”
• “I am committed to working with you to do that”
• New Open Water Data Initiative
Chair
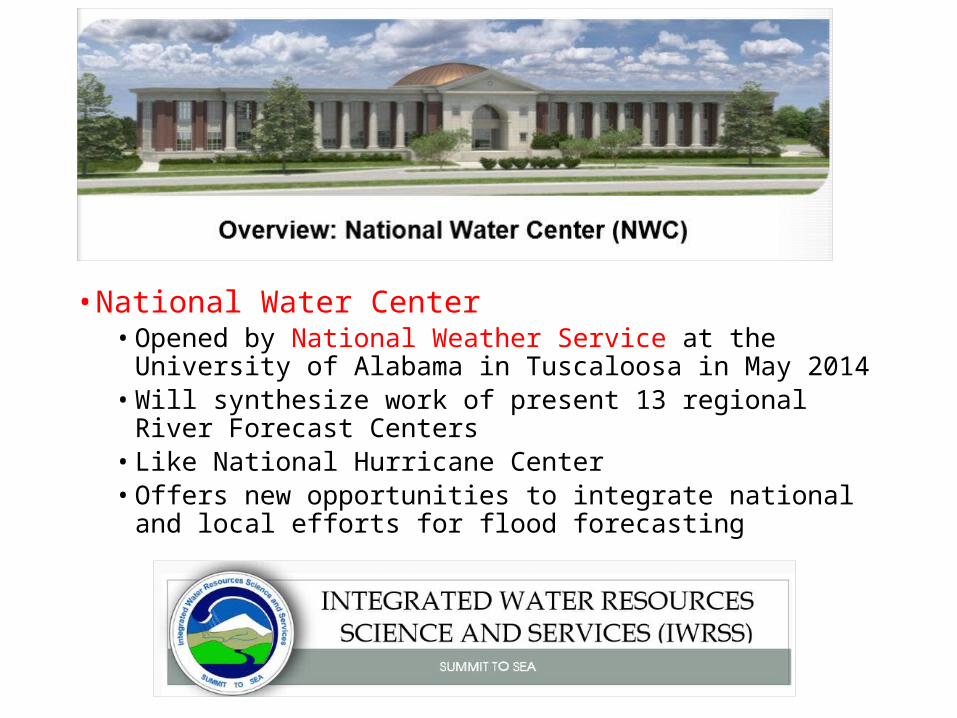
• National Water Center• Opened by National Weather Service at the University of
Alabama in Tuscaloosa in May 2014• Will synthesize work of present 13 regional River Forecast
Centers• Like National Hurricane Center• Offers new opportunities to integrate national and local
efforts for flood forecasting

National Water Data Infrastructure
David R. Maidment, University of Texas at Austin
NWS National Water Center OpeningTuscaloosa, Alabama
13 May 2014
Complete presentation: http://www.caee.utexas.edu/prof/maidment/meetings/NWSTuscaloosa/NWDITuscaloosa.pptx
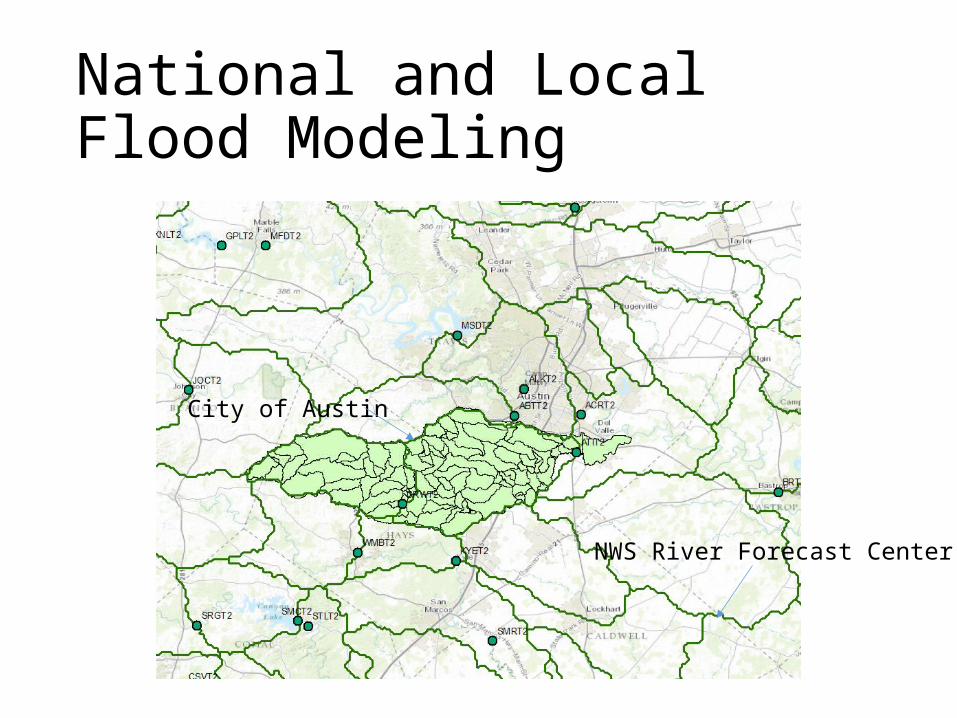
National and Local Flood Modeling
NWS River Forecast Center
City of Austin
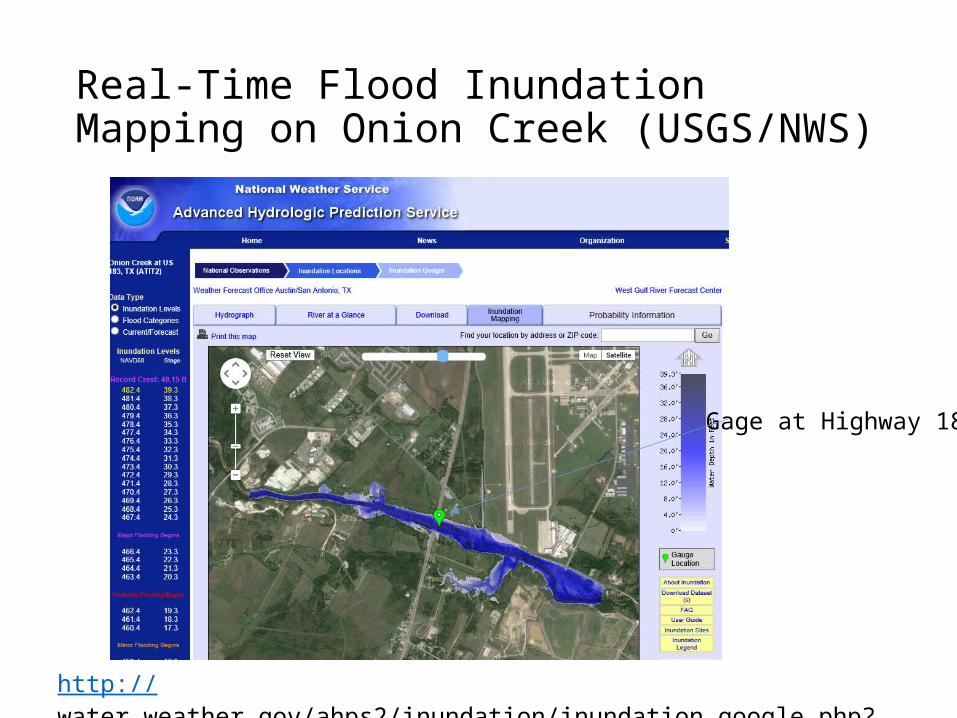
Real-Time Flood Inundation Mapping on Onion Creek (USGS/NWS)
http://water.weather.gov/ahps2/inundation/inundation_google.php?gage=atit2
Gage at Highway 183
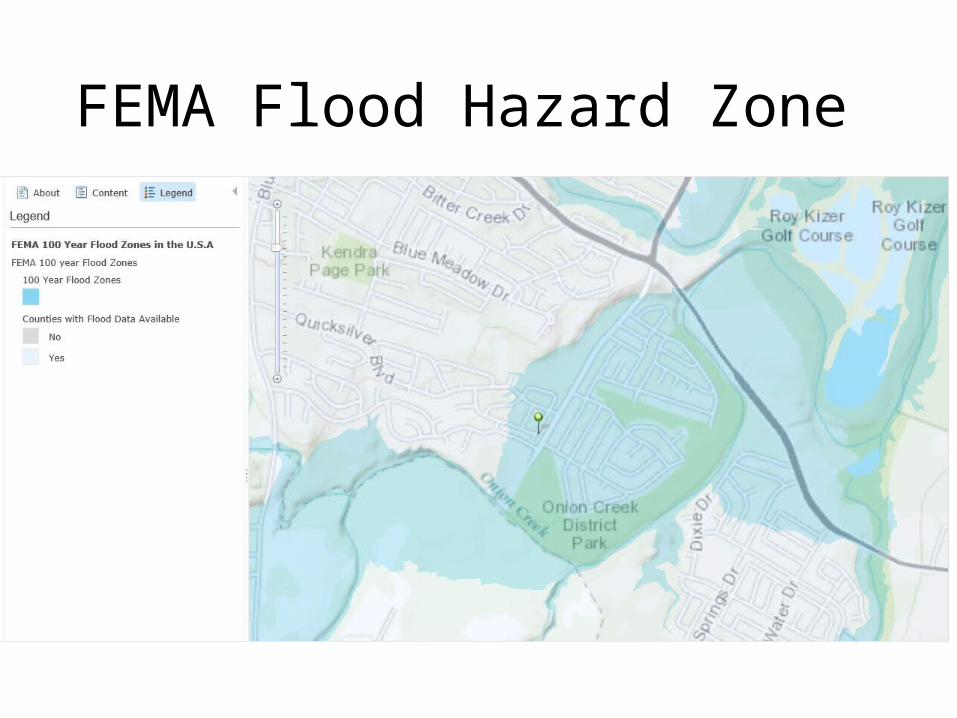
FEMA Flood Hazard Zone

17’ AHPS Flood Warning Stage
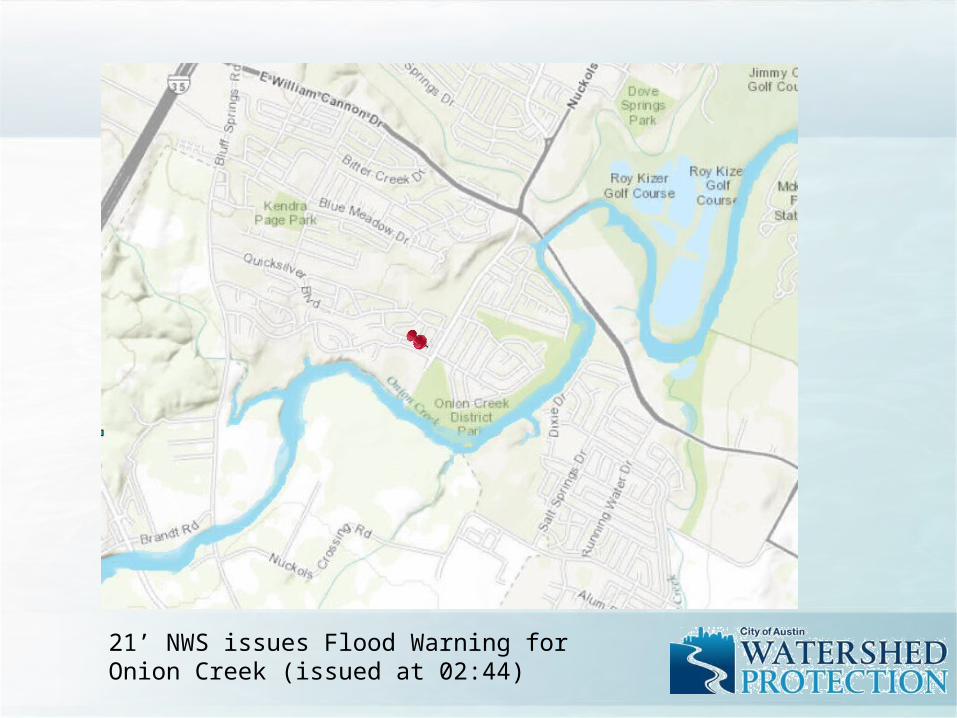
21’ NWS issues Flood Warning for Onion Creek (issued at 02:44)
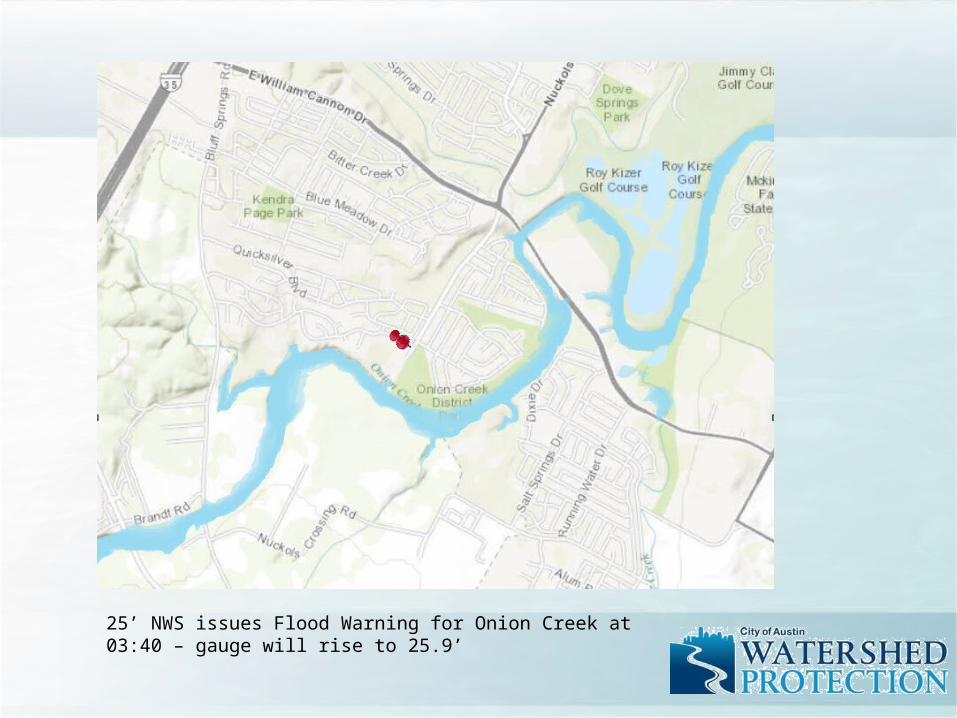
25’ NWS issues Flood Warning for Onion Creek at 03:40 – gauge will rise to 25.9’
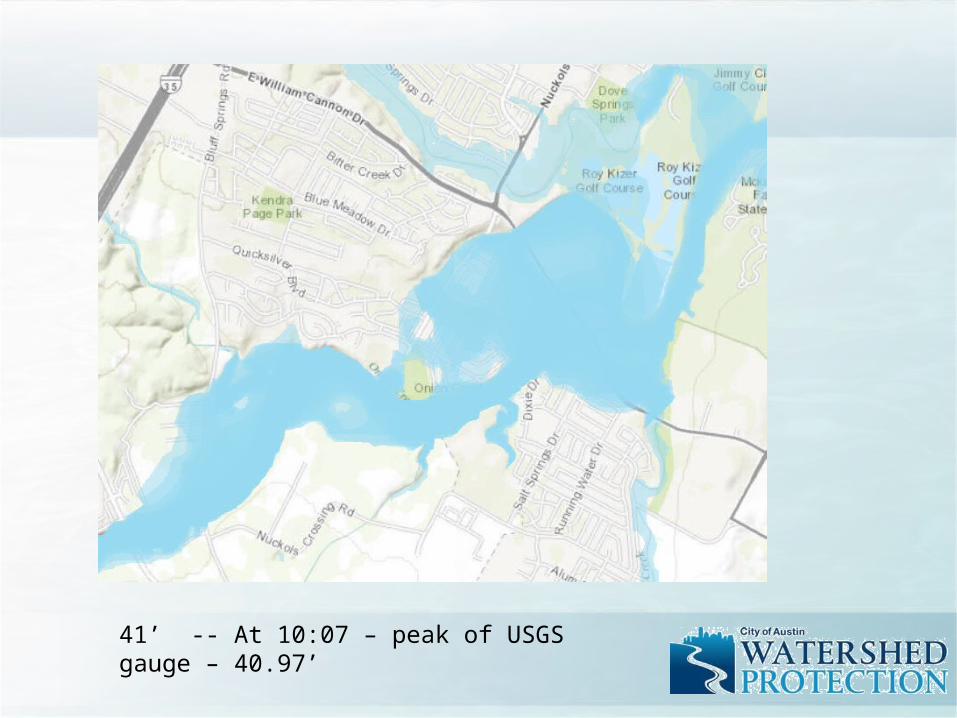
41’ -- At 10:07 – peak of USGS gauge – 40.97’
Inundation Mapping
• Flood emergency response is tied to the extent of inundation
• Prepare flood response plan using a “library of inundation maps”
• 1 ft level increments on all major streams
• During flood events make probabilistic projections of what flood stage will be reached
• Work with National Weather Service through National Water Center to create an improved real-time flood data, modeling and inundation mapping procedure
Responses to Question ThreeFuture risk, particularly in light of continued rapid urban growth in this part of central Texas• Flooding is a regional phenomenon• More detailed modeling of flooding at NWS is
feasible through National Water Center• Flood inundation mapping is the key interface
between hydrology and flood emergency response planning
• Propose Austin and Halloween Flood as a case study for the National Water Center