Embed Size (px)
Citation preview
Questioni di Economia e Finanza(Occasional Papers)
EU-UK global value chain trade and the indirect costs of Brexit
by Rita Cappariello, Milan Damjanovic, Michele Mancini and Filippo Vergara Caffarelli
Num
ber 468N
ovem
ber
201
8


Questioni di Economia e Finanza(Occasional Papers)
EU-UK global value chain trade and the indirect costs of Brexit
by Rita Cappariello, Milan Damjanovic, Michele Mancini and Filippo Vergara Caffarelli
Number 468 – November 2018
The series Occasional Papers presents studies and documents on issues pertaining to
the institutional tasks of the Bank of Italy and the Eurosystem. The Occasional Papers appear
alongside the Working Papers series which are specifically aimed at providing original contributions
to economic research.
The Occasional Papers include studies conducted within the Bank of Italy, sometimes
in cooperation with the Eurosystem or other institutions. The views expressed in the studies are those of
the authors and do not involve the responsibility of the institutions to which they belong.
The series is available online at www.bancaditalia.it .
ISSN 1972-6627 (print)ISSN 1972-6643 (online)
Printed by the Printing and Publishing Division of the Bank of Italy
EU-UK GLOBAL VALUE CHAIN TRADE AND THE INDIRECT COSTS OF BREXIT
by Rita Cappariello*, Milan Damjanović†, Michele Mancini* and Filippo Vergara Caffarelli*
Abstract
Production networks in the European Union (EU) and the United Kingdom (UK) are highly integrated and Brexit poses a threat to supply and demand linkages across the Channel. In a world of Global Value Chains (GVCs), tariffs might be more harmful than in a world where trade is purely direct. In this paper we highlight the features of GVC-trade between the EU and the UK, disentangling the complex network of bilateral EU-UK value-added flows. Assuming that following Brexit the UK adopts the same Most-Favoured-Nation tariff schedule as the EU, we compute the direct and indirect costs of these tariffs, taking into account the EU-UK GVC-trade patterns. Tariffs would add almost 1 percentage point to the cost of manufacturing inputs in the UK, while the corresponding input cost in the EU would be only marginally affected, despite some heterogeneity at the country-level.
JEL Classification: D57, F13, F15. Keywords: Brexit, tariffs, global value chains.
Contents 1. Introduction ......................................................................................................................... 5 2. Related literature.................................................................................................................. 8 3. A first look at EU-UK trade: from gross to value-added statistics .................................... 10 4. The EU-UK Global Value Chains: insights from bilateral exports ................................... 11
4.1 Sectoral GVC trade..................................................................................................... 16 4.2 UK and Factory Europe: intra-EU trade ..................................................................... 17
5. The impact of tariffs on the EU-UK GVCs ....................................................................... 18 5.1 Post-Brexit tariffs ....................................................................................................... 20 5.2 Import-side analysis: the cost-push effect of tariffs ................................................... 21 5.3 Export-side analysis: the cumulative resistance of export flows................................ 26
6. Conclusions ....................................................................................................................... 31 References .............................................................................................................................. 34 Appendices: A. Methodology ................................................................................................ 37 B. Tables ................................................................................................................................. 42 C. List of countries and sectors .............................................................................................. 61
_______________________________________ * Bank of Italy, Directorate General for Economics, Statistics and Research.† Bank of Slovenia, Analysis and Research Department.

1 Introduction1
One of the defining features of modern international trade is the pervasiveness
of the global value chains (GVCs) that connect countries specialising in different
phases of the same production process.2 The Single Market greatly facilitated
the cross-border integration of production chains in the European Union (EU),
which have significantly increased in number and nowadays span borders within
and outside the EU. Not surprisingly, the dense production network involving EU
countries is often called ‘Factory Europe’ (Baldwin and Lopez-Gonzalez, 2015).
On March 29th 2019 the United Kingdom (UK) will withdraw from the EU.
This is an unprecedented event (known as ‘Brexit’, a portmanteau word from
Britain and exit) in the history of European integration, and raises many questions
on the future evolution of the trade and production linkages between the two
economies.3
Brexit could be a threat to the existing EU-UK GVC linkages because of tariff-
and non-tariff barriers. Aside from the direct effect of tariffs, the indirect effects
could be sizeable in a world of GVCs. First, imported intermediate goods are
embedded in exported goods and the relative tariffs cumulate as many times as
the intermediates cross the EU-UK border; thus the upstream structure of the
GVC is important to assess the total cost-push effect. Second, a significant share
of goods and services reach destination countries only indirectly, through other
countries’ exports, and thus these intermediate goods face trade costs that are not
immediately evident.
Given the existence of GVCs, traditional trade statistics no longer provide an
adequate representation of supply and demand linkages, so we use Inter-Country
Input-Output (ICIO) tables (specifically the WIOD4 2016 release, containing data
1The authors wish to thank Pietro Catte, Silvia Fabiani, Andrea Finicelli, Giuseppe Parigi,Roberto Tedeschi, and Giovanni Veronese for their useful comments. The opinions expressed inthis paper are the sole responsibility of the authors and do not necessarily represent the officialposition of the Bank of Italy, the Bank of Slovenia, or the Eurosystem.
2See, among others, Landesmann et al. (2015), Keppel and Prettner (2015), Amador et al.(2015) and Guerrieri and Vergara Caffarelli (2012).
3Since we place our analysis after Brexit has occurred, from now on we will use EU to referto the Union of the 27 remaining Member States.
4See Timmer et al. (2015).
5
for 2014). ICIO tables have been developed by combining traditional trade statis-
tics with national Input-Output tables in order to map production and consump-
tion linkages between different countries. By combining these data with new tools,5
we can explore a wide range of indicators based on gross and value-added trade
flows of goods and services between the UK and the EU. In particular, we retrieve
the portion of EU-UK trade flows related to GVC activity, and we assess the
upstream and downstream linkages of the two regions, including indirect Brexit
exposure.
We assume that the UK adopts the current Most-Favoured-Nation tariff sched-
ule adopted by the EU, which is the worst case scenario for the EU-UK post Brexit
relationship. We construct a tariff schedule for the EU and the UK at the sector
level and, for the first time to our knowledge, at the end-use level. In this way, we
focus on the hypothetical total effect of tariffs, taking into account both the direct
and indirect costs related to GVC-trade.
On the import side, we retrieve the cost-push effect of post-Brexit tariffs on
imported goods, by computing (see Miroudot et al., 2013) the accumulated burden
of upstream tariffs for the EU (UK) imports from the UK (EU). Moreover, we show
how tariffs affect the overall production costs in both regions.
On the export side, we measure the direct and indirect costs incurred by exports
on their way to their destination (see Muradov, 2017). In other words, considering
both direct and indirect costs uncovers how many obstacles exports face along the
GVC before they reach the user.
The indirect costs of tariffs computed both from the import and the export side
are clearly related to the features of the production and consumption networks
between the EU and the UK. As a matter of fact, we show that the indirect costs
of tariffs are correlated with the relevant measures of trade in value added, such
as the foreign content in exports. This suggests that, more generally, it could be
possible to quantify the cumulative tariff effects on countries and sectors with a
proper analysis of the trade in value-added, even without knowing the actual level
of all the tariffs.
We do not attempt to quantify the effect of tariffs on growth or macroeconomic
5See Borin and Mancini (2016) for a survey of recent methodologies developed to measuretrade in value added and countries’ participation in GVCs.
6
performance, rather we aim at understanding the link between the GVC structure
and the direct and indirect effects of tariff costs in order to dig deeper into the
‘black box’ that empirical models, such as gravity models, are using.
We find that, after Brexit, average tariffs imposed on final products would be
higher (8.6 and 5.8 per cent on average, respectively on UK and EU imported
products) than those on the intermediates (3.2 and 2.8 per cent, respectively).6
As to the total cost-push effect on imported goods, we find that cumulative
tariffs on EU imports from the UK would be higher than direct tariffs by around
0.4 p.p. (from 3.9 to 4.3). Thus, 11 per cent of the total cost would be driven by
indirect upstream inter-linkages.
Instead, cumulative tariffs on UK imports from the EU (6 per cent) are much
more in line with the direct tariffs (5.9 per cent). This is not surprising, since a
very high share of UK exports to the EU embed EU products (around 9 per cent
of the total, 20 per cent in motor vehicles). These goods cross the Channel – and
have a tariff levied on them – twice before entering the EU. Viceversa the British
content of EU exports to the UK is much lower (around 2 per cent), and hence
the cost-push effect is negligible.
However, the cost impact of the tariffs on the economy as a whole is much
higher for the UK: manufacturing input costs increase by around 0.9 p.p., two
thirds due to direct tariffs, the rest to upstream linkages, while the corresponding
input costs in the EU would only be marginally affected. Size matters: around
one fifth of the total manufacturing inputs, imported and domestic, used by the
UK come from the EU, while just 1.5 per cent of the total EU inputs are imported
from the UK.
Given the density of intra-EU linkages and the sizeable share of indirect trade
between the two regions, exporters in both the UK and the EU Member States face
higher costs when indirect trade is taken into account. In other words, indirect
routes entail tariffs that are not perceived by the exporters (as intra-EU trade is
free of tariffs), but account for around 20 per cent of the total costs.
Our analysis bears some important caveats. First, it is a partial equilibrium
analysis: we do not consider any possible trade creation and diversion that might
6It should be noted that the difference between the EU and UK direct tariffs is completelydriven by sectoral composition, since the hypothetical tariff schedule is the same.
7
be induced by EU-UK bilateral tariffs. Secondly the persistence of tariffs between
the two economies is not plausible in the long run: the expectation is that an EU-
UK Free Trade Agreement will eventually be signed. Finally non-tariff barriers
are not considered and are left for further research.
In summary, we are able to compute measures of cost and resistance of trade
flows that take into account and are related to the EU-UK GVC structure, which
may be useful in the negotiations for the future bilateral free trade agreements,
and provide clear evidence of the direct and indirect costs due to Brexit.
The rest of the paper is organized as follows. Section 2 provides a review of
the related literature. Section 3 presents some preliminary evidence on EU-UK
GVCs. Section 4 digs deeper into the bilateral GVC relations, and the sourcing
and selling strategies of the two economies. Section 5 illustrates the construction of
the tariffs and calculates the cumulative impact of bilateral EU-UK tariffs. Section
6 concludes. The Appendices contain additional material.
2 Related literature
We borrow from various strands of the literature. After the seminal contribution
by Leontief (1936), the development of ICIO tables gave new life to input-output
analysis. Koopman et al. (2014) propose a new method for the decomposition
of total gross exports by source and destination of their embedded value added.7
Borin and Mancini (2017) introduce the ‘follow-the-value-added’ methodology that
refines and corrects Koopman et al. (2014) analysis, making possible a proper
investigation of the bilateral, as well as sectoral, dimension of trade flows and an
analysis of a country’s backward and forward linkages within the GVC.
The average tariffs, on intermediate and final goods traded between the EU
and the UK, are based on the methodology developed in Cappariello (2017).8
We compute the indirect costs of tariffs following the works of Miroudot et al.
(2013), Rouzet and Miroudot (2013), and Muradov (2017). The former contri-
bution develops a methodology to compute the accumulated burden of upstream
7Previously Hummels et al. (2001) and Johnson and Noguera (2012) also applied input-outputanalysis to the study of GVCs.
8See also Lawless and Morgenroth (2016).
8
tariffs for a given importer, drawing from standard cost-push analysis in the input-
output literature. It shows that that, given the interdependence between services and goods in international trade, in 2009 almost one third of tariffs levied on goods were in fact applied to value added coming from services embedded in merchan-dise imports. The pervasiveness of the GVC structure implies that, domestically, tariff reductions in one sector generate significant productivity gains in others and, internationally, the benefits of sectoral trade agreements spill over both up- and downstream.9 Using OECD-TiVA input-output tables and tariff data drawn from the UNCTAD-TRAINS database, Rouzet and Miroudot (2013) show that even small tariffs can have a significant impact on trade because of their cumulative effect.
Muradov (2017) provides a framework to compute two new measures (cumula-
tive tariffs at origin and at destination) that proxy the obstacles which a country’s exports face on their path to the user, and are useful to evaluate the indirect effects of free trade agreements on third countries. In the case of the Trans-Pacific Part-
nership (TPP) agreement, the author shows that non-members would reap some benefits because some of their intermediate exports reach the destination markets after being embedded in products of the TPP partners.
Other studies addressed the issue of Brexit by taking into account the exis-tence of EU-UK GVCs, and using different analytical frameworks. Vandenbussche et al. (2017) estimate a gravity model in value added, featuring sector-level input-output production linkages. Pisani and Vergara Caffarelli (2018) develop a dynamic model with tradeable intermediate goods and services (as well as in-termediate non-
tradeable services) calibrated for the euro area and the UK, and assess the effects of alternative tariff scenarios.10
9Cross-sectoral spillovers have by now become a well-known phenomenon, see for instance Carvalho and Voigtlaender (2015).
10Other interesting studies on Brexit are Dhingra et al. (2017) and OECD (2016), which do not explicitly feature GVCs, and Rojas-Romagosa (2016).
9
3 A first look at EU-UK trade: from gross to
value-added statistics
The first step is to investigate11 the bilateral exposure of the UK, the EU and
its Member States (Table B.1).12 Exploiting basic accounting relationships (Leon-
tief, 1936; Johnson and Noguera, 2012), we compare gross and net export shares.
The latter are measured as value added that originated in a certain country (the
exporter in value-added terms) and absorbed in a foreign market (the new ‘im-
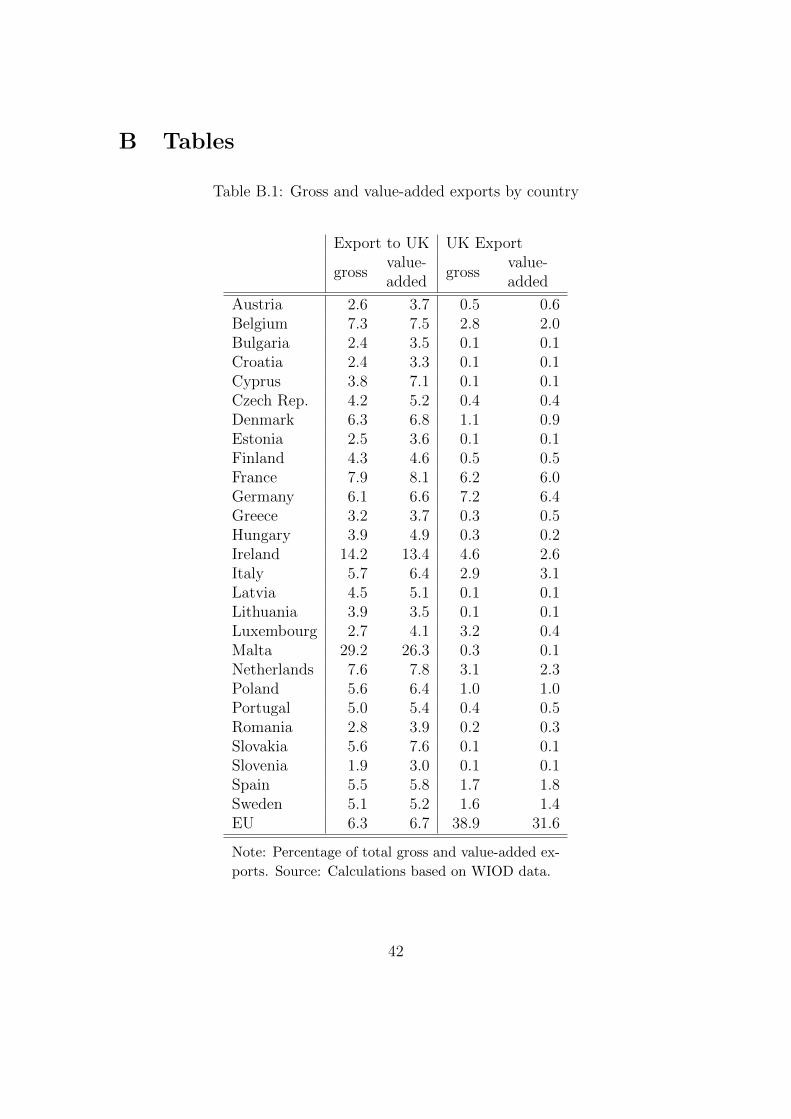
porter’). The UK receives about 6 per cent of EU gross exports, slightly more
in value-added terms. France, Netherlands and Belgium sell between 7 and 8 per
cent of their exports to the UK, while the figure for Germany and Italy is around
6 per cent. The value-added shares of these countries in the UK final demand are
higher by around 0.5 p.p., meaning that the British market activates the EU pro-
ductions more intensively than standard trade statistics might suggest. Malta13
and Ireland are the countries for which the UK market is an extremely significant
export destination, with a gross share of about 29 and 14 per cent respectively
(about 26 and 13 per cent in value added terms). This result might be driven by a
country’s specialisation: Amador et al. (2015) find that Luxembourg and Ireland
have strong ties with the UK, Denmark and Sweden, which can be explained by
common financial services specialisation both in the UK and in Luxembourg, and
by Ireland headquartering many Anglo-Saxon and Nordic multinationals.
Conversely, the overall exposure of the UK to the EU is extremely high, reach-
ing almost 40 per cent in gross terms, (32 per cent in value-added terms; Table
B.1). This discrepancy suggests that the UK value added exported to the EU
might often be re-exported by EU countries to some other market. We will look
further into this aspect when we evaluate the bilateral trade flows and their value-
11The methodology employed in this section is discussed in Appendix A.1.12The countries considered in our analysis are listed in Appendix C.13Malta’s figures seem to be upwardly biased in WIOD data. While WIOD tables are based
on official statistics only, OECD TiVA tables combine official data with firm-level evidence,providing a more reliable assessment of value added trade flows. In this latter ICIO database,the shares for Malta, both in gross and net terms, are lower by around 10 percentage points in2011 with respect to WIOD ones. Unfortunately, the latest available year for TiVA data is 2011.Since our aim is to provide the most up-to-date picture of the EU-UK GVC, we chose to rely onWIOD.
10
added components. The largest UK export destinations are Germany, France and
Ireland with shares of around 5 per cent, whereas in the case of Ireland the share
almost halves once it is corrected for value added. Hence market size and proximity
seem to be important in the selection of the destination of UK exports.
In a world of increasing production fragmentation across country borders, in-
terconnectedness should not only be seen in terms of trade flows but also from the
perspective of reciprocal production dependency. Using the ICIO framework we
can examine to what extent a specific country’s production depends on imported
inputs from other countries.14 The dependency of the EU economy on inputs from
the UK is relatively small (about 1 per cent, 2 if we consider exports instead of
total production; Table B.2). High dependency is found for Luxembourg (16 per
cent in total, 18 for exports), Malta (8 and 10 per cent, respectively) and Ireland
(about 6 per cent for both). On the contrary, the UK’s dependency on the EU
economy is sizeable, about 7 per cent in total production and 10 per cent for ex-
ports. The largest values are attained by imports from Germany (about 2 per
cent), France and the Netherlands (about 1.5 per cent), and Italy, Ireland and
Belgium (slightly less than 1 per cent).
This analysis, however, cannot quantify the actual share of trade due to the
presence of GVCs, nor can it disentangle the indirect flows of goods and services
between the two economies, which is the subject of the next section.
4 The EU-UK Global Value Chains: insights from
bilateral exports
To gauge a better understanding of EU-UK trade it is important to uncover the
share of the export flows between EU countries and the UK that is related to GVC
activities. Following Borin and Mancini (2017), GVC-related trade is defined as
goods and services crossing more than one border, in the spirit of the definition
proposed by Hummels et al. (2001). The rationale is that GVC schemes must
involve at least two production stages located in different countries before the
14Production dependency is calculated as the imports coming from a particular country em-bedded in total production.
11
final good or service reaches the destination market (intermediate goods crossing
just one border are not part of GVC-trade).
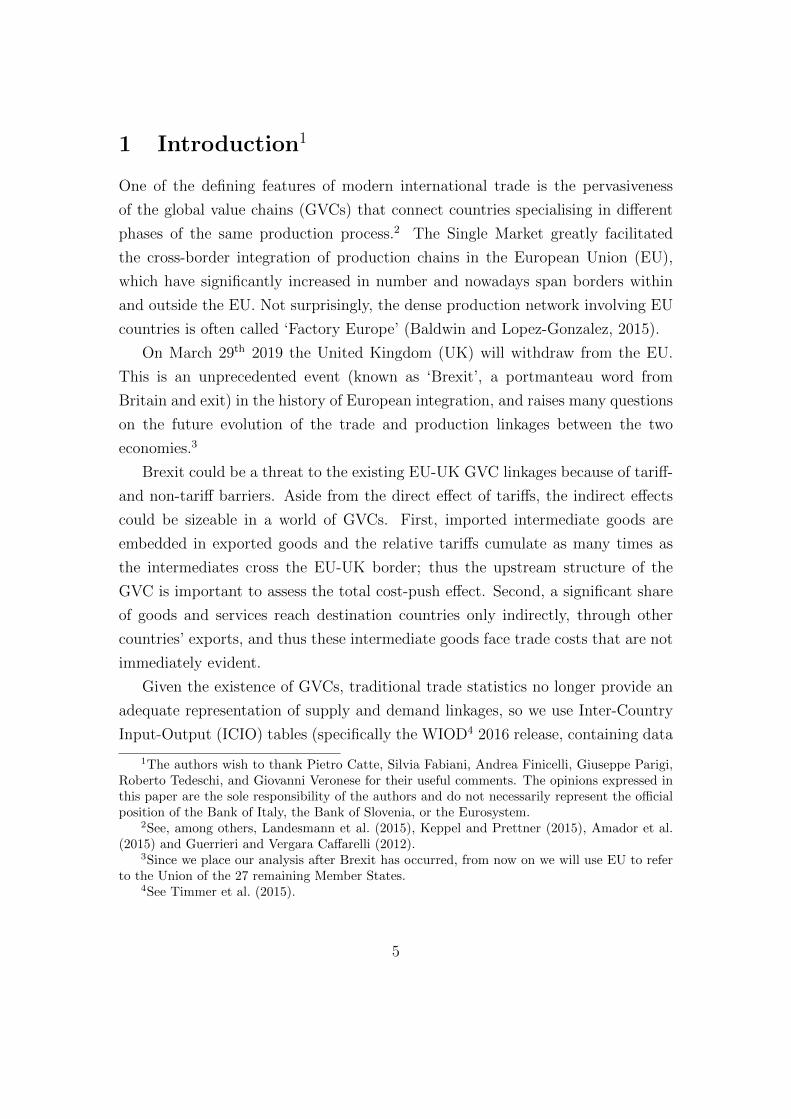
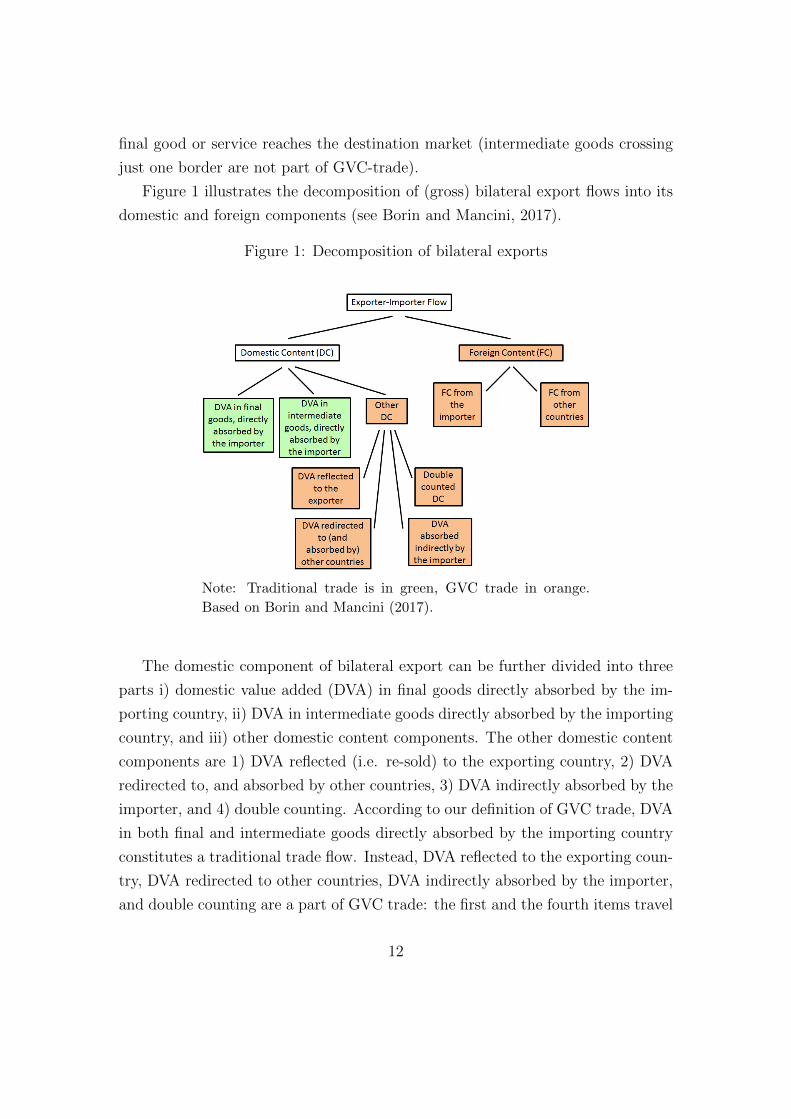
Figure 1 illustrates the decomposition of (gross) bilateral export flows into its
domestic and foreign components (see Borin and Mancini, 2017).
Figure 1: Decomposition of bilateral exports
Note: Traditional trade is in green, GVC trade in orange.
Based on Borin and Mancini (2017).
The domestic component of bilateral export can be further divided into three
parts i) domestic value added (DVA) in final goods directly absorbed by the im-
porting country, ii) DVA in intermediate goods directly absorbed by the importing
country, and iii) other domestic content components. The other domestic content
components are 1) DVA reflected (i.e. re-sold) to the exporting country, 2) DVA
redirected to, and absorbed by other countries, 3) DVA indirectly absorbed by the
importer, and 4) double counting. According to our definition of GVC trade, DVA
in both final and intermediate goods directly absorbed by the importing country
constitutes a traditional trade flow. Instead, DVA reflected to the exporting coun-
try, DVA redirected to other countries, DVA indirectly absorbed by the importer,
and double counting are a part of GVC trade: the first and the fourth items travel
12
back and forth across the exporter-importer border,15 whereas the second and
the third items pass both the exporter-importer border and the one between the
importer and a third country.
The foreign component of bilateral export flows is divided into two parts de-
pending on its origin, from the importer and from other countries, and both belong
to GVC trade.
Since our focus is on the EU as a whole, and not on single member countries,
we exclude all the intra-EU borders, and compute the GVC trade as defined above.
It turns out that the share of EU exports to the UK related to GVCs is about 35
per cent (40 per cent for UK exports to the EU). Thus, even without considering
intra-EU borders, more than one third of the trade flows between the EU area and
UK still consists of goods and services that cross at least two borders (the Channel
and some other extra-EU border, or the Channel at least twice).
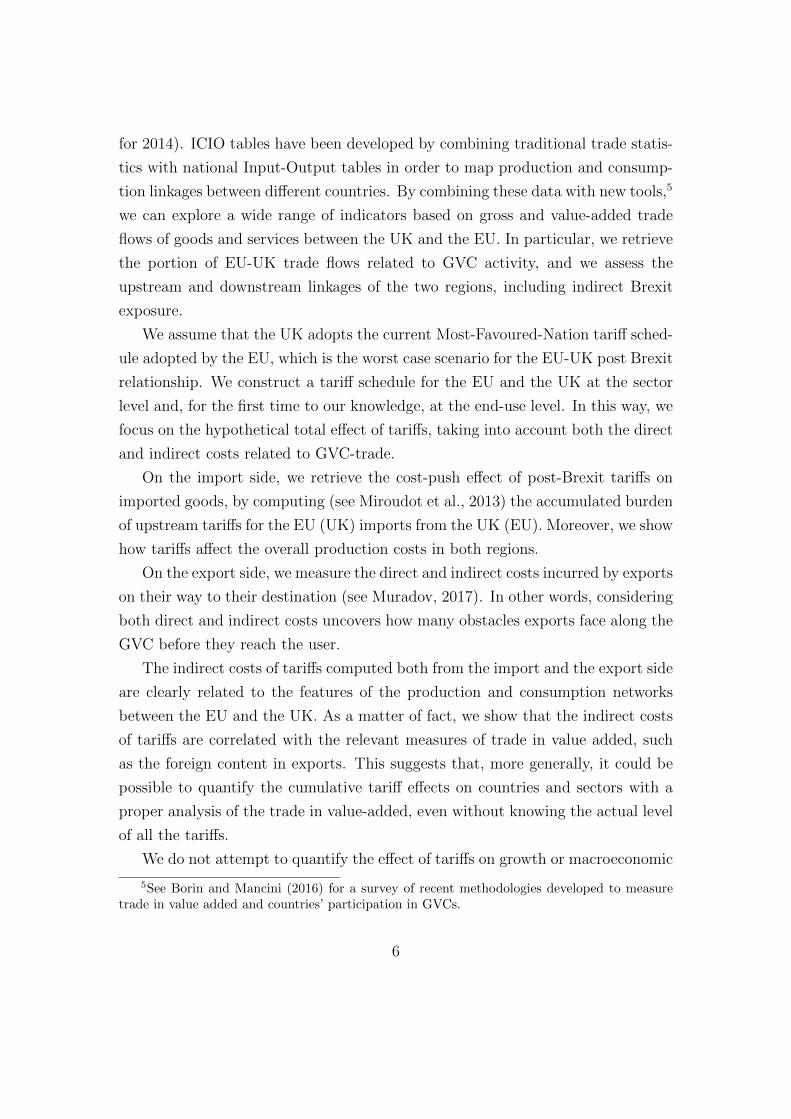
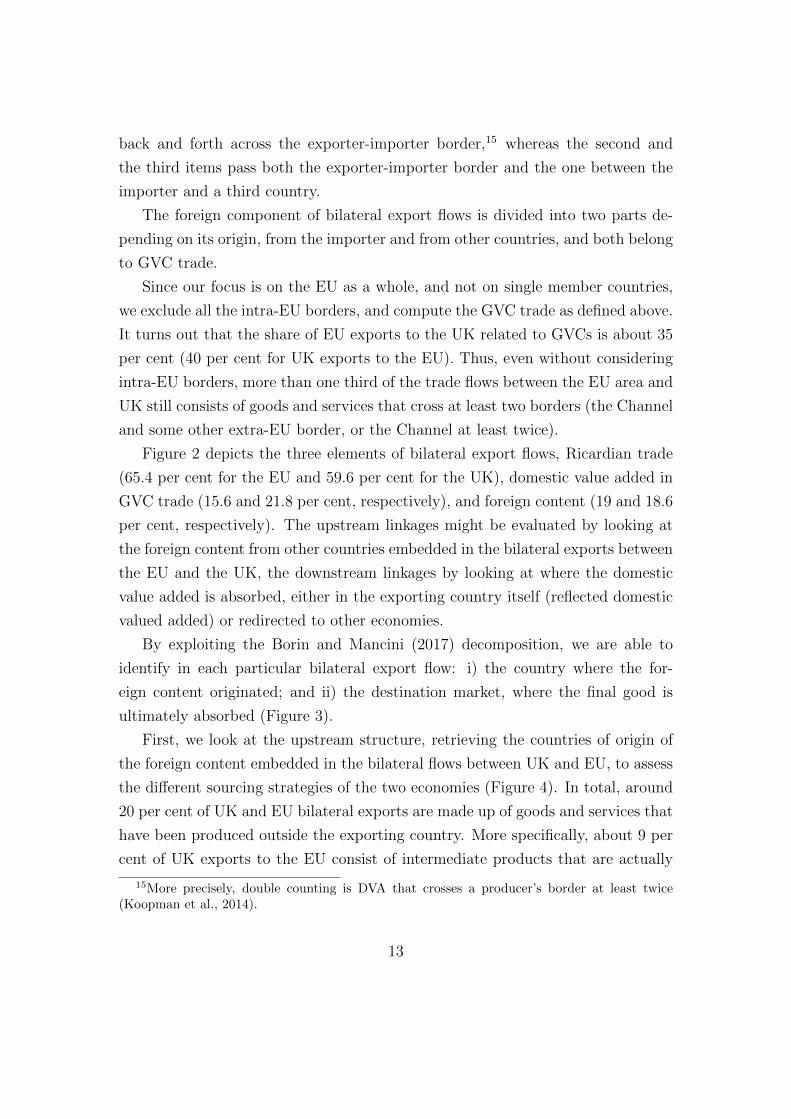
Figure 2 depicts the three elements of bilateral export flows, Ricardian trade
(65.4 per cent for the EU and 59.6 per cent for the UK), domestic value added in
GVC trade (15.6 and 21.8 per cent, respectively), and foreign content (19 and 18.6
per cent, respectively). The upstream linkages might be evaluated by looking at
the foreign content from other countries embedded in the bilateral exports between
the EU and the UK, the downstream linkages by looking at where the domestic
value added is absorbed, either in the exporting country itself (reflected domestic
valued added) or redirected to other economies.
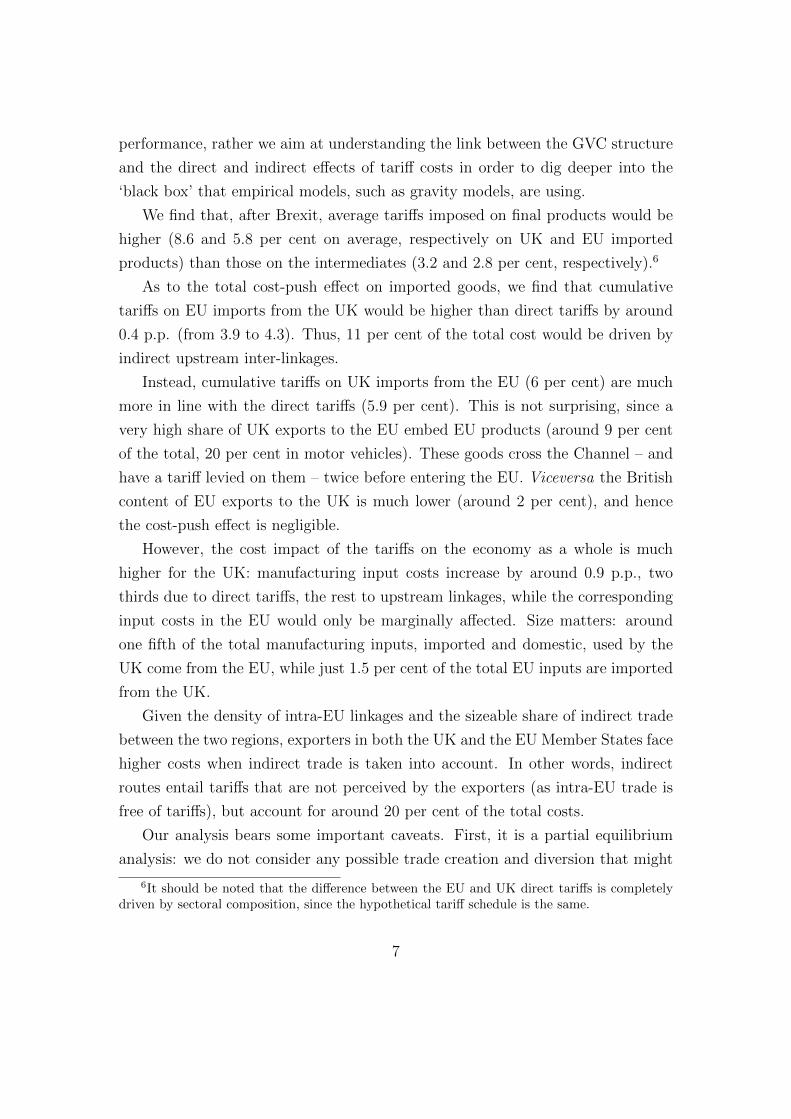
By exploiting the Borin and Mancini (2017) decomposition, we are able to
identify in each particular bilateral export flow: i) the country where the for-
eign content originated; and ii) the destination market, where the final good is
ultimately absorbed (Figure 3).
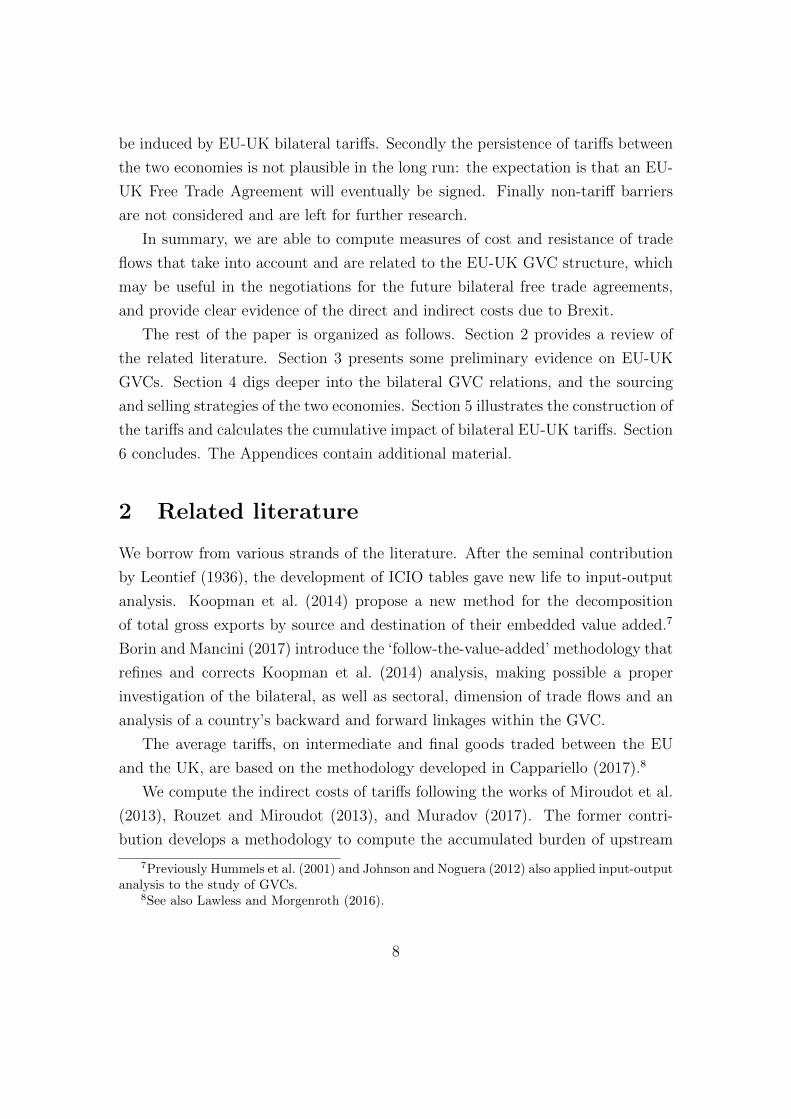
First, we look at the upstream structure, retrieving the countries of origin of
the foreign content embedded in the bilateral flows between UK and EU, to assess
the different sourcing strategies of the two economies (Figure 4). In total, around
20 per cent of UK and EU bilateral exports are made up of goods and services that
have been produced outside the exporting country. More specifically, about 9 per
cent of UK exports to the EU consist of intermediate products that are actually
15More precisely, double counting is DVA that crosses a producer’s border at least twice(Koopman et al., 2014).
13
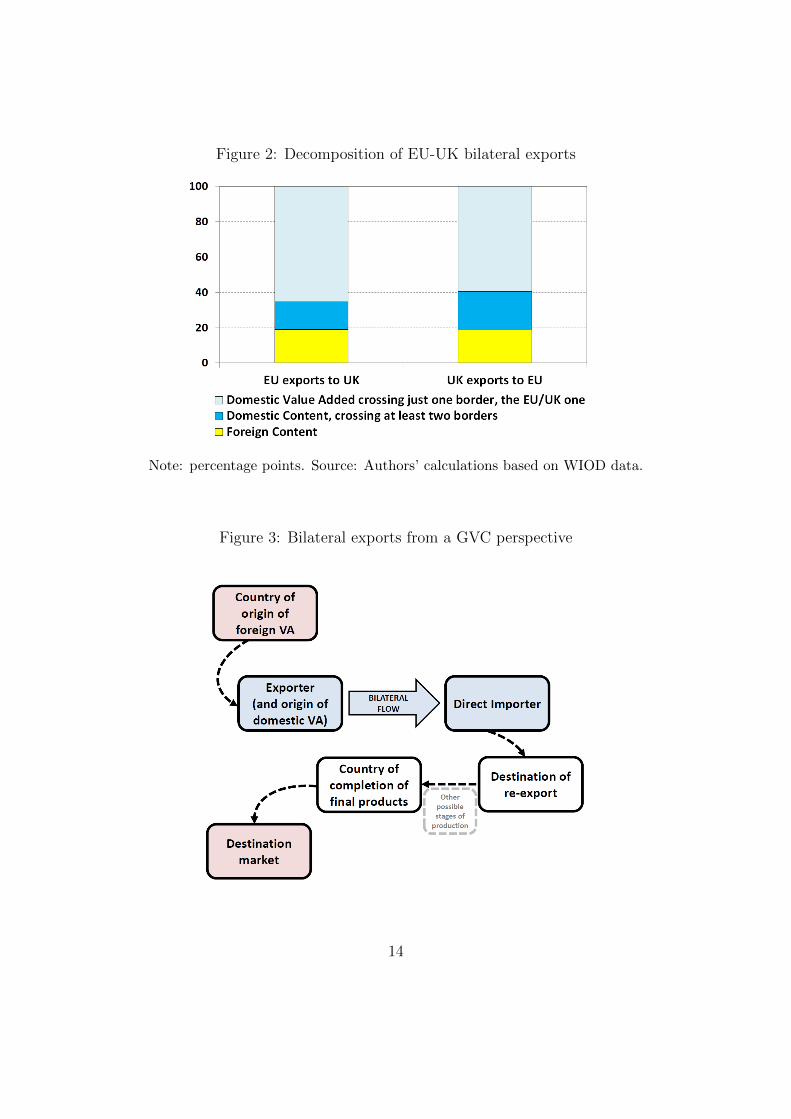
Figure 2: Decomposition of EU-UK bilateral exports
Note: percentage points. Source: Authors’ calculations based on WIOD data.
Figure 3: Bilateral exports from a GVC perspective
14
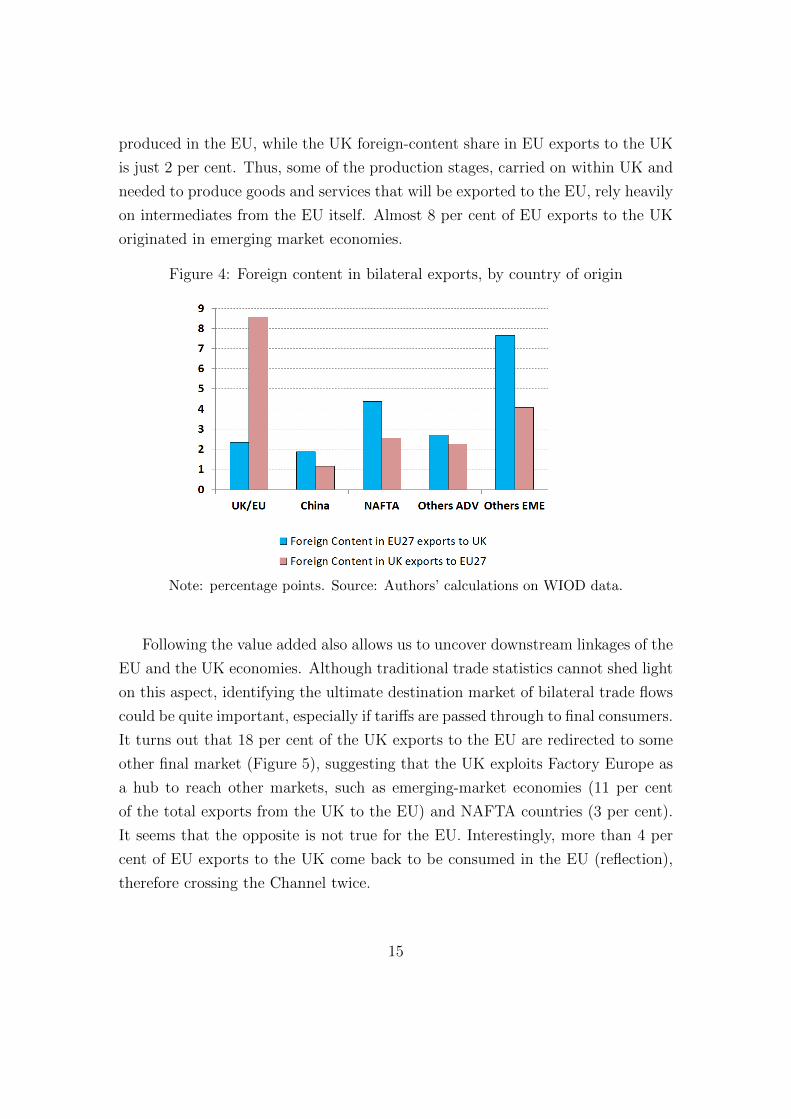
produced in the EU, while the UK foreign-content share in EU exports to the UK
is just 2 per cent. Thus, some of the production stages, carried on within UK and
needed to produce goods and services that will be exported to the EU, rely heavily
on intermediates from the EU itself. Almost 8 per cent of EU exports to the UK
originated in emerging market economies.
Figure 4: Foreign content in bilateral exports, by country of origin
Note: percentage points. Source: Authors’ calculations on WIOD data.
Following the value added also allows us to uncover downstream linkages of the
EU and the UK economies. Although traditional trade statistics cannot shed light
on this aspect, identifying the ultimate destination market of bilateral trade flows
could be quite important, especially if tariffs are passed through to final consumers.
It turns out that 18 per cent of the UK exports to the EU are redirected to some
other final market (Figure 5), suggesting that the UK exploits Factory Europe as
a hub to reach other markets, such as emerging-market economies (11 per cent
of the total exports from the UK to the EU) and NAFTA countries (3 per cent).
It seems that the opposite is not true for the EU. Interestingly, more than 4 per
cent of EU exports to the UK come back to be consumed in the EU (reflection),
therefore crossing the Channel twice.
15
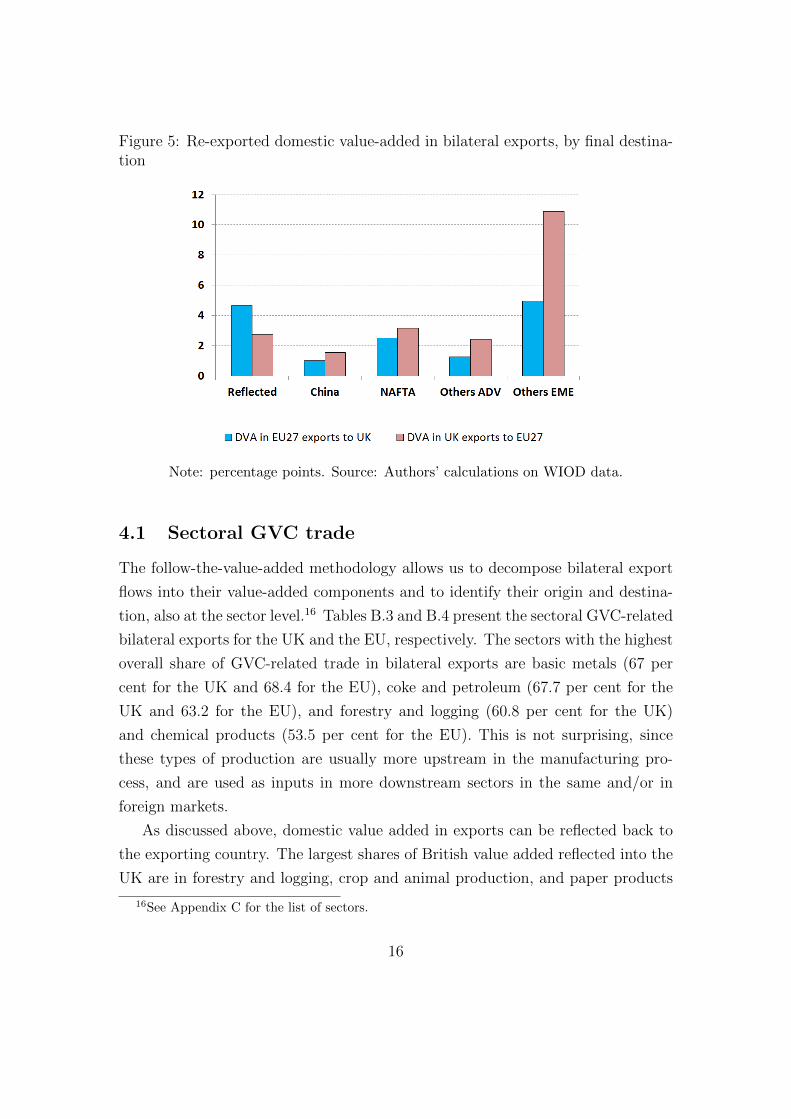
Figure 5: Re-exported domestic value-added in bilateral exports, by final destina-tion
Note: percentage points. Source: Authors’ calculations on WIOD data.
4.1 Sectoral GVC trade
The follow-the-value-added methodology allows us to decompose bilateral export
flows into their value-added components and to identify their origin and destina-
tion, also at the sector level.16 Tables B.3 and B.4 present the sectoral GVC-related
bilateral exports for the UK and the EU, respectively. The sectors with the highest
overall share of GVC-related trade in bilateral exports are basic metals (67 per
cent for the UK and 68.4 for the EU), coke and petroleum (67.7 per cent for the
UK and 63.2 for the EU), and forestry and logging (60.8 per cent for the UK)
and chemical products (53.5 per cent for the EU). This is not surprising, since
these types of production are usually more upstream in the manufacturing pro-
cess, and are used as inputs in more downstream sectors in the same and/or in
foreign markets.
As discussed above, domestic value added in exports can be reflected back to
the exporting country. The largest shares of British value added reflected into the
UK are in forestry and logging, crop and animal production, and paper products
16See Appendix C for the list of sectors.
16
(8.8, 6.9, and 4.9 per cent respectively), whose share of domestic value added are
30.6, 24.8 and 23.1 per cent, respectively (Table B.3). EU value added exported
to the UK and then reflected back to the EU is highest in basic metals, chemical
products, and mining and quarrying (11, 9.6 and 8.5 per cent, respectively), which
are also the sectors with the largest domestic content (Table B.4).
We can also obtain some insight regarding the upstream structure of these
sectoral trade flows by looking at the other region’s value added in the bilateral
export flows. For the EU the top sectors in terms of UK value-added content in
exports to the UK are crop and animal production, food products, and coke and
petroleum (5.7, 4.3 and 3.8 per cent, respectively), while computer and optical
products, one of the sectors with the highest foreign content has a share of just 1.9
per cent of UK value added (Table B.4). The first three sectors combined constitute
21.6 per cent of European exports to the UK. For the UK, the share of EU value-
added content in the bilateral exports to the EU is much higher. Interestingly,
the UK sectoral exports to the EU that contain the largest shares of European
value added are motor vehicles, chemical products, and basic metals (20.4, 17.8,
and 14.9 per cent, respectively; Table B.3). These three sectors account for 27.8
per cent of British exports to the EU. In section 5 we will show that this evidence
relates to the accumulated burden of upstream tariffs for a given importing sector.
In particular, these goods cross the Channel twice and thus are subject to post-
Brexit tariffs more than once.
4.2 UK and Factory Europe: intra-EU trade
In Table B.5 we show how UK goods and services reach the EU countries as final
markets. On average, around 75 per cent of UK value-added is delivered to a given
EU country directly. However, around 18 per cent is first exported to some other
economy in Factory Europe, and it only reaches the destination market after some
processing stages. There is a high level of heterogeneity: while the indirect trade
to EA-3 countries (Germany, France and Italy) is in line with the average, more
than one third of UK products destined for Austria and Eastern EU countries
(in particular Slovakia, Slovenia and, to a lesser extent, Romania) reaches those
countries indirectly, embedded in the exports of other Factory Europe economies.
17
Let us now consider how EU countries’ value added reaches the UK. The in-
direct trade is still substantial, around 17 per cent (Table B.5). Not surprisingly,
Ireland delivers the vast majority of its goods and services to the UK in a direct
way, and Malta shows a very low degree of indirect trade too. Again, some Eastern
EU economies, such as Slovenia, Romania and the Czech Republic take advantage
of the EU network to process their products and reach the UK.
Table B.6 presents direct and indirect trade between the UK and the EU Mem-
ber States as a share of GDP. This shows what part of the exporter’s GDP is acti-
vated directly or indirectly by the demand of the importing country, and indicates
the trade exposure in the event of a hard Brexit. The overall exposure to the UK
is highest for Malta, Ireland, the Netherlands, and Slovakia (12.4, 7.5, 3.4 and 3.3
per cent respectively); this is due to the large direct exposure of these countries to
UK demand (12, 7, 2.6 and 2.6 per cent, respectively). Interestingly for Cyprus
the indirect exposure (1.1 per cent) is higher than the direct one (1 per cent); other
countries with high indirect exposures are Luxembourg, the Czech Republic, the
Netherlands, and Hungary (1.0, 0.8, 0.7, 0.7 per cent, respectively). Conversely,
the UK is mostly exposed to the demand in Germany, France, Italy, and Ireland
(1.4, 1.3, 0.7, and 0.6 per cent, respectively), mainly through direct trade linkages.
In section 5, we will relate these results to a measure of indirect obstacles that
EU and UK products have to face to reach their destinations. In fact, since EU
and UK products are embedded in other Factory Europe countries’ exports, they
will indirectly face a trade cost that is not immediately evident.
5 The impact of tariffs on the EU-UK GVCs
In the previous sections we highlighted some of the features of GVC-trade between
the EU and the UK. Here we investigate the impact of tariffs.
We first compute the hypothetical tariff schedule that will be in place after
Brexit: this is the traditional manner in which the trade cost of Brexit has been
evaluated (Cappariello, 2017; Lawless and Morgenroth, 2016), which we innovate
by distinguishing tariffs according to the end-use of the goods (final or intermedi-
ate). Then we show how the network structure of trade flows and the interconnec-
tions between the two regions would affect the post-Brexit accumulation of trade
18
costs on intermediate goods, i.e. the indirect tariffs due to the presence of GVC-
trade, on top of the direct tariffs. In this way we are able to extend traditional
analyses on trade costs of Brexit, explicitly taking into account two features of
GVC- trade flows: a) exported intermediate goods embed imported intermediates
and their relative tariffs; and b) a significant share of goods and services reach
destination countries only indirectly, through other countries’ exports, and thus
are subject to tariffs that are not immediately evident. We apply two different
methodologies, developed in the literature by Rouzet and Miroudot (2013) and
Muradov (2017), respectively.
Rouzet and Miroudot (2013) compute the ‘cumulative tariff’ (i.e. the accumu-
lated burden of upstream tariffs for a given importer), which quantifies the total
cost-push effect of direct and indirect tariffs, taking into account the upstream
GVC structure (in section 5.2 we compute the cumulative tariff on post-Brexit
tariffs on EU-UK trade).17
Instead, Muradov (2017) stresses the importance of indirect bilateral trade
flows and proposes two alternative measures to account for the related costs, the
cumulative tariff at origin and at destination. If we consider any given country pair,
exports originating in the first country (called the producer) can take many possible
paths to reach the second (the user): the producer can export directly to the user
or can do it indirectly, i.e. its exports can reach the user by being embedded
in third countries’ exports to the latter. The cumulative tariff at origin traces
the direct and indirect cost levied on exports as soon as they leave the producer.
Conversely, cumulative tariff at destination traces the direct and indirect costs of
the producer’s exports upon entry into the user country. Differently from Rouzet
and Miroudot (2013), these measures cannot be interpreted as cost-push effects
such as the cumulative tariff, but as a proxy of the relative resistance of trade
flows, since they measure the direct and indirect costs that an exported product
has to face on its path from the producer to the user (see section 5.3).
Our first step is to compute the post-Brexit tariffs.
17See also Johnson (2017) for an up-to-date review of the cost-push effect of trade costs.
19
5.1 Post-Brexit tariffs
In order to estimate the average tariffs that would affect both the consumers and
the producers in each EU Member State and in the UK after Brexit, we construct
a tariff schedule for the EU and the UK at the sector level and, for the first
time to our knowledge, at the end-use level. We assume that following Brexit
the UK adopts the current EU tariffs; in other words, the trade tariffs that the
EU currently applies to countries with which there is no free trade agreement will
be applied between the EU and the UK (as well as between the UK and other
third countries).18 These are the Most-Favoured-Nation tariffs (MFN). We are
therefore considering the worst case scenario in terms of the post-Brexit EU-UK
relationship. Indeed, if a free trade agreement is struck, tariffs on bilateral trade
will be lower, potentially even zero.
Tariffs are public information. Yet the calculation of average tariffs is far from
straightforward and is described in Appendix A.2. Table B.7 (Table B.8) lists the
average bilateral tariffs that, according to our estimates, would be applied to the
EU (UK) imports from the UK (EU) at the sector level, with the detail for final
use and intermediates. Given the product composition of bilateral trade in 2014
(latest available year of the WIOD ICIO tables), the average duty imposed by
the UK on goods imported from the EU would be 5.9 per cent whereas the duty
imposed by the EU on British goods would be 3.9 per cent. As expected, the
duties imposed on final products would be higher (8.6 and 5.8 per cent on average
respectively on UK and EU imported products) than those on the intermediates
(3.2 and 2.8 per cent).
The high discrepancy in tariff rates between final and intermediate use even
within the same industry confirms the importance of taking into account all the
stages of the global value chain for the calculation of the impact of potential EU-
UK tariffs along the production linkages.
Tables B.7 and B.8 also show that the EU imports a relatively high share of
intermediate inputs from the UK: almost 63 per cent of the value of imports from
the UK is constituted by goods subsequently processed in the EU economies –
18This is consistent with the joint letter to the WTO members from the EU and the UKof 11th October 2017 in which the UK stated that it ‘intends to replicate as far as possible itsobligations under the current commitments of the EU.’
20
especially chemical, mining and metal products (Table B.7). On the contrary, the
British economy imports relatively more final goods, mainly motor vehicles and
food products, from the EU. Indeed, half of the value of total imports from the
EU is given by final goods (Table B.8).
Tariffs can also be aggregated at the country level by using sectoral import
shares. Tables B.9 and B.10 present the average tariffs for intermediate, final and
total bilateral imports for the UK and the EU Member States. There is a very high
cross-country variability that is driven by the underlying sectoral specialisation of
each country.19 Moreover tariffs on final goods are higher and even more variable
than those on intermediate goods.
5.2 Import-side analysis: the cost-push effect of tariffs
In this section we compute the cumulative tariffs that EU and UK imports would
have to face after Brexit, comparing the results with the direct tariffs. Moreover,
we show how tariffs affect the overall production costs in the two regions.20
In Figure 6 we show a graphical representation of the cumulative tariff by
Rouzet and Miroudot (2013). In this simplified scheme, there are only four coun-
tries: E (last exporter), M (importer), TC1 and TC2 (third countries). Country M
imports a unit of a good, paying the direct tariff tE,M . However, the last exporter
(E), in order to produce exports, has sourced inputs from M itself and from third
countries TC1 and TC2, paying the corresponding tariffs. In turn, these three
countries have already paid tariffs embedded in their export flows, and this pro-
cess could be iterated even further upstream. Thus, imports to country M embed
direct tariffs tE,M , and all the indirect tariffs incurred in the upstream value chain,
weighted by the amount of imports needed to produce exports. Then, we obtain
the share of the indirect costs levied on a particular import flow as the ratio be-
tween the indirect costs and total cost-push effect, which also takes into account
19We refer the interested reader to Cappariello (2017), who presents a more detailed analysisof average country tariffs.
20Owing to the changing nature of GVCs we also performed this analysis with the ICIO datafor 2000, provided by the WIOD. The results are basically unchanged, indicating that withinEurope the GVCs are pretty stable. This is consistent with the history of GVCs in Europe thatdeveloped in the 1990’s, when Eastern European countries entered into Transition (Guerrieri andVergara Caffarelli, 2012).
21
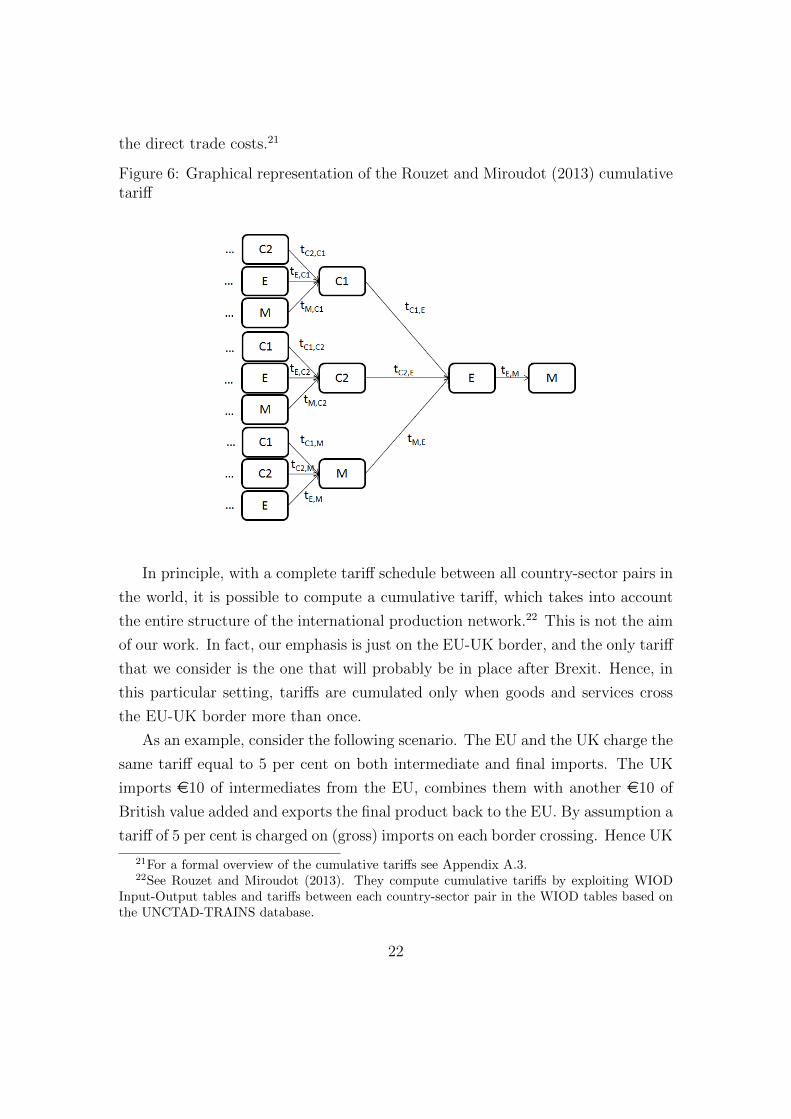
the direct trade costs.21
Figure 6: Graphical representation of the Rouzet and Miroudot (2013) cumulativetariff
In principle, with a complete tariff schedule between all country-sector pairs in
the world, it is possible to compute a cumulative tariff, which takes into account
the entire structure of the international production network.22 This is not the aim
of our work. In fact, our emphasis is just on the EU-UK border, and the only tariff
that we consider is the one that will probably be in place after Brexit. Hence, in
this particular setting, tariffs are cumulated only when goods and services cross
the EU-UK border more than once.
As an example, consider the following scenario. The EU and the UK charge the
same tariff equal to 5 per cent on both intermediate and final imports. The UK
imports e10 of intermediates from the EU, combines them with another e10 of
British value added and exports the final product back to the EU. By assumption a
tariff of 5 per cent is charged on (gross) imports on each border crossing. Hence UK
21For a formal overview of the cumulative tariffs see Appendix A.3.22See Rouzet and Miroudot (2013). They compute cumulative tariffs by exploiting WIOD
Input-Output tables and tariffs between each country-sector pair in the WIOD tables based onthe UNCTAD-TRAINS database.
22
producers pay e10.5 for the EU intermediate goods. If the UK producer passes-
through the tariff entirely, the export price of the final goods is e20.5. The EU
then charges a 5 per cent tariff and the EU consumer consequently pays e21.525
for the imported final good, as opposed to the no-tariff price of e20. Hence a 5
per cent tariff on both intermediate and final imports implies a price increase for
the final consumer equal to 7.625 per cent. Had there been no GVC relationship
between the EU and the UK (i.e., if the final good was 100 per cent British value
added) the impact of tariffs would have been just 5 per cent (i.e. the EU tariff on
final imports from the UK). This is the tariff magnification effect of back-and-forth
trade.
There is only one case in which there is no tariff magnification effect: this
occurs if UK producers fully absorb import tariffs into their profits, and do not
pass them through. In this case the export price of the final good from the UK
to the EU would be e20 (as in the no-tariff scenario) and the final price e21.
Yet UK firms’ profits would be reduced by 5 per cent. Since firms’ behaviour
and, in particular, their pricing strategy is a complex issue that falls beyond the
scope of this preliminary investigation, we assume that both European and British
firms fully pass tariffs through into prices, since in a Leontief framework firms are
price setters. This is also consistent with our partial-equilibrium approach and the
nature of this study as an impact assessment exercise.23
We are now ready to compute the cumulative tariffs induced by the new post-
Brexit tariffs, given the existing EU-UK GVC as mapped in the WIOD.
Tables B.11 and B.12 show the cumulative tariffs on EU and UK merchandise
imports by sector, respectively. The cost increase of EU imports from the UK
turns out to be sizeable: while the average direct tariff is 3.88 per cent, the total
cost-push effect is 4.3 per cent (Table B.11). Thus, all else being equal, around
10.8 per cent of the total cost-increase of EU imports after Brexit is due to indirect
backward inter-linkages.
Sectoral heterogeneity is substantial. The total cost of EU imports of interme-
diate goods in the motor-vehicle and chemical sectors, which account for around 20
23In the longer run firms will consider the existence of tariffs in their sourcing decisions andmay consequently restructure their GVCs, substituting suppliers across the Channel with otherslocated in third countries.
23
per cent of total imports of intermediate goods from the UK, increases by around
1 p.p., and the indirect effect accounts for around 16 per cent of the total increase.
Traditional EU sectors seem less affected: indirect tariffs on food and textiles ac-
count for less than 0.45 p.p. of total cost-increase. In two sectors, mining and
paper products, direct tariffs on intermediate goods, both for EU and UK im-
ports, are almost zero, and the total costs are almost entirely due to the indirect
backward linkages.
In turn, the indirect cost increase of UK imports would be small: the difference
between direct and total tariffs is just 0.07 p.p. (Table B.12).
The total cost increase is purely indirect for the service sectors (Table B.13).
Despite direct tariffs being absent by definition, service producers pay tariffs on
imported intermediate goods. Again, the cost increase is on average around 0.1
p.p. for EU imports of services and even smaller for UK imports.
In Table B.14 we show the direct and indirect cost increase for different EU
member countries. As regards the UK, only the cost of the imports from Ireland
seems to be higher due to indirect backward linkages (by around 0.33 p.p.). In-
stead, indirect costs on EU imports from the UK are higher on average, and range
from 0.53 p.p. for Austria to 0.35 p.p. for Denmark.
The magnification of direct costs measured as cumulative tariffs is clearly re-
lated to backward participation in the regional value chain. The higher indirect
cost for EU importers is due to the fact that the EU exploits the UK to perform
some processing stages and imports back these products. In this way, these in-
termediate goods cross the Channel twice, and thus have tariffs levied on them
both directly, the first time that the goods are imported by the UK, and indirectly,
once the goods are embedded in UK products imported by the EU. A proxy of this
back-and-forth trade between the two regions is offered by the UK (EU) foreign
value added in the bilateral exports to the EU (UK), seen in section 4, which is
positively correlated with the indirect cost-push effect at the sectoral level (Figure
7). This evidence suggests that if these tariffs are levied on EU imports after
Brexit, the subsequent cost increase might induce some EU producers to divert
exports from the UK to other EU countries, in order to perform these processing
stages within Factory Europe.
We can also compute the magnification effect on the trade flows with third
24
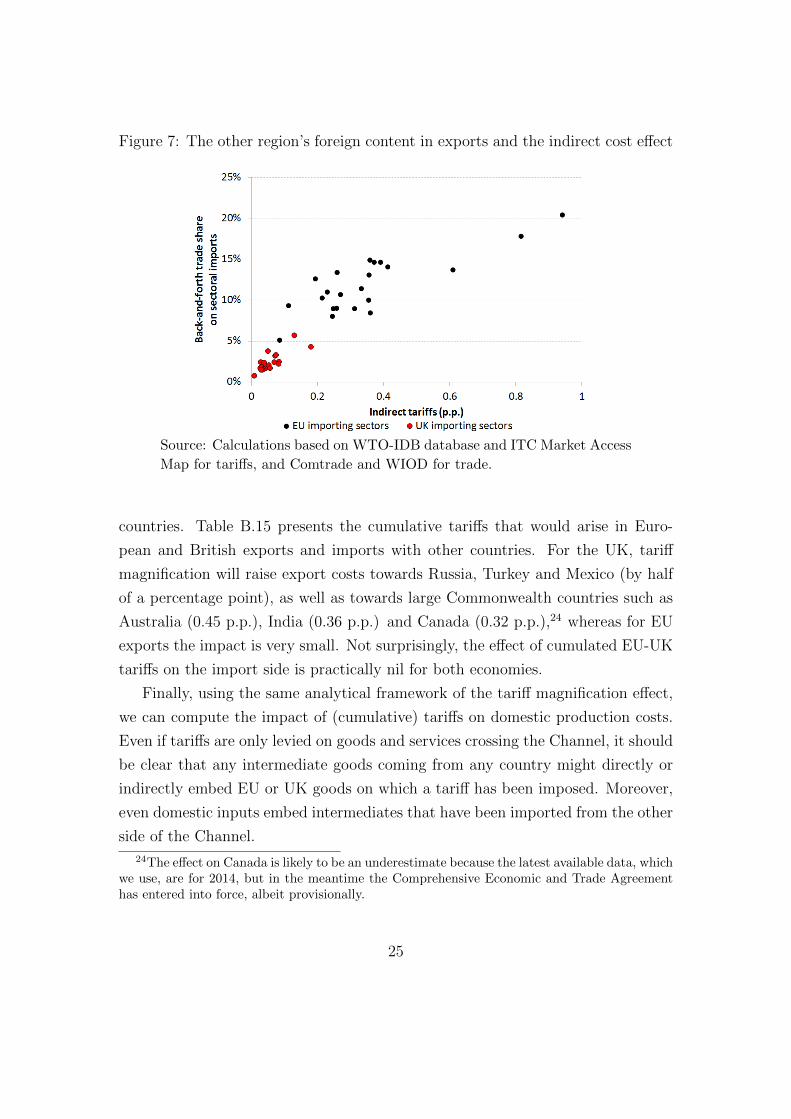
Figure 7: The other region’s foreign content in exports and the indirect cost effect
Source: Calculations based on WTO-IDB database and ITC Market Access
Map for tariffs, and Comtrade and WIOD for trade.
countries. Table B.15 presents the cumulative tariffs that would arise in Euro-
pean and British exports and imports with other countries. For the UK, tariff
magnification will raise export costs towards Russia, Turkey and Mexico (by half
of a percentage point), as well as towards large Commonwealth countries such as
Australia (0.45 p.p.), India (0.36 p.p.) and Canada (0.32 p.p.),24 whereas for EU
exports the impact is very small. Not surprisingly, the effect of cumulated EU-UK
tariffs on the import side is practically nil for both economies.
Finally, using the same analytical framework of the tariff magnification effect,
we can compute the impact of (cumulative) tariffs on domestic production costs.
Even if tariffs are only levied on goods and services crossing the Channel, it should
be clear that any intermediate goods coming from any country might directly or
indirectly embed EU or UK goods on which a tariff has been imposed. Moreover,
even domestic inputs embed intermediates that have been imported from the other
side of the Channel.
24The effect on Canada is likely to be an underestimate because the latest available data, whichwe use, are for 2014, but in the meantime the Comprehensive Economic and Trade Agreementhas entered into force, albeit provisionally.
25
In Table B.16 we show, for every country, the total cost increase of its manu-
facturing inputs, regardless of their origin.25 It turns out that in the UK the cost
of manufacturing inputs increases by almost 0.9 p.p. when domestic and global
value chains are taken into account, while the direct effect of tariffs is around 0.6
p.p. Instead, the overall impact on EU costs would be 0.08 p.p. However, the
cost-increase is very varied across EU countries, and particularly high for Ireland
(around 1 p.p.). These results are not surprising: around one fifth of the total
manufacturing inputs, imported and domestic, used by the UK come from the
EU, while just 1.5 per cent of the total EU inputs are imported from the UK. In
other words, size matters, and this is true also at the sectoral level (Table B.17).
5.3 Export-side analysis: the cumulative resistance of ex-
port flows
In order to complement the analysis on the effect of post-Brexit tariffs, let us now
adopt a totally different perspective, i.e. that of the exporter. In this section we
will try to answer the following question: What obstacles will exports face on their
way to their destination? Here we aim at investigating this issue from the point
of view of both the EU and the UK; we will concentrate on bilateral direct and
indirect export flows, and consider the effect of tariffs on the EU-UK border after
Brexit.
In this context, we consider the ‘full’ bilateral relations between EU Member
States and the UK by computing the cumulative tariffs at both the origin and the
destination, as developed by Muradov (2017),26 which allows us to obtain an index
of the resistance of trade flows, defined as the sum of direct and indirect costs that
an exported product has to face on its path from the producer to the user. The
intuition is very clear: in a GVC world one country’s exports reach another both
directly and indirectly, embedded in other country’s exports (possibly more than
one); in a traditional, ‘Ricardian’ world, trade is just direct. Then, comparing
direct and indirect costs determines how much additional resistance exports face
25If we hold the hypothesis of a full pass-through of tariffs to be true, these figures for thecost increases are actual increases in the producers’ prices.
26See Muradov (2017) for a formal derivation of these measures.
26
along the GVC to reach their destination.
The logic behind this exercise is simple. Final or intermediate demand in the
UK activates both direct and indirect exports from the EU. Direct exports directly
satisfy the demand in the UK. Indirect exports are parts and components supplied
to the (last) exporter in the UK. The opposite happens to EU exports. As noted
in section 4.2, the high degree of interconnectedness within Factory Europe makes
it worth investigating indirect as well as direct exports.
In our specific context we are interested in the impact of EU-UK bilateral tariffs,
as these will be the only changes in the tariff structure after Brexit.27 In particular
no tariff will be introduced within the Single Market and the transactions affected
by the new tariffs will just be those involving the UK, on the one side, and any
EU Member State, on the other.
Hence British exporters will face the new tariffs as soon as their goods leave the
UK, while European exporters will face the new tariffs only when their goods enter
the UK. Consequently, when we focus on the British exports to the EU we will
compute the cumulative tariffs at the origin, while we will compute the cumulative
tariffs at the destination for the EU exports to the UK.
5.3.1 Resistance (at origin) of UK exports
Figure 8 provides an illustration of the typical flow of UK exports to a given
EU Member State. In order to record the tariffs levied on British intermediate
goods used by a given EU Member State (MS1), our analysis focuses on the UK
and the perspective is forward-looking. The key point is that indirect tariffs on
intermediate goods that will end up in MS1 are applied as soon as inputs leave the
UK. Apart from the direct tariff (tUK,MS1), the indirect tariffs (tUK,MS2, tUK,MS3)
increase the resistance that these intermediates have to face to be delivered to
MS1. Note that no new tariff is applied to British exports to third countries, for
instance to TC1.
In Table B.18 we show the current dollar values of both direct and indirect
tariffs at origin for British exports to the EU Member States.
27It may be that the tariffs the UK faces vis-a-vis third countries change as well, but weabstract from that.
27
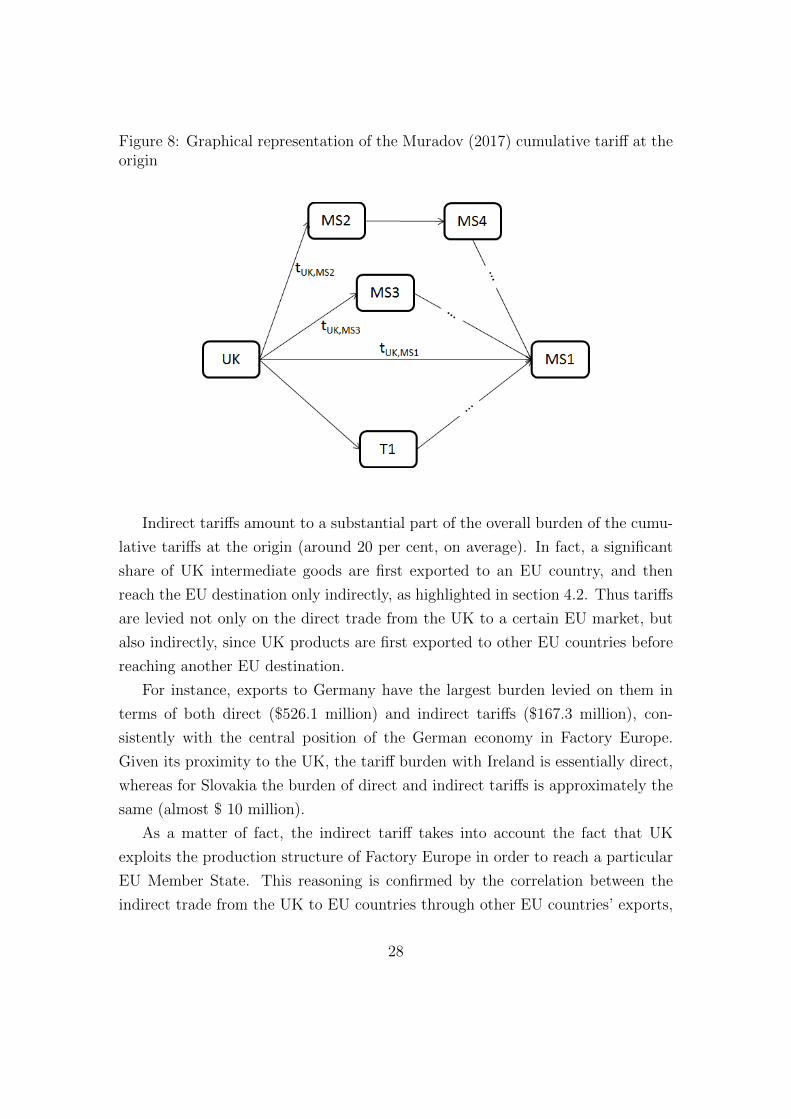
Figure 8: Graphical representation of the Muradov (2017) cumulative tariff at theorigin
Indirect tariffs amount to a substantial part of the overall burden of the cumu-
lative tariffs at the origin (around 20 per cent, on average). In fact, a significant
share of UK intermediate goods are first exported to an EU country, and then
reach the EU destination only indirectly, as highlighted in section 4.2. Thus tariffs
are levied not only on the direct trade from the UK to a certain EU market, but
also indirectly, since UK products are first exported to other EU countries before
reaching another EU destination.
For instance, exports to Germany have the largest burden levied on them in
terms of both direct ($526.1 million) and indirect tariffs ($167.3 million), con-
sistently with the central position of the German economy in Factory Europe.
Given its proximity to the UK, the tariff burden with Ireland is essentially direct,
whereas for Slovakia the burden of direct and indirect tariffs is approximately the
same (almost $ 10 million).
As a matter of fact, the indirect tariff takes into account the fact that UK
exploits the production structure of Factory Europe in order to reach a particular
EU Member State. This reasoning is confirmed by the correlation between the
indirect trade from the UK to EU countries through other EU countries’ exports,
28
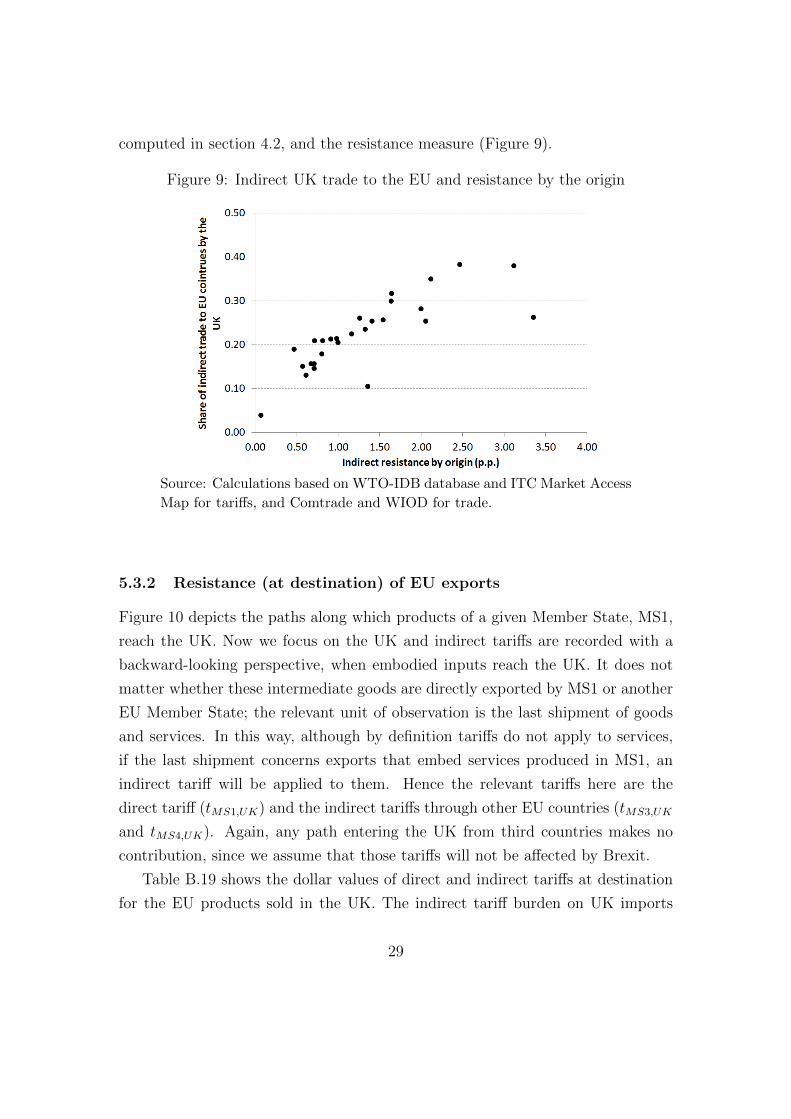
computed in section 4.2, and the resistance measure (Figure 9).
Figure 9: Indirect UK trade to the EU and resistance by the origin
Source: Calculations based on WTO-IDB database and ITC Market Access
Map for tariffs, and Comtrade and WIOD for trade.
5.3.2 Resistance (at destination) of EU exports
Figure 10 depicts the paths along which products of a given Member State, MS1,
reach the UK. Now we focus on the UK and indirect tariffs are recorded with a
backward-looking perspective, when embodied inputs reach the UK. It does not
matter whether these intermediate goods are directly exported by MS1 or another
EU Member State; the relevant unit of observation is the last shipment of goods
and services. In this way, although by definition tariffs do not apply to services,
if the last shipment concerns exports that embed services produced in MS1, an
indirect tariff will be applied to them. Hence the relevant tariffs here are the
direct tariff (tMS1,UK) and the indirect tariffs through other EU countries (tMS3,UK
and tMS4,UK). Again, any path entering the UK from third countries makes no
contribution, since we assume that those tariffs will not be affected by Brexit.
Table B.19 shows the dollar values of direct and indirect tariffs at destination
for the EU products sold in the UK. The indirect tariff burden on UK imports
29
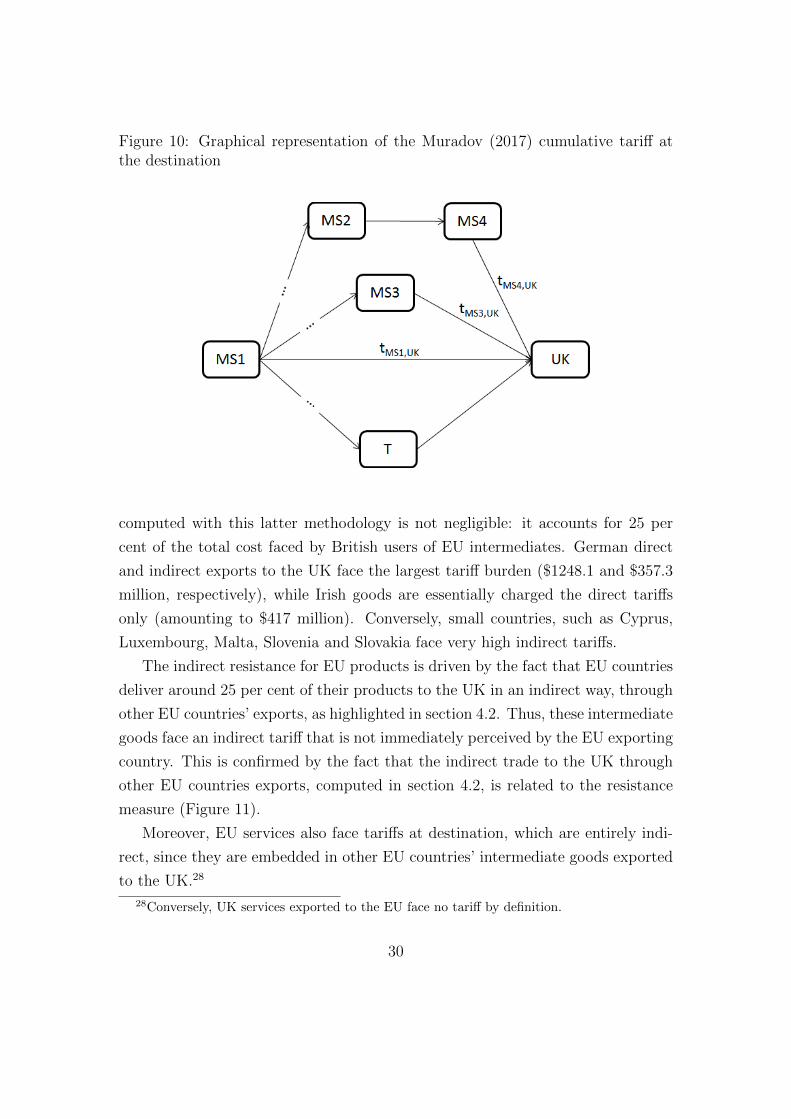
Figure 10: Graphical representation of the Muradov (2017) cumulative tariff atthe destination
computed with this latter methodology is not negligible: it accounts for 25 per
cent of the total cost faced by British users of EU intermediates. German direct
and indirect exports to the UK face the largest tariff burden ($1248.1 and $357.3
million, respectively), while Irish goods are essentially charged the direct tariffs
only (amounting to $417 million). Conversely, small countries, such as Cyprus,
Luxembourg, Malta, Slovenia and Slovakia face very high indirect tariffs.
The indirect resistance for EU products is driven by the fact that EU countries
deliver around 25 per cent of their products to the UK in an indirect way, through
other EU countries’ exports, as highlighted in section 4.2. Thus, these intermediate
goods face an indirect tariff that is not immediately perceived by the EU exporting
country. This is confirmed by the fact that the indirect trade to the UK through
other EU countries exports, computed in section 4.2, is related to the resistance
measure (Figure 11).
Moreover, EU services also face tariffs at destination, which are entirely indi-
rect, since they are embedded in other EU countries’ intermediate goods exported
to the UK.28
28Conversely, UK services exported to the EU face no tariff by definition.
30
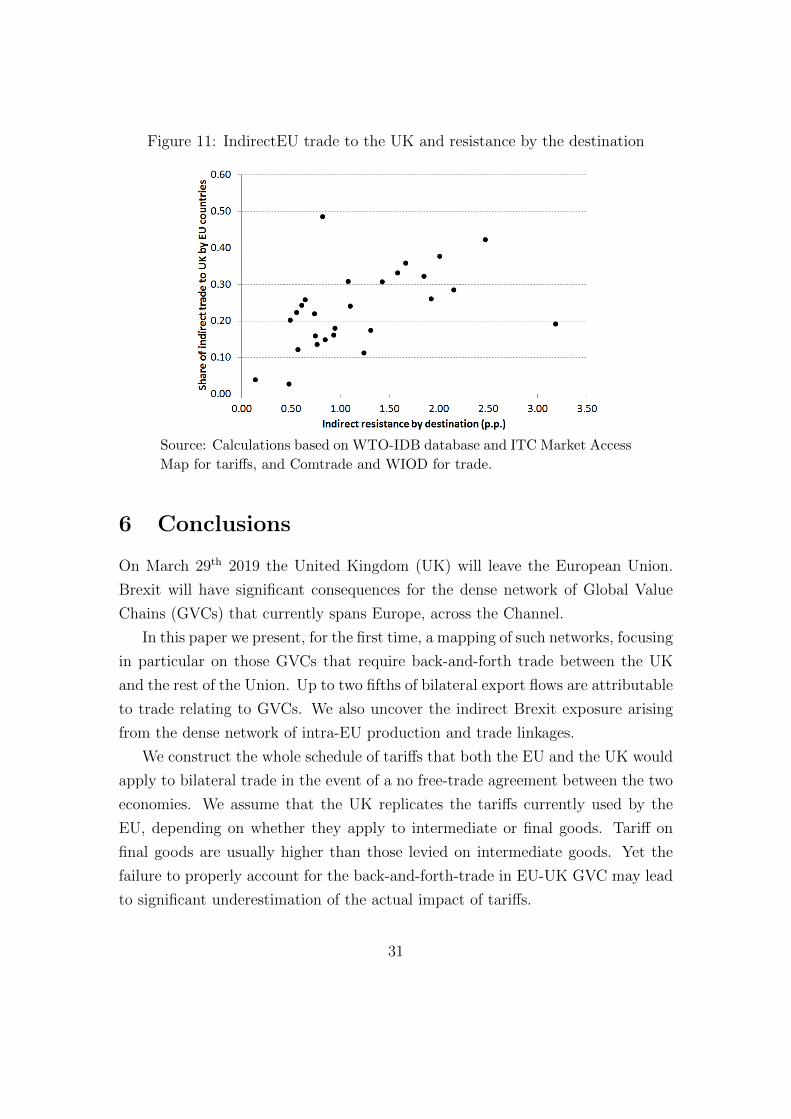
Figure 11: IndirectEU trade to the UK and resistance by the destination
Source: Calculations based on WTO-IDB database and ITC Market Access
Map for tariffs, and Comtrade and WIOD for trade.
6 Conclusions
On March 29th 2019 the United Kingdom (UK) will leave the European Union.
Brexit will have significant consequences for the dense network of Global Value
Chains (GVCs) that currently spans Europe, across the Channel.
In this paper we present, for the first time, a mapping of such networks, focusing
in particular on those GVCs that require back-and-forth trade between the UK
and the rest of the Union. Up to two fifths of bilateral export flows are attributable
to trade relating to GVCs. We also uncover the indirect Brexit exposure arising
from the dense network of intra-EU production and trade linkages.
We construct the whole schedule of tariffs that both the EU and the UK would
apply to bilateral trade in the event of a no free-trade agreement between the two
economies. We assume that the UK replicates the tariffs currently used by the
EU, depending on whether they apply to intermediate or final goods. Tariff on
final goods are usually higher than those levied on intermediate goods. Yet the
failure to properly account for the back-and-forth-trade in EU-UK GVC may lead
to significant underestimation of the actual impact of tariffs.
31
We compute various indicators of the impact of the indirect tariffs that span
from the more traditional cost-push effect to indices of resistance for exporters.
Our aim is to provide policymakers with a measure of cost and resistance of trade
flows that takes into account the whole EU-UK GVCs structure, in order to clarify
the impact of barriers to trade in the negotiations on the future bilateral free trade
agreement.
All in all, the total cost-push effect is much higher for the UK, as manufacturing
input costs increase by around 0.9 p.p. The corresponding input costs in the EU
would be only marginally affected (0.1 p.p). This result is due to the specific
links between the two regions: around one fifth of the total manufacturing inputs,
imported and domestic, used by the UK come from the EU, while only 1.5 per
cent of the total EU inputs are imported from the UK.
As to the import side, the total tariff would be higher for UK imports from
the EU than for EU imports from the UK by around 2 p.p., even taking into
account GVCs. However, tariff magnification due to GVCs appears significant
just for the European firms. This result is to a large extent due to the fact that
the EU exploits the UK to perform some processing stages and imports back these
intermediate products with the subsequent amplification of the tariff burden. In
the longer run this could induce trade diversion away from the UK (the effect is
small for services).
As to the export side, given the density of intra-EU linkages and the sizeable
share of indirect trade between the two regions, exporters in both the UK and the
EU Member States face higher costs when indirect trade is taken into account. In
other words, the export path towards the destination matters, and indirect routes
entail tariffs that are not perceived by the exporters (as intra-EU trade is free of
tariffs), but account for around 20 per cent of the total costs.
More generally, the methodology used in this paper is not Brexit-specific and
it can be applied to any type of tariff; obviously we expect that the magnification
effect will be higher, the larger the number of borders on which tariffs will be
imposed.
Our analysis has some limitations. Firstly, we adopt a partial equilibrium
approach and consequently exclude any trade creation and diversion potentially
triggered by EU-UK bilateral tariffs. Secondly, it is an impact assessment exercise:
32

in the long run we expect that an EU-UK Free Trade Agreement will be signed
and tariffs will return substantially to zero. Finally it only concentrates on tariff
barriers.
33
References
Amador, J., R. Cappariello, and R. Stehrer (2015): “Global Value
Chains: A View from the Euro Area,” Asian Economic Journal, 29, 99–120.
Baldwin, R. and J. Lopez-Gonzalez (2015): “Supply-chain Trade: A Por-
trait of Global Patterns and Several Testable Hypotheses,” The World Economy,
38, 1682–1721.
Borin, A. and M. Mancini (2016): “Participation in Global Value Chains:
Measurement Issues and the Place of Italy,” Rivista di Politica Economica, VII-
IX.
——— (2017): “Follow the Value Added: Tracking Bilateral Relations in Global
Value Chains,” MPRA Paper 82692, University Library of Munich, Germany.
Cappariello, R. (2017): “Brexit: estimating tariff costs for EU countries in a
new trade regime with the UK,” Questioni di Economia e Finanza (Occasional
Papers) 381, Bank of Italy, Directorate General for Economics, Statistics and
Research.
Carvalho, V. M. and N. Voigtlaender (2015): “Input Diffusion and the
Evolution of Production Networks,” CEPR Discussion Papers 10498, C.E.P.R.
Discussion Papers.
Dhingra, S., H. Huang, G. Ottaviano, J. Paulo Pessoa, T. Sampson,
and J. Van Reenen (2017): “The costs and benefits of leaving the EU: trade
effects,” Economic Policy, 32, 651–705.
Guerrieri, P. and F. Vergara Caffarelli (2012): “Trade Openness and
International Fragmentation of Production in the European Union: The New
Divide?” Review of International Economics, 20, 535–551.
Hummels, D., J. Ishii, and K.-M. Yi (2001): “The nature and growth of
vertical specialization in world trade,” Journal of International Economics, 54,
75 – 96, trade and Wages.
34
Johnson, R. C. (2017): “Measuring Global Value Chains,” NBER Working
Papers 24027, National Bureau of Economic Research, Inc.
Johnson, R. C. and G. Noguera (2012): “Accounting for intermediates: Pro-
duction sharing and trade in value added,” Journal of International Economics,
86, 224 – 236.
Keppel, C. and K. Prettner (2015): “How interdependent are Eastern Euro-
pean economies and the Euro area?” The Quarterly Review of Economics and
Finance, 58, 18 – 31.
Koopman, R., Z. Wang, and S.-J. Wei (2014): “Tracing Value-Added and
Double Counting in Gross Exports,” American Economic Review, 104, 459–94.
Landesmann, M., S. Leitner, and R. Stehrer (2015): “Competitiveness of
the European economy,” EIB Working Papers 2015/01, European Investment
Bank (EIB).
Lawless, M. and E. L. Morgenroth (2016): “The Product and Sector Level
impact of a hard Brexit across the EU,” Tech. rep., ESRI Working paper.
Leontief, W. W. (1936): “Quantitative Input and Output Relations in the Eco-
nomic Systems of the United States,” The Review of Economics and Statistics,
18, 105–125.
Miroudot, S., D. Rouzet, and F. Spinelli (2013): “Trade Policy Implica-
tions of Global Value Chains: Case Studies,” OECD Trade Policy Papers 161,
OECD Publishing.
Muradov, K. (2017): “Trade costs and borders in global value chains,” Review
of World Economics (Weltwirtschaftliches Archiv), 153, 487–509.
OECD (2016): “The Economic Consequences of Brexit: A Taxing Decision,”
Economic Policy Papers 16, OECD.
Pisani, M. and F. Vergara Caffarelli (2018): “What will Brexit mean
for the British and euro-area economies? A model-based assessment of trade
35
regimes,” Temi di discussione (Economic working papers) 1163, Bank of Italy,
Directorate General for Economics, Statistics and Research.
Rojas-Romagosa, H. (2016): “Trade effects of Brexit for the Netherlands,” CPB
Background Document June 2016, CPB - Netherlands Bureau for Economic
Policy Analysis.
Rouzet, D. and S. Miroudot (2013): “The Cumulative Impact of Trade Bar-
riers Along The Value Chain: An Empirical Assessment Using the OECD Inter-
Country Input-Output Model’,” in 16th Annual Conference on Global Economic
Analysis.
Timmer, M. P., E. Dietzenbacher, B. Los, R. Stehrer, and G. J.
de Vries (2015): “An Illustrated User Guide to the World InputOutput
Database: the Case of Global Automotive Production,” Review of International
Economics, 23, 575–605.
Vandenbussche, H., W. Connell, and W. Simons (2017): “Global Value
Chains, Trade Shocks And Jobs: An Application to Brexit,” Discussion paper
DP12303, Centre for Economic Policy Research.
36

A Methodology
A.1 A primer on input-output
The analysis presented in section 3 exploits the basic accounting relationship of the Input-Output framework. In the inter-country Input-Output framework with M countries and N sectors, one can assume that a gross output of a country s is either absorbed in the form of intermediate consumption (C) or final-good consumption (Y ):
Xs = Cµ+ Y ν =M∑r
csr +M∑r
ysr, (1)
where Xs is an N × 1 vector of gross output produced by N sectors in country
s, C is a N ×NM matrix of intermediate consumption according to country and
sector of absorption, Y represents a N×M matrix of final consumption by country,
and µ and ν are NM × 1 and Mx1 vectors of ones respectively.
By dividing each country’s intermediate consumption by its total gross product
we can obtain an NM × NM matrix of direct input-output (I-O) coefficients A,
where an individual N × N block, Asr, represents country r’s production depen-
dency on inputs provided by sectors in country s. More specifically, the individual
element of each block, a(si, rj) = c(si, rj)/Xrj , expresses the proportion of the
total output of a sector j in country r, produced with inputs provided by sector i
in country s. Using a matrix of direct I-O coefficients we can re-express equation
1 as:
X = AX + Y (2)
Following Leontief’s (1936) seminal work, the solution for equation 2 is the
Leontief inverse (B), which represents both direct and indirect output generated
in different stages of production to meet an additional unit of final consumption:
X = (I − A)−1Y = BY (3)
The starting point of the trade in value-added analysis is the augmentation
37
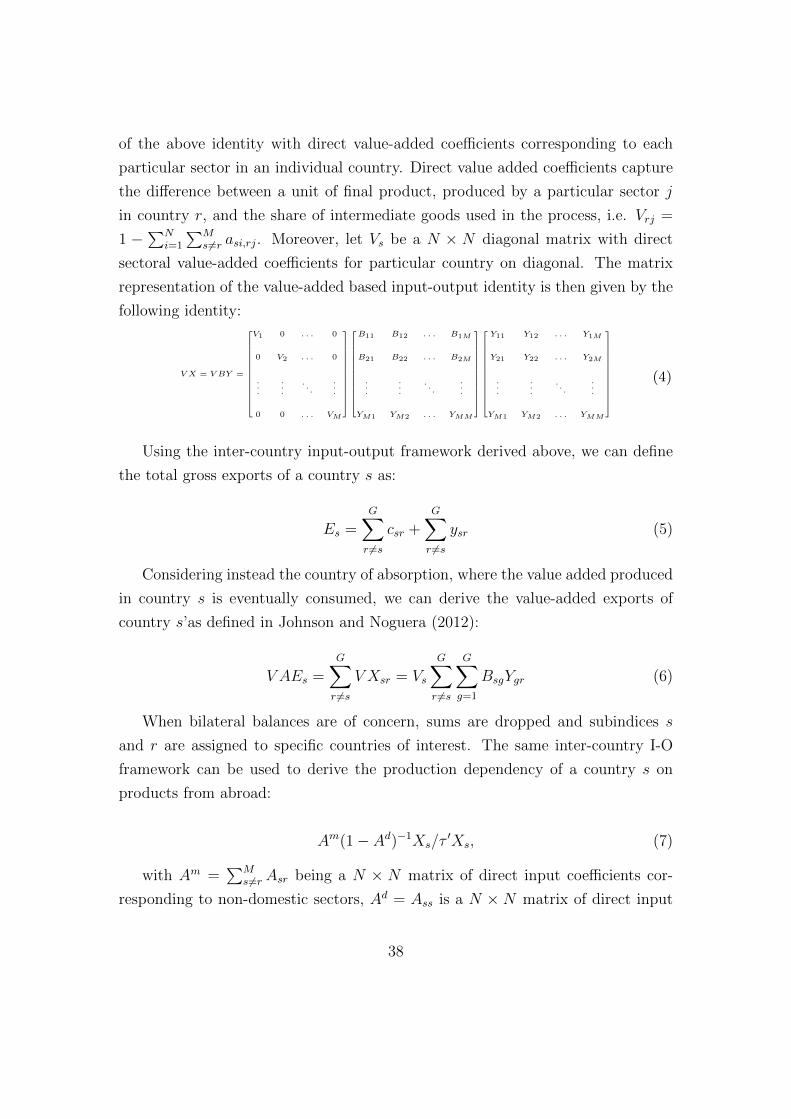
of the above identity with direct value-added coefficients corresponding to each
particular sector in an individual country. Direct value added coefficients capture
the difference between a unit of final product, produced by a particular sector j
in country r, and the share of intermediate goods used in the process, i.e. Vrj =
1 −∑N
i=1
∑Ms6=r asi,rj. Moreover, let Vs be a N × N diagonal matrix with direct
sectoral value-added coefficients for particular country on diagonal. The matrix
representation of the value-added based input-output identity is then given by the
following identity:
V X = V BY =
V1 0 . . . 0
0 V2 . . . 0
.
.
.
.
.
.. . .
.
.
.
0 0 . . . VM
B11 B12 . . . B1M
B21 B22 . . . B2M
.
.
.
.
.
.. . .
.
.
.
YM1 YM2 . . . YMM
Y11 Y12 . . . Y1M
Y21 Y22 . . . Y2M
.
.
.
.
.
.. . .
.
.
.
YM1 YM2 . . . YMM
(4)
Using the inter-country input-output framework derived above, we can define
the total gross exports of a country s as:
Es =G∑r 6=s
csr +G∑r 6=s
ysr (5)
Considering instead the country of absorption, where the value added produced
in country s is eventually consumed, we can derive the value-added exports of
country s’as defined in Johnson and Noguera (2012):
V AEs =G∑r 6=s
V Xsr = Vs
G∑r 6=s
G∑g=1
BsgYgr (6)
When bilateral balances are of concern, sums are dropped and subindices s
and r are assigned to specific countries of interest. The same inter-country I-O
framework can be used to derive the production dependency of a country s on
products from abroad:
Am(1 − Ad)−1Xs/τ′Xs, (7)
with Am =∑M
s6=r Asr being a N × N matrix of direct input coefficients cor-
responding to non-domestic sectors, Ad = Ass is a N × N matrix of direct input
38
coefficients corresponding to domestic sectors, and τ is a N × 1 vector of ones. By
replacing the vector of gross output X, corresponding to the sectoral production
of country s, with the vector of sectoral gross exports E, we obtain the import
content of export as proposed by Hummels et al. (2001):
Am(1 − Ad)−1Es/τ′Es (8)
A.2 Calculation of post-Brexit tariffs
Building on Cappariello (2017), in this study we use data on the EU’s applied
MFN tariffs at the product level from the IDB-WTO database. This data source
provides the ad-valorem tariffs (i.e. charged as a percentage of the value of the
imported good) for over 5,000 product lines (defined according to the Harmonised
System Nomenclature at 6-digit level, HS6).
However, a number of products, mostly produced in the food and live animals
industry and accounting for about 6 per cent of the overall value of UK imports
from the EU27, are subject to trade barriers different from tariffs expressed in
terms of prices, such as quantity or weight-based tariffs or tariff rate quotas.29 We
have consequently integrated IDB- WTO data with information drawn from the
International Trade Centre Market Access Map (ITC MAP), where the burden
of these trade barriers has been converted into a common metric. More precisely
this latter data set provides the ad-valorem-equivalent tariffs imposed on products
charged with weight-based tariffs and, in the case of products with tariff rate
quotas levied on them, information on tariffs applied to quantities both below and
above the quota.30
After having constructed the (very long) vector of tariffs, two more steps have
been implemented.
First, the tariff rate for each product at the HS6 level has been classified ac-
cording to the end-use of that product, final or intermediate, by using the Broad
29In this case, imports below a specified quantity are charged at a lower tariff (the InsideQuota Tariff Rate, IQTR) and imports above that quantity at a higher one (the Outside QuotaTariff Rate, OQTR).
30In the case of quotas, we utilise the IQTR under the assumption that the fill rate is lowerthan the quota, and the quota is not binding.
39
Economic Category Classification. Second, by combining these tariff data with
UN Comtrade data on trade flows in 2014, the average MFN tariffs for the 22
manufacturing sectors in WIOD – for both intermediate and final use – have been
calculated by utilising product-level import values as weights.
In general this method suffers from an endogeneity bias, as the import values
serving as weights depend on the tariffs themselves. That is, a high tariff rate
for a given product may reduce the import value for that product, lowering the
tariff rates contribution to the average tariff that is supposed to reflect the overall
protection level of the product group. A low tariff produces the opposite effect.
Yet, this critique does not apply to our case, because the import flows are pre-tariff
(in 2014 the UK was still a member of the EU and hence no tariffs were levied on
EU-UK trade).
A.3 Cumulative tariffs
Consider an import flow in sector i from country e to country m and assume that
a direct tariff t(e,i),m is paid by country m at the last border. All the backward
production linkages must then be taken into account to compute the cumulative
tariff. Producers in the exporting country e paid tariffs on the imported interme-
diate goods used to produce exports. The amount of foreign intermediate goods
embedded in exports is retrieved by the matrix of technical coefficients A. Each
element measures the share of input from a country-sector pair needed to produce
one unit of output in another country-sector pair. In other words, each supplier g
in sector s provides a(g,s),(e,i) unit of intermediate goods to country e to produce
one unit of sector i goods. Thus, the exporter in country-sector (e, i) has paid a
tariff on the imported intermediate goods:
∑g,s
a(g,s),(e,i)t(g,s),e (9)
We can go further upstream and compute the tariffs paid by the g countries
for the imports used to produce the exports destined for country e, that is:
∑g,s,j,u
a(g,s),(e,i)a(j,u),(g,s)t(j,u),g (10)
40
At this stage, the cumulative tariff on country m is:
t(e,i),m +∑g,s
a(g,s),(e,i)t(g,s),e +∑g,s,j,u
a(g,s),(e,i)a(j,u),(g,s)t(j,u),g (11)
The total cumulative tariff paid on an import flow along the entire backward
production chain is obtained by iterating this process to infinity. In practice, all
the direct and indirect uses of foreign intermediate goods in the production of one
unit of imports are taken into account by the global Leontief inverse, B, that is
limn→∞
An = (I − A)−1 = B. (12)
Thus, the cumulative cost of trade barriers on intermediate goods is hence
defined as the sum of direct tariffs at the last border and direct and of the indirect
tariffs on intermediate goods needed to produce this import flow, as follows:31
CTinterm = Tinterm + (e(A ◦ Tinterm)B)′ e (13)
where Tinterm is the tariff matrix for intermediate goods, A is the matrix of technical
coefficients, e a conformable row vector of ones; B the global Leontief inverse
matrix, and ◦ indicates the Hadamard (or element-by-element) product between
matrices.
Furthermore, the total cumulative cost might be computed considering both
intermediate and final tariffs. Thus,
CTtotal = Tintermwinterm + Tfinal(1 − winterm) + (e(A ◦ Tinterm)B)′ e, (14)
where winterm is the share of intermediate goods.
Note that CTtotal is a matrix, whose e,m-th element indicates the cumulative
tariff that country m faces in importing directly and indirectly from country e. In
other terms, e,m-th element is the total cost-push effect on imported goods from
country e to country m. Finally, we can compute the indirect tariff share of total
tariffs as: ITstotal = 1 − Ttotal/CTtotal.
31See Rouzet and Miroudot (2013) for a formal proof.
41
B Tables
Table B.1: Gross and value-added exports by country
Export to UK UK Export
grossvalue-added
grossvalue-added
Austria 2.6 3.7 0.5 0.6Belgium 7.3 7.5 2.8 2.0Bulgaria 2.4 3.5 0.1 0.1Croatia 2.4 3.3 0.1 0.1Cyprus 3.8 7.1 0.1 0.1Czech Rep. 4.2 5.2 0.4 0.4Denmark 6.3 6.8 1.1 0.9Estonia 2.5 3.6 0.1 0.1Finland 4.3 4.6 0.5 0.5France 7.9 8.1 6.2 6.0Germany 6.1 6.6 7.2 6.4Greece 3.2 3.7 0.3 0.5Hungary 3.9 4.9 0.3 0.2Ireland 14.2 13.4 4.6 2.6Italy 5.7 6.4 2.9 3.1Latvia 4.5 5.1 0.1 0.1Lithuania 3.9 3.5 0.1 0.1Luxembourg 2.7 4.1 3.2 0.4Malta 29.2 26.3 0.3 0.1Netherlands 7.6 7.8 3.1 2.3Poland 5.6 6.4 1.0 1.0Portugal 5.0 5.4 0.4 0.5Romania 2.8 3.9 0.2 0.3Slovakia 5.6 7.6 0.1 0.1Slovenia 1.9 3.0 0.1 0.1Spain 5.5 5.8 1.7 1.8Sweden 5.1 5.2 1.6 1.4EU 6.3 6.7 38.9 31.6
Note: Percentage of total gross and value-added ex-
ports. Source: Calculations based on WIOD data.
42
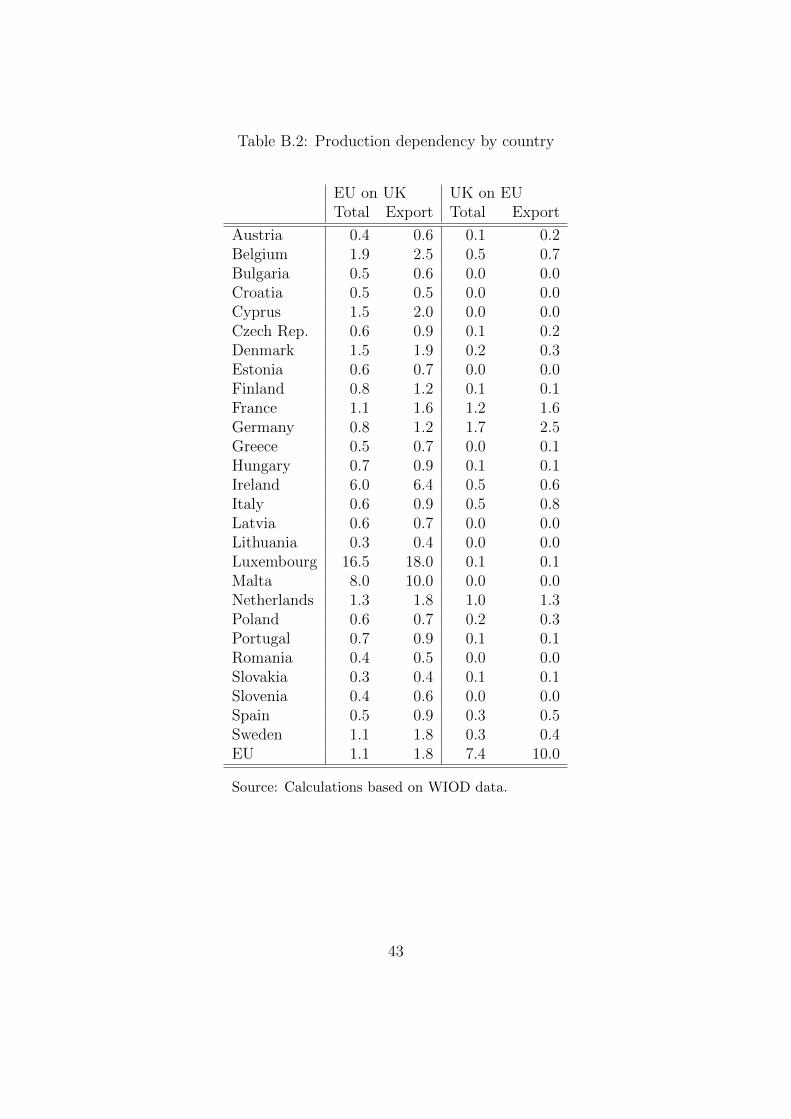
Table B.2: Production dependency by country
EU on UK UK on EUTotal Export Total Export
Austria 0.4 0.6 0.1 0.2Belgium 1.9 2.5 0.5 0.7Bulgaria 0.5 0.6 0.0 0.0Croatia 0.5 0.5 0.0 0.0Cyprus 1.5 2.0 0.0 0.0Czech Rep. 0.6 0.9 0.1 0.2Denmark 1.5 1.9 0.2 0.3Estonia 0.6 0.7 0.0 0.0Finland 0.8 1.2 0.1 0.1France 1.1 1.6 1.2 1.6Germany 0.8 1.2 1.7 2.5Greece 0.5 0.7 0.0 0.1Hungary 0.7 0.9 0.1 0.1Ireland 6.0 6.4 0.5 0.6Italy 0.6 0.9 0.5 0.8Latvia 0.6 0.7 0.0 0.0Lithuania 0.3 0.4 0.0 0.0Luxembourg 16.5 18.0 0.1 0.1Malta 8.0 10.0 0.0 0.0Netherlands 1.3 1.8 1.0 1.3Poland 0.6 0.7 0.2 0.3Portugal 0.7 0.9 0.1 0.1Romania 0.4 0.5 0.0 0.0Slovakia 0.3 0.4 0.1 0.1Slovenia 0.4 0.6 0.0 0.0Spain 0.5 0.9 0.3 0.5Sweden 1.1 1.8 0.3 0.4EU 1.1 1.8 7.4 10.0
Source: Calculations based on WIOD data.
43
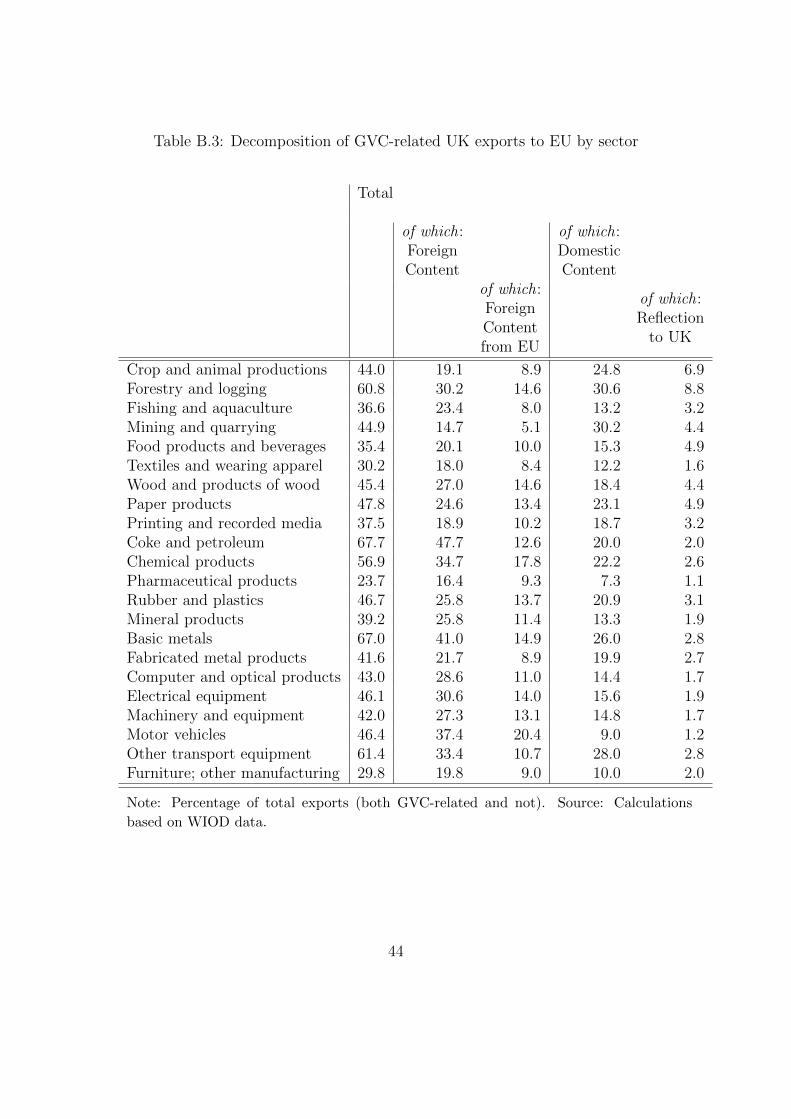
Table B.3: Decomposition of GVC-related UK exports to EU by sector
Total
of which:ForeignContent
of which:DomesticContent
of which:ForeignContentfrom EU
of which:Reflection
to UK
Crop and animal productions 44.0 19.1 8.9 24.8 6.9Forestry and logging 60.8 30.2 14.6 30.6 8.8Fishing and aquaculture 36.6 23.4 8.0 13.2 3.2Mining and quarrying 44.9 14.7 5.1 30.2 4.4Food products and beverages 35.4 20.1 10.0 15.3 4.9Textiles and wearing apparel 30.2 18.0 8.4 12.2 1.6Wood and products of wood 45.4 27.0 14.6 18.4 4.4Paper products 47.8 24.6 13.4 23.1 4.9Printing and recorded media 37.5 18.9 10.2 18.7 3.2Coke and petroleum 67.7 47.7 12.6 20.0 2.0Chemical products 56.9 34.7 17.8 22.2 2.6Pharmaceutical products 23.7 16.4 9.3 7.3 1.1Rubber and plastics 46.7 25.8 13.7 20.9 3.1Mineral products 39.2 25.8 11.4 13.3 1.9Basic metals 67.0 41.0 14.9 26.0 2.8Fabricated metal products 41.6 21.7 8.9 19.9 2.7Computer and optical products 43.0 28.6 11.0 14.4 1.7Electrical equipment 46.1 30.6 14.0 15.6 1.9Machinery and equipment 42.0 27.3 13.1 14.8 1.7Motor vehicles 46.4 37.4 20.4 9.0 1.2Other transport equipment 61.4 33.4 10.7 28.0 2.8Furniture; other manufacturing 29.8 19.8 9.0 10.0 2.0
Note: Percentage of total exports (both GVC-related and not). Source: Calculations
based on WIOD data.
44
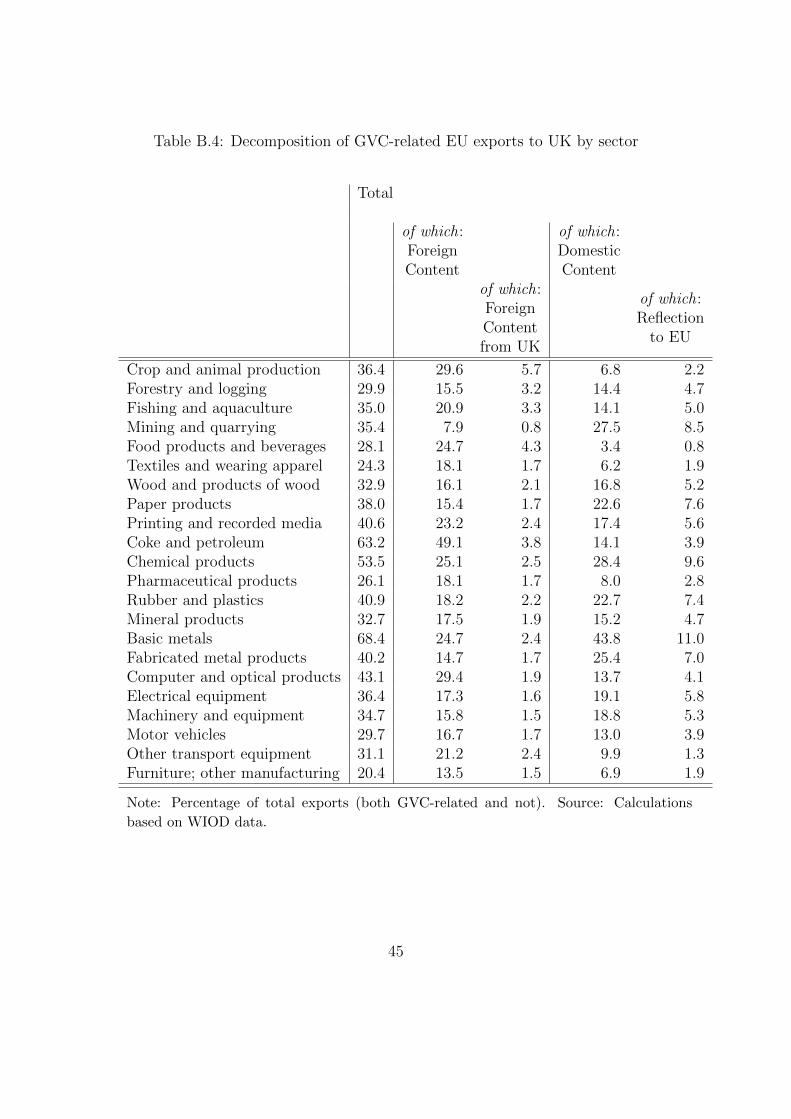
Table B.4: Decomposition of GVC-related EU exports to UK by sector
Total
of which:ForeignContent
of which:DomesticContent
of which:ForeignContentfrom UK
of which:Reflection
to EU
Crop and animal production 36.4 29.6 5.7 6.8 2.2Forestry and logging 29.9 15.5 3.2 14.4 4.7Fishing and aquaculture 35.0 20.9 3.3 14.1 5.0Mining and quarrying 35.4 7.9 0.8 27.5 8.5Food products and beverages 28.1 24.7 4.3 3.4 0.8Textiles and wearing apparel 24.3 18.1 1.7 6.2 1.9Wood and products of wood 32.9 16.1 2.1 16.8 5.2Paper products 38.0 15.4 1.7 22.6 7.6Printing and recorded media 40.6 23.2 2.4 17.4 5.6Coke and petroleum 63.2 49.1 3.8 14.1 3.9Chemical products 53.5 25.1 2.5 28.4 9.6Pharmaceutical products 26.1 18.1 1.7 8.0 2.8Rubber and plastics 40.9 18.2 2.2 22.7 7.4Mineral products 32.7 17.5 1.9 15.2 4.7Basic metals 68.4 24.7 2.4 43.8 11.0Fabricated metal products 40.2 14.7 1.7 25.4 7.0Computer and optical products 43.1 29.4 1.9 13.7 4.1Electrical equipment 36.4 17.3 1.6 19.1 5.8Machinery and equipment 34.7 15.8 1.5 18.8 5.3Motor vehicles 29.7 16.7 1.7 13.0 3.9Other transport equipment 31.1 21.2 2.4 9.9 1.3Furniture; other manufacturing 20.4 13.5 1.5 6.9 1.9
Note: Percentage of total exports (both GVC-related and not). Source: Calculations
based on WIOD data.
45
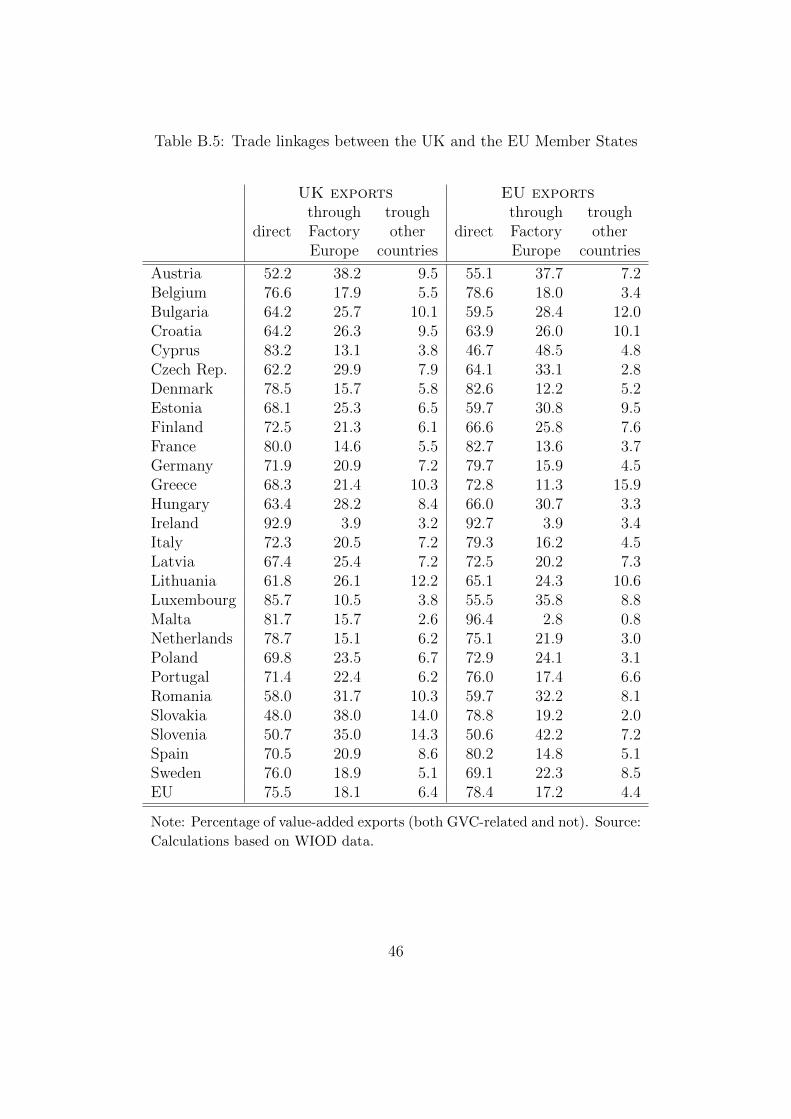
Table B.5: Trade linkages between the UK and the EU Member States
UK exports EU exports
directthroughFactoryEurope
troughother
countriesdirect
throughFactoryEurope
troughother
countries
Austria 52.2 38.2 9.5 55.1 37.7 7.2Belgium 76.6 17.9 5.5 78.6 18.0 3.4Bulgaria 64.2 25.7 10.1 59.5 28.4 12.0Croatia 64.2 26.3 9.5 63.9 26.0 10.1Cyprus 83.2 13.1 3.8 46.7 48.5 4.8Czech Rep. 62.2 29.9 7.9 64.1 33.1 2.8Denmark 78.5 15.7 5.8 82.6 12.2 5.2Estonia 68.1 25.3 6.5 59.7 30.8 9.5Finland 72.5 21.3 6.1 66.6 25.8 7.6France 80.0 14.6 5.5 82.7 13.6 3.7Germany 71.9 20.9 7.2 79.7 15.9 4.5Greece 68.3 21.4 10.3 72.8 11.3 15.9Hungary 63.4 28.2 8.4 66.0 30.7 3.3Ireland 92.9 3.9 3.2 92.7 3.9 3.4Italy 72.3 20.5 7.2 79.3 16.2 4.5Latvia 67.4 25.4 7.2 72.5 20.2 7.3Lithuania 61.8 26.1 12.2 65.1 24.3 10.6Luxembourg 85.7 10.5 3.8 55.5 35.8 8.8Malta 81.7 15.7 2.6 96.4 2.8 0.8Netherlands 78.7 15.1 6.2 75.1 21.9 3.0Poland 69.8 23.5 6.7 72.9 24.1 3.1Portugal 71.4 22.4 6.2 76.0 17.4 6.6Romania 58.0 31.7 10.3 59.7 32.2 8.1Slovakia 48.0 38.0 14.0 78.8 19.2 2.0Slovenia 50.7 35.0 14.3 50.6 42.2 7.2Spain 70.5 20.9 8.6 80.2 14.8 5.1Sweden 76.0 18.9 5.1 69.1 22.3 8.5EU 75.5 18.1 6.4 78.4 17.2 4.4
Note: Percentage of value-added exports (both GVC-related and not). Source:
Calculations based on WIOD data.
46
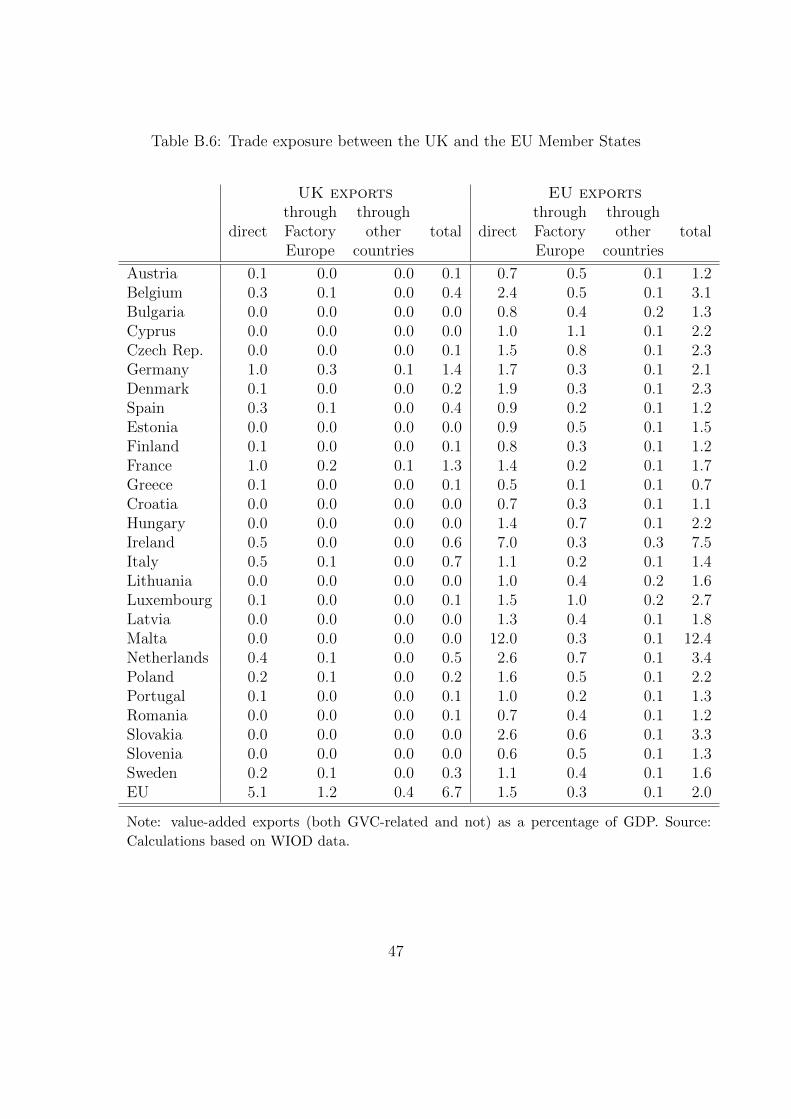
Table B.6: Trade exposure between the UK and the EU Member States
UK exports EU exports
directthroughFactoryEurope
throughother
countriestotal direct
throughFactoryEurope
throughother
countriestotal
Austria 0.1 0.0 0.0 0.1 0.7 0.5 0.1 1.2Belgium 0.3 0.1 0.0 0.4 2.4 0.5 0.1 3.1Bulgaria 0.0 0.0 0.0 0.0 0.8 0.4 0.2 1.3Cyprus 0.0 0.0 0.0 0.0 1.0 1.1 0.1 2.2Czech Rep. 0.0 0.0 0.0 0.1 1.5 0.8 0.1 2.3Germany 1.0 0.3 0.1 1.4 1.7 0.3 0.1 2.1Denmark 0.1 0.0 0.0 0.2 1.9 0.3 0.1 2.3Spain 0.3 0.1 0.0 0.4 0.9 0.2 0.1 1.2Estonia 0.0 0.0 0.0 0.0 0.9 0.5 0.1 1.5Finland 0.1 0.0 0.0 0.1 0.8 0.3 0.1 1.2France 1.0 0.2 0.1 1.3 1.4 0.2 0.1 1.7Greece 0.1 0.0 0.0 0.1 0.5 0.1 0.1 0.7Croatia 0.0 0.0 0.0 0.0 0.7 0.3 0.1 1.1Hungary 0.0 0.0 0.0 0.0 1.4 0.7 0.1 2.2Ireland 0.5 0.0 0.0 0.6 7.0 0.3 0.3 7.5Italy 0.5 0.1 0.0 0.7 1.1 0.2 0.1 1.4Lithuania 0.0 0.0 0.0 0.0 1.0 0.4 0.2 1.6Luxembourg 0.1 0.0 0.0 0.1 1.5 1.0 0.2 2.7Latvia 0.0 0.0 0.0 0.0 1.3 0.4 0.1 1.8Malta 0.0 0.0 0.0 0.0 12.0 0.3 0.1 12.4Netherlands 0.4 0.1 0.0 0.5 2.6 0.7 0.1 3.4Poland 0.2 0.1 0.0 0.2 1.6 0.5 0.1 2.2Portugal 0.1 0.0 0.0 0.1 1.0 0.2 0.1 1.3Romania 0.0 0.0 0.0 0.1 0.7 0.4 0.1 1.2Slovakia 0.0 0.0 0.0 0.0 2.6 0.6 0.1 3.3Slovenia 0.0 0.0 0.0 0.0 0.6 0.5 0.1 1.3Sweden 0.2 0.1 0.0 0.3 1.1 0.4 0.1 1.6EU 5.1 1.2 0.4 6.7 1.5 0.3 0.1 2.0
Note: value-added exports (both GVC-related and not) as a percentage of GDP. Source:
Calculations based on WIOD data.
47
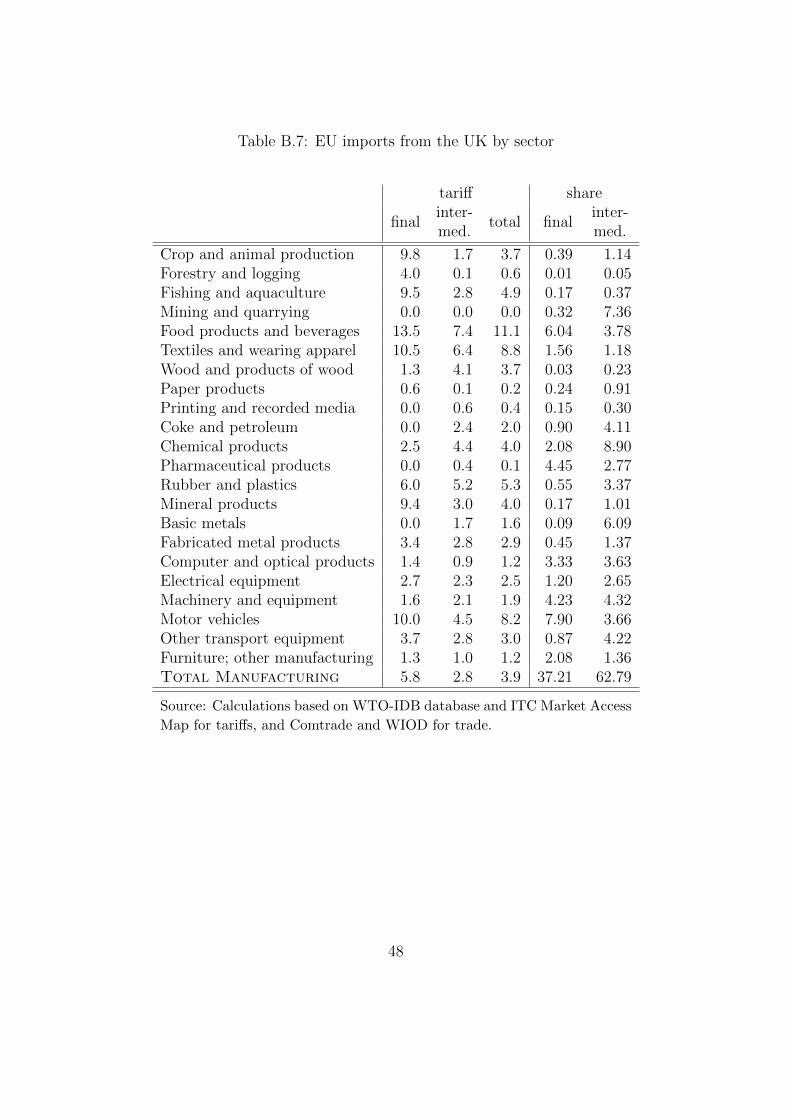
Table B.7: EU imports from the UK by sector
tariff share
finalinter-med.
total finalinter-med.
Crop and animal production 9.8 1.7 3.7 0.39 1.14Forestry and logging 4.0 0.1 0.6 0.01 0.05Fishing and aquaculture 9.5 2.8 4.9 0.17 0.37Mining and quarrying 0.0 0.0 0.0 0.32 7.36Food products and beverages 13.5 7.4 11.1 6.04 3.78Textiles and wearing apparel 10.5 6.4 8.8 1.56 1.18Wood and products of wood 1.3 4.1 3.7 0.03 0.23Paper products 0.6 0.1 0.2 0.24 0.91Printing and recorded media 0.0 0.6 0.4 0.15 0.30Coke and petroleum 0.0 2.4 2.0 0.90 4.11Chemical products 2.5 4.4 4.0 2.08 8.90Pharmaceutical products 0.0 0.4 0.1 4.45 2.77Rubber and plastics 6.0 5.2 5.3 0.55 3.37Mineral products 9.4 3.0 4.0 0.17 1.01Basic metals 0.0 1.7 1.6 0.09 6.09Fabricated metal products 3.4 2.8 2.9 0.45 1.37Computer and optical products 1.4 0.9 1.2 3.33 3.63Electrical equipment 2.7 2.3 2.5 1.20 2.65Machinery and equipment 1.6 2.1 1.9 4.23 4.32Motor vehicles 10.0 4.5 8.2 7.90 3.66Other transport equipment 3.7 2.8 3.0 0.87 4.22Furniture; other manufacturing 1.3 1.0 1.2 2.08 1.36Total Manufacturing 5.8 2.8 3.9 37.21 62.79
Source: Calculations based on WTO-IDB database and ITC Market Access
Map for tariffs, and Comtrade and WIOD for trade.
48
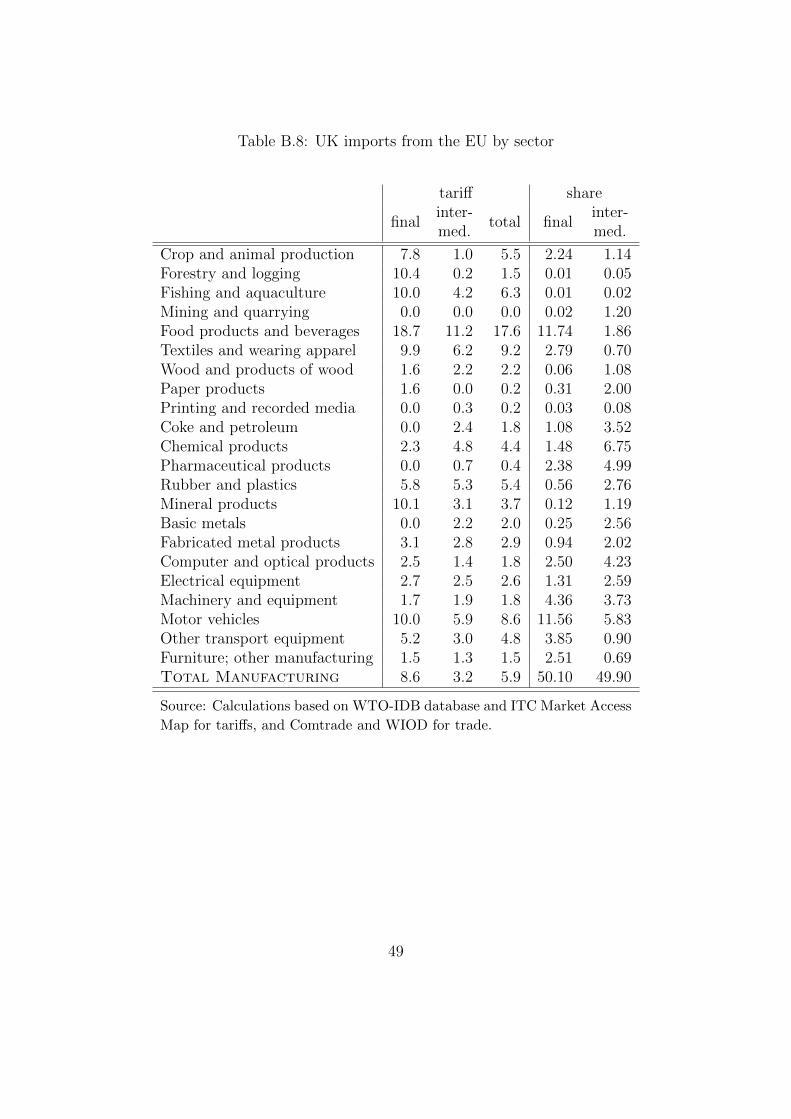
Table B.8: UK imports from the EU by sector
tariff share
finalinter-med.
total finalinter-med.
Crop and animal production 7.8 1.0 5.5 2.24 1.14Forestry and logging 10.4 0.2 1.5 0.01 0.05Fishing and aquaculture 10.0 4.2 6.3 0.01 0.02Mining and quarrying 0.0 0.0 0.0 0.02 1.20Food products and beverages 18.7 11.2 17.6 11.74 1.86Textiles and wearing apparel 9.9 6.2 9.2 2.79 0.70Wood and products of wood 1.6 2.2 2.2 0.06 1.08Paper products 1.6 0.0 0.2 0.31 2.00Printing and recorded media 0.0 0.3 0.2 0.03 0.08Coke and petroleum 0.0 2.4 1.8 1.08 3.52Chemical products 2.3 4.8 4.4 1.48 6.75Pharmaceutical products 0.0 0.7 0.4 2.38 4.99Rubber and plastics 5.8 5.3 5.4 0.56 2.76Mineral products 10.1 3.1 3.7 0.12 1.19Basic metals 0.0 2.2 2.0 0.25 2.56Fabricated metal products 3.1 2.8 2.9 0.94 2.02Computer and optical products 2.5 1.4 1.8 2.50 4.23Electrical equipment 2.7 2.5 2.6 1.31 2.59Machinery and equipment 1.7 1.9 1.8 4.36 3.73Motor vehicles 10.0 5.9 8.6 11.56 5.83Other transport equipment 5.2 3.0 4.8 3.85 0.90Furniture; other manufacturing 1.5 1.3 1.5 2.51 0.69Total Manufacturing 8.6 3.2 5.9 50.10 49.90
Source: Calculations based on WTO-IDB database and ITC Market Access
Map for tariffs, and Comtrade and WIOD for trade.
49
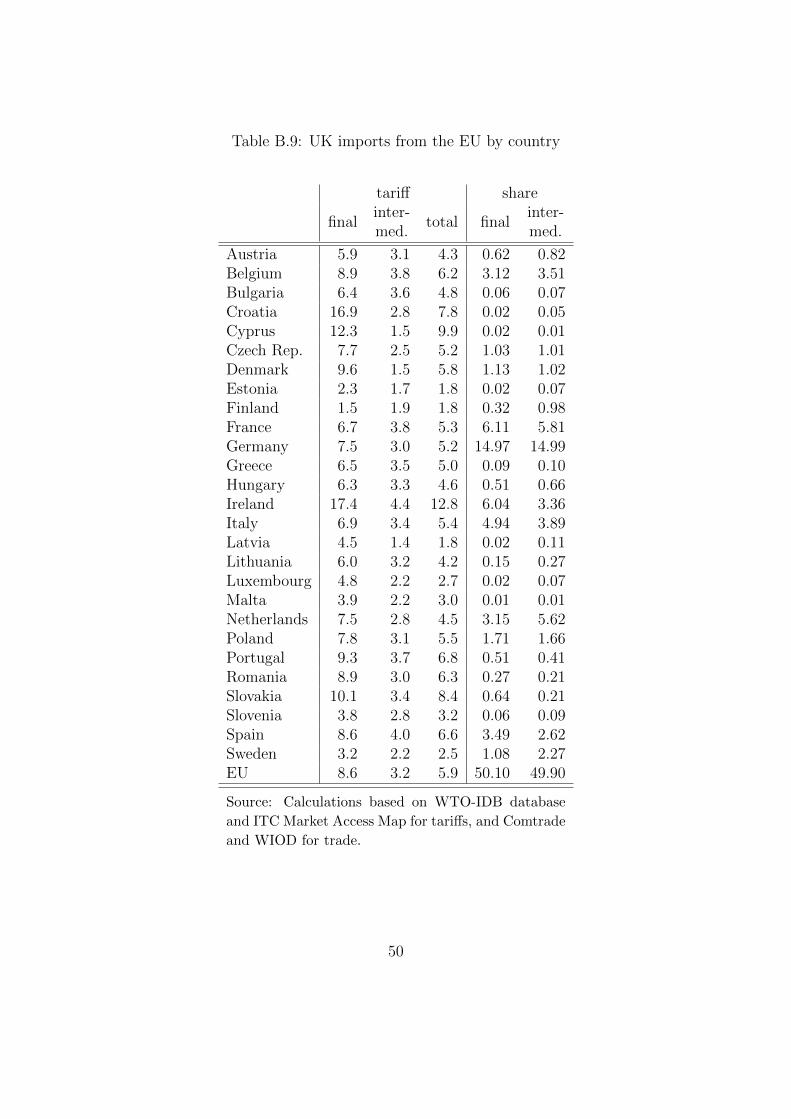
Table B.9: UK imports from the EU by country
tariff share
finalinter-med.
total finalinter-med.
Austria 5.9 3.1 4.3 0.62 0.82Belgium 8.9 3.8 6.2 3.12 3.51Bulgaria 6.4 3.6 4.8 0.06 0.07Croatia 16.9 2.8 7.8 0.02 0.05Cyprus 12.3 1.5 9.9 0.02 0.01Czech Rep. 7.7 2.5 5.2 1.03 1.01Denmark 9.6 1.5 5.8 1.13 1.02Estonia 2.3 1.7 1.8 0.02 0.07Finland 1.5 1.9 1.8 0.32 0.98France 6.7 3.8 5.3 6.11 5.81Germany 7.5 3.0 5.2 14.97 14.99Greece 6.5 3.5 5.0 0.09 0.10Hungary 6.3 3.3 4.6 0.51 0.66Ireland 17.4 4.4 12.8 6.04 3.36Italy 6.9 3.4 5.4 4.94 3.89Latvia 4.5 1.4 1.8 0.02 0.11Lithuania 6.0 3.2 4.2 0.15 0.27Luxembourg 4.8 2.2 2.7 0.02 0.07Malta 3.9 2.2 3.0 0.01 0.01Netherlands 7.5 2.8 4.5 3.15 5.62Poland 7.8 3.1 5.5 1.71 1.66Portugal 9.3 3.7 6.8 0.51 0.41Romania 8.9 3.0 6.3 0.27 0.21Slovakia 10.1 3.4 8.4 0.64 0.21Slovenia 3.8 2.8 3.2 0.06 0.09Spain 8.6 4.0 6.6 3.49 2.62Sweden 3.2 2.2 2.5 1.08 2.27EU 8.6 3.2 5.9 50.10 49.90
Source: Calculations based on WTO-IDB database
and ITC Market Access Map for tariffs, and Comtrade
and WIOD for trade.
50
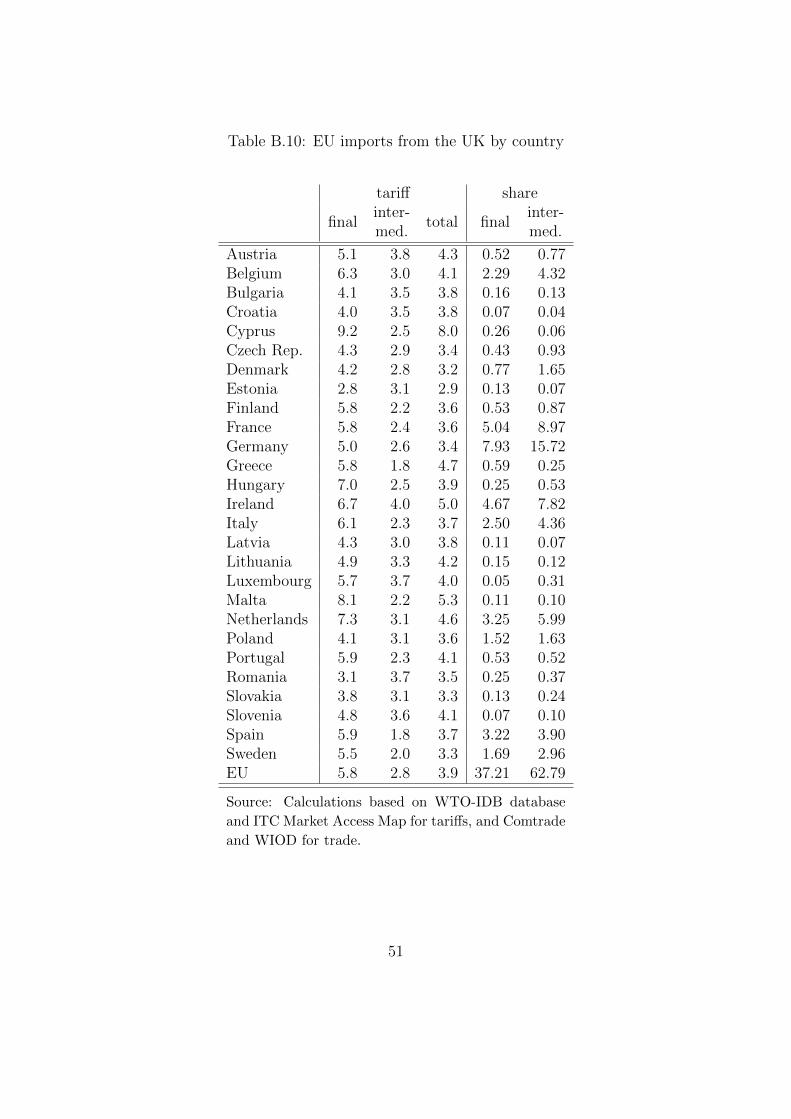
Table B.10: EU imports from the UK by country
tariff share
finalinter-med.
total finalinter-med.
Austria 5.1 3.8 4.3 0.52 0.77Belgium 6.3 3.0 4.1 2.29 4.32Bulgaria 4.1 3.5 3.8 0.16 0.13Croatia 4.0 3.5 3.8 0.07 0.04Cyprus 9.2 2.5 8.0 0.26 0.06Czech Rep. 4.3 2.9 3.4 0.43 0.93Denmark 4.2 2.8 3.2 0.77 1.65Estonia 2.8 3.1 2.9 0.13 0.07Finland 5.8 2.2 3.6 0.53 0.87France 5.8 2.4 3.6 5.04 8.97Germany 5.0 2.6 3.4 7.93 15.72Greece 5.8 1.8 4.7 0.59 0.25Hungary 7.0 2.5 3.9 0.25 0.53Ireland 6.7 4.0 5.0 4.67 7.82Italy 6.1 2.3 3.7 2.50 4.36Latvia 4.3 3.0 3.8 0.11 0.07Lithuania 4.9 3.3 4.2 0.15 0.12Luxembourg 5.7 3.7 4.0 0.05 0.31Malta 8.1 2.2 5.3 0.11 0.10Netherlands 7.3 3.1 4.6 3.25 5.99Poland 4.1 3.1 3.6 1.52 1.63Portugal 5.9 2.3 4.1 0.53 0.52Romania 3.1 3.7 3.5 0.25 0.37Slovakia 3.8 3.1 3.3 0.13 0.24Slovenia 4.8 3.6 4.1 0.07 0.10Spain 5.9 1.8 3.7 3.22 3.90Sweden 5.5 2.0 3.3 1.69 2.96EU 5.8 2.8 3.9 37.21 62.79
Source: Calculations based on WTO-IDB database
and ITC Market Access Map for tariffs, and Comtrade
and WIOD for trade.
51
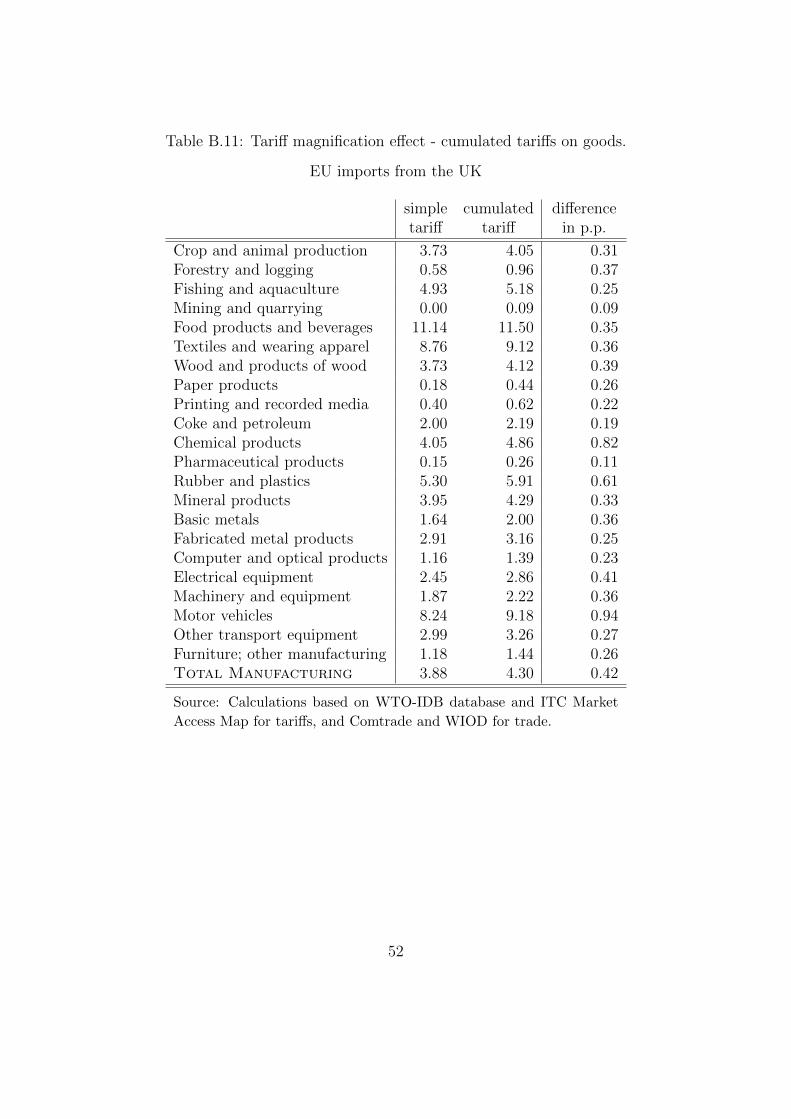
Table B.11: Tariff magnification effect - cumulated tariffs on goods.
EU imports from the UK
simpletariff
cumulatedtariff
differencein p.p.
Crop and animal production 3.73 4.05 0.31Forestry and logging 0.58 0.96 0.37Fishing and aquaculture 4.93 5.18 0.25Mining and quarrying 0.00 0.09 0.09Food products and beverages 11.14 11.50 0.35Textiles and wearing apparel 8.76 9.12 0.36Wood and products of wood 3.73 4.12 0.39Paper products 0.18 0.44 0.26Printing and recorded media 0.40 0.62 0.22Coke and petroleum 2.00 2.19 0.19Chemical products 4.05 4.86 0.82Pharmaceutical products 0.15 0.26 0.11Rubber and plastics 5.30 5.91 0.61Mineral products 3.95 4.29 0.33Basic metals 1.64 2.00 0.36Fabricated metal products 2.91 3.16 0.25Computer and optical products 1.16 1.39 0.23Electrical equipment 2.45 2.86 0.41Machinery and equipment 1.87 2.22 0.36Motor vehicles 8.24 9.18 0.94Other transport equipment 2.99 3.26 0.27Furniture; other manufacturing 1.18 1.44 0.26Total Manufacturing 3.88 4.30 0.42
Source: Calculations based on WTO-IDB database and ITC Market
Access Map for tariffs, and Comtrade and WIOD for trade.
52
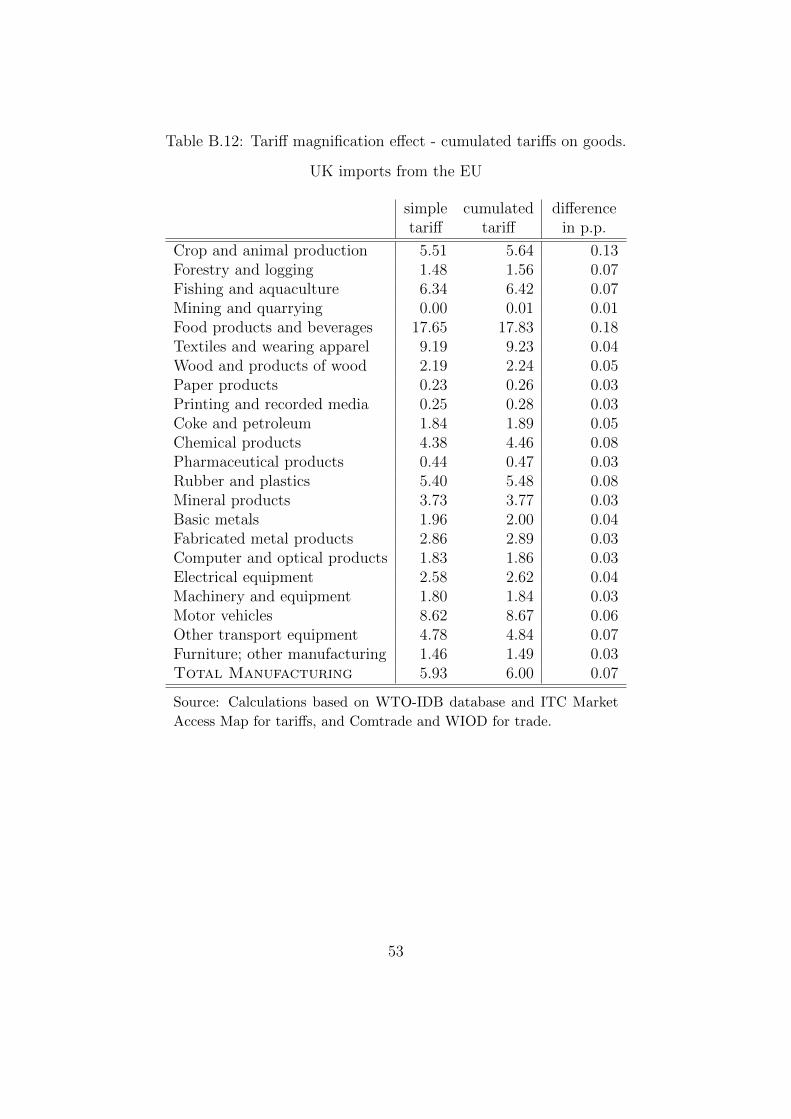
Table B.12: Tariff magnification effect - cumulated tariffs on goods.
UK imports from the EU
simpletariff
cumulatedtariff
differencein p.p.
Crop and animal production 5.51 5.64 0.13Forestry and logging 1.48 1.56 0.07Fishing and aquaculture 6.34 6.42 0.07Mining and quarrying 0.00 0.01 0.01Food products and beverages 17.65 17.83 0.18Textiles and wearing apparel 9.19 9.23 0.04Wood and products of wood 2.19 2.24 0.05Paper products 0.23 0.26 0.03Printing and recorded media 0.25 0.28 0.03Coke and petroleum 1.84 1.89 0.05Chemical products 4.38 4.46 0.08Pharmaceutical products 0.44 0.47 0.03Rubber and plastics 5.40 5.48 0.08Mineral products 3.73 3.77 0.03Basic metals 1.96 2.00 0.04Fabricated metal products 2.86 2.89 0.03Computer and optical products 1.83 1.86 0.03Electrical equipment 2.58 2.62 0.04Machinery and equipment 1.80 1.84 0.03Motor vehicles 8.62 8.67 0.06Other transport equipment 4.78 4.84 0.07Furniture; other manufacturing 1.46 1.49 0.03Total Manufacturing 5.93 6.00 0.07
Source: Calculations based on WTO-IDB database and ITC Market
Access Map for tariffs, and Comtrade and WIOD for trade.
53
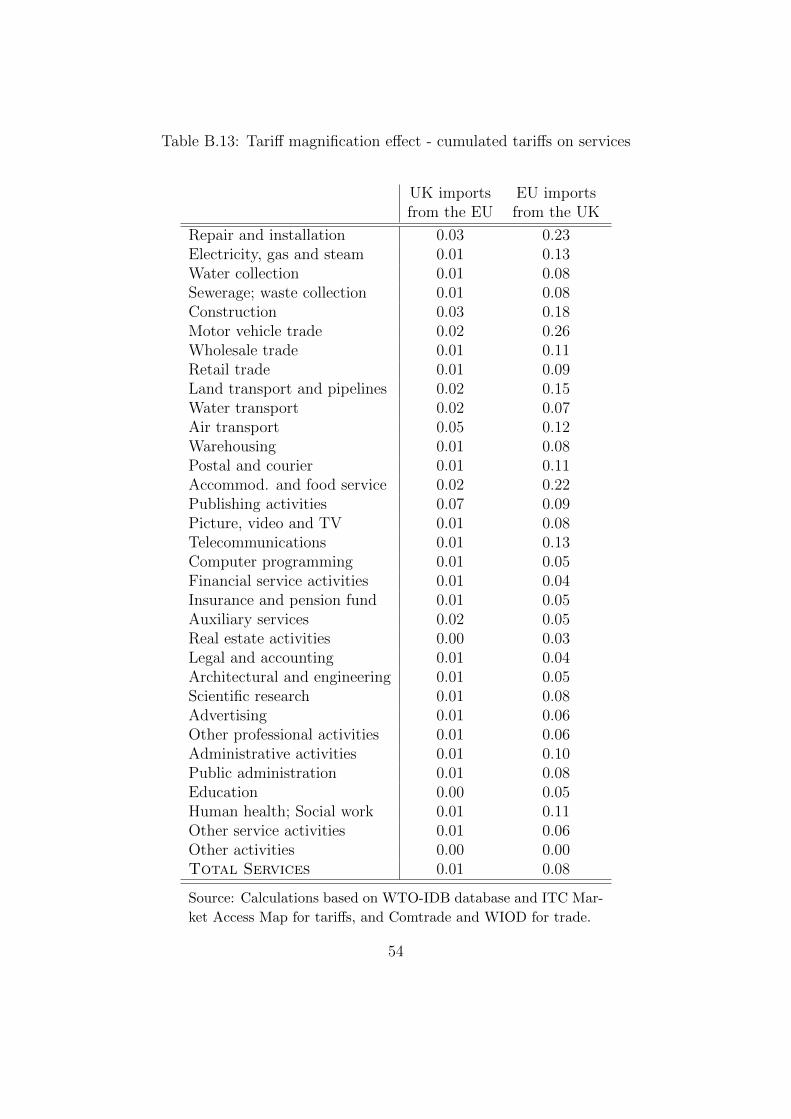
Table B.13: Tariff magnification effect - cumulated tariffs on services
UK importsfrom the EU
EU importsfrom the UK
Repair and installation 0.03 0.23Electricity, gas and steam 0.01 0.13Water collection 0.01 0.08Sewerage; waste collection 0.01 0.08Construction 0.03 0.18Motor vehicle trade 0.02 0.26Wholesale trade 0.01 0.11Retail trade 0.01 0.09Land transport and pipelines 0.02 0.15Water transport 0.02 0.07Air transport 0.05 0.12Warehousing 0.01 0.08Postal and courier 0.01 0.11Accommod. and food service 0.02 0.22Publishing activities 0.07 0.09Picture, video and TV 0.01 0.08Telecommunications 0.01 0.13Computer programming 0.01 0.05Financial service activities 0.01 0.04Insurance and pension fund 0.01 0.05Auxiliary services 0.02 0.05Real estate activities 0.00 0.03Legal and accounting 0.01 0.04Architectural and engineering 0.01 0.05Scientific research 0.01 0.08Advertising 0.01 0.06Other professional activities 0.01 0.06Administrative activities 0.01 0.10Public administration 0.01 0.08Education 0.00 0.05Human health; Social work 0.01 0.11Other service activities 0.01 0.06Other activities 0.00 0.00Total Services 0.01 0.08
Source: Calculations based on WTO-IDB database and ITC Mar-
ket Access Map for tariffs, and Comtrade and WIOD for trade.
54
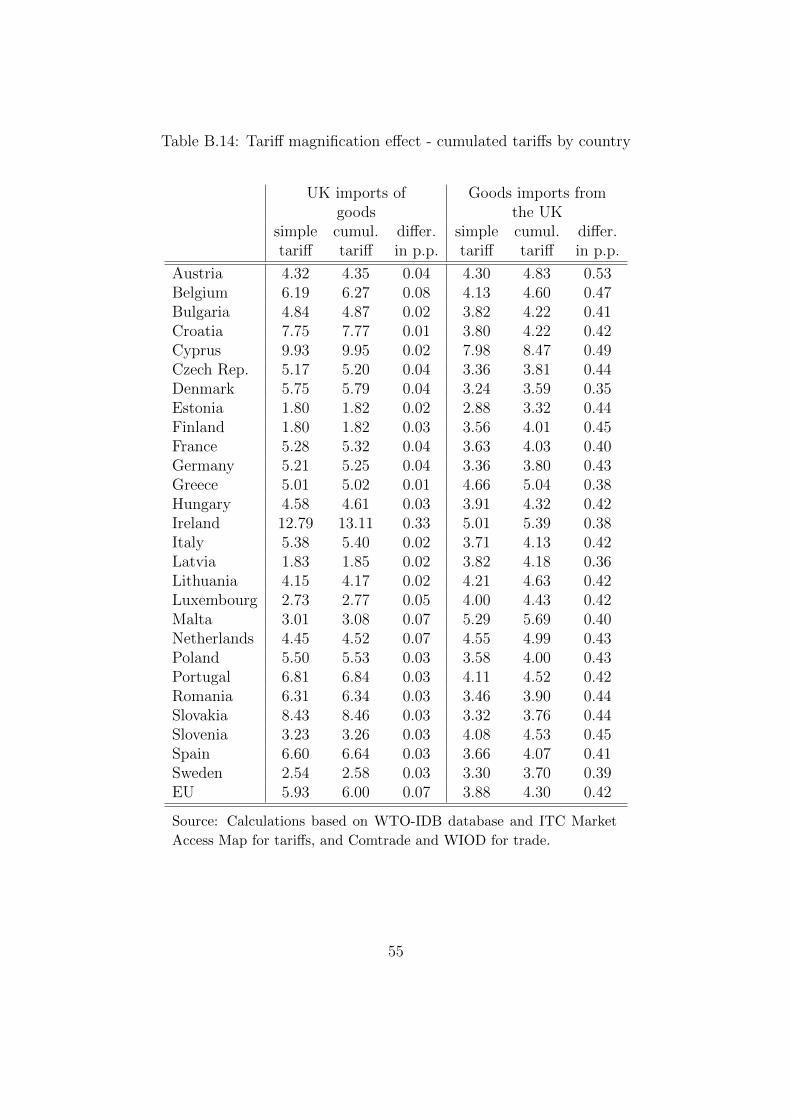
Table B.14: Tariff magnification effect - cumulated tariffs by country
UK imports ofgoods
Goods imports fromthe UK
simpletariff
cumul.tariff
differ.in p.p.
simpletariff
cumul.tariff
differ.in p.p.
Austria 4.32 4.35 0.04 4.30 4.83 0.53Belgium 6.19 6.27 0.08 4.13 4.60 0.47Bulgaria 4.84 4.87 0.02 3.82 4.22 0.41Croatia 7.75 7.77 0.01 3.80 4.22 0.42Cyprus 9.93 9.95 0.02 7.98 8.47 0.49Czech Rep. 5.17 5.20 0.04 3.36 3.81 0.44Denmark 5.75 5.79 0.04 3.24 3.59 0.35Estonia 1.80 1.82 0.02 2.88 3.32 0.44Finland 1.80 1.82 0.03 3.56 4.01 0.45France 5.28 5.32 0.04 3.63 4.03 0.40Germany 5.21 5.25 0.04 3.36 3.80 0.43Greece 5.01 5.02 0.01 4.66 5.04 0.38Hungary 4.58 4.61 0.03 3.91 4.32 0.42Ireland 12.79 13.11 0.33 5.01 5.39 0.38Italy 5.38 5.40 0.02 3.71 4.13 0.42Latvia 1.83 1.85 0.02 3.82 4.18 0.36Lithuania 4.15 4.17 0.02 4.21 4.63 0.42Luxembourg 2.73 2.77 0.05 4.00 4.43 0.42Malta 3.01 3.08 0.07 5.29 5.69 0.40Netherlands 4.45 4.52 0.07 4.55 4.99 0.43Poland 5.50 5.53 0.03 3.58 4.00 0.43Portugal 6.81 6.84 0.03 4.11 4.52 0.42Romania 6.31 6.34 0.03 3.46 3.90 0.44Slovakia 8.43 8.46 0.03 3.32 3.76 0.44Slovenia 3.23 3.26 0.03 4.08 4.53 0.45Spain 6.60 6.64 0.03 3.66 4.07 0.41Sweden 2.54 2.58 0.03 3.30 3.70 0.39EU 5.93 6.00 0.07 3.88 4.30 0.42
Source: Calculations based on WTO-IDB database and ITC Market
Access Map for tariffs, and Comtrade and WIOD for trade.
55
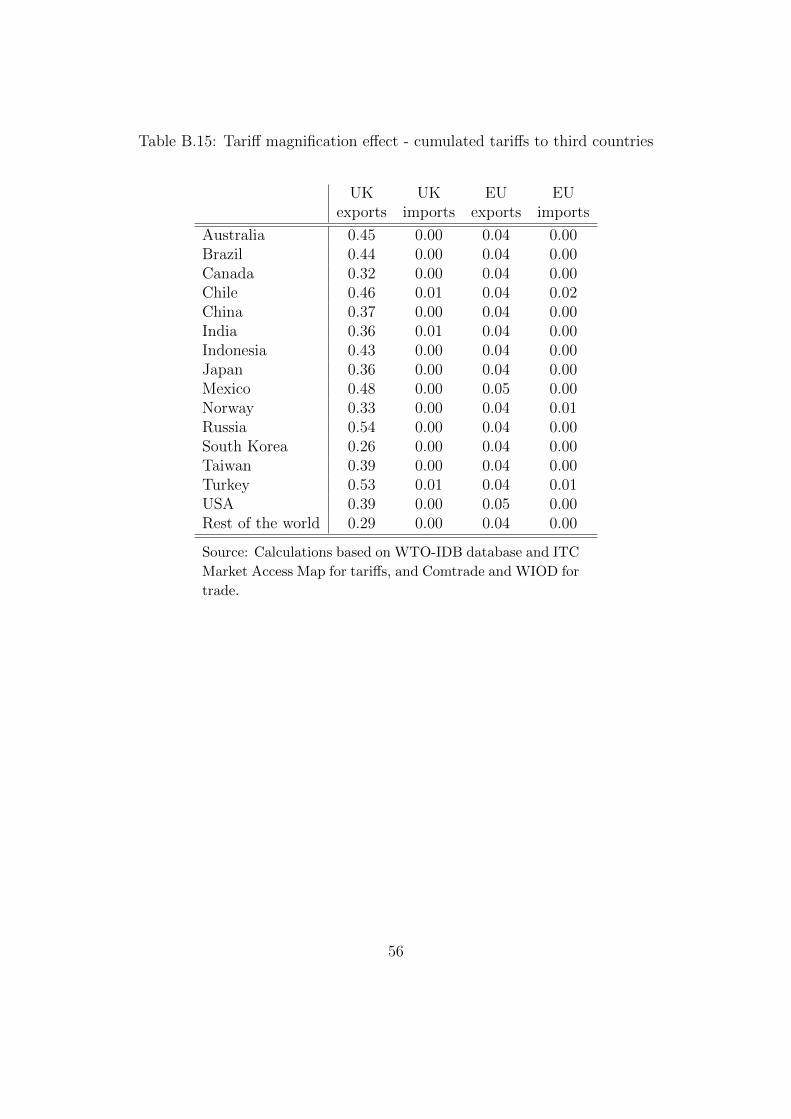
Table B.15: Tariff magnification effect - cumulated tariffs to third countries
UKexports
UKimports
EUexports
EUimports
Australia 0.45 0.00 0.04 0.00Brazil 0.44 0.00 0.04 0.00Canada 0.32 0.00 0.04 0.00Chile 0.46 0.01 0.04 0.02China 0.37 0.00 0.04 0.00India 0.36 0.01 0.04 0.00Indonesia 0.43 0.00 0.04 0.00Japan 0.36 0.00 0.04 0.00Mexico 0.48 0.00 0.05 0.00Norway 0.33 0.00 0.04 0.01Russia 0.54 0.00 0.04 0.00South Korea 0.26 0.00 0.04 0.00Taiwan 0.39 0.00 0.04 0.00Turkey 0.53 0.01 0.04 0.01USA 0.39 0.00 0.05 0.00Rest of the world 0.29 0.00 0.04 0.00
Source: Calculations based on WTO-IDB database and ITC
Market Access Map for tariffs, and Comtrade and WIOD for
trade.
56
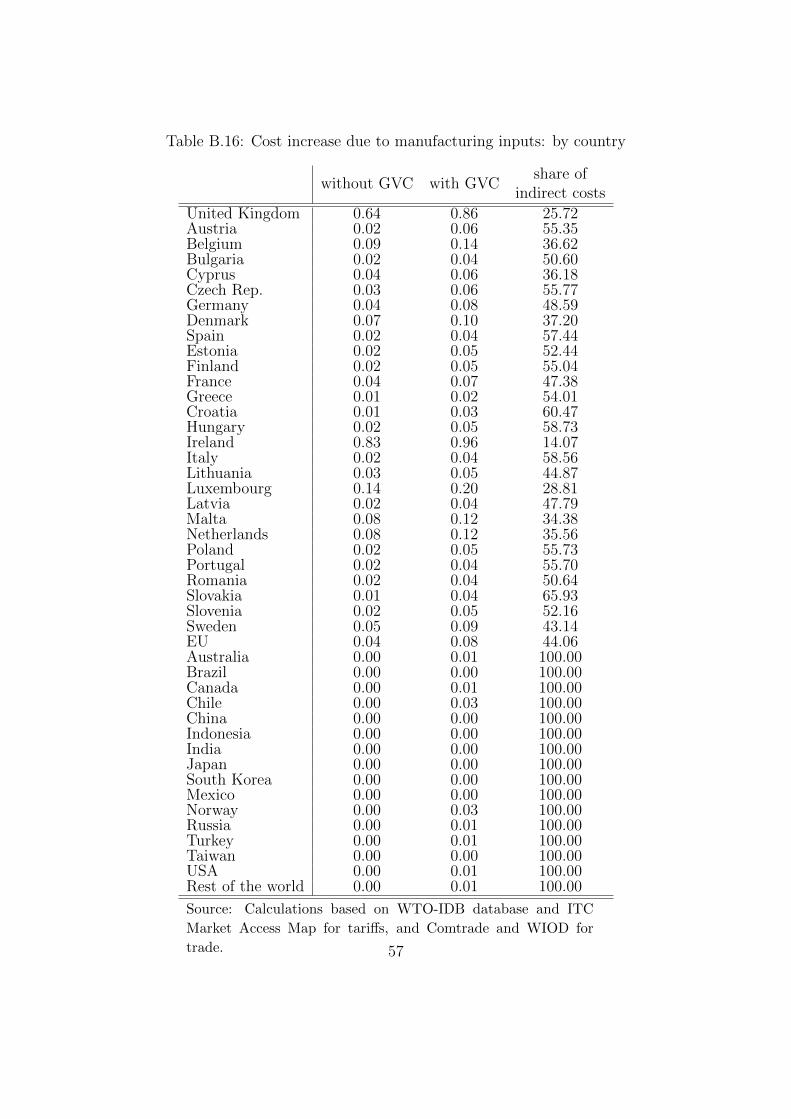
Table B.16: Cost increase due to manufacturing inputs: by country
without GVC with GVCshare of
indirect costs
United Kingdom 0.64 0.86 25.72Austria 0.02 0.06 55.35Belgium 0.09 0.14 36.62Bulgaria 0.02 0.04 50.60Cyprus 0.04 0.06 36.18Czech Rep. 0.03 0.06 55.77Germany 0.04 0.08 48.59Denmark 0.07 0.10 37.20Spain 0.02 0.04 57.44Estonia 0.02 0.05 52.44Finland 0.02 0.05 55.04France 0.04 0.07 47.38Greece 0.01 0.02 54.01Croatia 0.01 0.03 60.47Hungary 0.02 0.05 58.73Ireland 0.83 0.96 14.07Italy 0.02 0.04 58.56Lithuania 0.03 0.05 44.87Luxembourg 0.14 0.20 28.81Latvia 0.02 0.04 47.79Malta 0.08 0.12 34.38Netherlands 0.08 0.12 35.56Poland 0.02 0.05 55.73Portugal 0.02 0.04 55.70Romania 0.02 0.04 50.64Slovakia 0.01 0.04 65.93Slovenia 0.02 0.05 52.16Sweden 0.05 0.09 43.14EU 0.04 0.08 44.06Australia 0.00 0.01 100.00Brazil 0.00 0.00 100.00Canada 0.00 0.01 100.00Chile 0.00 0.03 100.00China 0.00 0.00 100.00Indonesia 0.00 0.00 100.00India 0.00 0.00 100.00Japan 0.00 0.00 100.00South Korea 0.00 0.00 100.00Mexico 0.00 0.00 100.00Norway 0.00 0.03 100.00Russia 0.00 0.01 100.00Turkey 0.00 0.01 100.00Taiwan 0.00 0.00 100.00USA 0.00 0.01 100.00Rest of the world 0.00 0.01 100.00
Source: Calculations based on WTO-IDB database and ITC
Market Access Map for tariffs, and Comtrade and WIOD for
trade. 57
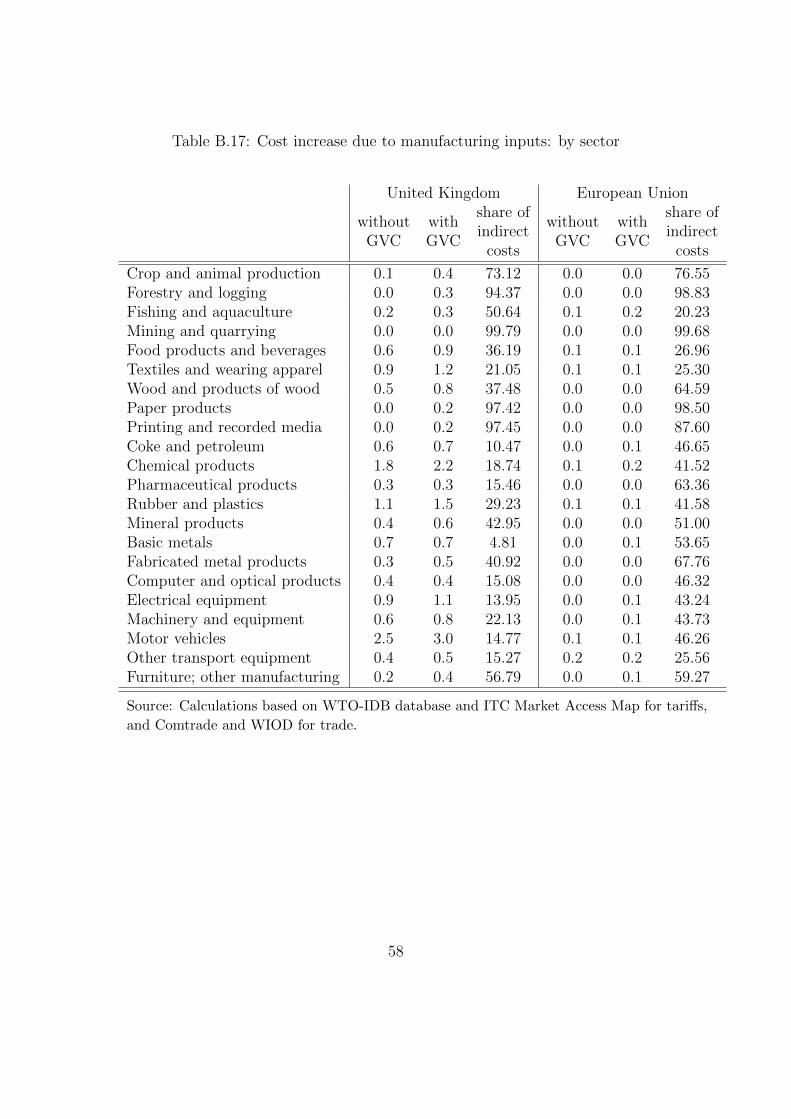
Table B.17: Cost increase due to manufacturing inputs: by sector
United Kingdom European Union
withoutGVC
withGVC
share ofindirect
costs
withoutGVC
withGVC
share ofindirect
costs
Crop and animal production 0.1 0.4 73.12 0.0 0.0 76.55Forestry and logging 0.0 0.3 94.37 0.0 0.0 98.83Fishing and aquaculture 0.2 0.3 50.64 0.1 0.2 20.23Mining and quarrying 0.0 0.0 99.79 0.0 0.0 99.68Food products and beverages 0.6 0.9 36.19 0.1 0.1 26.96Textiles and wearing apparel 0.9 1.2 21.05 0.1 0.1 25.30Wood and products of wood 0.5 0.8 37.48 0.0 0.0 64.59Paper products 0.0 0.2 97.42 0.0 0.0 98.50Printing and recorded media 0.0 0.2 97.45 0.0 0.0 87.60Coke and petroleum 0.6 0.7 10.47 0.0 0.1 46.65Chemical products 1.8 2.2 18.74 0.1 0.2 41.52Pharmaceutical products 0.3 0.3 15.46 0.0 0.0 63.36Rubber and plastics 1.1 1.5 29.23 0.1 0.1 41.58Mineral products 0.4 0.6 42.95 0.0 0.0 51.00Basic metals 0.7 0.7 4.81 0.0 0.1 53.65Fabricated metal products 0.3 0.5 40.92 0.0 0.0 67.76Computer and optical products 0.4 0.4 15.08 0.0 0.0 46.32Electrical equipment 0.9 1.1 13.95 0.0 0.1 43.24Machinery and equipment 0.6 0.8 22.13 0.0 0.1 43.73Motor vehicles 2.5 3.0 14.77 0.1 0.1 46.26Other transport equipment 0.4 0.5 15.27 0.2 0.2 25.56Furniture; other manufacturing 0.2 0.4 56.79 0.0 0.1 59.27
Source: Calculations based on WTO-IDB database and ITC Market Access Map for tariffs,
and Comtrade and WIOD for trade.
58
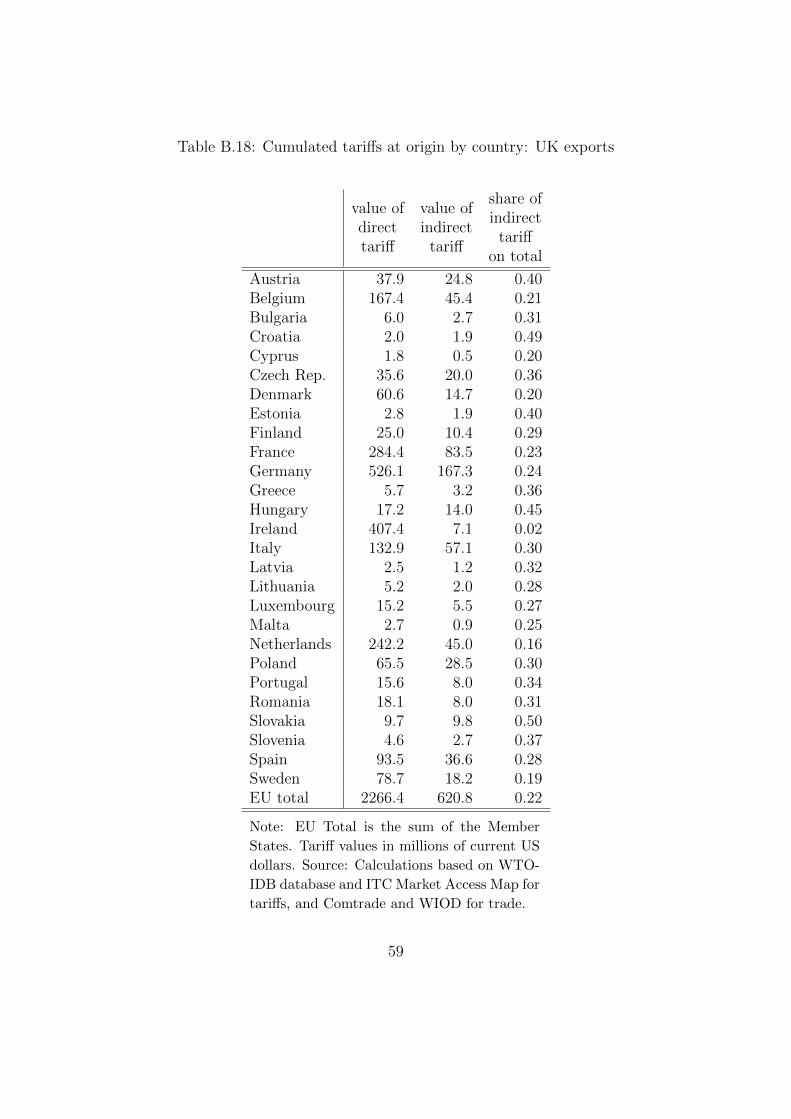
Table B.18: Cumulated tariffs at origin by country: UK exports
value ofdirecttariff
value ofindirect
tariff
share ofindirect
tariffon total
Austria 37.9 24.8 0.40Belgium 167.4 45.4 0.21Bulgaria 6.0 2.7 0.31Croatia 2.0 1.9 0.49Cyprus 1.8 0.5 0.20Czech Rep. 35.6 20.0 0.36Denmark 60.6 14.7 0.20Estonia 2.8 1.9 0.40Finland 25.0 10.4 0.29France 284.4 83.5 0.23Germany 526.1 167.3 0.24Greece 5.7 3.2 0.36Hungary 17.2 14.0 0.45Ireland 407.4 7.1 0.02Italy 132.9 57.1 0.30Latvia 2.5 1.2 0.32Lithuania 5.2 2.0 0.28Luxembourg 15.2 5.5 0.27Malta 2.7 0.9 0.25Netherlands 242.2 45.0 0.16Poland 65.5 28.5 0.30Portugal 15.6 8.0 0.34Romania 18.1 8.0 0.31Slovakia 9.7 9.8 0.50Slovenia 4.6 2.7 0.37Spain 93.5 36.6 0.28Sweden 78.7 18.2 0.19EU total 2266.4 620.8 0.22
Note: EU Total is the sum of the Member
States. Tariff values in millions of current US
dollars. Source: Calculations based on WTO-
IDB database and ITC Market Access Map for
tariffs, and Comtrade and WIOD for trade.
59
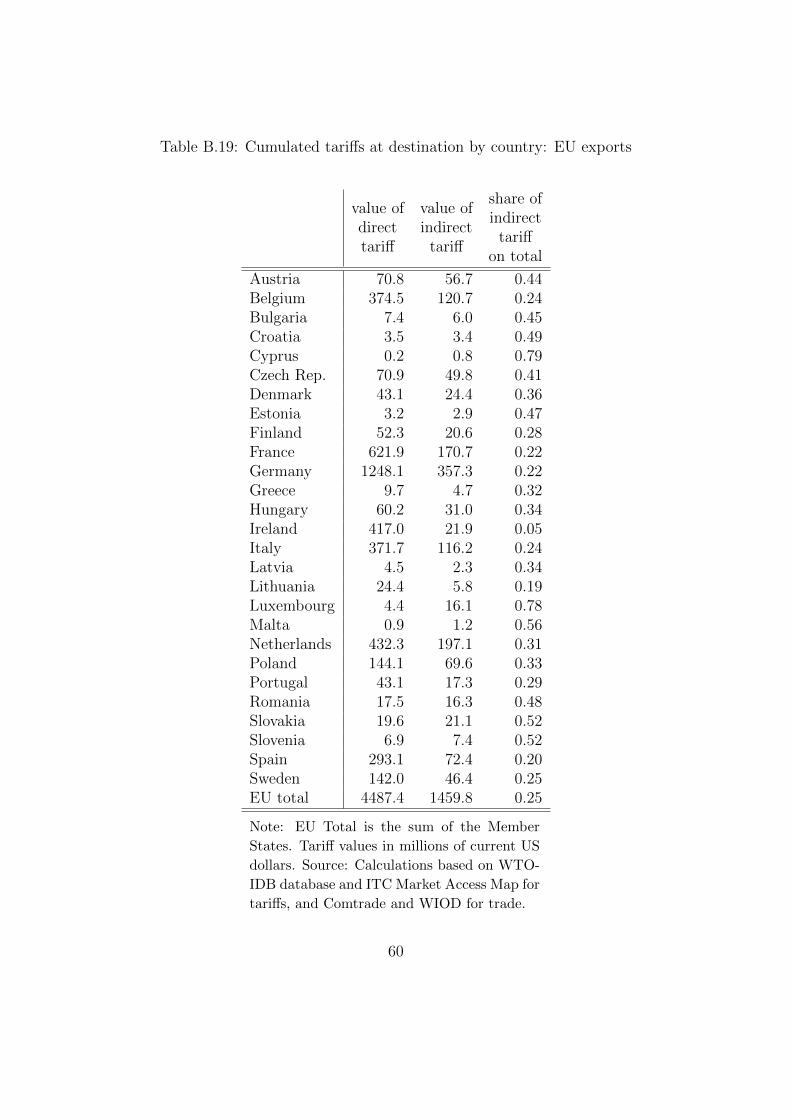
Table B.19: Cumulated tariffs at destination by country: EU exports
value ofdirecttariff
value ofindirect
tariff
share ofindirect
tariffon total
Austria 70.8 56.7 0.44Belgium 374.5 120.7 0.24Bulgaria 7.4 6.0 0.45Croatia 3.5 3.4 0.49Cyprus 0.2 0.8 0.79Czech Rep. 70.9 49.8 0.41Denmark 43.1 24.4 0.36Estonia 3.2 2.9 0.47Finland 52.3 20.6 0.28France 621.9 170.7 0.22Germany 1248.1 357.3 0.22Greece 9.7 4.7 0.32Hungary 60.2 31.0 0.34Ireland 417.0 21.9 0.05Italy 371.7 116.2 0.24Latvia 4.5 2.3 0.34Lithuania 24.4 5.8 0.19Luxembourg 4.4 16.1 0.78Malta 0.9 1.2 0.56Netherlands 432.3 197.1 0.31Poland 144.1 69.6 0.33Portugal 43.1 17.3 0.29Romania 17.5 16.3 0.48Slovakia 19.6 21.1 0.52Slovenia 6.9 7.4 0.52Spain 293.1 72.4 0.20Sweden 142.0 46.4 0.25EU total 4487.4 1459.8 0.25
Note: EU Total is the sum of the Member
States. Tariff values in millions of current US
dollars. Source: Calculations based on WTO-
IDB database and ITC Market Access Map for
tariffs, and Comtrade and WIOD for trade.
60
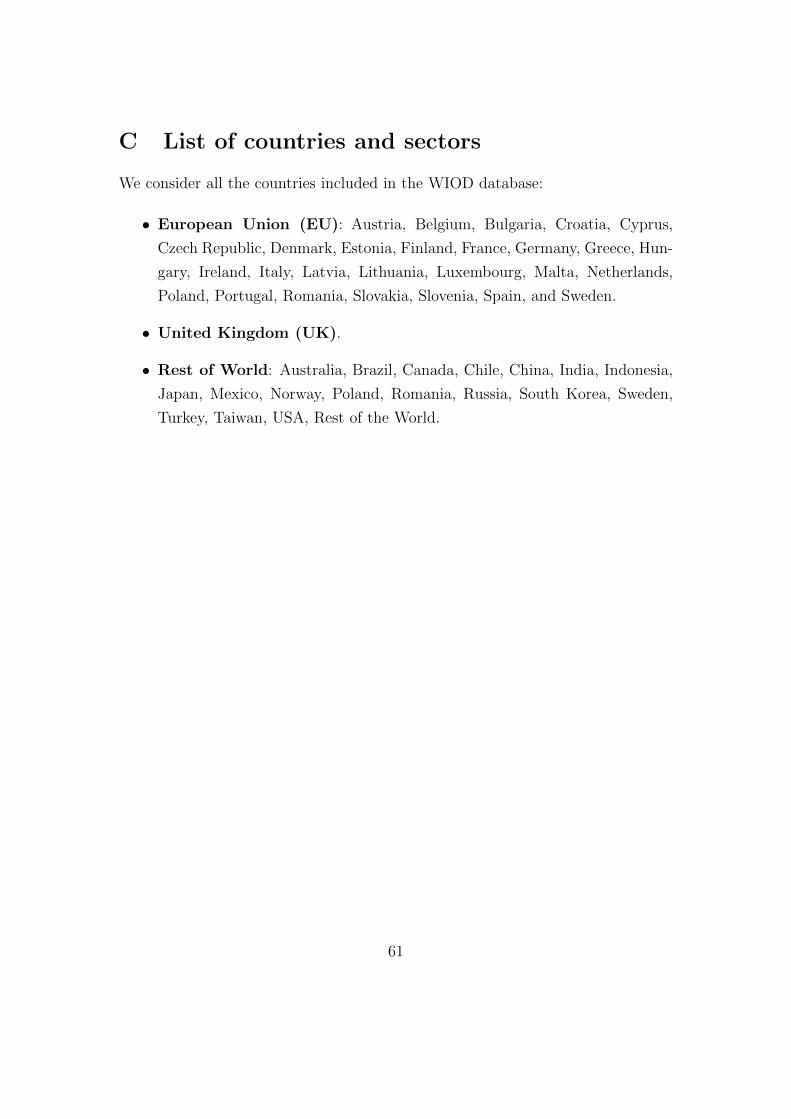
C List of countries and sectors
We consider all the countries included in the WIOD database:
• European Union (EU): Austria, Belgium, Bulgaria, Croatia, Cyprus,
Czech Republic, Denmark, Estonia, Finland, France, Germany, Greece, Hun-
gary, Ireland, Italy, Latvia, Lithuania, Luxembourg, Malta, Netherlands,
Poland, Portugal, Romania, Slovakia, Slovenia, Spain, and Sweden.
• United Kingdom (UK).
• Rest of World: Australia, Brazil, Canada, Chile, China, India, Indonesia,
Japan, Mexico, Norway, Poland, Romania, Russia, South Korea, Sweden,
Turkey, Taiwan, USA, Rest of the World.
61
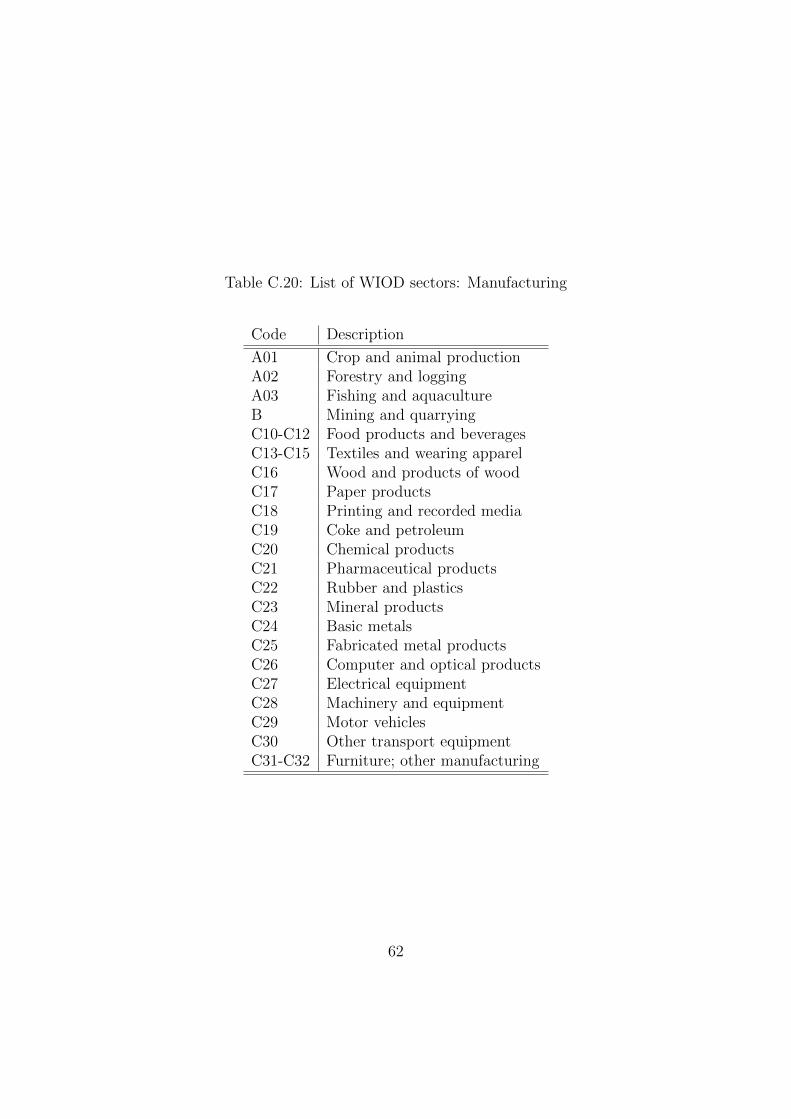
Table C.20: List of WIOD sectors: Manufacturing
Code Description
A01 Crop and animal productionA02 Forestry and loggingA03 Fishing and aquacultureB Mining and quarryingC10-C12 Food products and beveragesC13-C15 Textiles and wearing apparelC16 Wood and products of woodC17 Paper productsC18 Printing and recorded mediaC19 Coke and petroleumC20 Chemical productsC21 Pharmaceutical productsC22 Rubber and plasticsC23 Mineral productsC24 Basic metalsC25 Fabricated metal productsC26 Computer and optical productsC27 Electrical equipmentC28 Machinery and equipmentC29 Motor vehiclesC30 Other transport equipmentC31-C32 Furniture; other manufacturing
62
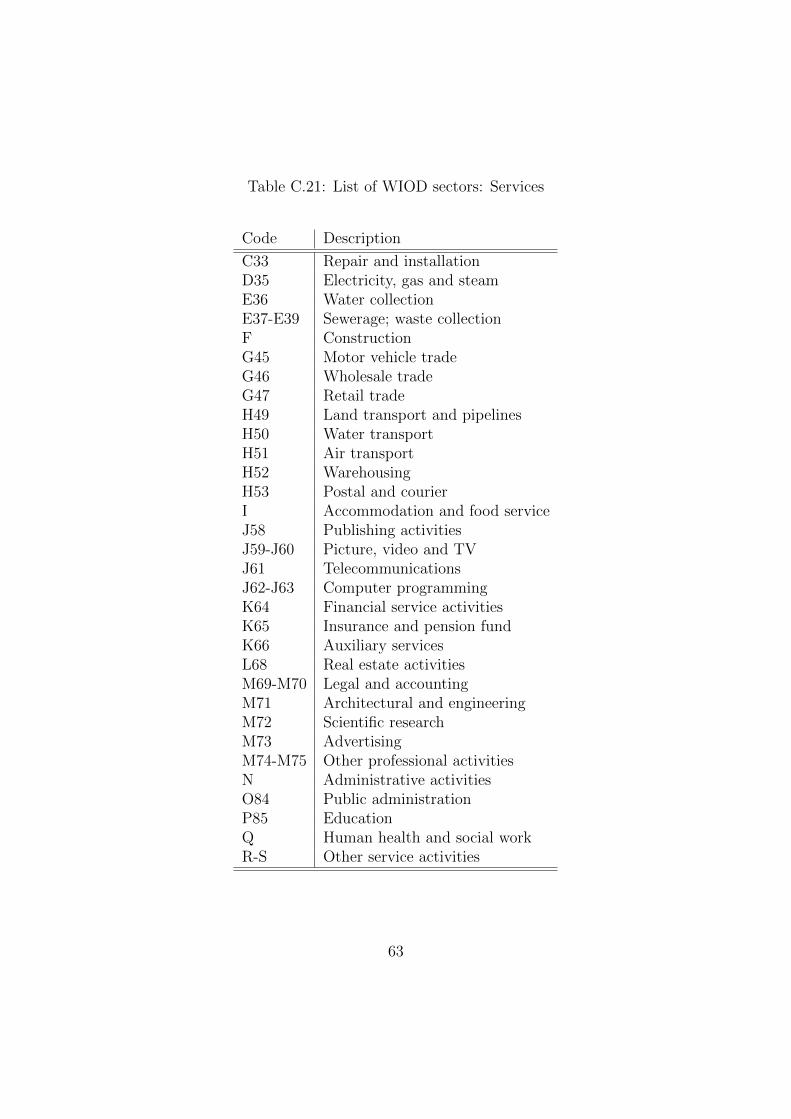
Table C.21: List of WIOD sectors: Services
Code Description
C33 Repair and installationD35 Electricity, gas and steamE36 Water collectionE37-E39 Sewerage; waste collectionF ConstructionG45 Motor vehicle tradeG46 Wholesale tradeG47 Retail tradeH49 Land transport and pipelinesH50 Water transportH51 Air transportH52 WarehousingH53 Postal and courierI Accommodation and food serviceJ58 Publishing activitiesJ59-J60 Picture, video and TVJ61 TelecommunicationsJ62-J63 Computer programmingK64 Financial service activitiesK65 Insurance and pension fundK66 Auxiliary servicesL68 Real estate activitiesM69-M70 Legal and accountingM71 Architectural and engineeringM72 Scientific researchM73 AdvertisingM74-M75 Other professional activitiesN Administrative activitiesO84 Public administrationP85 EducationQ Human health and social workR-S Other service activities
63