Embed Size (px)
Citation preview

© TNS 2016 263103937
Queenslanders’ Perceptions and Attitudes to ScienceBenchmark Research Report
Prepared for: Office of the Queensland Chief Scientist
TNS Consultants: Richard Bishop & Caitlin MancheJob No: 263103937Date: March 2016
1

© TNS 2016 263103937
Contents
2
1Executive Summary 3
2Visual Representation of 6 Broad Queensland Regions and Remoteness Classifications 8
3Awareness, knowledge and interest in Science 11
4Perceptions and attitudes towards Science 22
5Parents’ behaviours and attitudes towards their children studying Science 27
6Media and Science news / information 37
7Science activities and events 40
8Awareness of Queensland Science Projects and Scientists 56
9Demographics 59

© TNS 2016 263103937
1Executive Summary
3
© TNS 2016 263103937
Executive Summary (1)
Research background, objectives and methodology
Science impacts our lives every day and is vital to the state’s economic prosperity, and our current and future wellbeing. In addition, Queensland scientists are international leaders at the forefront of many breakthroughs and discoveries that have a significant impact on the Queensland community. Given this, public awareness and recognition of science is essential to engender increased support forscience at local, state and national levels.
In February/March 2016, TNS was commissioned by the Department of Science, Information Technology and Innovation (DSITI) to conduct research amongst Queensland adults to establish a benchmark of the perceptions and attitudes towards science. The research also aimed to understand current engagement and participation levels in science activities and identify differences across the state and between demographic groups. A total of n=1,200 Queensland residents (aged 18 years and over) completed the 10 minute online survey over a two week period from 29 February to 14 March 2016. Broad age and gender quotas were applied and a good spread of responses across the whole of the state was achieved (as highlighted to the right).
4
Data was post-weighted to 2011 ABS Census data to ensure that the sample is representative of the population statistics in Queensland. Weighting was conducted by age, gender and location within Queensland.
The results of the research will help inform the Advance Queensland Science Engagement and Communication Strategy (being implemented by the Office of the Queensland Chief Scientist). The vision is to create a Queensland population that engages in and recognises, supports and advocates for science. This has the potential to help influence the subject choices of students and ultimately career and job choices and contribute to the broader economy.
¹Effects of integrative approaches among STEM subjects on students’ learning’, Becker, K. and Park, K., Journal of STEM Education Volume 12 – Issue 5 & 6, July-September, 2011

© TNS 2016 263103937
Executive Summary (2)
Awareness, knowledge and interest in Science
Unprompted, most Queenslanders typically associate science in mainstream (school-related) terms with chemistry, biology, physicsand experiments the most common associations. After being informed of the broad range of topics that science encompasses, themajority (74%) of Queenslanders consider themselves interested in science.
Females are significantly less likely than males to be interested in science, and have markedly different areas of interest; females are focussed on health and medicine, biology and environmental science while males are more interested in technology, computer science and engineering. Interest in science is also significantly lower amongst the 18-24 age cohort (65% interested) compared to other age groups.
Perceptions and attitudes toward Science and science careers
Scientific development is perceived as having a positive impact on society by the majority of Queenslanders (76%), and is seen as being critical for the Queensland economy (72% in agreeance).
Whilst most Queensland parents (79%) stated they would encourage their children to consider science as a subject to study at school, fewer would actively encourage science as a career choice (59%). Interestingly, education figures show a decline in participation in science subjects. In the 20 years from 1992 to 2012 the total number of Australian students enrolled in year 12 increased by 16%, however for the same period participation rates for most Science and Mathematics subjects declined by approximately 8% (Kennedy, J et al, 2014²).
University websites, search engines and Government websites are the dominant choice for seeking information about a science-based career (72%, 51% and 47% respectively).
5
²Kennedy, J, Lyons,T and Quinn, F 2014, ‘The Continuing Decline of Science and Mathematics Enrolments in Australian High Schools’ Teaching Science, vol. 60, no. 2, pp 34-46

© TNS 2016 263103937
Executive Summary (3)
Media and Science news / information
Although the majority of Queenslanders are interested in science, almost one in two (45%) Queenslanders consider there is currently not enough information available. The survey results show that most Queenslanders passively receive information through massmedia channels (i.e. on TV and in newspapers), although one in four (26%) also passively receive information via social mediaplatforms.
Science Activities and Events
There is an appetite across Queensland for participating in science activities and events, with 47% considering there are not enough events/activities available – particularly for those outside South East Queensland (52% in agreeance that there is not enough available). Of the activities listed, ‘open house’ tours of science facilities and guided nature tours/nature play were the activities which drew the most interest (44% and 37% respectively).
With less than one in two aware of National Science Week (44%), and slightly more than one in ten aware of the World Science Festival (13%), the opportunity exists to drive awareness of these events across Queensland, especially since more than one in two (52%) indicated an interest in attending such events in the future.
Awareness of Queensland Science Projects and Scientists
Only one in five (20%) Queenslanders were able to spontaneously name notable Queensland scientists and/or discoveries. Even whenprompted with a list, two in five (41%) were still unaware of any of the scientists/discoveries listed. Amongst those that were aware, Professor Ian Frazer’s cervical cancer vaccine (Gardasil) had the highest awareness, both prompted and unprompted.
6

© TNS 2016 263103937
Executive Summary (4)
Where to from here?
It is clear from this research that Queenslanders are interested in science. However there is scope for improving in specific areas such as increasing interest levels of females and the younger generation (18-24 year olds) who were significantly less interested. Additionally, the research suggests we do not need to persuade Queenslanders about the benefits of science to society. Instead, the focus should be on increasing and enhancing dissemination of science information and events/activities, particularly in regionalQueensland.
While Queensland scientists are international leaders at the forefront of many breakthroughs and discoveries, this research indicates that Queenslanders are largely unaware of the significant, life-changing science and research taking place in their own backyard. Communication that promotes Queensland scientists/discoveries should be able to leverage the high levels of interest in science across the state.
Queenslanders largely expect to be notified about local science events or activities via the television and local newspapers/magazines, with these being the top two preferred channels for information across all Queensland regions, however this changes according to age with the younger generation preferring social media. An integrated multi-channel strategy for disseminating information would beoptimal to ensure age and region specific preferences were met.
Parents appear to be encouraging their children to undertake science but allowing independent decisions when it comes to career choice. This highlights the importance of ensuring both children and parents are sufficiently engaged and informed early in the career choice pathway and educated regarding the importance of STEM skills.
The Science Engagement and Communication Strategy currently being implemented by the Office of the Queensland Chief Scientist, has been updated to reflect these research findings so that it has an impact on identified areas of need. The Office of the Queensland Chief Scientist has established a benchmark with this research that will be measured again in the short-term, following the delivery of targeted initiatives.
7
© TNS 2016 263103937
2Visual Representation of 6 Broad Queensland Regions and Remoteness Classifications
8

© TNS 2016 263103937
6 Broad Queensland Regions
Far North Metro (includes Cairns and Port Douglas)
Remote/Outback Queensland
Northern/Mackay (includes Townsville and Mackay)
Darling Downs (includes Southern Downs, Western Downs, Toowoomba and Goondiwindi)
Greater Brisbane/Gold Coast/Sunshine Coast
Fitzroy/Wide Bay/Burnett (includes Rockhampton and Bundaberg)
Queensland region definitions are based on a combination of ABS Statistical Divisions and Queensland Government classifications. The map to the left shows an approximate visual representation of each region.
9
Weipa
Cairns
Townsville
Mackay
Rockhampton
Bundaberg
Brisbane
Toowoomba
Longreach
Cloncurry
Roma
Sample size achieved
n=210
n=227
n=254
n=252
n=190
n=67
© TNS 2016 263103937
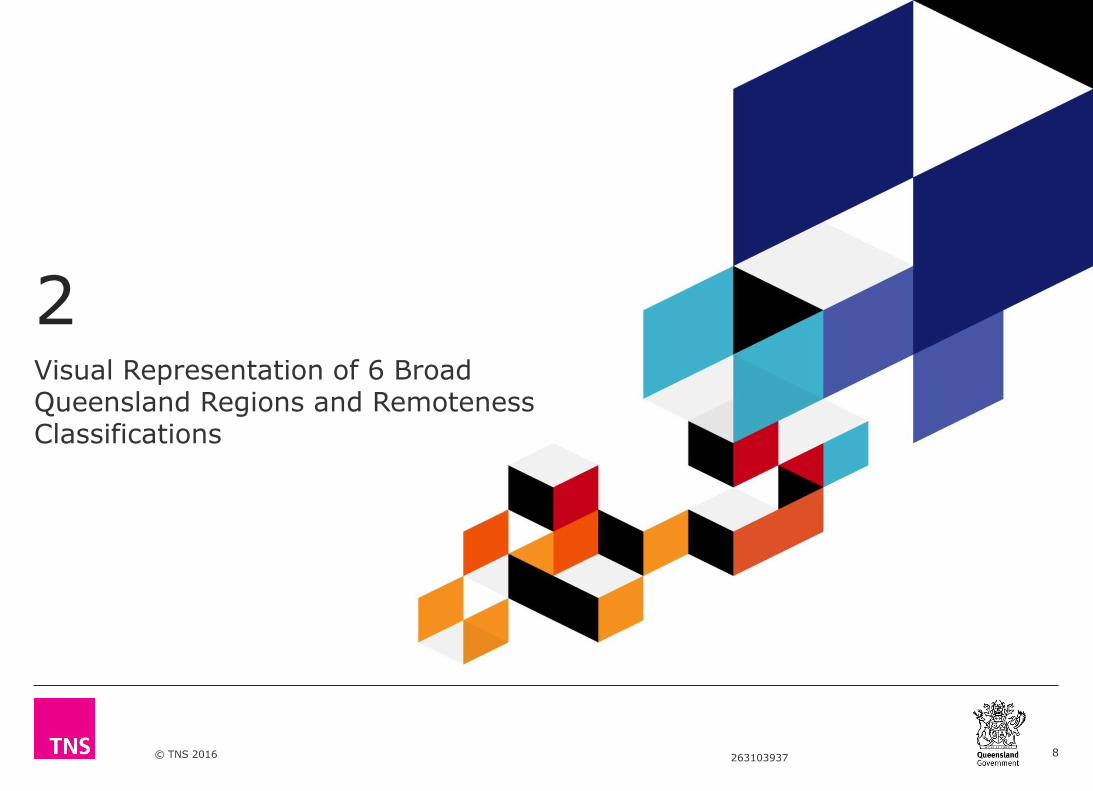
Remoteness Classifications
Remoteness classifications referenced throughout the report are based on the ABS 2011 Australian Statistical Geography Standard Queensland Remoteness Area boundaries.
10
Sample size achieved
n=117
n=551
n=352
n=180
Very remote
Remote
Outer regional
Inner regional
Major cities

© TNS 2016 263103937
3Awareness, knowledge and interest in Science
11

© TNS 2016 263103937
A1. When you think about science, what words or phrases first come to mind?BASE: All respondents (n=1200)Note: The top 100 words mentioned by respondents are shown in the above word cloud. Words mentioned more often are shown in larger text.
Unprompted Awareness / Understanding of Science
Unprompted, Queenslanders typically associate science in mainstream (school-related) terms with chemistry, biology, physics and experiments with science most commonly associated.
12

© TNS 2016 263103937
3 5 18 46 29
1 - Very disinterested
2 - Somewhat disinterested
3 - Neither interested nor disinterested
4 - Somewhat interested
5 - Very interested
Three in four (74%) Queenslanders are somewhat or very interested in science. A further one in five (18%) are ambivalent, with just 7% indicating they are somewhat or very disinterested.
A2. Thinking about science, as defined above, how interested would you say you are in science?BASE: All respondents (n=1200)
Interest in Science (%)
7% disinterested 74% interested
Mean (out of 5)
3.93
13

© TNS 2016 263103937
3
2
4
5
1
5
2
2
3
5
6
3
4
11
1
2
6
2
18
13
23
27
12
14
16
13
26
46
45
46
43
40
45
57
49
44
29
34
24
22
36
35
23
30
25
Total
Male
Female
18-24 years
25-34 years
35-44 years
45-54 years
55-64 years
65+ years
1 - Very disinterested 2 - Somewhat disinterested 3 - Neither interested nor disinterested 4 - Somewhat interested 5 - Very interested
Interest levels are higher amongst males compared to females. Those aged 18-24 years are less interested in science than other age groups.
A2. Thinking about science, as defined above, how interested would you say you are in science?BASE: All respondents (n=1200); Male (n=565); Female (n=635); 18-24 years (n=139); 24-34 years (n=231); 35-44 years (n=200); 45-54 years (n=190); 55-64 years (n=217); 65+ years (n=223)
Interest in Science (%) – by age and gender
Mean (out of 5)
Net disinterested
(rated 1 or 2 out of 5)
Net interested (rated 4 or 5
out of 5)
7% 74% 3.93
8% 79% 4.04
7% 70% 3.82
8% 65% 3.74
12% 76% 3.98
6% 80% 4.04
4% 80% 3.97
7% 78% 4.01
5% 69% 3.85
Significantly higher than total at 95% CI
Significantly lower than total at 95% CI
14
© TNS 2016 263103937
3
2
6
5
3
4
2
5
4
5
5
4
5
8
18
18
17
15
17
21
24
46
46
43
46
46
44
41
29
29
29
29
30
25
25
Total
Greater Brisbane/Gold Coast/
Sunshine Coast
Darling Downs
Northern/Mackay
Far North Metro
Fitzroy/Wide Bay/Burnett
Remote/Outback Queensland
1 - Very disinterested 2 - Somewhat disinterested 3 - Neither interested nor disinterested 4 - Somewhat interested 5 - Very interested
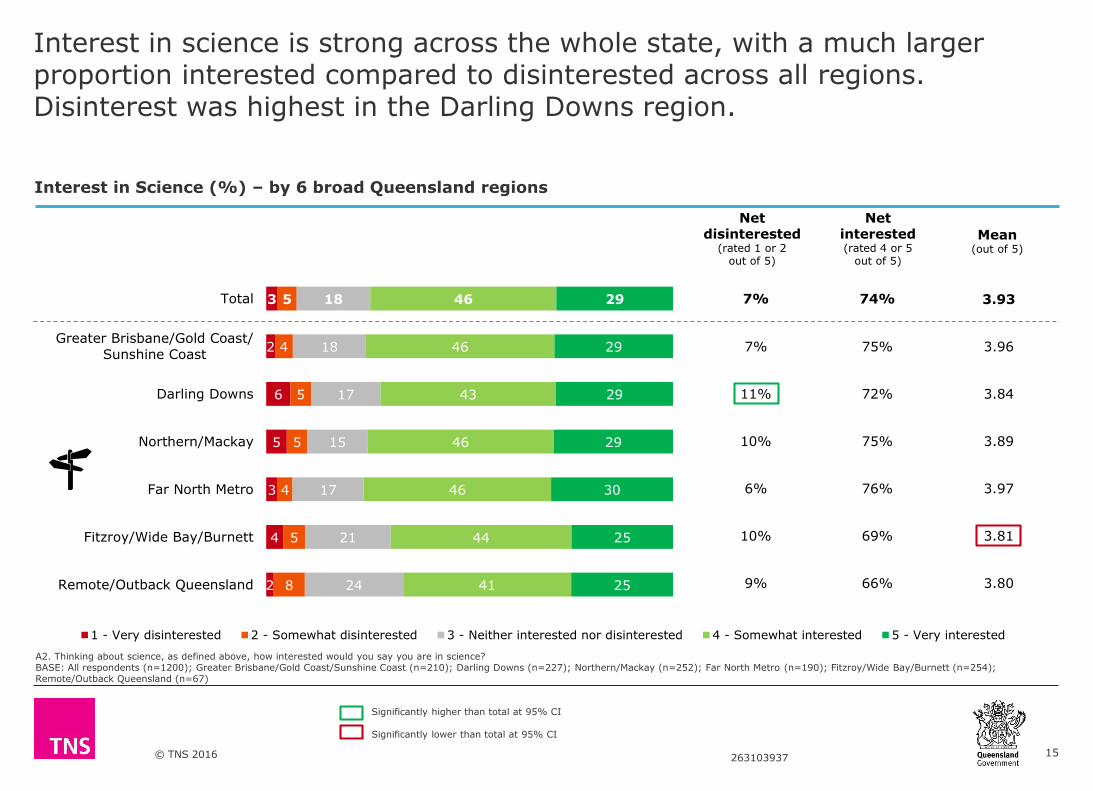
Interest in science is strong across the whole state, with a much larger proportion interested compared to disinterested across all regions. Disinterest was highest in the Darling Downs region.
A2. Thinking about science, as defined above, how interested would you say you are in science?BASE: All respondents (n=1200); Greater Brisbane/Gold Coast/Sunshine Coast (n=210); Darling Downs (n=227); Northern/Mackay (n=252); Far North Metro (n=190); Fitzroy/Wide Bay/Burnett (n=254); Remote/Outback Queensland (n=67)
Interest in Science (%) – by 6 broad Queensland regions
Mean (out of 5)
Net disinterested
(rated 1 or 2 out of 5)
Net interested (rated 4 or 5
out of 5)
7% 74% 3.93
7% 75% 3.96
11% 72% 3.84
10% 75% 3.89
6% 76% 3.97
10% 69% 3.81
9% 66% 3.80
Significantly higher than total at 95% CI
Significantly lower than total at 95% CI
15

© TNS 2016 263103937
Selected reasons provided amongst those “very disinterested” or “somewhat disinterested” in science.
A3. For what reason or reasons are you [RESPONSE FROM A2] in science? BASE: Those “very disinterested” or “somewhat disinterested” in science (n=111)Note: Verbatim responses were coded into common themes. Themes mentioned by >6% are shown.
Reasons disinterested in science (common themes and selected verbatim responses)
3
5
18
46
29
7% disinterested
It's not my thing. As long as something works I don't care
how it works.
It’s a boring topic to me. I am more into business stuff
and the sciences never interest me nor do I totally
understand it either.
Wasn't one of the subjects I most enjoyed at school -
more of an English/History person. Most science goes
over my head.
I hated it in school and could never understand or fathom it, and that has stuck with
me.
Unless I wish to be a scientist, I see no need for it.
Doesn't interest me, though the work performed is
amazing.
Not relevant to my work or lifestyle. I didn’t enjoy the
subject at school.
I suppose it didn't interest me at high school so I didn't listen about science basics.
Not very good at it and the topics don’t interest me at
all.
Rated “Very disinterested” in science
Rated “Somewhat disinterested” in science
Common themes mentions%
mentioned
Not interested / not my type of thing / boring 63%
Complicated /confusing / complex / don’t understand 20%
Do not have time to explore it / only when I have time / don’t go out of my way to look for it
7%
16
© TNS 2016 263103937
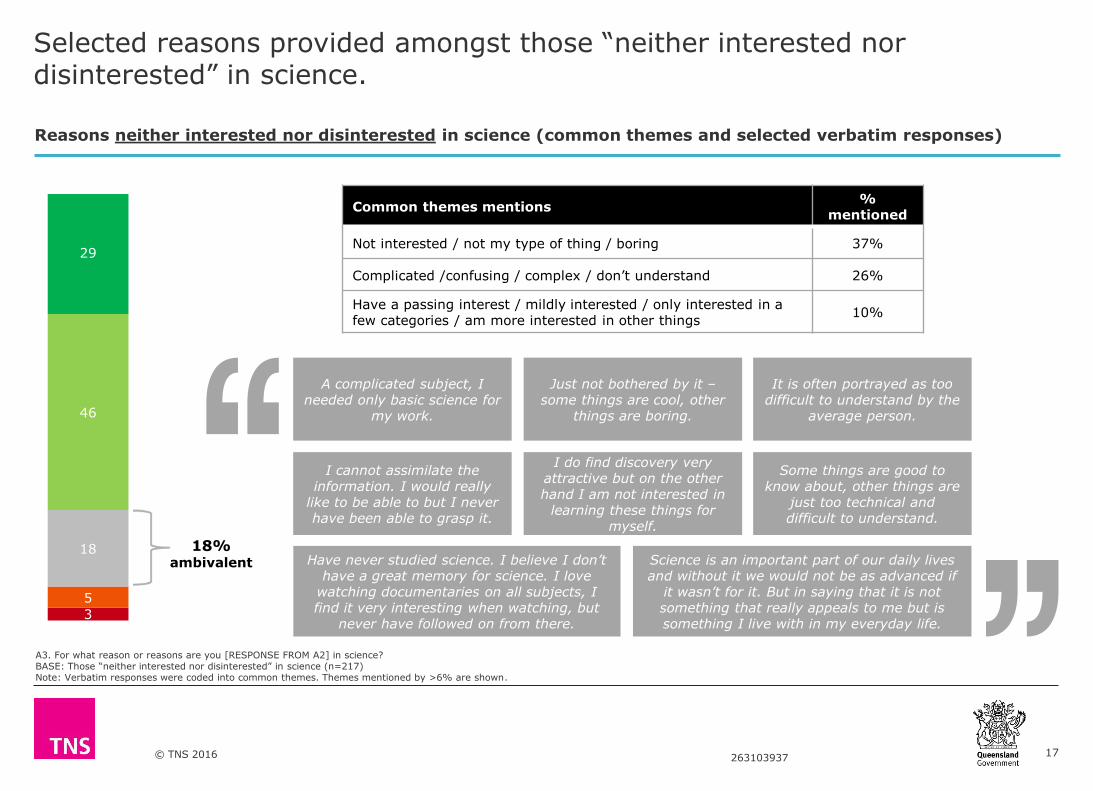
A3. For what reason or reasons are you [RESPONSE FROM A2] in science? BASE: Those “neither interested nor disinterested” in science (n=217)Note: Verbatim responses were coded into common themes. Themes mentioned by >6% are shown.
Reasons neither interested nor disinterested in science (common themes and selected verbatim responses)
3
5
18
46
29
18% ambivalent
A complicated subject, I needed only basic science for
my work.
Just not bothered by it –some things are cool, other
things are boring.
I cannot assimilate the information. I would really
like to be able to but I never have been able to grasp it.
It is often portrayed as too difficult to understand by the
average person.
Have never studied science. I believe I don’t have a great memory for science. I love
watching documentaries on all subjects, I find it very interesting when watching, but
never have followed on from there.
I do find discovery very attractive but on the other hand I am not interested in
learning these things for myself.
Some things are good to know about, other things are
just too technical and difficult to understand.
Science is an important part of our daily lives and without it we would not be as advanced if
it wasn’t for it. But in saying that it is not something that really appeals to me but is something I live with in my everyday life.
Selected reasons provided amongst those “neither interested nor disinterested” in science.
Common themes mentions%
mentioned
Not interested / not my type of thing / boring 37%
Complicated /confusing / complex / don’t understand 26%
Have a passing interest / mildly interested / only interested in a few categories / am more interested in other things
10%
17
© TNS 2016 263103937
Common themes mentions % mentioned
I find it / have always found it interesting / intriguing / engaging / exciting / have an enquiring mind
17%
To gain more knowledge / to advance my knowledge / to learn more 16%
New discoveries / new developments / new findings / new technology / advances / progress
11%
It fascinates me / amazing / impressive 9%
Explains the world / the universe / how the world began / involves the world around us / want to understand the world we live in / the wonders of the world
7%
Medical sciences / medicine / medical advancements / health side of science / cures for diseases / ways to combat diseases / medical breakthrough
7%
Understanding how and why things work the way they do 7%
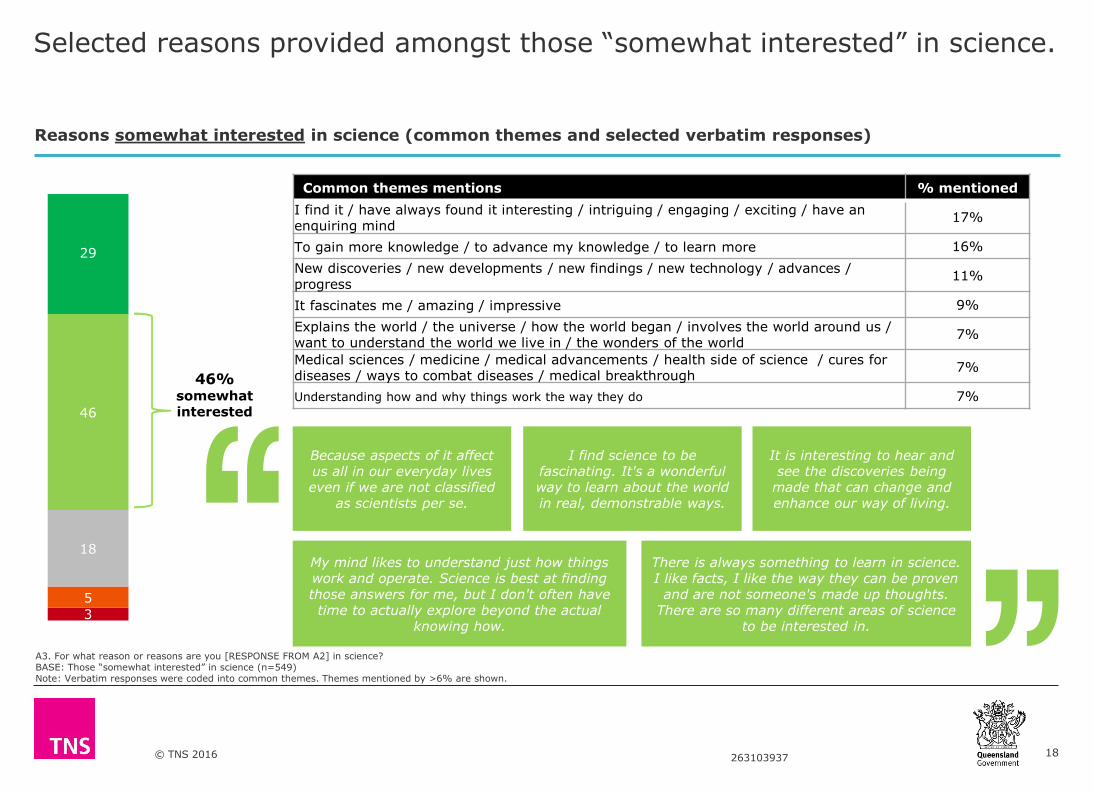
A3. For what reason or reasons are you [RESPONSE FROM A2] in science? BASE: Those “somewhat interested” in science (n=549)Note: Verbatim responses were coded into common themes. Themes mentioned by >6% are shown.
Reasons somewhat interested in science (common themes and selected verbatim responses)
3
5
18
46
29
46% somewhat interested
My mind likes to understand just how things work and operate. Science is best at finding those answers for me, but I don't often have time to actually explore beyond the actual
knowing how.
There is always something to learn in science. I like facts, I like the way they can be proven
and are not someone's made up thoughts. There are so many different areas of science
to be interested in.
Selected reasons provided amongst those “somewhat interested” in science.
Because aspects of it affect us all in our everyday lives even if we are not classified
as scientists per se.
I find science to be fascinating. It's a wonderful way to learn about the world in real, demonstrable ways.
It is interesting to hear and see the discoveries being
made that can change and enhance our way of living.
18

© TNS 2016 263103937
Common themes mentions % mentioned
I find it / have always found it interesting / intriguing / engaging / exciting / have an enquiring mind
23%
Explains the world / the universe / how the world began / involves the world around us / want to understand the world we live in / the wonders of the world
17%
Understanding how and why things work the way they do 15%
New discoveries / new developments / new findings / new technology / advances / progress 14%
Have a degree / am currently studying a science related course / am qualified to work in a scientific field / it's my career
11%
It fascinates me / amazing / impressive 10%
To gain more knowledge / to advance my knowledge / to learn more / always learning something new
9%
I am interested in the environment / environmental protection / environmental issues / global warming / climate change
7%
A3. For what reason or reasons are you [RESPONSE FROM A2] in science? BASE: Those “very interested” in science (n=344)Note: Verbatim responses were coded into common themes. Themes mentioned by >6% are shown.
Reasons very interested in science (common themes and selected verbatim responses)
3
5
18
46
2929% very
interested
I believe it is integral to all aspects of life and I love
learning about why things occur as well as how and also being
able to use information to make changes for the better.
Although I do not have a very scientific mind, I love
celebrating the work of others and hearing about
developments and discoveries which broaden our
understanding of the universe.
Because it is central to the world we live in;
material progress and improvement in health is virtually impossible without science; it is
intrinsically interesting.
Because it can and will impact on my future in the areas of health and
environment.
I love to learn. I like to know how things work, I'm not
comfortable with answering the question: "How does this work?" with the answer "it just does“.
Directly related to my job. Helps us understand the world
we live in. Solutions to problems.
Selected reasons provided amongst those “very interested” in science.
19

© TNS 2016 263103937
54
45
40
39
33
30
25
24
22
22
20
14
2
9
Health and medicine
Technology
Astronomy
Biology
Environmental studies
Computer Science
Physics
Agriculture
Geology
Engineering
Chemistry
Mathematics
Other
None
Areas of Science Interest (Total %)
A4. Which of the following broad areas of science are you interested in? BASE: Those who are not “very disinterested” in science (n=1152); Male (n=549); Female (n=603)
Overall, health and medicine, technology, astronomy and biology were the most commonly nominated science areas of interest. Males and females are interested in different topics.
42% 66%
57% 33%
43% 37%
33% 46%
26% 39%
42% 18%
36% 14%
22% 26%
21% 23%
37% 7%
35% 15%
18% 10%
1% 3%
8% 10%
Significantly higher than total at 95% CI
Significantly lower than total at 95% CI
Areas of Science Interest (%) – by gender
20

© TNS 2016 263103937
Areas of Science Interest (%) – regional differences
A4. Which of the following broad areas of science are you interested in? BASE: Those who are not “very disinterested” in science (n=1152); Greater Brisbane/Gold Coast/Sunshine Coast (n=206); Darling Downs (n=213); Northern/Mackay (n=239); Far North Metro (n=184); Fitzroy/Wide Bay/Burnett (n=244); Remote/Outback Queensland (n=66)
On the whole, there are minimal differences in areas of science interest based on regional location.
Greater Brisbane/Gold
Coast/Sunshine Coast
Darling Downs Northern/Mackay Far North MetroFitzroy/Wide Bay/Burnett
Remote/Outback Queensland
Areas of significantly
higher interest level than total
Chemistry(28% vs. 20%)
Mathematics (21% vs. 14%)
Geology(28% vs. 22%)
Geology (30% vs. 22%)
Chemistry(29% vs. 20%)
Mathematics (27% vs. 14%)
Chemistry(27% vs. 20%)
Mathematics (20% vs. 14%)
Areas of significantly
lower interest level than total
Engineering (16% vs. 22%)
Computer science
(21% vs. 30%)
Biology (26% vs. 39%)
21

© TNS 2016 263103937
4Perceptions and attitudes towards Science
22

© TNS 2016 263103937
2 2 13 32 45 6
1 - Significant negative impact
2 - Small negative impact
3 - Neither negative nor positive
4 - Small positive impact
5 - Significant positive impact
Don't know
Perceived overall impact of scientific development on society (%)
5% negative impact
76% positive impact
Mean (out of 5)
4.21
Key demographic differences:
Those with an undergraduate or postgraduate degree are significantly more likely to perceive that scientific
development is having a positive impact on society compared to those with lower education levels (89% vs.
72% rating 4 or 5 out of 5). This was also the case amongst those ‘interested’ in science, compared to those ‘ambivalent’
or ‘disinterested’ (87% vs. 45% rating 4 or 5 out of 5).
B1a. And overall, please indicate the impact you believe scientific development is having on society in general. BASE: All respondents (n=1200)
Overall, three in four (76%) believe that scientific development is having a positive impact on society. Only 5% are of the opinion that scientific development is negatively impacting society.
23

© TNS 2016 263103937
2
3
2
2
3
3
3
4
7
5
10
17
18
19
21
24
32
35
35
34
59
42
38
36
34
2
3
3
2
3
Health and
medicine
Communications
Food and
agriculture
Energy
The environment
1 - Significant negative impact 2 - Small negative impact 3 - Neither negative nor positive 4 - Small positive impact 5 - Significant positive impact Don't know
Perceived impact of various areas of scientific development on society (%)
Health and medicine, communications and food and agriculture are the areas of science perceived to have the greatest positive impact on society. At least one in five consider scientific development in the areas of climate change and mining to be negatively impacting society.
Top 2(rated 4 or 5
out of 5)
83%
74%
73%
71%
68%
4
5
10
12
8
9
10
15
24
28
30
26
36
29
23
22
25
26
24
21
3
4
3
3
Manufacturing
National security
Climate change
Mining
Top 2(rated 4 or 5
out of 5)
61%
55%
47%
43%
B1. Please indicate whether you believe scientific development in the following areas is having a positive or negative impact on society. BASE: All respondents (n=1200)
24
© TNS 2016 263103937
1
1
2
5
1
2
5
15
21
11
21
26
32
27
41
47
48
38
35
33
25
17
10
10
10
4
4
4
4
5
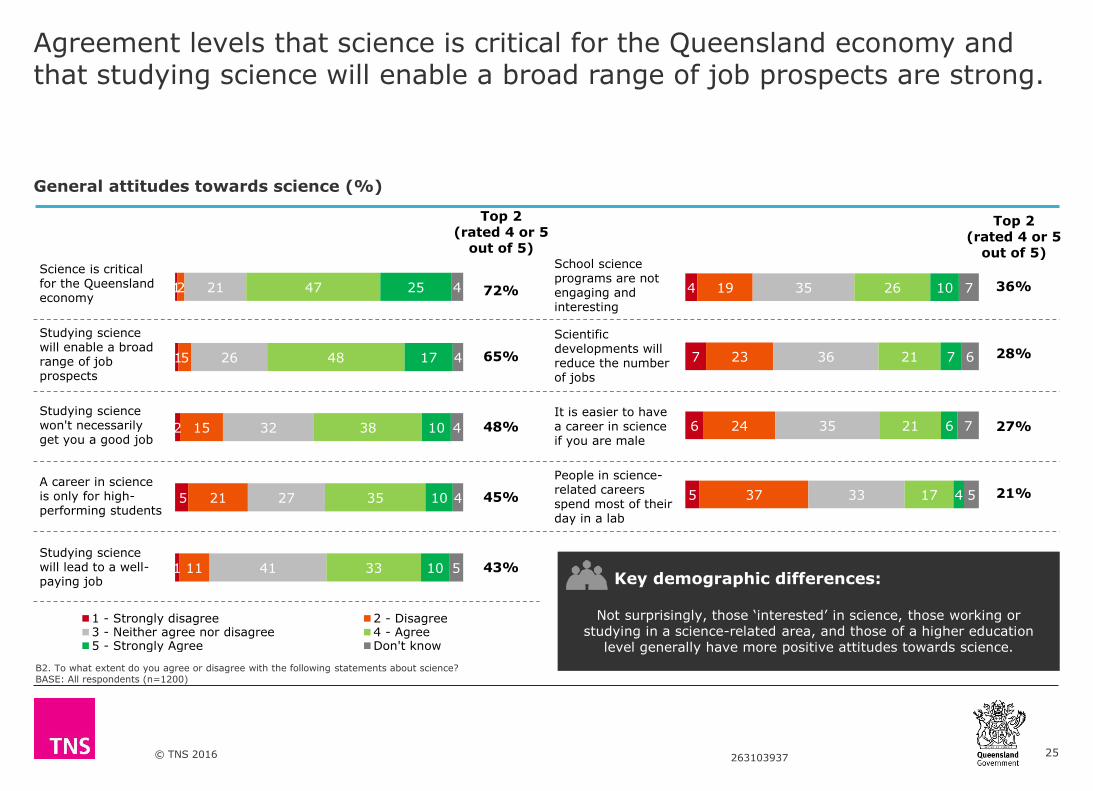
1 - Strongly disagree 2 - Disagree3 - Neither agree nor disagree 4 - Agree5 - Strongly Agree Don't know
Top 2(rated 4 or 5
out of 5)
72%
65%
48%
45%
43%
General attitudes towards science (%)
Science is critical for the Queensland economy
Studying science will enable a broad range of job prospects
Studying science won't necessarily get you a good job
A career in science is only for high-performing students
Studying science will lead to a well-paying job
B2. To what extent do you agree or disagree with the following statements about science? BASE: All respondents (n=1200)
Agreement levels that science is critical for the Queensland economy and that studying science will enable a broad range of job prospects are strong.
4
7
6
5
19
23
24
37
35
36
35
33
26
21
21
17
10
7
6
4
7
6
7
5
School science programs are not engaging and interesting
Scientific developments will reduce the number of jobs
It is easier to have a career in science if you are male
People in science-related careers spend most of their day in a lab
Top 2(rated 4 or 5
out of 5)
36%
28%
27%
21%
Key demographic differences:
Not surprisingly, those ‘interested’ in science, those working or studying in a science-related area, and those of a higher education
level generally have more positive attitudes towards science.
25
© TNS 2016 263103937
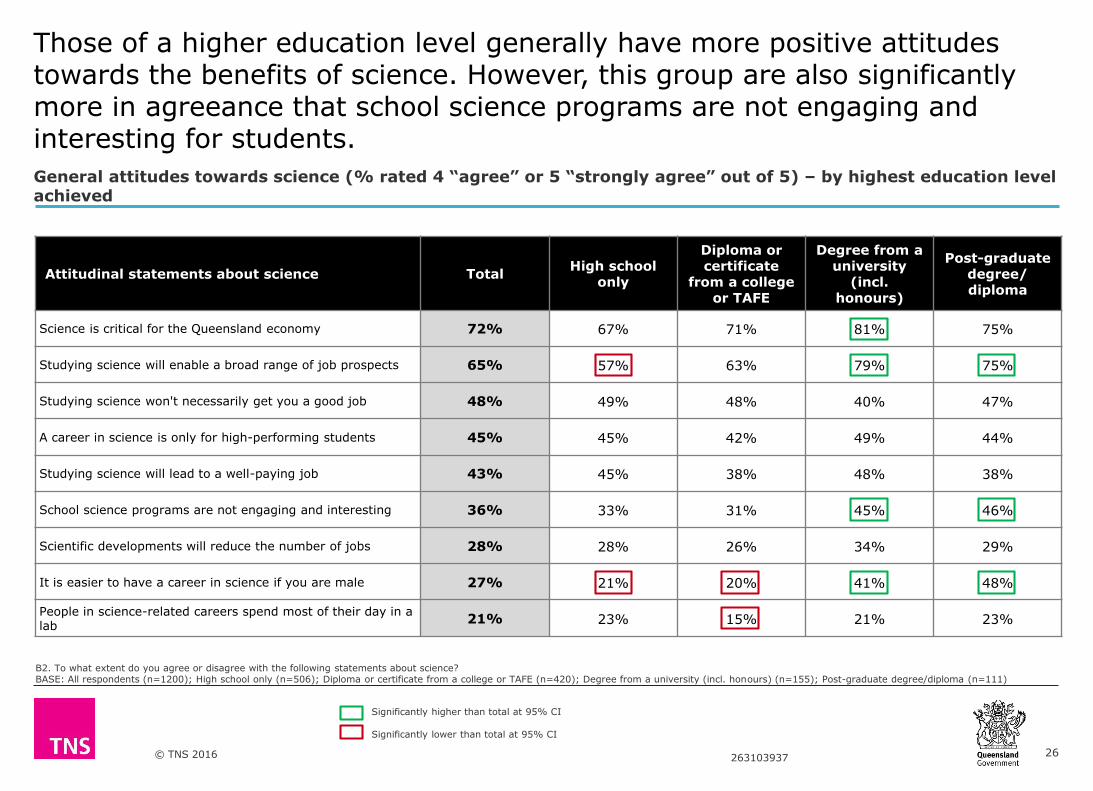
General attitudes towards science (% rated 4 “agree” or 5 “strongly agree” out of 5) – by highest education level achieved
B2. To what extent do you agree or disagree with the following statements about science? BASE: All respondents (n=1200); High school only (n=506); Diploma or certificate from a college or TAFE (n=420); Degree from a university (incl. honours) (n=155); Post-graduate degree/diploma (n=111)
Those of a higher education level generally have more positive attitudes towards the benefits of science. However, this group are also significantly more in agreeance that school science programs are not engaging and interesting for students.
26
Significantly higher than total at 95% CI
Significantly lower than total at 95% CI
Attitudinal statements about science TotalHigh school
only
Diploma or certificate
from a collegeor TAFE
Degree from a university
(incl. honours)
Post-graduate degree/ diploma
Science is critical for the Queensland economy 72% 67% 71% 81% 75%
Studying science will enable a broad range of job prospects 65% 57% 63% 79% 75%
Studying science won't necessarily get you a good job 48% 49% 48% 40% 47%
A career in science is only for high-performing students 45% 45% 42% 49% 44%
Studying science will lead to a well-paying job 43% 45% 38% 48% 38%
School science programs are not engaging and interesting 36% 33% 31% 45% 46%
Scientific developments will reduce the number of jobs 28% 28% 26% 34% 29%
It is easier to have a career in science if you are male 27% 21% 20% 41% 48%
People in science-related careers spend most of their day in a lab
21% 23% 15% 21% 23%
© TNS 2016 263103937
5Parents’ behaviours and attitudes towards their children studying Science
27
© TNS 2016 263103937
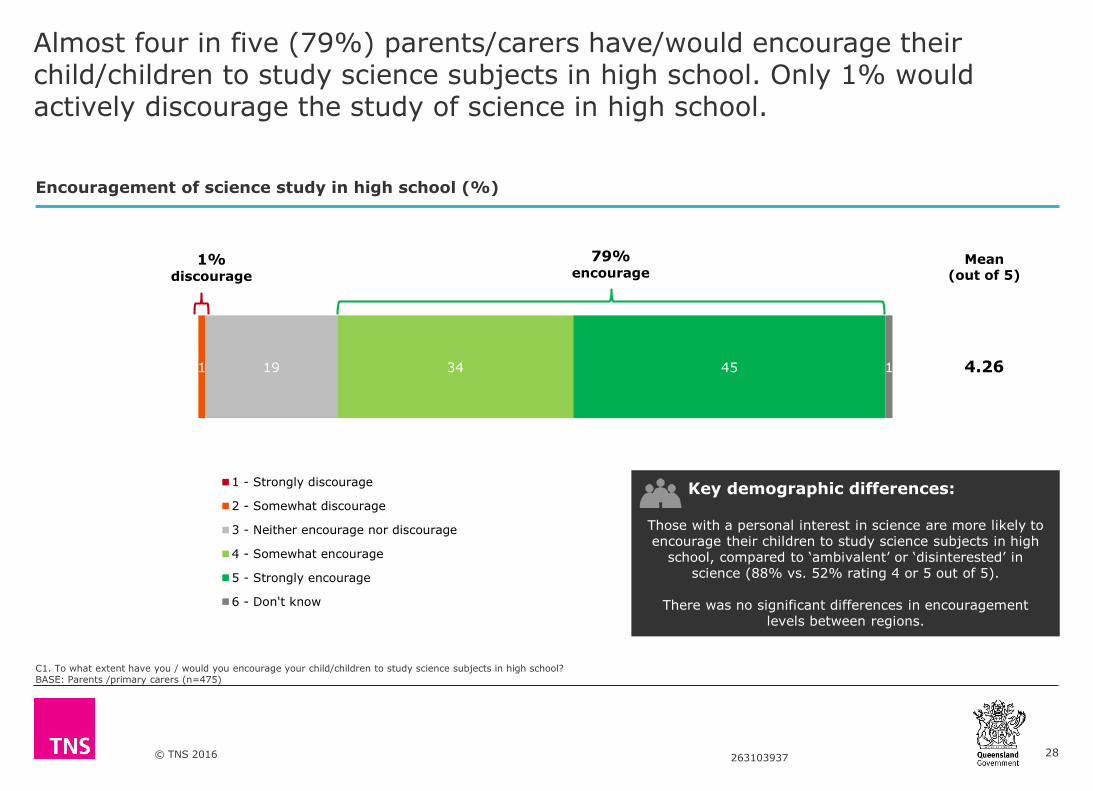
Almost four in five (79%) parents/carers have/would encourage their child/children to study science subjects in high school. Only 1% would actively discourage the study of science in high school.
C1. To what extent have you / would you encourage your child/children to study science subjects in high school? BASE: Parents /primary carers (n=475)
Encouragement of science study in high school (%)
1 19 34 45 1
1 - Strongly discourage
2 - Somewhat discourage
3 - Neither encourage nor discourage
4 - Somewhat encourage
5 - Strongly encourage
6 - Don't know
1% discourage
79% encourage
Mean (out of 5)
4.26
Key demographic differences:
Those with a personal interest in science are more likely to encourage their children to study science subjects in high
school, compared to ‘ambivalent’ or ‘disinterested’ in science (88% vs. 52% rating 4 or 5 out of 5).
There was no significant differences in encouragement levels between regions.
28

© TNS 2016 263103937
1 19 34 45 1
1% discourage 79% encourage
Selected reasons provided for discouraging and encouraging children to study science subjects in high school.
Reasons for discouraging/ambivalence towards/encouraging science study (Selected verbatim responses)
Because of HECS fees it’s not worth the investment.
It has a wide range of applications for career diversity. If they enjoy science they should consider it as a career option over something they don't enjoy.
Science opens the mind to critical thinking, e.g., how to help people get well, growing food with more nutrition. How to help create a better world.
There's so much in the world to learn about. Learning all different aspects of science can be fun, intriguing, informative and can be useful in everyday life.
Science is the basis of so many career paths I think that it is important that science be still a part of the curriculum for those students wanting to go on and learn and study different career paths in the future.
If they were able to do it I would actively encourage them but if they were unable to keep up or understand or if they weren't interested I would be more inclined to agree with them studying something else.
I want my child to have a bright future and studying all areas of science will give her a better understanding of the world.
C2. Why is that?BASE: Parents /primary carers who: “strongly discourage” or “somewhat discourage” science study (n=6); “neither encourage nor discourage” science study (n=82); “somewhat encourage” science study (n=163); “strongly encourage” science study (n=219)
Boring.
By the time kids go to high school they should make their own decisions – it’s their future.
I would encourage my children to follow their own interests when choosing subjects to study.
It’s up to my kids what areas they’re interested in and passionate about. If that should be science – great – but if not, that’s great too. They have to enjoy what they’re doing.
Rated “Somewhat discourage”
Rated “Neither encourage nor discourage”
Rated “Somewhat encourage”
Rated “Strongly encourage”
29
© TNS 2016 263103937
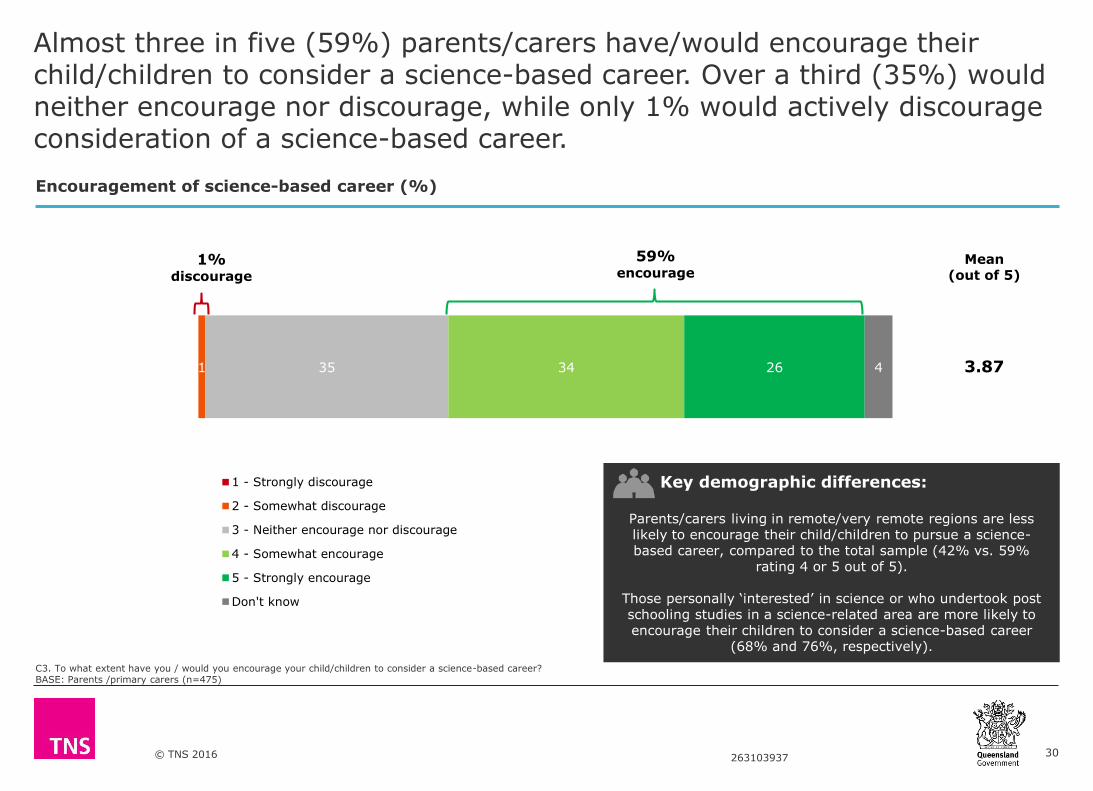
Almost three in five (59%) parents/carers have/would encourage their child/children to consider a science-based career. Over a third (35%) would neither encourage nor discourage, while only 1% would actively discourage consideration of a science-based career.
C3. To what extent have you / would you encourage your child/children to consider a science-based career? BASE: Parents /primary carers (n=475)
Encouragement of science-based career (%)
1 35 34 26 4
1 - Strongly discourage
2 - Somewhat discourage
3 - Neither encourage nor discourage
4 - Somewhat encourage
5 - Strongly encourage
Don't know
1% discourage
59% encourage
Mean (out of 5)
3.87
Key demographic differences:
Parents/carers living in remote/very remote regions are less likely to encourage their child/children to pursue a science-based career, compared to the total sample (42% vs. 59%
rating 4 or 5 out of 5).
Those personally ‘interested’ in science or who undertook post schooling studies in a science-related area are more likely to encourage their children to consider a science-based career
(68% and 76%, respectively).
30
© TNS 2016 263103937
If it is the career path they are happy doing, they should follow their passion.
1
35
34
26
4
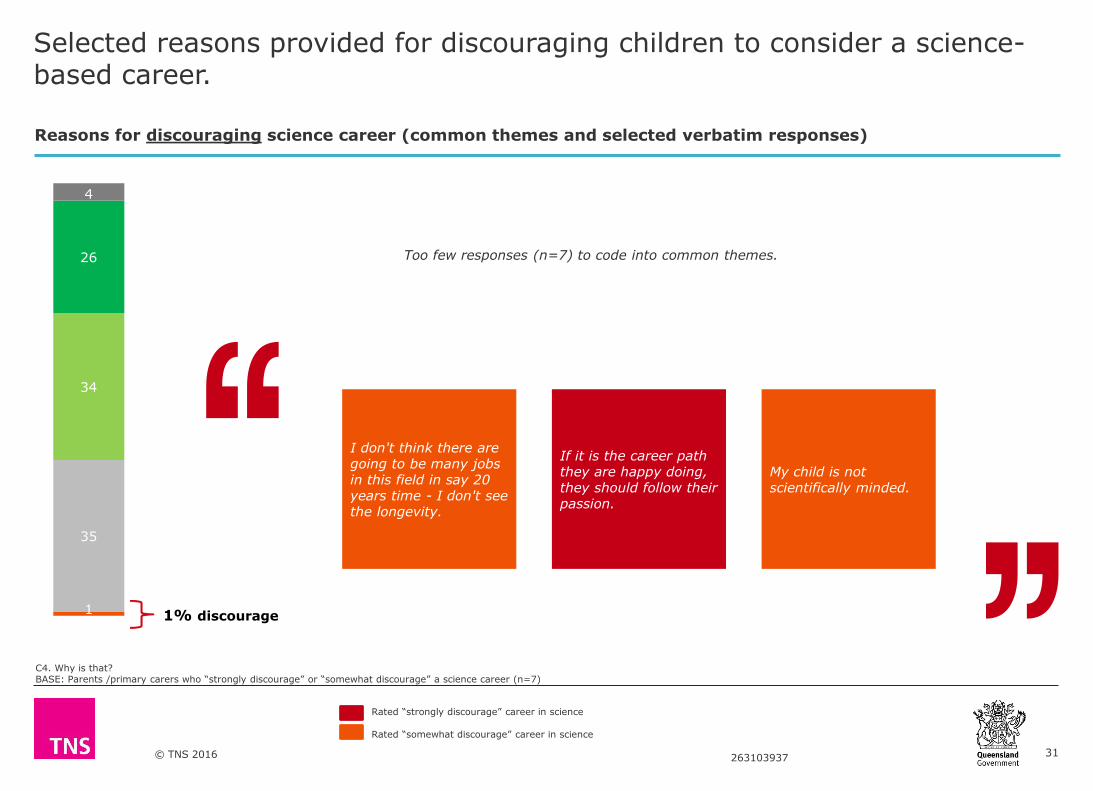
Selected reasons provided for discouraging children to consider a science-based career.
Reasons for discouraging science career (common themes and selected verbatim responses)
Rated “strongly discourage” career in science
Rated “somewhat discourage” career in science
C4. Why is that?BASE: Parents /primary carers who “strongly discourage” or “somewhat discourage” a science career (n=7)
1% discourage
I don't think there are going to be many jobs in this field in say 20 years time - I don't see the longevity.
My child is not scientifically minded.
Too few responses (n=7) to code into common themes.
31
© TNS 2016 263103937
1
35
34
26
4
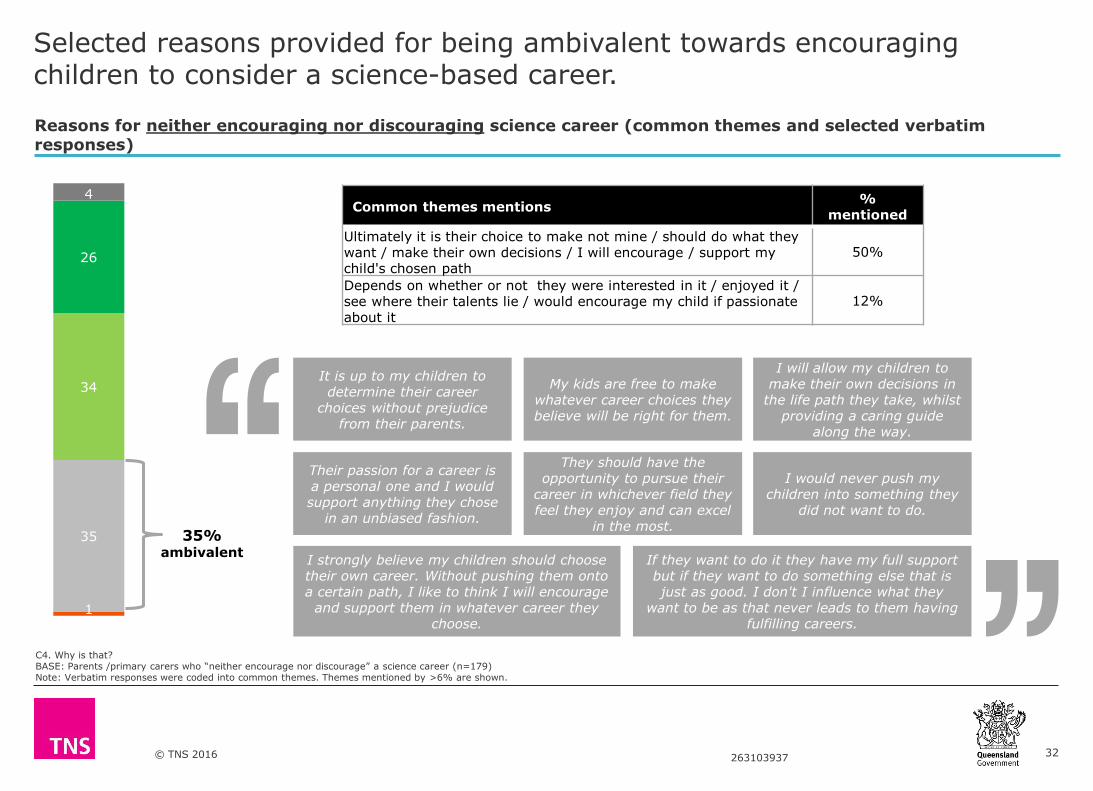
C4. Why is that?BASE: Parents /primary carers who “neither encourage nor discourage” a science career (n=179)Note: Verbatim responses were coded into common themes. Themes mentioned by >6% are shown.
Reasons for neither encouraging nor discouraging science career (common themes and selected verbatim responses)
35% ambivalent
It is up to my children to determine their career
choices without prejudice from their parents.
My kids are free to make whatever career choices they believe will be right for them.
Their passion for a career is a personal one and I would support anything they chose
in an unbiased fashion.
I will allow my children to make their own decisions in
the life path they take, whilst providing a caring guide
along the way.
I strongly believe my children should choose their own career. Without pushing them onto a certain path, I like to think I will encourage
and support them in whatever career they choose.
They should have the opportunity to pursue their
career in whichever field they feel they enjoy and can excel
in the most.
I would never push my children into something they
did not want to do.
If they want to do it they have my full support but if they want to do something else that is just as good. I don't I influence what they
want to be as that never leads to them having fulfilling careers.
Common themes mentions%
mentioned
Ultimately it is their choice to make not mine / should do what they want / make their own decisions / I will encourage / support my child's chosen path
50%
Depends on whether or not they were interested in it / enjoyed it / see where their talents lie / would encourage my child if passionate about it
12%
Selected reasons provided for being ambivalent towards encouraging children to consider a science-based career.
32
© TNS 2016 263103937
Common themes mentions % mentioned
Broader career options / career choices / good career opportunities in science related jobs / good job prospects / job security
21%
Depends on whether or not they were interested in it / enjoyed it / see where their talents lie / would encourage my child if passionate about it
14%
An interesting / enjoyable / rewarding career / satisfying work 11%
Ultimately it is their choice to make not mine / should do what they want / make their own decisions / I will encourage / support my child's chosen path
11%
Knowledge / to gain more knowledge / scientific knowledge / development / opens your mind to new things / better understanding of everything
9%
Science is a very important field / wide scope to study / school subject / would like my children to study science
9%
They can have a positive impact / make a difference / contribute to society / be involved in pioneering studies
8%
Better paying jobs / better paying career / well paid 7%
C4. Why is that?BASE: Parents /primary carers who “somewhat encourage” a science career (n=172)Note: Verbatim responses were coded into common themes. Themes mentioned by >6% are shown.
34% somewhat encourage
It is ultimately their choice. I think it would be great for them, But I refuse to push them into a career that they don't chose for themselves. Having said that, I will help as much as I can
once they have made their choice.
I think my children also need to have input into this. If they do not have an aptitude for the sciences I wouldn't strongly encourage them into an area they show no interest in.
It may result in a good job, well paid, interesting if they are passionate about it and will be great for the country.
There are a lot of science based careers available, but in the end, so long as my child enjoys their
occupation, they can go into whatever field they want.
It's a well paying industry and it might be an
enjoyable job. and they can make a positive impact
on society.
Reasons for somewhat encouraging science career (common themes and selected verbatim responses)
1
35
34
26
4
Selected reasons provided for somewhat encouraging children to consider a science-based career.
33

© TNS 2016 263103937
Common themes mentions % mentioned
Broader career options / career choices / good career opportunities in science related jobs / good job prospects / job security
16%
They can have a positive impact / make a difference / contribute to society / be involved in pioneering studies
16%
Knowledge / to gain more knowledge / scientific knowledge / development / opens your mind to new things / better understanding of everything
15%
An interesting / enjoyable / rewarding career / satisfying work 10%
Science is a very important field / wide scope to study / school subject / would like my children to study science
10%
It's the way of the future / it is the future / future is based on science 9%
I want the best for them / best for my child / to have a good future / my child already has their career path defined / knows what he wants to do after school
8%
Better paying jobs / better paying career / well paid 8%
Good / like / OK / nice (unspecific positive response) 7%
My child loves science / I love science / am interested in science / have a degree in science 7%
My children are smart / can do anything if they put their mind to it 7%
C4. Why is that?BASE: Parents /primary carers who “strongly encourage” a science career (n=100)Note: Verbatim responses were coded into common themes. Themes mentioned by >6% are shown.
26% strongly
encourage
Whether qualified as a nurse, computer
technician, researcher, librarian, admin officer, farmer,
photographer or accountant, you can
find a job in the world of science.
The idea of an ever-changing workplace is exciting. Science can be fun and exciting
and lead to so many different fields all over the world. With science degree you can travel most places regardless of what
science field you go into.
Wide choice of employment opportunities around the world, professionally and
personally satisfying.
Because it is an interesting job and
you could be the first person to discover a cure for something or discover something.
It can open the doors to numerous exciting and interesting jobs.
Reasons for strongly encouraging science career (common themes and selected verbatim responses)
1
35
34
26
4
Selected reasons provided for strongly encouraging children to consider a science-based career.
34
© TNS 2016 263103937
72
51
47
35
32
29
20
13
4
11
University websites
Search engine
Government websites
Employment websites
Family, friends and colleagues
Specific company websites
Blogs and forums
Social media
Other
Don't know
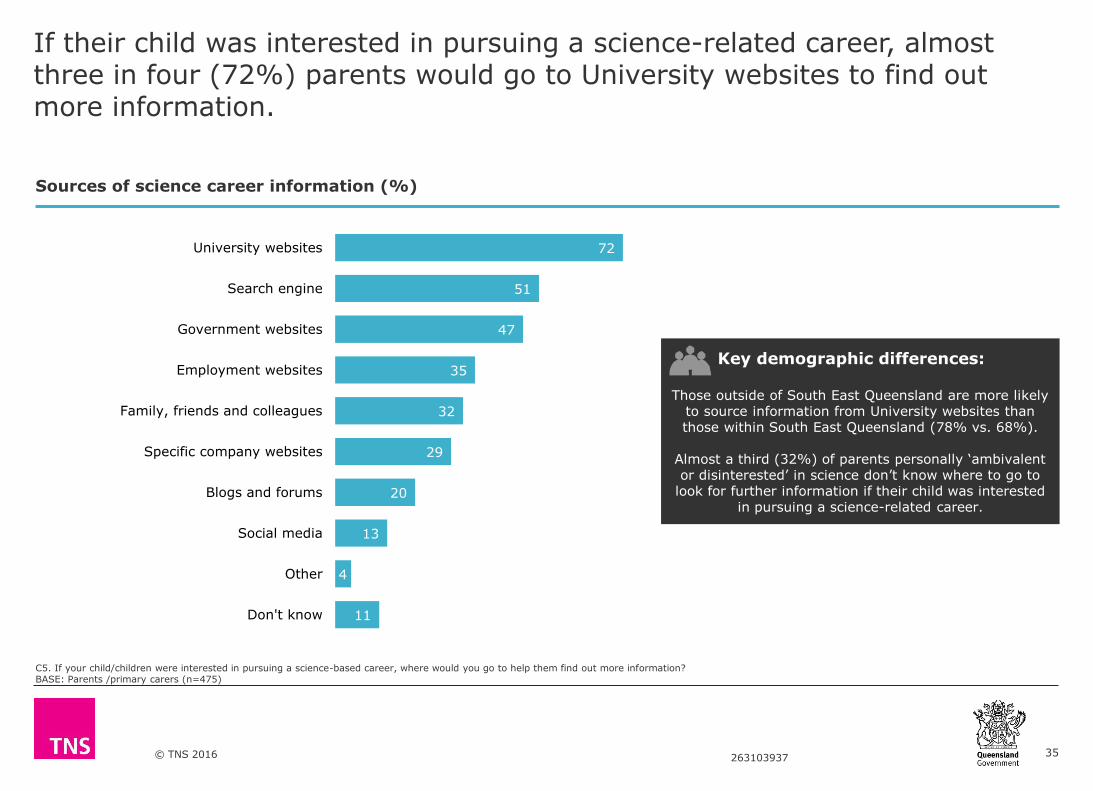
If their child was interested in pursuing a science-related career, almost three in four (72%) parents would go to University websites to find out more information.
Sources of science career information (%)
C5. If your child/children were interested in pursuing a science-based career, where would you go to help them find out more information?BASE: Parents /primary carers (n=475)
Key demographic differences:
Those outside of South East Queensland are more likely to source information from University websites than those within South East Queensland (78% vs. 68%).
Almost a third (32%) of parents personally ‘ambivalent or disinterested’ in science don’t know where to go to
look for further information if their child was interested in pursuing a science-related career.
35

© TNS 2016 263103937
Almost two in three (62%) Queensland parents/carers have/would encourage their child/children to be involved in science-based activities outside of school.
C6. To what extent have you / would you encourage your child/children to be involved in science-based activities outside of school? BASE: Parents /primary carers (n=475)
Encouragement of science-based activities outside of school (%)
33 39 23 5
1 - Strongly discourage
2 - Somewhat discourage
3 - Neither encourage nor discourage
4 - Somewhat encourage
5 - Strongly encourage
Don't know
<1% discourage
62% encourage
Mean (out of 5)
3.88
Key demographic differences:
Those personally ‘interested’ in science are more likely to encourage their children to be involved in science-based
activities outside of school, compared to those ‘ambivalent or disinterested’ in science (72% vs. 29%).
Those outside of South East Queensland (particularly those in the Northern/Mackay region) are less likely to ‘strongly
encourage’ science-based activities outside of school, compared to those within South East Queensland (17% vs.
26%).
36

© TNS 2016 263103937
7Media and Science news / information
37
© TNS 2016 263103937
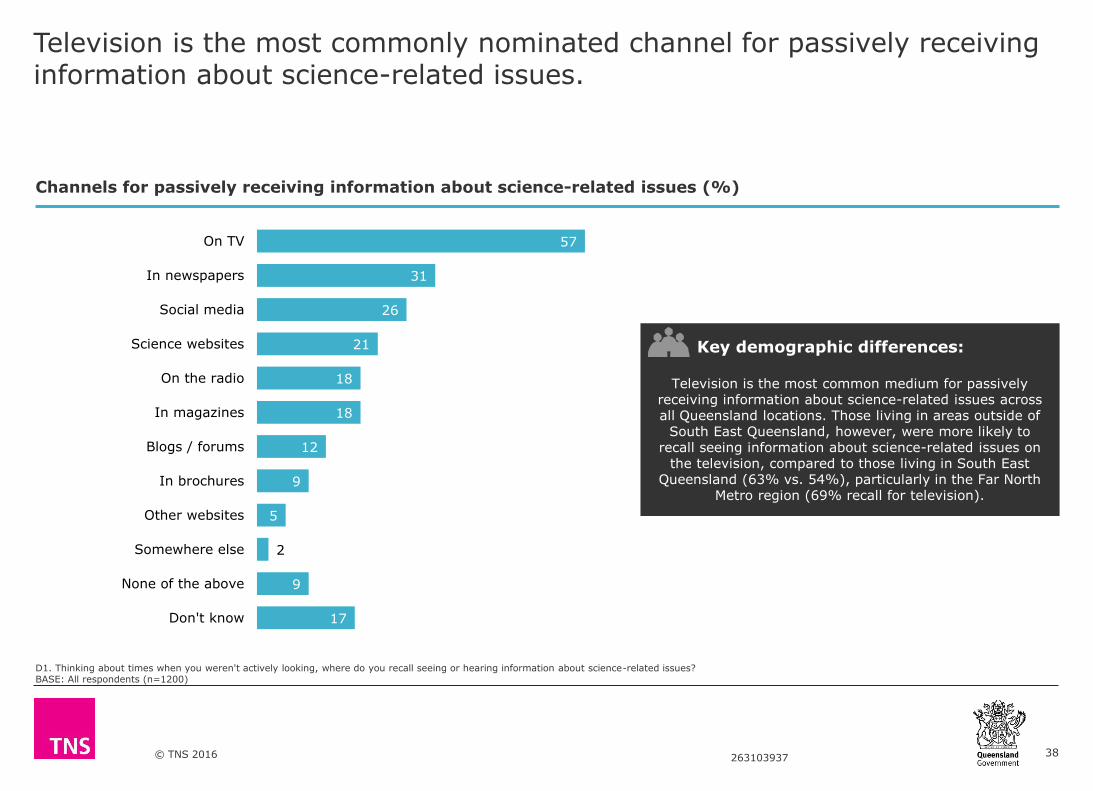
57
31
26
21
18
18
12
9
5
2
9
17
On TV
In newspapers
Social media
Science websites
On the radio
In magazines
Blogs / forums
In brochures
Other websites
Somewhere else
None of the above
Don't know
Channels for passively receiving information about science-related issues (%)
D1. Thinking about times when you weren't actively looking, where do you recall seeing or hearing information about science-related issues? BASE: All respondents (n=1200)
Key demographic differences:
Television is the most common medium for passively receiving information about science-related issues across all Queensland locations. Those living in areas outside of
South East Queensland, however, were more likely to recall seeing information about science-related issues on
the television, compared to those living in South East Queensland (63% vs. 54%), particularly in the Far North
Metro region (69% recall for television).
Television is the most commonly nominated channel for passively receiving information about science-related issues.
38

© TNS 2016 263103937
45
28
5
22
There is not enough information available
There is the right amount of information available
There is too much information available
Don't know
Almost half (45%) believe that there is currently not enough information or news about science via the media or online.
Amount of science news and information available in the media and online (%)
D2. Which of the following best describes the amount of information or news about science that you currently see or hear through the media or online? BASE: All respondents (n=1200)
Key demographic differences:
Males are significantly more likely to hold the opinion that there is not enough news or information about science available online or in the media compared to
females (52% vs. 38%). This is also the case for those working or studying in a science-related area (57% and 55% in agreeance that there is not enough information
or news about science, respectively) and those ‘interested’ in science (53% in agreeance).
39

© TNS 2016 263103937
8Science activities and events
40
© TNS 2016 263103937
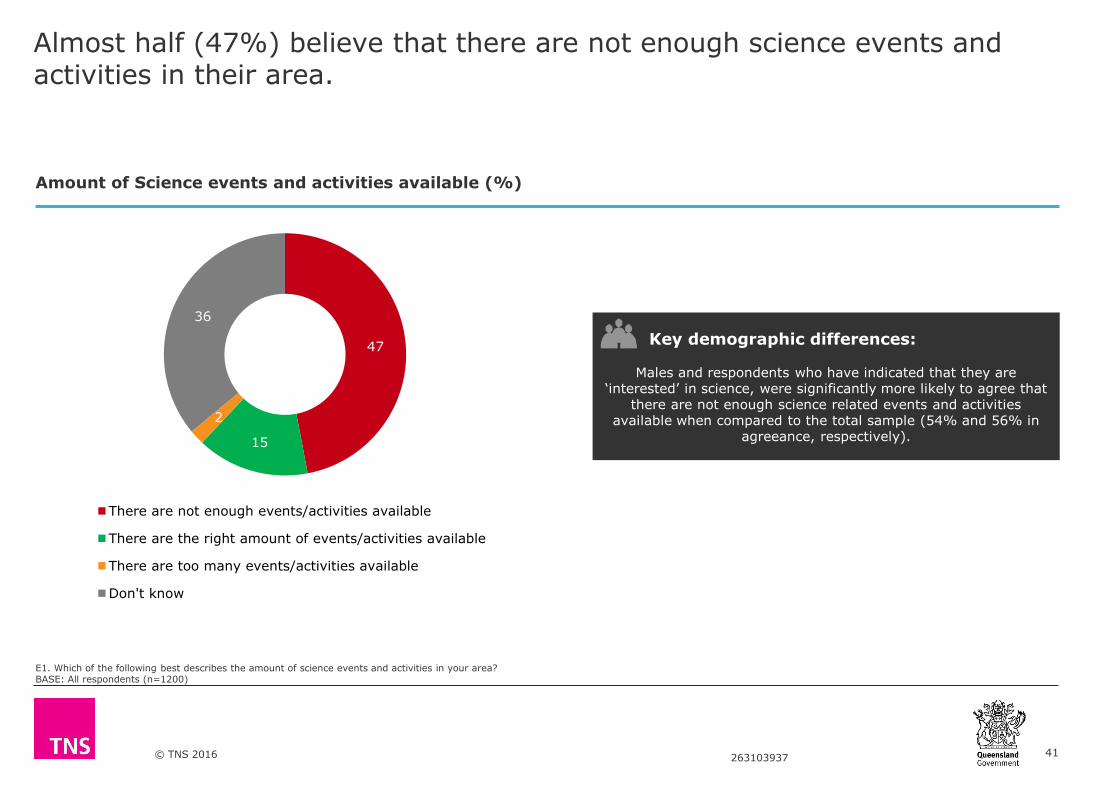
47
15
2
36
There are not enough events/activities available
There are the right amount of events/activities available
There are too many events/activities available
Don't know
Amount of Science events and activities available (%)
E1. Which of the following best describes the amount of science events and activities in your area? BASE: All respondents (n=1200)
Key demographic differences:
Males and respondents who have indicated that they are ‘interested’ in science, were significantly more likely to agree that
there are not enough science related events and activities available when compared to the total sample (54% and 56% in
agreeance, respectively).
Almost half (47%) believe that there are not enough science events and activities in their area.
41
© TNS 2016 263103937
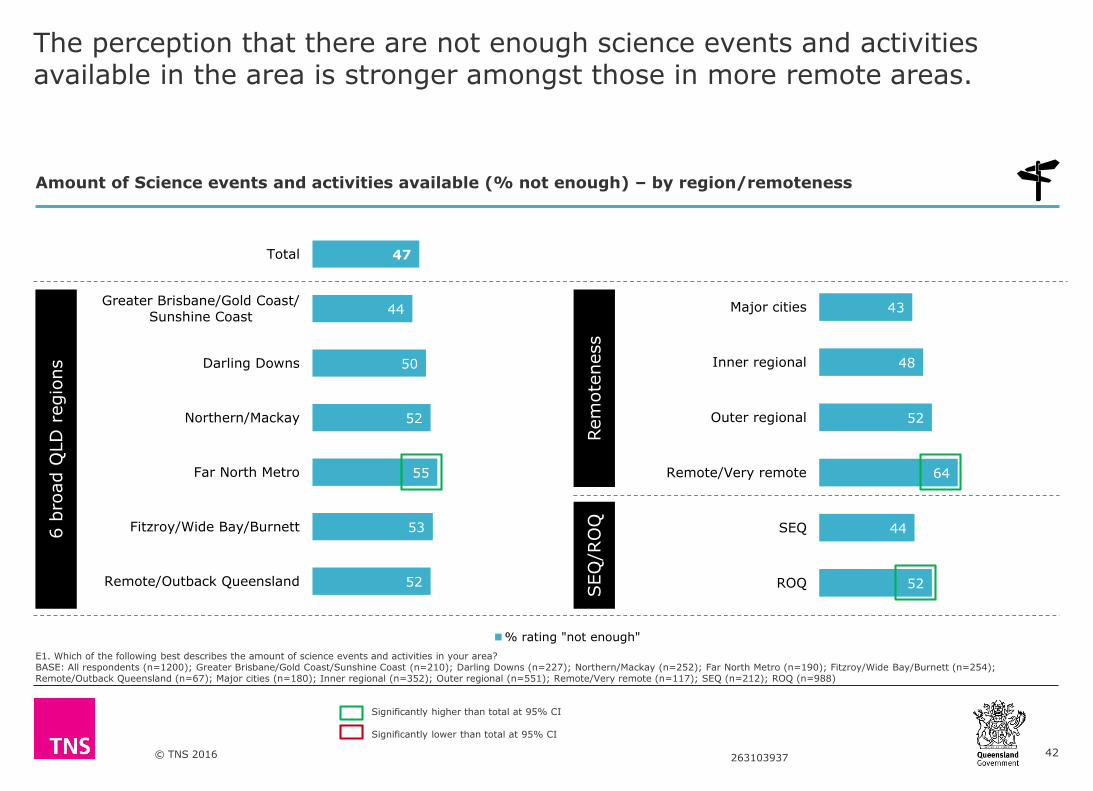
Amount of Science events and activities available (% not enough) – by region/remoteness
E1. Which of the following best describes the amount of science events and activities in your area? BASE: All respondents (n=1200); Greater Brisbane/Gold Coast/Sunshine Coast (n=210); Darling Downs (n=227); Northern/Mackay (n=252); Far North Metro (n=190); Fitzroy/Wide Bay/Burnett (n=254); Remote/Outback Queensland (n=67); Major cities (n=180); Inner regional (n=352); Outer regional (n=551); Remote/Very remote (n=117); SEQ (n=212); ROQ (n=988)
The perception that there are not enough science events and activities available in the area is stronger amongst those in more remote areas.
47
44
50
52
55
53
52
Total
Greater Brisbane/Gold Coast/
Sunshine Coast
Darling Downs
Northern/Mackay
Far North Metro
Fitzroy/Wide Bay/Burnett
Remote/Outback Queensland
% rating "not enough"
43
48
52
64
44
52
Major cities
Inner regional
Outer regional
Remote/Very remote
SEQ
ROQ
Significantly higher than total at 95% CI
Significantly lower than total at 95% CI
6 b
road Q
LD
regio
ns
SEQ
/RO
QRem
ote
ness
42
© TNS 2016 263103937
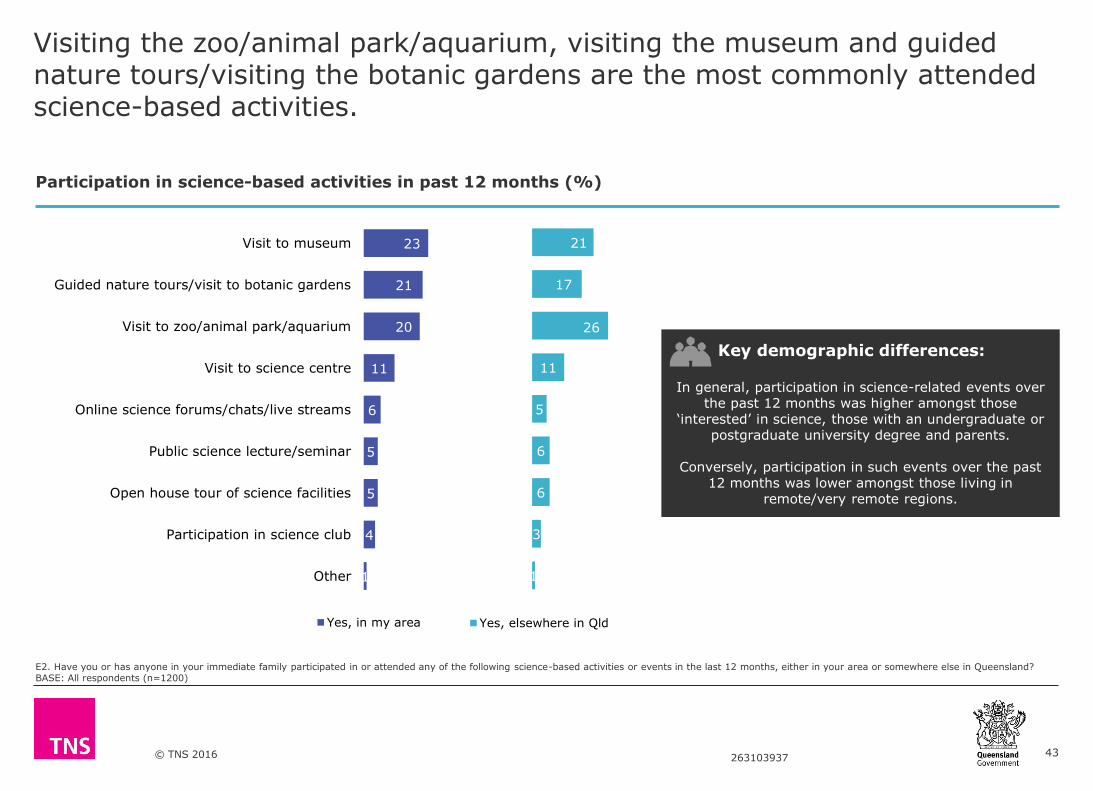
Participation in science-based activities in past 12 months (%)
E2. Have you or has anyone in your immediate family participated in or attended any of the following science-based activities or events in the last 12 months, either in your area or somewhere else in Queensland? BASE: All respondents (n=1200)
Key demographic differences:
In general, participation in science-related events over the past 12 months was higher amongst those
‘interested’ in science, those with an undergraduate or postgraduate university degree and parents.
Conversely, participation in such events over the past 12 months was lower amongst those living in
remote/very remote regions.
21
17
26
11
5
6
6
3
1
Yes, elsewhere in Qld
Visiting the zoo/animal park/aquarium, visiting the museum and guided nature tours/visiting the botanic gardens are the most commonly attended science-based activities.
23
21
20
11
6
5
5
4
1
Visit to museum
Guided nature tours/visit to botanic gardens
Visit to zoo/animal park/aquarium
Visit to science centre
Online science forums/chats/live streams
Public science lecture/seminar
Open house tour of science facilities
Participation in science club
Other
Yes, in my area
43
© TNS 2016 263103937
E2. Have you or has anyone in your immediate family participated in or attended any of the following science-based activities or events in the last 12 months, either in your area or somewhere else in Queensland? BASE: All respondents (n=1200); Major cities (n=180); Inner regional (n=352); Outer regional (n=551); Remote/Very remote (n=117)
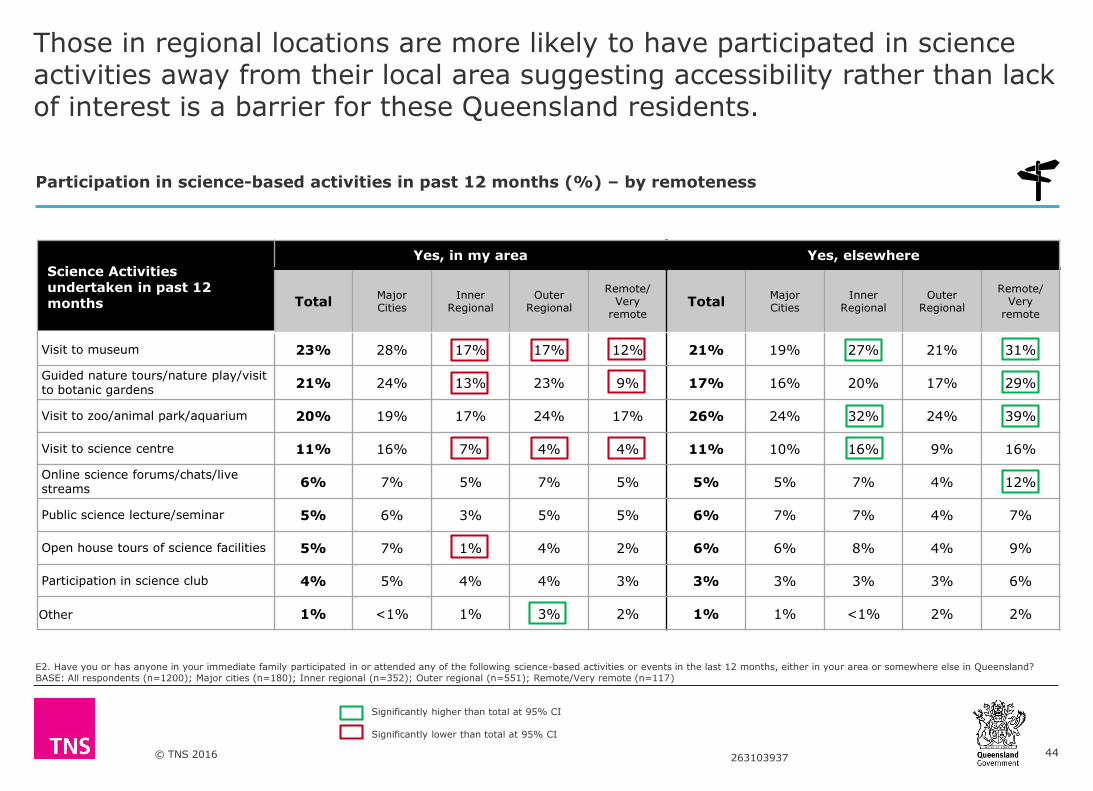
Participation in science-based activities in past 12 months (%) – by remoteness
Science Activities undertaken in past 12 months
Yes, in my area Yes, elsewhere
TotalMajor Cities
Inner Regional
Outer Regional
Remote/ Very
remoteTotal
Major Cities
Inner Regional
Outer Regional
Remote/ Very
remote
Visit to museum 23% 28% 17% 17% 12% 21% 19% 27% 21% 31%
Guided nature tours/nature play/visit to botanic gardens
21% 24% 13% 23% 9% 17% 16% 20% 17% 29%
Visit to zoo/animal park/aquarium 20% 19% 17% 24% 17% 26% 24% 32% 24% 39%
Visit to science centre 11% 16% 7% 4% 4% 11% 10% 16% 9% 16%
Online science forums/chats/live streams
6% 7% 5% 7% 5% 5% 5% 7% 4% 12%
Public science lecture/seminar 5% 6% 3% 5% 5% 6% 7% 7% 4% 7%
Open house tours of science facilities 5% 7% 1% 4% 2% 6% 6% 8% 4% 9%
Participation in science club 4% 5% 4% 4% 3% 3% 3% 3% 3% 6%
Other 1% <1% 1% 3% 2% 1% 1% <1% 2% 2%
Significantly higher than total at 95% CI
Significantly lower than total at 95% CI
Those in regional locations are more likely to have participated in science activities away from their local area suggesting accessibility rather than lack of interest is a barrier for these Queensland residents.
44
© TNS 2016 263103937
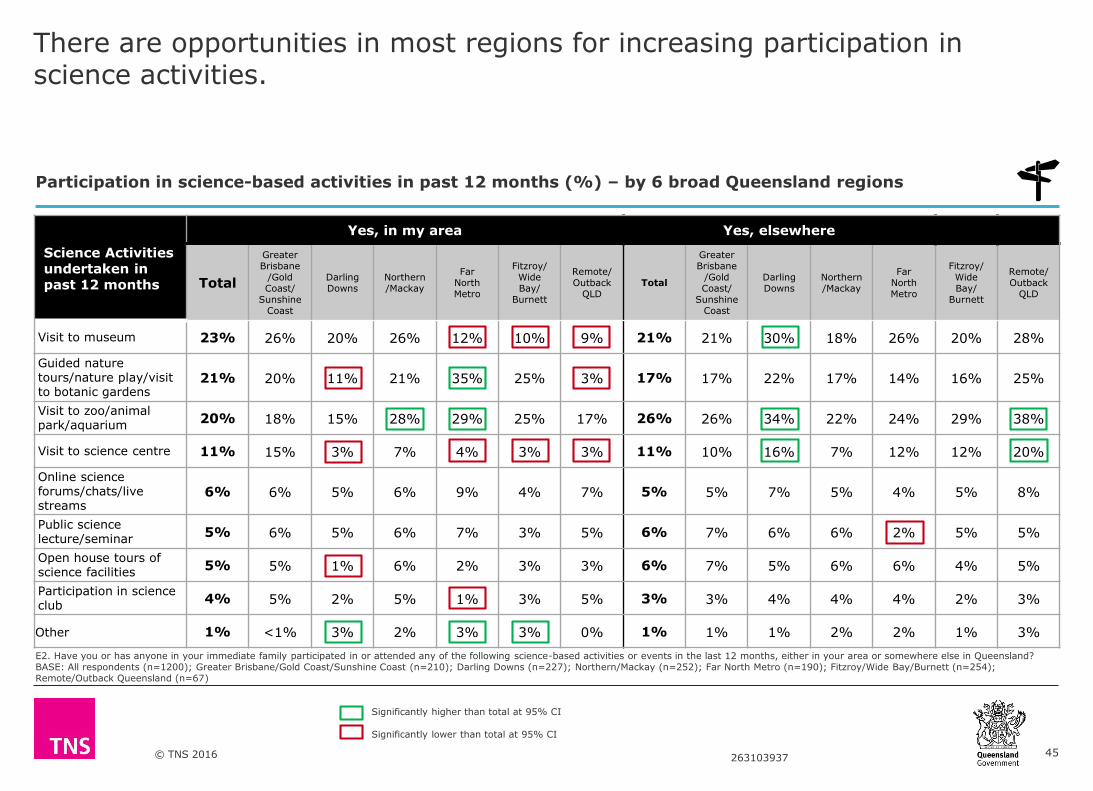
E2. Have you or has anyone in your immediate family participated in or attended any of the following science-based activities or events in the last 12 months, either in your area or somewhere else in Queensland? BASE: All respondents (n=1200); Greater Brisbane/Gold Coast/Sunshine Coast (n=210); Darling Downs (n=227); Northern/Mackay (n=252); Far North Metro (n=190); Fitzroy/Wide Bay/Burnett (n=254); Remote/Outback Queensland (n=67)
Participation in science-based activities in past 12 months (%) – by 6 broad Queensland regions
Science Activities undertaken in past 12 months
Yes, in my area Yes, elsewhere
Total
GreaterBrisbane
/Gold Coast/
Sunshine Coast
Darling Downs
Northern/Mackay
Far North Metro
Fitzroy/Wide Bay/
Burnett
Remote/ Outback
QLDTotal
Greater Brisbane
/Gold Coast/
Sunshine Coast
Darling Downs
Northern/Mackay
Far North Metro
Fitzroy/Wide Bay/
Burnett
Remote/ Outback
QLD
Visit to museum 23% 26% 20% 26% 12% 10% 9% 21% 21% 30% 18% 26% 20% 28%
Guided nature tours/nature play/visit to botanic gardens
21% 20% 11% 21% 35% 25% 3% 17% 17% 22% 17% 14% 16% 25%
Visit to zoo/animal park/aquarium
20% 18% 15% 28% 29% 25% 17% 26% 26% 34% 22% 24% 29% 38%
Visit to science centre 11% 15% 3% 7% 4% 3% 3% 11% 10% 16% 7% 12% 12% 20%
Online science forums/chats/live streams
6% 6% 5% 6% 9% 4% 7% 5% 5% 7% 5% 4% 5% 8%
Public science lecture/seminar
5% 6% 5% 6% 7% 3% 5% 6% 7% 6% 6% 2% 5% 5%
Open house tours of science facilities
5% 5% 1% 6% 2% 3% 3% 6% 7% 5% 6% 6% 4% 5%
Participation in science club
4% 5% 2% 5% 1% 3% 5% 3% 3% 4% 4% 4% 2% 3%
Other 1% <1% 3% 2% 3% 3% 0% 1% 1% 1% 2% 2% 1% 3%
Significantly higher than total at 95% CI
Significantly lower than total at 95% CI
There are opportunities in most regions for increasing participation in science activities.
45

© TNS 2016 263103937
44
37
27
25
24
20
16
1
24
Open house tours of science facilities
Guided nature tours/nature play for
children
Science talks/seminars for adults
Online portals/web activities
Science clubs for children
Science clubs for adults
Science talks/seminars for children
Other
None
Open house tours of science facilities and guided nature tours/nature play for children are the two events which draw the most interest amongst Queenslanders.
Interest in science-based activities or events (%)
E3. If they were available, which of the following science-based activities or events would you or anyone in your immediate family be interested in participating in or attending? BASE: All respondents (n=1200)
Key demographic differences:
Males are significantly more interested in attending science clubs for adults compared to females (23% vs.
16%), while females are more interested in nature tours/nature play for children than males (41% vs.
32%).
Those ‘interested’ in science are more likely to be interested in participating in all of the listed events, compared to those ambivalent or disinterested in
science.
Interest in the various science-based activities tends to increase with education level.
46

© TNS 2016 263103937
Interest in science-based activities Total SEQ ROQ Major CitiesInner
RegionalOuter
Regional
Remote/Very
remote
Open house tours of science facilities 44% 44% 44% 46% 40% 45% 40%
Guided nature tours/nature play for children 37% 37% 36% 38% 32% 39% 38%
Science talks/seminars for adults 27% 26% 27% 25% 29% 29% 29%
Online portals/web based activities 25% 26% 21% 27% 21% 20% 24%
Science clubs for children 24% 24% 25% 25% 18% 27% 26%
Science clubs for adults 20% 19% 22% 18% 18% 27% 23%
Science talks/seminars for children 16% 16% 16% 16% 14% 20% 12%
Other 1% 2% 1% 1% 2% 1% 2%
None 24% 24% 24% 22% 28% 23% 24%
Interest in science-based activities or events (%) – by SEQ/ROQ regions / remoteness
E3. If they were available, which of the following science-based activities or events would you or anyone in your immediate family be interested in participating in or attending? BASE: All respondents (n=1200); SEQ (n=212); ROQ (n=988); Major cities (n=180); Inner regional (n=352); Outer regional (n=551); Remote/Very remote (n=117)
There is an appetite for science clubs and seminars across Queensland, and particularly in outer regional areas.
Significantly higher than total at 95% CI
Significantly lower than total at 95% CI
47

© TNS 2016 263103937
Interest in science-based activities Total
GreaterBrisbane/
Gold Coast/ Sunshine
Coast
Darling Downs
Northern/Mackay
Far NorthMetro
Fitzroy/ Wide Bay/ Burnett
Remote/Outback
Queensland
Open house tours of science facilities 44% 44% 46% 44% 46% 44% 38%
Guided nature tours/nature play for children 37% 37% 33% 39% 38% 32% 36%
Science talks/seminars for adults 27% 26% 30% 27% 30% 25% 21%
Online portals/web based activities 25% 26% 24% 20% 24% 21% 18%
Science clubs for children 24% 24% 26% 27% 25% 21% 28%
Science clubs for adults 20% 19% 19% 26% 25% 20% 22%
Science talks/seminars for children 16% 16% 20% 20% 14% 13% 10%
Other 1% 2% <1% 1% 1% 1% 2%
None 24% 24% 23% 21% 22% 27% 27%
Interest in science-based activities or events (%) – by 6 broad Queensland regions
E3. If they were available, which of the following science-based activities or events would you or anyone in your immediate family be interested in participating in or attending? BASE: All respondents (n=1200); Greater Brisbane/Gold Coast/Sunshine Coast (n=210); Darling Downs (n=227); Northern/Mackay (n=252); Far North Metro (n=190); Fitzroy/Wide Bay/Burnett (n=254); Remote/Outback Queensland (n=67)
Interest levels in various science-related activities/events are relatively stable across all Queensland regions.
Significantly higher than total at 95% CI
Significantly lower than total at 95% CI
48

© TNS 2016 263103937
Queenslanders largely expect to be notified about science events or activities in their area via the television or via local newspapers and magazines.
E4. If there was a science event or activity in your area, where would you expect to see or hear about it? BASE: All respondents (n=1200)
49
54
50
40
37
33
32
27
24
23
23
6
10
On TV
In local newspapers/magazines
On the radio
Letterbox drop
In leaflets/brochures/flyers
Social media
Community websites
Email newsletters/mailing lists
Through family/friends/colleagues
Posters/noticeboards/billboards
At the cinema
Don't know
Preferred sources of local science event information (%)
Key demographic differences:
Those aged 45 years and older are more likely than younger Queenslanders to expect to be notified about
science events via the television.
Conversely, younger Queenslanders (i.e. those aged 18-34 years) are more likely to expect to find out about
such events via social media.
Females are more likely than males to expect to find out about science-related events through a letterbox drop (44% vs. 30%) or in leaflets/brochures/flyers
(41% vs. 24%).
© TNS 2016 263103937
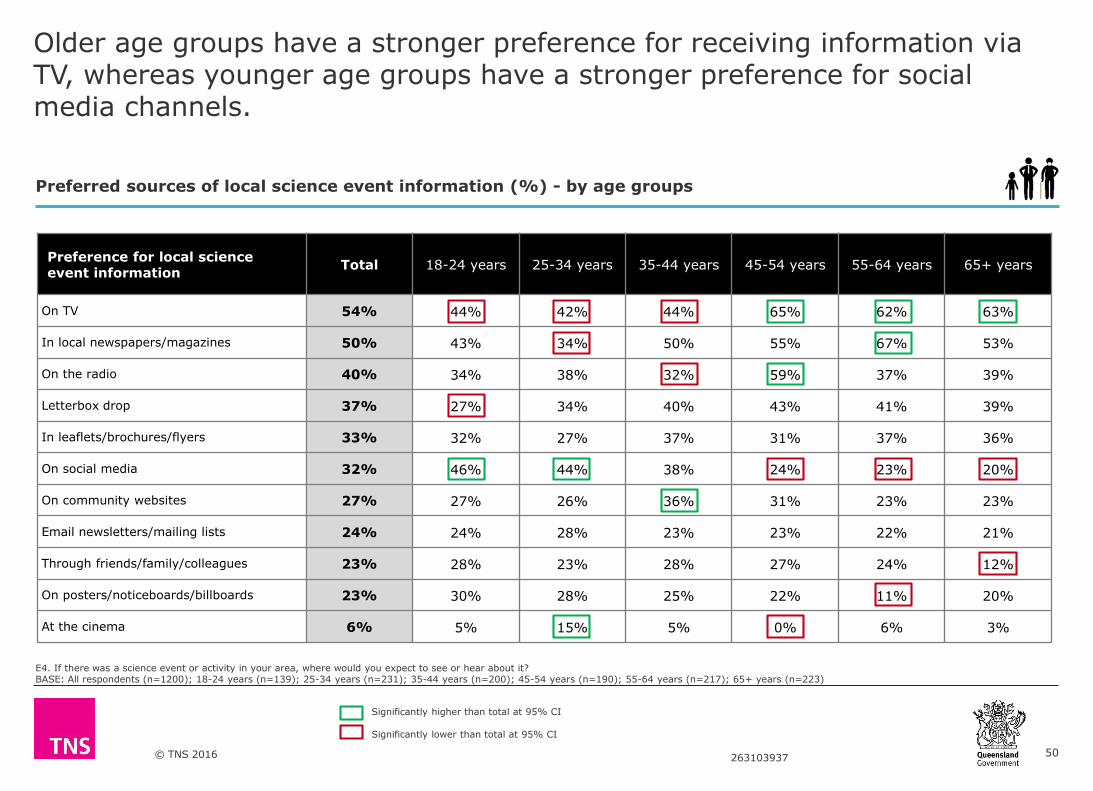
E4. If there was a science event or activity in your area, where would you expect to see or hear about it? BASE: All respondents (n=1200); 18-24 years (n=139); 25-34 years (n=231); 35-44 years (n=200); 45-54 years (n=190); 55-64 years (n=217); 65+ years (n=223)
Preference for local science event information
Total 18-24 years 25-34 years 35-44 years 45-54 years 55-64 years 65+ years
On TV 54% 44% 42% 44% 65% 62% 63%
In local newspapers/magazines 50% 43% 34% 50% 55% 67% 53%
On the radio 40% 34% 38% 32% 59% 37% 39%
Letterbox drop 37% 27% 34% 40% 43% 41% 39%
In leaflets/brochures/flyers 33% 32% 27% 37% 31% 37% 36%
On social media 32% 46% 44% 38% 24% 23% 20%
On community websites 27% 27% 26% 36% 31% 23% 23%
Email newsletters/mailing lists 24% 24% 28% 23% 23% 22% 21%
Through friends/family/colleagues 23% 28% 23% 28% 27% 24% 12%
On posters/noticeboards/billboards 23% 30% 28% 25% 22% 11% 20%
At the cinema 6% 5% 15% 5% 0% 6% 3%
Preferred sources of local science event information (%) - by age groups
Significantly higher than total at 95% CI
Significantly lower than total at 95% CI
Older age groups have a stronger preference for receiving information via TV, whereas younger age groups have a stronger preference for social media channels.
50
© TNS 2016 263103937
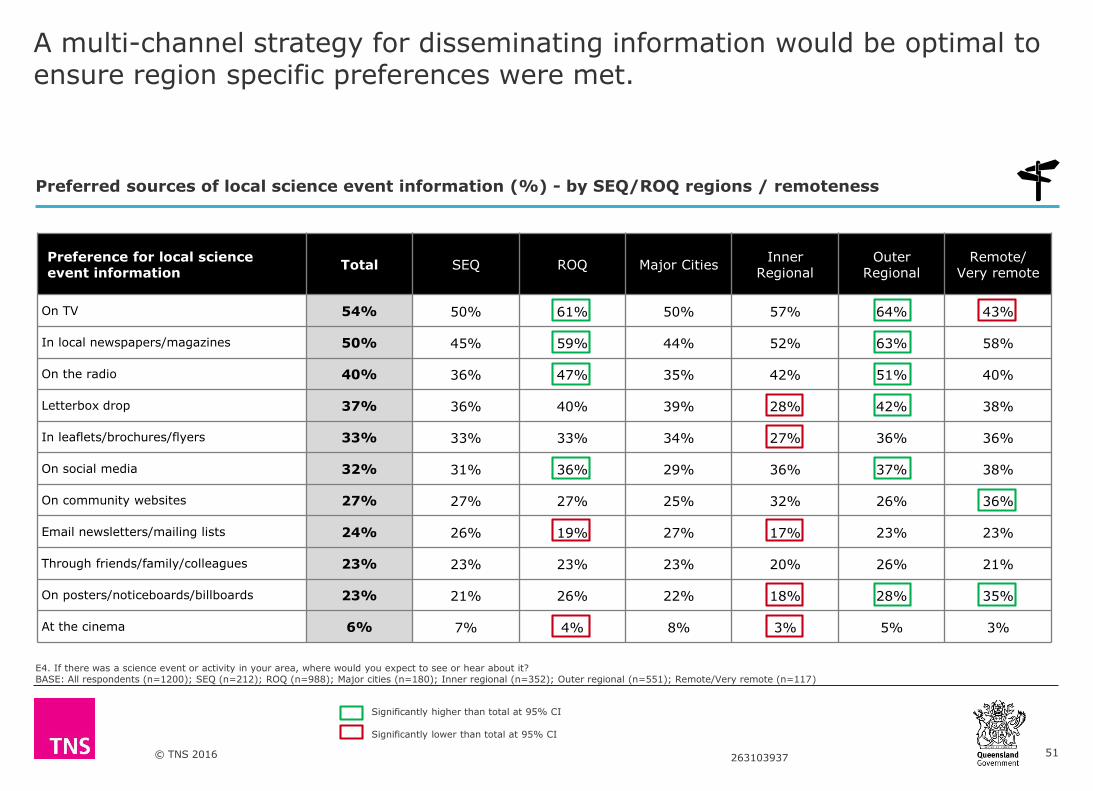
E4. If there was a science event or activity in your area, where would you expect to see or hear about it? BASE: All respondents (n=1200); SEQ (n=212); ROQ (n=988); Major cities (n=180); Inner regional (n=352); Outer regional (n=551); Remote/Very remote (n=117)
Preference for local science event information
Total SEQ ROQ Major CitiesInner
RegionalOuter
RegionalRemote/
Very remote
On TV 54% 50% 61% 50% 57% 64% 43%
In local newspapers/magazines 50% 45% 59% 44% 52% 63% 58%
On the radio 40% 36% 47% 35% 42% 51% 40%
Letterbox drop 37% 36% 40% 39% 28% 42% 38%
In leaflets/brochures/flyers 33% 33% 33% 34% 27% 36% 36%
On social media 32% 31% 36% 29% 36% 37% 38%
On community websites 27% 27% 27% 25% 32% 26% 36%
Email newsletters/mailing lists 24% 26% 19% 27% 17% 23% 23%
Through friends/family/colleagues 23% 23% 23% 23% 20% 26% 21%
On posters/noticeboards/billboards 23% 21% 26% 22% 18% 28% 35%
At the cinema 6% 7% 4% 8% 3% 5% 3%
Preferred sources of local science event information (%) - by SEQ/ROQ regions / remoteness
Significantly higher than total at 95% CI
Significantly lower than total at 95% CI
A multi-channel strategy for disseminating information would be optimal to ensure region specific preferences were met.
51

© TNS 2016 263103937
E4. If there was a science event or activity in your area, where would you expect to see or hear about it? BASE: All respondents (n=1200); Greater Brisbane/Gold Coast/Sunshine Coast (n=210); Darling Downs (n=227); Northern/Mackay (n=252); Far North Metro (n=190); Fitzroy/Wide Bay/Burnett (n=254); Remote/Outback Queensland (n=67)
Preference for local science event information
Total
GreaterBrisbane/
Gold Coast/ Sunshine
Coast
Darling Downs
Northern/Mackay
Far NorthMetro
Fitzroy/ Wide Bay/ Burnett
Remote/Outback
Queensland
On TV 54% 50% 57% 68% 62% 62% 43%
In local newspapers/magazines 50% 45% 59% 62% 60% 57% 60%
On the radio 40% 36% 39% 54% 52% 46% 37%
Letterbox drop 37% 36% 44% 39% 40% 36% 45%
In leaflets/brochures/flyers 33% 33% 35% 34% 37% 31% 32%
On social media 32% 31% 33% 40% 35% 36% 35%
On community websites 27% 27% 22% 33% 28% 24% 29%
Email newsletters/mailing lists 24% 26% 20% 20% 23% 15% 22%
Through friends/family/colleagues 23% 23% 24% 26% 24% 22% 19%
On posters/noticeboards/billboards 23% 21% 24% 27% 28% 24% 27%
At the cinema 6% 7% 4% 6% 3% 3% 3%
Preferred sources of local science event information (%) – by 6 broad Queensland regions
Significantly higher than total at 95% CI
Significantly lower than total at 95% CI
TV and local newspapers are consistently amongst the most preferred channel for information regardless of region.
52

© TNS 2016 263103937
44
13
<1
50
National Science Week
World Science Festival
Other
None
Awareness of Queensland science-based events (%)
E5. Before today, which of the following science-based events have you heard of in Queensland? BASE: All respondents (n=1200)
Key demographic differences:
Awareness of National Science Week was higher amongst those aged 45-54 years (55%), those in a
science-related occupation (57%), those who studied science post school (55%) and those ‘interested’ in
science (51%) compared to the total sample.
Awareness of the World Science Festival was higher amongst those aged 25-44 years (25%), those with an
undergraduate or postgraduate university degree (25%), those in a science-related occupation (24%),
those who studied science post school (27%) and those from an Aboriginal or Torres Strait Islander background
(24%), compared to the total sample.
More than two in five (44%) have heard of National Science Week, whereas just over one in ten (13%) have heard of the World Science Festival.
53
© TNS 2016 263103937
E1. Which of the following best describes the amount of science events and activities in your area? BASE: All respondents (n=1200); Greater Brisbane/Gold Coast/Sunshine Coast (n=210); Darling Downs (n=227); Northern/Mackay (n=252); Far North Metro (n=190); Fitzroy/Wide Bay/Burnett (n=254); Remote/Outback Queensland (n=67); Major cities (n=180); Inner regional (n=352); Outer regional (n=551); Remote/Very remote (n=117); SEQ (n=212); ROQ (n=988)
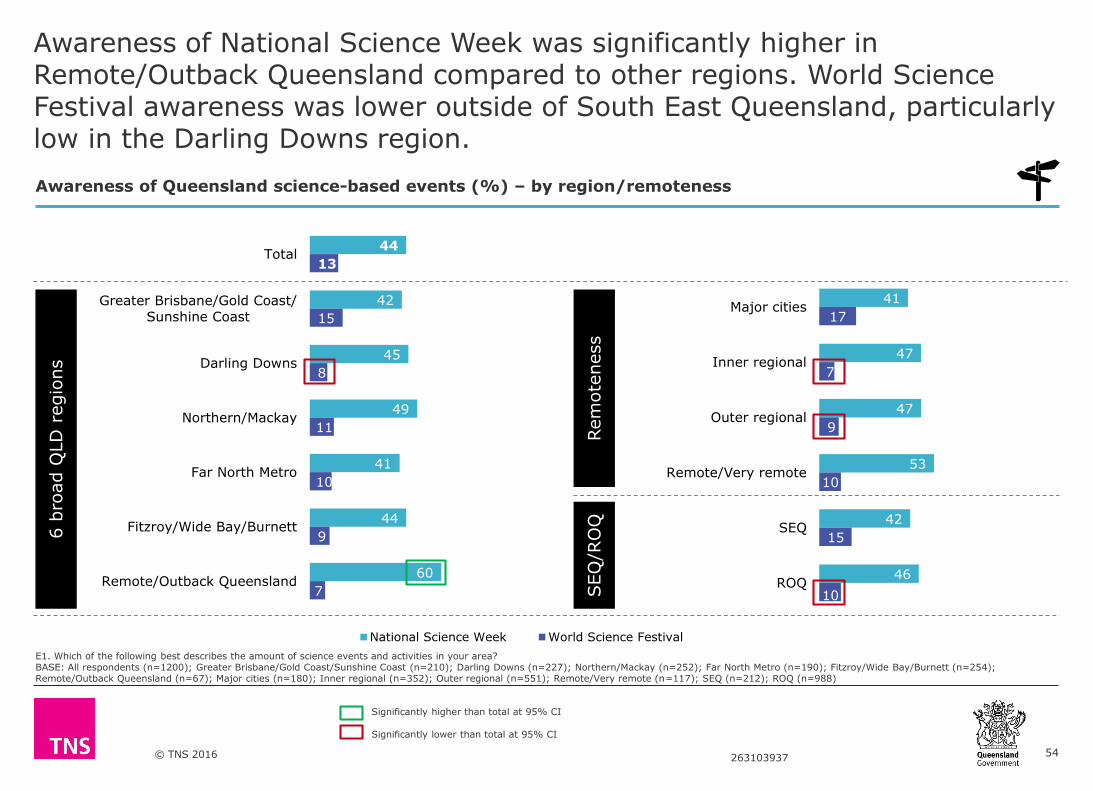
Awareness of National Science Week was significantly higher in Remote/Outback Queensland compared to other regions. World Science Festival awareness was lower outside of South East Queensland, particularly low in the Darling Downs region.
44
42
45
49
41
44
60
13
15
8
11
10
9
7
Total
Greater Brisbane/Gold Coast/
Sunshine Coast
Darling Downs
Northern/Mackay
Far North Metro
Fitzroy/Wide Bay/Burnett
Remote/Outback Queensland
National Science Week World Science Festival
41
47
47
53
42
46
17
7
9
10
15
10
Major cities
Inner regional
Outer regional
Remote/Very remote
SEQ
ROQ
Significantly higher than total at 95% CI
Significantly lower than total at 95% CI
6 b
road Q
LD
regio
ns
SEQ
/RO
QRem
ote
ness
Awareness of Queensland science-based events (%) – by region/remoteness
54

© TNS 2016 263103937
7 8 28 38 15 5
1 - Very disinterested
2 - Somewhat disinterested
3 - Neither
4 - Somewhat interested
5 - Very interested
Don't know
More than half (52%) demonstrate an interest in participating in science-based events like National Science Week and World Science Festival in the future.
15% disinterested
52% interested
Mean (out of 5)
3.46
Key demographic differences:
Interest levels in attending science-based events in the future were significantly higher amongst Queenslanders aged 25-44
years (65% rating 4 or 5 out of 5), those with a undergraduate or postgraduate degree (47%), those working or studying in a science-related area (74% and 71%, respectively) and those ‘interested’ in science (66%), compared to the total sample.
Interest in attending science-based events in the future (%)
E6. How interested are you in attending events like these in the future? BASE: All respondents (n=1200)
55
© TNS 2016 263103937
9Awareness of Queensland Science Projects and Scientists
56

© TNS 2016 263103937
F1. In the spaces provided below, please name any Queensland scientists or scientific discoveries in Queensland that you are aware of. BASE: All respondents (n=1200)Note: Verbatim responses were coded into common themes. Responses <1% have been combined into “Other scientists” or “Other discoveries”.
Unprompted awareness of Queensland scientists and scientific discoveries (% of total respondents)
Unprompted, four in five (80%) could not spontaneously name a Queensland scientist or scientific discovery. Amongst those that could, Professor Ian Frazer’s cervical cancer vaccine was the most commonly mentioned discovery.
57
80
3
1
2
7
3
2
1
1
1
8
Not aware of any Queensland scientists or scientific
discoveries in Queensland
Professor Ian Frazer
Dr Geoff Garrett
Other scientists
Cervical cancer vaccine / HPV vaccine
Dinosaur mentions (e.g. Muttaburrasaurus / discovery of
bones / fossils / dinosaurs at Winton)
Alzheimer's breakthrough / research / cure
Great Barrier Reef coral bleaching / preservation /
controlling Crown of Thorns (all mentions)
Cancer research / cures / treatment
Medical research
Other discoveries
Unprompted, only one in five (20%) could name a Queensland
scientist and/or scientific discovery.
Of the 20% that could, one in four identified scientists and three in four identified scientific
discoveries.
Note: Individual percentages add to >20%
as multiple responses were allowed.
Scientist mentions
Scientific discovery mentions
Not aware

© TNS 2016 263103937
42
24
21
10
7
3
3
41
Professor Ian Frazer (Gardasil)
Eliminate Dengue Program
Triple P Program
Professor Mark Kendall (Nanopatch)
Professor Thomas Parnell (Pitch Drop Experiment)
GroundProbe Technology
Professor James Dale (Vitamin-A enriched banana)
None
Prompted awareness of Queensland scientists and scientific discoveries (%)
F2. And which, if any, of the following key Queensland scientists or scientific discoveries in Queensland were you aware of before today? BASE: All respondents (n=1200)
Key demographic differences:
Awareness of at least one of the Queensland scientists and scientific discoveries listed was higher amongst
Queenslanders aged 45 years and older, those who had undertaken post-schooling studies and those with an interest in science or studying/working in a science-
related area.
When prompted, three in five (59%) had heard of at least one of the listed Queensland scientists/scientific discoveries. Two in five (42%) were aware of Professor Ian Frazer’s Gardasil cervical cancer vaccine.
58

© TNS 2016 263103937
10Demographics
59
© TNS 2016 263103937
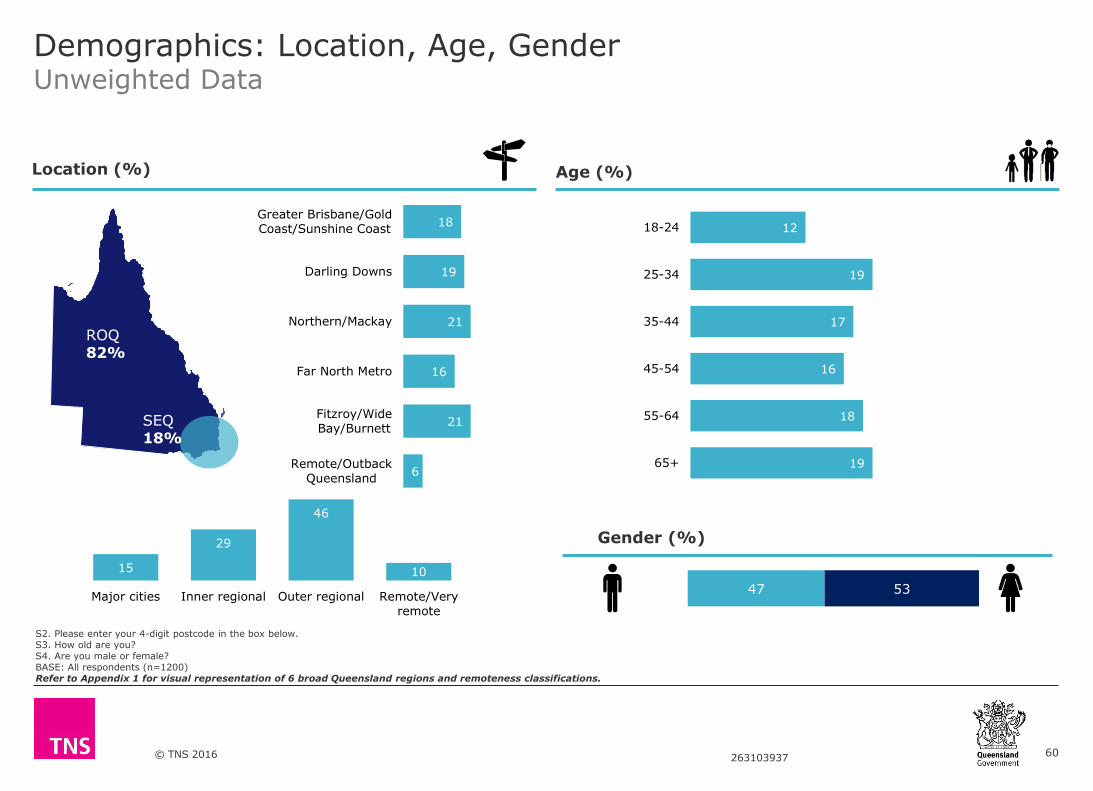
18
19
21
16
21
6
Greater Brisbane/GoldCoast/Sunshine Coast
Darling Downs
Northern/Mackay
Far North Metro
Fitzroy/Wide
Bay/Burnett
Remote/Outback
Queensland
12
19
17
16
18
19
18-24
25-34
35-44
45-54
55-64
65+
47 53
Demographics: Location, Age, GenderUnweighted Data
Location (%)
Gender (%)
Age (%)
S2. Please enter your 4-digit postcode in the box below.S3. How old are you? S4. Are you male or female?BASE: All respondents (n=1200)Refer to Appendix 1 for visual representation of 6 broad Queensland regions and remoteness classifications.
SEQ 18%
ROQ 82%
15
29
46
10
Major cities Inner regional Outer regional Remote/Very
remote
60

© TNS 2016 263103937
13
15
11
15
60
Has child who has not started
school
Has child in primary school
Has child in high school
Has child who has finished
school
Does not have children
4
94
2
Yes
No
Prefer not to say
4
14
24
35
13
4
6
1
Year 9 or below
Year 10
Year 11 or 12
Diploma or certificate
University undergraduate
Postgraduate diploma
Postgraduate degree
Other
Demographics: Parental status, Education, ATSIUnweighted Data
Parental status (%)
Aboriginal or Torres Strait Islander (%)Participation in post-school science course
(% of those who have studied post-school)
Education level (%)
S5. Please select which of the following apply to you.G2. What is the highest level of education you personally have completed?G3. Were any of your post-schooling studies in a science-related course?G9. Do you identify as Aboriginal and/or Torres Strait Islander? BASE: All respondents (n=1200)
32
68
Yes
No
61

© TNS 2016 263103937
Demographics: Employment statusUnweighted Data
29
12
6
5
22
8
5
6
5
2
Working full-time
Working part-time
Working casually
Self-employed
Retired
Home duties
Studying
Looking for work
Unable to work
Other
Employment Status (%)
G4. Which of these best describes your current employment status?G5. Are you currently working in a science-related job? G6. Before retirement, did you work in a science-related job? G7. Are you currently studying a science-related course? G8. Are you currently looking for science-related work? BASE: All respondents (n=1200)
15% of those currently working work in a science-
related job
15% of those currently retired worked in a
science-related job
35% of those currently studying are studying a
science-related course
16% of those currently looking for work are
looking for science-related work
62

© TNS 2016 263103937
Carried out in Accordance with ISO 20252