Embed Size (px)
Citation preview

QUEENSLAND LAND CLEARING PROPOSAL
SOCIO-ECONOMIC IMPACT
Report for the Commonwealth Government
By
The Australian Bureau of Agricultural and Resource Economics
And
The Bureau of Rural Sciences
Within
Agriculture, Fisheries and Forestry - Australia
May 2003
1

1. KEY FINDINGS ......................................................................................................................... 3
2. INTRODUCTION....................................................................................................................... 6
3. HOW WAS THE PROPOSAL ASSESSED?........................................................................... 6
4. WHAT AREA OF REMNANT VEGETATION IS AFFECTED?........................................ 7
5. WHAT ARE THE POTENTIAL IMPACTS OF THE PROPOSAL ON LANDHOLDERS AND COMMUNITIES?................................................................................................................... 13
OPPORTUNITY COST FOR LANDHOLDERS .......................................................................................... 13 Business As Usual scenario ........................................................................................................ 13 The proposal ............................................................................................................................... 16 Private returns to clearing.......................................................................................................... 19 Opportunity cost estimates.......................................................................................................... 22
IMPACT ON FARM VIABILITY ............................................................................................................ 26 FLOW-ON EFFECTS TO REGIONS AND COMMUNITIES......................................................................... 31
6. GREENHOUSE GAS AND BIODIVERSITY IMPLICATIONS........................................ 33
GREENHOUSE GAS IMPLICATIONS.................................................................................................... 33 BIODIVERSITY IMPLICATIONS .......................................................................................................... 33
7. ACKNOWLEDGEMENTS ..................................................................................................... 33
8. ATTACHMENTS ..................................................................................................................... 34
2

1. Key findings The Australian Bureau of Agricultural and Resource Economics (ABARE) and the Bureau of Rural Sciences (BRS) in the Commonwealth Department of Agriculture, Fisheries and Forestry - Australia have been asked to undertake a socio-economic assessment of a proposal to immediately halt clearing of ‘of concern’ vegetation and phase out clearing of remnant vegetation in Queensland . The proposal incorporates a $150 million adjustment package to be jointly funded by the Commonwealth and State to offset the development opportunities forgone by landholders as a result of cessation of land-clearing. The proposal considers addressing only clearing of remnant vegetation and excluding clearing of regrowth on previously cleared land. (In 2000-01, total clearing was 377,900 hectares, of which 40 per cent was clearing of regrowth and 60 per cent was clearing of remnant vegetation). In undertaking the assessment, ABARE and BRS have worked closely with the Australian Greenhouse Office (AGO) and Environment Australia (EA) to incorporate a preliminary assessment of the greenhouse gas and biodiversity implications of the proposal. ABARE and BRS find that:
a) The net area of remnant vegetation in rural Queensland that is forgone under the proposal, but would otherwise be subject to economic clearing over the next 25 years is around 4.8 million hectares.
- This is just under 10 per cent of the total of 49.0 million hectares of remnant
vegetation that would otherwise be available for clearing, after existing permits and permits issued during the phase down period are taken into account.
b) Assuming all clearing is for pastoralism, the estimated opportunity cost of forgone
clearing under the proposal to cease clearing of remnant vegetation is around $181 million.
c) The magnitude of the opportunity cost of forgone clearing is potentially sensitive to a
number of factors including the value of the replacement land use and the substitution of clearing regrowth for remnant vegetation.
- If the post-clearing land use was of higher value, such as cropping, the
opportunity cost will be increased significantly for a small number of producers.
If 2 per cent of future clearing was for cropping then the opportunity cost would be closer to $190 million.
In the absence of information on the projected land use after clearing, this
issue will need to be closely monitored in the implementation of any adjustment proposal.
3

- Alternatively, the opportunity cost may be smaller if a cessation of remnant
clearing frees farm resources for additional clearing of regrowth.
If 10 per cent of the remnant clearing effort was transferred to regrowth clearing that offers similar returns to the landholder, then the opportunity cost would be of the order of $166 million.
d) The statistical local areas with the largest opportunity cost of foregone clearing are in
central Queensland, particularly in the statistical local areas (SLAs) of Broadsound, Murweh, Belyando, Peak Downs and Jericho.
e) Around 15 000 landholders have some remnant vegetation on their property affected by
this proposal. However, only a proportion of these landholders would have an intention to clear.
- Around 3 750 of the total number of affected landholders are located within the
twenty shires with the greatest opportunity cost.
f) The size of the adjustment package is similar to the estimated opportunity costs, assuming all cleared land will be for pastoralism.
g) The overall impact of the proposal on existing farm viability is likely to be small on
average.
- While the proposal is expected to reduce capital values, it will not affect landholders’ current capacity to generate income.
- Only landholders who have borrowed heavily to purchase properties and
planned for relatively quick farm development might be significantly affected. However, this would have to be assessed on a case-by-case basis.
h) While the overall social impact of the proposal will be small if the adjustment package is
implemented effectively, there will be a number of social impacts affecting individuals and communities.
- Land clearing is an established part of the traditional Queensland pastoralist
farming system and ceasing clearing remnant vegetation will meet strong resistance.
- Clearing controls will necessitate changes to farming practices, with flow-on
effects to information and training needs.
- Although clearing of regrowth will continue to be a significant activity, there may be reduced employment in land clearing and related industries, including machinery sales and maintenance, with flow-on effects to local communities.
- To the extent that the proposed implementation package provides a payment to
landholders, there may be some leakage of benefits outside the target areas as a result of expenditure occurring elsewhere in Australia.
4
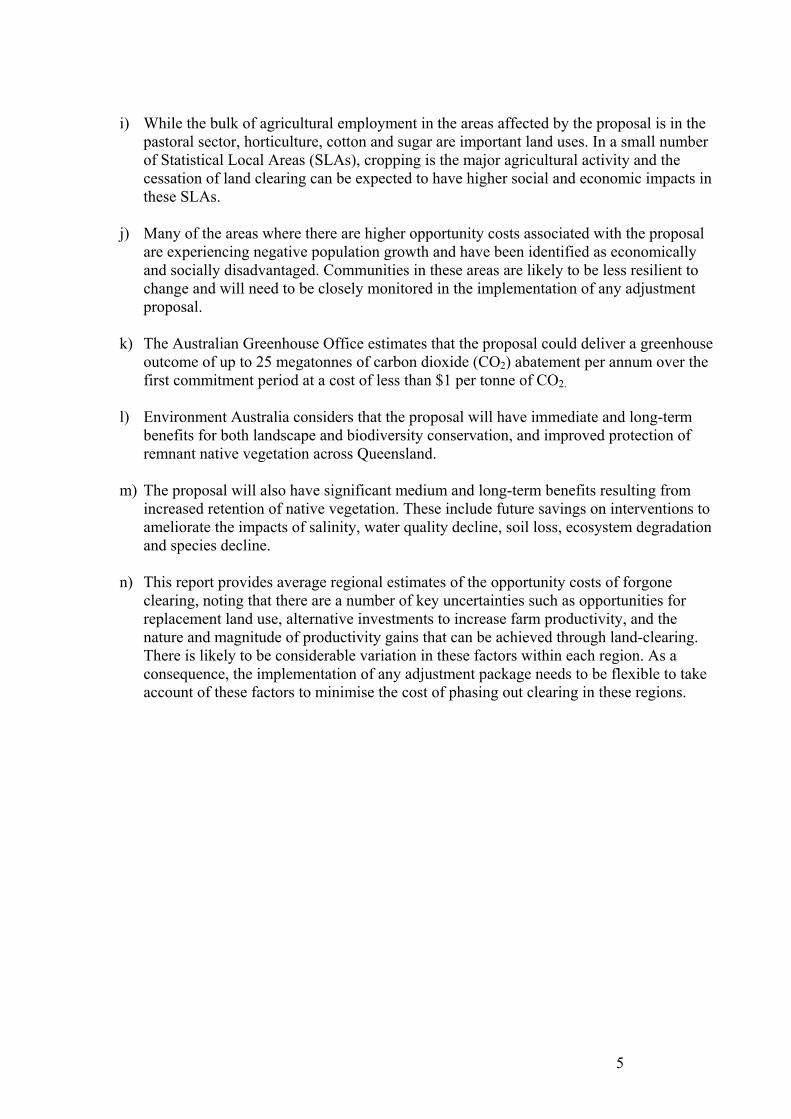
i) While the bulk of agricultural employment in the areas affected by the proposal is in the
pastoral sector, horticulture, cotton and sugar are important land uses. In a small number of Statistical Local Areas (SLAs), cropping is the major agricultural activity and the cessation of land clearing can be expected to have higher social and economic impacts in these SLAs.
j) Many of the areas where there are higher opportunity costs associated with the proposal
are experiencing negative population growth and have been identified as economically and socially disadvantaged. Communities in these areas are likely to be less resilient to change and will need to be closely monitored in the implementation of any adjustment proposal.
k) The Australian Greenhouse Office estimates that the proposal could deliver a greenhouse
outcome of up to 25 megatonnes of carbon dioxide (CO2) abatement per annum over the first commitment period at a cost of less than $1 per tonne of CO2.
l) Environment Australia considers that the proposal will have immediate and long-term
benefits for both landscape and biodiversity conservation, and improved protection of remnant native vegetation across Queensland.
m) The proposal will also have significant medium and long-term benefits resulting from
increased retention of native vegetation. These include future savings on interventions to ameliorate the impacts of salinity, water quality decline, soil loss, ecosystem degradation and species decline.
n) This report provides average regional estimates of the opportunity costs of forgone
clearing, noting that there are a number of key uncertainties such as opportunities for replacement land use, alternative investments to increase farm productivity, and the nature and magnitude of productivity gains that can be achieved through land-clearing. There is likely to be considerable variation in these factors within each region. As a consequence, the implementation of any adjustment package needs to be flexible to take account of these factors to minimise the cost of phasing out clearing in these regions.
5
2. Introduction
The Australian Bureau of Agricultural and Resource Economics (ABARE) and the Bureau of Rural Sciences (BRS) in the Commonwealth Department of Agriculture, Fisheries and Forestry - Australia were commissioned to conduct a socio-economic assessment of a proposal to immediately halt clearing of ‘of concern’ vegetation and phase out clearing of remnant vegetation in Queensland. The proposal incorporates a $150 million adjustment package to be jointly funded by the Commonwealth and State to offset the development opportunities forgone by landholders as a result of cessation of land-clearing. The proposal addresses only remnant vegetation and does not consider clearing activity directed at regrowth on previously cleared land. In 2000-01, total clearing was 377 900 hectares, of which 40 per cent was clearing of re-growth on agricultural land and 60 per cent was clearing of remnant vegetation. The terms of reference for the assessment are attached (Attachment A). In undertaking the assessment, ABARE and BRS have worked with the Australian Greenhouse Office (AGO) and Environment Australia (EA) to provide a preliminary assessment of the greenhouse gas and biodiversity implications of the proposal. Summary excerpts of the findings and conclusions from these assessments are included in this report (section 1: Key findings, and section 6: Greenhouse Gas and Biodiversity implications). Underpinning analyses from which these findings are derived are contained in Attachments E and F.
3. How was the proposal assessed? This project utilises traditional cost-benefit techniques to estimate the opportunity cost of the proposed land-clearing framework. At the heart of the methodology is a baseline that reflects the likely Business As Usual (BAU) scenario. The baseline has been established acknowledging the existing range of controls over land clearing in Queensland. The socio-economic impact is then estimated by comparing the proposal to the baseline. Hence, a key element of the analysis is to identify what land will now not be available for clearing under the conditions imposed by the new land-clearing framework. The data used were drawn from a range of sources. Data on vegetation cover, past clearing patterns and the impact of the existing land clearing framework in Queensland on land that is eligible to be cleared were provided by Queensland state agencies. Queensland officials also provided their interpretation of the likely impact of the proposed changes to the land-clearing framework. Most of the economic data on which the opportunity cost estimates for private landholders are based are from ABARE’s farm survey database. Included in that database are the results of the 1997-98 Australian Agricultural and Grazing Industries Survey (AAGIS), which in Queensland included a supplementary questionnaire on vegetation cover and clearing activity. The 1997-98 data have been used extensively to develop estimates of the returns to clearing and to better understand the profile of farms clearing land in Queensland. Social impact assessment explores how particular events or policies impact on people’s way of life, their culture and their community. The analysis of social impacts draws on the experience and
6

knowledge gained from previous resource access policy changes, the economic analysis undertaken by ABARE, and analysis of ABS Population and Housing Census data (1996 and 2001).
4. What area of Remnant Vegetation is affected? The objective of the spatial analysis has been to develop an estimate of the area of woody remnant vegetation affected by the proposal. This area is henceforth referred to as net-D and is represented in the schematic diagram below (Figure 4.1). Remnant vegetation is defined (Queensland EPA 2001) as vegetation where the predominant stratum of the vegetation is still intact, that is, it has at least 50 per cent of the cover and more than 70 per cent of the height, and is composed of species characteristic of the vegetation’s undisturbed predominant stratum. This definition includes all woody structural formations as well as those dominated by shrubs, grasses and other life forms. In order to separate only the woody (defined as more than 10 per cent Foliage Projection Cover) from the rest of the remnant vegetation and to bring all data to a 2001 baseline, this study used the Queensland NR&M SLATS data dated 1999 - 2001, to remove regrowth and delineate total woody vegetation (A) within the EPA regional ecosystems mapping dated 1999 and Queensland EPA landcover mapping for non-remnant ecosystem areas.
AExclusions – slope, salinity, catchment restrictions, etc
net-D
Protected – National Parks, State forests, endangered REs etc.
B C
D
Figure 4.1. Schematic depiction of remnant vegetation and its relationship to the original proposal. (Note: not to proportion).
2003 2008
(A) total Queensland woody remnant vegetation; (B) current active permits issued (C); future permits under capped phase down; (D) total remnant vegetation under consideration in the proposal (rural leasehold and freehold. Excluding National Parks and State forests, endangered regional ecosystems, and ‘of concern’ regional ecosystems on leasehold land); and (net-D) potentially clearable remnant vegetation under consideration in the proposal (excluding those areas that most likely would not be cleared e.g. steep slope, catchment restrictions, etc.).
In order to arrive at net D it has been necessary sequentially to identify and then separate out areas that are already unavailable to be cleared for various reasons within the total area of woody remnant vegetation in Queensland (A). First, areas that would never be cleared, such as those in National Parks, State Forests and areas protected as endangered, and ‘of concern’ ecosystems on leasehold land under the Vegetation Management Act have been removed, leaving (D).
7

Second, areas excluded from clearing through slope restrictions, salinity hazard, catchment restrictions, draft regional vegetation management plan (RVMP) outcomes, urban areas and wetlands were identified and removed. What remains is remnant vegetation covered by currently active clearing permits (B), and permits to be issued for clearing remnant vegetation under the cap to be imposed by the proposed land-clearing framework until 2008 (C). The area of potentially clearable remnant vegetation forgone under the restrictions imposed by the proposal then constitutes net-D. The base data available from Queensland to enable the above step-wise analyses to be conducted and their relationships to one another are identified in Figure 4.2.
Figure 4.2. Flow diagram of data used in the preparation of spatial datasets. The area of remnant vegetation identified as affected by the proposal required a further level of interpretation to enable subsequent economic, social and other analyses. Consideration was given to how the potentially clearable areas of net-D might have been scheduled for clearing (spatially and over time) under a BAU scenario. Details of the BAU scenario and related assumptions are presented below in the section 5: What are the potential impacts of the proposal on landholders and communities?
8

The original proposal was based on a land-clearing framework that provided for permits covering 160 000 hectares of clearing to be allocated immediately the new framework came into force (assumed to be in December 2003) to allow for the existing stock of applications (150 000 hectares) currently being held by Queensland to be actioned (Figure 4.3). After this initial allocation, the framework proposed that further allocation of permits be phased down to zero over five (financial) years by reductions of an additional 32 000 hectares per year, with a period of two years to be exercised. This arrangement would result in a total of 480 000 hectares of clearing being permitted before total cessation of remnant vegetation clearing occurred in 2007-08 (or in effect by 2009-10, allowing for the two year exercise period to expire). Subsequently, a modification to the proposal was developed to provide for administratively simpler management arrangements for permit allocation. This modified proposal was based on setting the overall permitted clearing (C) under the new framework at 500 000 hectares and allocating permits to clear this area in two tranches (Figure 4.4). The first tranche (referred to as C 1) would allow for the approval of all applications received by Queensland but not yet actioned. It would be for around 150,000 hectares of clearing and the permits are assumed to be allocated in December 2003. The remaining 350,000 hectares (referred to as C 2) would be called for in calendar year 2004, and allocated on 1 January 2005. Under the modified proposal, all clearing would be completed by the end of 2006. The analysis presented in this report is based on this modified proposal. The location of clearing under the first tranche of permits (150 000 hectares) was specified by Queensland officials from permit databases. The location of clearing under the second tranche of permits (350 000 hectares) was modelled by ABARE based on past clearance practices. The data on the first tranche of permits were aggregated and reported on a Statistical Local Area (SLA) basis because the clearing application data do not identify specific locations within a property, and hence the resolution of the data are insufficient to enable an unequivocal allocation to a specific parcel of land. The second tranche of permits were also modelled on an SLA basis because no spatially explicit land clearing projections were available.
0
2040
60
80100
120
140160
180
03/04 04/05 05/06 06/07 07/08
Ha/
yr
Original Proposed Phasedown - commence at160,000 and reduce by32,000 pa
Figure 4.3. Original phase down of permits (C).
9
0
50
100
150
200
250
300
2004 2005 2006 2007 2008
Ha/
yrNew Phase down set 1 - applications in systemawaiting approval(150,000 Ha)New Phase down set 2 -no applications receivedyet (350,000 Ha)
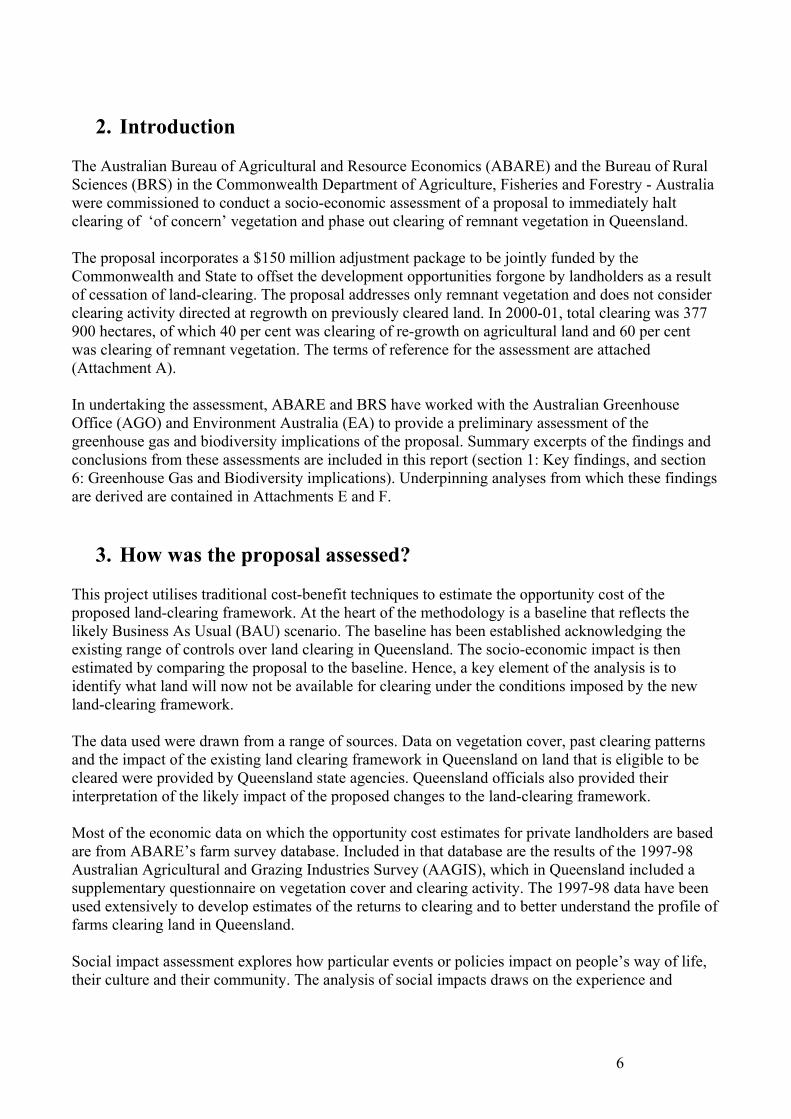
Figure 4.4. New phase down of permits (C) The area identified as potentially clearable in the new framework proposal (net-D), and the areas that will be cleared under the proposal (C), are shown in green in Figure 4.5 for the entire state and are not depicted separately for reasons indicated above. Areas covered by currently active clearing permits (B) are also displayed, but on a whole property basis and thus depict an over-estimate of their spatial coverage. For reasons indicated above, the areas were then aggregated and reported on an SLA basis for the separate categories (B, C, net-D) in the Section 5. A summary of the area of the remnant vegetation and separate categories (B, C, net-D) for the entire state is provided in Table 4.1 below.
10

Table 4.1 Summary area statement (ha)
Type Forest Woodland Total Source Total remnant vegetation in Qld (A) 47 464 00017 912 000 65 376 000Queensland spatial data
Total remnant for other tenures 4 104 000 5 032 000 9 136 000Queensland spatial data Total remnant for leasehold/freehold (D) 43 360 00012 880 000 56 240 000Queensland spatial data
Exclusions from clearing (slope, salinity, RVMP outcomes, urban, etc.)
2 815 000 2 425 000 5 240 000Queensland spatial data
Potentially clearable (net-D) 40 682 300 9 674 000 50 356 300Queensland spatial data - Of concern on freehold land 409 300 778,000 1 187 300Queensland spatial data - Not of concern vegetation 40 273 000 8 896 000 49 169 000Queensland spatial data Current permits (B) 122 000 1 209 000 1 331 000Queensland data, by SLA
Area affected by the proposal (net-D) minus (B) 40 550300 8 465 000 49 025 300Calculated from above data
BAU clearing within net-D (260,000 ha/yr for 25 years reducible)
2 755 842 2 560 227 5 316 069ABARE modelling
Phase down C1 - 2004/05 7 000 131 000 138 000Queensland spatial data Phase down C2 - 2005/06 143 000 219 000 362 000Queensland total and ABARE modellingArea foregone under the proposal BAU clearing minus total phase down (C)
2 605 842 210 227 4 816 069Calculated from above data
The modified proposal identifies the first tranche (C1) as being for 150 000 hectares of clearing and the second (C2) for 350 000 hectares. However, detailed inspection identified that in fact applications for forests and woodlands clearing in the first tranche only totalled approximately 138 000 hectares and that the remainder of the permits were for other forms of clearing (largely for grasslands for fodder) and thus the first tranche was adjusted down to reflect this reduced level of woodland and forest clearing. The second tranche allocation (C2) was adjusted upwards to 362 000 hectares to accommodate this change within the overall cap of 500 000 hectares.
11

Figure 4.5. Map of net-D and C combined (green) and B (red).
12

5. What are the potential impacts of the proposal on landholders
and communities? The analysis of the forgone opportunities from the proposal utilises traditional cost-benefit techniques. The analysis in the following section considers the opportunity cost for private landholders. Flow-on effects for rural towns and communities are then discussed. The benefits arising from a reduction in greenhouse gas emissions and biodiversity conservation are discussed in Section 6:Greenhouse and Biodiversity implications. In the absence of data on the likely future post-clearing land use, this analysis uses the assumption that all land clearing is for pastoralism. This is a realistic assumption if the focus is on land area, as just 2.3 per cent of clearing over the 1999-2001 period was for cropping. However, in terms of economic returns, this assumption is less realistic as of all the post-clearing land uses considered in an earlier report on land clearing restrictions, grazing offered the lowest return (ABARE 2000). The implications of this assumption for opportunity costs are discussed at the end of the following section. Opportunity cost for landholders Tree clearing in Queensland represents a development opportunity for rural landholders. However, the benefits of increased productivity must be weighed against the costs of clearing and the ongoing costs of managing regrowth. Further, farms face constraints on levels of investment and the net benefits of clearing will be considered in the context of other potential investments in land, capital equipment and breeding stock. Hence, all profitable investments in land clearing in Queensland cannot be expected to occur immediately. A range of factors may influence clearing rates such as limited cash availability, limits on the availability of farm labour and management skills, seasonal conditions and market outlook. This is reflected in observed clearing patterns. Consequently, an essential part of the analysis is to establish the economic returns from the clearing rate anticipated into the future in the absence of policy change. This can then be compared with the economic returns from clearing allowed under the new arrangements to calculate the value of forgone development opportunities.
Business As Usual scenario The Business As Usual or baseline scenario is designed to reflect the extent and composition of land clearing that would be expected to occur in the absence of policy change. The baseline extends 25 years until 2027-28. Recent data on the annual remnant clearing rate are presented in Figure 5.1. Although the recent rate of clearing has been relatively volatile, partly due to uncertainty surrounding the introduction of the Vegetation Management Act in 2000, after discussions with Queensland officials it was decided to assume an initial baseline clearing rate at 260 000 hectares a year.
13

Remnant clearing in Queensland
0
100
200
300
400
500
600
1995-97 1997-99 1999-00 2000-01
ha/yr
Remnant clearing
Business as usual assumption
Figure 5.1. Remnant clearing rates in Queensland
Implicit in the assumed rate of 260 000 hectares a year in the short term is the expected uptake of existing permits. Queensland officials have advised that around 40 per cent of the stock of permits is currently exercised in any given year. This supports the assertion that many farmers take out clearing permits as an option that is exercised when farms have sufficient investment capacity. Under the current vegetation management arrangements, landholders can apply for a clearing permit at very low cost and over the next two years continually assess their personal circumstances, and seasonal and market conditions to decide whether they will proceed with the planned clearing. If farmers’ expectations regarding the future availability of permits remains unchanged, there is no reason to expect that the uptake rate will change in the BAU scenario. In fact, as the highest returning land is likely to be cleared first, uptake rates could be expected to decline over time. The basis for allocating future clearing between SLAs is the 1999-2001 clearing pattern (Figure 5.2). Analysis of clearing patterns over time showed that although recent clearing rates had increased, the increase was relatively evenly spread among the same SLAs. That is, no significant amounts of clearing were emerging in SLAs where the level of clearing was historically low, and under a BAU scenario this pattern could be expected to continue.
14

Figure 5.2. Land clearing in Queensland 1991-2001, by SLA
15

However, two additional factors were considered. First, no future clearing was anticipated in SLAs where all remaining remnant vegetation was protected by the existing Queensland vegetation management framework. That is, there was no net-D in that SLA that could be cleared. Second, no clearing was assumed to occur in SLAs where clearing was estimated to be uneconomic. Estimates of the expected returns from clearing are discussed later in this section. The composition of clearing in each SLA, treating open (Photo 5.1) and closed forests as one category and woodlands (Photo 5.2) as another, is also assumed to remain unchanged. The only exception is where the stock of either forest or woodlands allowed to be cleared was exhausted, in which case all clearing activity in the SLA was assumed to focus on the remaining vegetation category until the end of the baseline projections in 2027-28 or until it was exhausted.
Photo 5.1 Open Forest Photo 5.2 Woodland
The proposal There are three groups of permits that need to be separately accounted for in the proposal evaluated. The first is existing permits. Landholders are likely to value the flexibility the permit provides them with respect to their choice over exactly when to clear. The latter point would suggest that landholders attribute an option value to a clearing permit. However, with the announcement of the current proposal, landholders will be practically reduced to a one-off opportunity to exercise their permits. The uptake rate of permits would be expected to increase, providing additional returns to clearing. However, this would be offset by the lost option value attached to existing permits. That is, the policy change has forced landholders away from their preferred position and this could represent an economic cost for them. Because of the difficulties in directly estimating the option value, the effect of the proposal on the benefits of exercising existing permits has not been included in the analysis. The second group is the set of applications for the clearing of around 150 000 hectares of land that have been received by the Queensland Government, but are yet to be approved. These applications are expected to be approved by December 2003 and will be included in the stock of permits
16

allocated during the phase down period. Queensland officials provided information on the SLAs where the clearing was planned and the area of proposed clearing (see Figure 5.3). However, upon closer inspection only 137 616 hectares of these permits were for clearing of forests and woodlands. The remainder were for clearing of land other than forests and woodlands (largely grasslands for fodder). It was assumed that all permits for clearing of forests and woodlands would be approved and subsequently exercised by landholders over the 2003-2005 period. Consequently, an adjustment was made to the phase down scenario to one of 137 616 (rounded to 138 000) hectares in the first tranche (C1) and 362 384 (rounded to 362 000) hectares in the second tranche (C 2), and totalling 500 000 hectares.
Figure 5.3. First Tranche permits of phase down (C1)
17

Figure 5.4. Second Tranche permits of phase down (C2)
The third group of permits are those that will be issued over the remainder of the phase down period, referred to as the second tranche (C2). The assumption was that the remaining 362 000 hectares of permit allocations would be issued on 1 January 2005 and fully exercised over the following two year period. Upon announcement of the new framework, there is a possibility that a considerable number of landholders will seek to ensure that they give themselves the best possible opportunity to exercise an option to clear their land under this second tranche of permits, by submitting an application for consideration. The extent to which this develops depends primarily on the criteria to be used to determine eligibility for adjustment assistance under this package. However, in the absence of any detailed information on the allocation mechanism to be used, these permits were
18

allocated across SLAs and between forests and woodlands to reflect the pattern of remnant clearing over the 1999-2001 period (see Figure 5.4).
Private returns to clearing The private returns to land clearing are generated from the increased carrying capacity of the properties and the associated increase in operating profit. This can be expressed as: Opportunity cost = Expected increase in agricultural output from clearing (1) times Net returns per additional unit of agricultural output (2) less Cost of clearing (3) Components (1) and (2) represent the gross returns to land clearing. The approach taken to estimating gross returns utilises information on land values from ABARE’s farm survey database as they represent the capitalised value of the long run returns from agricultural activity including other investments such as animal inventories. Data from the 1997-98 AAGIS collection were used as this is the only year in which data on the vegetation cover of broadacre properties were collected in conjunction with the farm production and financial information. Details of ABARE’s farm surveys and the vegetation management supplementary survey are presented in the 1999 ABARE Australian Farm Survey Report. The 1997-98 land values in the farm survey dataset have been indexed forward to 2001-02 dollars. The significant rise in values over this period can be largely explained by the rise in beef prices (see Figure 5.5).
Queensland land and beef prices (All values are in 2001-02 dollars)
200
300
400
500
600
700
800
1988-89
1989-90
1990-91
1991-92
1992-93
1993-94
1994-95
1995-96
1996-97
1997-98
1998-99
1999-00
2000-01
2001-02
$/beast
60708090100110120130140150160
$/ha
Beef
Land
Figure 5.5. Queensland land and beef prices, 1988-89 to 2001-02
M-quantile regression analysis was used to estimate the value of different land cover classes on agricultural properties. Unlike ordinary least squares regression, M-quantile regression allows different parameter values to be attributed to individual farms within a sample. As such, this
19

technique generates estimates that can be used to provide a better spatial representation of economic returns compared with region level estimates. The regression analysis explained the total land value for each farm as a function of the area of the different land uses and vegetation classes on the property. The model was specified as: Land value/NPP = a(area of grassland) + b(area of grazable closed and open forest) + c(area of grazable woodlands) + d(area of grazable other vegetation excluding grassland) + e(area of cropland) + f(area of unused land) where NPP is an index of net primary productivity from the AGO (2002) data set. The vegetation classes are defined as: Closed forest 100 per cent crown cover, over 2m high (includes tropical and temperate
forests) Open forest 50 – 100 per cent crown cover, over 2m high Woodlands 20 – 50 per cent crown cover, over 2m high Other vegetation less than 20 per cent crown cover and/or under 2m high (excluding
grasslands) From the regression estimates it was possible to derive the value of a hectare of a particular type of vegetation or land use for each farm in the sample by multiplying the estimated parameter by the NPP index for that farm. The difference between the value of a hectare of grassland and grazable vegetation (grazable forest and woodland) represents an estimate of the capitalised gross return to clearing vegetation to grassland. This estimate was then used in a calculation designed to reflect the expected productivity profile after clearing and to incorporate clearing costs. The post-clearing productivity assumptions and clearing cost estimates used in this study were derived in consultation with the Queensland Department of Primary Industries as part of an earlier ABARE analysis of changes to Queensland vegetation management controls (ABARE 2000). Clearing cost estimates are presented in Attachment B. The assumed productivity profile is as follows. For the first three years following clearing the productivity of land cleared for grazing increases to 30 per cent above the average productivity of grassland in that region. This reflects the short-term spike in productivity obtained as a result of natural soil fertility. The productivity of cleared land is then assumed to decline as the natural soil fertility is rundown and regrowth reduces productivity. By 15 years after clearing the increase in productivity falls to just less than half of the initial increase in productivity. The land is then assumed to be re-cleared with the same post-clearing productivity pattern, but without the initial 30 per cent spike. Re-clearing costs were assumed to be lower than initial clearing costs for two reasons. First, clearing costs are known to continually decline with successive regrowth controls. Second, it is likely that the returns to grassland already have some regrowth maintenance costs embedded in them. In the analysis it is assumed that re-clearing costs are two-thirds that of original clearing. This clearing cycle is assumed to continue indefinitely and the net present value of the stream of returns was calculated using a 5 per cent real discount rate.
20
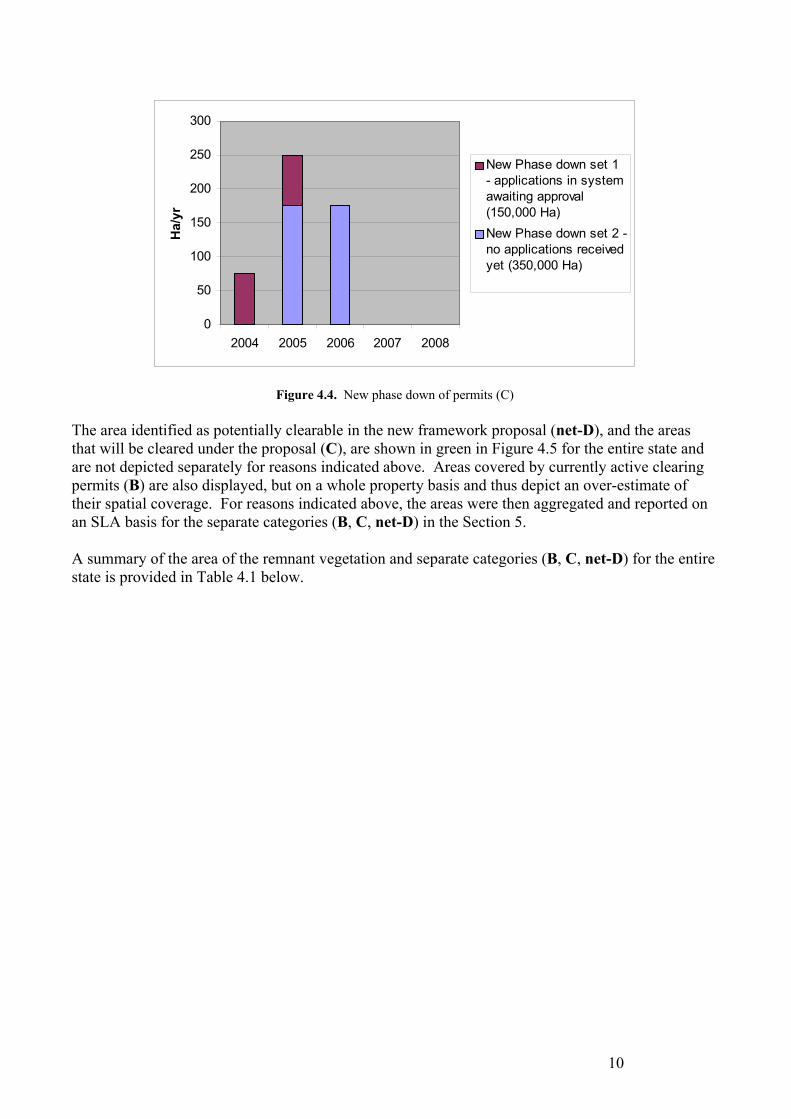
Returns to clearing within an SLA are likely to vary substantially with climate and terrain. Within an SLA it is assumed that clearing will only take place where there is an economic return. Hence, average returns for each SLA were calculated from those sample points in the ABARE farm survey dataset that indicated clearing was economic. The estimates are conditional means and the average return to clearing across the entire SLA is likely to be substantially lower. Kernel smoothing techniques were used to calculate local area estimates for grid points spaced 0.2 of a degree (approximately 20 kilometres) apart. This technique calculates an estimate at each grid point drawing on surrounding survey farms. Other things being equal, a survey farm located close to the grid point or with a high survey weight is given a higher level of importance (or a greater weight) in the calculation. All the grid points lying within a particular SLA are then used to separately calculate the average returns to clearing forests and woodlands in that SLA. The estimated returns to clearing are presented in Figures 5.6 and 5.7. SLAs where clearing is estimated to be economic are also those where the majority of clearing has been taking place, thereby providing a degree of confidence in the estimates. The estimates suggest the returns from clearing open and closed forest are generally higher than those from clearing woodlands, particularly through central Queensland.
Figure 5.6. Average returns to clearing grazable forest, by SLA.
21

Figure 5.7. Average returns to clearing grazable woodlands, by SLA.
Opportunity cost estimates Comparing the economic returns to landholders under the baseline and under the proposal provides an estimate of the opportunity costs to landholders. On the assumption that all land clearing is for pastoralism, the opportunity cost is estimated to be around $181 million. The opportunity cost at an SLA level are presented in Figure 5.8. In conducting the analysis, three issues were brought into sharp focus. First, the assumption used to calculate the opportunity cost estimate above, was that all clearing would be for pastoralism. However, if the post-clearing land use is for higher value activities, such as cropping, the opportunity cost will be increased significantly for a small number of producers.
22
A little over 2 per cent of clearing over the 1999-2001 period was for cropping (Figure 5.9). However, the extent of cropping immediately following land-clearing has varied significantly over the 1991-2001 period, ranging from as high as 9.6 per cent of state clearing in 1997-99 to as low as 0.54 per cent in 2000-01. This could possibly be explained by changes in the returns to cropping relative to beef and wool, and seasonal conditions. Although data on post-clearing land use could not be provided by Queensland, estimates of the value of pastoral and crop land were used to gauge the possible impact on opportunity cost of some clearing for cropping. If 2 per cent of future land-clearing was for cropping then the opportunity cost of the proposal may be closer to $191 million. Second, a cessation of remnant clearing may free up some financial, labour and management resources for other on-farm investments or developments such as regrowth control. This is because the extended pattern of land-clearing through time suggests it is occurring within the limits of available farm resources. If there were no such constraints it would be expected that all economic clearing would be undertaken immediately. The extent to which remnant clearing effort would be transferred to regrowth control is extremely difficult to predict. However, if 10 per cent of the remnant clearing effort is assumed to be transferred to regrowth control that offers similar economic returns then the opportunity cost of the proposal would be of the order of $166 million. Third, some potential problems were found with the strict application of the decision rules used in this analysis. In particular, both the proposal and the opportunity cost estimates in this report take no account of the possibility that in some SLAs all vegetation affected by the proposal may be cleared before the end of the phase down period. For example, only 70 per cent of the first tranche of permits (C1) could be cleared without breaching existing regulations on land clearing. Similarly, only 232 000 hectares of the 362 000 hectares of permits to be allocated in the second tranche (C2) could be exercised without breaching existing regulations if they are to be allocated between SLAs proportional to past clearing rates. This will need to be considered when implementing the proposal. The effect of these shortcomings on the estimated opportunity cost will depend on the nature of any changes to decision rules for allocating permits. These changes need to be known before refined estimates of opportunity costs can be developed.
23

Figure 5.8: Opportunity cost from the proposal, by SLA.
24

Figure 5.9. Proportion of state land-clearing which was for cropping, 1999–2001, by SLA
25

Impact on farm viability The potential impact of the proposal on farm viability is an important concern. If the impact of the proposal was to reduce the ability of a property to earn income, then depending on the extent of this reduction, the property may not be economically viable. However, the most significant effect is likely to be on land values. While many farms are likely to be affected by the proposal, it is likely that only a small subset of these may have their viability threatened. The area of remnant vegetation affected by this proposal, identified using Queensland data, was used in conjunction with Queensland’s Digital Cadastral Database to obtain an estimate of the number of properties affected by this proposal and the area of affected vegetation on these properties. Properties were separated by their size class and by the amount of affected vegetation found on each farm (table 5.1 and 5.2).
Table 5.1. Number of properties affected by the proposal b
Proportion of affected vegetation contained on farm (including net D, existing permits (B) and phase down areas (C))
Size class (ha) 0 - 20% 20 - 40% 40 - 60% 60 - 80% 80 - 100% 10-100a 1695 673 338 238 153101-500 1829 631 409 274 197501-2000 1364 370 247 168 1412001-5000 1111 279 176 99 905001-20000 1755 497 299 223 22220001 - 433 229 137 166 285Total 8214 2732 1657 1196 1288
a Properties smaller than 10 hectares were excluded from the table. b Properties in the Brisbane and Moreton statistical divisions were excluded since many were expected to be non-rural. Note: Affected vegetation excludes ‘of concern’ ecosystems on freehold land. Based on ABARE/BRS calculations using Queensland data.
Table 5.2: Area on properties affected by the proposal (Ha) b
Proportion of affected vegetation contained on farm (including net D, existing permits (B) and phase down areas (C))
Size class (ha) 0 - 20% 20 - 40% 40 - 60% 60 - 80% 80 - 100% 10-100a 7456 10017 8536 7864 5978101-500 29306 44742 48690 46040 43809501-2000 84952 109287 129901 131955 1376482001-5000 204025 264778 282749 218098 2473305001-20000 972889 1582826 1578915 1737627 223116520001 - 2021522 3549098 3789340 7750096 19756366Total 3320150 5560748 5838131 9891680 22422296
a Properties smaller than 10 hectares were excluded from the table. b Properties in the Brisbane and Moreton statistical divisions were excluded since many were expected to be non rural. Note: Affected vegetation excludes ‘of concern’ ecosystems on freehold land. Based on ABARE/BRS calculations using Queensland data. As can be seen from table 5.2, a large proportion of the affected vegetation is found on larger properties. These properties also tend to have a large portion of their total area covered with vegetation affected by this proposal. Tables 5.3 and 5.4 show respectively the number of properties and area affected by the proposal in the top 20 SLAs ranked by opportunity cost. Around 48 per cent of the affected properties are located within just five of these SLAs: Bauhinia, Calliope, Murweh, Banana and Booringa.
26

Figure 5.10. Twenty most affected SLA on basis of opportunity cost.
Table 5.3. Number of properties affected by the proposal in top 20 SLAs ranked by aggregate opportunity cost
Proportion of affected vegetation contained on farm (including net D, existing permits (B) and phase down areas (C))
Size class (ha) 0 - 20% 20 - 40% 40 - 60% 60 – 80% 80 - 100% 10-100a 126 55 23 21 11101-500 384 131 66 44 30501-2000 644 142 65 43 292001-5000 553 127 70 34 155001-20000 556 175 98 77 2220001 - 74 53 37 29 11Total 2337 683 359 248 118
a Properties smaller than 10 hectares were excluded from the table. Note: Affected vegetation excludes ‘of concern’ ecosystems on freehold land. Based on ABARE/BRS calculations using Queensland data.
27

Table 5.4. Area on properties affected by the proposal (Ha) in top 20 SLAs ranked by aggregate opportunity cost
Proportion of affected vegetation contained on farm (including net D, existing permits (B) and phase down areas (C))
Size class (ha) 0 - 20% 20 - 40% 40 - 60% 60 – 80% 80 - 100% 10-100a 564 765 488 800 534101-500 6524 10393 8918 8162 7731501-2000 38252 41662 34556 34723 326532001-5000 92692 124983 109821 75077 457965001-20000 306714 546088 512046 577697 18762920001 - 163004 467294 637652 860498 352215Total 607750 1191185 1303481 1556957 626558
a Properties smaller than 10 hectares were excluded from the table. Note: Affected vegetation excludes ‘of concern’ ecosystems on freehold land. Based on ABARE/BRS calculations using Queensland data. A profile of the broadacre farms in the 20 most affected SLAs, as measured by aggregate opportunity cost, is presented in Table 5.5.
Table 5.5. Farm profiles for affected farms in top 20 SLAs ranked by aggregate opportunity cost Characteristic Average a Land area (Ha) 8027 Total cash costs b ($) 212331
Administration 10412 Fertiliser 1733 Electricity 1634 Fodder 14453 Fuel, oil and grease 16070 Crop pasture chemicals 3198 Insurance 4517 Interest paid 18636 Livestock materials 3998 Plant hire 120 Rates 5290 Repairs buildings 10385 Repairs maintenance 23837 Repairs plant 13451 Seed 2684 Shearing and crutching 3458 Telephone 2092
Total cash receipts ($) 279021 Farm business profit ($) 635 Rate of return (%) 5 Average farm debt ($) 241219 Average non farm income ($) 18543
a Based on ABARE 2001-2002 farm survey data b Total may not add due to rounding and the exclusion of some small farm cash expenditures
28

A pivotal question is the degree to which these landholders are affected by the proposal. Land values generally reflect the capitalised value of the expected stream of future profits from resource use. In the case of land clearing, the extent to which any future increase in profitability arising from land development is factored into the land value depends critically on both the expected increase in productivity that clearing could generate and the expected timing of clearing. The latter is especially important if the land development is expected to occur over several years. This is represented graphically in figure 5.11. The expected profit stream under current development is the flat bottom line. The steadily increasing top line represents the expected returns under a scenario of gradual land clearing and property development. The premium that would be factored into the price of uncleared land would be the net present value of the difference in future profits which is represented by the gap between these two lines.
400
500
600
700
800
900
1000
1100
1200
1300
1400
Time
Prof
it ($
)
Returns from current development Returns from future development
Figure 5.11. Returns with and without future land clearing To gain some additional insight into the nature of clearing in Queensland, ABARE farm survey data were used to profile the characteristics of farms clearing land (table 5.6). Only farms located in the 20 SLAs with the highest opportunity cost were included in these estimates. Farms that cleared land during the 1995-1998 period were larger and less developed, in both a proportional and absolute sense, than farms that did not clear. Consequently, they also had lower average land values and stocking rates than farms that did not clear. This is an indication of the underlying motivation for land clearing, which is to lift carrying capacity and increase profitability. The average area of remnant clearing accounted for only a small proportion of remnant cover. This suggests that property development programs could extend over many years.
29

Table 5.6: Farm profiles for the top 20 SLA’s ranked by aggregate opportunity cost and clearing Characteristic Farms clearing Farms not clearing Land area (hectares) 15424 5786 Total cash costs ($) 225100 156000 Farm business profit ($) 6432 -8300 Rate of return (%) 2.5 -3.2 Average farm debt ($) 294313 262770 Vegetation cover (%) 78 53 Vegetation cover cleared (% of vegetation cover, includes regrowth clearing)
13 0
Land value - $ per hectare 108 167 DSE per hectare 0.93 1.52
a Based on ABARE 1997-98 farm survey data Farms that cleared also had higher levels of farm cash income and farm business profit in 1997-98. While this may seem inconsistent with these farms being less productive, it is probably explained by the tax treatment of land clearing expenses. Although land clearing is a form of capital investment, for taxation purposes the costs involved would probably be treated as a cash cost and, hence, fully deductible in the year of expenditure. Consequently, the farm business tax position may be a major factor in the decision to clear. This would suggest that property development occurs over many years and in high income years in particular. If the rate of clearing on all farms was the same as that for the SLA as a whole, then at the SLA level the fall in the capital value of the farms as a result of this proposal would be equal to the opportunity cost presented in the earlier section. This is because the average returns and the time period over which clearing would occur would be the same at the farm and SLA level. Within a SLA, the reduction in capital value of individual properties would be roughly distributed according to the area of affected vegetation on each property. While the proposal would reduce the capital value of affected properties, it is unlikely to directly affect the viability of businesses in their current form. The current levels of productivity and income earning potential would not be affected. Although there would be a reduction in farm equity, the debt servicing ratio would remain unchanged. The exception would be farm businesses that borrowed heavily to purchase properties at a price that reflected the expectation of future property development and were relying on the future increases in productivity and profitability to service the loan. From the data available to this study, it is not possible to judge how many properties are in that situation. Rather, it may only be possible to assess this on a case-by-case basis. To gain an insight into the impact of clearing restrictions on individual farms, average clearing rates and returns were estimated using a sub-sample of survey farms that cleared remnant vegetation between 1996 and 1998 in the top 20 SLAs. To calculate an upper bound estimate of the opportunity cost of clearing restrictions for these farms it was assumed that they would continue to clear their remaining stocks of remnant vegetation at the same rate and return over the next 25 years. However, in the absence of farm specific information it was not possible to account for the potential limits on clearing imposed by the existing Queensland restrictions. The net present values of these estimates, expressed in absolute terms and as a percentage of farm capital value, are presented in Table 5.7. On average, the opportunity cost of foregone clearing represents about 9.2 per cent of the average farm
30

capital value, for farms on which clearing of remnant vegetation is economic. However, the distribution of these costs is skewed by a small number of farms with relatively high opportunity costs. The median opportunity costs is lower than the mean at 8.1 per cent. Table 5.7. Opportunity cost for farms clearing remnant vegetation in the top 20 SLAs ranked by aggregate opportunity
cost and clearing Percentiles Mean 25 50 75 NPV opportunity cost
$254 000 $54 000 $228 000 $435 000
Opportunity cost as a percentage of total capital value
9.2
2.2
8.1
12.5
Given that the overall impact of the proposal on farm viability is likely to be small for the properties that would have been cleared for grazing purposes and the package is of a similar magnitude to the opportunity costs, the overall social impact of the proposal is likely to be manageable. At the same time, there will be a number of social impacts, particularly those related to changes in traditional farming practices and the nature of economic activity, and these impacts are likely to be important for some individuals and some communities. Land clearing is an important part of the traditional Queensland pastoralist farming system. Regulations controlling land clearing are therefore likely to be seen as impacting negatively on farming opportunities and may affect perceptions of the viability of succession plans. Cessation of land clearing will necessitate changes to farming practices with flow-on effects to information and training needs. Flow-on effects to regions and communities With the cessation of clearing of remnant vegetation there will be reduced employment in land clearing and related industries, including machinery sales and maintenance. However, there will continue to be significant clearing of regrowth. Clearing of regrowth in 2000-2001 was 152 700 hectares, which was 40 per cent of the total clearing of 377 900 hectares. To the extent that the proposed implementation package provides a payment to landholders, expenditure by landholders may occur outside the region and there may be a net decline in expenditure flows in the region. These impacts are likely to flow through and affect the population living in towns and the services they provide, including to landholders. There may also be reduced opportunities for off-property work for landholders and their families.
While the bulk of agricultural employment is in the pastoral sector, the horticulture, cotton and sugar sectors are important land uses in the affected area. In a small number of SLAs, cropping is the major agricultural activity and the cessation of land clearing can be expected to have higher social and economic impacts in these SLAs. For example, employment in horticulture accounts for 41 per cent of all agricultural employment in Burnett and Isis, and sugar and horticulture together account for 85 per cent in Burnett and Isis (Table 1 in Appendix D). Much of the area where there are higher opportunity costs associated with the proposal is experiencing negative population growth and is economically and socially disadvantaged. These areas are generally experiencing negative population growth, well below the Queensland non-metropolitan average of 1.36 per cent. A large part of the affected area is economically and socially
31
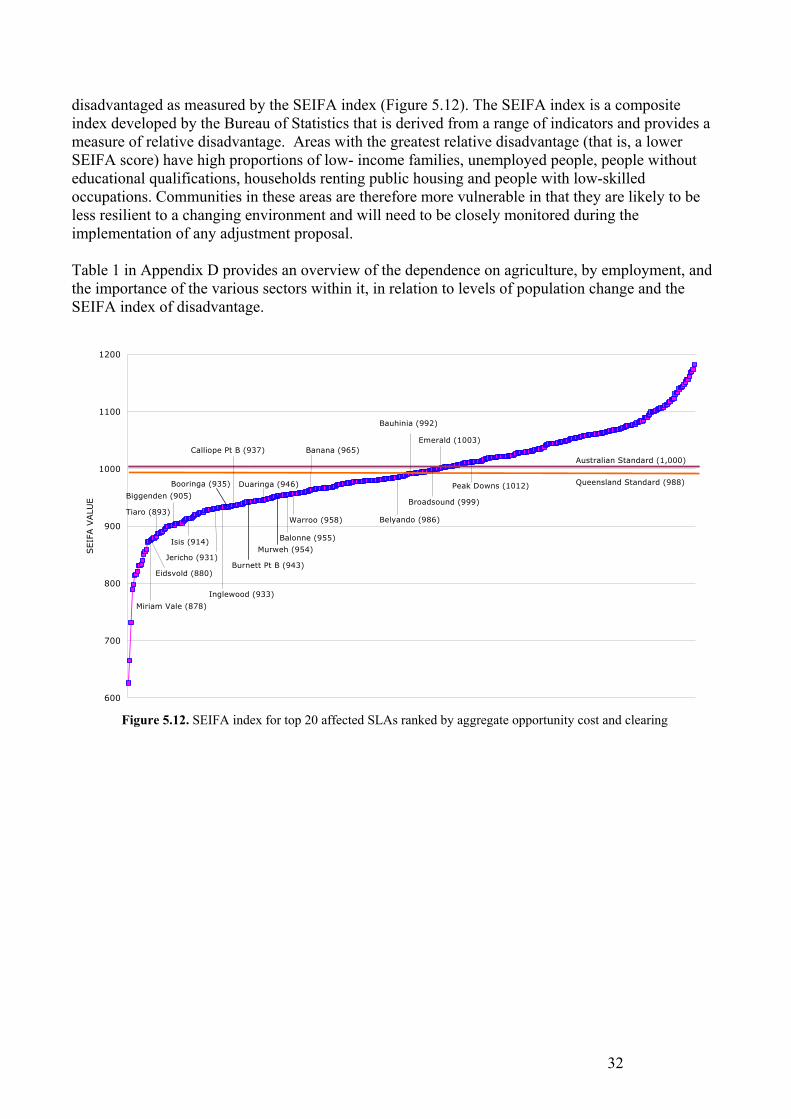
disadvantaged as measured by the SEIFA index (Figure 5.12). The SEIFA index is a composite index developed by the Bureau of Statistics that is derived from a range of indicators and provides a measure of relative disadvantage. Areas with the greatest relative disadvantage (that is, a lower SEIFA score) have high proportions of low- income families, unemployed people, people without educational qualifications, households renting public housing and people with low-skilled occupations. Communities in these areas are therefore more vulnerable in that they are likely to be less resilient to a changing environment and will need to be closely monitored during the implementation of any adjustment proposal. Table 1 in Appendix D provides an overview of the dependence on agriculture, by employment, and the importance of the various sectors within it, in relation to levels of population change and the SEIFA index of disadvantage.
600
700
800
900
1000
1100
1200
SEIF
A V
ALU
E
Booringa (935)
Burnett Pt B (943)
Murweh (954)
Australian Standard (1,000)
Queensland Standard (988)
Jericho (931)
Belyando (986)
Bauhinia (992)
Broadsound (999)
Emerald (1003)
Peak Downs (1012)
Banana (965)Calliope Pt B (937)
Inglewood (933)
Miriam Vale (878)
Eidsvold (880)
Tiaro (893)
Biggenden (905)
Isis (914)
Duaringa (946)
Balonne (955)
Warroo (958)
Figure 5.12. SEIFA index for top 20 affected SLAs ranked by aggregate opportunity cost and clearing
32
6. Greenhouse Gas and Biodiversity implications In addition to the assessment by ABARE and BRS of the opportunity costs of the proposal, the Australian Greenhouse Office (AGO) and Environment Australia (EA) have provided preliminary assessments of the implications for greenhouse gas emissions and biodiversity outcomes resulting from the proposal. Greenhouse Gas Implications Using the National Carbon Accounting System (NCAS), the AGO has concluded that:
(i) the cessation of deforestation of remnant forests (even with lagged emissions from previous deforestation events, the removal of regrowth and ‘exempt’ activities such as urban development taken into account) could deliver up to 25Mt CO2 abatement a year over the first commitment period;
(ii) the nearer in time to the commencement of the first commitment period that deforestation of remnant forests is allowed to occur, the greater the risk of significant emissions occurring during the Kyoto target period;
(iii) the cost of abatement would be less than $1 per tonne of CO2, much less than other identified greenhouse emissions abatement options.
Biodiversity Implications The proposal will have immediate and long-term benefits for both landscape and biodiversity conservation. ‘Of concern’ regional ecosystems, currently available to be cleared on freehold land, will be immediately protected on all tenures, ensuring that all threatened vegetation communities in Queensland will have statutory protection. As a result of phasing out all clearing other than regrowth the proposal will also protect remnant native vegetation more broadly across the state. Recognising that protection from clearing is not sufficient on its own to ensure that biodiversity is protected, the proposal also includes financial incentives for the ongoing management of vegetation for a range of conservation purposes. The proposal will also have significant medium and long-term benefits resulting from increased retention of native vegetation. These include future savings on interventions to ameliorate the impacts of salinity, water quality decline, soil loss, ecosystem degradation and species decline.
7. Acknowledgements ABARE and BRS wish to acknowledge the assistance provided by Queensland officials led by the Department of Natural Resources and Mines and officers of the Australian Greenhouse Office and Environment Australia.
33

8. Attachments Attachment A Terms of Reference. Attachment B Clearing cost estimates. Attachment C Queensland data assumptions and limitations. Attachment D Employment, Population and SEIFA Attachment E Australian Greenhouse Office report on the greenhouse gas
implications of the proposal Attachment F Environment Australia report on the biodiversity and landscape
implications of the proposal
34

Attachment A JOINT ABARE/BRS STUDY
QUEENSLAND LAND CLEARING PROPOSAL DRAFT TERMS OF REFERENCE
In light of the proposal to reduce land clearing, ABARE and BRS are to conduct an independent socio-economic study of the possible impact of the proposal, which would estimate, inter alia: 1. the area likely to be affected by the proposal, specifically the net area of remnant vegetation in
rural areas that would otherwise be subject to broad scale clearing for economically viable productive farming or grazing uses;
2. the net opportunity cost for landholders prevented from clearing remnant vegetation that would otherwise have been cleared for economically viable productive uses.
3. the likely number of producers affected, including an estimate of producers who are at risk of becoming unviable, as a result of the proposal; and
4. the capacity of the proposed adjustment package to offset the projected opportunity costs and the possible regional impacts.
In addition to the above Terms of Reference the Bureaus will, to the extent possible, also comment on the potential broader medium to longer-term costs and benefits to the community, the broader impact on rural and regional communities and any key areas of uncertainty. All results, as far as possible, should be outlined both broadly for the State and on a regional geographic basis. Data Sources In conducting its investigations, ABARE and BRS can draw on the best available data including, if appropriate, the Australian Bureau of Statistics, the most recent price, commodity and survey data available from ABARE and farm income data from the Australian Taxation Office, land cover change data from the NCAS, any Queensland sources of data, as well as data from any other source. The Report The report should be presented in an easily understood manner, with as far as possible, photographs, maps and graphs to illustrate findings. Data and other source material should be fully referenced in the report. The report is to be confidential. Timelines Following the relay of these Terms of Reference to Queensland. Week 1 Outline of the report and research methods, including assumptions. Week 3 Draft report with a preliminary assessment and detailed description of data and
methods. Week 4 Final report. Reference Group A Reference Group, chaired by AFFA, with representatives from EA, AGO and PM&C, will facilitate the conduct of the study.
35

Attachment B Clearing cost estimates The cost of clearing varies depending on the type and thickness of vegetation. The clearing cost estimates used in this analysis apply to closed, open and woodland forest types and were derived from earlier consultation with QDPI (personal communication, Paul Black and Peter Donaghy, QDPI, November – December 1999). Table 1 contains average per hectare cost estimates for each region for clearing remnant vegetation to native pasture. Table 1: Average regional clearing costs for pastoral use ($/ha)
Regions 312 313 314 321 322 331 Closed 70 70 70 91 91 317 Open 70 70 70 91 91 291 Woodlands 48 48 48 66 66 85 The estimates used in the analysis have been checked against data provided by QDNR. They are broadly consistent, although there was some deviation in the more intensively farmed regions in the south-east of Queensland (regions 321 and 331), where QDNR have estimated higher costs. However, examination of the pattern of clearing shows that most of the recent clearing was in the western part of these regions, region 321 in particular. The less dense vegetation in these lower rainfall areas was the justification for choosing the lower clearing cost.
36
Attachment C Queensland data assumptions and limitations The data set net-D represents what vegetation is currently available to be cleared in Queensland, based on a modified Vegetation Management Act (VMA). Vegetation that can potentially be cleared must fall within the following criteria: • Is remnant woody vegetation i.e. not ‘of concern’ or ‘endangered’ ecosystem and has a foliage projective cover
(FPC) of >10 per cent • Is located on freehold or leasehold • Is not located in an urban zone • Is a known clearable vegetation type • Has no clearing restriction under the VMA eg.
o Slope o Salinity o Wetlands o Riparian zones o Not located in a catchment where no further approvals will be allowed
• Has not reached the possible clearing limit of the RE type • Will not be protected under the proposed RVMP Addition information provided included: • Biodiversity indexes • Clearing likelihood over the next 5 years • Whether a clearing approval exists over an area • Property related information
o Size of property o Percentage of net-D vegetation that exists on a property o What is the unimproved value of a property ($ per hectare) with net-D located within the property o Primary land use of the property
Analysis Assumptions Net-D equals: 1) Environmental Protection Agency (EPA) Remnant Ecosystem (RE) vegetation or land cover mapping classified
as Not of Concern and; 2) Clearing not detected by Statewide Landcover and Tree Study (SLATS) during the 1999-2001 change detection
period and; 3) Vegetation classified as Woody in the SLATS FPC layer and; 4) Vegetation classified as Woody by the EPA and; 5) Land tenure classified as either freehold or leasehold and; 6) A salinity hazard rating of medium to low and; 7) A slope percentage equal to or less than the values prescribed in PR4 of the State Policy for Vegetation
Management on Freehold Land and; 8) REs that have not reached threshold levels and; 9) Catchments where clearing is still allowed and; 10) Not located in urban areas and; 11) Known REs allowed to be cleared Data Limitations Some of the limitations specified by Queensland in regard to spatial data: • All data sets have been grided at a cell size of 100m that represents a minimum analysis size of one hectare. The
conversion of vector data to raster will either degrade or enhance spatial features in some areas. No checking has been performed to determine whether any deterioration or enhancement has occurred.
• Spatial Analysis has been undertaken with the assumption that the source data is error free and all appropriate checks have been performed.
• Due to the way the analysis is undertaken, error(s) in one spatial layer will flow through the analysis process and therefore cause problems and errors to other layers and the final prediction outcomes. These errors are minimal when outcomes are declared accurate at the regional scale of 1:250,000.
• That all the analysis has been undertaken at a 1 hectare cell size (100m * 100m), therefore data has been either directly scaled up or scaled down to this cell size with no modelling or statistical calculation undertaken to determine the impact of deterioration of the information.
• Due to time restrictions, little data checking and quality checking has been undertaken. Therefore, data has been treated as accurate from the source. There have been some errors picked up, these have been completely corrected, modified to include best available information or noted but not modified.
37

38
Attachment D Employment, Population and SEIFA
SLA Name % of
Employment in Agriculture
(2001)
% of Ag. emp'ment in
Cotton (2001)
% of Ag. emp'ment in
Sugar (2001)
% of Ag. emp'ment in
H'culture, (2001)
Economic Dependency
Index (2001)
% Average Annual
Population change
(1996 – 2001)
SEIFA (1996)
Warroo 51.19 1.99 0 1.99 66.33 1.34 958 Jericho (S) 51.06 0 0 0 66.34 1.01 931 Bauhinia (S) 47.50 1.7 0 1.39 61.24 0.17 992 Booringa (S) 40.82 0 0 1.05 58.29 1.47 935 Eidsvold (S) 40.81 0 0 18.68 61.05 -0.91 880 Inglewood (S) 35.51 0.98 0 7.12 57.39 -1.15 933 Balonne 33.49 33.05 0 3.83 55.84 2.28 955 Burnett (S)-Pt B 26.61 0 43.65 41.61 53.79 1.22 943 Murweh (S) 20.03 0 0 0.62 46.18 0.02 954 Banana (S) 19.99 4.72 0 1.57 41.50 -0.21 965 Calliope (S)-Pt B 19.32 0 0 13.08 44.30 -0.27 937 Peak Downs (S) 16.84 1.1 0 1.1 57.28 0.76 1012 Broadsound (S) 14.95 0.59 18.68 2.58 58.29 -2.57 999 Miriam Vale (S) 13.75 0 1.86 17.21 40.12 2.29 878 Duaringa (S) 12.86 0.86 0 0 50.21 -3.57 946 Emerald (S) 12.49 18.51 0.35 30.66 39.45 1.36 1003 Belyando (S) 11.07 1.67 0 0.55 53.74 -1.66 986 Isis (S) 31.17 0 43.54 41.72 53.77 0.38 914 Tiaro (S) 26.27 0 14.96 32.84 53.40 0.96 893 Biggenden (S) 3.14 0 0 30.77 50.88 -1.16 905 QLD Non-metro Average
7.48
1.36
QLD State Average 988 AFF = Agriculture, Fishing and Forestry Economic Dependency Index: The concentration of employment within the top three employing industry sectors.