Embed Size (px)
Citation preview

Transport and Main Roads
Queensland Cycle Strategy 2011–2021

2 Queensland Cycle Strategy 2011–2021
This document has been produced by the Department of Transport and Main Roads.
PO Box 673 Fortitude Valley QLD 4006Phone: 13 23 80Website: www.tmr.qld.gov.au
Images supplied courtesy of Queensland Health, Sustainable Transport Consultants, Sunshine Coast Regional Council, Department of Local Government and Planning, and the Mad Cycologists.
Copyright protects this publication. Except for purposes permitted by the Copyright Act 1968, no part may be produced by any means without the prior permission of the department.
© The State Government of Queensland (Department of Transport and Main Roads)
creativecommons.org/licenses/by/2.5/au This work is licenced under the Creative Commons Attribution 2.5 Australia Licence To attribute this material, cite State of Queensland (Department of Transport and Main Roads) (2011) Queensland Cycle Strategy 2011–2021
ISBN - 978-1-920719-16-6
Queensland Cycle Strategy 2011–2021 3

Table of contents
4 Queensland Cycle Strategy 2011–2021
Table of contentsExecutive summary 5
Part A – Setting the scene 13
About the Queensland Cycle Strategy 14Achievements since 2003 14
Cycling infrastructure 14Cycling culture 15Planning for improved cycling infrastructure 15Providing technical guidance and support 15Cycling research 15
Cycling in Queensland today 18Why do people cycle? 18Encouraging more cycling 19Cycling for the commute to work 21Boosting cycling through infrastructure improvements 20
Growing cycling in Queensland 21Vision 21Policy linkages and opportunities 21Targets 21Priority areas 22
Part B – Priorities for action 23
Priority area oneBuilding safe, direct and connected cycle networks 24
1.1 Building connected cycle networks 251.2 Developing cycle network plans 281.3 Making cycling a part of all government transport infrastructure projects 29
Signature project oneConnected networks for cities and towns across Queensland 31
Priority area twoGrowing a cycling culture 48
2.1 Supporting travel behaviour change to boost cycling 492.2 Encouraging active school travel 512.3 Providing information and wayfinding 522.4 Promoting cycling and community education 532.5 Supporting cycling events 552.6 Engaging cycling change champions 562.7 Ensuring road rules and legislative frameworks support cycling 58
Signature project twoBicycle education 59
Priority area threeCreating cycle-friendly communities 60
3.1 Integrating cycling into planning and development 613.2 Including end-of-trip facilities in development 643.3 Delivering a safe cycle network 66
Signature project threeActive towns 67
Priority area fourDeveloping a cycling economy 68
4.1 Supporting cycle tourism 704.2 Supporting the bicycle industry 724.3 Supporting recreation and sports cycling 73
Signature project fourRecreation trails 74
Part C – Implementation 77
Implementing the strategy 785.1 A coordinated approach 785.2 Funding the strategy 795.3 Performance indicators and strategy monitoring 79
Glossary 82
References 83
Executive summary
Queensland Cycle Strategy 2011–2021 5
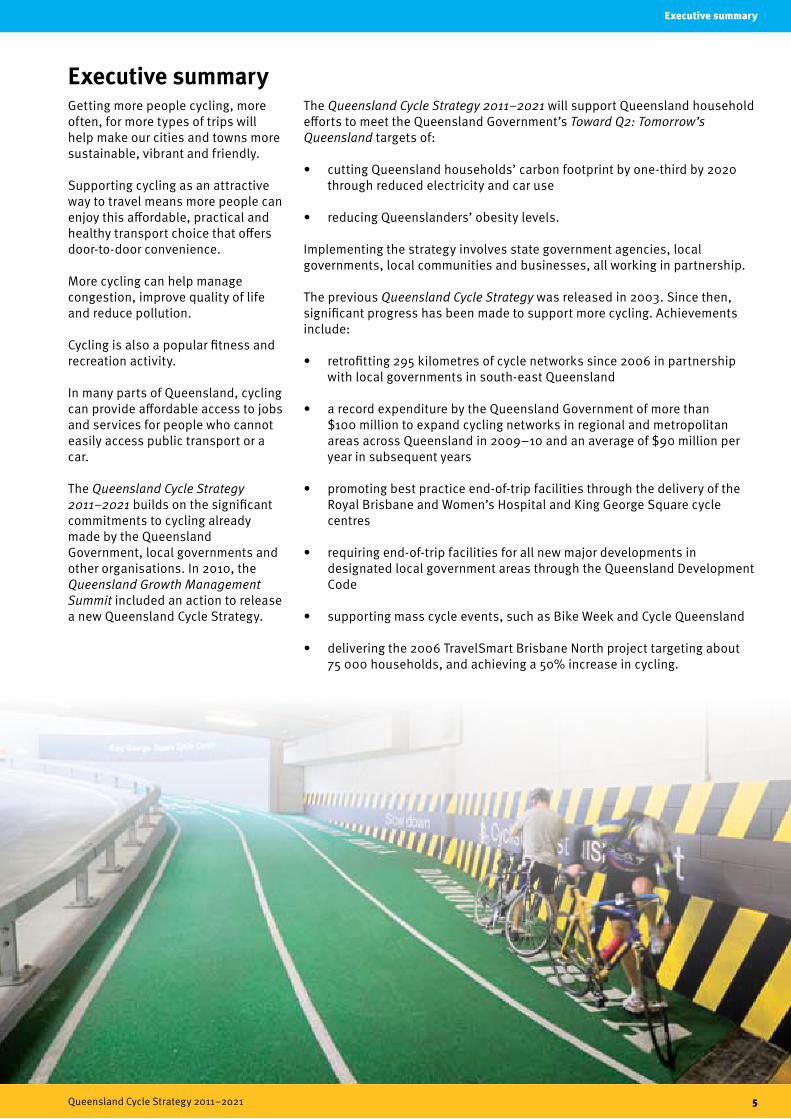
Executive summaryGetting more people cycling, more often, for more types of trips will help make our cities and towns more sustainable, vibrant and friendly.
Supporting cycling as an attractive way to travel means more people can enjoy this affordable, practical and healthy transport choice that offers door-to-door convenience.
More cycling can help manage congestion, improve quality of life and reduce pollution.
Cycling is also a popular fitness and recreation activity.
In many parts of Queensland, cycling can provide affordable access to jobs and services for people who cannot easily access public transport or a car.
The Queensland Cycle Strategy 2011–2021 builds on the significant commitments to cycling already made by the Queensland Government, local governments and other organisations. In 2010, the Queensland Growth Management Summit included an action to release a new Queensland Cycle Strategy.
The Queensland Cycle Strategy 2011–2021 will support Queensland household efforts to meet the Queensland Government’s Toward Q2: Tomorrow’s Queensland targets of:
• cutting Queensland households’ carbon footprint by one-third by 2020 through reduced electricity and car use
• reducing Queenslanders’ obesity levels.
Implementing the strategy involves state government agencies, local governments, local communities and businesses, all working in partnership.
The previous Queensland Cycle Strategy was released in 2003. Since then, significant progress has been made to support more cycling. Achievements include:
• retrofitting 295 kilometres of cycle networks since 2006 in partnership with local governments in south-east Queensland
• a record expenditure by the Queensland Government of more than $100 million to expand cycling networks in regional and metropolitan areas across Queensland in 2009–10 and an average of $90 million per year in subsequent years
• promoting best practice end-of-trip facilities through the delivery of the Royal Brisbane and Women’s Hospital and King George Square cycle centres
• requiring end-of-trip facilities for all new major developments in designated local government areas through the Queensland Development Code
• supporting mass cycle events, such as Bike Week and Cycle Queensland
• delivering the 2006 TravelSmart Brisbane North project targeting about 75 000 households, and achieving a 50% increase in cycling.

Executive summary
6 Queensland Cycle Strategy 2011–2021
Our vision TargetsOur vision for cycling in Queensland is:
Achieving this vision would mean:
• Queenslanders of all ages and abilities can make the choice to cycle for transport, recreation, fitness and health
• residents in Queensland cities and towns can ride on safe, direct cycle routes with secure bicycle parking at their destination
• school and university students have safe and direct cycling routes, with secure bicycle parking
• cycling is supported by all levels of government and the community.
Cycling facts
• In 2011, it is estimated that 814 000 people ride a bike in Queensland each week (18% of residents).
• In 2011, it is estimated that close to 60% of Queensland households have access to a bicycle.
• In 2010, Australians bought more than 1.3 million new bicycles, compared to one million cars, making it the eleventh year in a row that bicycle sales outstripped car sales.
• In 2009, more than 364 000 Queenslanders rode a bike for recreation, exercise or sport – an 11% increase from the previous two years.
The Queensland Cycle Strategy 2011–2021 target is to get more people to cycle, more often for school, work, recreation, shopping and social trips.
Currently there is no state-wide data available that tracks how often people cycle for all types of trips.
Until this is available, progress on the strategy will be tracked through a target to double cycling’s share of commute trips to work by 2021, and tripling these trips by 2031.
With population growth, doubling the commute trips by bicycle by 2021 represents a 180% increase.
The strategy will monitor the percentage of females cycling to work. Internationally, the proportion of female riders is recognised as an indicator of the ‘friendliness’ of cycling environments. In 2006, only 19% of cycling journeys to work were made by females.
0
10000
20000
30000
40000
50000
60000
2006 2021
1.4%21 000 commute cycle trips per day
2.8%56 000 commute cycle trips per day
Cycling commute to work targets
How can cycling benefit you?Improved health and fitnessCycling is a great way to improve your cardiovascular fitness, tone the body and shed some unwanted kilos.
Save timeGet the recommended physical activity of at least 30 minutes on most days of the week, by combining exercise with your cycling trip.
Save moneyOnce you have your bike and accessories, cycling is basically free. That means you do not have to pay for fuel, parking, registration or insurance. This can save thousands of dollars each year.
Environmentally friendlyRelying on ‘pedal power’, cycling produces no emissions and has minimal impacts on the environment.
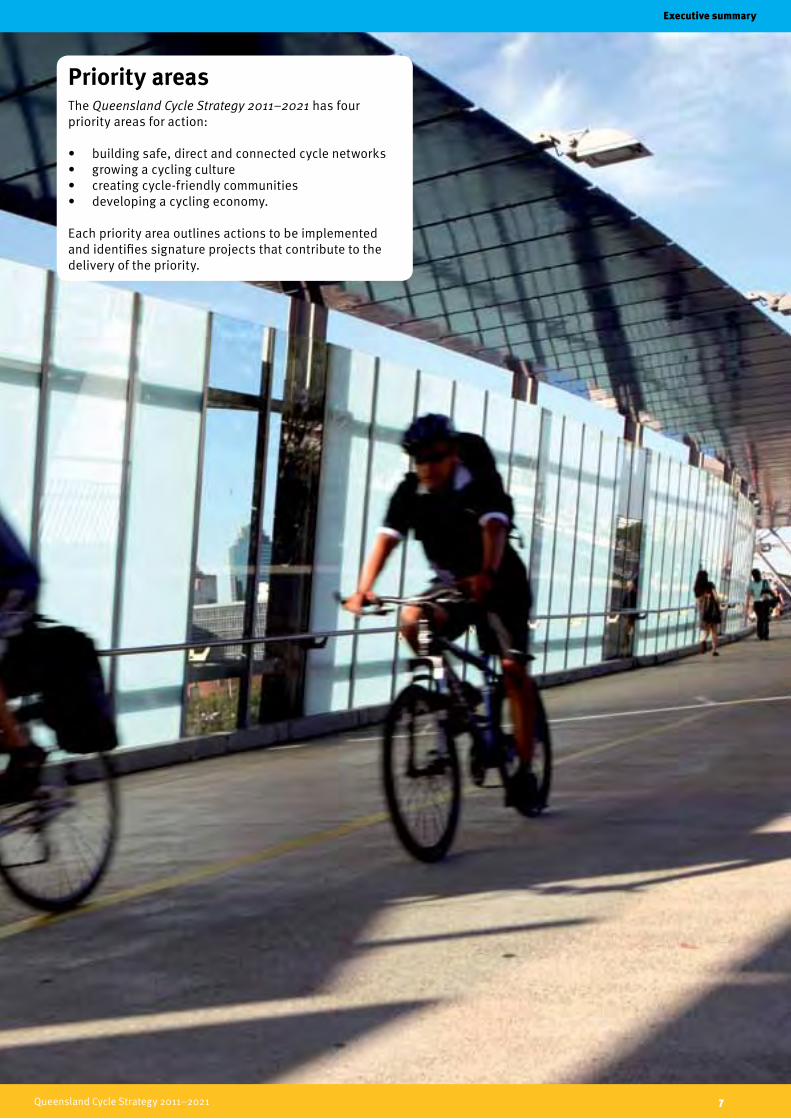
Priority areasThe Queensland Cycle Strategy 2011–2021 has four priority areas for action:
• building safe, direct and connected cycle networks• growing a cycling culture• creating cycle-friendly communities• developing a cycling economy.
Each priority area outlines actions to be implemented and identifies signature projects that contribute to the delivery of the priority.
Queensland Cycle Strategy 2011–2021 7
Executive summary

Executive summary
8 Queensland Cycle Strategy 2011–2021
Priority area one – building safe, direct and connected cycle networks
Principal Cycle Network Plans will be prepared for regions across the state to identify important cycle connections for progressive delivery of connected networks.
The Queensland Government has adopted a Cycling Infrastructure Policy to make sure cycling is incorporated into all government transport infrastructure projects.
The policy will result in provision for cycling in transport infrastructure projects (roads, public transport and other), upgrades and maintenance on the principal cycle network.
Delivering a connected network will also make it safer to cycle. New types of cycle facilities will be trialled that provide better separation of cyclists and motor vehicles.
People consistently report they would walk and cycle more if there were safer facilities, with 91% of cyclists reporting they feel safe when cycling on off-road paths.
Enhanced safety will be supported with targeted reductions in speed limits, along with a program to address locations where cycle crashes are an issue.
The signature project for this priority is to roll out connected networks across Queensland cities and towns with populations of more than 20 000 residents (see box below).
Delivery of infrastructure will be guided by Principal Cycle Network Plans (where they are available), with priority given to projects that fit into one of the following categories:
Strategic cycle network – links to connect centres and key attractors. Some of these routes may be protected cycleways or veloways
Complete 5 – completing the principal cycle network within five kilometres of key centres to deliver a connected cycle network
Educated Ways – ensuring safe and connected routes are provided to major schools, universities and TAFEs, focusing on a three kilometre catchment around schools
Connect To – putting cycle links in place to key public transport stations and stops (up to five kilometres), supported by bicycle parking and end-of-trip facilities.
Signature project oneConnected networks for cities and towns across QueenslandSP 1.1 Develop a delivery program in partnership with local government for strategic cycle networks, Complete 5, Educated Ways and Connect To, updated annually as part of the Queensland Transport and Roads Investment Program.
SP 1.2 Focus criteria for existing and new cycling infrastructure-related funding programs on delivering strategic cycle network routes, Complete 5, Educated Ways and Connect To. Coordinate and streamline the application processes across the various funding sources.
Strategic cycle network, Complete 5, Connect To and Educated Ways
Did you know?
Cycling five kilometres to and from work each day instead of driving would save about 720 kilograms of greenhouse gas
emissions per year.
Executive summary
Queensland Cycle Strategy 2011–2021 9
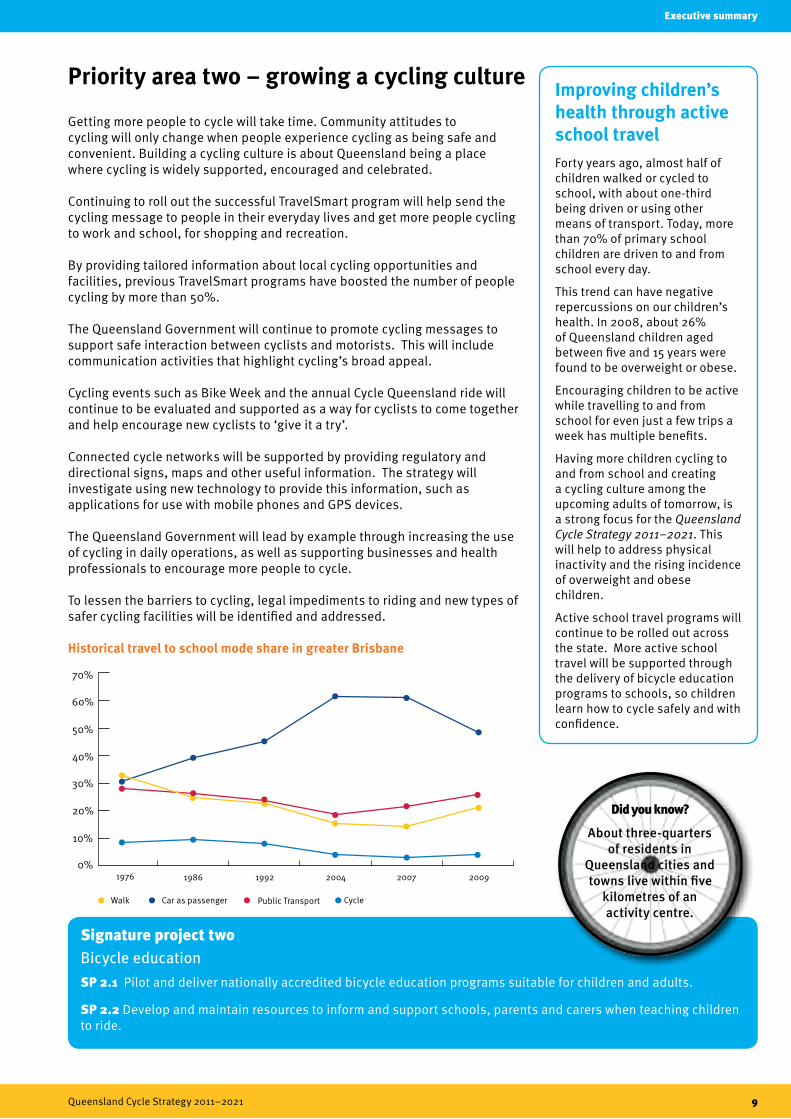
Priority area two – growing a cycling culture Improving children’s health through active school travelForty years ago, almost half of children walked or cycled to school, with about one-third being driven or using other means of transport. Today, more than 70% of primary school children are driven to and from school every day.
This trend can have negative repercussions on our children’s health. In 2008, about 26% of Queensland children aged between five and 15 years were found to be overweight or obese.
Encouraging children to be active while travelling to and from school for even just a few trips a week has multiple benefits.
Having more children cycling to and from school and creating a cycling culture among the upcoming adults of tomorrow, is a strong focus for the Queensland Cycle Strategy 2011–2021. This will help to address physical inactivity and the rising incidence of overweight and obese children.
Active school travel programs will continue to be rolled out across the state. More active school travel will be supported through the delivery of bicycle education programs to schools, so children learn how to cycle safely and with confidence.
Getting more people to cycle will take time. Community attitudes to cycling will only change when people experience cycling as being safe and convenient. Building a cycling culture is about Queensland being a place where cycling is widely supported, encouraged and celebrated.
Continuing to roll out the successful TravelSmart program will help send the cycling message to people in their everyday lives and get more people cycling to work and school, for shopping and recreation.
By providing tailored information about local cycling opportunities and facilities, previous TravelSmart programs have boosted the number of people cycling by more than 50%.
The Queensland Government will continue to promote cycling messages to support safe interaction between cyclists and motorists. This will include communication activities that highlight cycling’s broad appeal.
Cycling events such as Bike Week and the annual Cycle Queensland ride will continue to be evaluated and supported as a way for cyclists to come together and help encourage new cyclists to ‘give it a try’.
Connected cycle networks will be supported by providing regulatory and directional signs, maps and other useful information. The strategy will investigate using new technology to provide this information, such as applications for use with mobile phones and GPS devices.
The Queensland Government will lead by example through increasing the use of cycling in daily operations, as well as supporting businesses and health professionals to encourage more people to cycle.
To lessen the barriers to cycling, legal impediments to riding and new types of safer cycling facilities will be identified and addressed.
Historical travel to school mode share in greater Brisbane
Signature project twoBicycle educationSP 2.1 Pilot and deliver nationally accredited bicycle education programs suitable for children and adults.
SP 2.2 Develop and maintain resources to inform and support schools, parents and carers when teaching children to ride.
1976 1986 1992 2004 2007 2009
Walk Car as passenger Public Transport Cycle
0%
10%
20%
30%
40%
50%
60%
70%
Did you know?
About three-quarters of residents in
Queensland cities and towns live within five
kilometres of an activity centre.
Executive summary
10 Queensland Cycle Strategy 2011–2021
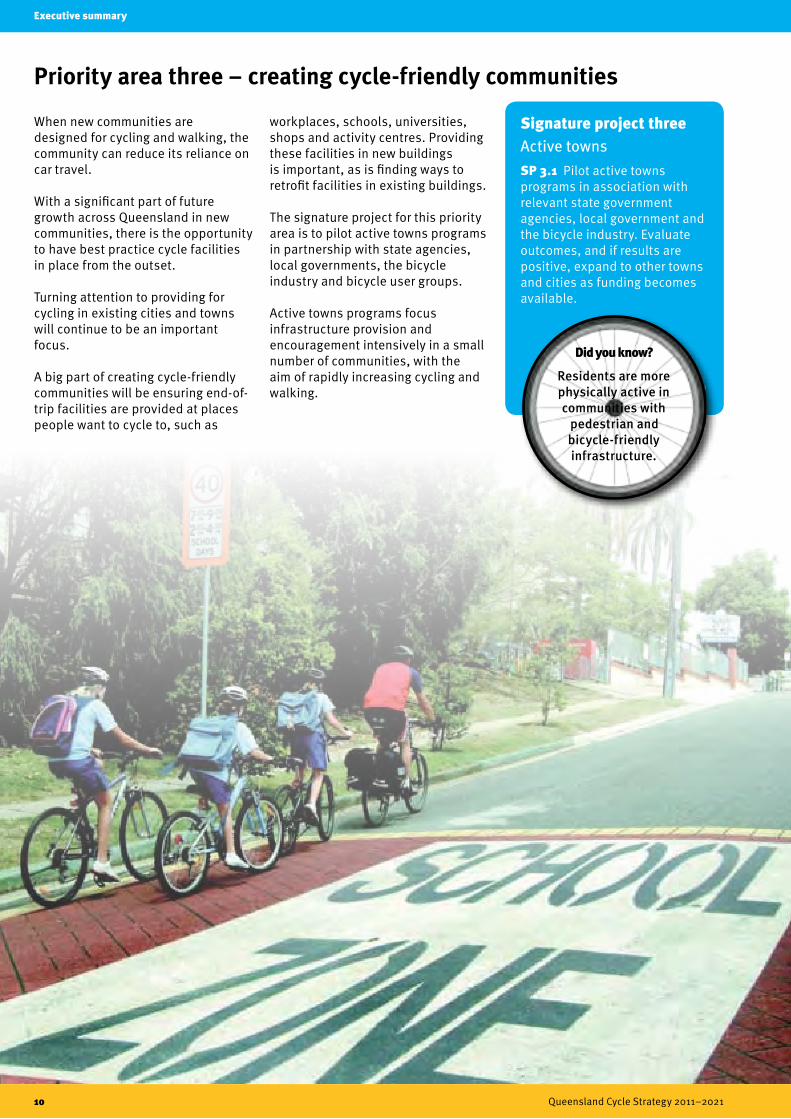
Priority area three – creating cycle-friendly communities
When new communities are designed for cycling and walking, the community can reduce its reliance on car travel.
With a significant part of future growth across Queensland in new communities, there is the opportunity to have best practice cycle facilities in place from the outset.
Turning attention to providing for cycling in existing cities and towns will continue to be an important focus.
A big part of creating cycle-friendly communities will be ensuring end-of-trip facilities are provided at places people want to cycle to, such as
Signature project threeActive townsSP 3.1 Pilot active towns programs in association with relevant state government agencies, local government and the bicycle industry. Evaluate outcomes, and if results are positive, expand to other towns and cities as funding becomes available.
Did you know?
Residents are more physically active in communities with
pedestrian and bicycle-friendly infrastructure.
workplaces, schools, universities, shops and activity centres. Providing these facilities in new buildings is important, as is finding ways to retrofit facilities in existing buildings.
The signature project for this priority area is to pilot active towns programs in partnership with state agencies, local governments, the bicycle industry and bicycle user groups.
Active towns programs focus infrastructure provision and encouragement intensively in a small number of communities, with the aim of rapidly increasing cycling and walking.
Executive summary
Queensland Cycle Strategy 2011–2021 11
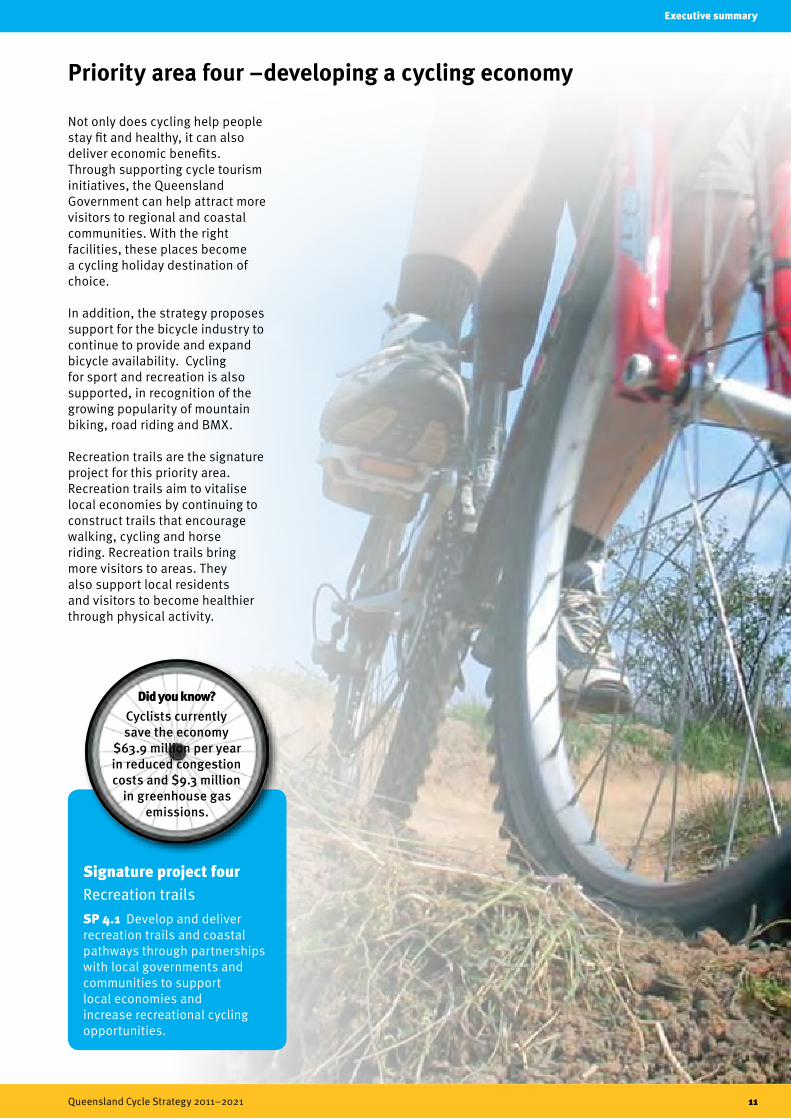
Priority area four –developing a cycling economy
Signature project fourRecreation trailsSP 4.1 Develop and deliver recreation trails and coastal pathways through partnerships with local governments and communities to support local economies and increase recreational cycling opportunities.
Did you know?
Cyclists currently save the economy
$63.9 million per year in reduced congestion costs and $9.3 million
in greenhouse gas emissions.
Not only does cycling help people stay fit and healthy, it can also deliver economic benefits. Through supporting cycle tourism initiatives, the Queensland Government can help attract more visitors to regional and coastal communities. With the right facilities, these places become a cycling holiday destination of choice.
In addition, the strategy proposes support for the bicycle industry to continue to provide and expand bicycle availability. Cycling for sport and recreation is also supported, in recognition of the growing popularity of mountain biking, road riding and BMX.
Recreation trails are the signature project for this priority area. Recreation trails aim to vitalise local economies by continuing to construct trails that encourage walking, cycling and horse riding. Recreation trails bring more visitors to areas. They also support local residents and visitors to become healthier through physical activity.
Executive summary
12 Queensland Cycle Strategy 2011–2021
Implementing the strategy
The Queensland Cycle Strategy 2011–2021 is a whole-of-government strategy. It has been developed collaboratively by state and local governments in consultation with the cycling industry and bicycle user groups.
Because so many diverse groups are involved in achieving cycling outcomes, a coordinated approach to strategy implementation is essential. This includes regular progress reporting through an annual report card, and the development of detailed performance indicators to measure the success of all priority areas in the strategy.
The strategy aims to implement additional funding programs, as well as focus existing funding programs to ensure the strategy’s vision and targets are achieved.
Part A
Setting the scene
Queensland Cycle Strategy 2011–2021 13
Part A – Setting the scene
Queensland Cycle Strategy 2011–2021 13
14 Queensland Cycle Strategy 2011–2021
Part A – Setting the scene
About the Queensland Cycle StrategyGetting people cycling more often for more types of trips will make our cities and towns more sustainable, vibrant and friendly.
Supporting cycling as an attractive way to travel means more people can enjoy this affordable, practical and healthy transport choice that offers door-to-door convenience.
More cycling can help manage congestion, improve quality of life and reduce pollution. In many parts of Queensland, cycling can provide affordable access to jobs and services for people who cannot easily access public transport or a car.
Cycling is also a popular fitness and recreational activity.
The Queensland Cycle Strategy 2011–2021 builds on the significant Queensland Government commitments to cycling that are already in place. In 2010, the Queensland Growth Management Summit included an action to release a new Queensland Cycle Strategy.
The strategy will support the achievement of objectives in the government’s state-wide plan Toward Q2: Tomorrow’s Queensland that focuses on:
• making Queensland greener by reducing car use
• making Queenslanders healthier by reducing obesity.
The strategy will also help reduce greenhouse gas emissions from other forms of transport, supporting Climate Q: toward a greener Queensland.
Implementing this strategy involves state government agencies, local governments, local communities and businesses working in partnership.
As a whole-of-government strategy, funding and resources for implementation of the strategy are the responsibility of a range of agencies and are linked with multiple government strategies at local, state and national levels. It is anticipated that state agencies, local governments and other strategy partners will continue to incorporate cycling initiatives within existing policy and program priorities, and will seek additional funding for specific projects as required.
Achievements since 2003
Significant progress has been made since the previous Queensland Cycle Strategy was released in 2003. Parts of the state are showing that investment in safe, direct and connected cycling facilities, combined with promotion, gets more people cycling.
The new Queensland Cycle Strategy 2011–2021 will build on these investments and achievements. Some of the key achievements delivered since the release of the previous strategy are detailed below.
Cycling infrastructure
Ensuring connected networks are in place is a critical factor to achieving more cycling. Recent infrastructure improvements include:
• delivering new cycling facilities across Queensland since 2006, by building cycling facilities as part of state road projects
• retrofitting 295 kilometres of cycle network since 2006 in partnership with local governments in south-east Queensland
• providing $40 million over 15 years to support road, BMX, mountain bike and elite cycling infrastructure, through the Sport and Recreation Infrastructure Program
• setting the standard for new types of end-of-trip facilities, through the delivery of the Royal Brisbane and Women’s Hospital and King George Square cycle centres
• requiring end-of-trip facilities to include secure bike racks, lockers and change rooms where cyclists, joggers and walkers can shower, change and secure their belongings
• providing $44 million in funding over the last 10 years for the delivery of safe cycling and pedestrian
Queensland Cycle Strategy 2011–2021 15
Part A – Setting the scene
About the Queensland Cycle Strategyinfrastructure around schools, through the Transport Infrastructure Development Scheme
• completing 100 kilometres of the Brisbane Valley rail trail through local, state and federal government and community collaboration
• implementing green bicycle lanes across Cairns to improve safety at problem crash locations.
Local governments across Queensland are also delivering infrastructure for cycling and walking.
Cycling culture
A cycling culture is growing in Queensland, supported by events, behaviour change programs and information, such as:
• Bike Week, the nine-day Cycle Queensland ride, Gold Coast Cycle Challenge, Ride to Work and Ride to School
• delivering the TravelSmart Communities program – the Brisbane North project involved about 75 000 households and achieved a 50% increase in cycling trips
• working in partnership with local government to deliver TravelSmart Schools projects – the Noosa program achieved a 25% increase in cycling to school and cycle skills training was provided to 1100 year four students
• Share the Road campaign to encourage motorists to drive safely around cyclists and cyclists to obey the road rules
• 70% of local governments actively promoting walking and 50% actively promoting cycling through a range of activities
• publishing local government cycling and TravelSmart maps.
Planning for improved cycling infrastructure
Bicycle network planning is supported by:
• including a Desired Regional Outcome of Integrated Transport in the South East Queensland Regional Plan which incorporates policies to promote public transport use, walking and cycling
• developing Principal Cycle Network Plans for south-east Queensland and far north Queensland
• including cycling infrastructure in the Queensland Transport and Roads Investment Program which provides for the coordinated delivery of transport infrastructure across Queensland including integrated transport networks that support active transport
• supporting local governments to update their cycle network plans as part of Cycle Network Program funding and Sport and Recreation Services Local Sport and Recreation Program
• publishing the Active and Healthy Communities guidelines for local governments to create supportive environments for physical activity and healthy eating
• installing counters to collect cyclist and pedestrian numbers across the cycle network in south-east Queensland.
Providing technical guidance and support
Quality cycling facilities are supported through:
• developing cycle notes and other technical guidance that assist state and local government planners and engineers to deliver best practice cycle facilities tailored to local requirements
• publishing A Guide to Signing Cycle Networks and accompanying cycle note Producing Bicycle Network Maps and Cycling Transport Access Guides to support the provision of consistent and legible directional and information signage for cycle networks across the state
• providing training to over 300 designers and engineers over three years through the Designing for Pedestrians and Cyclists course.
Cycling research
Research efforts that support cycling include:
• working with the Queensland University of Technology on a cyclist visibility study. The study found that using lighting and reflective clothing on moving parts of the body while cycling can significantly improve visibility of cyclists to motorists1
• investigating the effect of road lane width on cyclist safety in urban areas2
• funding a Griffith University study to examine the barriers to cycling, particularly how neighbourhood design influences cycling participation
• collecting and analysing cyclist and pedestrian traffic data.
1 Wood, J., Lasherex, P., Marszlaek, R. and King, M. (2009), “Drivers’ and cyclists’ experiences of sharing the road: incidents, attitudes and perceptions of visibility”, Accident Analysis and Prevention, 41(4), 772-776.
2 Schramm, A. and Rakotonirainy, A. (2009), The effect of road lane width on cyclist safety in urban areas, Paper presented to Australasian Road Safety Research, Policing and Education Conference, 10 -13 November 2009, Sydney, New South Wales.
16 Queensland Cycle Strategy 2011–2021
Part A – Setting the scene
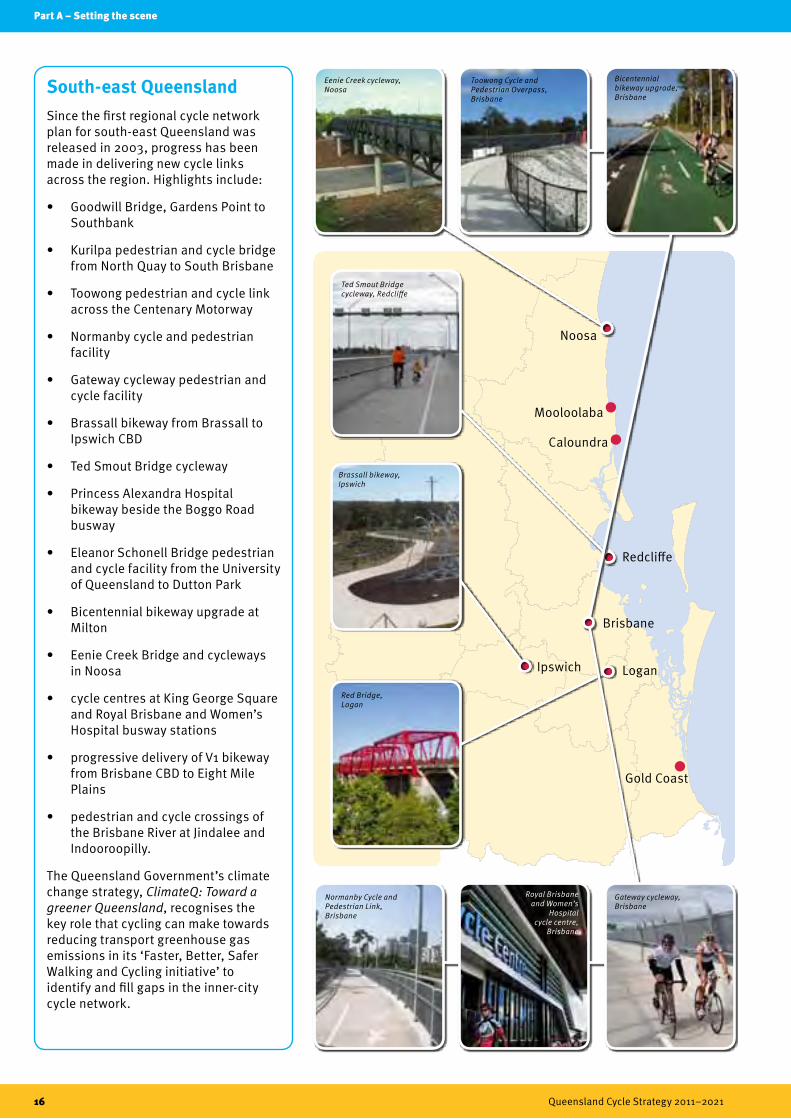
South-east QueenslandSince the first regional cycle network plan for south-east Queensland was released in 2003, progress has been made in delivering new cycle links across the region. Highlights include:
• Goodwill Bridge, Gardens Point to Southbank
• Kurilpa pedestrian and cycle bridge from North Quay to South Brisbane
• Toowong pedestrian and cycle link across the Centenary Motorway
• Normanby cycle and pedestrian facility
• Gateway cycleway pedestrian and cycle facility
• Brassall bikeway from Brassall to Ipswich CBD
• Ted Smout Bridge cycleway
• Princess Alexandra Hospital bikeway beside the Boggo Road busway
• Eleanor Schonell Bridge pedestrian and cycle facility from the University of Queensland to Dutton Park
• Bicentennial bikeway upgrade at Milton
• Eenie Creek Bridge and cycleways in Noosa
• cycle centres at King George Square and Royal Brisbane and Women’s Hospital busway stations
• progressive delivery of V1 bikeway from Brisbane CBD to Eight Mile Plains
• pedestrian and cycle crossings of the Brisbane River at Jindalee and Indooroopilly.
The Queensland Government’s climate change strategy, ClimateQ: Toward a greener Queensland, recognises the key role that cycling can make towards reducing transport greenhouse gas emissions in its ‘Faster, Better, Safer Walking and Cycling initiative’ to identify and fill gaps in the inner-city cycle network.
Bicentennial bikeway upgrade, Brisbane
Brassall bikeway, Ipswich
Red Bridge, Logan
Normanby Cycle and Pedestrian Link, Brisbane
Royal Brisbane and Women’s
Hospital cycle centre,
Brisbane
Gateway cycleway, Brisbane
Eenie Creek cycleway, Noosa
Toowong Cycle and Pedestrian Overpass, Brisbane
Ted Smout Bridge cycleway, Redcliffe
Noosa
Mooloolaba
Caloundra
Redcliffe
Brisbane
Ipswich Logan
Gold Coast

Queensland Cycle Strategy 2011–2021 17
Part A – Setting the scene
Cycling across QueenslandHighlights include:
• Cairns inner-city cycle facility from the CBD to Aeroglen, providing a high quality commuter facility and demonstrating safe implementation of cycling facilities within a rail corridor
• safety upgrades on the Captain Cook Highway near Cairns, including 1.5 metre wide shoulders for cyclists, as well as reduced speed limits, green paint and rubber kerbs at the roundabouts to separate cyclists and other vehicles
• construction of cycle lanes on Mulgrave Road in Cairns as part of the upgrade, including bicycle push buttons to activate traffic signals and a trial protected cycleway
• initiation of the ‘bike bus’ program, allowing groups of students to safely travel to school on a specified route with supervisors
• provision of cycle lanes to the University of Southern Queensland, Toowoomba
• provision of cycle lanes and bicycle traffic signal push buttons in Roma
• completion of the 21 kilometre Bluewater Trail in Mackay.
Hook turn storage box,
Cairns
Green bicycle lane treatment, Cairns
Bicycle lane, Roma
Bicycle push buttons, Roma
Bicycle lanes, Toowoomba
Shared path under Douglas Arterial, Townsville
Narrow bridge signage, Cairns
Cairns
Townsville
Mackay
BrisbaneToowoomba
Roma
Mount Isa
18 Queensland Cycle Strategy 2011–2021
Part A – Setting the scene
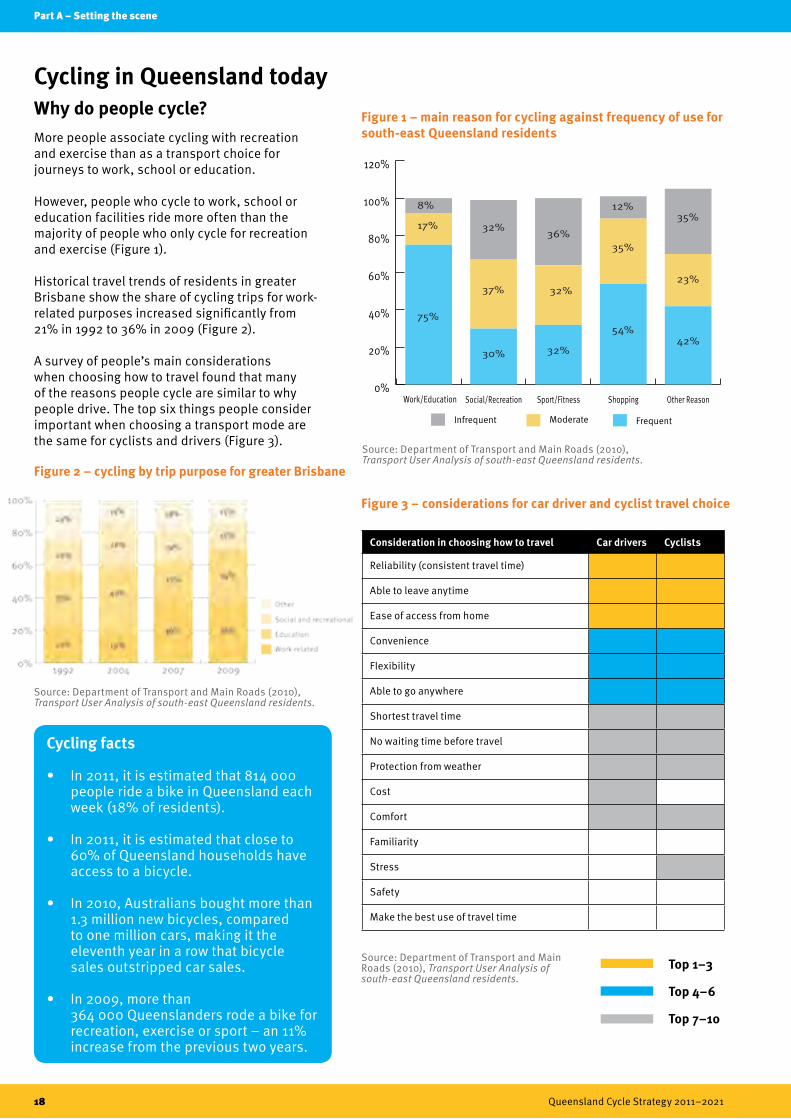
Cycling in Queensland todayWhy do people cycle?More people associate cycling with recreation and exercise than as a transport choice for journeys to work, school or education.
However, people who cycle to work, school or education facilities ride more often than the majority of people who only cycle for recreation and exercise (Figure 1).
Historical travel trends of residents in greater Brisbane show the share of cycling trips for work-related purposes increased significantly from 21% in 1992 to 36% in 2009 (Figure 2).
A survey of people’s main considerations when choosing how to travel found that many of the reasons people cycle are similar to why people drive. The top six things people consider important when choosing a transport mode are the same for cyclists and drivers (Figure 3).
Cycling facts
• In 2011, it is estimated that 814 000 people ride a bike in Queensland each week (18% of residents).
• In 2011, it is estimated that close to 60% of Queensland households have access to a bicycle.
• In 2010, Australians bought more than 1.3 million new bicycles, compared to one million cars, making it the eleventh year in a row that bicycle sales outstripped car sales.
• In 2009, more than 364 000 Queenslanders rode a bike for recreation, exercise or sport – an 11% increase from the previous two years.
Figure 2 – cycling by trip purpose for greater Brisbane
Figure 3 – considerations for car driver and cyclist travel choice
Figure 1 – main reason for cycling against frequency of use for south-east Queensland residents
Top 1–3
Top 4–6
Top 7–10
Source: Department of Transport and Main Roads (2010), Transport User Analysis of south-east Queensland residents.
Source: Department of Transport and Main Roads (2010), Transport User Analysis of south-east Queensland residents.
Source: Department of Transport and Main Roads (2010), Transport User Analysis of south-east Queensland residents.
0%
20%
40%
60%
80%
100%
120%
Frequent
Other ReasonShoppingSport/FitnessSocial/RecreationWork/Education
75%
30% 32%
54%42%
17%
37% 32%
35%
23%
35%
36%32%
12%8%
ModerateInfrequent
Consideration in choosing how to travel Car drivers Cyclists
Reliability (consistent travel time)
Able to leave anytime
Ease of access from home
Convenience
Flexibility
Able to go anywhere
Shortest travel time
No waiting time before travel
Protection from weather
Cost
Comfort
Familiarity
Stress
Safety
Make the best use of travel time
Queensland Cycle Strategy 2011–2021 19
Part A – Setting the scene
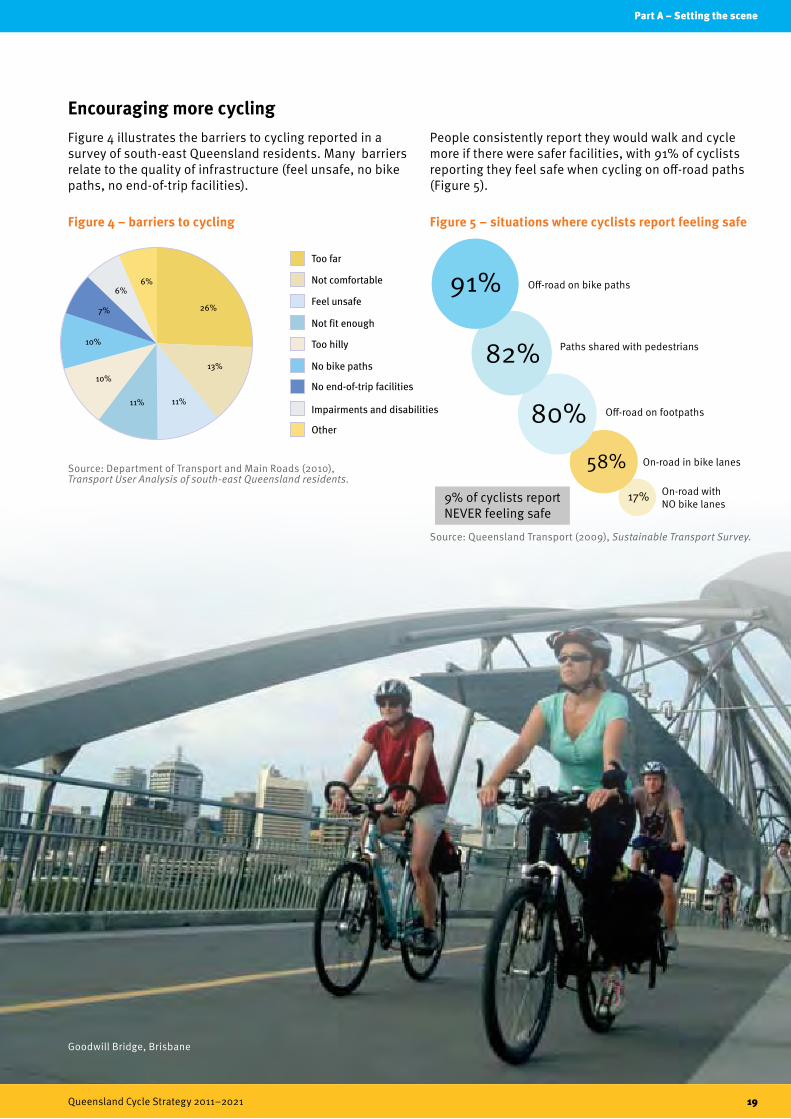
Cycling in Queensland todayEncouraging more cyclingFigure 4 illustrates the barriers to cycling reported in a survey of south-east Queensland residents. Many barriers relate to the quality of infrastructure (feel unsafe, no bike paths, no end-of-trip facilities).
91% Off-road on bike paths
82% Paths shared with pedestrians
80% Off-road on footpaths
58% On-road in bike lanes
On-road withNO bike lanes
17%9% of cyclists report NEVER feeling safe
Figure 4 – barriers to cycling Figure 5 – situations where cyclists report feeling safe
Top 1–3
Top 4–6
Top 7–10
Source: Department of Transport and Main Roads (2010), Transport User Analysis of south-east Queensland residents.
Goodwill Bridge, Brisbane
Source: Queensland Transport (2009), Sustainable Transport Survey.
People consistently report they would walk and cycle more if there were safer facilities, with 91% of cyclists reporting they feel safe when cycling on off-road paths (Figure 5).

20 Queensland Cycle Strategy 2011–2021
Part A – Setting the scene
Cycling for the commute to workData for cycling participation across Queensland is collected as part of the Australian Bureau of Statistics census which captures journey to work. The census is carried out every five years, with the most recent data from 2006.
In 2006, about 20 000 people cycled to work on an average weekday in Queensland. Despite population growth, this number has declined from about 23 000 in 1991.
On average, 1.1% of white collar workers and 1.8% of blue collar workers cycle to work each day.
There is significant variation in cycling participation rates for the commute to work across the state, with parts of Brisbane as low as 0.5% and parts of Cairns at 10%.
Cycling participation rates for the commute to work have declined across all the major towns and cities since 1996, with the exception of inner Brisbane (Figure 6). This increase is related to the provision of cycling infrastructure that delivered safe, direct and connected routes.
Boosting cycling through infrastructure improvementsThere has been significant investment in cycling infrastructure to provide direct, off-road connections to Brisbane’s CBD (particularly from the south and west).
Investment has seen increased levels of cycling participation in suburbs surrounding these quality facilities.
Between 1986 and 2006, the share of cycling trips to work in the CBD increased from 0.5% to 3% for suburbs within 12 kilometres of the city (Figure 7) – a five-fold increase.
Cycling increases were higher in southern and western suburbs, highlighting the positive influence of dedicated cycle facilities in attracting more people to cycling.
75kms of major cycle infrastructure
O� road cycling infrastructure
Cycle mode share (%)
7 to 10 5 to 7 3 to 5 2 to 3 1 to 2 0 to 1
2006
Carindale
Balmoral
Kedron
Everton Park
The Gap Kelvin Grove
Auchen�owerWoolloongabba
BrisbaneCity
St Lucia
Graceville
JindaleeMount Gravatt
Between 2001 and 2006, cycle trips to work in the south and west increased from 3.1% to 3.7%, as people could more easily access the CBD from suburbs south of the river with the opening of the Goodwill Bridge. By comparison, Brisbane’s northside mode share only increased from 1.9% to 2.2%.
In 2006, inner Brisbane suburbs such as West End and Woolloongabba experienced more than 7% of journeys to work by bicycle.
Figure 7 – change in cycling mode share around key infrastructure in inner Brisbane
Figure 6 –commute to work cycling mode share (by local government area)
Cairns 3.2
2.9
1.7
1.7
1.5
2.0 1.4
Townsville
Gladstone
Mackay
Rockhampton
Maryborough
Gympie 0.8
Toowoomba
Ipswich
Brisbane
Logan
Gold Coast
1.5 0.4
1.2
1.3 0.5
Positive
Decline 0 to 0.5
Mode share change (1996–2006)
Decline 0.5 to 1.0
Decline over 1.0
see inset
Bundaberg
75kms of major cycle infrastructure
O� road cycling infrastructure
Cycle mode share (%)
7 to 10 5 to 7 3 to 5 2 to 3 1 to 2 0 to 1
2006
Carindale
Balmoral
Kedron
Everton Park
The Gap Kelvin Grove
Auchen�owerWoolloongabba
BrisbaneCity
St Lucia
Graceville
JindaleeMount Gravatt
1986 2006
Queensland Cycle Strategy 2011–2021 21
Part A – Setting the scene
Growing cycling in QueenslandVisionOur vision for cycling in Queensland is:
Achieving this vision would mean:
• Queenslanders of all ages and abilities can make the choice to cycle for transport, recreation, fitness and health
• residents in Queensland cities and towns can ride on safe, direct cycle routes with secure bicycle parking at their destination
• school and university students have safe and direct cycling routes, with secure bicycle parking
• cycling is supported by all levels of government and the community.
Policy linkages and opportunitiesIncorporating a health benefit into daily travelCycling is a convenient, safe and attractive option for many trips, encouraging more people to make active travel choices as part of daily travel. This will contribute to the Toward Q2 target to cut obesity by one-third across Queensland.
Providing an affordable and convenient travel choiceMany Queenslanders can easily access goods, services, facilities and jobs by safe, direct cycle connections.
Protecting the environment and transitioning to a low carbon futureGreenhouse gases and other environmental emissions are reduced by increasing levels of cycling. This supports the Toward Q2 target to cut Queenslanders’ carbon footprint by one-third through reducing car and electricity use.
Managing congestionBy encouraging people to replace some car trips with cycling, congestion can be better managed.
Making transport more resilient to oil shortagesBy establishing cycling as an attractive travel choice, the vulnerability to reduced oil supply and rising oil prices can be minimised.
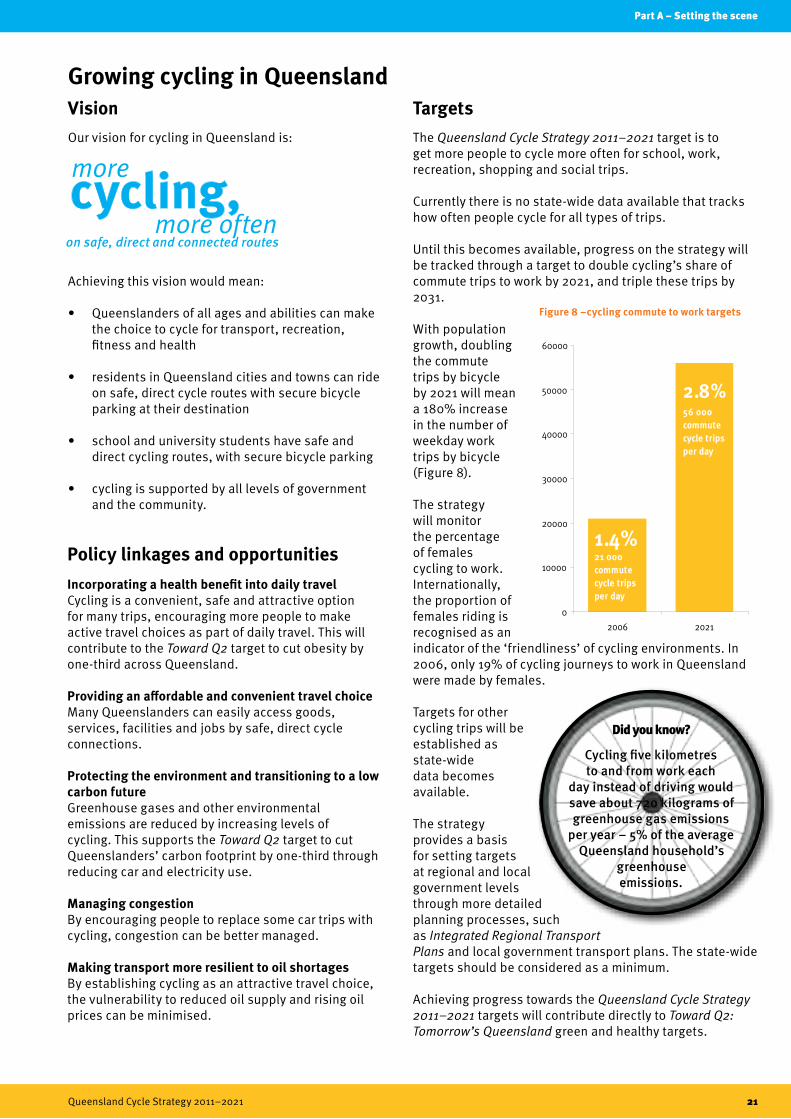
TargetsThe Queensland Cycle Strategy 2011–2021 target is to get more people to cycle more often for school, work, recreation, shopping and social trips.
Currently there is no state-wide data available that tracks how often people cycle for all types of trips.
Until this becomes available, progress on the strategy will be tracked through a target to double cycling’s share of commute trips to work by 2021, and triple these trips by 2031.
With population growth, doubling the commute trips by bicycle by 2021 will mean a 180% increase in the number of weekday work trips by bicycle (Figure 8).
The strategy will monitor the percentage of females cycling to work. Internationally, the proportion of females riding is recognised as an indicator of the ‘friendliness’ of cycling environments. In 2006, only 19% of cycling journeys to work in Queensland were made by females.
Targets for other cycling trips will be established as state-wide data becomes available.
The strategy provides a basis for setting targets at regional and local government levels through more detailed planning processes, such as Integrated Regional Transport Plans and local government transport plans. The state-wide targets should be considered as a minimum.
Achieving progress towards the Queensland Cycle Strategy 2011–2021 targets will contribute directly to Toward Q2: Tomorrow’s Queensland green and healthy targets.
Did you know?
Cycling five kilometres to and from work each
day instead of driving would save about 720 kilograms of greenhouse gas emissions
per year – 5% of the average Queensland household’s
greenhouse emissions.
0
10000
20000
30000
40000
50000
60000
2006 2021
1.4%21 000 commute cycle trips per day
2.8%56 000 commute cycle trips per day
Figure 8 –cycling commute to work targets

22 Queensland Cycle Strategy 2011–2021
Part A – Setting the scene
Priority areasThe Queensland Cycle Strategy 2011–2021 has four priority areas for action. The strategy sets out a signature project for each priority. These signature projects will focus implementation to achieve the vision of ‘more cycling, more often’.
Each priority area is also supported by a set of actions designed to help achieve the strategy vision and targets. These actions have short, medium or long-term timeframes for implementation, or are existing and will be continued.
1 Building safe, direct and connected cycle networks
2 Growing a cycling culture
4 Developing a cycling economy
Safe, direct and connected cycle networks will provide facilities to support the many trips for which the bicycle is a viable, convenient and enjoyable transport choice. This includes:• building connected cycle networks• developing cycle network plans• making cycling a part of all government
infrastructure projects.
Signature project one – Connected networks for cities and towns across QueenslandSP 1.1 Develop a delivery program in partnership with local government for strategic cycle networks, Complete 5, Educated Ways and Connect To, updated annually as part of the Queensland Transport and Roads Investment Program. SP 1.2 Focus criteria for existing and new cycling infrastructure-related funding programs on delivering strategic cycle network routes, Complete 5, Educated Ways and Connect To. Coordinate and streamline the application processes across the various funding sources.
A cycling culture is about Queensland being a place where cycling is widely supported, encouraged and celebrated. This includes:• supporting travel behaviour change to boost cycling• encouraging active school travel• providing information and wayfinding • promoting cycling and community education • supporting cycling events • engaging cycling change champions• ensuring road rules and legislative frameworks
support cycling.
Signature project two – bicycle educationSP 2.1 Pilot and deliver nationally-accredited bicycle education programs suitable for children and adults. SP 2.2 Develop and maintain resources to inform and support schools, parents and carers when teaching children to ride.
When communities and suburbs are designed to be ‘cycleable’ and ‘walkable’, the community as a whole can reduce its reliance on car travel. This includes:• integrating cycling into planning and development• including end-of-trip facilities in developments• delivering a safe cycle network.
Signature project three – active townsActive towns focus infrastructure provision and encouragement intensively in a small number of communities with the aim of rapidly increasing cycling and walking.SP 3.1 Pilot active town programs in association with relevant state government agencies, local government and the bicycle industry. Evaluate outcomes and, if results are positive, expand to other towns and cities as funding becomes available.
Developing a cycling economy is about inviting community and business to partner with government to take advantage of the value-adding benefits of cycling, it is also about supporting all forms of cycling including outdoor recreation and sport. This includes:• supporting cycle tourism • supporting the bicycle industry• supporting recreation and sports cycling.
Signature project four – recreation trails Recreation trails for walking, cycling and horse riding can vitalise local economies and have health benefits. SP 4.1 Develop and deliver recreation trails and coastal pathways through partnerships with local governments and communities to support local economies and increase recreational cycling opportunities.
3 Creating cycle-friendly communities
Part B
Priorities for action
Queensland Cycle Strategy 2011–2021 23
Part B – Priorities for action
Part B – Priorities for action
24 Queensland Cycle Strategy 2011–2021
Priority area one
Building safe, direct and connected
cycle networks
Roma Street Parklands, Brisbane

Part B – Priorities for action
Queensland Cycle Strategy 2011–2021 25
Most trips in Queensland, even short ones, are made by car.
Cycling offers many advantages over driving, such as avoiding congestion and car parking costs.
At a comfortable cycling speed of 15 kilometres per hour, a trip of five kilometres becomes an easy 20 minute bicycle ride for most people.
Having safe and attractive bicycle routes to the places people need to go is the key to making cycling a desirable choice.
Where there is no public transport service, walking and cycling are often the only transport options available when people do not have access to a car. By making it easy to cycle, greater opportunities will be provided for people without a car (or who choose not to use their car) to access jobs, education, shopping and recreation.
The strategy will focus on providing facilities to activity centres, school and universities to support as many cycling trips as possible.
Activity centres are areas of employment, residential and/or retail activity. Larger cities can have several activity centres.
In Queensland, cycling on footpaths is permitted.
This expands the off-road cycle network, making it more attractive for existing cyclists, and is important in supporting new cyclists who are not comfortable cycling on busy roads.
Ensuring footpaths are cycle-friendly and wide enough to share with pedestrians, where possible, can support an expanded off-road network and help achieve ‘more cycling, more often’.
The action tables in the following section include an implementation priority. The intended timeframes are:
• Short: 2011 – 2013
• Medium: 2014 – 2017
• Long: 2018 – 2021
• Existing: current action.
1.1 Building connected cycle networks
The Queensland Government will give priority to developing a connected network of safe active transport routes, with a focus on:
• improving active transport links to and between activity centres, tertiary education institutions and schools
• integrating cycling and walking with public transport.
Levels of cycling are directly related to the quality of cycling infrastructure.
Communities with safe, direct and connected cycling routes demonstrate higher levels of cycling.
Cycling needs safe and attractive space in the transport system to function.
The principles for providing cycling infrastructure include:
• providing clearly defined operating space for cyclists through on and off-road cycling facilities
• ensuring the cycle network provides a high degree of connectivity and direct routes.
Delivering a connected network across the state means significant investment. It will take time to put all the links in place to provide continuous, direct cycling connections.
To prioritise delivery of a connected cycle network, the Queensland Cycle Strategy 2011–2021 has a signature project – ‘Connected networks for cities and towns’.
This signature project will focus on delivering cycling networks for cities and towns with a population of more than 20 000 people.
For this reason, this initiative will target infrastructure funding to towns with the highest population, and greater traffic levels, and the need for safe and connected networks.
Boosting cycling in smaller towns is aided by their compact size and lower populations.
Less population translates into less traffic, meaning that cyclists can safely cycle on local streets.
This reduces the need for expensive cycling networks that are essential in larger cities to support more cycling.
Table 1.1 details actions to build connected cycle networks.
Did you know?
During the 2011
Queensland floods many
cycle paths were inundated by
rising waters. The quality and
resilience of these facilities was
proven after the floods, with
most only requiring a simple
clean to become fully
operational.
Part B – Priorities for action
26 Queensland Cycle Strategy 2011–2021
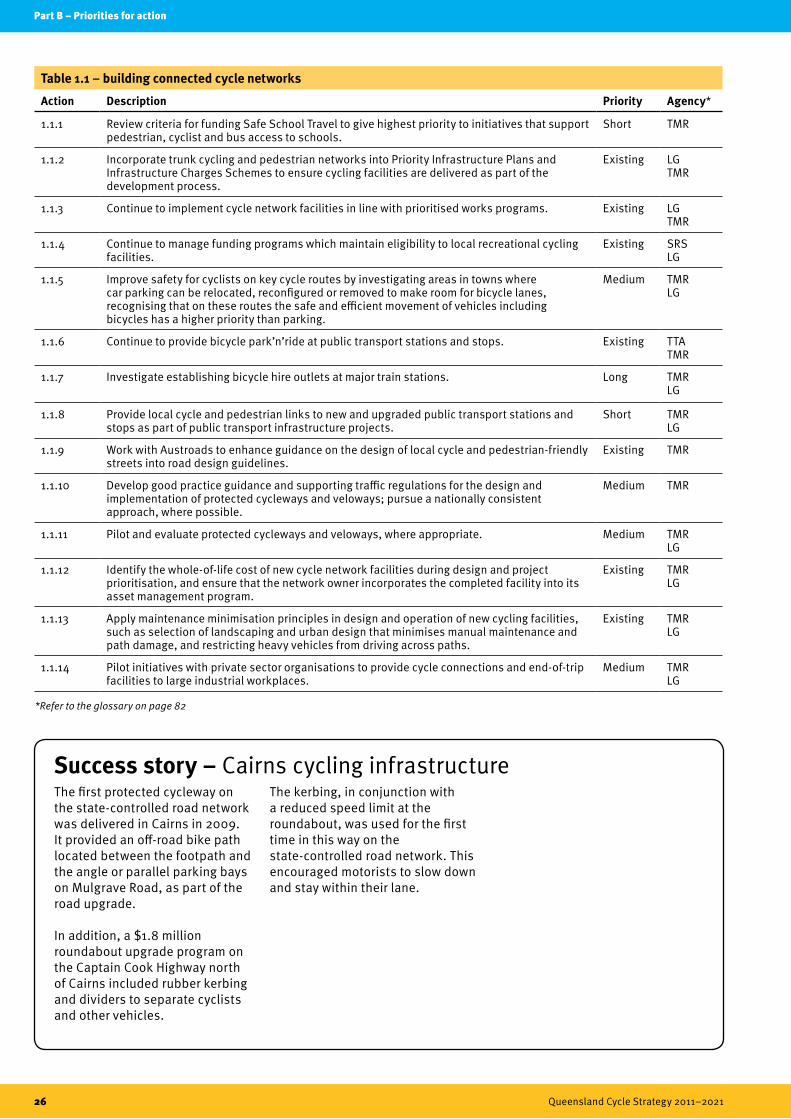
The first protected cycleway on the state-controlled road network was delivered in Cairns in 2009. It provided an off-road bike path located between the footpath and the angle or parallel parking bays on Mulgrave Road, as part of the road upgrade.
In addition, a $1.8 million roundabout upgrade program on the Captain Cook Highway north of Cairns included rubber kerbing and dividers to separate cyclists and other vehicles.
The kerbing, in conjunction with a reduced speed limit at the roundabout, was used for the first time in this way on the state-controlled road network. This encouraged motorists to slow down and stay within their lane.
Success story – Cairns cycling infrastructure
Table 1.1 – building connected cycle networks
Action Description Priority Agency*
1.1.1 Review criteria for funding Safe School Travel to give highest priority to initiatives that support pedestrian, cyclist and bus access to schools.
Short TMR
1.1.2 Incorporate trunk cycling and pedestrian networks into Priority Infrastructure Plans and Infrastructure Charges Schemes to ensure cycling facilities are delivered as part of the development process.
Existing LG TMR
1.1.3 Continue to implement cycle network facilities in line with prioritised works programs. Existing LG TMR
1.1.4 Continue to manage funding programs which maintain eligibility to local recreational cycling facilities.
Existing SRS LG
1.1.5 Improve safety for cyclists on key cycle routes by investigating areas in towns where car parking can be relocated, reconfigured or removed to make room for bicycle lanes, recognising that on these routes the safe and efficient movement of vehicles including bicycles has a higher priority than parking.
Medium TMR LG
1.1.6 Continue to provide bicycle park’n’ride at public transport stations and stops. Existing TTA TMR
1.1.7 Investigate establishing bicycle hire outlets at major train stations. Long TMR LG
1.1.8 Provide local cycle and pedestrian links to new and upgraded public transport stations and stops as part of public transport infrastructure projects.
Short TMR LG
1.1.9 Work with Austroads to enhance guidance on the design of local cycle and pedestrian-friendly streets into road design guidelines.
Existing TMR
1.1.10 Develop good practice guidance and supporting traffic regulations for the design and implementation of protected cycleways and veloways; pursue a nationally consistent approach, where possible.
Medium TMR
1.1.11 Pilot and evaluate protected cycleways and veloways, where appropriate. Medium TMR LG
1.1.12 Identify the whole-of-life cost of new cycle network facilities during design and project prioritisation, and ensure that the network owner incorporates the completed facility into its asset management program.
Existing TMR LG
1.1.13 Apply maintenance minimisation principles in design and operation of new cycling facilities, such as selection of landscaping and urban design that minimises manual maintenance and path damage, and restricting heavy vehicles from driving across paths.
Existing TMR LG
1.1.14 Pilot initiatives with private sector organisations to provide cycle connections and end-of-trip facilities to large industrial workplaces.
Medium TMR LG
*Refer to the glossary on page 82

Part B – Priorities for action
Queensland Cycle Strategy 2011–2021 27
Separating cyclists from cars – on track to protected cycleways
To encourage more people to take up cycling, cycle facilities are needed that are safe and attractive to the widest possible range of users.
Protected cycleways are physically separated from motor vehicle traffic by kerbs and/or parking.
Protected cycleways promote accessibility and safety for cyclists.
Some Australian cities have delivered protected cycleways, recognising that these are one of the best ways to encourage new cyclists.
Veloways
The veloway concept is about cycling infrastructure that is wide enough to cater for at least two cyclists riding side by side, with space for faster moving cyclists to safely overtake.
These facilities encourage people of all ages and abilities to ride, for sports training, a social trip, or commuting.
Veloways provide a very high standard cycling facility (wide path, straight alignment, good sight lines) and are intended for major cycling links where high numbers of cyclists are expected. Veloways are generally designed for higher travel speeds.
A northern cycleway for Brisbane City
An investigation is underway to identify the route for a north Brisbane cycleway. The cycleway will provide a high quality cycle corridor from the CBD to Kedron and ultimately Chermside, integrated with existing land uses and future growth. It will separate cyclists from other traffic.
It will connect cycle facilities that are being delivered as part of the Airport Link project at Bowen Hills, through Albion and Wooloowin, linking into the existing bikeway at Kedron Brook and the Royal Brisbane and Women’s Hospital cycle centre.
Northern cycleway
28 Queensland Cycle Strategy 2011–2021
Part A – Setting the scene
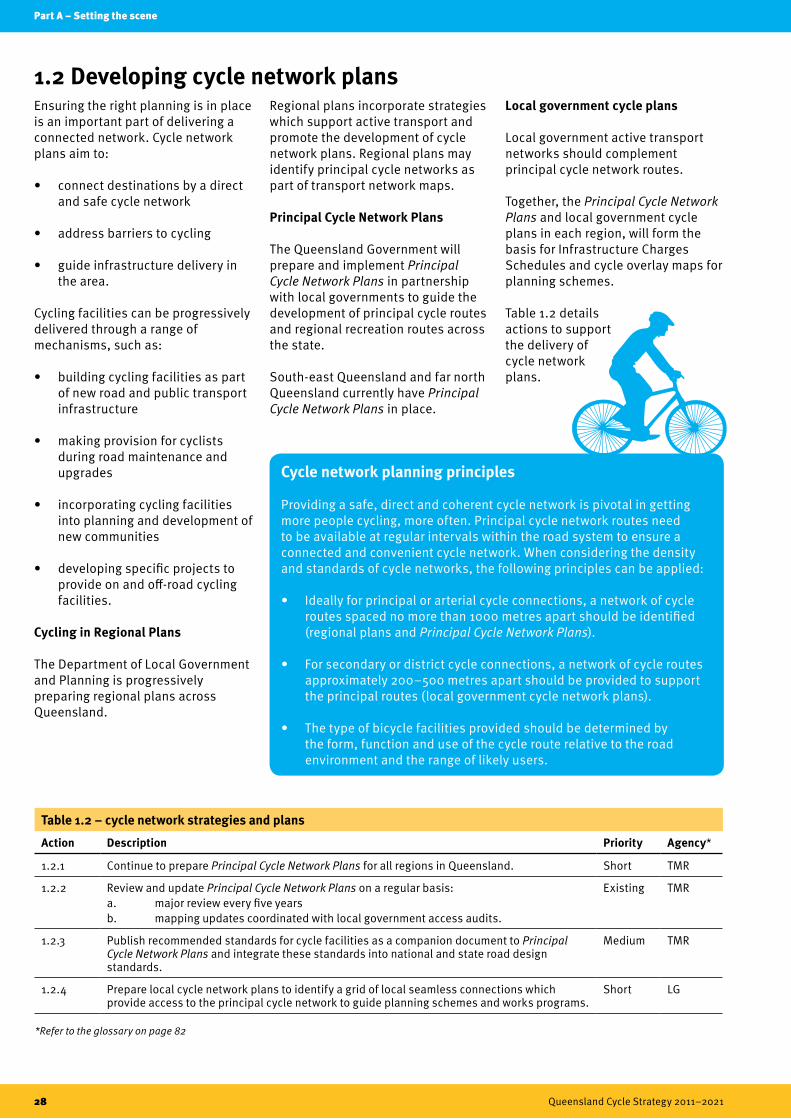
1.2 Developing cycle network plansEnsuring the right planning is in place is an important part of delivering a connected network. Cycle network plans aim to:
• connect destinations by a direct and safe cycle network
• address barriers to cycling
• guide infrastructure delivery in the area.
Cycling facilities can be progressively delivered through a range of mechanisms, such as:
• building cycling facilities as part of new road and public transport infrastructure
• making provision for cyclists during road maintenance and upgrades
• incorporating cycling facilities into planning and development of new communities
• developing specific projects to provide on and off-road cycling facilities.
Cycling in Regional Plans
The Department of Local Government and Planning is progressively preparing regional plans across Queensland.
Regional plans incorporate strategies which support active transport and promote the development of cycle network plans. Regional plans may identify principal cycle networks as part of transport network maps.
Principal Cycle Network Plans
The Queensland Government will prepare and implement Principal Cycle Network Plans in partnership with local governments to guide the development of principal cycle routes and regional recreation routes across the state.
South-east Queensland and far north Queensland currently have Principal Cycle Network Plans in place.
Local government cycle plans
Local government active transport networks should complement principal cycle network routes.
Together, the Principal Cycle Network Plans and local government cycle plans in each region, will form the basis for Infrastructure Charges Schedules and cycle overlay maps for planning schemes.
Table 1.2 details actions to support the delivery of cycle network plans.
Cycle network planning principles
Providing a safe, direct and coherent cycle network is pivotal in getting more people cycling, more often. Principal cycle network routes need to be available at regular intervals within the road system to ensure a connected and convenient cycle network. When considering the density and standards of cycle networks, the following principles can be applied:
• Ideally for principal or arterial cycle connections, a network of cycle routes spaced no more than 1000 metres apart should be identified (regional plans and Principal Cycle Network Plans).
• For secondary or district cycle connections, a network of cycle routes approximately 200–500 metres apart should be provided to support the principal routes (local government cycle network plans).
• The type of bicycle facilities provided should be determined by the form, function and use of the cycle route relative to the road environment and the range of likely users.
*Refer to the glossary on page 82
Table 1.2 – cycle network strategies and plans
Action Description Priority Agency*
1.2.1 Continue to prepare Principal Cycle Network Plans for all regions in Queensland. Short TMR
1.2.2 Review and update Principal Cycle Network Plans on a regular basis: a. major review every five years b. mapping updates coordinated with local government access audits.
Existing TMR
1.2.3 Publish recommended standards for cycle facilities as a companion document to Principal Cycle Network Plans and integrate these standards into national and state road design standards.
Medium TMR
1.2.4 Prepare local cycle network plans to identify a grid of local seamless connections which provide access to the principal cycle network to guide planning schemes and works programs.
Short LG

Part B – Priorities for action
Queensland Cycle Strategy 2011–2021 29
1.2 Developing cycle network plans 1.3 Making cycling a part of all government transport infrastructure projectsIncorporating cycling and walking facilities into new road and other transport infrastructure projects is a cost-effective way to deliver new active transport facilities.
Providing for, and building, multi-modal transport networks where all road users are accommodated is the best value investment. There are many opportunities to provide, connect and improve cycling and walking facilities as part of transport projects, especially in urban areas.
The Queensland Government introduced a policy on cycling on state-controlled roads in 2004, requiring implementation of cycle network facilities as part of road projects. Significant cycle network facilities that have been delivered include:
• Gateway cycleway at a cost of $36 million
• Ted Smout Bridge cycleway at a cost of $22 million
• Centenary Motorway cycleway at a cost of $2.35 million
• cycleway provision in all stages of the Ipswich Motorway Upgrade.
Other road upgrades and maintenance also incorporate cycling facilities on principal cycle networks. For example, to date, road re-seals, shoulder widening and shifting linemarking have resulted in
additional new cycling facilities across Queensland on the state-controlled road network.
The Queensland Government has extended the Cycling Infrastructure Policy to apply to all relevant transport infrastructure projects, whether roads, rail or bus assets. To ensure the best value for the community, wherever the Queensland Government delivers transport infrastructure along a corridor included in a Principal Cycle Network Plan or local government cycle network plan (to which a Queensland Government agency is signatory), positive provision will be made for cycling to ensure routes are constructed as part of works.
For transport infrastructure projects, positive provision means bicycle lanes, bicycle paths or shared paths. The policy recognises that facilities are needed to cater for the full range of new and experienced cyclists. Exactly what facilities and connections are needed is determined in the project planning phase.
Where cycling provision is off-road and/or at public transport stations and stops, positive provision also includes facilities such as direction signage, lighting, and mid-trip and end-of-trip facilities, including bicycle parking. Where demand is identified, provision for pedestrian access should also be included, especially to public transport.
Outside of the principal cycle networks, cycle-friendly provision will be made to deliver safe operating space for bicycles.
As with all transport construction and maintenance projects, planning and investment in cycling will be subject to consultation, safety considerations, competing priorities, obtaining value for money, and realising benefits.
Provision of cycling facilities via the Cycling Infrastructure Policy complements dedicated funding programs which retrofit cycling facilities, where no other transport projects are planned. Over the life of this strategy, the two approaches will result in a transport network that is accessible and attractive for cyclists.
Responsibility for ongoing maintenance costs associated with all new cycling infrastructure, regardless of the constructing authority, will be negotiated on a case-by-case basis.
A similar policy approach can be applied to locating new facilities or buildings. For example, Queensland Health has issued its Ecologically Sustainable Health Care Facilities Policy: Implementation Standard – Transport to prepare Transport Travel Plans and ensure health care facilities are accessible by public transport, walk and cycle connections and provide end-of-trip facilities.
Table 1.3 details actions to deliver cycling as part of projects.

Part B – Priorities for action
30 Queensland Cycle Strategy 2011–2021
Table 1.3 – making cycling a part of all government transport infrastructure projects
Action Description Priority Agency*
1.3.1 Implement the Cycling Infrastructure Policy to provide for cycling as part of all government transport infrastructure projects on corridors identified in Principal Cycle Network Plans.
Short TMR
1.3.2 Continue to implement cycling facilities as part of state government transport infrastructure projects and seek consistency in cycling provision and level of service on state and local government transport infrastructure.
Existing TMR
1.3.3 Ensure works on urban roads, where possible incorporate the following cycle-friendly features:a. no squeeze pointsb. traffic islands set back from edge linesc. wider kerbside lanes for cyclist used. safe crossing points.
Short TMR LG
1.3.4 Incorporate cycling facilities into project scoping and development for minor works in line with the Cycling Infrastructure Policy.
Short TMR
1.3.5 Include active transport access from catchment areas as a high priority criteria in the location of new schools, hospitals and other government buildings, and ensure the design and construction provides access through pathways, bicycle parking and end-of-trip facilities.
Short DPW QH DET TMR LG
1.3.6 Ensure cycle-friendly design is considered in the provision of rural roads, including at intersections.
Existing TMR LG
1.3.7 Establish cycle network facilities in active rail corridors by:a. investigating barriers to providing cycling facilities within rail corridorsb. preparing technical policies and detailed guidance to support provision of cycling
facilities and resolve identified barriers, such as maintenance access, rail operations and safety
c. piloting and evaluating provision of cycling facilities in existing rail corridors which allow a range of typical corridor types and issues to be tested
d. incorporating cycle network facilities into planning new rail lines and upgrades as well as on existing corridors, where practical.
Medium TMR Queens-land Rail LG
1.3.8 Investigate ways to improve facilities for the carriage of bicycles on trains. Long TTA Queens- land Rail
1.3.9 Incorporate cycle networks into asset management policies, strategies and systems, including:a. conducting a regular asset inventoryb. prioritising programmed maintenance works to achieve a suitable level of service across
the network, including surface quality, safe path edges, path and bike lane sweeping and vegetation clearance.
Medium TMR LG
*Refer to the glossary on page 82

Part B – Priorities for action
Queensland Cycle Strategy 2011–2021 31
Signature project oneConnected networks for cities and towns across Queensland
Most Queensland cities and towns have significant potential for many more trips to be made by bicycle, whether for work, school, shopping or recreation.
In towns of over 20 000 people, there is a need for good quality, direct cycle network links to make cycling an easy and attractive choice.
Queensland’s population is highly concentrated, with about 80% of people living in cities and towns with a population of more than 20 000.
Within these cities and towns, about three-quarters of the population live within five kilometres of the major activity centres.
This signature project proposes to replicate the successful South East Queensland Cycle Network Program to progress delivery of connected cycle networks in regional cities and towns across Queensland. The maps on the following pages encompass all cities and towns in Queensland with a population greater than 20 000 people.
Delivery of infrastructure will be guided by Principal Cycle Network Plans (where they are available), with priority given to projects that fit into one of the following categories:
• Strategic cycle network – links to connect centres and key attractors – some of these routes may be protected cycleways or veloways.
• Complete 5 – completing the Principal Cycle Network within five kilometres of key centres to deliver a connected cycle network.
• Educated Ways – ensuring safe and connected routes are provided for major schools, universities and TAFEs, focusing on a three kilometre catchment around these institutions.
• Connect To – putting cycle links in place to key public transport stations and stops (up to five kilometre radius), supported by bicycle parking and other end-of-trip facilities.
Figure 9 illustrates these categories.
Figure 9 – strategic cycle network, Complete 5, Connect To and Educated Ways
Connect To• Improving integration of cycling and public transport will be a high priority across
south-east Queensland to help boost public transport patronage and manage congestion. • Can alleviate significant pressure on park ‘n’ ride facilities across the south-east
Queensland public transport network. • Plays a role in expanding the reach of the public transport network in regional cities. • Focus is on developing and upgrading walking and cycling routes and supporting facilities
such as bicycle parking that connect to major public transport stations and stops.
SP 1.1 Develop a delivery program in partnership with local government for strategic cycle networks, Complete 5, Educated Ways and Connect To, updated annually as part of the Queensland Transport and Roads Investment Program. SP 1.2 Focus criteria for existing and new cycling infrastructure-related funding programs on delivering strategic cycle network routes, Complete 5, Educated Ways and Connect To. Coordinate and streamline the application processes across the various funding sources.
Complete 5• Focus on completing the active transport network within five kilometre catchments
of activity centres. About three-quarters of people in cities and towns live within five kilometres of an activity centre.
• Many jobs are located in activity centres and the majority of universities and schools in cities and towns are within five kilometres of centres.
Educated Ways• About two-thirds of primary school students and one-half of all secondary schools students
live within three kilometres of their closest school.• Educated Ways will initially focus on three kilometre catchments around larger schools
and tertiary education, with prioritisation where school communities are already running programs to encourage more cycling and walking.
• For smaller towns, Educated Ways programs will ensure safe cycling access to all schools and universities.
• Delivery of infrastructure under Educated Ways can include end-of-trip facilities and other supporting treatments.
Strategic cycle network• Strategic cycle networks link centres and are corridors where higher numbers of cyclists are
expected.• They form part of the principal cycle network.• Many of these strategic cycle network links will need to be either off-road or on-road
facilities, which separate cyclists from general traffic. • Some strategic cycle network corridors may also be shared use facilities with pedestrians.

147 000 2010 population
+44%
3.0%
2031 growth forecast
commute mode share
mode share trends
35% Per cent of commute trips less than 5 km
77% Per cent of population within 5km of key centres
14 700 Number of commute trips to Cairns CBD
119 Average annual rain days
Flat Topography
55% Per cent of population overweight or obese
Part B – Priorities for action
32 Queensland Cycle Strategy 2011–2021
CairnsCairns can anticipate considerable population growth over the next 20 years. While car trips form the principal mode of transport, there is existing support for active transport in Cairns. Between 1996 and 2006 there was a decrease in active transport mode share in Cairns. This drop is reversible with the right measures. Central Cairns has over 10% of journeys to work by cycling – the highest in the state. Many areas in Cairns have a high potential for shifting commuters to walking and cycling, with one-in-three residents travelling five kilometres or less to work.
With 55% of Cairns residents overweight or obese, supporting people to be more active as part of daily travel can make an important contribution to overall community health. About 40% of people living in Smithfield and the Northern Beaches
are employed locally. However, in other parts of Cairns, few residents have opted to live close to where they work, or vice versa. Even though the trip distribution spreads across a considerable area, there is a clear centre, with the CBD and adjacent Westcourt/Portsmith attracting almost 50% of total work trips from all suburbs.
Key projects to complete the strategic cycle network
While parts of the cycle network in Cairns are already in place, establishing a high quality network linking the centres is a priority. A Principal Cycle Network Plan has been developed for far north Queensland which identifies the existing and future regional cycle network. Priority strategic cycle connections are shown in Figure 10.
Educated Ways
Cairns is a model for getting more students cycling to school through ‘bike bus’ programs.
With 73% of primary school students and 41% of secondary school students living within three kilometres of their nearest school, there is potential to boost the number of trips to school by cycling.
End-of-trip facilities
This will include the integration of end-of-trip facilities, such as bicycle parking, showers and lockers in buildings. Cycle centres or facilities with secure bicycle parking and showers could be trialled in the CBD and Westcourt/Portsmith.
Connect To
This would prioritise the placement of end-of-trip facilities and cycle connections to support the integration of active transport with public transport.
Figure 10 – strategic cycle network priorities for Cairns
Proposed strategic cycle connections*:1. Cairns to Edmonton via
Earlville
2. Cairns to Redlynch
3. Cairns to Palm Cove via Smithfield
4. Cairns CBD to Airport
5. Edmonton to Gordonvale
* Not in priority order
Smithfield
Edmonton
Earlville
1
Cairns
Redlynch
2
Palm Cove
3
3
4
GordonvaleN
Not to scale,indicative only
Note: The existing cycle network is not shown.
5
Key centre/destination
University/TAFE
Hospital
Airport
Strategic road network
Proposed strategiccycle
Urban footprint
2.5 km from town centre
5 km from town centre
connections
Legend
Proposed strategic cycle connections*:1. Cairns to Edmonton
via Earlville
2. Cairns to Redlynch
3. Cairns to Palm Cove via Smithfield
4. Cairns CBD to Airport
5. Edmonton to Gordonvale
* Not in priority order

Part B – Priorities for action
Queensland Cycle Strategy 2011–2021 33
N
Not to scale,indicative only
Mount Isa
2
2
1
3
Key centre/destination
University/TAFE
Hospital
Strategic road network
Proposed strategic cycle
Urban footprint
2.5 km from town centre
5 km from town centre
connections
Legend
Note: The existing cycle network is not shown.
Cairns Mount IsaMount Isa can anticipate moderate population growth over the next 20 years.
Car trips form the predominant mode of transport. Almost 3% of commute trips are made by cycling.
With about 63% of Mount Isa residents overweight or obese, supporting people to be more active as part of daily travel can make an important contribution to overall community health.
Key projects to complete the strategic cycle network
Mount Isa has some cycle facilities in place. Building on the existing network and providing high-quality links between centres will support more cycling. Some key cycle routes to link centres are identified in Figure 11.
Cycle Network Planning
A Principal Cycle Network Plan will be completed for Mount Isa. In the meantime, priority will be given to works which complete connections to and between the major cycling destinations.
Educated Ways
With almost 89% of primary school students and 63% of secondary school students living within three kilometres of the closest school, there is potential to have more students cycling to local schools.
Figure 11 – strategic cycle network priorities for Mount Isa
21 000 2010 population
+22%
2.8%
2031 growth forecast
commute mode share
mode share trends
99% Per cent of population within 5km of key centre
37 Average annual rain days
Majority flat
Topography
63% Per cent of population overweight or obese
Proposed strategic cycle connections*:1. Miles End to Mount Isa TAFE
2. Soldiers Hill to Happy Valley
3. Sunset to Mount Isa CBD
* Not in priority order
Part B – Priorities for action
34 Queensland Cycle Strategy 2011–2021
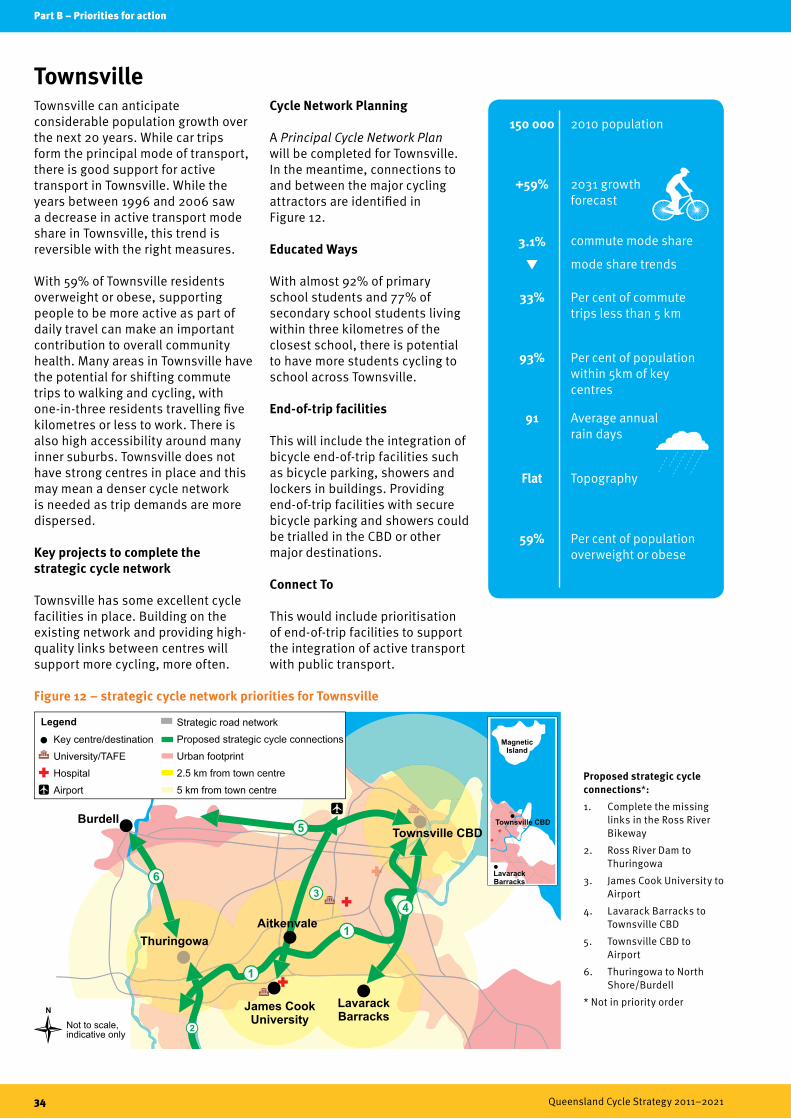
TownsvilleTownsville can anticipate considerable population growth over the next 20 years. While car trips form the principal mode of transport, there is good support for active transport in Townsville. While the years between 1996 and 2006 saw a decrease in active transport mode share in Townsville, this trend is reversible with the right measures.
With 59% of Townsville residents overweight or obese, supporting people to be more active as part of daily travel can make an important contribution to overall community health. Many areas in Townsville have the potential for shifting commute trips to walking and cycling, with one-in-three residents travelling five kilometres or less to work. There is also high accessibility around many inner suburbs. Townsville does not have strong centres in place and this may mean a denser cycle network is needed as trip demands are more dispersed.
Key projects to complete the strategic cycle network
Townsville has some excellent cycle facilities in place. Building on the existing network and providing high-quality links between centres will support more cycling, more often.
Cycle Network Planning
A Principal Cycle Network Plan will be completed for Townsville. In the meantime, connections to and between the major cycling attractors are identified in Figure 12.
Educated Ways
With almost 92% of primary school students and 77% of secondary school students living within three kilometres of the closest school, there is potential to have more students cycling to school across Townsville.
End-of-trip facilities
This will include the integration of bicycle end-of-trip facilities such as bicycle parking, showers and lockers in buildings. Providing end-of-trip facilities with secure bicycle parking and showers could be trialled in the CBD or other major destinations.
Connect To
This would include prioritisation of end-of-trip facilities to support the integration of active transport with public transport.
150 000 2010 population
+59%
3.1%
2031 growth forecast
commute mode share
mode share trends
33% Per cent of commute trips less than 5 km
93% Per cent of population within 5km of key centres
91 Average annual rain days
Flat Topography
59% Per cent of population overweight or obese
Proposed strategic cycle connections*:1. Complete the missing
links in the Ross River Bikeway
2. Ross River Dam to Thuringowa
3. James Cook University to Airport
4. Lavarack Barracks to Townsville CBD
5. Townsville CBD to Airport
6. Thuringowa to North Shore/Burdell
* Not in priority order
Figure 12 – strategic cycle network priorities for Townsville
Not to scale,indicative only
Northern Beaches
5
Mackay
Andergrove
North Mackay
1
Note: The existing cycle network is not shown.
4
3
2
Key centre/destination
University/TAFE
Hospital
Strategic road network
Proposed strategic cycle
Urban footprint
2.5 km from town centre
5 km from town centre
connections
Legend
Mount Pleasant
6

Part B – Priorities for action
Queensland Cycle Strategy 2011–2021 35
Not to scale,indicative only
Northern Beaches
5
Mackay
Andergrove
North Mackay
1
Note: The existing cycle network is not shown.
4
3
2
Key centre/destination
University/TAFE
Hospital
Strategic road network
Proposed strategic cycle
Urban footprint
2.5 km from town centre
5 km from town centre
connections
Legend
Mount Pleasant
6
Townsville MackayMackay can anticipate considerable population growth over the next 20 years. This is underpinned by mining activity in central Queensland, with Mackay playing a central role as a major service centre and residential area.
The urban area of Mackay has increased considerably over the past decade. The CBD has remained a very strong centre, attracting about 30% of work trips. North Mackay and Mt Pleasant also attracts a high proportion of work trips.
Car trips form the predominant mode of transport, with some support for active transport. There are incentives to walk and cycle, as origins and destinations are close together.
With about 60% of Mackay residents overweight or obese, supporting people to be more active as part of daily travel can make an important contribution to overall community health.
Cycle Network Planning
A Principal Cycle Network Plan will be completed for Mackay. In the meantime, priority will be given to works which complete connections to and between the major cycling destinations identified in Figure 13.
Educated Ways
With 73% of primary school students and 64% of secondary school students living within three
kilometres of their nearest school, there is potential to boost the number of trips to school by cycling.
End-of-trip facilities
This will include the integration of bicycle end-of-trip facilities such as bicycle parking, showers and lockers in buildings. Cycle centres or end-of-trip facilities with secure bicycle parking and showers could be trialled in the CBD.
Figure 13 – strategic cycle network priorities for Mackay 76 000 2010 population
+58%
1.8%
2031 growth forecast
commute mode share
mode share trends
38% Per cent of commute trips less than 5 km
94% Per cent of population within 5km of key centres
11 600 Number of commute trips to the Mackay CBD
130 Average annual rain days
Flat Topography
60% Per cent of population overweight or obese
Proposed strategic cycle connections*:1. Bucasia to Rural View
(Northern Beaches)
2. Mackay Central to North Mackay
3. North Mackay to Mt Pleasant
4. North Mackay to Andergrove
5. Mackay Central to Paget/Ooralea
6. Northern Beaches to Mt Pleasant
* Not in priority order
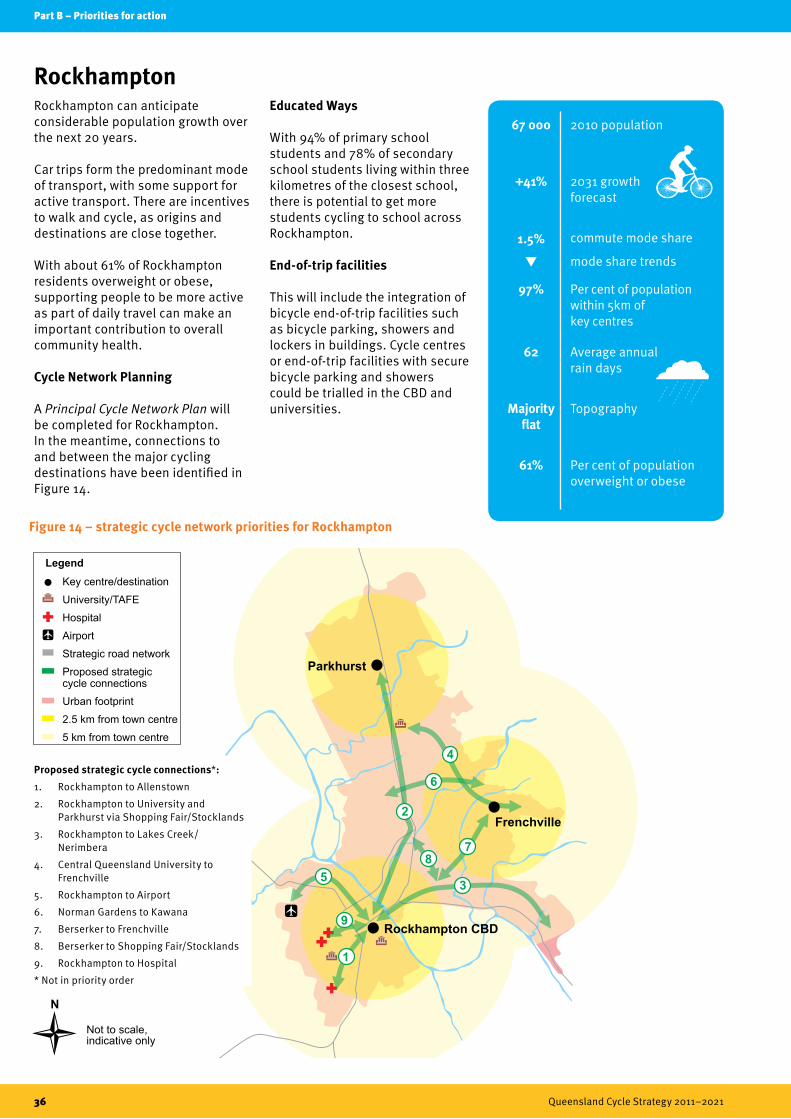
Part B – Priorities for action
36 Queensland Cycle Strategy 2011–2021
Frenchville
Parkhurst
Rockhampton CBD
1
5
9
3
4
6
78
N
Not to scale,indicative only
Note: The existing cycle network is not shown.
Key centre/destination
University/TAFE
Hospital
Airport
Strategic road network
Proposed strategic cycle connections
Urban footprint
2.5 km from town centre
5 km from town centre
Legend
2
RockhamptonRockhampton can anticipate considerable population growth over the next 20 years.
Car trips form the predominant mode of transport, with some support for active transport. There are incentives to walk and cycle, as origins and destinations are close together.
With about 61% of Rockhampton residents overweight or obese, supporting people to be more active as part of daily travel can make an important contribution to overall community health.
Cycle Network Planning
A Principal Cycle Network Plan will be completed for Rockhampton. In the meantime, connections to and between the major cycling destinations have been identified in Figure 14.
Educated Ways
With 94% of primary school students and 78% of secondary school students living within three kilometres of the closest school, there is potential to get more students cycling to school across Rockhampton.
End-of-trip facilities
This will include the integration of bicycle end-of-trip facilities such as bicycle parking, showers and lockers in buildings. Cycle centres or end-of-trip facilities with secure bicycle parking and showers could be trialled in the CBD and universities.
67 000 2010 population
+41%
1.5%
2031 growth forecast
commute mode share
mode share trends
97% Per cent of population within 5km of key centres
62 Average annual rain days
Majority flat
Topography
61% Per cent of population overweight or obese
Figure 14 – strategic cycle network priorities for Rockhampton
Proposed strategic cycle connections*:1. Rockhampton to Allenstown
2. Rockhampton to University and Parkhurst via Shopping Fair/Stocklands
3. Rockhampton to Lakes Creek/Nerimbera
4. Central Queensland University to Frenchville
5. Rockhampton to Airport
6. Norman Gardens to Kawana
7. Berserker to Frenchville
8. Berserker to Shopping Fair/Stocklands
9. Rockhampton to Hospital
* Not in priority order
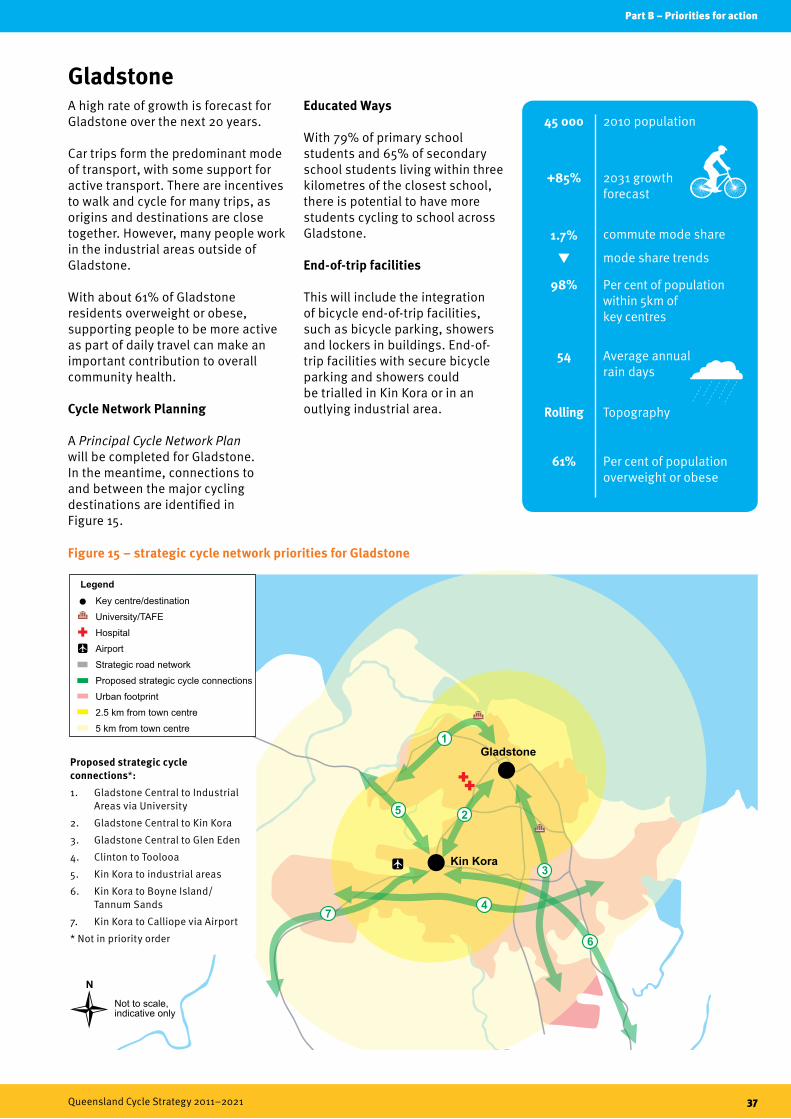
Part B – Priorities for action
Queensland Cycle Strategy 2011–2021 37
N
Not to scale,indicative only
Gladstone
4
2
Kin Kora
Note: The existing cycle network is not shown.
1
3
5
Key centre/destination
University/TAFE
Hospital
Airport
Strategic road network
Proposed strategic cycle
Urban footprint
2.5 km from town centre
5 km from town centre
connections
Legend
6
7
Rockhampton GladstoneA high rate of growth is forecast for Gladstone over the next 20 years.
Car trips form the predominant mode of transport, with some support for active transport. There are incentives to walk and cycle for many trips, as origins and destinations are close together. However, many people work in the industrial areas outside of Gladstone.
With about 61% of Gladstone residents overweight or obese, supporting people to be more active as part of daily travel can make an important contribution to overall community health.
Cycle Network Planning
A Principal Cycle Network Plan will be completed for Gladstone. In the meantime, connections to and between the major cycling destinations are identified in Figure 15.
Educated Ways
With 79% of primary school students and 65% of secondary school students living within three kilometres of the closest school, there is potential to have more students cycling to school across Gladstone.
End-of-trip facilities
This will include the integration of bicycle end-of-trip facilities, such as bicycle parking, showers and lockers in buildings. End-of-trip facilities with secure bicycle parking and showers could be trialled in Kin Kora or in an outlying industrial area.
45 000 2010 population
+85%
1.7%
2031 growth forecast
commute mode share
mode share trends
98% Per cent of population within 5km of key centres
54 Average annual rain days
Rolling Topography
61% Per cent of population overweight or obese
Figure 15 – strategic cycle network priorities for Gladstone
Proposed strategic cycle connections*:1. Gladstone Central to Industrial
Areas via University
2. Gladstone Central to Kin Kora
3. Gladstone Central to Glen Eden
4. Clinton to Toolooa
5. Kin Kora to industrial areas
6. Kin Kora to Boyne Island/Tannum Sands
7. Kin Kora to Calliope via Airport
* Not in priority order
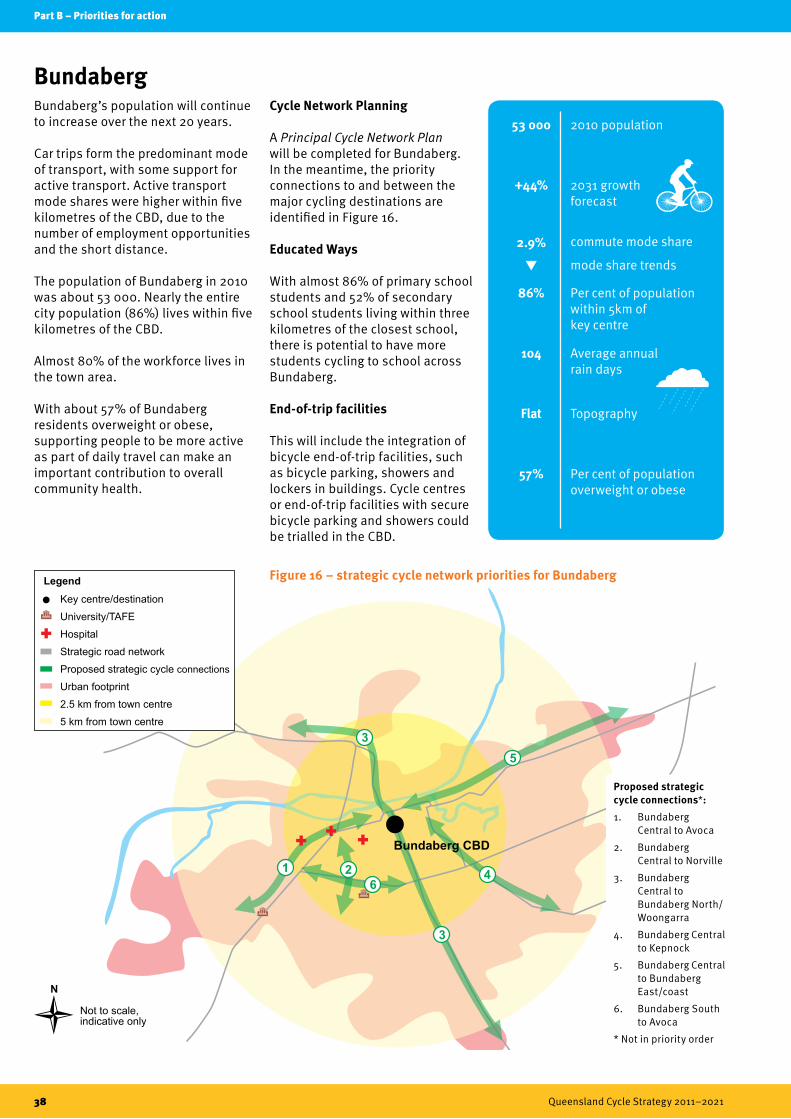
Part B – Priorities for action
38 Queensland Cycle Strategy 2011–2021
N
Not to scale,indicative only
1 2
3
5
4
Key centre/destination
University/TAFE
Hospital
Strategic road network
Proposed strategic cycle
Urban footprint
2.5 km from town centre
5 km from town centre
connections
Legend
Note: The existing cycle network is not shown.
Bundaberg CBD
3
6
BundabergBundaberg’s population will continue to increase over the next 20 years.
Car trips form the predominant mode of transport, with some support for active transport. Active transport mode shares were higher within five kilometres of the CBD, due to the number of employment opportunities and the short distance.
The population of Bundaberg in 2010 was about 53 000. Nearly the entire city population (86%) lives within five kilometres of the CBD.
Almost 80% of the workforce lives in the town area.
With about 57% of Bundaberg residents overweight or obese, supporting people to be more active as part of daily travel can make an important contribution to overall community health.
Cycle Network Planning
A Principal Cycle Network Plan will be completed for Bundaberg. In the meantime, the priority connections to and between the major cycling destinations are identified in Figure 16.
Educated Ways
With almost 86% of primary school students and 52% of secondary school students living within three kilometres of the closest school, there is potential to have more students cycling to school across Bundaberg.
End-of-trip facilities
This will include the integration of bicycle end-of-trip facilities, such as bicycle parking, showers and lockers in buildings. Cycle centres or end-of-trip facilities with secure bicycle parking and showers could be trialled in the CBD.
53 000 2010 population
+44%
2.9%
2031 growth forecast
commute mode share
mode share trends
86% Per cent of population within 5km of key centre
104 Average annual rain days
Flat Topography
57% Per cent of population overweight or obese
Proposed strategic cycle connections*:1. Bundaberg
Central to Avoca
2. Bundaberg Central to Norville
3. Bundaberg Central to Bundaberg North/Woongarra
4. Bundaberg Central to Kepnock
5. Bundaberg Central to Bundaberg East/coast
6. Bundaberg South to Avoca
* Not in priority order
Figure 16 – strategic cycle network priorities for Bundaberg
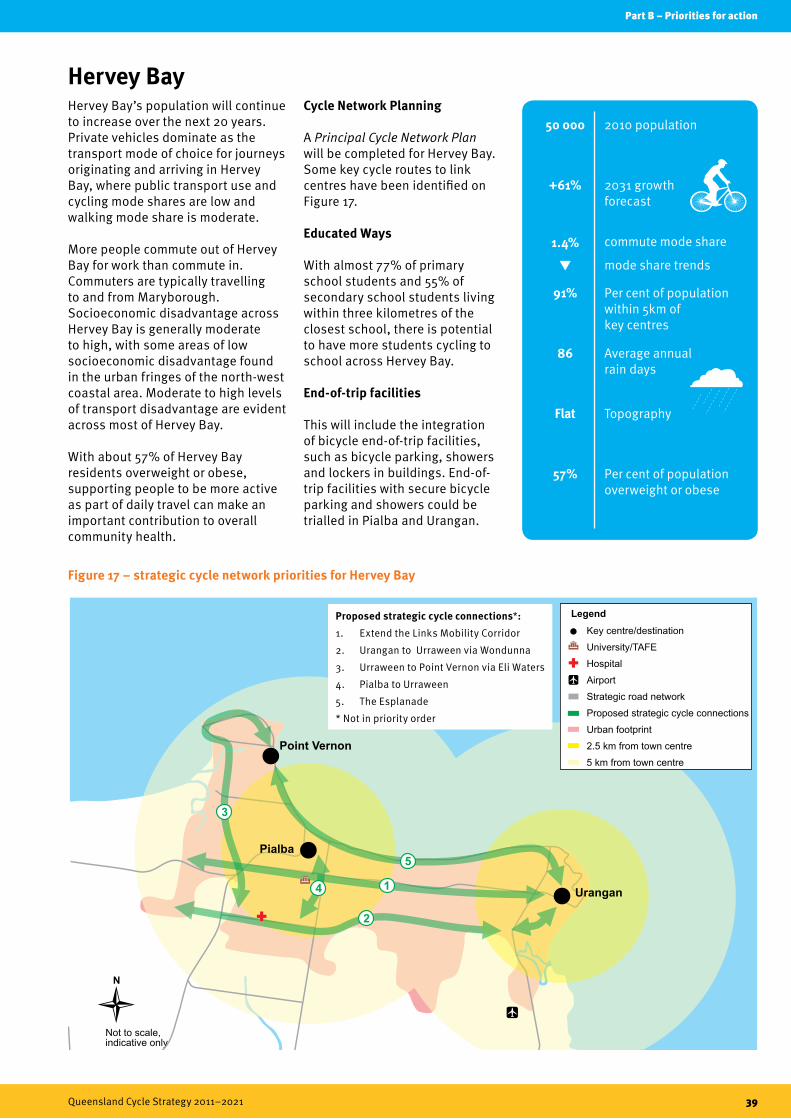
Part B – Priorities for action
Queensland Cycle Strategy 2011–2021 39
Not to scale,indicative only
N
Urangan
Pialba
1
3
4
2
Note: The existing cycle network is not shown.
Point Vernon
5
Key centre/destination
University/TAFE
Hospital
Airport
Strategic road network
Proposed strategic cycle connections
Urban footprint
2.5 km from town centre
5 km from town centre
Legend
Bundaberg Hervey BayHervey Bay’s population will continue to increase over the next 20 years. Private vehicles dominate as the transport mode of choice for journeys originating and arriving in Hervey Bay, where public transport use and cycling mode shares are low and walking mode share is moderate.
More people commute out of Hervey Bay for work than commute in. Commuters are typically travelling to and from Maryborough. Socioeconomic disadvantage across Hervey Bay is generally moderate to high, with some areas of low socioeconomic disadvantage found in the urban fringes of the north-west coastal area. Moderate to high levels of transport disadvantage are evident across most of Hervey Bay.
With about 57% of Hervey Bay residents overweight or obese, supporting people to be more active as part of daily travel can make an important contribution to overall community health.
Cycle Network Planning
A Principal Cycle Network Plan will be completed for Hervey Bay. Some key cycle routes to link centres have been identified on Figure 17.
Educated Ways
With almost 77% of primary school students and 55% of secondary school students living within three kilometres of the closest school, there is potential to have more students cycling to school across Hervey Bay.
End-of-trip facilities
This will include the integration of bicycle end-of-trip facilities, such as bicycle parking, showers and lockers in buildings. End-of-trip facilities with secure bicycle parking and showers could be trialled in Pialba and Urangan.
50 000 2010 population
+61%
1.4%
2031 growth forecast
commute mode share
mode share trends
91% Per cent of population within 5km of key centres
86 Average annual rain days
Flat Topography
57% Per cent of population overweight or obese
Proposed strategic cycle connections*:1. Extend the Links Mobility Corridor
2. Urangan to Urraween via Wondunna
3. Urraween to Point Vernon via Eli Waters
4. Pialba to Urraween
5. The Esplanade
* Not in priority order
Figure 17 – strategic cycle network priorities for Hervey Bay
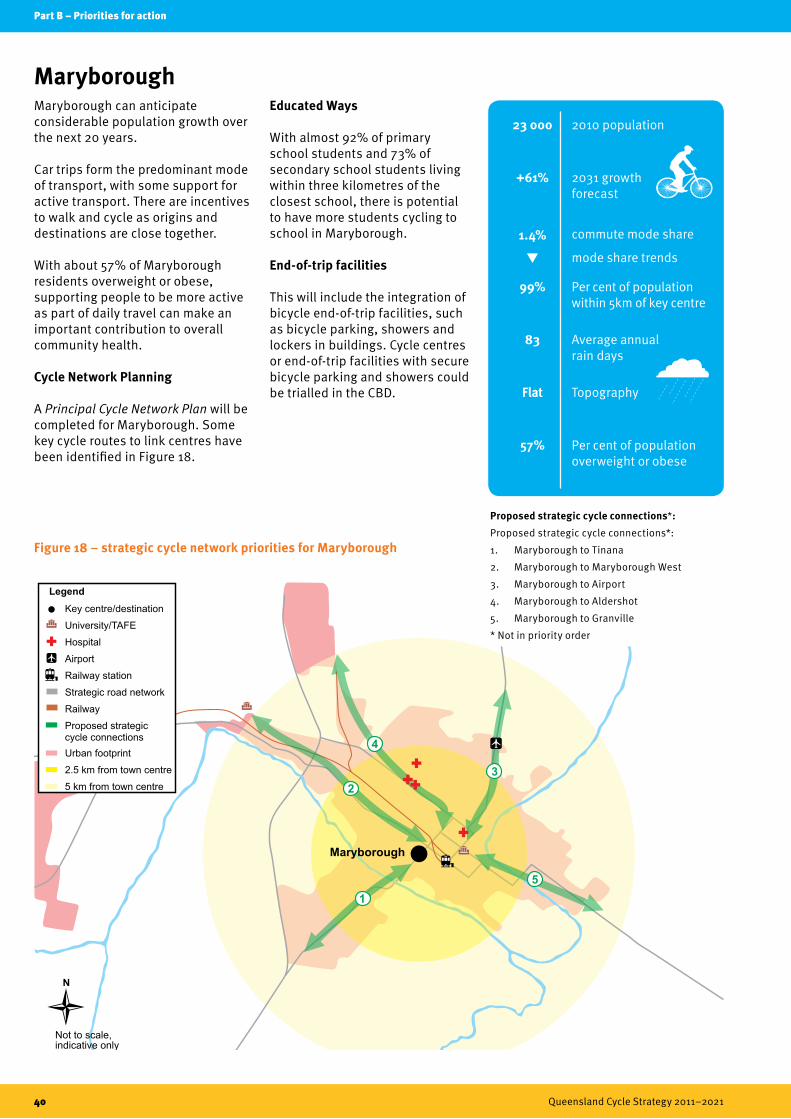
Part B – Priorities for action
40 Queensland Cycle Strategy 2011–2021
N
Not to scale,indicative only
Maryborough
3
5
1
Note: The existing cycle network is not shown.
2
4
Key centre/destination
University/TAFE
Hospital
Airport
Railway station
Strategic road network
Railway
Proposed strategic cycle connections
Urban footprint
2.5 km from town centre
5 km from town centre
Legend
MaryboroughMaryborough can anticipate considerable population growth over the next 20 years.
Car trips form the predominant mode of transport, with some support for active transport. There are incentives to walk and cycle as origins and destinations are close together.
With about 57% of Maryborough residents overweight or obese, supporting people to be more active as part of daily travel can make an important contribution to overall community health.
Cycle Network Planning
A Principal Cycle Network Plan will be completed for Maryborough. Some key cycle routes to link centres have been identified in Figure 18.
Educated Ways
With almost 92% of primary school students and 73% of secondary school students living within three kilometres of the closest school, there is potential to have more students cycling to school in Maryborough.
End-of-trip facilities
This will include the integration of bicycle end-of-trip facilities, such as bicycle parking, showers and lockers in buildings. Cycle centres or end-of-trip facilities with secure bicycle parking and showers could be trialled in the CBD.
Figure 18 – strategic cycle network priorities for Maryborough
23 000 2010 population
+61%
1.4%
2031 growth forecast
commute mode share
mode share trends
99% Per cent of population within 5km of key centre
83 Average annual rain days
Flat Topography
57% Per cent of population overweight or obese
Proposed strategic cycle connections*:Proposed strategic cycle connections*:
1. Maryborough to Tinana
2. Maryborough to Maryborough West
3. Maryborough to Airport
4. Maryborough to Aldershot
5. Maryborough to Granville
* Not in priority order
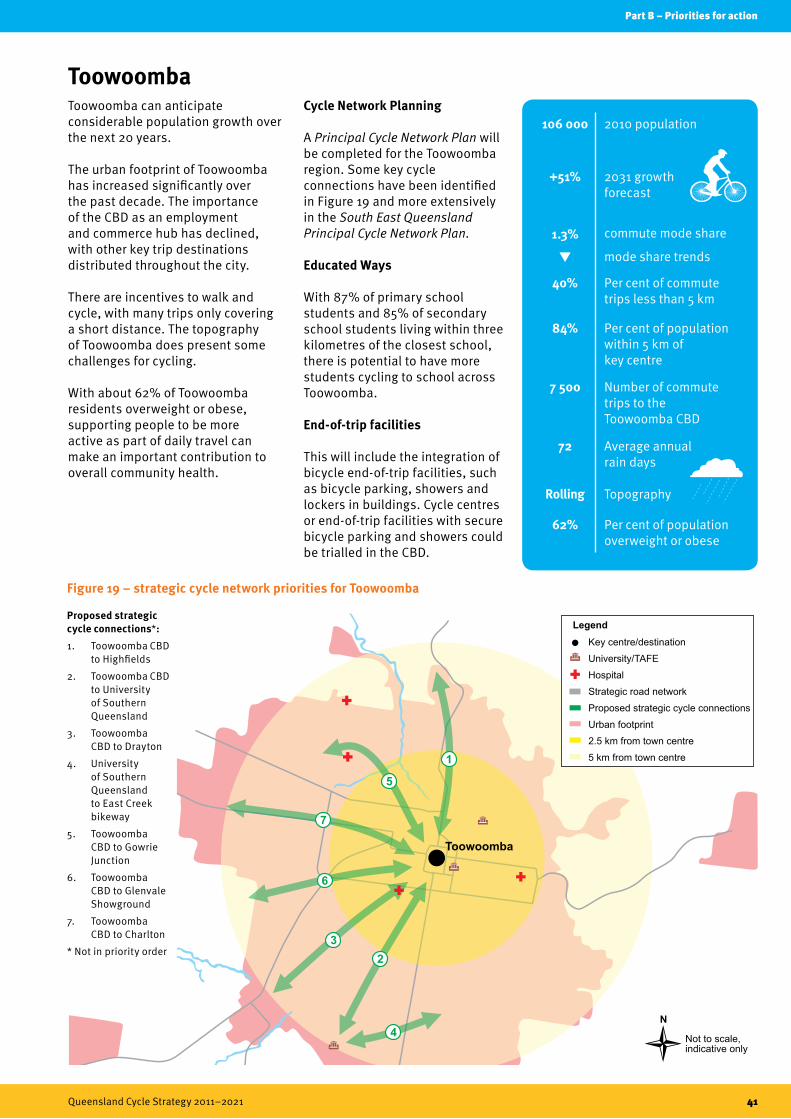
Part B – Priorities for action
Queensland Cycle Strategy 2011–2021 41
N
Not to scale,indicative only
Toowoomba
2
Key centre/destination
University/TAFE
Hospital
Strategic road network
Proposed strategic cycle
Urban footprint
2.5 km from town centre
5 km from town centre
connections
Legend
1
Note: The existing cycle network is not shown.
5
7
4
3
6
Maryborough ToowoombaToowoomba can anticipate considerable population growth over the next 20 years.
The urban footprint of Toowoomba has increased significantly over the past decade. The importance of the CBD as an employment and commerce hub has declined, with other key trip destinations distributed throughout the city.
There are incentives to walk and cycle, with many trips only covering a short distance. The topography of Toowoomba does present some challenges for cycling.
With about 62% of Toowoomba residents overweight or obese, supporting people to be more active as part of daily travel can make an important contribution to overall community health.
Cycle Network Planning
A Principal Cycle Network Plan will be completed for the Toowoomba region. Some key cycle connections have been identified in Figure 19 and more extensively in the South East Queensland Principal Cycle Network Plan.
Educated Ways
With 87% of primary school students and 85% of secondary school students living within three kilometres of the closest school, there is potential to have more students cycling to school across Toowoomba.
End-of-trip facilities
This will include the integration of bicycle end-of-trip facilities, such as bicycle parking, showers and lockers in buildings. Cycle centres or end-of-trip facilities with secure bicycle parking and showers could be trialled in the CBD.
Figure 19 – strategic cycle network priorities for Toowoomba
106 000 2010 population
+51%
1.3%
2031 growth forecast
commute mode share
mode share trends
40% Per cent of commute trips less than 5 km
84% Per cent of population within 5 km of key centre
7 500 Number of commute trips to the Toowoomba CBD
72 Average annual rain days
Rolling Topography
62% Per cent of population overweight or obese
Proposed strategic cycle connections*:1. Toowoomba CBD
to Highfields
2. Toowoomba CBD to University of Southern Queensland
3. Toowoomba CBD to Drayton
4. University of Southern Queensland to East Creek bikeway
5. Toowoomba CBD to Gowrie Junction
6. Toowoomba CBD to Glenvale Showground
7. Toowoomba CBD to Charlton
* Not in priority order
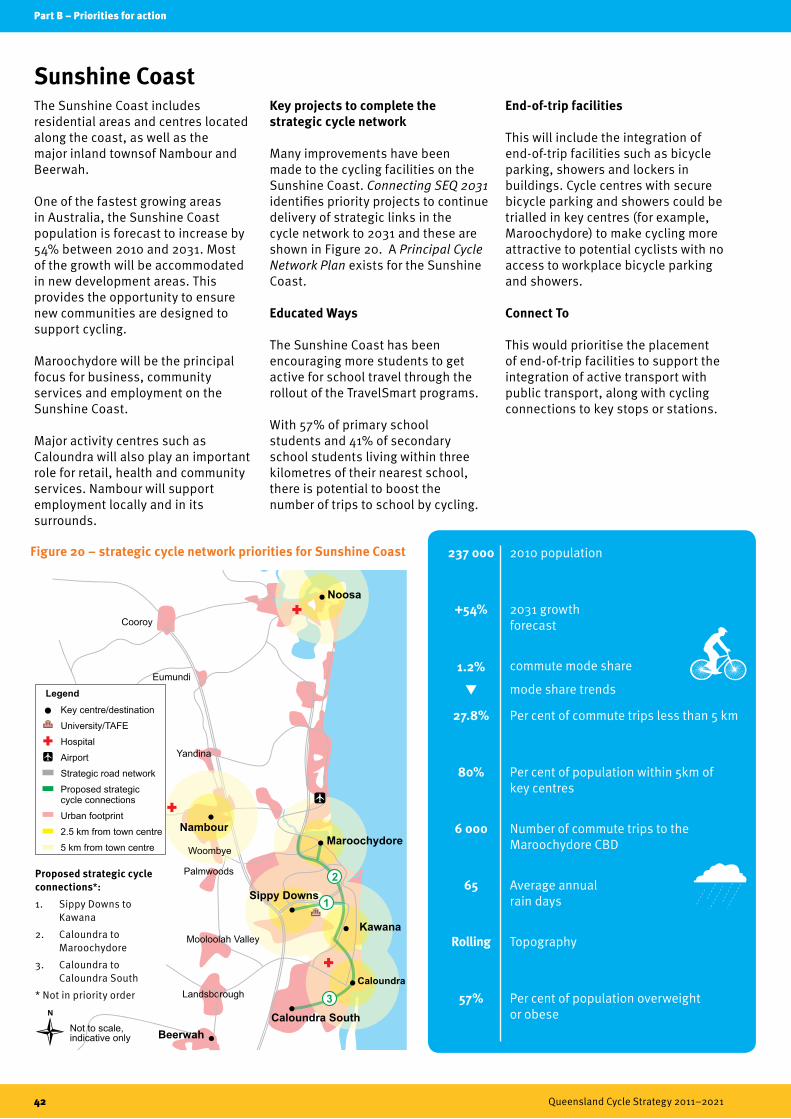
Part B – Priorities for action
42 Queensland Cycle Strategy 2011–2021
Sunshine CoastThe Sunshine Coast includes residential areas and centres located along the coast, as well as the major inland townsof Nambour and Beerwah.
One of the fastest growing areas in Australia, the Sunshine Coast population is forecast to increase by 54% between 2010 and 2031. Most of the growth will be accommodated in new development areas. This provides the opportunity to ensure new communities are designed to support cycling.
Maroochydore will be the principal focus for business, community services and employment on the Sunshine Coast.
Major activity centres such as Caloundra will also play an important role for retail, health and community services. Nambour will support employment locally and in its surrounds.
Key projects to complete the strategic cycle network
Many improvements have been made to the cycling facilities on the Sunshine Coast. Connecting SEQ 2031 identifies priority projects to continue delivery of strategic links in the cycle network to 2031 and these are shown in Figure 20. A Principal Cycle Network Plan exists for the Sunshine Coast.
Educated Ways
The Sunshine Coast has been encouraging more students to get active for school travel through the rollout of the TravelSmart programs.
With 57% of primary school students and 41% of secondary school students living within three kilometres of their nearest school, there is potential to boost the number of trips to school by cycling.
End-of-trip facilities
This will include the integration of end-of-trip facilities such as bicycle parking, showers and lockers in buildings. Cycle centres with secure bicycle parking and showers could be trialled in key centres (for example, Maroochydore) to make cycling more attractive to potential cyclists with no access to workplace bicycle parking and showers.
Connect To
This would prioritise the placement of end-of-trip facilities to support the integration of active transport with public transport, along with cycling connections to key stops or stations.
237 000 2010 population
+54%
1.2%
2031 growth forecast
commute mode share
mode share trends
27.8% Per cent of commute trips less than 5 km
80% Per cent of population within 5km of key centres
6 000 Number of commute trips to the Maroochydore CBD
65 Average annual rain days
Rolling Topography
57% Per cent of population overweight or obese
Figure 20 – strategic cycle network priorities for Sunshine Coast
Beerwah
Cooroy
Eumundi
Yandina
Palmwoods
Mooloolah Valley
Landsborough
N
Not to scale,indicative only
Kawana
Caloundra South
Sippy Downs1
2
Noosa
NambourMaroochydore
Caloundra
3
Woombye
Note: The existing cycle network is not shown.
Key centre/destination
University/TAFE
Hospital
Airport
Strategic road network
Proposed strategiccycle connections
Urban footprint
2.5 km from town centre
5 km from town centre
Legend
Proposed strategic cycle connections*:1. Sippy Downs to
Kawana
2. Caloundra to Maroochydore
3. Caloundra to Caloundra South
* Not in priority order

Part B – Priorities for action
Queensland Cycle Strategy 2011–2021 43
Chermside
Ipswich
Springfield
Beenleigh
Capalaba
Carindale
Upper Mt Gravatt
Springwood
Ripley
Strathpine
Redcliffe
North Lakes
Mitchelton
Cleveland
Browns Plains
Logan Central
Logan Hyperdome
Goodna
N
Not to scale,indicative only
Caboolture
Alderley
CBD
Indooroopilly
Toowong
Seeinset
CBD
1
4
5 2
3Toowong
Indooroopilly
Key centre/destination
Strategic road network
Proposed strategic cycle connections
Urban footprint
2.5 km from key centre
5 km from key centre
Legend
1312
11
14 16
617
10
7
18
15
9
8
Sunshine Coast Greater BrisbaneGreater Brisbane is an urban metropolis of five local governments: Brisbane City Council, Moreton Bay Regional Council, Ipswich City Council, Logan City Council and Redland City Council.
There is variation in the rates of growth, urban form, cycling rates and overall travel patterns between the local governments in greater Brisbane and these are addressed further in Connecting SEQ 2031.
The population is forecast to grow by 42% between 2010 and 2031. Under the South East Queensland Regional Plan, about half of this growth will be accommodated within existing urban areas.
Increasing densities through promoting development within existing urban areas will mean more people living in closer proximity to jobs, shops, schools and recreation opportunities. This presents excellent opportunities for cycling in greater Brisbane.
A proportion of growth will be accommodated in high growth development areas, such as Springfield and the emerging Ripley Valley. This provides the opportunity to ensure new communities are designed to support active travel.
Key projects to complete strategic cycle network
Many improvements have been made to cycling facilities in greater Brisbane. Connecting SEQ 2031 identifies some priority projects to continue delivery of strategic links in the cycle network to 2031 and these are shown in Figure 21. A Principal Cycle Network Plan has also been developed for this area, showing all existing and future cycle connections.
Educated Ways
With 82% of primary school students and 63% of secondary school students living within three kilometres of the closest school,
there is potential to have more students cycling to school.
Connect To
This would prioritise the placement of end-of-trip facilities to support the integration of active transport with public transport, along with cycling connections to key stops or stations.
Improved facilities like secure bike parking and lockers to encourage more cycling to rail stations in south-east Queensland are being planned. Trials of new bike enclosures are being undertaken at various rail stations. Major rail station upgrades will also include fully integrated cycle parking and shower facilities.
End-of-trip facilities
In addition to existing larger cycle centres and public end-of-trip facilities in government buildings in inner Brisbane, opportunities for similar facilities in other key centres will be explored.
1. Investigate Green Bridge from West End to Toowong
2. Investigate Green Bridge from West End to UQ St Lucia
3. Investigate Green Bridge from City to Kangaroo Point
4. Brisbane CBD to Toowong5. Toowong to Indooroopilly6. Brisbane CBD to Springwood7. Brisbane CBD to Chermside8. Brisbane CBD to Alderley9. West End to Coorparoo
10. Gateway Motorway11. Brassall to Ripley (via
Ipswich CBD)12. Amberley to Ipswich CBD13. Springfield to Ipswich CBD14. Springfield to Goodna15. Caboolture to Morayfield16. Logan Central to Springwood17. Capalaba to Cleveland18. Redcliffe to Strathpine/
Albany Creek* Not in priority order
Proposed strategic cycle connections*:
Figure 21 – strategic cycle network priorities for greater Brisbane
1 907 000 2010 population
+42%
1.1%
2031 growth forecast
commute mode share
mode share trends
22.1% Per cent of commute trips less than 5 km
75% Per cent of population within 5km of key centres
120 000 Number of commute trips to the Brisbane CBD
76 Average annual rain days
Hilly Topography
52% Per cent of population overweight or obese

Part B – Priorities for action
44 Queensland Cycle Strategy 2011–2021
482 000 2010 population
+51%1.3%
2031 growth forecastcommute mode sharemode share trends
91% Per cent of commute trips less than 5 km
91% Per cent of population within 5 km of key centres
7 500 Number of commute trips to the Southport CBD
72 Average annual rain days
Rolling Topography
62% Per cent of population overweight or obese
N
Not to scale,indicative only
Coomera
SurfersParadise
Broadbeach
Coolangatta
New SouthWales
Queensland
Bundall
Beenleigh
3
1
Helensvale
Nerang
Southport
Robina
Note: The existing cycle network is not shown.
Key centre/destination
University/TAFE
Airport
Strategic road network
Proposed strategic cycle connections
Urban footprint
2.5 km from town centre
5 km from town centre
Legend
2
Gold CoastThe Gold Coast is Queensland’s second largest city, with a range of coastal and hinterland lifestyles and increasingly diverse employment opportunities.
Growth is forecast to continue over the next two decades, with population increasing by 51% between 2010 and 2031. Under the South East Queensland Regional Plan, over 65% of this growth will be accommodated within existing urban areas.
Urban development is concentrated in growth centres between Yatala and Coolangatta. Continuous development extends south of Coolangatta beyond the Queensland border into the Tweed Shire. The urban form consists of medium to high density development along the
coastal spine and pockets of canal development, surrounded by larger areas of low density residential housing. Rural residential living areas are located further west.
Increasing densities through promoting development within existing urban areas will mean more people living in closer proximity to jobs, shops, schools and recreation opportunities. This presents an excellent opportunity for cycling.
Key projects to complete strategic cycle network
Many improvements have already been made to the cycling facilities on the Gold Coast. Connecting SEQ 2031 identifies priority projects to continue delivery of strategic links in the region’s cycle network and these are
shown in Figure 22. A Principal Cycle Network Plan has also been identified for the area.
Educated Ways
With 74% of primary school students and 48% of secondary school students living within three kilometres of their nearest school, there is huge potential to boost the numbers of trips to school by cycling.
End-of-trip facilities
This will include the integration of bicycle end-of-trip facilities such as bicycle parking, showers and lockers in buildings. Cycle centres or end-of-trip facilities with secure bicycle parking and showers could be trialled in key centres.
Proposed strategic cycle connections*:1. Helensvale to Southport
2. Southport to Broadbeach
3. Broadbeach to Robina
* Not in priority order
Connect To
This would prioritise the placement of end-of-trip facilities to support the integration of active transport with public transport.
Figure 22 – strategic cycle network priorities for Gold Coast
Gold Coast
Part B – Priorities for action
Queensland Cycle Strategy 2011–2021 45

Part B – Priorities for action
46 Queensland Cycle Strategy 2011–2021
Ted Smout Bridge and Gateway Cycleways
The $36 million Gateway cycleway and the $22 million Ted Smout Memorial Bridge cycle and pedestrian facility, both opened in 2010, are critical links in the south-east Queensland cycle network. They form part of the 150 km Moreton Bay cycleway running across four local government areas from Redcliffe to Redland Bay, and are important local links for commuting trips.
The Queensland Government’s Cycling on State-controlled Roads Policy introduced in 2004, required that road projects on priority cycle routes provided for cycling. As a result, cycling and pedestrian facilities were incorporated into the upgrade of these two bridges.
The Queensland Government recognised that including a bicycle and pedestrian crossing as part of these major projects was a significant and unique opportunity to improve connections east and north of Brisbane. Incorporating cycling and walking facilities into all transport projects is economical and provides greater resilience to the transport system.
The Gateway and Ted Smout Bridge cycleways are proving to be worthwhile investments supporting rapidly growing areas of Queensland. The Queensland Government’s Cycling Infrastructure Policy will continue to ensure that all opportunities are taken to connect and improve cycling and walking, as part of transport projects, and will provide best value investment for the Queensland community.
Gateway cycleway

Ted Smout Bridge cycleway
Part B – Priorities for action
Queensland Cycle Strategy 2011–2021 47
Part B – Priorities for action
48 Queensland Cycle Strategy 2011–2021
Priority area two
Growing a cycling culture

Growing a cycling culture is about Queensland being a place where cycling is widely supported, encouraged and celebrated. It is about making cycling convenient, easy to do, enjoyable and a cultural norm embraced by the wider community.
Getting more people to cycle will take time. Community attitudes towards cycling will only change when people experience cycling as being safe and convenient.
Providing a network that offers safe and direct cycling routes is critical. Initiatives that promote cycling to existing, lapsed and potential cyclists are also needed.
Organised community events, one-on-one assistance by skilled riders and bicycle education give people the opportunity to try cycling in safe and supportive settings.
Providing information and advice about the infrastructure available in people’s local areas will support voluntary travel behaviour change programs.
Ensuring road rules support cycling and improve cycling safety is also important. The department regularly reviews road rules as part of its safety commitment and will provide this information to the community.
The action tables in the following section include an implementation priority. The intended timeframes are:
• Short: 2011 – 2013
• Medium: 2014 – 2017
• Long: 2018 – 2021
• Existing: current action.
Part B – Priorities for action
Queensland Cycle Strategy 2011–2021 49
2.1 Supporting travel behaviour change to boost cyclingThe Queensland Government will support existing cyclists to cycle more often, and encourage more people to take up cycling.
As well as improving infrastructure and facilities, getting more people cycling more often requires the support of travel behaviour change programs.
Travel behaviour change programs encourage the use of sustainable modes of transport like cycling and walking.
TravelSmart
The Queensland Government is rolling out the world’s largest TravelSmart communities program to encourage people to use public transport, cycle and walk for more trips. TravelSmart communities is a key pillar of the Government’s climate change strategy, ClimateQ, for reducing Queensland’s road transport greenhouse gas emissions.
TravelSmart programs use a range of measures that target the attitudes and behaviours of individuals. They support investments in public transport, walking and cycling to encourage a change in travel behaviour in homes, schools and workplaces.
TravelSmart programs involve the Queensland Government working with local governments, businesses and the community.
Programs underway include:
• TravelSmart communities – about 325 000 households throughout Brisbane, the Gold Coast and Sunshine Coast will be encouraged to increase their use of sustainable modes of transport. Households which elect to participate in the program are provided with a range of resources to assist them to change their travel behaviours.
The TravelSmart communities project was rolled out to about 75 000 households in north Brisbane. Project results include:
• 49% increase in walking
• 50% increase in cycling
• 27% increase in public transport use
• 13% reduction in kilometres travelled in private cars
• 28 000 tonne reduction in greenhouse gas emissions per year – equivalent to the annual electricity use of around 2100 households.
Success story – boost to cycling through TravelSmart communities
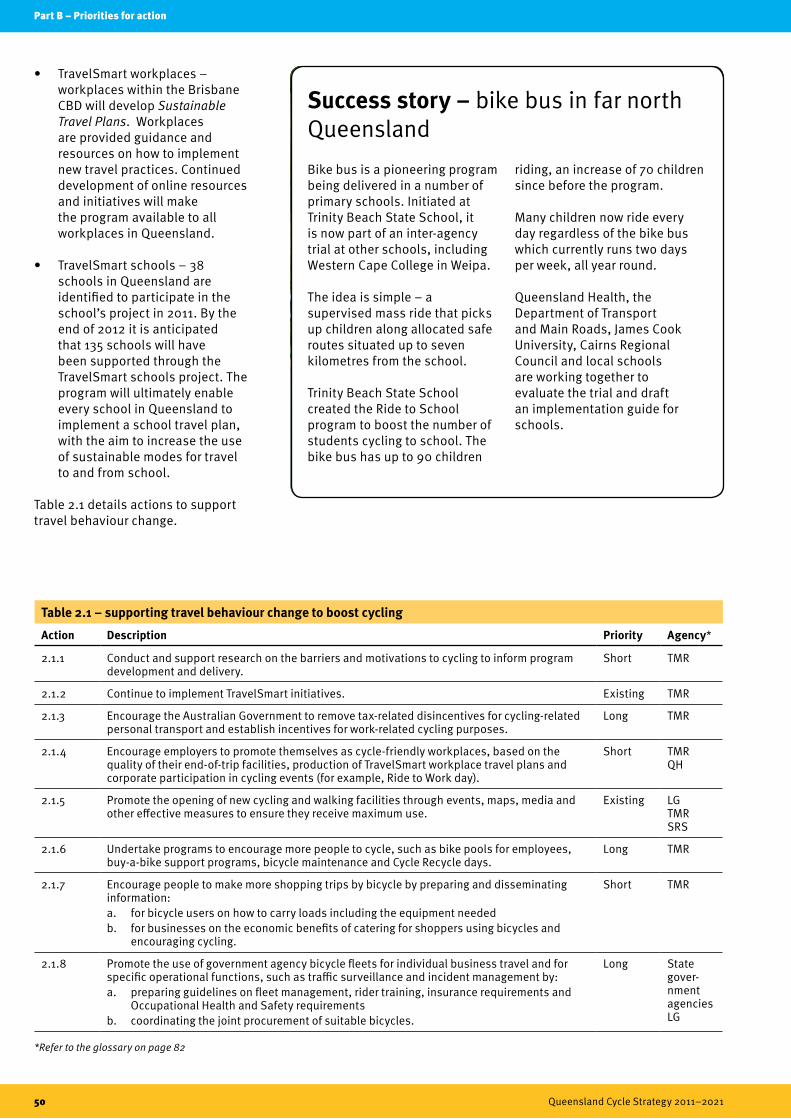
*Refer to the glossary on page 82
Part B – Priorities for action
50 Queensland Cycle Strategy 2011–2021
• TravelSmart workplaces – workplaces within the Brisbane CBD will develop Sustainable Travel Plans. Workplaces are provided guidance and resources on how to implement new travel practices. Continued development of online resources and initiatives will make the program available to all workplaces in Queensland.
• TravelSmart schools – 38 schools in Queensland are identified to participate in the school’s project in 2011. By the end of 2012 it is anticipated that 135 schools will have been supported through the TravelSmart schools project. The program will ultimately enable every school in Queensland to implement a school travel plan, with the aim to increase the use of sustainable modes for travel to and from school.
Table 2.1 details actions to support travel behaviour change.
Bike bus is a pioneering program being delivered in a number of primary schools. Initiated at Trinity Beach State School, it is now part of an inter-agency trial at other schools, including Western Cape College in Weipa.
The idea is simple – a supervised mass ride that picks up children along allocated safe routes situated up to seven kilometres from the school.
Trinity Beach State School created the Ride to School program to boost the number of students cycling to school. The bike bus has up to 90 children
riding, an increase of 70 children since before the program.
Many children now ride every day regardless of the bike bus which currently runs two days per week, all year round.
Queensland Health, the Department of Transport and Main Roads, James Cook University, Cairns Regional Council and local schools are working together to evaluate the trial and draft an implementation guide for schools.
Success story – bike bus in far north Queensland
Table 2.1 – supporting travel behaviour change to boost cycling
Action Description Priority Agency*
2.1.1 Conduct and support research on the barriers and motivations to cycling to inform program development and delivery.
Short TMR
2.1.2 Continue to implement TravelSmart initiatives. Existing TMR
2.1.3 Encourage the Australian Government to remove tax-related disincentives for cycling-related personal transport and establish incentives for work-related cycling purposes.
Long TMR
2.1.4 Encourage employers to promote themselves as cycle-friendly workplaces, based on the quality of their end-of-trip facilities, production of TravelSmart workplace travel plans and corporate participation in cycling events (for example, Ride to Work day).
Short TMR QH
2.1.5 Promote the opening of new cycling and walking facilities through events, maps, media and other effective measures to ensure they receive maximum use.
Existing LG TMR SRS
2.1.6 Undertake programs to encourage more people to cycle, such as bike pools for employees, buy-a-bike support programs, bicycle maintenance and Cycle Recycle days.
Long TMR
2.1.7 Encourage people to make more shopping trips by bicycle by preparing and disseminating information:a. for bicycle users on how to carry loads including the equipment neededb. for businesses on the economic benefits of catering for shoppers using bicycles and
encouraging cycling.
Short TMR
2.1.8 Promote the use of government agency bicycle fleets for individual business travel and for specific operational functions, such as traffic surveillance and incident management by:a. preparing guidelines on fleet management, rider training, insurance requirements and
Occupational Health and Safety requirementsb. coordinating the joint procurement of suitable bicycles.
Long State gover- nment agencies LG
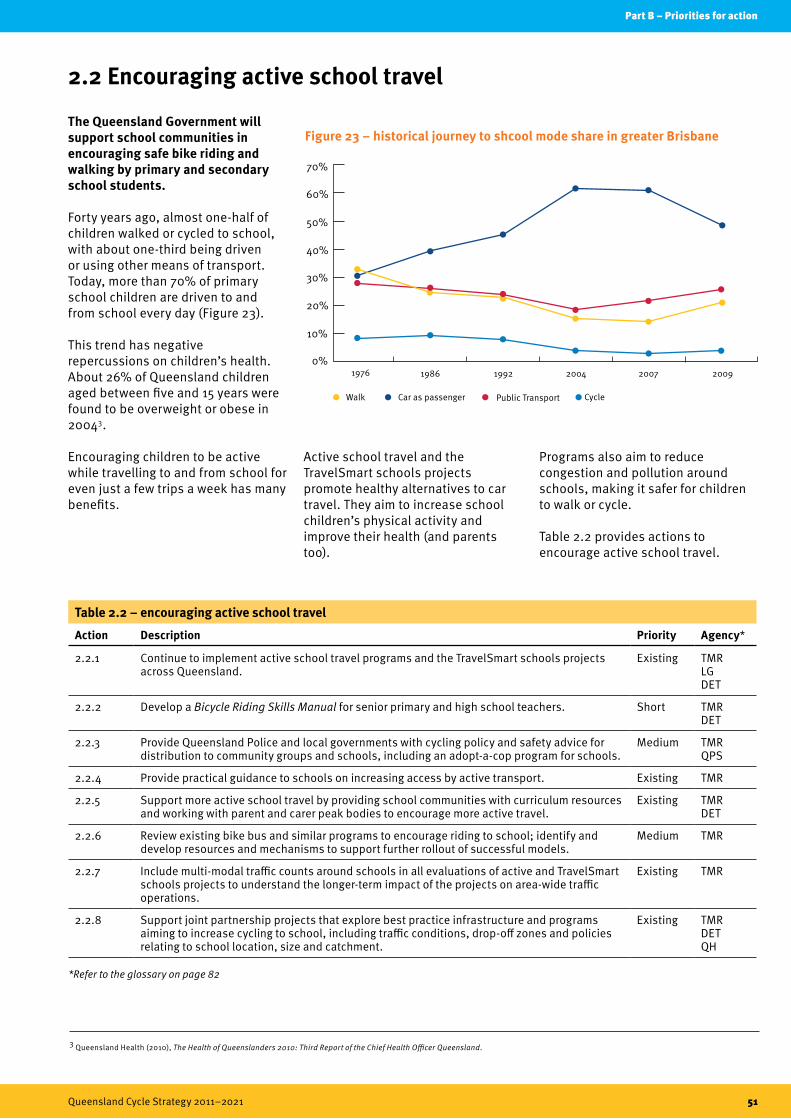
*Refer to the glossary on page 82
Part B – Priorities for action
Queensland Cycle Strategy 2011–2021 51
2.2 Encouraging active school travel
The Queensland Government will support school communities in encouraging safe bike riding and walking by primary and secondary school students.
Forty years ago, almost one-half of children walked or cycled to school, with about one-third being driven or using other means of transport. Today, more than 70% of primary school children are driven to and from school every day (Figure 23).
This trend has negative repercussions on children’s health. About 26% of Queensland children aged between five and 15 years were found to be overweight or obese in 20043.
Encouraging children to be active while travelling to and from school for even just a few trips a week has many benefits.
Active school travel and the TravelSmart schools projects promote healthy alternatives to car travel. They aim to increase school children’s physical activity and improve their health (and parents too).
Programs also aim to reduce congestion and pollution around schools, making it safer for children to walk or cycle.
Table 2.2 provides actions to encourage active school travel.
1976 1986 1992 2004 2007 2009
Walk Car as passenger Public Transport Cycle
0%
10%
20%
30%
40%
50%
60%
70%
Figure 23 – historical journey to shcool mode share in greater Brisbane
3 Queensland Health (2010), The Health of Queenslanders 2010: Third Report of the Chief Health Officer Queensland.
Table 2.2 – encouraging active school travel
Action Description Priority Agency*
2.2.1 Continue to implement active school travel programs and the TravelSmart schools projects across Queensland.
Existing TMR LG DET
2.2.2 Develop a Bicycle Riding Skills Manual for senior primary and high school teachers. Short TMR DET
2.2.3 Provide Queensland Police and local governments with cycling policy and safety advice for distribution to community groups and schools, including an adopt-a-cop program for schools.
Medium TMR QPS
2.2.4 Provide practical guidance to schools on increasing access by active transport. Existing TMR
2.2.5 Support more active school travel by providing school communities with curriculum resources and working with parent and carer peak bodies to encourage more active travel.
Existing TMR DET
2.2.6 Review existing bike bus and similar programs to encourage riding to school; identify and develop resources and mechanisms to support further rollout of successful models.
Medium TMR
2.2.7 Include multi-modal traffic counts around schools in all evaluations of active and TravelSmart schools projects to understand the longer-term impact of the projects on area-wide traffic operations.
Existing TMR
2.2.8 Support joint partnership projects that explore best practice infrastructure and programs aiming to increase cycling to school, including traffic conditions, drop-off zones and policies relating to school location, size and catchment.
Existing TMR DET QH

Part B – Priorities for action
52 Queensland Cycle Strategy 2011–2021
2.3 Providing information and wayfindingThe Queensland Government will promote best practice bicycle signage and maps.
‘Wayfinding’ refers to a cyclist’s ability to navigate through an area. It can include using signs, landmarks, maps and electronic devices to help orient the cyclist. Wayfinding signage is particularly important when people want to cycle through an unfamiliar area.
Good wayfinding schemes can also help remove clutter and visual obstructions on pathways.
Table 2.3 details actions for providing information and wayfinding.
Signage
Signage is a critical component used to legitimise and assist the many and varied trips cyclists make daily.
Cycle network signage can:
• show the legal status of a facility (like shared path signs)
• regulate safe use (stop, give way and parking signs)
• warn of potential hazards (steep descents, slippery when wet, road ahead signs)
• provide destination guidance for cyclists (cycle route directional and distance signs).
Maps
Unlike signage that is limited to showing directional details, maps display information such as gradient (for example, steep hills), shortcuts, detours, local services, facilities, landmarks and tourist attractions.
Maps showing existing cycle facilities are available at www.tmr.qld.gov.au/ cycling. Some local government websites also provide detailed cycling maps.
*Refer to the glossary on page 82
Table 2.3 – information and wayfinding
Action Description Priority Agency*
2.3.1 Build and maintain a comprehensive online source of Queensland Government bicycle information including:a. a bike route finding facility through websites, web-enabled mobile phones and GPS
devicesb. a cyclist feedback facility to share route ideas, and identify local opportunities for
shortcutsc. user-friendly instructions for creating and printing personalised cycle network mapsd. quality trails and route information for recreational and sport cyclinge. calculators that show how cycle trips contribute to daily physical activity, fuel cost
savings and greenhouse gas emissions reduction.
Medium TMR
2.3.2 Develop and distribute bicycle maps and route information for both on and off-road cycle routes in hard copy, electronic copy and interactive online formats.
Existing LG TMR DERM
2.3.3 Inform cyclists and public transport passengers about bicycle parking locations and policies about carriage of bicycles on public transport.
Existing TTAQueens- land RailBus operators
2.3.4 Prepare focal point maps for wayfinding signage on cycle networks (or use/adapt road-based focal point maps as appropriate). Ensure the maps allow for seamless signage across all levels of government.
Short TMR LG TTA
2.3.5 Apply the Transport and Main Roads signage guidelines in signage plans and strategies for new and existing cycling facilities, and incorporate relevant guide signs into the Manual of Uniform Traffic Control Devices.
Existing TMR LG
2.3.6 Install route signage on all new and existing bikeways that highlight the distance and typical duration of bike travel to key destinations, including public transport. Signage should also be provided to assist in wayfinding to next section of bikeway where bikeways are discontinuous.
Existing TMR LG
2.3.7 Install trail wayfinding signage on formalised mountain bike trails where considered necessary and appropriate.
Existing DERMDLGPSEQWaterLG
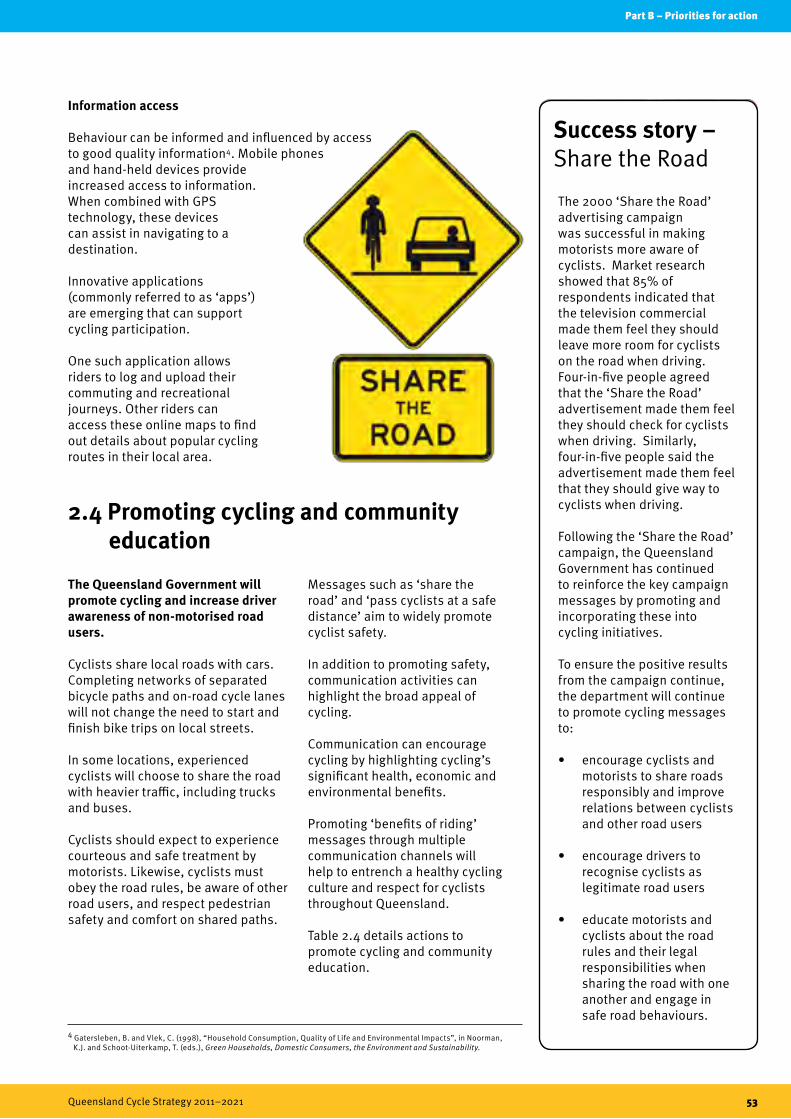
Part B – Priorities for action
Queensland Cycle Strategy 2011–2021 53
2.3 Providing information and wayfinding
4 Gatersleben, B. and Vlek, C. (1998), “Household Consumption, Quality of Life and Environmental Impacts”, in Noorman, K.J. and Schoot-Uiterkamp, T. (eds.), Green Households, Domestic Consumers, the Environment and Sustainability.
The 2000 ‘Share the Road’ advertising campaign was successful in making motorists more aware of cyclists. Market research showed that 85% of respondents indicated that the television commercial made them feel they should leave more room for cyclists on the road when driving. Four-in-five people agreed that the ‘Share the Road’ advertisement made them feel they should check for cyclists when driving. Similarly, four-in-five people said the advertisement made them feel that they should give way to cyclists when driving.
Following the ‘Share the Road’ campaign, the Queensland Government has continued to reinforce the key campaign messages by promoting and incorporating these into cycling initiatives.
To ensure the positive results from the campaign continue, the department will continue to promote cycling messages to:
• encourage cyclists and motorists to share roads responsibly and improve relations between cyclists and other road users
• encourage drivers to recognise cyclists as legitimate road users
• educate motorists and cyclists about the road rules and their legal responsibilities when sharing the road with one another and engage in safe road behaviours.
Success story – Share the Road
2.4 Promoting cycling and community education
The Queensland Government will promote cycling and increase driver awareness of non-motorised road users.
Cyclists share local roads with cars. Completing networks of separated bicycle paths and on-road cycle lanes will not change the need to start and finish bike trips on local streets.
In some locations, experienced cyclists will choose to share the road with heavier traffic, including trucks and buses.
Cyclists should expect to experience courteous and safe treatment by motorists. Likewise, cyclists must obey the road rules, be aware of other road users, and respect pedestrian safety and comfort on shared paths.
Messages such as ‘share the road’ and ‘pass cyclists at a safe distance’ aim to widely promote cyclist safety.
In addition to promoting safety, communication activities can highlight the broad appeal of cycling.
Communication can encourage cycling by highlighting cycling’s significant health, economic and environmental benefits.
Promoting ‘benefits of riding’ messages through multiple communication channels will help to entrench a healthy cycling culture and respect for cyclists throughout Queensland.
Table 2.4 details actions to promote cycling and community education.
Information access
Behaviour can be informed and influenced by access to good quality information4. Mobile phones and hand-held devices provide increased access to information. When combined with GPS technology, these devices can assist in navigating to a destination.
Innovative applications (commonly referred to as ‘apps’) are emerging that can support cycling participation.
One such application allows riders to log and upload their commuting and recreational journeys. Other riders can access these online maps to find out details about popular cycling routes in their local area.
Part B – Priorities for action
54 Queensland Cycle Strategy 2011–2021
In 2005, a small group of people in Bundaberg (calling themselves the ‘Mad Cycologists’) decided to share their love of cycling by organising a 20 kilometre community ride from Bundaberg to Burnett Heads.
The first ride attracted 140 riders with numbers increasing each year, peaking at 800 riders in 2009. It is the single largest community bike ride outside Brisbane. About one-fifth of participants came from outside the Bundaberg area, indicating keen interest for this kind of event.
The ride aims to provide a safe and enjoyable experience for people who are new to cycling. A big part of its success is that refreshment and water stops, ride marshals and other support features are available to encourage new and inexperienced cyclists.
Success story – City to Coast ride
Table 2.4 – community education and promotion
Action Description Priority Agency*
2.4.1 Continue to implement, evaluate and update regular ‘Share the Road’ activities to encourage mutual respect among road users, including:a. communication activities to promote cycling and educate drivers and cyclists on how to
interact safely on Queensland roads b. reinforcing cycling-related road rules, including initiatives directed at both cyclists and
drivers through communication activitiesc. promoting safe behaviour by cyclists and pedestrians on shared paths with signage,
information and pavement markings that reinforce give way requirementsd. liaising with transport industry associations, unions and operators to understand the
road-sharing needs of cyclists, trucks, buses and taxis and develop strategies to reduce conflicts.
Existing TMR
2.4.2 Regularly promote key information from the Road User Code of Behaviour for pedestrians, cyclists and motorists in media and events.
Existing TMR
2.4.3 Prepare promotional and educational resources for use by state and local government and bicycle user groups in regional areas to: a. promote cycling (should be designed to match a range of target audiences and types of
cycling) b. educate road users about new cycling treatments and their use (for example, green bike
lanes, hook turn storage boxes, shared left turn lanes)c. encourage drivers to ‘pass cyclists at a safe distance’d. promote the benefits of cycling for individuals and the community.
Existing TMR
2.4.4 Maintain a comprehensive cycling section on the department’s website covering all aspects of cycling policy, planning, promotion, projects and information for bicycle users.
Existing TMR
*Refer to the glossary on page 82
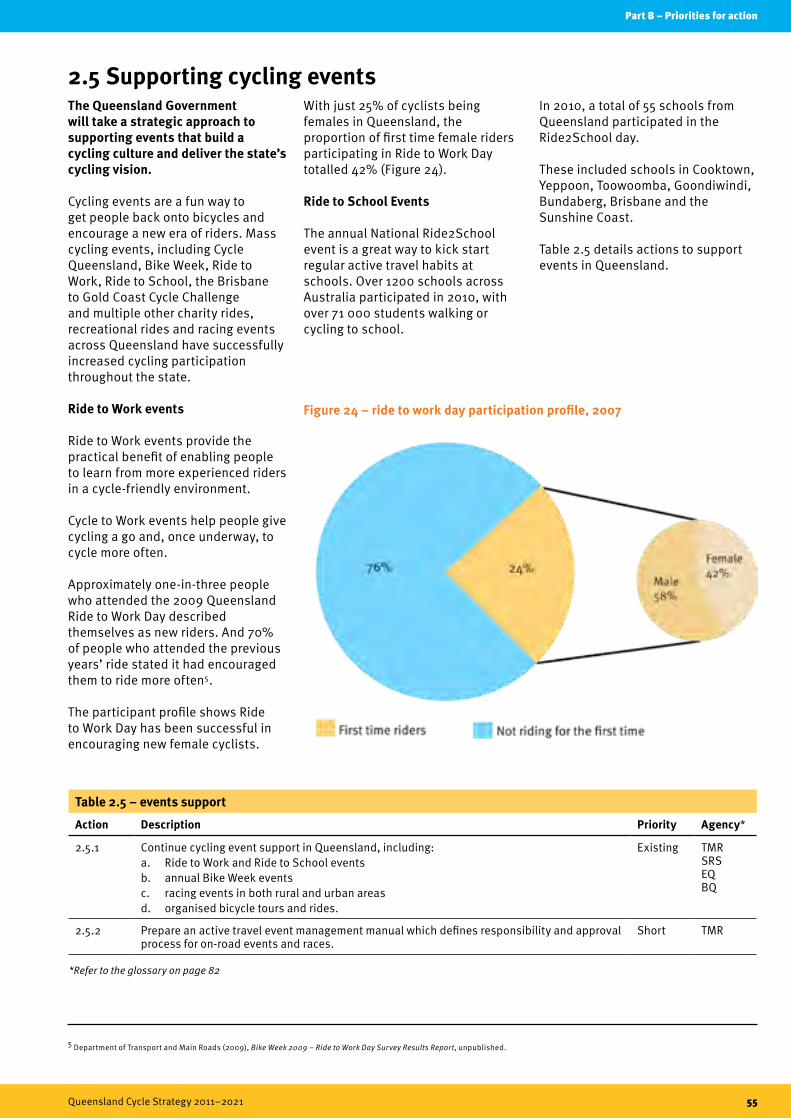
Part B – Priorities for action
Queensland Cycle Strategy 2011–2021 55
2.5 Supporting cycling eventsThe Queensland Government will take a strategic approach to supporting events that build a cycling culture and deliver the state’s cycling vision.
Cycling events are a fun way to get people back onto bicycles and encourage a new era of riders. Mass cycling events, including Cycle Queensland, Bike Week, Ride to Work, Ride to School, the Brisbane to Gold Coast Cycle Challenge and multiple other charity rides, recreational rides and racing events across Queensland have successfully increased cycling participation throughout the state.
Ride to Work events
Ride to Work events provide the practical benefit of enabling people to learn from more experienced riders in a cycle-friendly environment.
Cycle to Work events help people give cycling a go and, once underway, to cycle more often.
Approximately one-in-three people who attended the 2009 Queensland Ride to Work Day described themselves as new riders. And 70% of people who attended the previous years’ ride stated it had encouraged them to ride more often5.
The participant profile shows Ride to Work Day has been successful in encouraging new female cyclists.
With just 25% of cyclists being females in Queensland, the proportion of first time female riders participating in Ride to Work Day totalled 42% (Figure 24).
Ride to School Events
The annual National Ride2School event is a great way to kick start regular active travel habits at schools. Over 1200 schools across Australia participated in 2010, with over 71 000 students walking or cycling to school.
In 2010, a total of 55 schools from Queensland participated in the Ride2School day.
These included schools in Cooktown, Yeppoon, Toowoomba, Goondiwindi, Bundaberg, Brisbane and the Sunshine Coast.
Table 2.5 details actions to support events in Queensland.
Figure 24 – ride to work day participation profile, 2007
5 Department of Transport and Main Roads (2009), Bike Week 2009 – Ride to Work Day Survey Results Report, unpublished.
*Refer to the glossary on page 82
Table 2.5 – events support
Action Description Priority Agency*
2.5.1 Continue cycling event support in Queensland, including:a. Ride to Work and Ride to School eventsb. annual Bike Week events c. racing events in both rural and urban areasd. organised bicycle tours and rides.
Existing TMR SRS EQ BQ
2.5.2 Prepare an active travel event management manual which defines responsibility and approval process for on-road events and races.
Short TMR
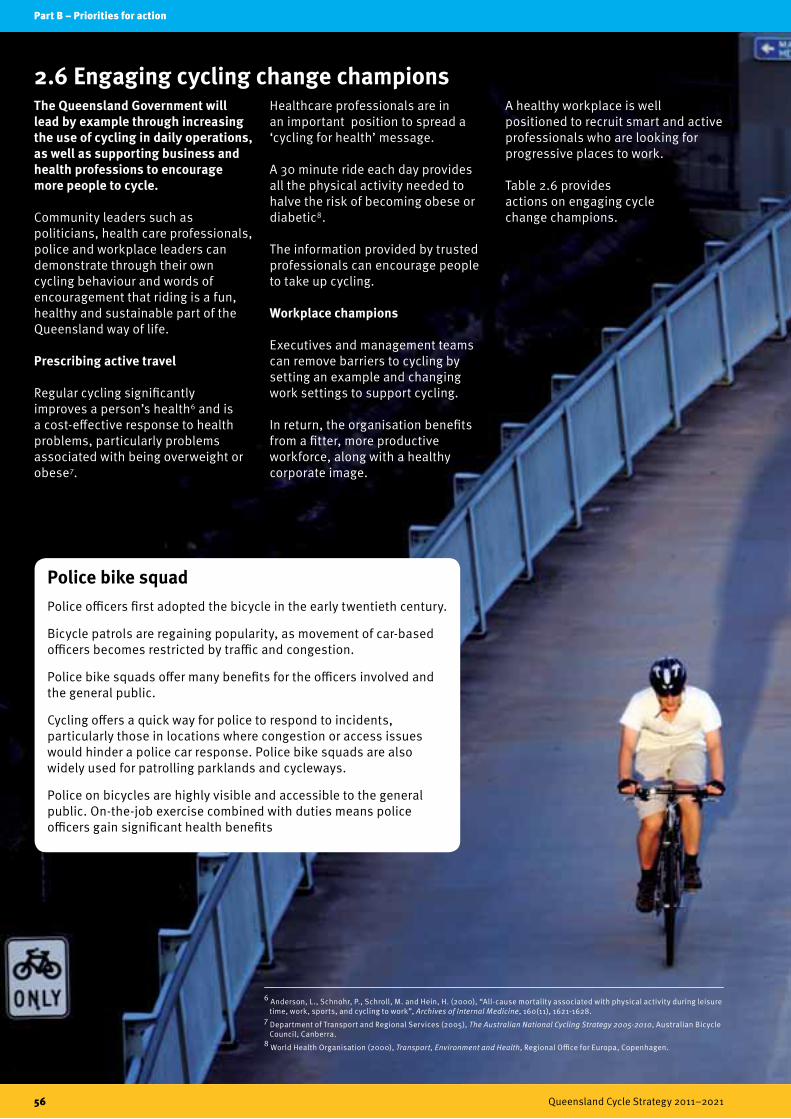
Part B – Priorities for action
56 Queensland Cycle Strategy 2011–2021
2.6 Engaging cycling change championsThe Queensland Government will lead by example through increasing the use of cycling in daily operations, as well as supporting business and health professions to encourage more people to cycle.
Community leaders such as politicians, health care professionals, police and workplace leaders can demonstrate through their own cycling behaviour and words of encouragement that riding is a fun, healthy and sustainable part of the Queensland way of life.
Prescribing active travel
Regular cycling significantly improves a person’s health6 and is a cost-effective response to health problems, particularly problems associated with being overweight or obese7.
Healthcare professionals are in an important position to spread a ‘cycling for health’ message.
A 30 minute ride each day provides all the physical activity needed to halve the risk of becoming obese or diabetic8.
The information provided by trusted professionals can encourage people to take up cycling.
Workplace champions
Executives and management teams can remove barriers to cycling by setting an example and changing work settings to support cycling.
In return, the organisation benefits from a fitter, more productive workforce, along with a healthy corporate image.
A healthy workplace is well positioned to recruit smart and active professionals who are looking for progressive places to work.
Table 2.6 provides actions on engaging cycle change champions.
6 Anderson, L., Schnohr, P., Schroll, M. and Hein, H. (2000), “All-cause mortality associated with physical activity during leisure time, work, sports, and cycling to work”, Archives of Internal Medicine, 160(11), 1621-1628.7 Department of Transport and Regional Services (2005), The Australian National Cycling Strategy 2005-2010, Australian Bicycle Council, Canberra.8 World Health Organisation (2000), Transport, Environment and Health, Regional Office for Europa, Copenhagen.
Police bike squadPolice officers first adopted the bicycle in the early twentieth century.
Bicycle patrols are regaining popularity, as movement of car-based officers becomes restricted by traffic and congestion.
Police bike squads offer many benefits for the officers involved and the general public.
Cycling offers a quick way for police to respond to incidents, particularly those in locations where congestion or access issues would hinder a police car response. Police bike squads are also widely used for patrolling parklands and cycleways.
Police on bicycles are highly visible and accessible to the general public. On-the-job exercise combined with duties means police officers gain significant health benefits
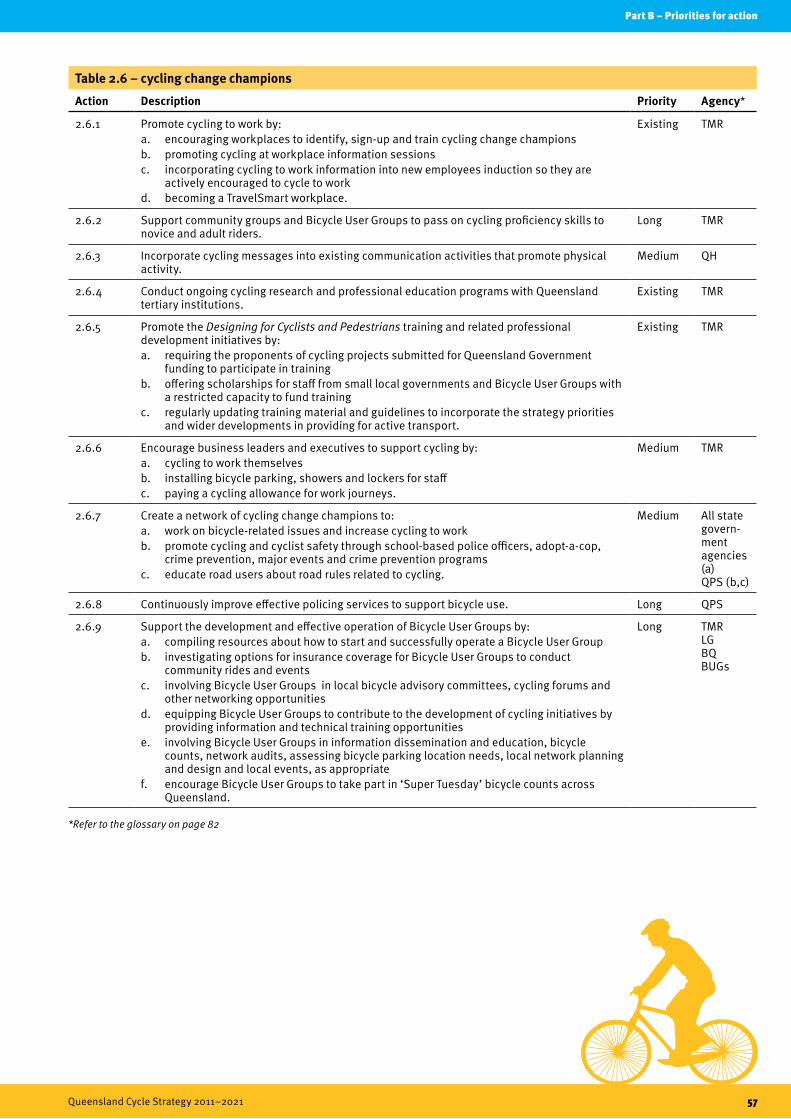
Part B – Priorities for action
Queensland Cycle Strategy 2011–2021 57
2.6 Engaging cycling change champions
*Refer to the glossary on page 82
Table 2.6 – cycling change champions
Action Description Priority Agency*
2.6.1 Promote cycling to work by:a. encouraging workplaces to identify, sign-up and train cycling change championsb. promoting cycling at workplace information sessions c. incorporating cycling to work information into new employees induction so they are
actively encouraged to cycle to workd. becoming a TravelSmart workplace.
Existing TMR
2.6.2 Support community groups and Bicycle User Groups to pass on cycling proficiency skills to novice and adult riders.
Long TMR
2.6.3 Incorporate cycling messages into existing communication activities that promote physical activity.
Medium QH
2.6.4 Conduct ongoing cycling research and professional education programs with Queensland tertiary institutions.
Existing TMR
2.6.5 Promote the Designing for Cyclists and Pedestrians training and related professional development initiatives by:a. requiring the proponents of cycling projects submitted for Queensland Government
funding to participate in trainingb. offering scholarships for staff from small local governments and Bicycle User Groups with
a restricted capacity to fund training c. regularly updating training material and guidelines to incorporate the strategy priorities
and wider developments in providing for active transport.
Existing TMR
2.6.6 Encourage business leaders and executives to support cycling by:a. cycling to work themselvesb. installing bicycle parking, showers and lockers for staffc. paying a cycling allowance for work journeys.
Medium TMR
2.6.7 Create a network of cycling change champions to: a. work on bicycle-related issues and increase cycling to workb. promote cycling and cyclist safety through school-based police officers, adopt-a-cop,
crime prevention, major events and crime prevention programs c. educate road users about road rules related to cycling.
Medium All state govern- ment agencies (a) QPS (b,c)
2.6.8 Continuously improve effective policing services to support bicycle use. Long QPS
2.6.9 Support the development and effective operation of Bicycle User Groups by:a. compiling resources about how to start and successfully operate a Bicycle User Groupb. investigating options for insurance coverage for Bicycle User Groups to conduct
community rides and eventsc. involving Bicycle User Groups in local bicycle advisory committees, cycling forums and
other networking opportunitiesd. equipping Bicycle User Groups to contribute to the development of cycling initiatives by
providing information and technical training opportunitiese. involving Bicycle User Groups in information dissemination and education, bicycle
counts, network audits, assessing bicycle parking location needs, local network planning and design and local events, as appropriate
f. encourage Bicycle User Groups to take part in ‘Super Tuesday’ bicycle counts across Queensland.
Long TMR LG BQ BUGs
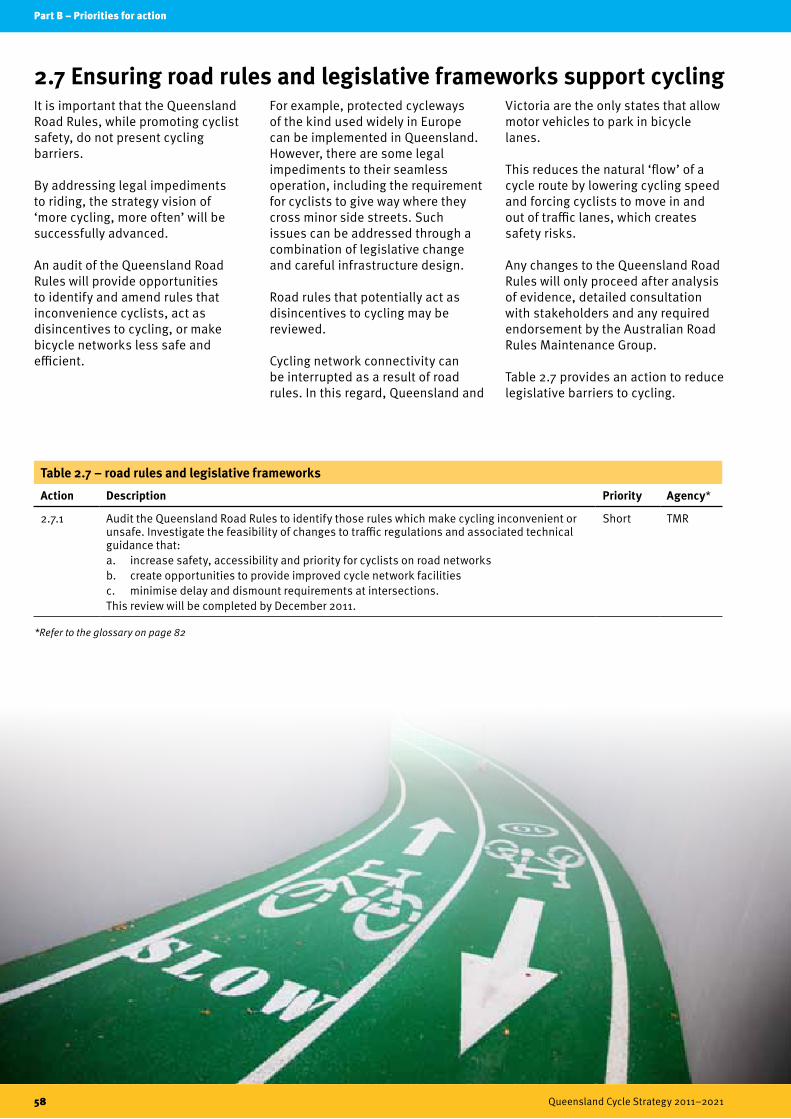
Part B – Priorities for action
58 Queensland Cycle Strategy 2011–2021
2.7 Ensuring road rules and legislative frameworks support cyclingIt is important that the Queensland Road Rules, while promoting cyclist safety, do not present cycling barriers.
By addressing legal impediments to riding, the strategy vision of ‘more cycling, more often’ will be successfully advanced.
An audit of the Queensland Road Rules will provide opportunities to identify and amend rules that inconvenience cyclists, act as disincentives to cycling, or make bicycle networks less safe and efficient.
For example, protected cycleways of the kind used widely in Europe can be implemented in Queensland. However, there are some legal impediments to their seamless operation, including the requirement for cyclists to give way where they cross minor side streets. Such issues can be addressed through a combination of legislative change and careful infrastructure design.
Road rules that potentially act as disincentives to cycling may be reviewed.
Cycling network connectivity can be interrupted as a result of road rules. In this regard, Queensland and
Victoria are the only states that allow motor vehicles to park in bicycle lanes.
This reduces the natural ‘flow’ of a cycle route by lowering cycling speed and forcing cyclists to move in and out of traffic lanes, which creates safety risks.
Any changes to the Queensland Road Rules will only proceed after analysis of evidence, detailed consultation with stakeholders and any required endorsement by the Australian Road Rules Maintenance Group.
Table 2.7 provides an action to reduce legislative barriers to cycling.
*Refer to the glossary on page 82
Table 2.7 – road rules and legislative frameworks
Action Description Priority Agency*
2.7.1 Audit the Queensland Road Rules to identify those rules which make cycling inconvenient or unsafe. Investigate the feasibility of changes to traffic regulations and associated technical guidance that:a. increase safety, accessibility and priority for cyclists on road networks b. create opportunities to provide improved cycle network facilitiesc. minimise delay and dismount requirements at intersections.This review will be completed by December 2011.
Short TMR

Signature project twoBicycle education
The Queensland Government will work with other stakeholders to pilot and deliver a nationally-accredited bicycle education program suitable for children and adults.
What is bicycle education?
Bicycle education and training programs assist people to learn cycling skills in a supportive setting, with a strong focus on teaching people to ride safely. Courses are structured to meet the needs of beginners through to more experienced riders. Participants progress to learning more advanced skills once they have achieved the overall outcomes and milestones of the previous level. Accredited trainers are responsible for assessing rider competencies and adjusting training sessions to meet individual requirements. Quality training gives people the knowledge and skills needed to cycle confidently and safely in groups, traffic and other riding environments.
Bicycle education and safety
Surveys of Queensland cyclists tell us that about one-quarter of cycling injuries are a result of falling off a bicycle. About one-third are due to crashing into an object on a road or path, or skidding.
A further 15% are due to colliding with a motor vehicle, and 11% are due to collisions with another bicycle or a pedestrian9. These results suggest that many cycling injuries can be attributed to lack of cycling skills, risky cycling behaviour and poor bicycle maintenance. Increasing cycling skills and encouraging safe cycling behaviours and bicycle maintenance are essential for reducing cycling injuries. These measures can be delivered through quality bicycle education training10.
Bicycle education for children
Obesity and climate change are two of the biggest challenges facing our state. Encouraging children to use their bikes more often can help address these challenges. However, the number of children being driven to school by parents or carers has increased significantly over the past three decades. Bicycle education is an essential component of any efforts to reverse this unsustainable trend. By providing professionally delivered cycle training, parents can gain confidence in allowing their children to ride to school. Children benefit from gaining a sense of freedom and increased social opportunities and independence that is lost by being driven to school.
Bicycle education for adults
Bicycle education should be available to Queenslanders of all ages. Bicycle education is not just for children. Adults who are new cyclists or returning to cycling also need quality training support. The same outcomes for bike control and handling are expected from adults and children, but different teaching principles are involved.
Targeted training will help adults on their way to cycle more often for more trips.
A national approach to bicycle education
For bicycle education to be successful, the Queensland Government recognises the need for a national standard to encourage consistency in best practice delivery. A number of organisations currently provide bicycle education in Australia, including Police Citizens Youth Clubs and AusCycle. For example, AusCycle has been identified in the New South Wales Bike Plan as a key supplier of cycling education within Australia. AusCycle is a joint venture between the Amy Gillett Foundation and Cycling Australia. This training program is the result of over a decade of research, which identified a strong need to develop a national training approach. Established in 2008 to deliver high quality cycling training by accredited teachers, AusCycle aims to encourage people of all ages to ride more often, more confidently and more safely.
9 Heesch, Kristiann and Garrard, Jan and Sahlqvist, Shannon (2010), What factors are associated with cyclists getting injured? Correlates of cyclist injuries in Queensland. In: 2010 Australasian Road Safety Research, Policing and Education Conference, 31 August – 3 September 2010, National Convention Centre, Canberra.10 Heesch et al, 2010; and CARRS-Q (2008), “Bicycle Safety”, State of the Road: A fact sheet of the Centre for Accident Research and Road Safety – Queensland, www.carrsq.qut.edu.au, accessed on 7 February 2011.
2.7 Ensuring road rules and legislative frameworks support cycling
SP 2.1 Pilot and deliver nationally-accredited bicycle education programs suitable for children and adults.
SP 2.2 Develop and maintain resources to inform and support schools, parents and carers when teaching children to ride.
Part B – Priorities for action
Queensland Cycle Strategy 2011–2021 59
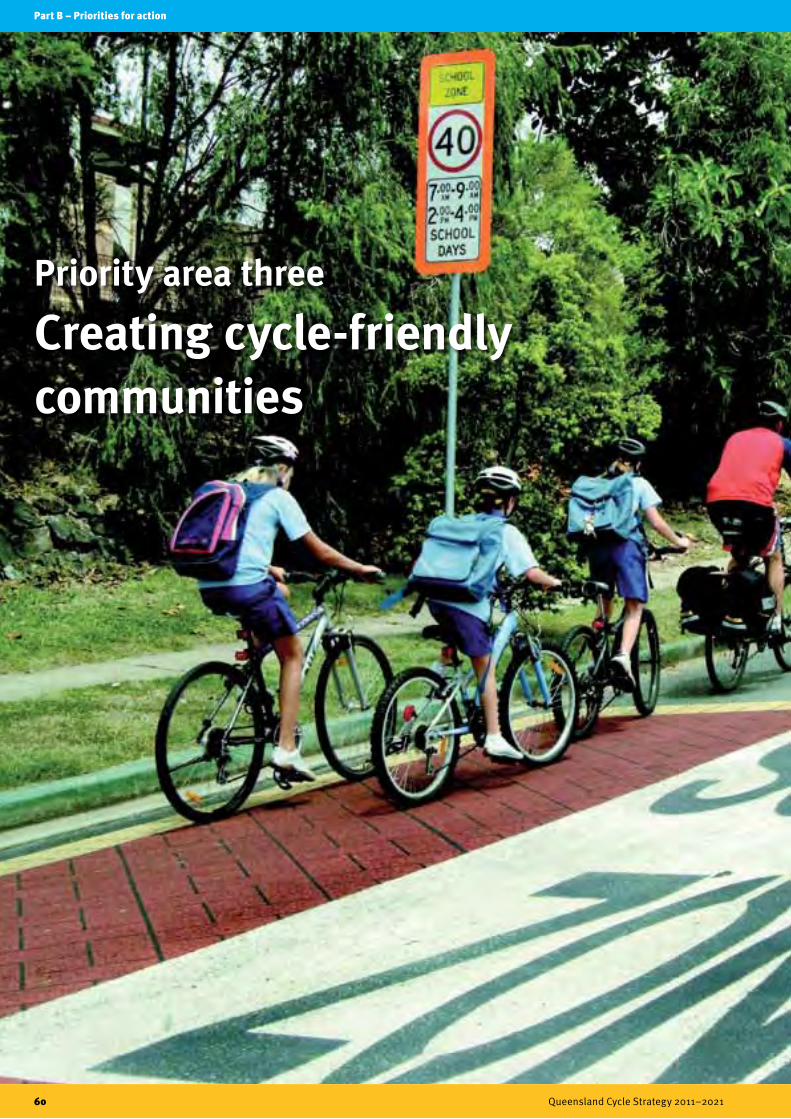
Part B – Priorities for action
60 Queensland Cycle Strategy 2011–2021
Priority area three
Creating cycle-friendly communities
Cycling offers many of the benefits of car use – reliability, the flexibility to leave when you want and the convenience of door-to-door travel – with the added benefits of being affordable, healthy and environmentally friendly.
When new communities and suburbs are designed to be ‘cycleable’ and ‘walkable’, the community as a whole can reduce its reliance on car travel.
Studies looking at how built environment characteristics are linked to physical activity (walking and cycling) have found:
• residents with a variety of destinations in close proximity walk and cycle more
• there is more walking and cycling in areas with higher residential densities
• high traffic volumes and unsafe routes discourage physical activity, particularly for children
• children travel more by active modes of transport in communities that have footpaths leading to schools
• residents are more physically active in communities with pedestrian and bicycle-friendly infrastructure to destinations of interest11.
The action tables in the following section include an implementation priority. The intended timeframes are:
• Short: 2011 – 2013
• Medium: 2014 – 2017
• Long: 2018 – 2021
• Existing: current action.
Part B – Priorities for action
Queensland Cycle Strategy 2011–2021 61
3.1 Integrating cycling into planning and developmentThe Queensland Government, in partnership with local government, will plan cycle-friendly places and promote cycle-friendly communities.
The shape and characteristics of our neighbourhoods is a key factor in supporting a cycling culture.
Planning to locate residential areas and community activities (such as schools, shops and workplaces) close together and adjacent to bikeways makes it more likely that people will cycle.
Developers increasingly recognise that planning for and delivering quality walking and cycling facilities can make communities more appealing for active transport.
11 Medibank Private (October 2008), The cost of physical inactivity, http://www.medibank.com.au/Client/Documents/Pdfs/The_Cost_Of_Physical_Inactivity_08.pdf, accessed on 18 June 2011
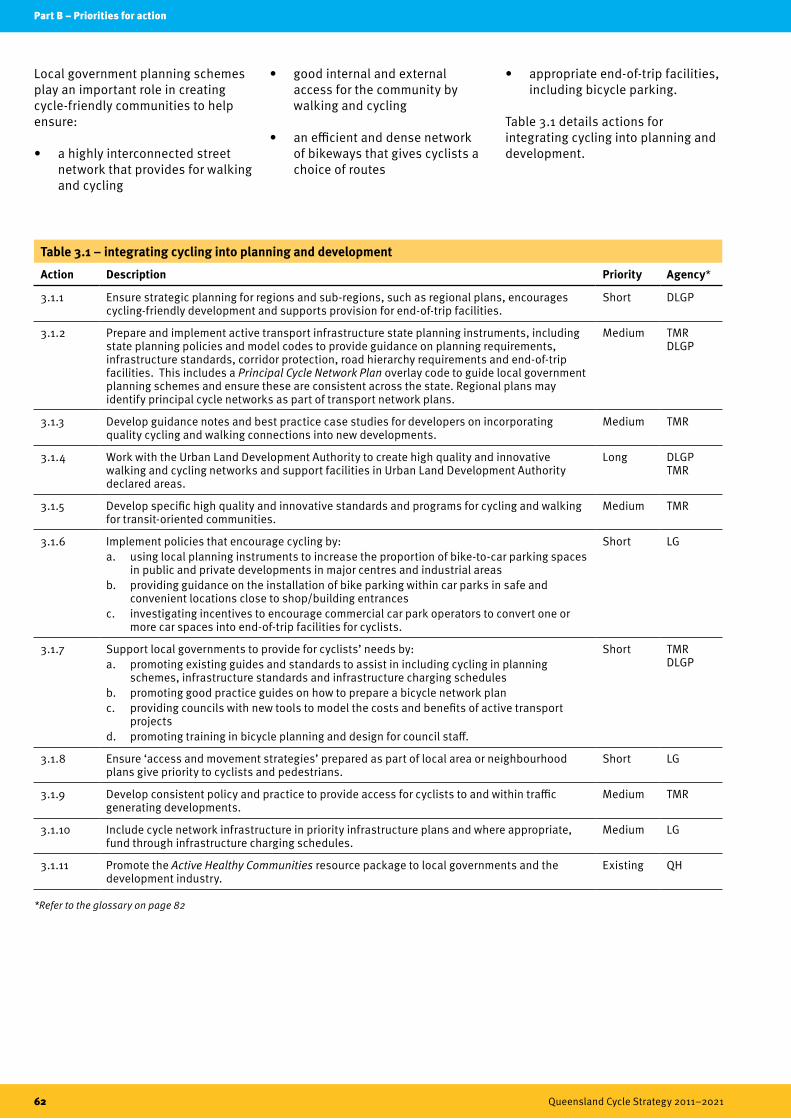
Part B – Priorities for action
62 Queensland Cycle Strategy 2011–2021
Local government planning schemes play an important role in creating cycle-friendly communities to help ensure:
• a highly interconnected street network that provides for walking and cycling
• good internal and external access for the community by walking and cycling
• an efficient and dense network of bikeways that gives cyclists a choice of routes
• appropriate end-of-trip facilities, including bicycle parking.
Table 3.1 details actions for integrating cycling into planning and development.
*Refer to the glossary on page 82
Table 3.1 – integrating cycling into planning and development
Action Description Priority Agency*
3.1.1 Ensure strategic planning for regions and sub-regions, such as regional plans, encourages cycling-friendly development and supports provision for end-of-trip facilities.
Short DLGP
3.1.2 Prepare and implement active transport infrastructure state planning instruments, including state planning policies and model codes to provide guidance on planning requirements, infrastructure standards, corridor protection, road hierarchy requirements and end-of-trip facilities. This includes a Principal Cycle Network Plan overlay code to guide local government planning schemes and ensure these are consistent across the state. Regional plans may identify principal cycle networks as part of transport network plans.
Medium TMR DLGP
3.1.3 Develop guidance notes and best practice case studies for developers on incorporating quality cycling and walking connections into new developments.
Medium TMR
3.1.4 Work with the Urban Land Development Authority to create high quality and innovative walking and cycling networks and support facilities in Urban Land Development Authority declared areas.
Long DLGP TMR
3.1.5 Develop specific high quality and innovative standards and programs for cycling and walking for transit-oriented communities.
Medium TMR
3.1.6 Implement policies that encourage cycling by:a. using local planning instruments to increase the proportion of bike-to-car parking spaces
in public and private developments in major centres and industrial areasb. providing guidance on the installation of bike parking within car parks in safe and
convenient locations close to shop/building entrancesc. investigating incentives to encourage commercial car park operators to convert one or
more car spaces into end-of-trip facilities for cyclists.
Short LG
3.1.7 Support local governments to provide for cyclists’ needs by:a. promoting existing guides and standards to assist in including cycling in planning
schemes, infrastructure standards and infrastructure charging schedulesb. promoting good practice guides on how to prepare a bicycle network planc. providing councils with new tools to model the costs and benefits of active transport
projectsd. promoting training in bicycle planning and design for council staff.
Short TMR DLGP
3.1.8 Ensure ‘access and movement strategies’ prepared as part of local area or neighbourhood plans give priority to cyclists and pedestrians.
Short LG
3.1.9 Develop consistent policy and practice to provide access for cyclists to and within traffic generating developments.
Medium TMR
3.1.10 Include cycle network infrastructure in priority infrastructure plans and where appropriate, fund through infrastructure charging schedules.
Medium LG
3.1.11 Promote the Active Healthy Communities resource package to local governments and the development industry.
Existing QH
Part B – Priorities for action
Queensland Cycle Strategy 2011–2021 63
Part B – Priorities for action
Queensland Cycle Strategy 2011–2021 63

Part B – Priorities for action
64 Queensland Cycle Strategy 2011–2021
3.2 Including end-of-trip facilities in developmentThe Queensland Government will promote the installation and use of end-of-trip facilities at major destinations.
End-of-trip facilities must be well designed, thoughtfully located and promoted to regular and casual users.
A high standard of end-of-trip facilities should be provided at workplaces to encourage employees to walk and cycle to work. These can be used by people walking to work or those who wish to exercise before work or during breaks.
Providing secure bicycle parking at schools and universities will also promote more cycling.
Bicycle parking can also be provided at cafes, shopping complexes, convenience stores, restaurants, movie theatres, pools, gyms and businesses frequented by short-term visitors. This will encourage people to make shorter trips by bicycle.
Queensland Development Code
Mandatory end-of-trip facilities are now required for all new major developments or major additions to development in designated local governments. Major developments include office buildings, shopping centres, universities and hospitals with a floor area greater than 2000 square metres.
End-of-trip facilities include secure bike racks, lockers and change rooms where staff can shower, change and secure their belongings before starting work.
These mandatory requirements will encourage people to use alternative means of transport and promote a healthy, more active population. Building owners and tenants can expect benefits, including a healthier workforce, increased staff wellbeing, higher productivity, an improved corporate image and reduced demand for car parking.
Table 3.2 provides actions for end-of-trip facilities.
The Queensland Government is leading the way in providing end-of-trip facilities. TransLink Transit Authority and Queensland Health have adopted good practice end-of-trip policies which are delivering popular facilities. The private sector is also showing initiative in new workplaces.
End-of-trip facilities and public transport
End-of-trip facilities are being included in new stations and major station upgrades.
TransLink Transit Authority and Queensland Rail now have a standard bicycle enclosure which includes personal lockers for storing helmets and equipment. These are installed at Burpengary, Bray Park, Bald Hills and Ormiston stations.
Royal Brisbane and Women’s Hospital Cycle Centre, Brisbane
The Royal Brisbane and Women’s Hospital Cycle Centre opened in 2009 offering cyclists, joggers and pedestrians a state-of-the-art end-of-trip facility.
Built in partnership between the Department of Transport and Main Roads, Northern Busway Alliance and Queensland Health, the project was the result of rigorous research into facilities available in the area and forecast demand.
The centre promotes healthy living and active travel and is built to an ecologically sustainable design standard. Artwork on the side of the building promotes cycling and walking to passing traffic. Open 24 hours, it includes parking for 750 bicycles, showers, lockers, clothes drying rooms, ironing facilities, hair dryers, towel service and a dry cleaning service.
In February 2011, the centre had 409 members and growing.
Workplace end-of-trip facilities
The HQ commercial development in Fortitude Valley, Brisbane, has incorporated a centre with facilities for 266 bicycles, lockers, showers, change facilities and towel service.
In addition to the cycle centre, there is a café in the foyer and racks for visitor parking provided outside in covered bays.
The inclusion of the cycle centre helped to achieve a six star rating from the Green Building Council of Australia, as well as promoting healthy lifestyles for the building’s staff.
Success stories

Part B – Priorities for action
Queensland Cycle Strategy 2011–2021 65
*Refer to the glossary on page 82
Table 3.2 – end-of-trip facilities
Action Description Priority Agency*
3.2.1 Prepare guidelines and codes to support best practice provision of end-of-trip and other active transport facilities for cyclists and pedestrians into new developments.
Existing DLGP TMR
3.2.2 Provide end-of-trip facilities for cycling and walking in new and upgraded public transport stations in south-east Queensland and regional centres. In higher demand locations, provide an over-supply of bicycle storage and actively promote this to increase use.
Existing TTA TMR LG
3.2.3 As part of strategies to achieve ‘Green Star’ sustainability ratings for development, encourage the installation and use of high-standard bicycle parking and shower facilities:a. in existing and new developmentsb. at facilities shared and supported by partnerships of adjacent businesses in regional and
major centresc. tertiary education establishments.
Medium TMR LG
3.2.4 Require state agencies to offer high-standard access for cyclists as both employees and clients, by:a. updating design guidelines to require provision of bicycle parking, showers and change
facilities in all government buildings, developments and large-scale relocationsb. defining and requiring good practice presentation of bicycle access information on
agency websites and bicycle network mapsc. encouraging active transport choices through TravelSmart workplace travel plans for
government agencies.
Existing DPW TMR
3.2.5 Ensure bicycle parking is available at schools by: a. providing up-to-date guidance to school communities on designing and locating bicycle
parkingb. providing secure bicycle parking in all new Queensland schools c. funding bicycle parking in existing schools through the Safe Walking and Pedalling
Program.
Existing TMR DET
3.2.6 Trial installation of publicly accessible cycle centres (parking, showers, lockers) in regional activity centres and investigate ways to allow public access to government and private end-of-trip facilities where cycle centres are not available.
Medium TMR LG
3.2.7 Ensure the provision of good practice end-of-trip facilities is included in planning schemes to complement the requirements of the Queensland Development Code.
Short LG
3.2.8 Enhance and promote initiatives to prevent bicycle theft and recover stolen bicycles, including:a. annual monitoring of bicycle theft rates and hot spotsb. promoting bicycle engraving to cyclistsc. informing cyclists on how to prevent theftd. informing bicycle parking providers on appropriate locations and quality of facilities.
Medium QPS
3.2.9 Provide convenient, safe and visible on-street bicycle parking in activity centres and other locations.
Short LG
3.2.10 Investigate ways for businesses to retrofit existing buildings with end-of-trip facilities. Medium DLGP
3.2.11 Provide secure bicycle parking at rural school bus stops where a need is identified in local cycle network strategies or plans.
Medium LG
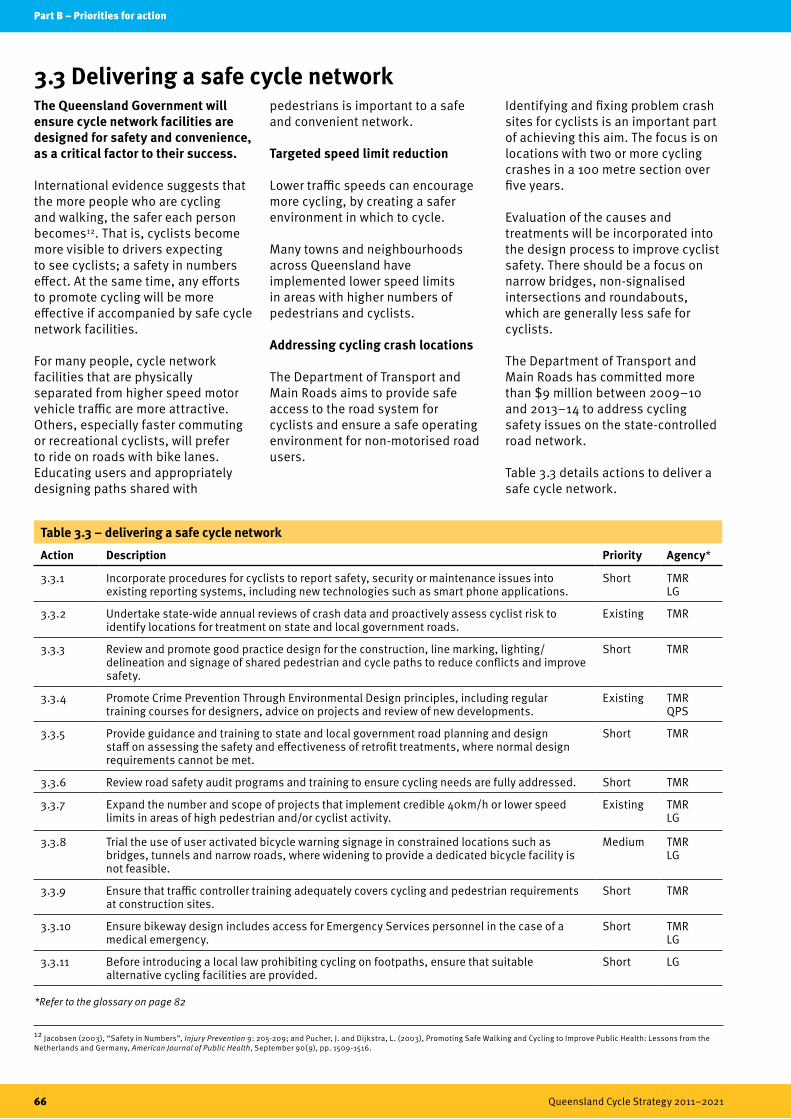
Part B – Priorities for action
66 Queensland Cycle Strategy 2011–2021
3.3 Delivering a safe cycle network The Queensland Government will ensure cycle network facilities are designed for safety and convenience, as a critical factor to their success.
International evidence suggests that the more people who are cycling and walking, the safer each person becomes12. That is, cyclists become more visible to drivers expecting to see cyclists; a safety in numbers effect. At the same time, any efforts to promote cycling will be more effective if accompanied by safe cycle network facilities.
For many people, cycle network facilities that are physically separated from higher speed motor vehicle traffic are more attractive. Others, especially faster commuting or recreational cyclists, will prefer to ride on roads with bike lanes. Educating users and appropriately designing paths shared with
pedestrians is important to a safe and convenient network.
Targeted speed limit reduction
Lower traffic speeds can encourage more cycling, by creating a safer environment in which to cycle.
Many towns and neighbourhoods across Queensland have implemented lower speed limits in areas with higher numbers of pedestrians and cyclists.
Addressing cycling crash locations
The Department of Transport and Main Roads aims to provide safe access to the road system for cyclists and ensure a safe operating environment for non-motorised road users.
Identifying and fixing problem crash sites for cyclists is an important part of achieving this aim. The focus is on locations with two or more cycling crashes in a 100 metre section over five years.
Evaluation of the causes and treatments will be incorporated into the design process to improve cyclist safety. There should be a focus on narrow bridges, non-signalised intersections and roundabouts, which are generally less safe for cyclists.
The Department of Transport and Main Roads has committed more than $9 million between 2009–10 and 2013–14 to address cycling safety issues on the state-controlled road network.
Table 3.3 details actions to deliver a safe cycle network.
12 Jacobsen (2003), “Safety in Numbers”, Injury Prevention 9: 205-209; and Pucher, J. and Dijkstra, L. (2003), Promoting Safe Walking and Cycling to Improve Public Health: Lessons from the Netherlands and Germany, American Journal of Public Health, September 90(9), pp. 1509-1516.
*Refer to the glossary on page 82
Table 3.3 – delivering a safe cycle network
Action Description Priority Agency*
3.3.1 Incorporate procedures for cyclists to report safety, security or maintenance issues into existing reporting systems, including new technologies such as smart phone applications.
Short TMR LG
3.3.2 Undertake state-wide annual reviews of crash data and proactively assess cyclist risk to identify locations for treatment on state and local government roads.
Existing TMR
3.3.3 Review and promote good practice design for the construction, line marking, lighting/ delineation and signage of shared pedestrian and cycle paths to reduce conflicts and improve safety.
Short TMR
3.3.4 Promote Crime Prevention Through Environmental Design principles, including regular training courses for designers, advice on projects and review of new developments.
Existing TMR QPS
3.3.5 Provide guidance and training to state and local government road planning and design staff on assessing the safety and effectiveness of retrofit treatments, where normal design requirements cannot be met.
Short TMR
3.3.6 Review road safety audit programs and training to ensure cycling needs are fully addressed. Short TMR
3.3.7 Expand the number and scope of projects that implement credible 40km/h or lower speed limits in areas of high pedestrian and/or cyclist activity.
Existing TMR LG
3.3.8 Trial the use of user activated bicycle warning signage in constrained locations such as bridges, tunnels and narrow roads, where widening to provide a dedicated bicycle facility is not feasible.
Medium TMR LG
3.3.9 Ensure that traffic controller training adequately covers cycling and pedestrian requirements at construction sites.
Short TMR
3.3.10 Ensure bikeway design includes access for Emergency Services personnel in the case of a medical emergency.
Short TMR LG
3.3.11 Before introducing a local law prohibiting cycling on footpaths, ensure that suitable alternative cycling facilities are provided.
Short LG

Part B – Priorities for action
Queensland Cycle Strategy 2011–2021 67
Signature project threeActive towns
Active towns programs focus infrastructure provision and encouragement intensively in a small number of communities with the aim of rapidly increasing cycling and walking.
The Queensland Government will pilot an active town program in three communities in partnership with local governments and the bicycle industry.
The pilot will provide an opportunity to assess the outcomes of best practice cycling infrastructure and promotion. There is no set recipe for what will lead to success. What will be important is having a good understanding of local needs and conditions.
Active town programs could include:
• cycle and walking network construction
• cycle centres/end-of-trip facilities/bicycle parking
• bicycle education
• travel behaviour change programs cycling and walking champions
• bike week events
• ride/walk to work days
• ride/walk to school days.
Active town candidates must demonstrate that a range of community destinations (business, schools, retail) are within easy riding or walking distance from large residential population centres. They will require political support, and a commitment to sustained investment in infrastructure and promotion measures.
The success of the active town program will depend on local government integration of walking and cycling with other strategies, policies, program and activities. This encompasses areas of land use, maintenance, capital works, parking and vehicle access. A partnership approach between state agencies and local government is needed to coordinate delivery of existing programs into the active town program.
In 2005, Cycling England launched a Cycling Demonstration Towns program to encourage more cycling through infrastructure provision, promotion and travel behaviour change programs.
In the first phase of the program, from 2005 to 2008, six towns received funding to significantly increase cycling levels.
Evaluation of the program found:
• an average increase of 27% in cycling across all six towns
• the increase resulted from more people starting to cycle, or returning to cycling (not just cyclists using their bikes for more trips)
• cycling to school has more than doubled in towns that invested the most in initiatives to support children riding to school
• cycling investment generated town-wide increases in physical activity
• the health benefits were calculated at around £2.50 for every £1 spent
• investment in cycling returns at least 3:1
• other benefits are realised, including reduced congestion and pollution.
Success story – cycling demonstration towns in the United Kingdom
SP 3.1 Pilot active towns programs in association with relevant state government agencies, local government and the bicycle industry. Evaluate outcomes and, if results are positive, expand to other towns and cities as funding becomes available.
Part B – Priorities for action
68 Queensland Cycle Strategy 2011–2021
Priority area four
Developing a cycling economy

The direct economic benefits of cycling are significant for Queensland. Cycling creates jobs in retail, repair and service, event management, building infrastructure, planning and tourism.
Promoting the health, recreation, sport and tourism benefits of cycling also significantly expands the appeal of cycling.
With the appropriate strategies in place, more people cycling more often, for transport, recreation and sport will mean more jobs.
Cyclists currently save the economy $63.9 million per year in reduced congestion costs and $9.3 million in greenhouse gas emissions13.
The economic benefit of commuter cycling is $144.3 million per year14.
In 2008, Medibank Private estimated the total economic cost of physical inactivity to the Australian economy to be $13.8 billion each year15.
The action tables in the following section include an implementation priority. The intended timeframes are:
• Short: 2011 – 2013
• Medium: 2014 – 2017
• Long: 2018 – 2021
• Existing: current action.
Mountain biking
Queensland offers a range of environments and opportunities for mountain biking, with events around the state to cater for every taste.
The largest events have a marathon format, with 500 to 1000 competitors cycling for 50 to 100 kilometres off-road.
Some well-known events include:
• Flight Centre Cycle Epic from Toowoomba to Grandchester with over 1000 riders each year
• Noosa Enduro through the Noosa Trail Network and local forests
• Cairns Rural, Rainforest, Reef – a long-distance event finishing at Port Douglas
• Croc Trophy in far north Queensland, a multi-day event that attracts international competitors.
Part B – Priorities for action
Queensland Cycle Strategy 2011–2021 69
13 Bauman A., Rissel C., Garrard J., Ker I., Speidel R. and Fishman E., 2008 Cycling: Getting Australia Moving: Barriers, facilitators and interventions to get more Australians physically active through cycling, Cycling Promotion Fund, Melbourne.14 Bauman A., Rissel C., Garrard J., Ker I., Speidel R. and Fishman E., 2008 Cycling: Getting Australia Moving: Barriers, facilitators and interventions to get more Australians physically active through cycling, Cycling Promotion Fund, Melbourne.15Medibank Private (October 2008), The cost of physical inactivity, http://www.medibank.com.au/Client/Documents/Pdfs/The_Cost_Of_Physical_Inactivity_08.pdf, accessed on 18 June 2011.
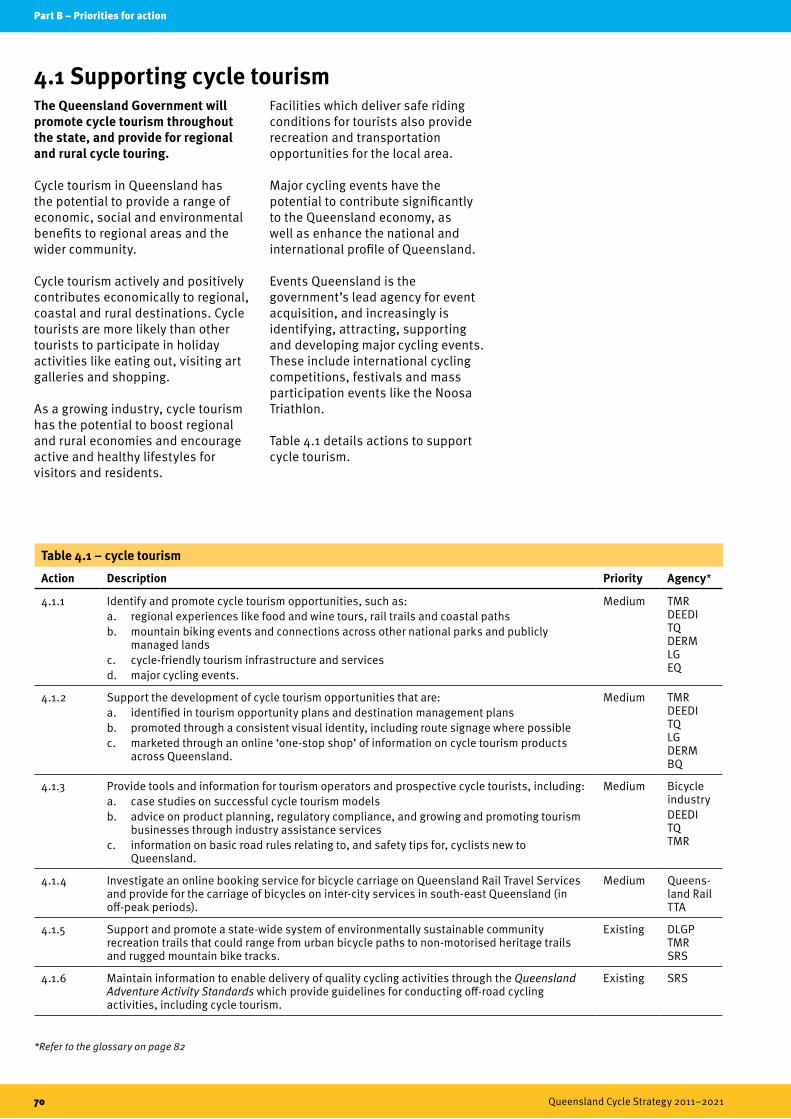
Part B – Priorities for action
70 Queensland Cycle Strategy 2011–2021
4.1 Supporting cycle tourismThe Queensland Government will promote cycle tourism throughout the state, and provide for regional and rural cycle touring.
Cycle tourism in Queensland has the potential to provide a range of economic, social and environmental benefits to regional areas and the wider community.
Cycle tourism actively and positively contributes economically to regional, coastal and rural destinations. Cycle tourists are more likely than other tourists to participate in holiday activities like eating out, visiting art galleries and shopping.
As a growing industry, cycle tourism has the potential to boost regional and rural economies and encourage active and healthy lifestyles for visitors and residents.
Facilities which deliver safe riding conditions for tourists also provide recreation and transportation opportunities for the local area.
Major cycling events have the potential to contribute significantly to the Queensland economy, as well as enhance the national and international profile of Queensland.
Events Queensland is the government’s lead agency for event acquisition, and increasingly is identifying, attracting, supporting and developing major cycling events. These include international cycling competitions, festivals and mass participation events like the Noosa Triathlon.
Table 4.1 details actions to support cycle tourism.
*Refer to the glossary on page 82
Table 4.1 – cycle tourism
Action Description Priority Agency*
4.1.1 Identify and promote cycle tourism opportunities, such as:a. regional experiences like food and wine tours, rail trails and coastal pathsb. mountain biking events and connections across other national parks and publicly
managed landsc. cycle-friendly tourism infrastructure and servicesd. major cycling events.
Medium TMR DEEDI TQ DERM LG EQ
4.1.2 Support the development of cycle tourism opportunities that are:a. identified in tourism opportunity plans and destination management plansb. promoted through a consistent visual identity, including route signage where possible c. marketed through an online ‘one-stop shop’ of information on cycle tourism products
across Queensland.
Medium TMR DEEDI TQ LG DERM BQ
4.1.3 Provide tools and information for tourism operators and prospective cycle tourists, including:a. case studies on successful cycle tourism modelsb. advice on product planning, regulatory compliance, and growing and promoting tourism
businesses through industry assistance servicesc. information on basic road rules relating to, and safety tips for, cyclists new to
Queensland.
Medium Bicycle industryDEEDI TQ TMR
4.1.4 Investigate an online booking service for bicycle carriage on Queensland Rail Travel Services and provide for the carriage of bicycles on inter-city services in south-east Queensland (in off-peak periods).
Medium Queens- land Rail TTA
4.1.5 Support and promote a state-wide system of environmentally sustainable community recreation trails that could range from urban bicycle paths to non-motorised heritage trails and rugged mountain bike tracks.
Existing DLGP TMR SRS
4.1.6 Maintain information to enable delivery of quality cycling activities through the Queensland Adventure Activity Standards which provide guidelines for conducting off-road cycling activities, including cycle tourism.
Existing SRS
Part B – Priorities for action
Queensland Cycle Strategy 2011–2021 71
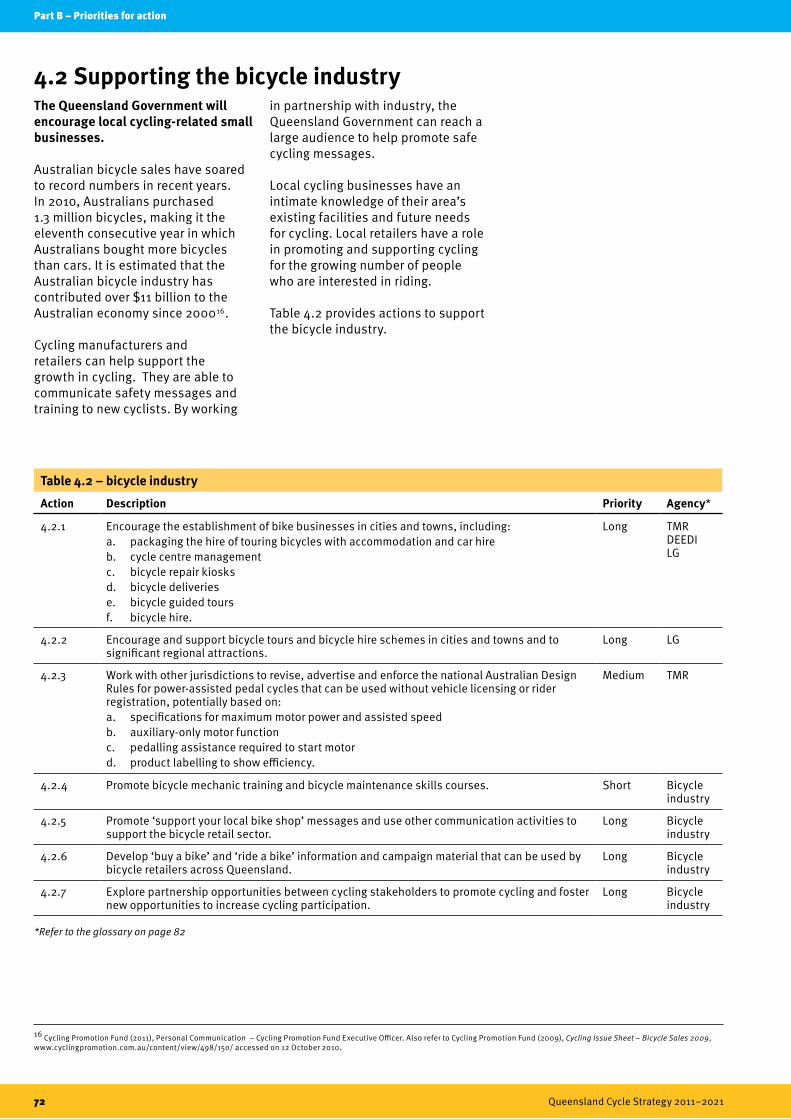
Part B – Priorities for action
72 Queensland Cycle Strategy 2011–2021
4.2 Supporting the bicycle industryThe Queensland Government will encourage local cycling-related small businesses.
Australian bicycle sales have soared to record numbers in recent years. In 2010, Australians purchased 1.3 million bicycles, making it the eleventh consecutive year in which Australians bought more bicycles than cars. It is estimated that the Australian bicycle industry has contributed over $11 billion to the Australian economy since 200016.
Cycling manufacturers and retailers can help support the growth in cycling. They are able to communicate safety messages and training to new cyclists. By working
in partnership with industry, the Queensland Government can reach a large audience to help promote safe cycling messages.
Local cycling businesses have an intimate knowledge of their area’s existing facilities and future needs for cycling. Local retailers have a role in promoting and supporting cycling for the growing number of people who are interested in riding.
Table 4.2 provides actions to support the bicycle industry.
16 Cycling Promotion Fund (2011), Personal Communication – Cycling Promotion Fund Executive Officer. Also refer to Cycling Promotion Fund (2009), Cycling Issue Sheet – Bicycle Sales 2009, www.cyclingpromotion.com.au/content/view/498/150/ accessed on 12 October 2010.
*Refer to the glossary on page 82
Table 4.2 – bicycle industry
Action Description Priority Agency*
4.2.1 Encourage the establishment of bike businesses in cities and towns, including:a. packaging the hire of touring bicycles with accommodation and car hireb. cycle centre managementc. bicycle repair kiosksd. bicycle deliveries e. bicycle guided tours f. bicycle hire.
Long TMR DEEDI LG
4.2.2 Encourage and support bicycle tours and bicycle hire schemes in cities and towns and to significant regional attractions.
Long LG
4.2.3 Work with other jurisdictions to revise, advertise and enforce the national Australian Design Rules for power-assisted pedal cycles that can be used without vehicle licensing or rider registration, potentially based on:a. specifications for maximum motor power and assisted speedb. auxiliary-only motor functionc. pedalling assistance required to start motord. product labelling to show efficiency.
Medium TMR
4.2.4 Promote bicycle mechanic training and bicycle maintenance skills courses. Short Bicycle industry
4.2.5 Promote ‘support your local bike shop’ messages and use other communication activities to support the bicycle retail sector.
Long Bicycle industry
4.2.6 Develop ‘buy a bike’ and ‘ride a bike’ information and campaign material that can be used by bicycle retailers across Queensland.
Long Bicycle industry
4.2.7 Explore partnership opportunities between cycling stakeholders to promote cycling and foster new opportunities to increase cycling participation.
Long Bicycle industry

Part B – Priorities for action
Queensland Cycle Strategy 2011–2021 73
4.2 Supporting the bicycle industry
17 Australian Sports Commission (2006 & 2009), Participation in Exercise, Recreation and Sport: Annual Report, Canberra.
The Queensland Government will encourage the development of cycling for sport and recreation.
Cycling for sport and recreation is growing in popularity. In 2009, 10.6% of Queenslanders aged 15 years and older cycled for sport or recreation, up from 8.7% in 200617.
The strong performance of Australians in high-profile cycling events has contributed to a growing interest in cycling. This is in addition to the variety of cycling events which allow people to be involved and challenge themselves.
BMX, mountain biking (cross country, orienteering and adventure racing), Audax, bicycle trials, cycle touring, bicycle polo, kick biking, road
riding, triathlons, and elite racing on road and tracks are all showing an increasingly strong following.
Australia hosts and competes in national and international events. Many of these sports also encourage participation of juniors and families.
Australia has world champions in road racing and mountain biking.
The Queensland Academy of Sport fosters the champions of tomorrow. The Queensland Academy of Sport cycling program focuses on developing Queensland cyclists to the level of national representation. The program incorporates track and road cyclists and mountain bikers. Continuing to support this is valuable to the Queensland community,
whether for sport or recreation.
Providing purpose-built facilities, allowing access to suitable areas for riding, and supporting the development of various cycling styles can help to maintain a vibrant and competitive sport and recreation sector. Management strategies exist to guide the use of public owned land for recreation, such as the Recreation Management Framework by SEQWater.
Charity bike rides help raise the profile of sport and recreational riding. Cycle events can encourage tourists to the area where the event is held.
Table 4.3 provides actions to support recreation and sports cycling.
4.3 Supporting recreation and sports cycling
*Refer to the glossary on page 82
Table 4.3 – delivering a safe cycle network
Action Description Priority Agency*
4.3.1 Administer funding programs that support eligible sporting and recreational cycling clubs or organisations to encourage participation.
Existing SRS
4.3.2 Promote safe on-road riding practices by training and racing cyclists, including a Code of Conduct prepared in consultation with key stakeholders.
Long TMR
4.3.3 Support the development of mountain biking opportunities through:a. providing a range of trails and recreational facilities, where appropriate, to facilitate
opportunities for mountain bike access to and through designated public lands, including National Parks, State Forests, local government reserves, water storages and other Crown land
b. promoting the development and use of sustainable mountain bike trails in suitable locations to encourage community participation
c. recognising and supporting the role of private landholders to provide trails and opportunities for mountain bike events and general recreational use
d. adopting and implementing International Mountain Bike Association (IMBA) standards for mountain bike trail classification, signage and trail features where appropriate. Collaborate with IMBA (Australia) and other relevant stakeholders on the development of alternative standards, as required.
Medium DERMLGDLGPSEQ WaterSRS
4.3.4 Support sport cycling through the provision of funding to the Queensland Academy of Sport for a cycling and triathlon high-performance program.
Existing SRS
4.3.5 Support the peak sport cycling body in Queensland through the provision of assessed funding assistance.
Existing SRS
4.3.6 Maintain an international standard BMX Facility, as part of Brisbane’s Sleeman sports complex.
Existing Stadiums Qld
4.3.7 Support cycling-related projects, individuals or groups through a range of funding programs, including:a. Sport and Recreation Infrastructure Programb. Young Athlete Assistance Programc. Sport and Recreational Active Inclusion Program.
Existing SRS
4.3.8 Provide information to assist private landowners to make their land available for cycling and mountain biking-related events and activities.
Existing SRS
4.3.9 Administer an event sponsorship program where sporting and recreational cycling events are eligible.
Existing SRS

Part B – Priorities for action
74 Queensland Cycle Strategy 2011–2021
Signature project fourRecreation trails
The Queensland Government will implement recreation trails and coastal pathways throughout the state, expanding on the SEQ Active Trails Strategy and the Queensland Greenspace Strategy.
Recreation trails are a great, and relatively low-cost way to provide outdoor recreation opportunities and encourage more recreational cycling. As more people gain confidence in riding for recreation, they may then consider cycling for other trip purposes.
Access to quality recreation trails improves the health and vitality of local communities. Getting more people active contributes to reducing the high levels of obesity among Queenslanders. Recreation trails help to reach the Toward Q2 vision to create a green and healthy Queensland. They must demonstrate how the state government, through Growth Management Queensland, is protecting more land for public recreation and delivering sustainable outcomes for Queenslanders.
Protecting linear corridors for future trail and commuter pathways can play a complementary role in the delivery and vision of the Queensland Cycle Strategy 2011–2021.
Recreation trails in Queensland
The Queensland Government is investing $8.8 million over five years to develop three new regional recreation trails – the Brisbane Valley Rail Trail, Maroochy River Trail and the Boonah to Ipswich Trail. An additional $4 million over 10 years is available to the Tablelands Regional Council to develop a rail trail from Mareeba to Atherton. As well, $1.1 million will be invested to develop the disused rail corridor at Yeppoon into a commuter pathway.
These recreation trails will provide opportunities for residents and visitors to explore and experience some of Queensland’s most scenic landscapes. Connections to recreation trails closer to activity centres also act as the principal cycle network and promote cycling for a wider range of trips.
Delivery of similar trails across Queensland will help to get more people active through walking, cycling and horse riding, and contribute to the economic vitality of local areas.
Benefits of recreation trails
Recreation trails deliver recreation, social and health benefits to users as well as adjacent coastal, rural and residential communities. Trails offer excellent recreation opportunities to families, bicycle tourists, mountain bike riders, historical enthusiasts, horse riders and walkers.
They also offer potential to establish native wildlife corridors and contribute to environmental conservation.
74 Queensland Cycle Strategy 2011-=–2021
Part B – Priorities for action
SP 4.1 Develop and deliver recreation trails and coastal pathways through partnerships with local governments and communities to support local economies and increase recreational cycling opportunities.

Part B – Priorities for action
Queensland Cycle Strategy 2011–2021 75
Signature project fourRecreation trails
Boonah to Ipswich Trail
The Boonah to Ipswich Trail will be a 68 kilometre, multi-use, non-motorised recreation trail connecting the communities of Ipswich and Boonah. The trail will also connect the 40 kilometre network of multi-use and single-use recreation trails developed as part of the Wyaralong Dam precinct and Ipswich City Council’s Flinders Goolman Conservation Estate. This includes Hardings Paddock Picnic and Flinders Plum Picnic areas.
The Boonah to Ipswich Trail will provide outdoor recreation opportunities for current and future populations of south-east Queensland, particularly the communities of:
• greater Ipswich and the Western Corridor
• Ripley Valley
• southern Logan City
• Boonah
• Beaudesert
• proposed urban centres of Greenbank Central, New Beith and Flagstone.
By current estimates, in 2026 these neighbouring communities will have a combined population of approximately 640 000.
What is a rail trail?
A rail trail is a recreation trail that uses a disused rail line.
There are over 30 established rail trails in Australia, the majority of which are in Victoria. In Queensland, the Fernvale to Lowood Rail Trail and the Linville to Blackbutt Rail Trail have been open for a number of years. Both trails will become part of the Brisbane Valley Rail Trail. Over 100 kilometres of the Brisbane Valley Rail Trail is open to the public. When completed, the Brisbane Valley rail trail will be 161 kilometres long and extend from Wulkaraka to Yarraman – the longest rail trail in Australia.
Why are they popular?
Rail trails are popular because they are:
• often accessible from large population centres
• close to existing or easily developed tourism infrastructure in or near townships along the rail trail – places to eat, explore and stay
• a car-free facility for people to walk or ride bicycles in safety to school and the shops, or just to enjoy the scenery
• a pleasant experience even in hilly country because trains, like walkers and cyclists are not partial to steep gradients
• a long continuous natural heritage corridor.
In the USA, a comprehensive health economics study showed every US$1.00 invested in recreational trails for physical activity yielded a direct medical benefit of US$2.9418.
Many of the disused rail lines in Australia are in country areas, providing unprecedented access to and through some spectacular scenery and bushland, along with associated personal and community benefits. In local communities, opportunities to provide refreshments, meals, accommodation and camping supplies have the potential to bring significant economic benefits to communities along the trail.
In this way, trails provide a significant economic benefit to local communities.
The Murray to the Mountains Rail Trail in north-eastern Victoria is one of the better known rail trails in Australia. Recent studies on this trail found that average expenditure was $258 per person per day19.
The average expenditure on the Otago Central Rail Trail (a well known rail trail in the Otago region of New Zealand’s South Island) is NZ$92.80 per person per day, with an average length of stay of 3.8 days. Over 200 employment opportunities have been created from this project20.
Rail trails are a valuable tourism attraction, especially when marketed well. Trails can help instil a conservation ethic among users and educate users about the attributes of an area, especially when good interpretation is a feature of the trail.
18 Wang, G., Maccera, C.A., Scudder-Soucie, B., Schmid, T., Pratt, M. and Buchner, D. (2005), “A cost-benefit analysis of physical activity using bike/pedestrian trails”, Health Promotion Practice, April 6 (2): 174-79.19 Beeton, S. (2006), Regional Communities and Cycling: The case of the Murray to the Mountains Rail Trail, Victoria, Australia, Latrobe University, Australia, 17.20 Otago Central Rail Trail Trust (2005), The Otago Central Rail Trail Means Business Survey, November.

Part B – Priorities for action
76 Queensland Cycle Strategy 2011–2021
Recreation trails in Queensland
There are many disused rail corridors in Queensland. Like coastal and other trails, rail trails offer opportunities to enjoy Queensland’s natural spaces. All provide the opportunity to be developed into recreation trails and commuter pathways. A number of disused rail corridors have been identified as providing opportunities for rail trails.
The top five rail trail opportunities are:
• Atherton Tablelands Rail Trail – 34 kilometres
• Bethania to Beaudesert Rail Trail – 42 kilometres
• Extension of the Brisbane Valley Rail Trail from Blackbutt to Yarraman – 19 kilometres
• Caboolture to Wamuran Rail Trail – 11.2 kilometres
• Kingaroy to Theebine Rail Trail – 132 kilometres.
Atherton Tablelands Rail Trail
The Queensland Government has made available $4 million over 10 years to the Tablelands Regional Council to develop a rail trail from Mareeba to Atherton. Consideration will be given to developing the Atherton to Tolga corridor as a commuting route with an asphalt surface and the Atherton to Ravenshoe corridor as a rail trail.
Bethania to Beaudesert Rail Trail
The disused Bethania to Beaudesert Rail Corridor is identified as a possible rail trail, with sections developed as bikeways where it crosses developed areas. The rail trail within the Logan City Council area is 32 kilometres.
This proposed rail trail will provide a valuable recreational and commuting link for locals and a great attraction for visitors from Brisbane and beyond. Trip destinations include educational facilities, shopping
centres and recreational facilities, and these are easily accessed by public transport.
A feasibility report found about 33 000 locals could use the track each year, plus 20 000 day-trippers and 1500 overnight visitors. It is estimated that users would provide about $843 000 in economic benefits to surrounding areas each year.
Brisbane Valley Rail Trail
The 19 kilometre extension of the Brisbane Valley Rail Trail from Blackbutt to Yarraman will provide 161 kilometres of recreation trail, connecting the urban centres of Wulkaraka to Blackbutt. This trail already provides 100 kilometres of trail allowing walkers, touring cyclists and horse riders to experience the history and landscape of the Brisbane Valley and South Burnett regions.
The trail follows the old Brisbane Valley railway line along the western side of the Brisbane River and will traverse farming landscapes, native and plantation forests, rural residential areas and country towns. The Brisbane Valley Rail Trail is well located to service the growing population of the western corridor. The growth of this region is directed by the South East Queensland Regional Plan.
Cyclists, walkers and horse riders will be catered for by a range of services, accommodation and facilities in towns along the trail. Due for completion in 2012, it will be one of the longest rail trails in Australia.
Caboolture to Wamuran Rail Trail
The 11 kilometre rail corridor has not been used regularly for 15 years, some rail infrastructure still remains. Much of the steel track, the ballast and all three bridges remain. Using the corridor as a rail trail and commuter pathway is an opportunity to connect the urban centre of Caboolture with schools, communities and business along the corridor.
Kingaroy to Theebine Rail Trail
The Kingaroy to Theebine railway line was officially closed in early 2010.
The Kingaroy to Theebine Rail Trail can connect the Brassall Bikeway, Brisbane Valley Rail Trail and the Bicentennial National Trail. Developing this rail corridor into a rail trail would deliver a continuous recreation trail over 350 kilometres in length. It would also connect the communities of Ipswich to the Sunshine Coast, with a trail traversing the regional and rural communities of Somerset and South Burnett.
The significant economic contribution to the local communities through linking these recreation trails are highlighted in the South East Queensland Country Tourism Plan.

Part C
Implementation
Queensland Cycle Strategy 2011–2021 77
Part C – Implementation
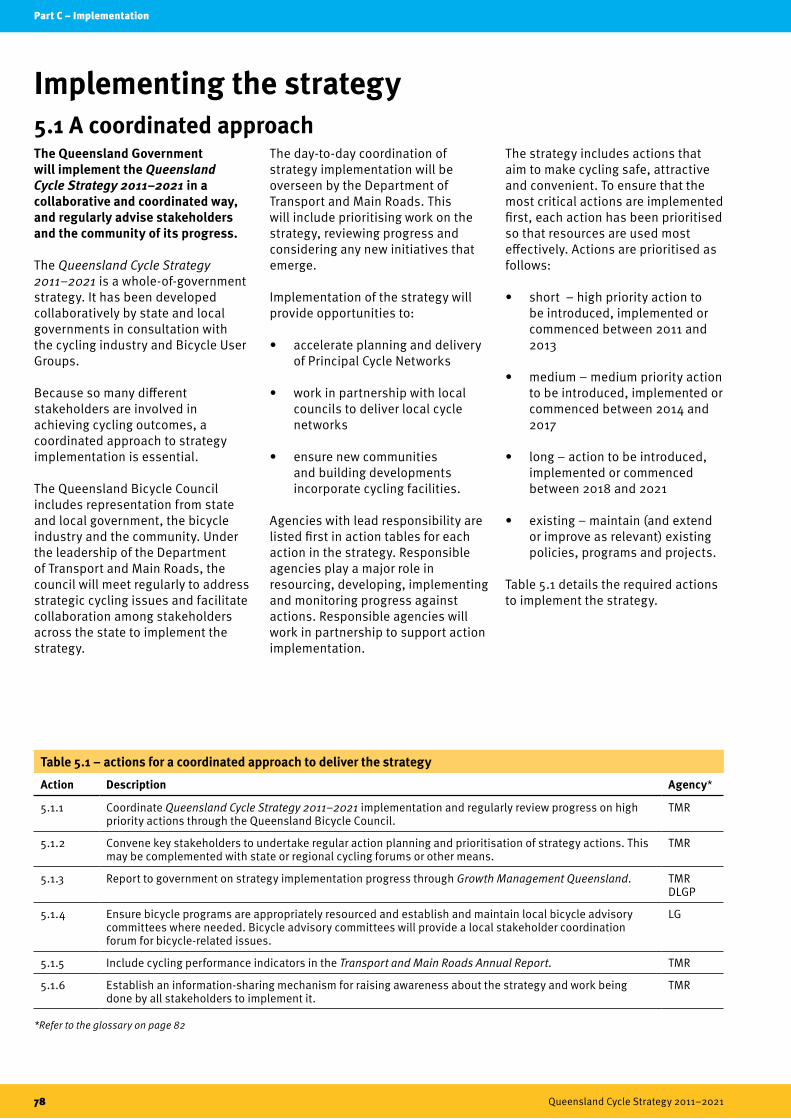
Part C – Implementation
78 Queensland Cycle Strategy 2011–2021
5.1 A coordinated approachThe Queensland Government will implement the Queensland Cycle Strategy 2011–2021 in a collaborative and coordinated way, and regularly advise stakeholders and the community of its progress.
The Queensland Cycle Strategy 2011–2021 is a whole-of-government strategy. It has been developed collaboratively by state and local governments in consultation with the cycling industry and Bicycle User Groups.
Because so many different stakeholders are involved in achieving cycling outcomes, a coordinated approach to strategy implementation is essential.
The Queensland Bicycle Council includes representation from state and local government, the bicycle industry and the community. Under the leadership of the Department of Transport and Main Roads, the council will meet regularly to address strategic cycling issues and facilitate collaboration among stakeholders across the state to implement the strategy.
The day-to-day coordination of strategy implementation will be overseen by the Department of Transport and Main Roads. This will include prioritising work on the strategy, reviewing progress and considering any new initiatives that emerge.
Implementation of the strategy will provide opportunities to:
• accelerate planning and delivery of Principal Cycle Networks
• work in partnership with local councils to deliver local cycle networks
• ensure new communities and building developments incorporate cycling facilities.
Agencies with lead responsibility are listed first in action tables for each action in the strategy. Responsible agencies play a major role in resourcing, developing, implementing and monitoring progress against actions. Responsible agencies will work in partnership to support action implementation.
The strategy includes actions that aim to make cycling safe, attractive and convenient. To ensure that the most critical actions are implemented first, each action has been prioritised so that resources are used most effectively. Actions are prioritised as follows:
• short – high priority action to be introduced, implemented or commenced between 2011 and 2013
• medium – medium priority action to be introduced, implemented or commenced between 2014 and 2017
• long – action to be introduced, implemented or commenced between 2018 and 2021
• existing – maintain (and extend or improve as relevant) existing policies, programs and projects.
Table 5.1 details the required actions to implement the strategy.
Implementing the strategy
*Refer to the glossary on page 82
Table 5.1 – actions for a coordinated approach to deliver the strategy
Action Description Agency*
5.1.1 Coordinate Queensland Cycle Strategy 2011–2021 implementation and regularly review progress on high priority actions through the Queensland Bicycle Council.
TMR
5.1.2 Convene key stakeholders to undertake regular action planning and prioritisation of strategy actions. This may be complemented with state or regional cycling forums or other means.
TMR
5.1.3 Report to government on strategy implementation progress through Growth Management Queensland. TMR DLGP
5.1.4 Ensure bicycle programs are appropriately resourced and establish and maintain local bicycle advisory committees where needed. Bicycle advisory committees will provide a local stakeholder coordination forum for bicycle-related issues.
LG
5.1.5 Include cycling performance indicators in the Transport and Main Roads Annual Report. TMR
5.1.6 Establish an information-sharing mechanism for raising awareness about the strategy and work being done by all stakeholders to implement it.
TMR
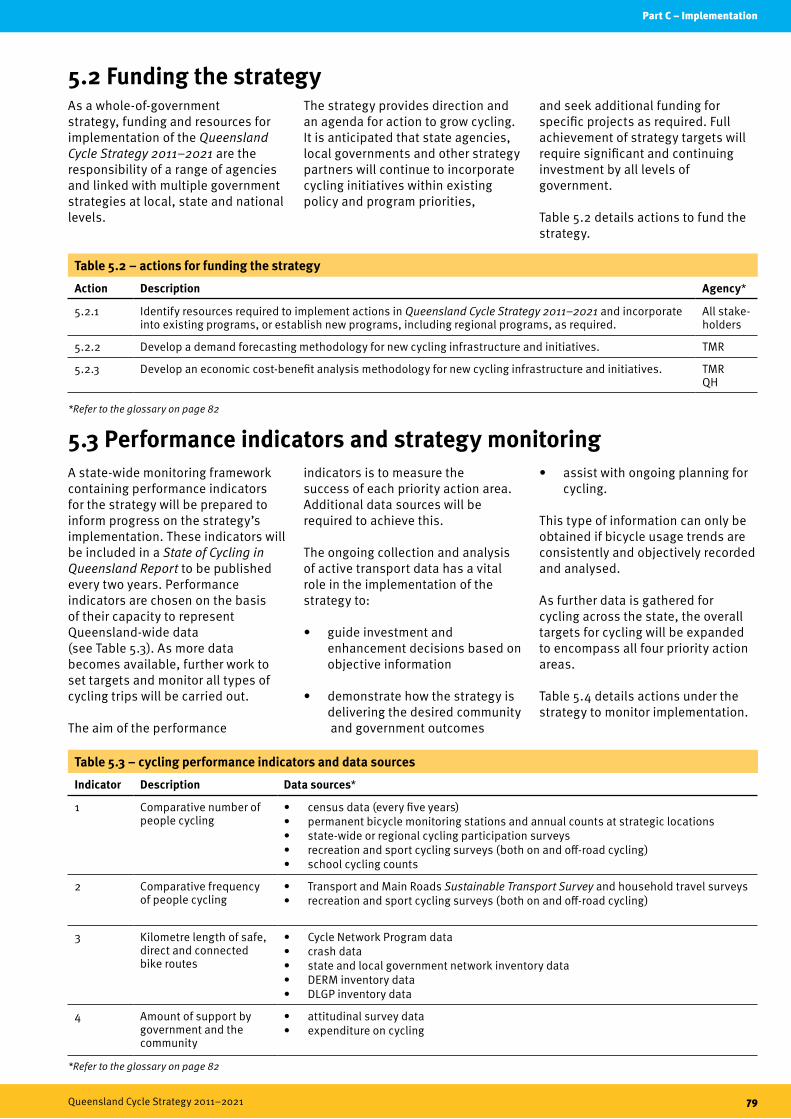
Part C – Implementation
Queensland Cycle Strategy 2011–2021 79
5.1 A coordinated approach
5.2 Funding the strategy
5.3 Performance indicators and strategy monitoring
As a whole-of-government strategy, funding and resources for implementation of the Queensland Cycle Strategy 2011–2021 are the responsibility of a range of agencies and linked with multiple government strategies at local, state and national levels.
The strategy provides direction and an agenda for action to grow cycling. It is anticipated that state agencies, local governments and other strategy partners will continue to incorporate cycling initiatives within existing policy and program priorities,
and seek additional funding for specific projects as required. Full achievement of strategy targets will require significant and continuing investment by all levels of government.
Table 5.2 details actions to fund the strategy.
A state-wide monitoring framework containing performance indicators for the strategy will be prepared to inform progress on the strategy’s implementation. These indicators will be included in a State of Cycling in Queensland Report to be published every two years. Performance indicators are chosen on the basis of their capacity to represent Queensland-wide data (see Table 5.3). As more data becomes available, further work to set targets and monitor all types of cycling trips will be carried out.
The aim of the performance
indicators is to measure the success of each priority action area. Additional data sources will be required to achieve this.
The ongoing collection and analysis of active transport data has a vital role in the implementation of the strategy to:
• guide investment and enhancement decisions based on objective information
• demonstrate how the strategy is delivering the desired community and government outcomes
• assist with ongoing planning for cycling.
This type of information can only be obtained if bicycle usage trends are consistently and objectively recorded and analysed.
As further data is gathered for cycling across the state, the overall targets for cycling will be expanded to encompass all four priority action areas.
Table 5.4 details actions under the strategy to monitor implementation.
*Refer to the glossary on page 82
*Refer to the glossary on page 82
Table 5.3 – cycling performance indicators and data sources
Indicator Description Data sources*
1 Comparative number of people cycling
• censusdata(everyfiveyears)• permanentbicyclemonitoringstationsandannualcountsatstrategiclocations• state-wideorregionalcyclingparticipationsurveys• recreationandsportcyclingsurveys(bothonandoff-roadcycling)• schoolcyclingcounts
2 Comparative frequency of people cycling
• TransportandMainRoadsSustainable Transport Survey and household travel surveys• recreationandsportcyclingsurveys(bothonandoff-roadcycling)
3 Kilometre length of safe, direct and connected bike routes
• CycleNetworkProgramdata• crashdata• stateandlocalgovernmentnetworkinventorydata• DERMinventorydata• DLGPinventorydata
4 Amount of support by government and the community
• attitudinalsurveydata• expenditureoncycling
Table 5.2 – actions for funding the strategy
Action Description Agency*
5.2.1 Identify resources required to implement actions in Queensland Cycle Strategy 2011–2021 and incorporate into existing programs, or establish new programs, including regional programs, as required.
All stake- holders
5.2.2 Develop a demand forecasting methodology for new cycling infrastructure and initiatives. TMR
5.2.3 Develop an economic cost-benefit analysis methodology for new cycling infrastructure and initiatives. TMR QH

Part C – Implementation
80 Queensland Cycle Strategy 2011–2021
*Refer to the glossary on page 82
Table 5.4 – actions for a coordinated approach to deliver the strategy
Action Description Agency*
5.4.1 Prepare an active transport data strategy to quantify the benefits of the proposed initiatives and monitor progress against the targets and actions in the Queensland Cycle Strategy 2011–2021.
TMR
5.4.2 Develop measures and targets for all types of cycling trips (not just journeys to work) that can be applied across Queensland or in specific locations.
TMR
5.4.3 Publish a biennial State of Cycling in Queensland Report, reporting bicycle usage against the Queensland Cycle Strategy 2011–2021 outcomes and state and local government expenditure on cycling-related infrastructure and initiatives.
TMR
5.4.4 Improve the quality, coverage, and consistency of cycling data, by:• installingpermanentbicycleandpedestriantrafficmonitoringstationsacrossthecyclewaynetwork• requiringtheuseofrelevantdata-gatheringandelectronicmappingtoolsbylocalgovernments
seeking Queensland Government cycle network funding• incorporatingbicyclesintotheannualstate-widetrafficsurvey• undertakingannualcountsofbikeparkingattransporthubs,selectedschoolsandkeyregional
activity centres• undertaking‘before’and‘after’bicycletrafficandparkingcountsforallnewinfrastructureand
initiatives • conductingannualbicycleandpedestriancordoncountsinfiveindicatortownsorcommunities• publishingthedatagatheredontheQueenslandTrafficandTravelInformationwebsite.
TMR LG
5.4.5 Quantify and monitor the number of cyclists and pedestrians using the network during specific times, such as weather changes (eg. rain, humidity), cost of living changes (eg. petrol, inflation), infrastructure events (eg. bridge closure or opening), and transport system events (eg. train/bus strike).
TMR LG
5.4.6 Undertake further research into active transport data development and reporting, by: • pilotinginnovativemeasuresformakingdataoncyclingandwalkingpubliclyavailableinrealornear
time• exploringoptionsforbenchmarkingmethodsthatprovidecomparativedataonQueensland’s
performance against world recognised cycling and walking cities • testinguseofnewandemergingtechnologiesincollectingreal-timeinformationonuserbehaviour
through smart phones and other widely available applications.
TMR
5.4.7 Develop standardised methodologies to allow consistent and continual recording of active transport data, such as origin-destination, travel time, route choice, intercept surveys and classified traffic and parking counts.
TMR
Part C – Implementation
Queensland Cycle Strategy 2011–2021 81

Glossary
82 Queensland Cycle Strategy 2011–2021
GlossaryAccessibility – The ease with which people can travel from one place to another by different modes of transport. Includes access by people with disabilities.
Active school travel programs – Programs to support and encourage public transport, walk and cycle trips to and from schools.
Active towns – Active towns programs focus infrastructure provision and encouragement intensively in a small number of communities with the aim of rapidly increasing cycling and walking.
Recreation trails – A relatively low cost way to provide cycling recreational opportunities.
Active transport – Non-motorised travel, such as walking and cycling.
Activity centres – Areas of employment, residential and/or retail activity. Larger cities can have several activity centres.
AusCycle – Established in 2008 to deliver high quality cycling training by accredited teachers.
Bicycle education – Education and training programs that assist people to learn cycling skills in a safe and supportive setting.
BUGs – Bicycle User Groups are groups whose members support, encourage and advocate for cycling in communities and workplaces.
BQ – Bicycle Queensland
Complete 5 – A program designed to complete Principal Cycle Network connections within five kilometres of key centres to deliver a connected cycle network.
Congestion – In the context of transport, a condition where the use of a piece of infrastructure exceeds the level at which it functions efficiently.
Connect To – A program to construct cycle links to key public transport stations and stops (up to five kilometres), supported by bicycle parking and end-of-trip facilities.
Cycleable – The ease of cycling in a particular location.
Cycle-friendly communities – Communities designed to be ‘cycleable’ to reduce reliance on car travel.
Cycling culture – Queensland is a place where cycling is widely supported, encouraged and celebrated.
Cycling economy – Recognises cycling’s ability to create jobs in retail, repair and service, event management, building infrastructure, planning and tourism.
DEEDI – Department of Employment, Economic Development and Innovation
DERM – Department of Environment and Resource Management
DET – Department of Education and Training
DLGP – Department Local Government and Planning
DPW – Department of Public Works
Educated ways – Ensuring safe and connected routes are provided for major schools, universities and TAFEs, focusing on a three kilometre catchment around these educational institutions.
End-of-trip facilities – Facilities for cyclists and pedestrians which can include bicycle parking, lockers, change rooms and showers.
EQ – Events Queensland, the lead agency for event acquisition in Queensland reporting to the Premier.
GPS – Global Positioning System
IMBA – International Mountain Bike Association
LG – Local government
NZ – New Zealand
Mode share – The proportion of trips made by particular modes of transport, including walking, cycling, motor vehicle and public transport.
PCNP – Principal Cycle Network Plans guide the provision of regionally significant cycling facilities across different regions of Queensland. They identify the ‘arterial’ roads for cycling.
Protected cycleways – Physically separated cycleways from both motor vehicle traffic and pedestrians by raised kerbs and parking.
QBC – Queensland Bicycle Council. Includes representation from state and local government, bicycle industry and the community. It meets regularly to facilitate collaboration among stakeholders across the state to implement the strategy.
QH – Queensland Health
QPS – Queensland Police Service
Responsible agencies – Identified for each action in the strategy. Responsible agencies play the major role in resourcing, developing, implementing and monitoring progress against actions.
SRS – Sport and Recreation Services, Department of Communities
Strategic cycle networks – The highest priority links in the Principal Cycle Network. They connect activity centres and other major cycling attractors.
Super Tuesday – Australia’s largest visual bicycle count providing annual figures on bicycle commuting. Organised by Bicycle Victoria.
TAFE – Technical and Further Education
TMR – Department of Transport and Main Roads
TQ – Tourism Queensland
TravelSmart – A program that supports investment in public transport, walking and cycling to encourage a change in travel behaviour in homes, schools and workplaces.
TTA – Translink Transit Authority
UQ – University of Queensland
Veloway – High standard bicycle paths (wide with a direct alignment) generally used where high numbers of cyclists are expected.
Wayfinding – Includes signs, maps and electronic devices to help guide cyclists and pedestrians to their destinations.

References
Queensland Cycle Strategy 2011–2021 83
ReferencesAnderson, L., Schnohr, P., Schroll, M. and Hein, H. (2000), “All-cause mortality associated with physical activity during leisure time, work, sports, and cycling to work”, Archives of Internal Medicine, 160(11), 1621-1628.Australian Sports Commission (2006 and 2009), Participation in Exercise, Recreation and Sport: Annual Report, Canberra.Bauman A., Rissel C., Garrard J., Ker I., Speidel, R. and Fishman, E. (2008), Cycling: Getting Australia Moving: Barriers, facilitators and interventions to get more Australians physically active through cycling, Cycling Promotion Fund, Melbourne.Beeton, S. (2006), Regional Communities and Cycling: The case of the Murray to the Mountains Rail Trail, Victoria, Australia, Latrobe University, Australia, 17.Cycling Promotion Fund (2009), Cycling Issue Sheet – Bicycle Sales 2009, www.cyclingpromotion.com.au/content/view/498/150/accessed on 12 October 2010.Cycling Promotion Fund (2011), Personal Communication – Cycling Promotion Fund Executive Officer. Department of Transport and Main Roads (2010), Transport User Analysis (south-east Queensland residents), unpublished.Department of Transport and Main Roads (2009a), Bike Week 2009 – Ride to Work Day Survey Results Report, unpublished.Department of Transport and Main Roads (2009b), Sustainable Transport Survey, unpublished. Department of Transport and Regional Services (2005), The Australian National Cycling Strategy 2005-2010, Australian Bicycle Council, Canberra.Elvic, R. (2009), ‘The non-linearity of risk and the promotion of environmentally sustainable transport’, Accident Analysis & Prevention, p 41.Garrard, J. (2008), Safe Speed: Promoting cycling and walking by reducing traffic speed, Safe Speed Interest Group, Yarra, Victoria.Gatersleben, B. and Vlek, C. (1998), “Household Consumption, Quality of Life and Environmental Impacts”, in Noorman, K.J. and Schoot-Uiterkamp, T. (eds.), Green Households, Domestic Consumers, the Environment and Sustainability.Heesch, Kristiann and Garrard, Jan and Sahlqvist, Shannon. (2010), What factors are associated with cyclists getting injured? Correlates of cyclist injuries in Queensland. In: 2010 Australasian Road Safety Research, Policing and Education Conference, 31 August – 3 September 2010, National Convention Centre, Canberra.Heesch et al, 2010; and CARRS-Q (2008), “Bicycle Safety”, State of the Road: A fact sheet of the Centre for Accident Research and Road Safety – Queensland, www.carrsq.qut.edu.au, accessed on 7 February 2011.Jacobsen, P.L. (2003), “Safety in Numbers”, Injury Prevention 9: 205-209.Medibank Private (October 2008), The cost of physical inactivity, http://www.medibank.com.au/Client/Documents/Pdfs/The_Cost_Of_Physical_Inactivity_08.pdf, accessed on 18 June 2011.New South Wales Government (2010), New South Wales Bikeplan, May, Sydney.Otago Central Rail Trail Trust (2005), The Otago Central Rail Trail Means Business Survey, November.Pucher, J. and Dijkstra, L. (2003), Promoting Safe Walking and Cycling to Improve Public Health: Lessons from the Netherlands and Germany, American Journal of Public Health, September 90(9), pp. 1509-1516.Queensland Health (2010), The Health of Queenslanders 2010: Third Report of the Chief Health Officer Queensland.Robinson, D. (2005), ‘Safety in numbers in Australia, more walkers and bicyclists, safer walker and bicycling’, Health Promotion Journal, 16 (1).Schramm, A. and Rakotonirainy, A. (2009), The effect of road lane width on cyclist safety in urban areas, Paper presented to Australasian Road Safety Research, Policing and Education Conference, 10 -13 November 2009, Sydney, New South Wales.Wang, G., Maccera, C.A., Scudder-Soucie, B., Schmid, T., Pratt, M. and Buchner, D. (2005), “A cost-benefit analysis of physical activity using bike/pedestrian trails”, Health Promotion Practice, April 6 (2): 174-79.Wood, J., Lasherex, P., Marszlaek, R. and King, M. (2009), “Drivers’ and cyclists’ experiences of sharing the road: incidents, attitudes and perceptions of visibility”, Accident Analysis and Prevention, 41(4), 772-776.World Health Organisation (2000), Transport, Environment and Health, Regional Office for Europa, Copenhagen.

Transport and Main Roads