Embed Size (px)
Citation preview
Queens University
Business Intelligence in the real world
Gareth Diamond
www.pwc.com
PwC
Contents1. Introduction
2. PwC
3. What is Business Intelligence and Analytics?
4. Why do businesses need BI&A?
5. Business challenges in implementing BI
6. BI isn’t new, so what’s different?
2
PwC
1. Personal Introduction
Gareth Diamond
Senior Manager in our Information Management team in NI which consists of 4 distinct areas;
• Information Architecture Strategy & Governance
• Business Intelligence & Analytics
• Enterprise Data Management
• Enterprise Content Management
Companies our team are currently supporting include;
• Jaguar Land-rover• Heineken • Royal Bank of Scotland• BBC• Rolls Royce• Torus 3
• Lehman Bros (IA)• Reed Elsevier• AstraZeneca• Guys & St Thomas Hospital• BAE
PwC
Who are PwC?
•The world’s largest professional services firm
•Operating in 154 countries and in 39 locations across the UK
•16,000 staff in the UK and 169,000 globally
•Turnover of £2.4bn in the UK and $29.2bn globally
•The UK’s largest private sector graduate recruiter
•Graduate Employer of Choice in the UK every year since 2004
PwC
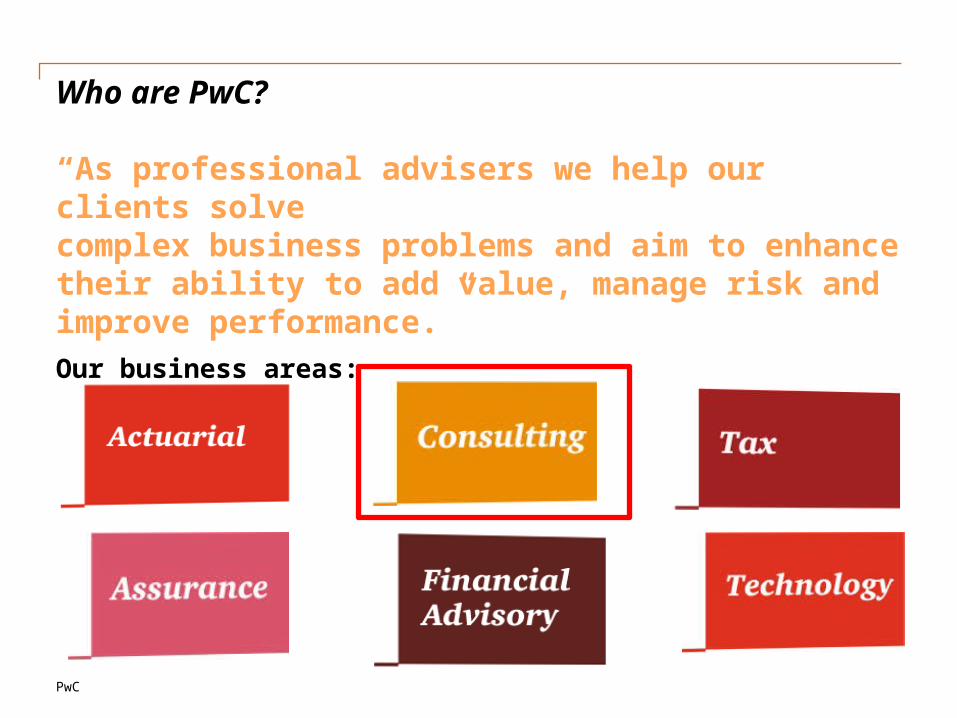
Who are PwC?
“As professional advisers we help our clients solvecomplex business problems and aim to enhance their ability to add value, manage risk and improve performance.”Our business areas:
PwC
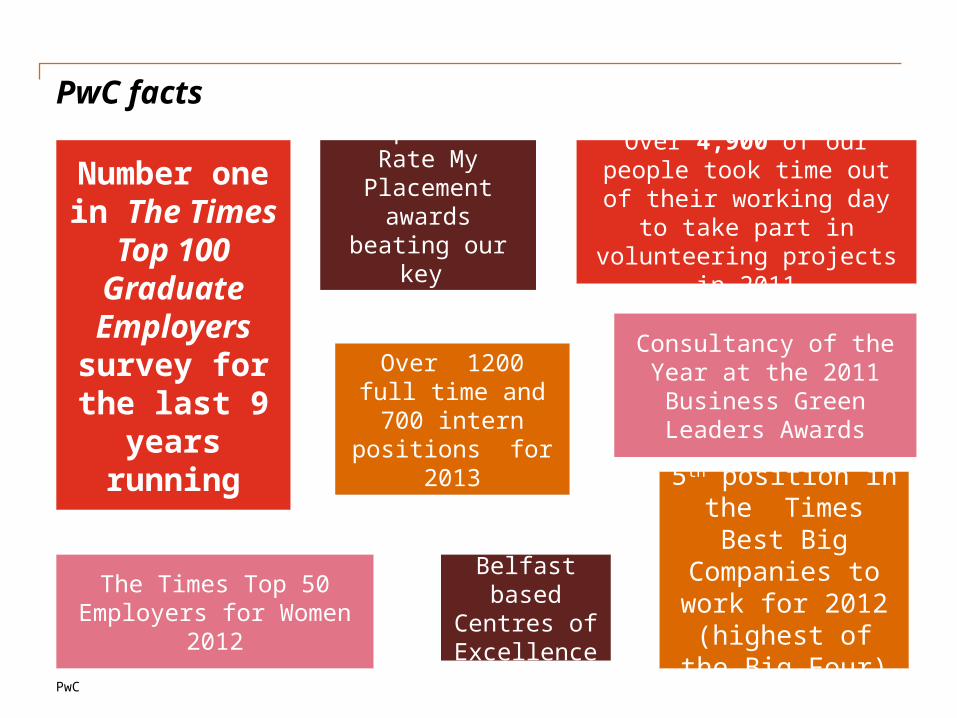
PwC facts
Number one in The Times Top
100 Graduate Employers survey for the last 9
years running
Consultancy of the Year at the 2011 Business Green Leaders Awards
The Times Top 50 Employers for Women
2012
5th position in the Times Best Big Companies
to work for 2012 (highest of the
Big Four)
Over 1200 full time and 700
intern positions for 2013
Over 4,900 of our people took time out of their
working day to take part in volunteering projects
in 2011
Belfast based
Centres of Excellence
3rd place in Rate My
Placement awards beating
our key competitors
PwC
Graduate opportunities
Graduate positions• Full time graduate roles in Consulting• Degree discipline’s particularly welcome:
- IT- Technology - Business- Finance- Science- Engineering- Mathematical
• At least 340 UCAS points (or equivalent) • 2:1 or above degree • You can now apply for Autumn 2013 intakes.
PwC
1. Lecture Introduction
The aim of these lectures is to give you a non technical perspective of how BI&A (Business Intelligence and Analytics) is used in the real world, including;
• What businesses define as BI
• How businesses are using BI to help solve business issues
• What is stopping businesses realising the value of BI
Our 2nd Lecture will focus on the latest People, Process and Technology which are found in an organisation and how to resolve some of the key issues they face.
• The emerging trends in BI
• The new approaches businesses are taking to implementing BI to realise benefits
8
PwC
2. What is Business Intelligence and Analytics?
Enterprise Reporting
Scorecards
Mobile BIBusiness Process Modelling
Predictive Analytics
Text Mining
Data Visualisation
Data Mining
OLAP Analysis
BI Competency
Centre
Modelling
Alerts and Notifications
BI Strategy
and Roadmap
Dashboards
Forecasting
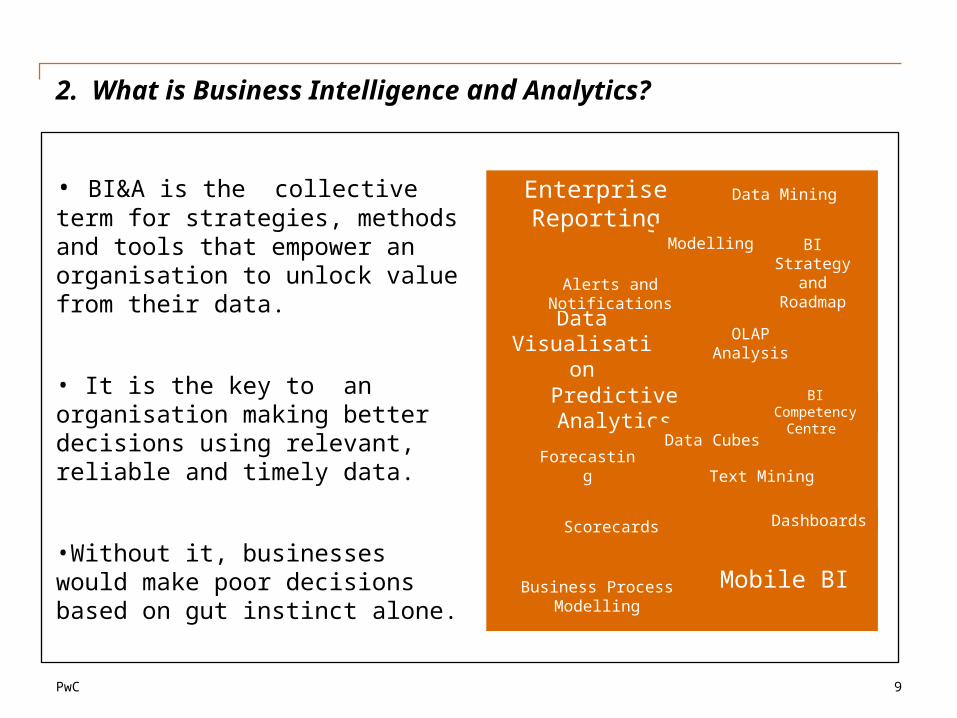
• BI&A is the collective term for strategies, methods and tools that empower an organisation to unlock value from their data.
• It is the key to an organisation making better decisions using relevant, reliable and timely data.
•Without it, businesses would make poor decisions based on gut instinct alone.
Data Cubes
9

PwC
Pro
vid
es
P
latf
orm
for
BI&
A
Deri
ve V
alu
e f
rom
Data
2. BI&A Taxonomy
10
Infrastructure and Tools“What Technologiesdo I need to support BI&A ?”
Reporting“What Happened ?”
Analysis“Why did it Happen ?”
Monitoring“What is Happening Now ?”
Prediction “What is going Happening ?”
Operational Reporting
Alerts and Notification
Scorecards Dashboard
Predictive Analytics
Forecast and Modelling
Query/Drill DownStatistical Analysis
Data/Text Mining
Real Time Descision Making
Data Structures (ODS, OLAP Cubes etc)
Tool Installation and
Configuration
Strategy, Architecture and Governance “How does BI operate in the firm?”
BI StrategyBI Operating
ModelBI Architecture
Policy and Compliance Definition
Hardware Infrastructure
Data Visualisation
Financial Reporting
PwC 11
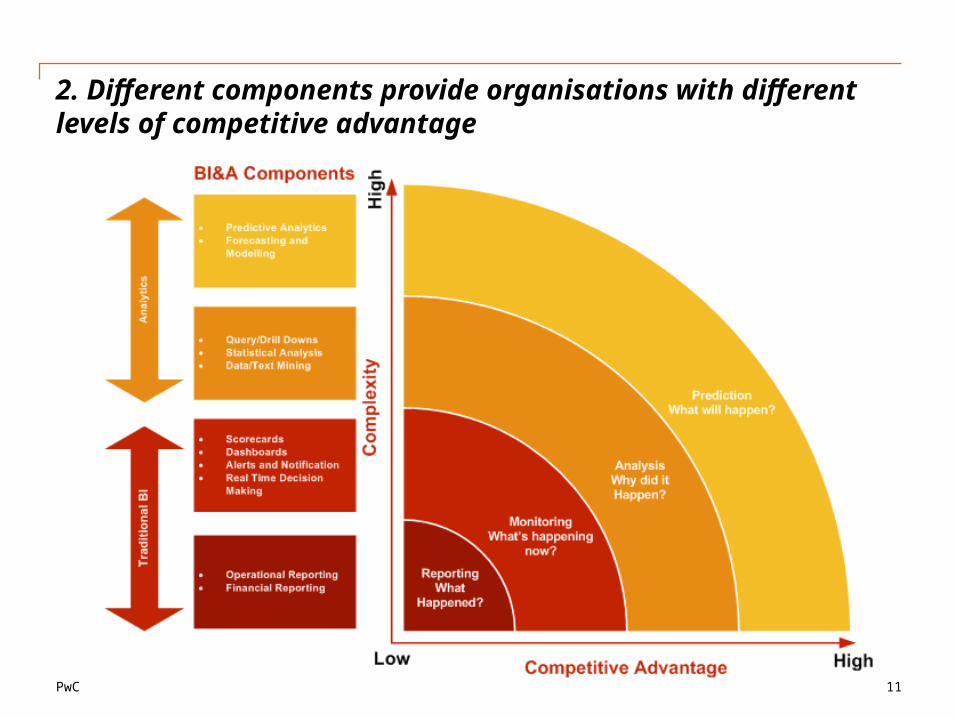
2. Different components provide organisations with different levels of competitive advantage
PwC
2. BI&A Taxonomy – Finance and Operation Reporting
12
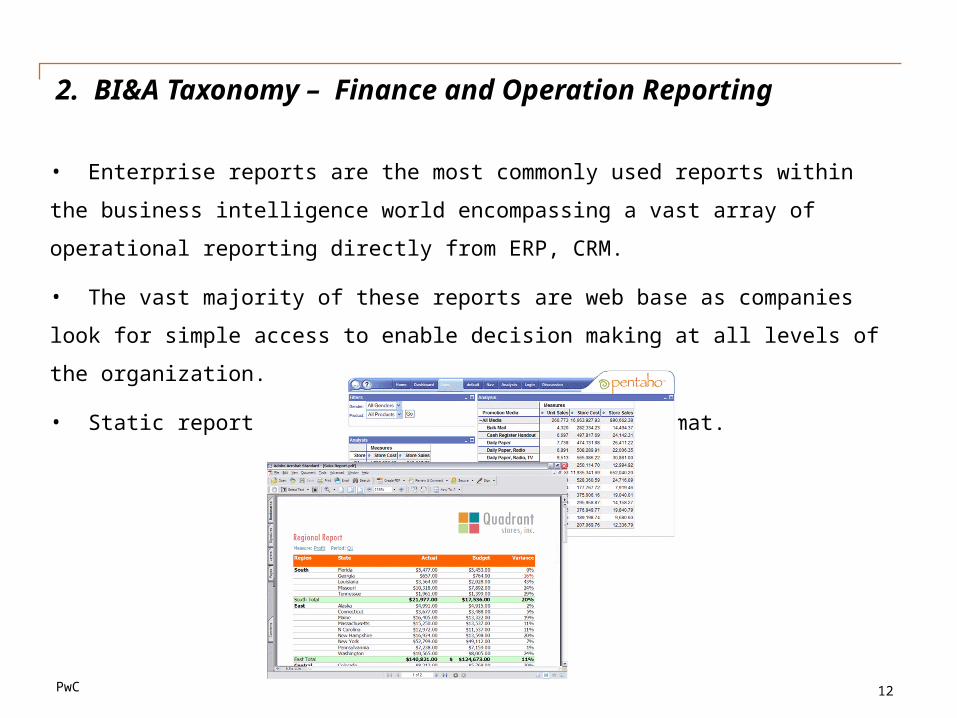
• Enterprise reports are the most commonly used reports within the business
intelligence world encompassing a vast array of operational reporting directly
from ERP, CRM.
• The vast majority of these reports are web base as companies look for
simple access to enable decision making at all levels of the organization.
• Static report usually presented in tabular format.
PwC
2. BI&A Taxonomy – Monitoring
13
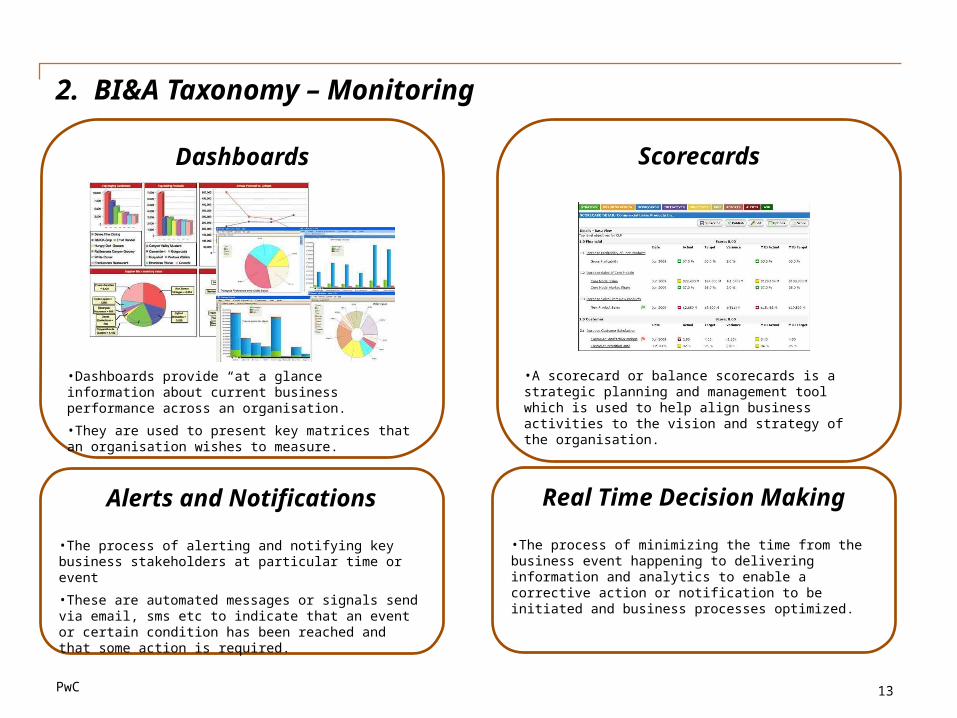
Dashboards
•Dashboards provide “at a glance” information about current business performance across an organisation.
•They are used to present key matrices that an organisation wishes to measure.
Scorecards
•A scorecard or balance scorecards is a strategic planning and management tool which is used to help align business activities to the vision and strategy of the organisation.
Alerts and Notifications
•The process of alerting and notifying key business stakeholders at particular time or event
•These are automated messages or signals send via email, sms etc to indicate that an event or certain condition has been reached and that some action is required.
Real Time Decision Making
•The process of minimizing the time from the business event happening to delivering information and analytics to enable a corrective action or notification to be initiated and business processes optimized.
PwC
2. BI&A Taxonomy – Analysis
14
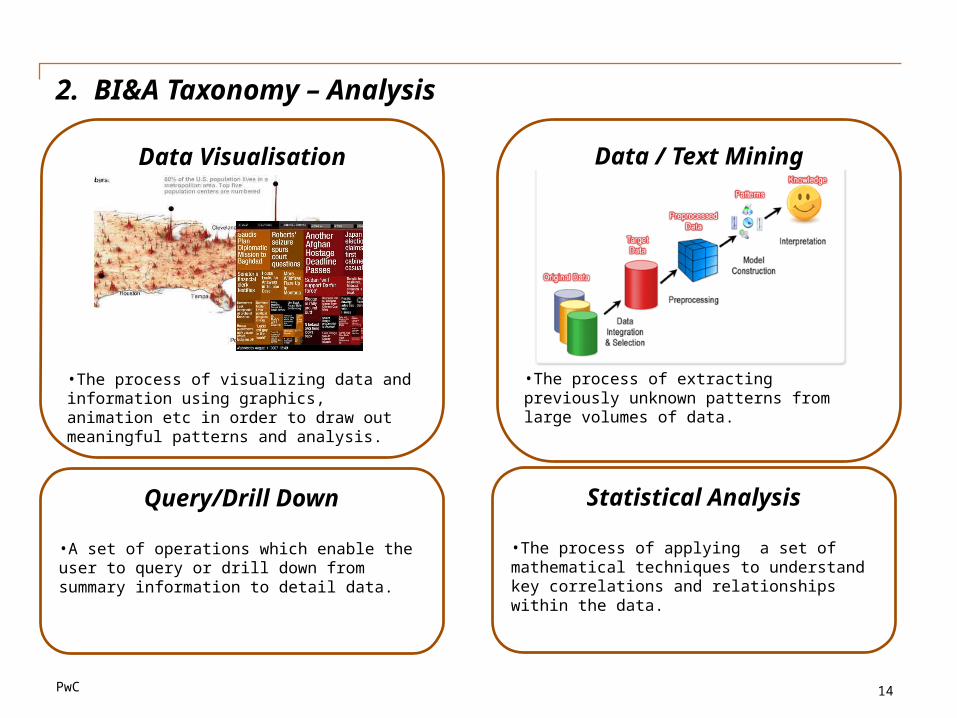
Data Visualisation
•The process of visualizing data and information using graphics, animation etc in order to draw out meaningful patterns and analysis.
Data / Text Mining
•The process of extracting previously unknown patterns from large volumes of data.
Query/Drill Down
•A set of operations which enable the user to query or drill down from summary information to detail data.
Statistical Analysis
•The process of applying a set of mathematical techniques to understand key correlations and relationships within the data.
PwC
2. BI&A Taxonomy – Prediction
15
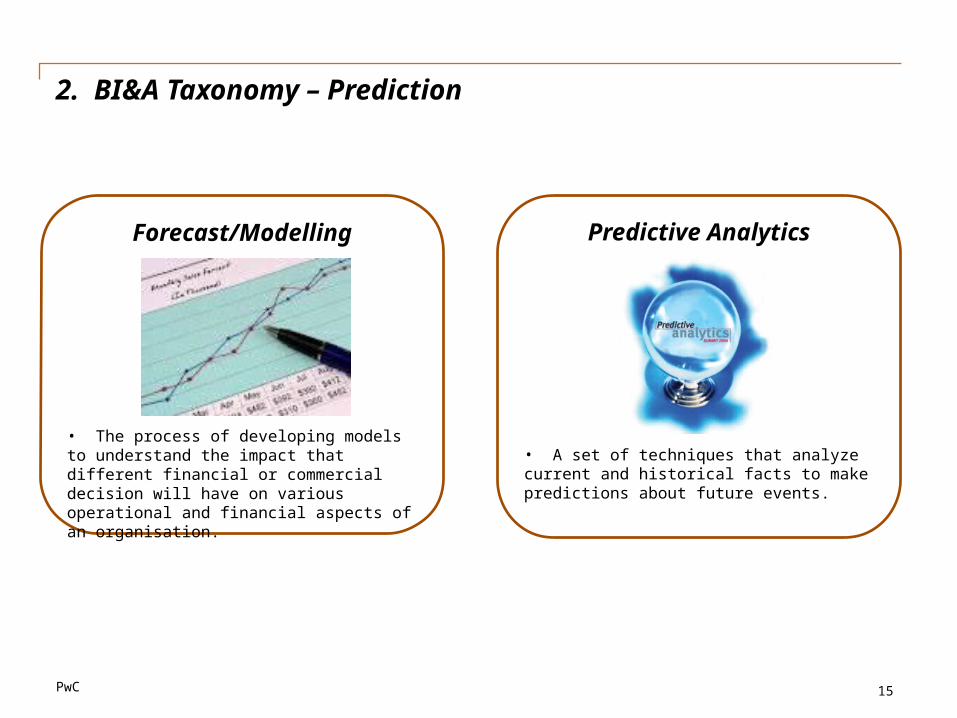
Forecast/Modelling
• The process of developing models to understand the impact that different financial or commercial decision will have on various operational and financial aspects of an organisation.
Predictive Analytics
• A set of techniques that analyze current and historical facts to make predictions about future events.
PwC
Pro
vid
es
P
latf
orm
for
BI&
A
Deri
ve V
alu
e f
rom
Data
2. BI&A Taxonomy
16
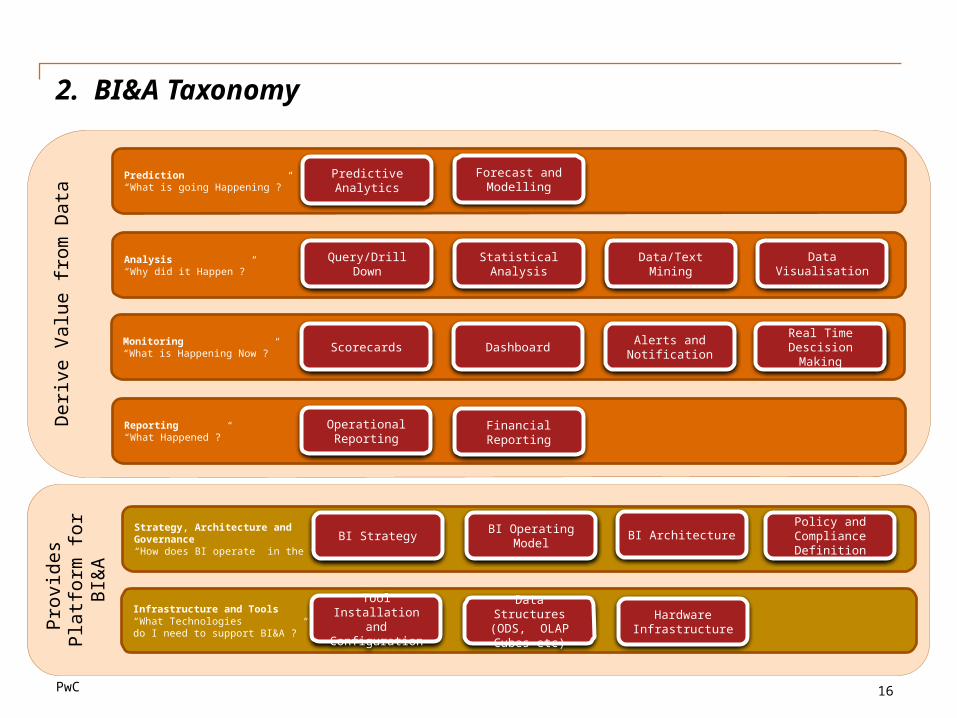
Infrastructure and Tools“What Technologiesdo I need to support BI&A ?”
Reporting“What Happened ?”
Analysis“Why did it Happen ?”
Monitoring“What is Happening Now ?”
Prediction “What is going Happening ?”
Operational Reporting
Alerts and Notification
Scorecards Dashboard
Predictive Analytics
Forecast and Modelling
Query/Drill DownStatistical Analysis
Data/Text Mining
Real Time Descision Making
Data Structures (ODS, OLAP Cubes etc)
Tool Installation and
Configuration
Strategy, Architecture and Governance “How does BI operate in the firm?”
BI StrategyBI Operating
ModelBI Architecture
Policy and Compliance Definition
Hardware Infrastructure
Data Visualisation
Financial Reporting
PwC 17
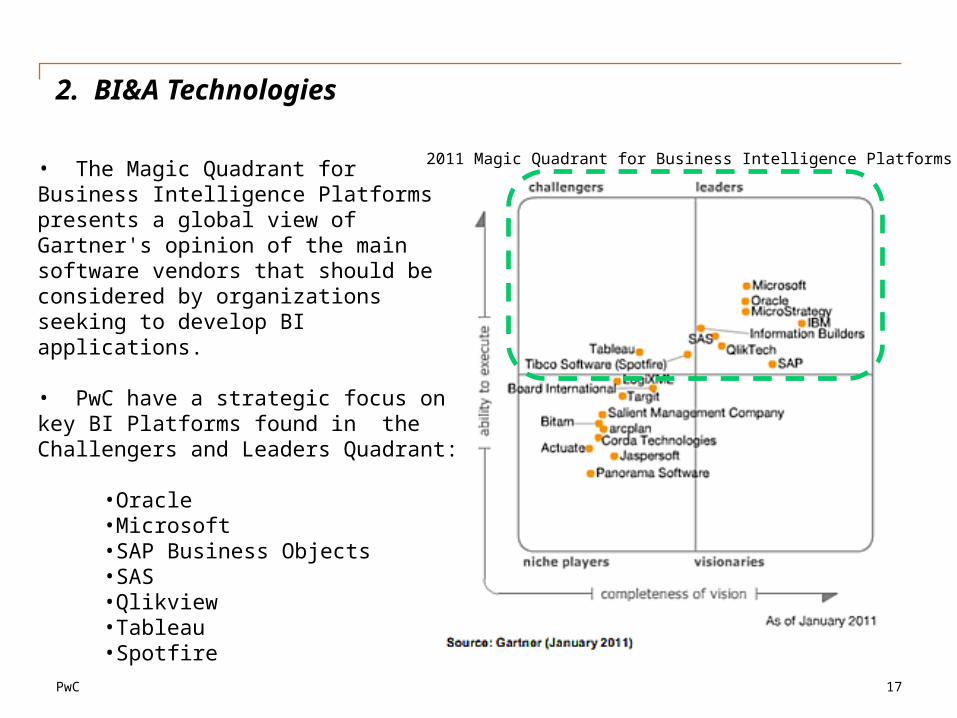
2. BI&A Technologies
2011 Magic Quadrant for Business Intelligence Platforms • The Magic Quadrant for Business Intelligence Platforms presents a global view of Gartner's opinion of the main software vendors that should be considered by organizations seeking to develop BI applications.
• PwC have a strategic focus on key BI Platforms found in the Challengers and Leaders Quadrant:
•Oracle•Microsoft•SAP Business Objects•SAS•Qlikview•Tableau•Spotfire
PwC 18
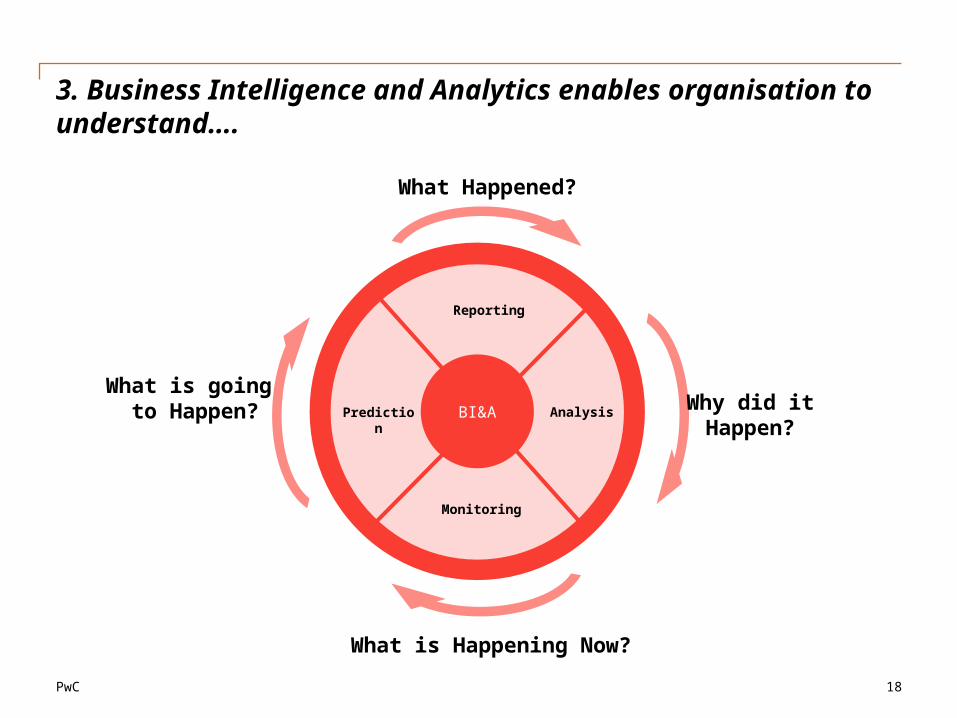
Prediction
Analysis
Reporting
Monitoring
What is going to Happen?
What Happened?
Why did it Happen?
What is Happening Now?
BI&A
3. Business Intelligence and Analytics enables organisation to understand….
PwC 19
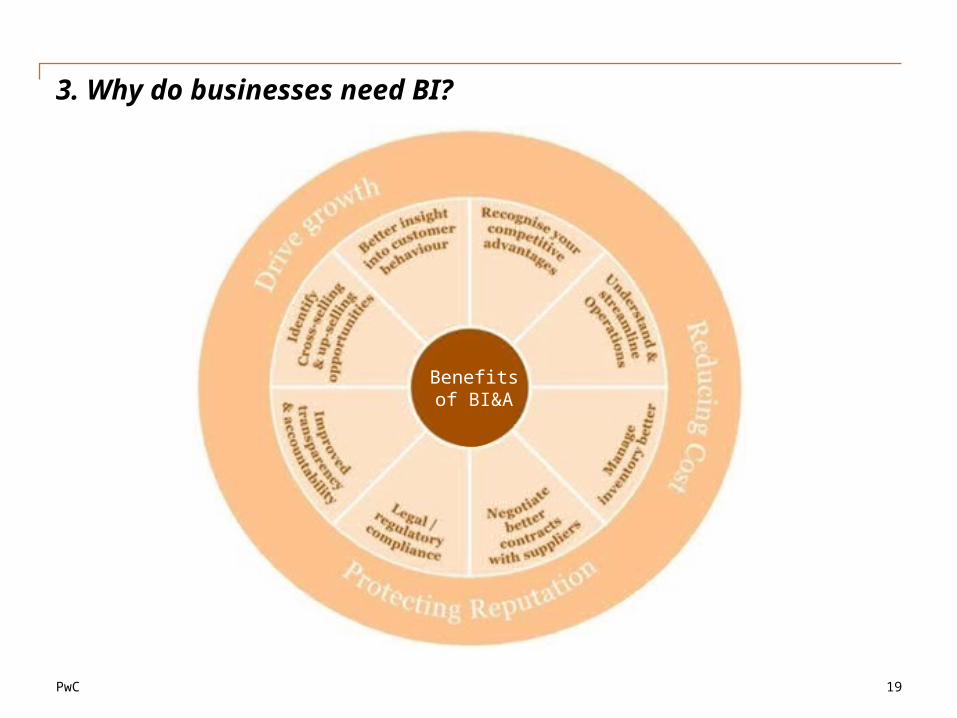
3. Why do businesses need BI?
Benefits of BI&A
PwC 20
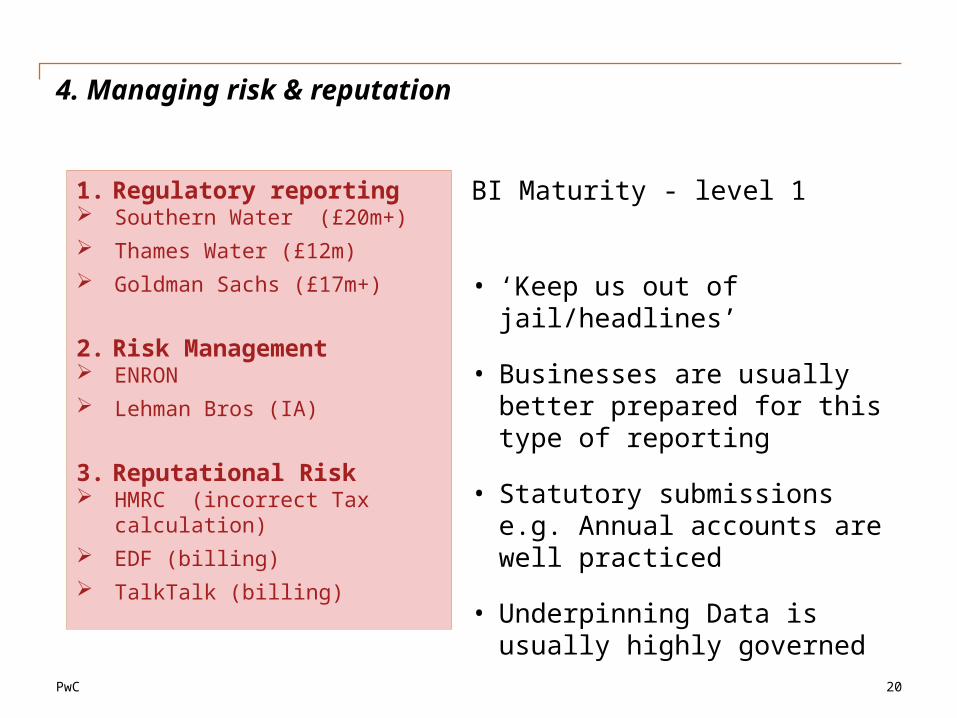
4. Managing risk & reputation
1. Regulatory reporting Southern Water (£20m+) Thames Water (£12m) Goldman Sachs (£17m+)
2. Risk Management ENRON Lehman Bros (IA)
3. Reputational Risk HMRC (incorrect Tax
calculation) EDF (billing) TalkTalk (billing)
BI Maturity - level 1
• ‘Keep us out of jail/headlines’
• Businesses are usually better prepared for this type of reporting
• Statutory submissions e.g. Annual accounts are well practiced
• Underpinning Data is usually highly governed
PwC 21
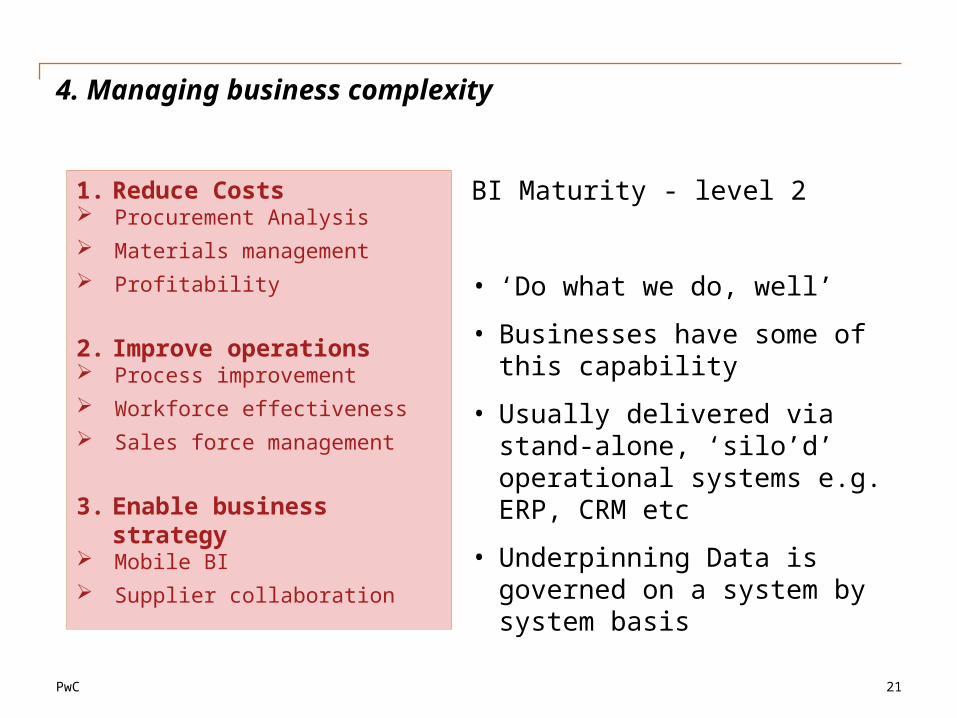
4. Managing business complexity
1. Reduce Costs Procurement Analysis Materials management Profitability
2. Improve operations Process improvement Workforce effectiveness Sales force management
3. Enable business strategy
Mobile BI Supplier collaboration
BI Maturity - level 2
• ‘Do what we do, well’
• Businesses have some of this capability
• Usually delivered via stand-alone, ‘silo’d’ operational systems e.g. ERP, CRM etc
• Underpinning Data is governed on a system by system basis
PwC 22
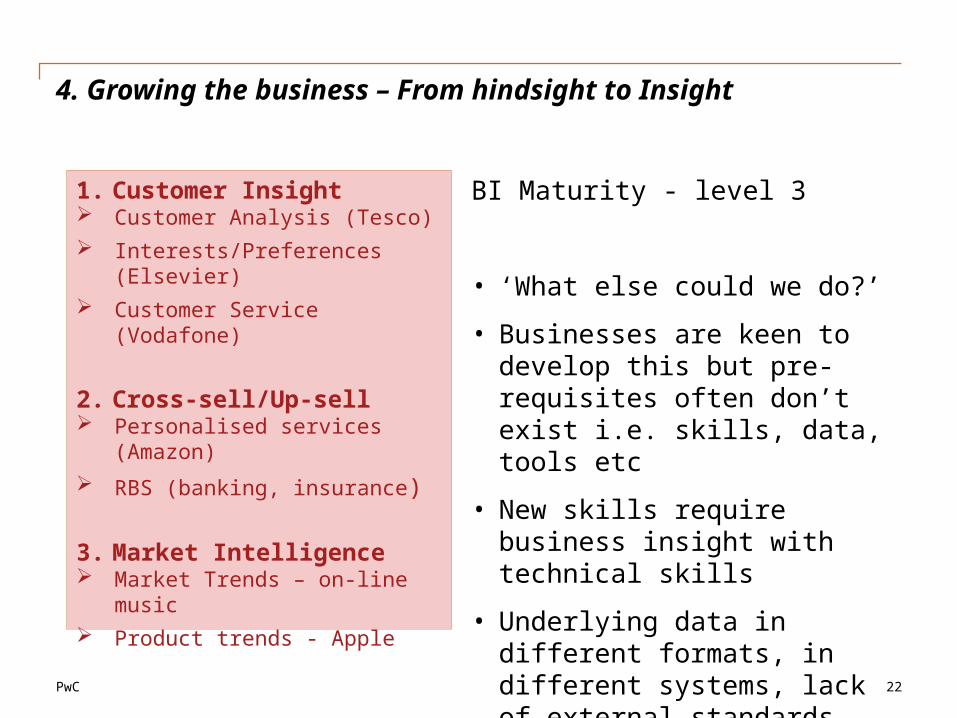
4. Growing the business – From hindsight to Insight
1. Customer Insight Customer Analysis (Tesco) Interests/Preferences
(Elsevier) Customer Service (Vodafone)
2. Cross-sell/Up-sell Personalised services
(Amazon)
RBS (banking, insurance)
3. Market Intelligence Market Trends – on-line
music Product trends - Apple
BI Maturity - level 3
• ‘What else could we do?’
• Businesses are keen to develop this but pre-requisites often don’t exist i.e. skills, data, tools etc
• New skills require business insight with technical skills
• Underlying data in different formats, in different systems, lack of external standards,
PwC 23
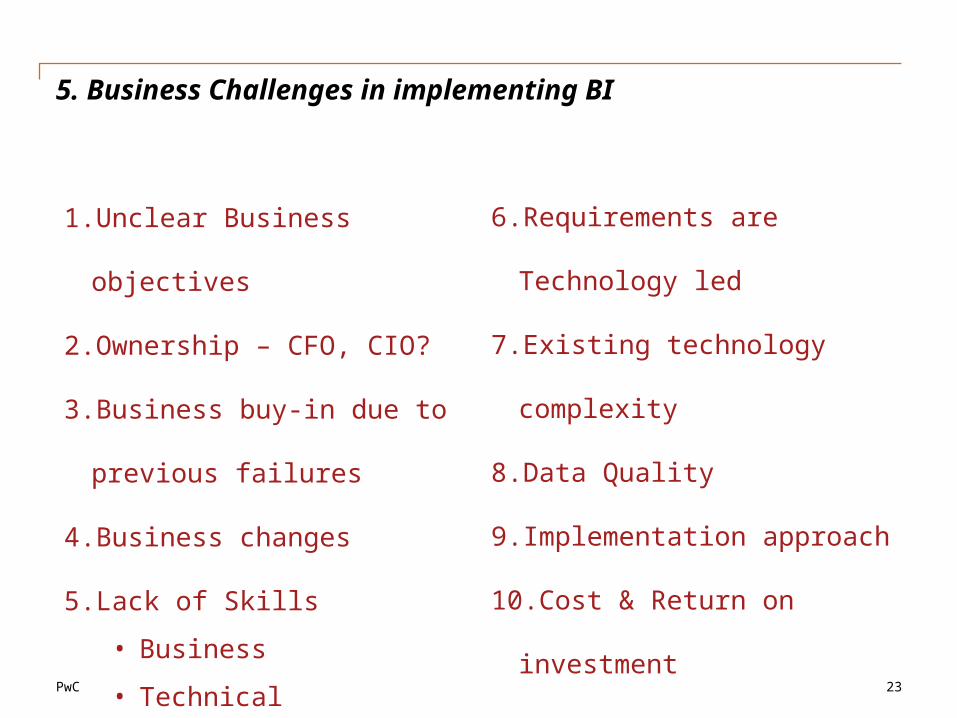
5. Business Challenges in implementing BI
1.Unclear Business objectives
2.Ownership – CFO, CIO?
3.Business buy-in due to
previous failures
4.Business changes
5.Lack of Skills
• Business
• Technical
6.Requirements are Technology
led
7.Existing technology
complexity
8.Data Quality
9.Implementation approach
10.Cost & Return on investment
PwC 24
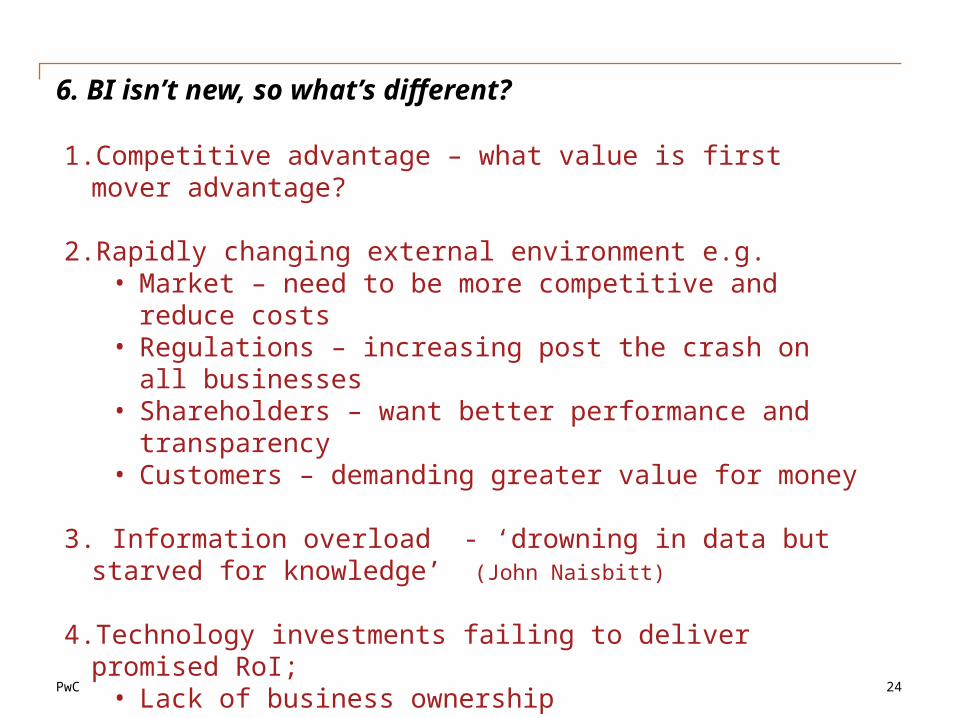
6. BI isn’t new, so what’s different?
1.Competitive advantage – what value is first mover advantage?
2.Rapidly changing external environment e.g.• Market – need to be more competitive and reduce
costs• Regulations – increasing post the crash on all
businesses• Shareholders – want better performance and
transparency• Customers – demanding greater value for money
3. Information overload - ‘drowning in data but starved for knowledge’ (John Naisbitt)
4.Technology investments failing to deliver promised RoI; • Lack of business ownership• ERP & Operational/’silo’d’ reporting solutions• Data is not managed as a corporate asset
This publication has been prepared for general guidance on matters of interest only, and does not constitute professional advice. You should not act upon the information contained in this publication without obtaining specific professional advice. No representation or warranty (express or implied) is given as to the accuracy or completeness of the information contained in this publication, and, to the extent permitted by law, PricewaterhouseCoopers LLP, its members, employees and agents do not accept or assume any liability, responsibility or duty of care for any consequences of you or anyone else acting, or refraining to act, in reliance on the information contained in this publication or for any decision based on it.
© 2011 PricewaterhouseCoopers LLP. All rights reserved. In this document, “PwC” refers to PricewaterhouseCoopers LLP which is a member firm of PricewaterhouseCoopers International Limited, each member firm of which is a separate legal entity.
Business Intelligence and Analytics
Any Questions?