Embed Size (px)
Citation preview
2015 ∙2025 Québec Infrastructure Plan
2015 ∙2016 Annual Management Plans for Public Infrastructure Investments
QUÉBEC’S PUBLIC
INFRASTRUCTURE

2015 ∙2025 Québec Infrastructure Plan
2015 ∙2016 Annual Management Plans for Public Infrastructure Investments
QUÉBEC’S PUBLIC
INFRASTRUCTURE
Québec’s Public Infrastructure 2015-2025 Québec Infrastructure Plan / 2015-2016 Annual Management Plans for Public Infrastructure Investments
Legal Deposit - March 2015 Bibliothèque et Archives nationales du Québec
ISBN 978-2-551-25661-7 (Print Version) ISBN 978-2-550-72722-4 (Online)
© Gouvernement du Québec - 2015

Message froM the Chair of the Conseil du trésor
Since its election, the Government has worked tirelessly and resolutely to restore Québec’s financial health and regain control of its spending, which will allow us to achieve a balanced budget this year.
This responsible management of the public purse must also extend to infrastructure investments. Québec has important choices to make. Although investments are urgently needed to maintain the safety and quality of our aging buildings, schools and roads, we must not lose sight of the need for new infrastructures. These investments must be made responsibly, keeping in mind our citizens’ ability to pay.
Québec’s recent history in infrastructure investments can be broken down into two phases. The first was a period of chronic under-investment that began in the 1990s and continued until the early 2000s. The second was the inevitable “catch-up”
phase, which began in earnest in 2006-2007. It is now time to embark on a stable path that will allow us to respond to the undeniable priority of maintaining the quality and safety of our existing infrastructures while responsibly developing Québec’s public infrastructure network. To this end, the Government is adopting an even more disciplined approach to project selection while finding innovative ways to finance major projects.
Investments of $88.4 billion over the next 10 years
Infrastructure investments are a powerful stimulus for economic development. Not only do they generate tens of thousands of jobs every year, but they also help create an environment conducive to private investment and the production of new goods and services. With investments of $88.4 billion, the 2015-2025 Québec Infrastructure Plan lends support to our economic recovery plan in all regions of Québec.
More transparent management
We want citizens to know the condition of Québec’s public assets. After all, these assets belong to them since they are financed with their tax dollars.
For the first time this year, the Government is presenting management plans for infrastructure investments, titled 2015-2016 Annual Management Plans for Public Infrastructure Investments. These plans present an initial portrait of Québec’s public infrastructures, including an assessment of their physical condition and any asset maintenance deficit. This portrait will be included with each year’s expenditure budget.
Let us take advantage of the newly balanced budget to develop a long-term vision for Québec’s infrastructures, one that includes responsible, regular and balanced investments. We must avoid repeating history and ensure stable, adequate investments that will enable Québec to have quality infrastructures in good condition and at the same time stimulate the economy. We must make the best choices. We will make these choices responsibly, transparently and in a disciplined manner.
The Minister responsible for Government Administration and Ongoing Program Review and Chair of the Conseil du trésor,
Martin Coiteux

Table of Contents Message from the Chair of the Conseil du trésor .................................................................. 3
Introduction .............................................................................................................................. 7
PART I Rigorous, responsible management of public infrastructures ............................................. 9
1. An adequate investment plan to ensure public services ............................................................ 11
1.1. A few more years of playing catch-up ................................................................................... 11
1.2. Monies allocated to priority and strategic needs .................................................................... 12
1.3. Multi-year vision and careful use of a central envelope ......................................................... 12
2. Clear government orientations ..................................................................................................... 13
2.1 Guidelines for the prioritization of infrastructure investments ................................................. 14
2.2 Balanced investment planning over ten years ....................................................................... 15
2.3 New method for carrying out structuring infrastructure projects: involvement of the Caisse de dépôt et placement du Québec ............................................................................................. 15
3. Evolving governance rules ........................................................................................................... 16
3.1. Revised governance rules for projects that cost less than $50 million .................................... 16
4. A new evaluation of the condition of infrastructures and the asset maintenance deficit .......... 17
5. Continuous improvement in transparency and management ..................................................... 18
PART II 2015-2025 Québec Infrastructure Plan ..................................................................................19
1. Quality infrastructures for All Sectors of Activity ........................................................................ 21
1.1. Evolution of public infrastructure investments ....................................................................... 21
2. The 2015-2025 Québec Infrastructure Plan: diversified investments ........................................ 22
2.1 Elements presented in the Québec Infrastructure Plan ......................................................... 22
2.2 Activity sectors in the Québec Infrastructure Plan ................................................................. 24
2.3 Partner contributions ............................................................................................................ 28
3. Projects whose costs exceed $50 million .................................................................................... 29
3.1. New studies of projects whose costs exceed $50 million ....................................................... 29
4. Positive impacts of new infrastructure investments on the economy........................................ 30
5. Summary presentation tables of investments under the 2015-2025 Québec Infrastructure Plan and list of projects whose costs exceed $50 million ................................... 32
5.1 Table showing investments by sector and by year ................................................................ 32
5.2 Table showing investments by type and by year ................................................................... 33
5.3 Table showing investments by sector and by type ................................................................ 34
5.4 List of projects whose costs exceed $50 million .................................................................... 35
5.5 Update of probable investments for 2014-2015..................................................................... 49
5.6 Final statement for investments made for 2013-2014 ............................................................ 51
PART III 2015-2016 Annual Management Plans for Public Infrastructure Investments ..................57
1. Background ................................................................................................................................... 59
2. Governmental condition indicator for public infrastructure ....................................................... 61
3. 2015-2016 Annual Management Plans for Public Infrastructure Investments ............................ 62
Affaires municipales et Occupation du territoire ........................................................................... 63
Conseil du trésor et Administration gouvernementale .................................................................. 67
Culture et Communications ......................................................................................................... 73
Développement durable, Environnement et Lutte contre les changements climatiques ................ 79
Éducation, Enseignement supérieur et Recherche ...................................................................... 83
Santé et Services sociaux ........................................................................................................... 97
Tourisme ................................................................................................................................... 107
Transports................................................................................................................................. 111
APPENDIX ............................................................................................................................. 123
Appendix 1 Statute, Directive and other measures .......................................................................... 125
1. The Public Infrastructure Act ...................................................................................................... 125
2. Société québécoise des infrastructures .................................................................................... 126
3. Directive sur la gestion des projets majeurs d’infrastructure publique ................................... 126
4. Infrastructure management frameworks .................................................................................... 127

Introduction The budget tabled on March 26, 2015 by the Minister of Finance represents a return to a balanced budget, as projected for 2015-2016. Through strict expenditure control, the Government of Québec has achieved the objective it had set for itself. With the 2015-2025 Québec Infrastructure Plan, the Government is reiterating the commitments made in last June's budget regarding rigorous and transparent management of public infrastructures and continuing with the priority initiatives to guard against obsolescence and to foster economic development. Given that public infrastructure investments have a positive impact on Québec's economic development and contribute to preserving our heritage for future generations, the Government plans to allocate $88.4 billion to its public infrastructure investment program. Although it gives priority to maintaining the condition of public infrastructures and guarding against their obsolescence, this program also provides for the construction of new infrastructures to improve the offer of government services with projects selected based on merit and especially on their contribution to Québec's economic development. Lastly, as announced last year, for the first time, the Government is presenting management plans for infrastructure investments, titled 2015-2016 Annual Management Plans for Public Infrastructure Investments. An unprecedented exercise in transparency, these plans present an initial portrait of the public infrastructure stock, including an assessment of their physical condition and any asset maintenance deficit. Ultimately, they will provide another tool that will help the Government prioritize its asset maintenance and infrastructure replacement investments. This document groups together the 2015-2025 Québec Infrastructure Plan and the 2015-2016 Annual Management Plans for Public Infrastructure Investments. The document is divided into three parts:
• The first presents, among other things, the orientations and governance rules guiding the Government's infrastructure investment priorities and careful planning aimed at ensuring optimal use of public funds;
• The second part covers the 2015-2025 Québec Infrastructure Plan;
• The third part presents the 2015-2016 Annual Management Plans for Public Infrastructure Investments developed by the ministers responsible for the following portfolios:
— Affaires municipales et Occupation du territoire;
— Conseil du trésor et Administration gouvernementale;
— Culture et Communications;
— Développement durable, Environnement et Lutte contre les changements climatiques;
— Éducation, Enseignement supérieur et Recherche;
— Santé et Services sociaux;
— Tourisme;
— Transports.


PART I Rigorous, responsible management
of public infrastructures

Rigorous, responsible management of public infrastructures 11
1. An adequate investment plan to ensure public services
To reduce medium and long-term pressures on the debt and public expenditures, the orientations in the 2015-2016 Budget provide $88.4 billion for the 2015-2025 Québec Infrastructure Plan, compared to $90.3 billion in 2014-2024.
Despite this decrease, established based on the Government's ability to pay, this amount is sufficient to meet our ever-growing needs in this area. The Government must therefore do more with less, meaning infrastructure governance and planning must continue to improve in order to responsibly manage the resources available. More than ever, the Government must make choices, prioritize projects based on clear orientations and find new ways of investing in Québec's public infrastructures. 1.1. A few more years of playing catch-up
Just as in many other jurisdictions elsewhere in North America and around the world, most of Québec's public infrastructures were built between 1960 and 1980. The many investments made in public infrastructures, particularly in the road network, fuelled the economic development of Québec and its regions.
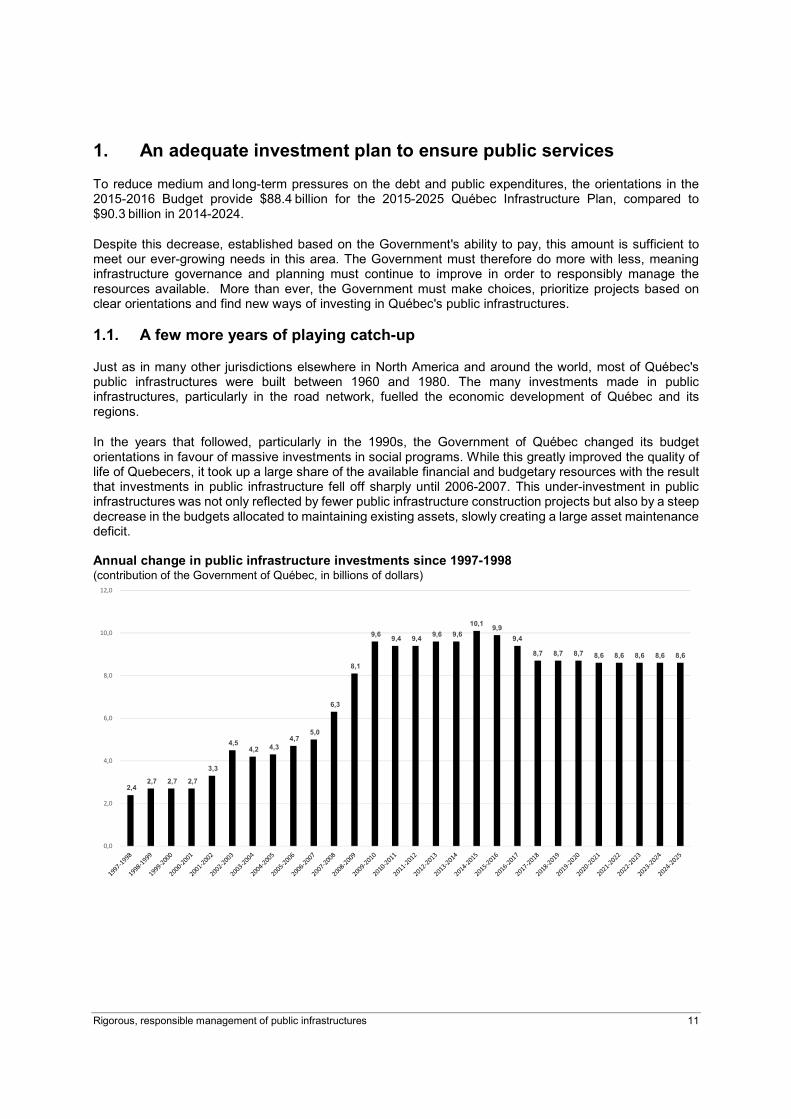
In the years that followed, particularly in the 1990s, the Government of Québec changed its budget orientations in favour of massive investments in social programs. While this greatly improved the quality of life of Quebecers, it took up a large share of the available financial and budgetary resources with the result that investments in public infrastructure fell off sharply until 2006-2007. This under-investment in public infrastructures was not only reflected by fewer public infrastructure construction projects but also by a steep decrease in the budgets allocated to maintaining existing assets, slowly creating a large asset maintenance deficit. Annual change in public infrastructure investments since 1997-1998 (contribution of the Government of Québec, in billions of dollars)
2,4 2,7 2,7 2,7
3,3
4,5 4,2 4,3
4,7 5,0
6,3
8,1
9,6 9,4 9,4
9,6 9,6
10,19,9
9,4
8,7 8,7 8,7 8,6 8,6 8,6 8,6 8,6
0,0
2,0
4,0
6,0
8,0
10,0
12,0
12 Rigorous, responsible management of public infrastructures
Since the collapse of Laval's De la Concorde overpass in 2006 and following the adoption in 2007 of the Act to promote the maintenance and renewal of public infrastructures, the Government once again began investing heavily in transportation, health and other infrastructures. The amounts allocated to public infrastructure investments grew year after year to a record $10.1 billion (probable data) in 2014-2015.
While it may seem difficult to sustain this pace over the long term given the combined effect on the debt and expenditures, the 2015-2025 Québec Infrastructure Plan intends to maintain the average level of investments at a sizable $9.1 billion over the next five years and concentrate on infrastructure investments that will maintain the service offer to the public. The Government is acting responsibly by stabilizing the average investments in the second five-year period of the 2015-2025 Québec Infrastructure Plan at $8.6 billion and reiterating its prioritization criteria to maximize the return on each dollar invested in this area. 1.2. Monies allocated to priority and strategic needs
The Québec Infrastructure Plan is a 10-year blueprint for all Government's projects of $50 million or more and also ensures that monies are available for every year of the plan for projects of less than $50 million and for the maintenance of the assets belonging to its departments and bodies. All infrastructure projects have been divided into categories based on their degree of advancement: "under study," "in the planning stage" or "in progress" (described in section 2.1 of Part II).
Regarding major projects of $50 million or more, which account for 14.7% of the 2015-2025 Québec Infrastructure Plan, projects currently "in the planning stage" or "in progress" have been fully provided for while projects "under study" have been allocated only the amounts required to conduct the studies.
To ensure rigorous and responsible management of public infrastructures in the long term, the Government must not only have a firm grasp of all the major projects that will move to "the planning stage" in 2015-2016 but also those in this category for which funding will have to be provided in 2016-2017 and 2017-2018. To this end, the departments and bodies have been asked to carefully prioritize the needs to be funded by the monies that will be available in the coming years.
Projects whose cost exceed $50 million are therefore prioritized based on the strategic needs in the 2015-2025 Québec Infrastructure Plan. 1.3. Multi-year vision and careful use of a central envelope
The 2015-2025 Québec Infrastructure Plan confirms the intention stated by the Government in its June 2014 budget to carefully and responsibly plan and manage the implementation of major projects. This plan includes a central envelope of close to $10.7 billion. Given that it will take two and in some cases three years to provision amounts in the Québec Infrastructure Plan for some priority projects currently "under study," the Government has decided to proceed cautiously by identifying and prioritizing in the central envelope the amounts required for strategic replacement and priority projects. Certain major economic projects will also be considered on their merit.
Rigorous, responsible management of public infrastructures 13
2. Clear government orientations
With its $88.4 billion infrastructure investment program, the Government is ensuring the maintenance of the condition of its infrastructure and the safety of its citizens, while substantially supporting economic growth in Québec and respecting its citizens' ability to pay.
Government orientations have been clearly defined to address issues related to public infrastructure and to ensure consistency in the intervention strategy.
The first orientation is to make choices that will ensure the sustainability of public infrastructures, which will ensure that services are safely delivered to citizens.
• To do this, the Government has developed guidelines to determine the prioritization of infrastructure investment. It has also forecast a balanced distribution of this investment over the two five-year periods.
The second orientation aims to establish innovative financing mechanisms and adapt financing rules for public infrastructure projects in order to maintain the budgetary funds available to offer citizens efficient and safe infrastructure.
• The agreement negotiated between the Gouvernement du Québec and the Caisse de dépôt et placement du Québec will allow citizens to benefit from the Caisse's expertise in large-scale infrastructure projects and for the Caisse to get a return on its investment in Québec infrastructure projects.
Through these orientations and their related measures, the Government is working to establish the structural components of its centralized governance framework for public infrastructure project management.
These orientations will be achieved through transparency, as announced by the Government.

14 Rigorous, responsible management of public infrastructures
2.1 Guidelines for the prioritization of infrastructure investments The guidelines for the prioritization of infrastructure investments convey the Government's orientations and priorities. They are aligned with the Government's major investment priorities.
Guidelines for the prioritization of infrastructure investments
Priority 1
Maintain the offer of government services (existing infrastructures)
Priority 2
Improve the offer of government services (new or improved infrastructures)
Asset maintenance
Restore or maintain the condition of infrastructure
Replacement
Replace dilapidated infrastructure
Addition
Build infrastructure Acquire infrastructure Improve existing infrastructure
Criteria for determining budgets
Project prioritization criteria
Major project prioritization criteria
• Current allocation according to management frameworks for departments and bodies
• Prioritization of projects by
department and body in order to: • ensure public health and
safety • avoid a service
interruption • reach the target • bring infrastructure up to
standards • Additional allocation to
extend the use of dilapidated infrastructure
• Eventual prioritization of
certain asset categories according to the target to be determined by the Government
• Continue projects in progress
• Evaluate whether it is
appropriate to maintain services by replacing infrastructure
• Continue projects in progress • Continue projects in the planning stage • Annually re-evaluate whether it is appropriate to
maintain or withdraw from projects under study • Continue selected projects under study
Comparative criteria and prioritization of new projects
• The department or body's ability to bear the project's
costs • Taking into account the Government's strategies • Social viability • Economic impact
These guidelines clearly demonstrate that projects maintaining the current offer of government services, through asset maintenance and the replacement of existing infrastructures, are considered a priority. The amounts forecasted in the 2015-2025 Québec Infrastructure Plan reflect these strategic choices by the Government and the next Québec Infrastructure Plans will reinforce this orientation. Additional projects improving the offer of government services are selected based only on merit and mainly in cases that foster Québec's economic development.
Rigorous, responsible management of public infrastructures 15
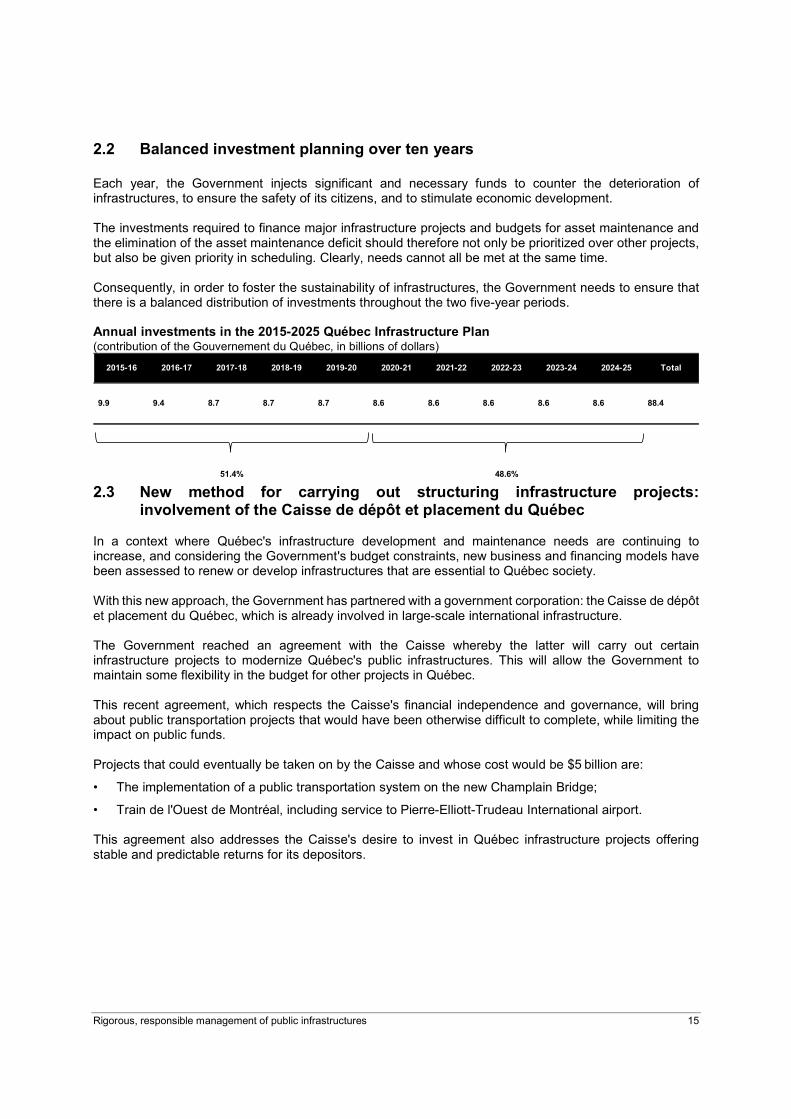
2.2 Balanced investment planning over ten years Each year, the Government injects significant and necessary funds to counter the deterioration of infrastructures, to ensure the safety of its citizens, and to stimulate economic development. The investments required to finance major infrastructure projects and budgets for asset maintenance and the elimination of the asset maintenance deficit should therefore not only be prioritized over other projects, but also be given priority in scheduling. Clearly, needs cannot all be met at the same time. Consequently, in order to foster the sustainability of infrastructures, the Government needs to ensure that there is a balanced distribution of investments throughout the two five-year periods. Annual investments in the 2015-2025 Québec Infrastructure Plan (contribution of the Gouvernement du Québec, in billions of dollars)
2.3 New method for carrying out structuring infrastructure projects:
involvement of the Caisse de dépôt et placement du Québec In a context where Québec's infrastructure development and maintenance needs are continuing to increase, and considering the Government's budget constraints, new business and financing models have been assessed to renew or develop infrastructures that are essential to Québec society. With this new approach, the Government has partnered with a government corporation: the Caisse de dépôt et placement du Québec, which is already involved in large-scale international infrastructure. The Government reached an agreement with the Caisse whereby the latter will carry out certain infrastructure projects to modernize Québec's public infrastructures. This will allow the Government to maintain some flexibility in the budget for other projects in Québec. This recent agreement, which respects the Caisse's financial independence and governance, will bring about public transportation projects that would have been otherwise difficult to complete, while limiting the impact on public funds. Projects that could eventually be taken on by the Caisse and whose cost would be $5 billion are:
• The implementation of a public transportation system on the new Champlain Bridge;
• Train de l'Ouest de Montréal, including service to Pierre-Elliott-Trudeau International airport. This agreement also addresses the Caisse's desire to invest in Québec infrastructure projects offering stable and predictable returns for its depositors.
2015-16 2016-17 2017-18 2018-19 2019-20 2020-21 2021-22 2022-23 2023-24 2024-25 Total
9.9 9.4 8.7 8.7 8.7 8.6 8.6 8.6 8.6 8.6 88.4
48.6%51.4%
16 Rigorous, responsible management of public infrastructures
3. Evolving governance rules
The Public Infrastructure Act (Chapter I-8.3) and the Directive sur la gestion des projets majeurs d’infrastructure publique have established governance rules for planning infrastructure investments as well as for the management of public infrastructures (see Appendix 1). Since 2014, the Secrétariat du Conseil du trésor has been working toward developing governance rules and therefore improving the monitoring and performance of strategic projects under the Québec Infrastructure Plan. To ensure its leadership in the governance of major projects, governance committee meetings were held regularly in 2014-2015. They allowed the Government to be better informed about major projects, particularly those involving a high level of risk and important issues. With better information, it becomes possible to propose targeted actions to appropriate departments and bodies and to ensure more rigorous monitoring, which also addresses issues raised. 3.1. Revised governance rules for projects that cost less than $50 million Governance rules concerning project management, approval and monitoring will continue to be strengthened in the coming year in order to allow the Government to emphasize its rigorous management of infrastructure investment and to maximize received value. On that point, the amounts invested in infrastructure projects that cost less than $50 million will be subject to a rigorous planning, management and monitoring process. Over the course of the 2014-2015 fiscal year, an update of the general overview of existing departmental and body project management practices and processes was carried out. In addition, research and monitoring was initiated in order to identify the best practices in the field. These activities will continue in 2015-2016 in order to develop governance rules for the supervision of departments and bodies for projects that cost less than $50 million.
Rigorous, responsible management of public infrastructures 17
4. A new evaluation of the condition of infrastructures and the asset maintenance deficit
Government infrastructure management is a major challenge. It is therefore essential that the Government have the information necessary to prioritize investments earmarked for repairing and maintaining infrastructures. The appraisal of investment needs and their prioritization should be based on knowledge of the condition of infrastructures in order to determine the priorities for action and to evaluate the pace of the required investments or interventions. Sustainability or durability of infrastructures makes it possible to provide an expected level of services while remaining reliable, efficient and safe for users. This sustainability is generally ensured when the recorded condition of infrastructure corresponds to what it should normally be, taking into account its age and useful lifespan, if it has undergone necessary repairs and asset maintenance. When infrastructure maintenance and repairs are not carried out in a timely manner, the structure's sustainability is affected and an asset maintenance deficit could be recorded. In this respect, the 2014-2015 fiscal year will have been a pivotal year since the guidelines were developed in order to establish common parameters for the development of a management framework for each body that would create and maintain a list of public infrastructure inventory, including the evaluation of their condition, asset maintenance deficit and replacement value. As a result of this process, the Annual Management Plans for Public Infrastructure Investments will be presented for the first time in Part III of this report. They represent an unprecedented exercise in transparency that gives an overview of infrastructure conditions and asset maintenance deficits. As mentioned in recent years, the 2015-2025 Québec Infrastructure Plan will encourage investments that will address the issue and work toward eliminating the asset maintenance deficit. Therefore, for all infrastructures over the next ten years, the plan forecasts $31.3 billion for asset maintenance, $6.0 billion for eliminating the asset maintenance deficit and $14.5 billion for replacing existing infrastructures, many of which will make it possible to eliminate significant asset maintenance deficits. In the fiscal years ahead, work will be carried out to complete the portrait of infrastructures presented in the Annual Management Plans for Public Infrastructure Investments. In addition, other information will be added so that bodies can present the evolution of their asset management deficit and forecast the impact of their investments on this deficit and on the condition of their infrastructures.
18 Rigorous, responsible management of public infrastructures
5. Continuous improvement in transparency and management
In addition to rigorous management, in 2015-2016 the Government will continue its efforts to improve its practices in transparency, so that the citizens can judge for themselves the legitimacy of the Government's investment choices and decisions aimed at allowing Québec to move forward and prosper. The 2014-2024 Québec Infrastructure Plan presented a list of all projects costing $50 million or more for the first time. For the 2015-2025 Québec Infrastructure Plan, this list has been improved by specifically presenting the investments for the current year as projects "in progress." In addition, all investments aimed at replacing infrastructure will now be specifically presented as additions. This is a reclassification of certain information presented in the Québec Infrastructure Plan that will more accurately reflect the Government's choice to prioritize the maintenance of services. The Government will also carry out additional action for transparency by releasing a large number of interventions related to major projects in progress to the public. Therefore, as with the Turcot interchange project, which will be the subject of increased transparency regarding contractual aspects and the monitoring of construction in relation to scheduling and costs, the Government will gradually integrate, starting in fall 2015, all major projects "in progress" on the "www.donnees.gouv.qc.ca" site. This will allow the public to have access to the same information as for the Turcot interchange project. Lastly, for the first time, the Government is presenting Annual Management Plans for Public Infrastructure Investments. These plans will contribute to a better portrait of the condition of public infrastructures, evaluated according to a new government condition index, and of their asset maintenance deficit.
PART II 2015-2025 Québec
Infrastructure Plan

2015-2025 Québec Infrastructure Plan 21
1. Quality infrastructures for All Sectors of Activity
The $88.4 billion investment in infrastructures planned under the 2015-2025 Québec Infrastructure Plan has a direct impact on public services and on the welfare-and quality of life of all citizens. Quality infrastructures enable citizens to benefit from the services they expect. Beyond roads and buildings, more public capital means hospitals, educational institutions, public transit systems, as well as cultural facilities that meet the needs of the population. The infrastructure investments, for which the planning is made public for the next 10 years, is one of the drivers of the Québec economy. They will support economic development directly, and they will have positive medium and long-term advantages on the activity of a large number of sectors. With complete transparency throughout, the 2015-2025 Québec Infrastructure Plan reflects the results of a responsible and rigorous management of infrastructure investments. 1.1. Evolution of public infrastructure investments
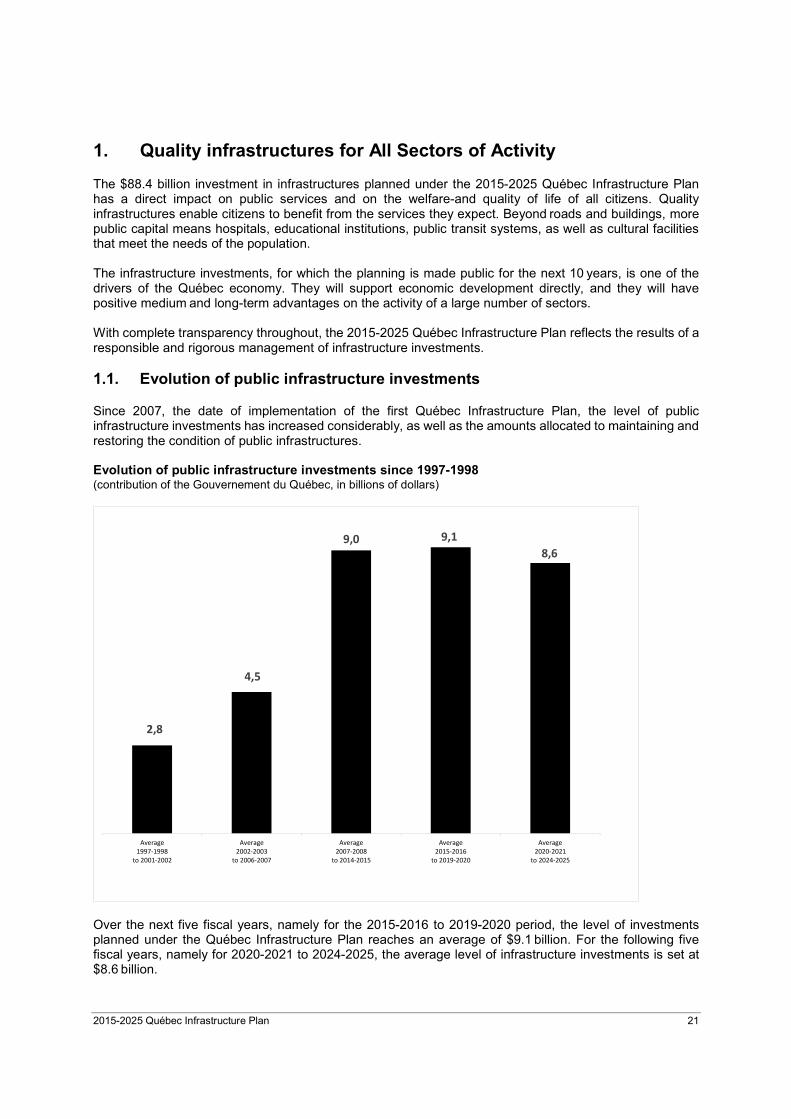
Since 2007, the date of implementation of the first Québec Infrastructure Plan, the level of public infrastructure investments has increased considerably, as well as the amounts allocated to maintaining and restoring the condition of public infrastructures. Evolution of public infrastructure investments since 1997-1998 (contribution of the Gouvernement du Québec, in billions of dollars)
Over the next five fiscal years, namely for the 2015-2016 to 2019-2020 period, the level of investments planned under the Québec Infrastructure Plan reaches an average of $9.1 billion. For the following five fiscal years, namely for 2020-2021 to 2024-2025, the average level of infrastructure investments is set at $8.6 billion.
2,8
4,5
9,0 9,1
8,6
Average1997‐1998
to 2001‐2002
Average2002‐2003
to 2006‐2007
Average2007‐2008
to 2014‐2015
Average2015‐2016
to 2019‐2020
Average2020‐2021
to 2024‐2025
22 2015-2025 Québec Infrastructure Plan
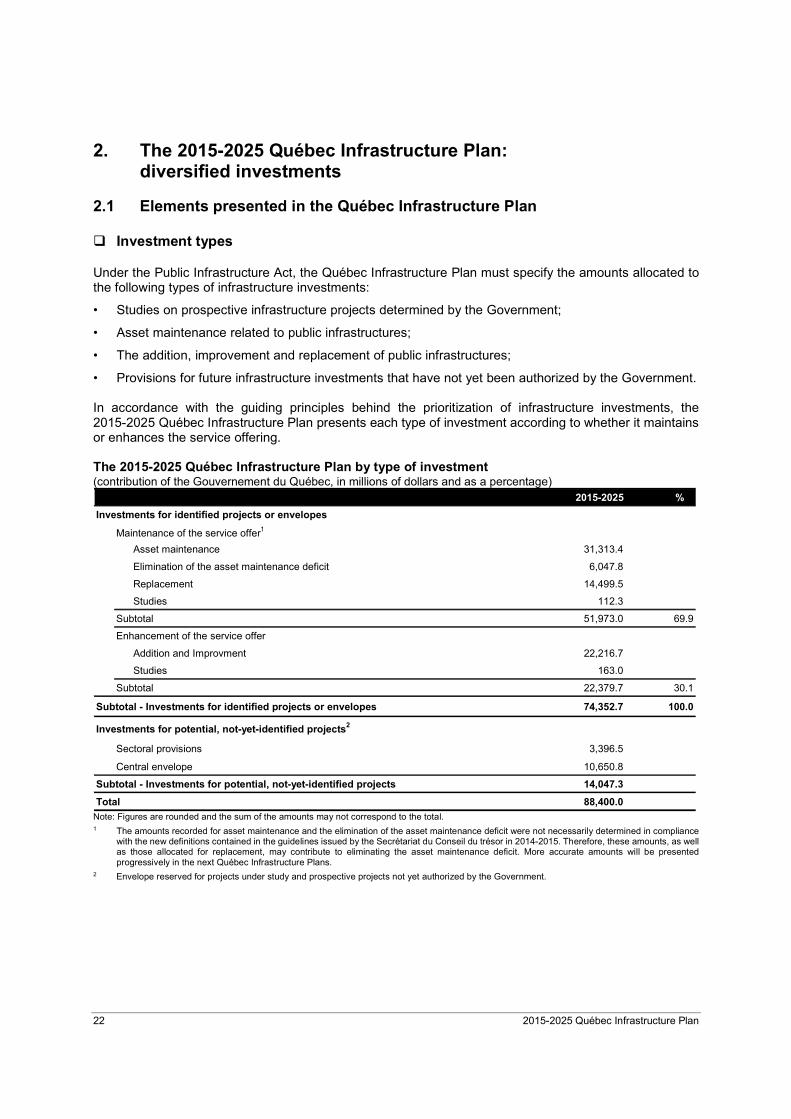
2. The 2015-2025 Québec Infrastructure Plan: diversified investments
2.1 Elements presented in the Québec Infrastructure Plan Investment types
Under the Public Infrastructure Act, the Québec Infrastructure Plan must specify the amounts allocated to the following types of infrastructure investments:
• Studies on prospective infrastructure projects determined by the Government;
• Asset maintenance related to public infrastructures;
• The addition, improvement and replacement of public infrastructures;
• Provisions for future infrastructure investments that have not yet been authorized by the Government. In accordance with the guiding principles behind the prioritization of infrastructure investments, the 2015-2025 Québec Infrastructure Plan presents each type of investment according to whether it maintains or enhances the service offering. The 2015-2025 Québec Infrastructure Plan by type of investment (contribution of the Gouvernement du Québec, in millions of dollars and as a percentage)
2015-2025 %
Investments for identified projects or envelopes
Maintenance of the service offer1
Asset maintenance 31,313.4
Elimination of the asset maintenance deficit 6,047.8
Replacement 14,499.5
Studies 112.3
Subtotal 51,973.0 69.9
Enhancement of the service offer
Addition and Improvment 22,216.7
Studies 163.0
Subtotal 22,379.7 30.1
Subtotal - Investments for identified projects or envelopes 74,352.7 100.0
Investments for potential, not-yet-identified projects2
Sectoral provisions 3,396.5
Central envelope 10,650.8
Subtotal - Investments for potential, not-yet-identified projects 14,047.3
Total 88,400.0
Note: Figures are rounded and the sum of the amounts may not correspond to the total. 1 The amounts recorded for asset maintenance and the elimination of the asset maintenance deficit were not necessarily determined in compliance
with the new definitions contained in the guidelines issued by the Secrétariat du Conseil du trésor in 2014-2015. Therefore, these amounts, as well as those allocated for replacement, may contribute to eliminating the asset maintenance deficit. More accurate amounts will be presented progressively in the next Québec Infrastructure Plans.
2 Envelope reserved for projects under study and prospective projects not yet authorized by the Government.

2015-2025 Québec Infrastructure Plan 23
The allocation of the investments of the 2015-2025 Québec Infrastructure Plan primarily goes to maintaining the current offering of Government services. The amounts forecast for this purpose total nearly $52 billion, or 70% of the total amount allocated to enhancement of the service offer. In addition, investments of over $22 billion are forecast to improve the serving offering, or 30% of the total amount allocated to enhancement of the service offer. Lastly, approximately $14 billion, including $10.7 billion in the central envelope, are forecast for future projects that have not yet been determined by the Government. These projects will be approved by the Government in accordance with the guiding principles behind the prioritization of infrastructure investments. Degrees of advancement
All the infrastructure projects provided for in the 2015-2025 Québec Infrastructure Plan are divided into three categories, according to their degree of advancement.
• The first category includes projects under study. These are start-up projects prioritized by a department or body. To proceed with in-depth analyses, amounts are reserved for the study of these projects in the 2015-2025 Québec Infrastructure Plan. These studies will confirm each project’s relevance and allow for an estimate of its financial needs and risks.
• Projects in the planning stage are classified in a specific category. The total investment amount is then subject to a preliminary evaluation. These projects have not yet been approved in a final form. However, they generate enough interest and the information concerning them is sufficiently documented to provision amounts in the Québec Infrastructure Plan.
• Projects in progress are projects for which the business case is completed and authorized and for which the total investment amount is specified.
The 2015-2025 Québec Infrastructure Plan by degree of advancement (contribution of the Gouvernement du Québec, in millions of dollars and as a percentage)
2015-2025 %
Projects under study 275.3 0.3
Projects in the planning stage (including sectoral provisions and central envelope)1 26,951.5 30.5
Projects in progress (including asset maintenance envelopes)2 61,173.1 69.2
Total 88,400.0 100.0
Note: Figures are rounded and the sum of the amounts may not correspond to the total.
1 Envelope reserved for projects under study and prospective projects not yet determined by the Government. 2 For the purposes of breaking down the investments by degree of advancement, the envelopes dedicated to asset maintenance and elimination of
the asset maintenance deficit are considered "in progress".
24 2015-2025 Québec Infrastructure Plan
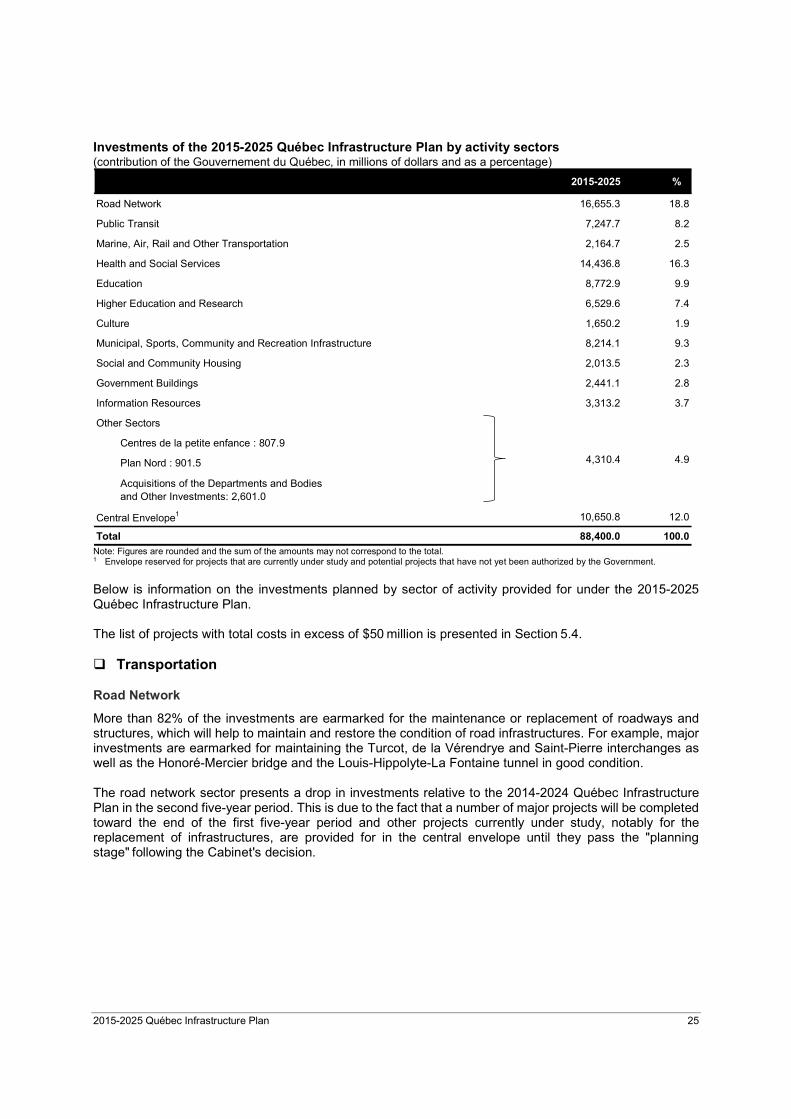
2.2 Activity sectors in the Québec Infrastructure Plan The investments of the 2015-2025 Québec Infrastructure Plan cover all sectors of the Government's activities. Asset maintenance and the replacements, additions and improvements of infrastructures scheduled over the next 10 years have been identified according to priority needs. The infrastructure modernization effort continues under the 2015-2025 Québec Infrastructure Plan and particularly concern transportation, health and social services, higher education and municipal administrations. In the transportation sector, this modernization effort will facilitate citizen and worker mobility, and trade between companies. In health and social services, it will contribute to increasing the public's welfare and health, and improve access to the health network. In higher education and research, the effort will improve training of students and workers as well as research and innovation, leading determinants of the productivity of Québec businesses. In the municipal sector, it will represent a major location factor for families and businesses. The investments of the 2015-2025 Québec Infrastructure Plan cover all sectors of the Government’s activities.
• Road Network: highways, bridges, interchanges and overpasses.
• Public Transit: metro, buses, commuter trains, platforms, stations and tracks.
• Marine, Air, Rail and Other Transportation: ferries, wharves, stations, northern airports, railways and local roads.
• Health and Social Services: hospital centres, CLSCs, CHSLDs.
• Education: schools.
• Higher Education and Research: CEGEPs, universities, research laboratories.
• Culture: museums, libraries.
• Municipal, Sports, Community and Recreation Infrastructures: water treatment plants, aqueduct and sewer networks, multipurpose complexes, biomethanation and composting plants, sports facilities, national parks.
• Social and Community Housing.
• Government Buildings: government offices, courthouses, detention centres, Sûreté du Québec stations.
• Information Resources: information resources projects and equipment of departments and bodies.
• Other Sectors: Childcare centres, the Plan Nord, public dams, acquisitions of movable and immovable property by departments and bodies.
2015-2025 Québec Infrastructure Plan 25
Investments of the 2015-2025 Québec Infrastructure Plan by activity sectors (contribution of the Gouvernement du Québec, in millions of dollars and as a percentage)
2015-2025 %
Road Network 16,655.3 18.8
Public Transit 7,247.7 8.2
Marine, Air, Rail and Other Transportation 2,164.7 2.5
Health and Social Services 14,436.8 16.3
Education 8,772.9 9.9
Higher Education and Research 6,529.6 7.4
Culture 1,650.2 1.9
Municipal, Sports, Community and Recreation Infrastructure 8,214.1 9.3
Social and Community Housing 2,013.5 2.3
Government Buildings 2,441.1 2.8
Information Resources 3,313.2 3.7
Other Sectors
Centres de la petite enfance : 807.9
Plan Nord : 901.5
Acquisitions of the Departments and Bodies and Other Investments: 2,601.0
Central Envelope1 10,650.8 12.0
Total 88,400.0 100.0
4.94,310.4
Note: Figures are rounded and the sum of the amounts may not correspond to the total. 1 Envelope reserved for projects that are currently under study and potential projects that have not yet been authorized by the Government.
Below is information on the investments planned by sector of activity provided for under the 2015-2025 Québec Infrastructure Plan. The list of projects with total costs in excess of $50 million is presented in Section 5.4. Transportation
Road Network
More than 82% of the investments are earmarked for the maintenance or replacement of roadways and structures, which will help to maintain and restore the condition of road infrastructures. For example, major investments are earmarked for maintaining the Turcot, de la Vérendrye and Saint-Pierre interchanges as well as the Honoré-Mercier bridge and the Louis-Hippolyte-La Fontaine tunnel in good condition. The road network sector presents a drop in investments relative to the 2014-2024 Québec Infrastructure Plan in the second five-year period. This is due to the fact that a number of major projects will be completed toward the end of the first five-year period and other projects currently under study, notably for the replacement of infrastructures, are provided for in the central envelope until they pass the "planning stage" following the Cabinet's decision.
26 2015-2025 Québec Infrastructure Plan
The Turcot interchange replacement project is now in the "in progress" phase. This project, is evaluated at $3.7 billion, following the signing of the contract by the Government in February 2015 for the design and construction of the main infrastructures. All the major projects in progress are continuing. In this regard, more than $2.8 billion is earmarked for addition and infrastructure improvement projects. These investments will be allocated as follows:
• To phases I and II of the redevelopment of Route 185 between Autoroute 20 and the New Brunswick border;
• For the extension of Autoroute 73 between Saint-Joseph-de-Beauce and Saint-Georges;
• To phase I of the extension of Autoroute 410 in Sherbrooke;
• For the permanent relocation of Route 112 in Thetford Mines. A number of projects are under study or in the planning stage throughout Québec's regions, including:
• Work on the Félix-Leclerc / Laurentien interchange in Québec City;
• The partial covering over of Autoroute Ville-Marie in Montréal. New projects are under study, including the extension of two sections of Route 138 and major repair of the Québec bridge deck. Ongoing studies for other projects are continuing, including phase II of the widening of Autoroute Henri-IV in Québec City (components 1, 2 and 3), the repair of Autoroute Métropolitaine and major repairs to the Louis-Hippolyte-La Fontaine Bridge Tunnel. Public Transit
All the major projects in progress are continuing. This is the case for the replacement of metro cars as well as for the Montréal metro renovation programs. Amounts are also provided for a number of projects, including the construction of maintenance centres in Pointe-Saint-Charles and Lachine for commuter trains operated by the Agence métropolitaine de transport, as well as the implementation of a reserved lane along the Pie-IX corridor between downtown Montréal and Laval. Projects under study include two public transit system projects entrusted to the Caisse de dépôt et placement du Québec: the new Champlain Bridge project and another project for the implementation Train de l'Ouest, including service to Pierre-Elliot-Trudeau International airport. Marine, Air, Rail and Other Transportation
Amounts are allocated for the construction of three ferries by the Société des traversiers du Québec. With regard to the implementation of the Maritime Strategy, funds are specifically allocated for various port projects and for shore-based electrical power for vessels in the ports of Montréal and Québec City. Health and Social Services
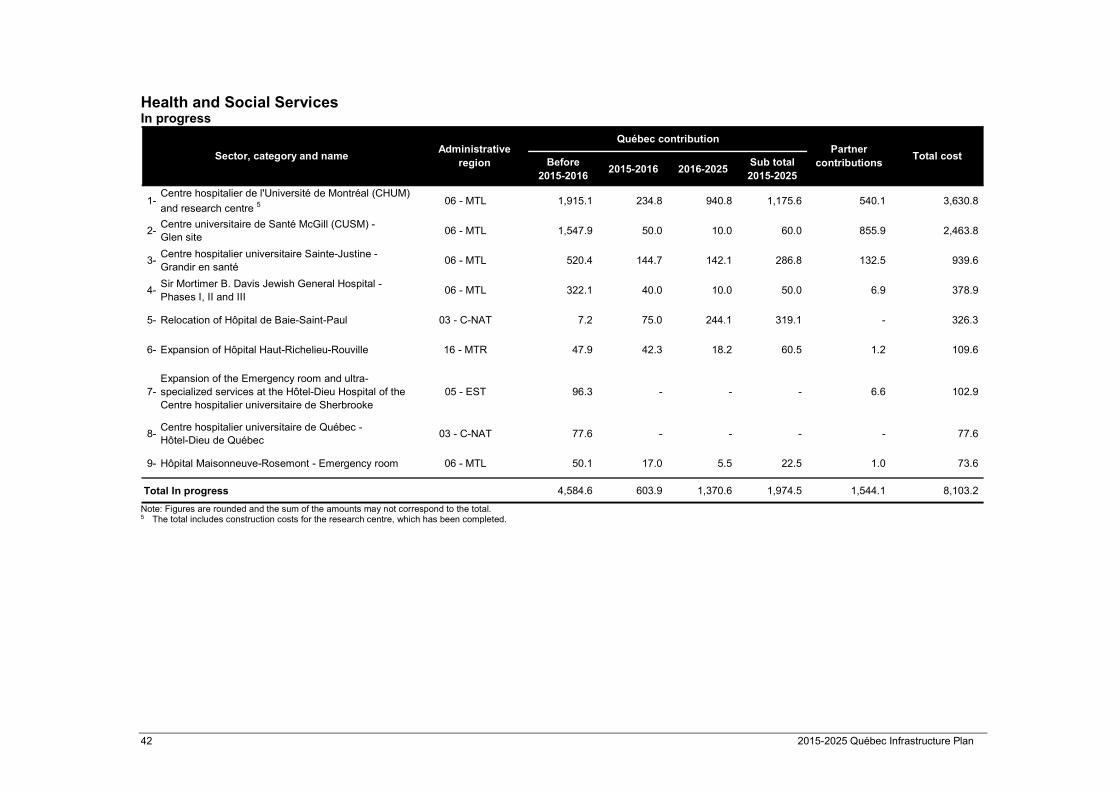
About ten major projects are in progress and continuing, including the construction of the Centre hospitalier de l’Université de Montréal (CHUM), the expansion of the Centre hospitalier universitaire Sainte-Justine, the expansion of the Hôpital du Haut-Richelieu-Rouville and the relocation of Hôpital de Baie-Saint-Paul.
2015-2025 Québec Infrastructure Plan 27
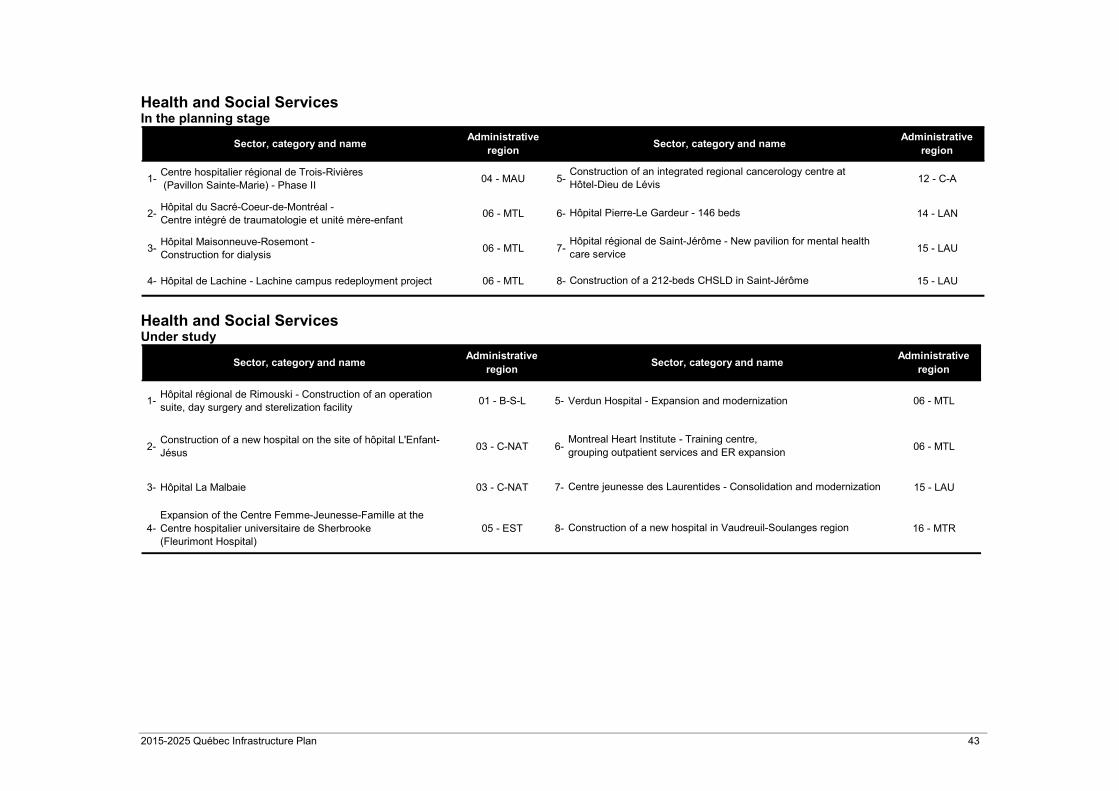
A number of projects are under study or in the planning stage throughout Québec's regions, including:
• The construction of a new hospital on the Hôpital de l’Enfant-Jésus site in Québec City;
• The construction of the Centre régional intégré de cancérologie at the Hôtel-Dieu de Lévis;
• The construction of a new hospital in Vaudreuil-Soulanges;
• The construction of the Centre intégré de traumatologie et l’unité mère-enfant at Hôpital du Sacré-Cœur-de-Montréal;
• A new wing at Hôpital de Verdun;
• The expansion of the Centre Femme-Jeunesse-Famille at Hôpital Fleurimont du Centre hospitalier universitaire de Sherbrooke;
• The redeployment of the Lachine campus to Lachine Hospital;
• The construction of a new mental health pavilion at Hôpital régional de Saint-Jérôme. More than $10 billion is allocated for asset maintenance, elimination of the asset maintenance deficit and replacement of real estate infrastructures and medical equipment at the network's establishments. Education
Priority is given to asset maintenance and elimination of the maintenance deficit. They represent close to 80% of the sector's investments, or more than $7.0 billion. A $1.0 billion new envelope is earmarked for the addition and expansion of schools in order to meet 2015-2016 needs and to ensure provisions in this regard for subsequent years of the 2015-2025 Québec Infrastructure Plan. Higher Education and Research
Higher Education and Research investments have been increased by more than $450.0 million relative to the previous Québec Infrastructure Plan. Asset maintenance, elimination of the maintenance deficit and replacement are priorities. More than $5.6 billion will be earmarked, accounting for 86% of the sector's investments. McGill University is carrying out a study to find a new vocation for the Royal Victoria Hospital site. Culture
Over 83% of the total envelope, or close to $1.4 billion, is earmarked to maintain, replace and restore the condition of cultural infrastructures. Investments in the digital cultural Strategy as well as repairs and extension work to the Wilder building are continuing. Municipal, Sports, Community and Recreation Infrastructure
A $5.8-billion amount is forecast for asset maintenance pertaining to the upgrade to standards of drinking water installations, underground networks and wastewater treatment, with $1.8 billion allocated to the Strategy for the Management of Municipal Wastewater Effluent. Over $1.0 billion is earmarked for the addition and improvement of municipal infrastructures.
28 2015-2025 Québec Infrastructure Plan
Government contributions in excess of $350.0 million are allocated to the biomethanation and composting programs. An envelope of nearly $900.0 million is forecast for sports, recreation and tourist infrastructures, notably as part of the Maritime Strategy. Social and Community Housing
An amount in excess of $1.0 billion is earmarked for the renovation of Social and Community Housing and close to $1.0 billion for the construction of new housing units. In this regard, the construction of 1,500 new social and community housing units will be announced in the 2015-2016 budget. Government Buildings
Construction work pertaining to detention facilities is in progress in Sorel-Tracy, Amos and Sept-Îles. Studies for the construction of an office building on the Îlot Voyageur site in Montréal and the Estimauvillle site in Québec City are continuing. Information Resources
A number of information resources projects of departments and bodies will continue, notably projects related to technological infrastructures and to mission systems. Other Sectors
More than $900.0 million is allocated for infrastructures related to the development and implementation of the Plan Nord. The envelopes provided for under the 2015-2025 Québec Infrastructure Plan for childcare centres amount to over $800.0 million. The Ministère de la Famille is currently assessing the impact of the revision of the infrastructures financial program of the childcare centres in recent months. More than $2.6 billion is forecast for acquisitions of movable and immovable property by departments and bodies, including vehicles and equipment
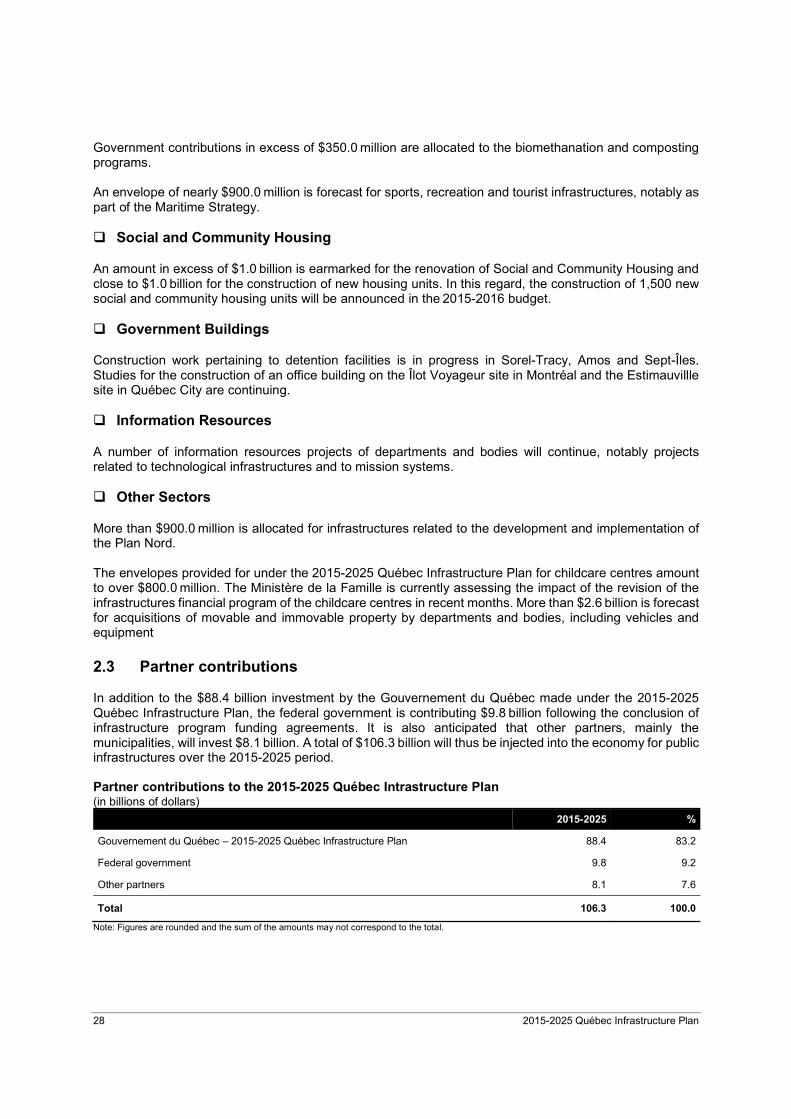
2.3 Partner contributions In addition to the $88.4 billion investment by the Gouvernement du Québec made under the 2015-2025 Québec Infrastructure Plan, the federal government is contributing $9.8 billion following the conclusion of infrastructure program funding agreements. It is also anticipated that other partners, mainly the municipalities, will invest $8.1 billion. A total of $106.3 billion will thus be injected into the economy for public infrastructures over the 2015-2025 period. Partner contributions to the 2015-2025 Québec Intrastructure Plan (in billions of dollars)
2015-2025 %
Gouvernement du Québec – 2015-2025 Québec Infrastructure Plan 88.4 83.2
Federal government 9.8 9.2
Other partners 8.1 7.6
Total 106.3 100.0
Note: Figures are rounded and the sum of the amounts may not correspond to the total.
2015-2025 Québec Infrastructure Plan 29
3. Projects whose costs exceed $50 million
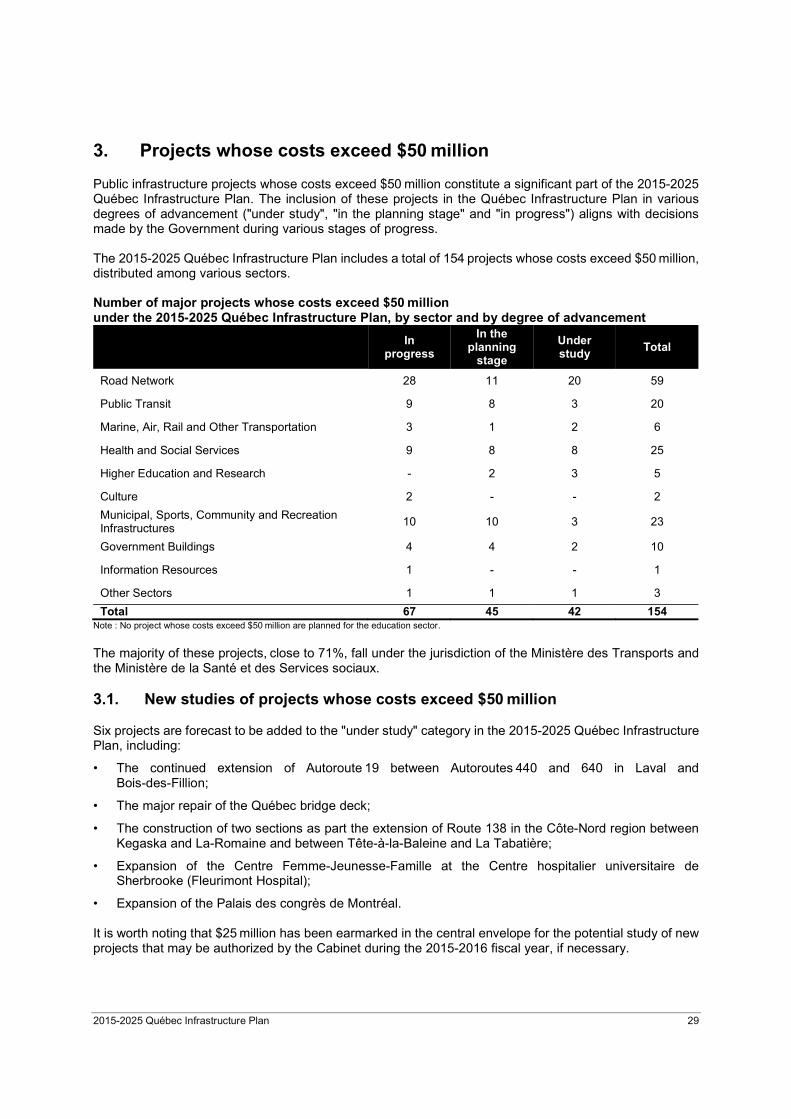
Public infrastructure projects whose costs exceed $50 million constitute a significant part of the 2015-2025 Québec Infrastructure Plan. The inclusion of these projects in the Québec Infrastructure Plan in various degrees of advancement ("under study", "in the planning stage" and "in progress") aligns with decisions made by the Government during various stages of progress. The 2015-2025 Québec Infrastructure Plan includes a total of 154 projects whose costs exceed $50 million, distributed among various sectors. Number of major projects whose costs exceed $50 million under the 2015-2025 Québec Infrastructure Plan, by sector and by degree of advancement
In progress
In the planning
stage
Under study
Total
Road Network 28 11 20 59
Public Transit 9 8 3 20
Marine, Air, Rail and Other Transportation 3 1 2 6
Health and Social Services 9 8 8 25
Higher Education and Research - 2 3 5
Culture 2 - - 2
Municipal, Sports, Community and Recreation Infrastructures
10 10 3 23
Government Buildings 4 4 2 10
Information Resources 1 - - 1
Other Sectors 1 1 1 3
Total 67 45 42 154Note : No project whose costs exceed $50 million are planned for the education sector.
The majority of these projects, close to 71%, fall under the jurisdiction of the Ministère des Transports and the Ministère de la Santé et des Services sociaux. 3.1. New studies of projects whose costs exceed $50 million Six projects are forecast to be added to the "under study" category in the 2015-2025 Québec Infrastructure Plan, including:
• The continued extension of Autoroute 19 between Autoroutes 440 and 640 in Laval and Bois-des-Fillion;
• The major repair of the Québec bridge deck;
• The construction of two sections as part the extension of Route 138 in the Côte-Nord region between Kegaska and La-Romaine and between Tête-à-la-Baleine and La Tabatière;
• Expansion of the Centre Femme-Jeunesse-Famille at the Centre hospitalier universitaire de Sherbrooke (Fleurimont Hospital);
• Expansion of the Palais des congrès de Montréal. It is worth noting that $25 million has been earmarked in the central envelope for the potential study of new projects that may be authorized by the Cabinet during the 2015-2016 fiscal year, if necessary.
30 2015-2025 Québec Infrastructure Plan
4. Positive impacts of new infrastructure investments on the economy
Supporting economic development
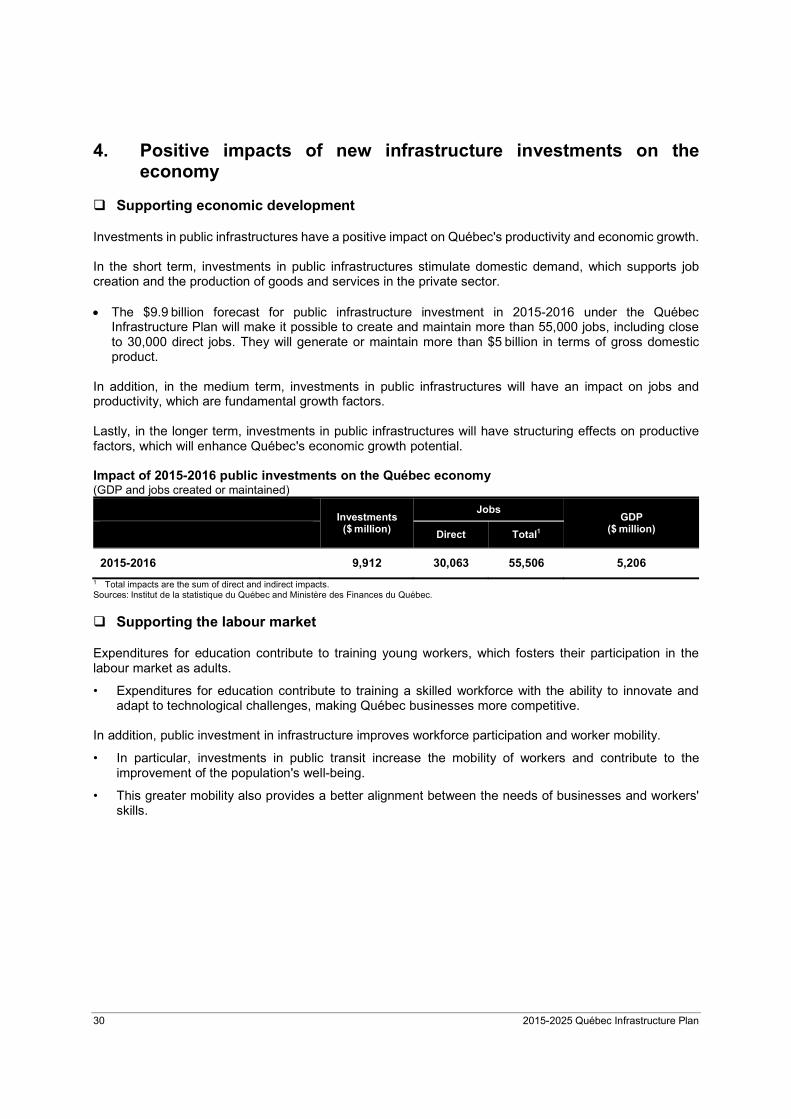
Investments in public infrastructures have a positive impact on Québec's productivity and economic growth. In the short term, investments in public infrastructures stimulate domestic demand, which supports job creation and the production of goods and services in the private sector. The $9.9 billion forecast for public infrastructure investment in 2015-2016 under the Québec
Infrastructure Plan will make it possible to create and maintain more than 55,000 jobs, including close to 30,000 direct jobs. They will generate or maintain more than $5 billion in terms of gross domestic product.
In addition, in the medium term, investments in public infrastructures will have an impact on jobs and productivity, which are fundamental growth factors. Lastly, in the longer term, investments in public infrastructures will have structuring effects on productive factors, which will enhance Québec's economic growth potential. Impact of 2015-2016 public investments on the Québec economy (GDP and jobs created or maintained)
Investments
($ million)
Jobs GDP
($ million) Direct Total1
2015-2016 9,912 30,063 55,506 5,206
1 Total impacts are the sum of direct and indirect impacts. Sources: Institut de la statistique du Québec and Ministère des Finances du Québec.
Supporting the labour market
Expenditures for education contribute to training young workers, which fosters their participation in the labour market as adults.
• Expenditures for education contribute to training a skilled workforce with the ability to innovate and adapt to technological challenges, making Québec businesses more competitive.
In addition, public investment in infrastructure improves workforce participation and worker mobility.
• In particular, investments in public transit increase the mobility of workers and contribute to the improvement of the population's well-being.
• This greater mobility also provides a better alignment between the needs of businesses and workers' skills.
2015-2025 Québec Infrastructure Plan 31
Stimulating private investment
Investment in public capital acts as a catalyst by creating favourable conditions for private investment and by augmenting anticipated benefits.
• High-quality public infrastructures and a qualified workforce help maintain a favourable business climate and make Québec more attractive for foreign investment.
• Expenditures in transportation facilitate the mobility of goods and services, which helps create business opportunities that generate new investments.
• The construction of new public infrastructures, such as that undertaken under the Plan Nord, increases the potential for developing resources in remote regions, which helps create jobs in these regions.
Investments in public infrastructures are an important tool for the Gouvernement du Québec in stimulating private investment.
32 2015-2025 Québec Infrastructure Plan
5. Summary presentation tables of investments under the 2015-2025 Québec Infrastructure Plan and list of projects whose costs exceed $50 million
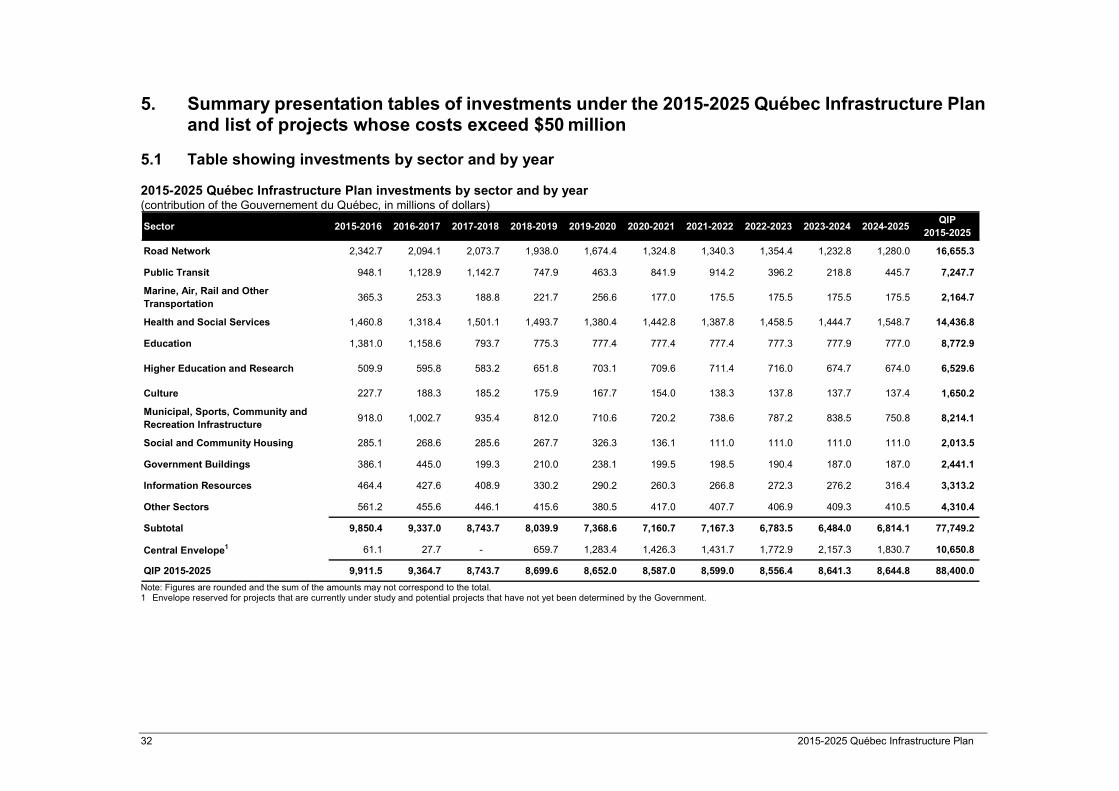
5.1 Table showing investments by sector and by year 2015-2025 Québec Infrastructure Plan investments by sector and by year (contribution of the Gouvernement du Québec, in millions of dollars)
Sector 2015-2016 2016-2017 2017-2018 2018-2019 2019-2020 2020-2021 2021-2022 2022-2023 2023-2024 2024-2025QIP
2015-2025
Road Network 2,342.7 2,094.1 2,073.7 1,938.0 1,674.4 1,324.8 1,340.3 1,354.4 1,232.8 1,280.0 16,655.3
Public Transit 948.1 1,128.9 1,142.7 747.9 463.3 841.9 914.2 396.2 218.8 445.7 7,247.7
Marine, Air, Rail and Other Transportation
365.3 253.3 188.8 221.7 256.6 177.0 175.5 175.5 175.5 175.5 2,164.7
Health and Social Services 1,460.8 1,318.4 1,501.1 1,493.7 1,380.4 1,442.8 1,387.8 1,458.5 1,444.7 1,548.7 14,436.8
Education 1,381.0 1,158.6 793.7 775.3 777.4 777.4 777.4 777.3 777.9 777.0 8,772.9
Higher Education and Research 509.9 595.8 583.2 651.8 703.1 709.6 711.4 716.0 674.7 674.0 6,529.6
Culture 227.7 188.3 185.2 175.9 167.7 154.0 138.3 137.8 137.7 137.4 1,650.2
Municipal, Sports, Community and Recreation Infrastructure
918.0 1,002.7 935.4 812.0 710.6 720.2 738.6 787.2 838.5 750.8 8,214.1
Social and Community Housing 285.1 268.6 285.6 267.7 326.3 136.1 111.0 111.0 111.0 111.0 2,013.5
Government Buildings 386.1 445.0 199.3 210.0 238.1 199.5 198.5 190.4 187.0 187.0 2,441.1
Information Resources 464.4 427.6 408.9 330.2 290.2 260.3 266.8 272.3 276.2 316.4 3,313.2
Other Sectors 561.2 455.6 446.1 415.6 380.5 417.0 407.7 406.9 409.3 410.5 4,310.4
Subtotal 9,850.4 9,337.0 8,743.7 8,039.9 7,368.6 7,160.7 7,167.3 6,783.5 6,484.0 6,814.1 77,749.2
Central Envelope1 61.1 27.7 - 659.7 1,283.4 1,426.3 1,431.7 1,772.9 2,157.3 1,830.7 10,650.8
QIP 2015-2025 9,911.5 9,364.7 8,743.7 8,699.6 8,652.0 8,587.0 8,599.0 8,556.4 8,641.3 8,644.8 88,400.0
Note: Figures are rounded and the sum of the amounts may not correspond to the total. 1 Envelope reserved for projects that are currently under study and potential projects that have not yet been determined by the Government.
2015-2025 Québec Infrastructure Plan 33
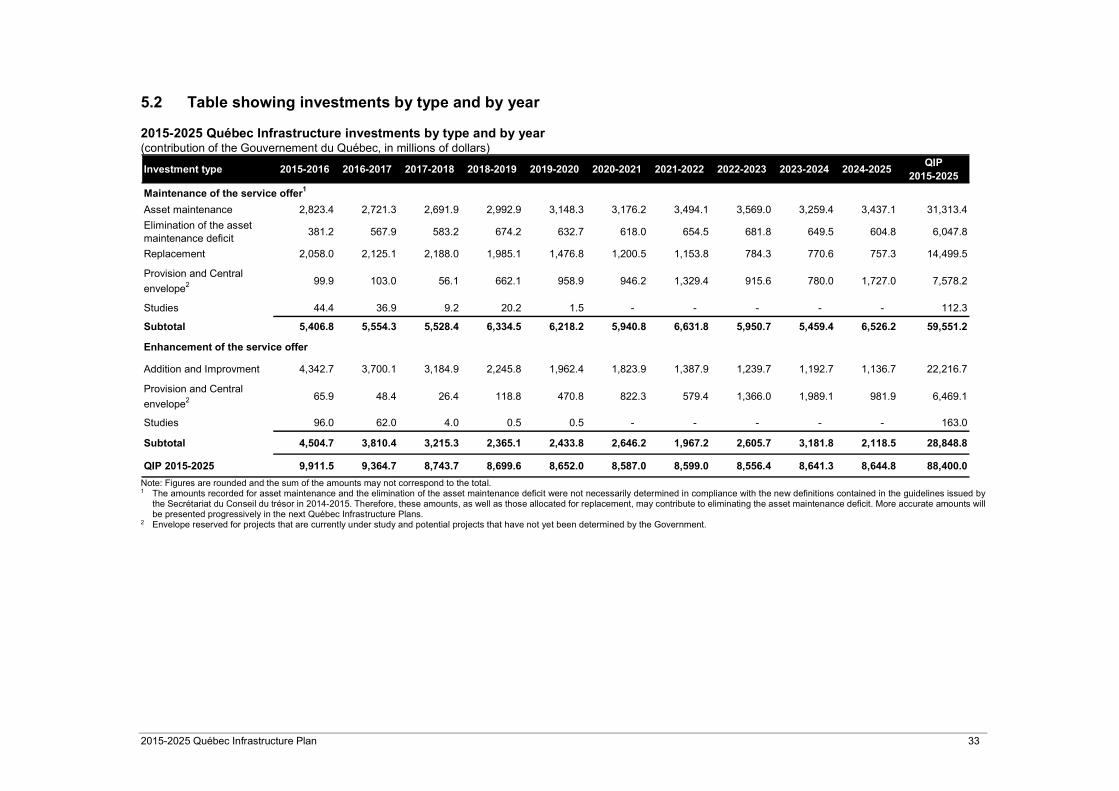
5.2 Table showing investments by type and by year 2015-2025 Québec Infrastructure investments by type and by year (contribution of the Gouvernement du Québec, in millions of dollars)
Investment type 2015-2016 2016-2017 2017-2018 2018-2019 2019-2020 2020-2021 2021-2022 2022-2023 2023-2024 2024-2025QIP
2015-2025
Asset maintenance 2,823.4 2,721.3 2,691.9 2,992.9 3,148.3 3,176.2 3,494.1 3,569.0 3,259.4 3,437.1 31,313.4
Elimination of the asset maintenance deficit
381.2 567.9 583.2 674.2 632.7 618.0 654.5 681.8 649.5 604.8 6,047.8
Replacement 2,058.0 2,125.1 2,188.0 1,985.1 1,476.8 1,200.5 1,153.8 784.3 770.6 757.3 14,499.5
Provision and Central
envelope2 99.9 103.0 56.1 662.1 958.9 946.2 1,329.4 915.6 780.0 1,727.0 7,578.2
Studies 44.4 36.9 9.2 20.2 1.5 - - - - - 112.3
Subtotal 5,406.8 5,554.3 5,528.4 6,334.5 6,218.2 5,940.8 6,631.8 5,950.7 5,459.4 6,526.2 59,551.2
Addition and Improvment 4,342.7 3,700.1 3,184.9 2,245.8 1,962.4 1,823.9 1,387.9 1,239.7 1,192.7 1,136.7 22,216.7
Provision and Central
envelope2 65.9 48.4 26.4 118.8 470.8 822.3 579.4 1,366.0 1,989.1 981.9 6,469.1
Studies 96.0 62.0 4.0 0.5 0.5 - - - - - 163.0
Subtotal 4,504.7 3,810.4 3,215.3 2,365.1 2,433.8 2,646.2 1,967.2 2,605.7 3,181.8 2,118.5 28,848.8
QIP 2015-2025 9,911.5 9,364.7 8,743.7 8,699.6 8,652.0 8,587.0 8,599.0 8,556.4 8,641.3 8,644.8 88,400.0
Maintenance of the service offer1
Enhancement of the service offer
Note: Figures are rounded and the sum of the amounts may not correspond to the total. 1 The amounts recorded for asset maintenance and the elimination of the asset maintenance deficit were not necessarily determined in compliance with the new definitions contained in the guidelines issued by
the Secrétariat du Conseil du trésor in 2014-2015. Therefore, these amounts, as well as those allocated for replacement, may contribute to eliminating the asset maintenance deficit. More accurate amounts will be presented progressively in the next Québec Infrastructure Plans.
2 Envelope reserved for projects that are currently under study and potential projects that have not yet been determined by the Government.
34 2015-2025 Québec Infrastructure Plan
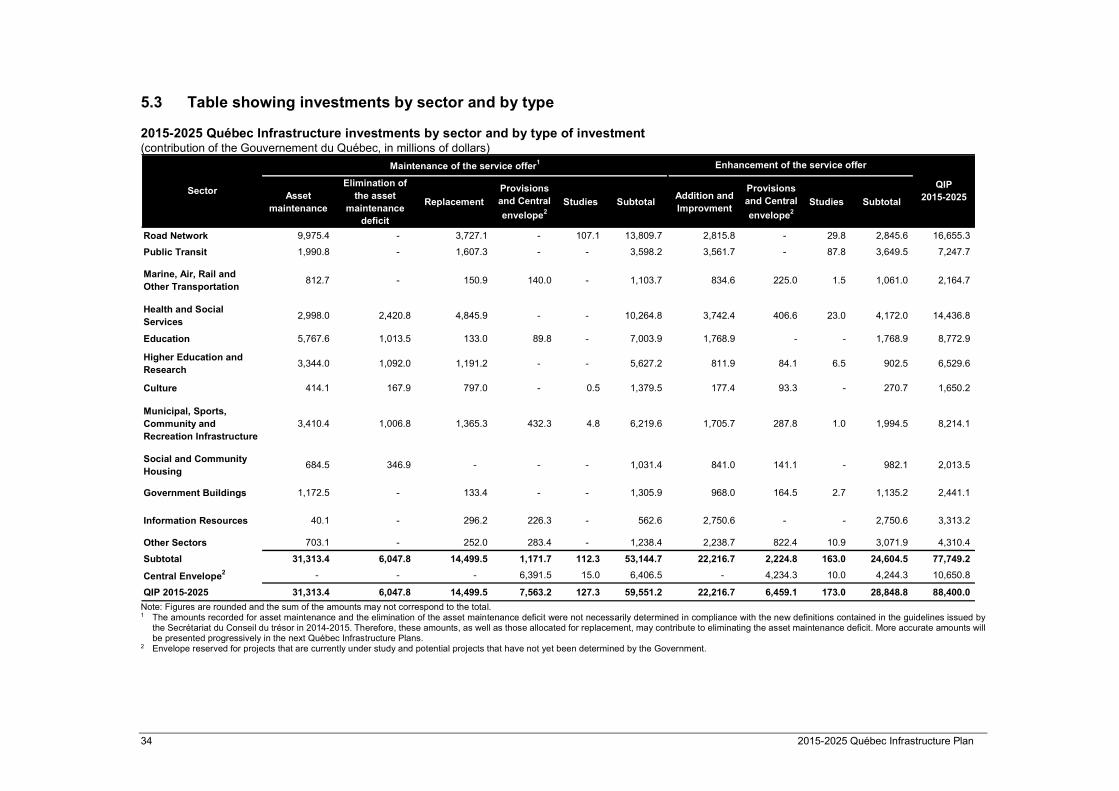
5.3 Table showing investments by sector and by type 2015-2025 Québec Infrastructure investments by sector and by type of investment (contribution of the Gouvernement du Québec, in millions of dollars)
Asset maintenance
Elimination of the asset
maintenance deficit
Replacement
Provisions and Central
envelope2Studies Subtotal
Addition and Improvment
Provisions and Central
envelope2Studies Subtotal
Road Network 9,975.4 - 3,727.1 - 107.1 13,809.7 2,815.8 - 29.8 2,845.6 16,655.3
Public Transit 1,990.8 - 1,607.3 - - 3,598.2 3,561.7 - 87.8 3,649.5 7,247.7
Marine, Air, Rail and Other Transportation
812.7 - 150.9 140.0 - 1,103.7 834.6 225.0 1.5 1,061.0 2,164.7
Health and Social Services
2,998.0 2,420.8 4,845.9 - - 10,264.8 3,742.4 406.6 23.0 4,172.0 14,436.8
Education 5,767.6 1,013.5 133.0 89.8 - 7,003.9 1,768.9 - - 1,768.9 8,772.9
Higher Education and Research
3,344.0 1,092.0 1,191.2 - - 5,627.2 811.9 84.1 6.5 902.5 6,529.6
Culture 414.1 167.9 797.0 - 0.5 1,379.5 177.4 93.3 - 270.7 1,650.2
Municipal, Sports, Community and Recreation Infrastructure
3,410.4 1,006.8 1,365.3 432.3 4.8 6,219.6 1,705.7 287.8 1.0 1,994.5 8,214.1
Social and Community Housing
684.5 346.9 - - - 1,031.4 841.0 141.1 - 982.1 2,013.5
Government Buildings 1,172.5 - 133.4 - - 1,305.9 968.0 164.5 2.7 1,135.2 2,441.1
Information Resources 40.1 - 296.2 226.3 - 562.6 2,750.6 - - 2,750.6 3,313.2
Other Sectors 703.1 - 252.0 283.4 - 1,238.4 2,238.7 822.4 10.9 3,071.9 4,310.4
Subtotal 31,313.4 6,047.8 14,499.5 1,171.7 112.3 53,144.7 22,216.7 2,224.8 163.0 24,604.5 77,749.2
Central Envelope2 - - - 6,391.5 15.0 6,406.5 - 4,234.3 10.0 4,244.3 10,650.8
QIP 2015-2025 31,313.4 6,047.8 14,499.5 7,563.2 127.3 59,551.2 22,216.7 6,459.1 173.0 28,848.8 88,400.0
Sector
Maintenance of the service offer1 Enhancement of the service offer
QIP2015-2025
Note: Figures are rounded and the sum of the amounts may not correspond to the total. 1 The amounts recorded for asset maintenance and the elimination of the asset maintenance deficit were not necessarily determined in compliance with the new definitions contained in the guidelines issued by
the Secrétariat du Conseil du trésor in 2014-2015. Therefore, these amounts, as well as those allocated for replacement, may contribute to eliminating the asset maintenance deficit. More accurate amounts will be presented progressively in the next Québec Infrastructure Plans.
2 Envelope reserved for projects that are currently under study and potential projects that have not yet been determined by the Government.

2015-2025 Québec Infrastructure Plan 35
5.4 List of projects whose costs exceed $50 million Road Network1 In progress
Before2015-2016
2015-2016 2016-2025Sub-total2015-2025
1- Turcot interchange reconstruction 06 - MTL 696.8 589.3 2,387.2 2,976.5 - 3,673.3
2-Construction of a four-lane highway between Québec city and Saguenay (Autoroute 73)
02 - S-L-S-J03 - C-NAT
583.0 1.5 0.4 1.8 386.6 971.4
3-Extension of Autoroute 50 between Doherty and Lachute
07 - OUT 821.6 1.6 - 1.6 43.0 866.3
4-Redevelopment of Route 185 between Autoroute 20 and the New Brunswick border - Phase I and II
01 - B-S-L 432.4 15.2 5.6 20.9 299.7 752.9
5-Extension of Autoroute 73 fromSaint-Joseph-de-Beauce to Saint-Georges
12 - C-A 313.2 44.9 11.6 56.5 40.8 410.5
6-Maintaining the Turcot andDe La Vérendrye interchanges
06 - MTL 258.1 30.0 112.7 142.7 - 400.8
7- Redevelopment of the Dorval Circle (road compenent) 06 - MTL 115.6 34.9 78.5 113.4 113.5 342.5
8- Extension of Route 167 to Mont Otish 10 - N-D-Q 244.3 2.4 - 2.4 - 246.8
9-Extension of Autoroute 35 from Saint-Jean-sur-Richelieu to the U.S. border - Phase I and II
16 - MTR 158.2 5.0 38.8 43.8 44.3 246.2
10- Maintaining the Honoré-Mercier bridge06 - MTL16 - MTR
107.8 23.9 94.5 118.3 - 226.1
11-Extension of Autoroute 20 from Cacouna to Notre-Dame-des-Neiges
01 - B-S-L 196.7 19.0 1.5 20.5 0.5 217.8
12-Redevelopment of the Charest and Robert-Bourassa interchange in Québec city
03 - C-NAT 182.9 0.2 - 0.2 30.5 213.6
13- Extension of Route 138 from Natashquan to Kegaska 09 - C-NOR 200.4 0.8 - 0.8 - 201.2
Sector, category and nameAdministrative
region
Contribution of QuébecPartner
contributionsTotal cost
Note: Figures are rounded and the sum of the amounts may not correspond to the total.
1 The Ministère des Transport's contribution to complete road network projects is borne by the Land Transportation Network Fund.
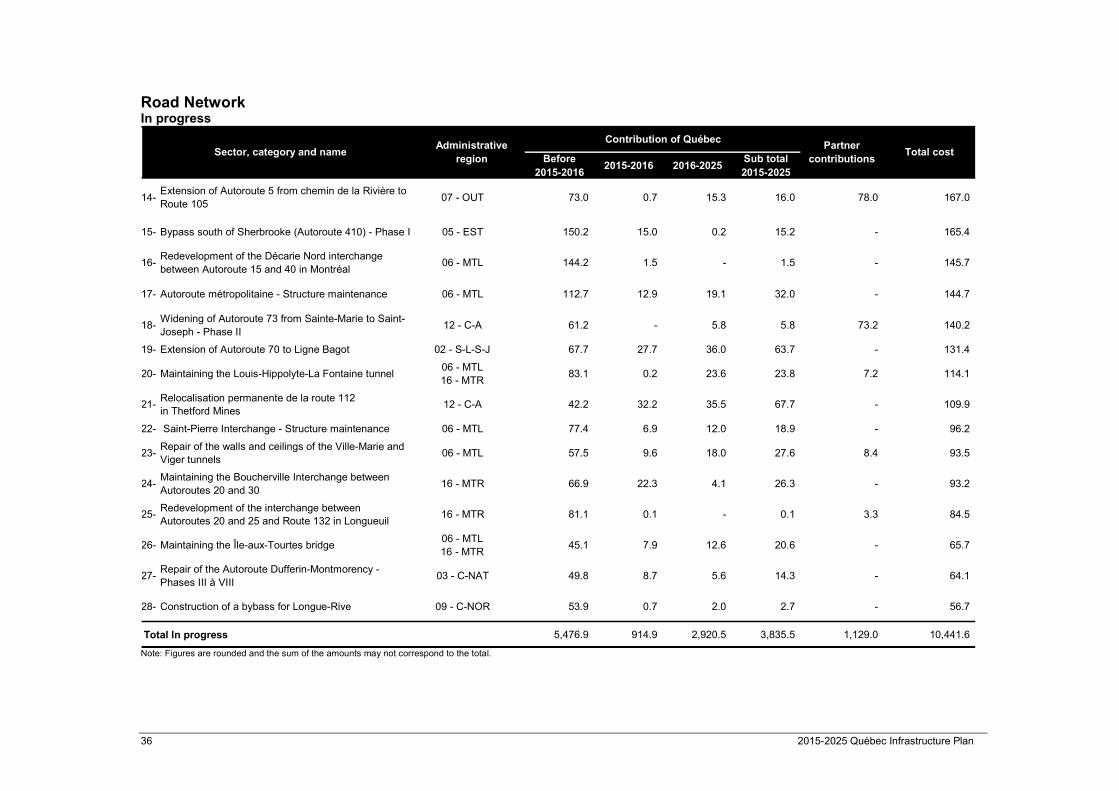
36 2015-2025 Québec Infrastructure Plan
Road Network In progress
Before2015-2016
2015-2016 2016-2025Sub total2015-2025
14-Extension of Autoroute 5 from chemin de la Rivière to Route 105
07 - OUT 73.0 0.7 15.3 16.0 78.0 167.0
15- Bypass south of Sherbrooke (Autoroute 410) - Phase I 05 - EST 150.2 15.0 0.2 15.2 - 165.4
16-Redevelopment of the Décarie Nord interchange between Autoroute 15 and 40 in Montréal
06 - MTL 144.2 1.5 - 1.5 - 145.7
17- Autoroute métropolitaine - Structure maintenance 06 - MTL 112.7 12.9 19.1 32.0 - 144.7
18-Widening of Autoroute 73 from Sainte-Marie to Saint-Joseph - Phase II
12 - C-A 61.2 - 5.8 5.8 73.2 140.2
19- Extension of Autoroute 70 to Ligne Bagot 02 - S-L-S-J 67.7 27.7 36.0 63.7 - 131.4
20- Maintaining the Louis-Hippolyte-La Fontaine tunnel06 - MTL16 - MTR
83.1 0.2 23.6 23.8 7.2 114.1
21-Relocalisation permanente de la route 112 in Thetford Mines
12 - C-A 42.2 32.2 35.5 67.7 - 109.9
22- Saint-Pierre Interchange - Structure maintenance 06 - MTL 77.4 6.9 12.0 18.9 - 96.2
23-Repair of the walls and ceilings of the Ville-Marie and Viger tunnels
06 - MTL 57.5 9.6 18.0 27.6 8.4 93.5
24-Maintaining the Boucherville Interchange between Autoroutes 20 and 30
16 - MTR 66.9 22.3 4.1 26.3 - 93.2
25-Redevelopment of the interchange between Autoroutes 20 and 25 and Route 132 in Longueuil
16 - MTR 81.1 0.1 - 0.1 3.3 84.5
26- Maintaining the Île-aux-Tourtes bridge06 - MTL16 - MTR
45.1 7.9 12.6 20.6 - 65.7
27-Repair of the Autoroute Dufferin-Montmorency - Phases III à VIII
03 - C-NAT 49.8 8.7 5.6 14.3 - 64.1
28- Construction of a bybass for Longue-Rive 09 - C-NOR 53.9 0.7 2.0 2.7 - 56.7
Total In progress 5,476.9 914.9 2,920.5 3,835.5 1,129.0 10,441.6
Sector, category and nameAdministrative
region
Contribution of QuébecPartner
contributionsTotal cost
Note: Figures are rounded and the sum of the amounts may not correspond to the total.
2015-2025 Québec Infrastructure Plan 37
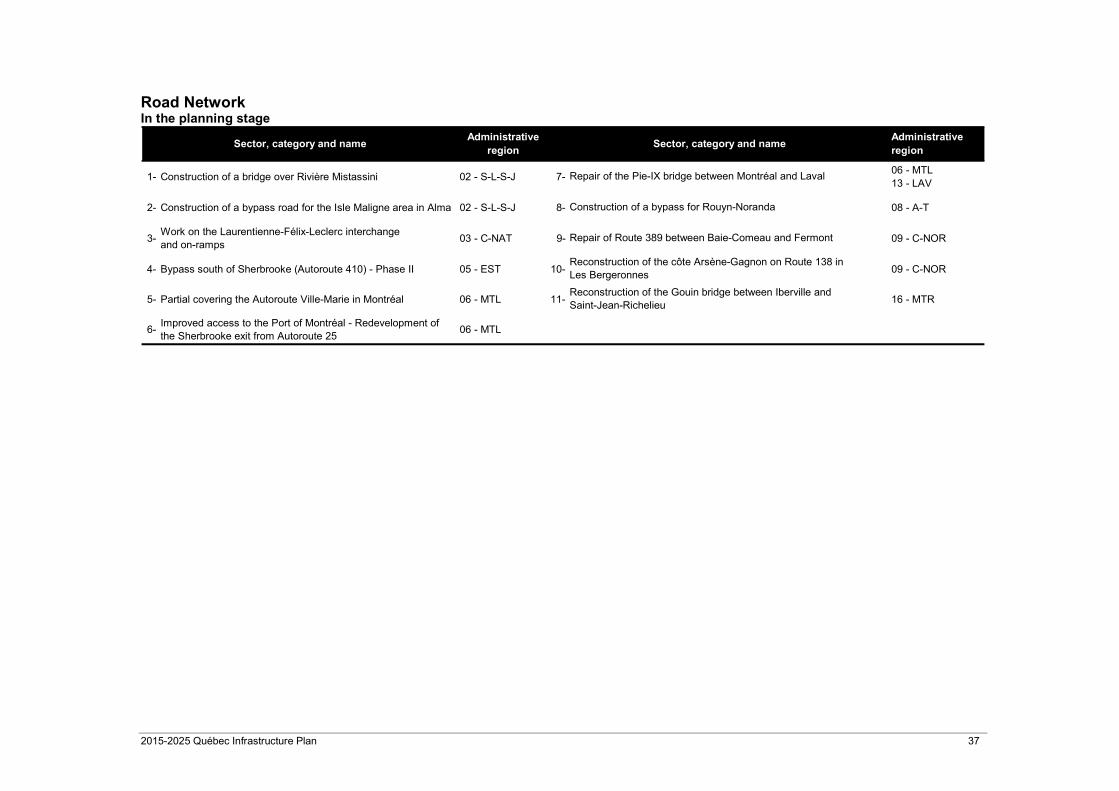
Road Network In the planning stage
1- Construction of a bridge over Rivière Mistassini 02 - S-L-S-J 7-06 - MTL13 - LAV
2- Construction of a bypass road for the Isle Maligne area in Alma 02 - S-L-S-J 8- 08 - A-T
3-Work on the Laurentienne-Félix-Leclerc interchangeand on-ramps
03 - C-NAT 9- 09 - C-NOR
4- Bypass south of Sherbrooke (Autoroute 410) - Phase II 05 - EST 10- 09 - C-NOR
5- Partial covering the Autoroute Ville-Marie in Montréal 06 - MTL 11- 16 - MTR
6-Improved access to the Port of Montréal - Redevelopment of the Sherbrooke exit from Autoroute 25
06 - MTL
Administrative region
Repair of the Pie-IX bridge between Montréal and Laval
Construction of a bypass for Rouyn-Noranda
Repair of Route 389 between Baie-Comeau and Fermont
Sector, category and nameAdministrative
regionSector, category and name
Reconstruction of the Gouin bridge between Iberville and Saint-Jean-Richelieu
Reconstruction of the côte Arsène-Gagnon on Route 138 in Les Bergeronnes
38 2015-2025 Québec Infrastructure Plan
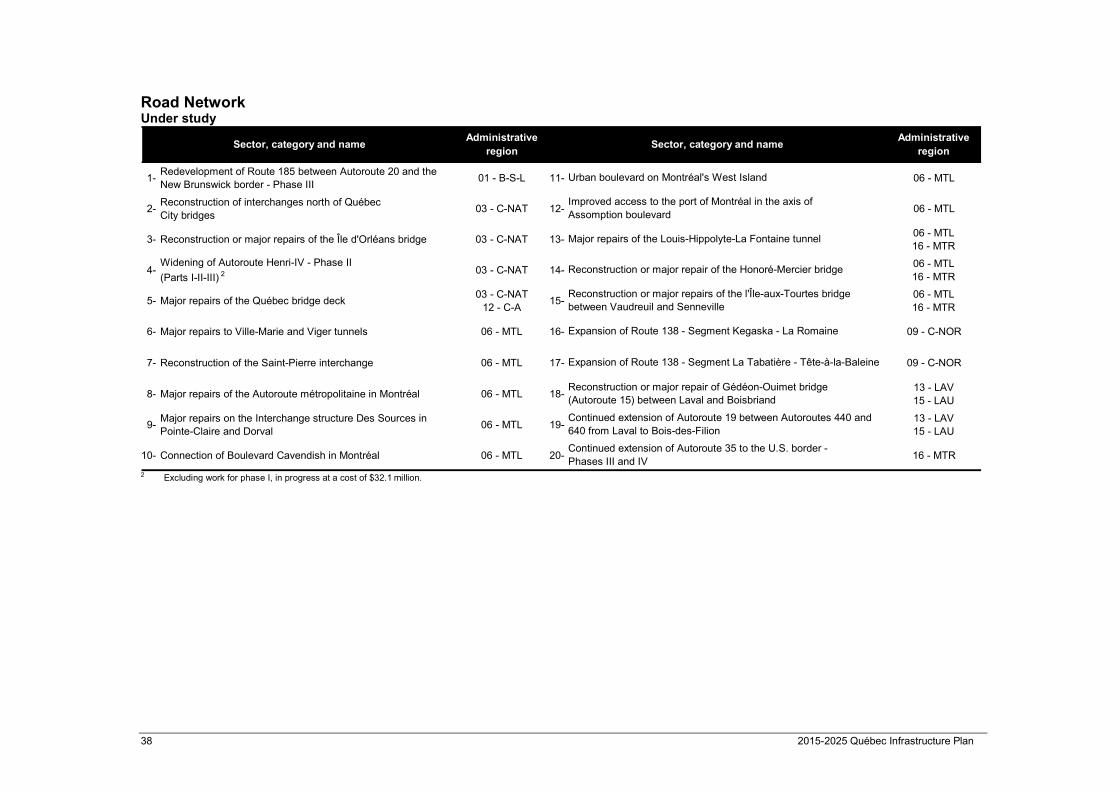
Road Network Under study
1-Redevelopment of Route 185 between Autoroute 20 and the New Brunswick border - Phase III
01 - B-S-L 11- 06 - MTL
2-Reconstruction of interchanges north of QuébecCity bridges
03 - C-NAT 12- 06 - MTL
3- Reconstruction or major repairs of the Île d'Orléans bridge 03 - C-NAT 13-06 - MTL16 - MTR
4-Widening of Autoroute Henri-IV - Phase II
(Parts I-II-III) 2 03 - C-NAT 14-06 - MTL16 - MTR
5- Major repairs of the Québec bridge deck03 - C-NAT
12 - C-A15-
06 - MTL16 - MTR
6- Major repairs to Ville-Marie and Viger tunnels 06 - MTL 16- 09 - C-NOR
7- Reconstruction of the Saint-Pierre interchange 06 - MTL 17- 09 - C-NOR
8- Major repairs of the Autoroute métropolitaine in Montréal 06 - MTL 18-13 - LAV15 - LAU
9-Major repairs on the Interchange structure Des Sources in Pointe-Claire and Dorval
06 - MTL 19-13 - LAV15 - LAU
10- Connection of Boulevard Cavendish in Montréal 06 - MTL 20- 16 - MTR
Expansion of Route 138 - Segment Kegaska - La Romaine
Expansion of Route 138 - Segment La Tabatière - Tête-à-la-Baleine
Reconstruction or major repair of Gédéon-Ouimet bridge (Autoroute 15) between Laval and Boisbriand
Continued extension of Autoroute 19 between Autoroutes 440 and 640 from Laval to Bois-des-Filion
Continued extension of Autoroute 35 to the U.S. border - Phases III and IV
Urban boulevard on Montréal's West Island
Improved access to the port of Montréal in the axis ofAssomption boulevard
Major repairs of the Louis-Hippolyte-La Fontaine tunnel
Reconstruction or major repair of the Honoré-Mercier bridge
Reconstruction or major repairs of the l'Île-aux-Tourtes bridge between Vaudreuil and Senneville
Sector, category and nameAdministrative
regionSector, category and name
Administrative region
2 Excluding work for phase I, in progress at a cost of $32.1 million.
2015-2025 Québec Infrastructure Plan 39
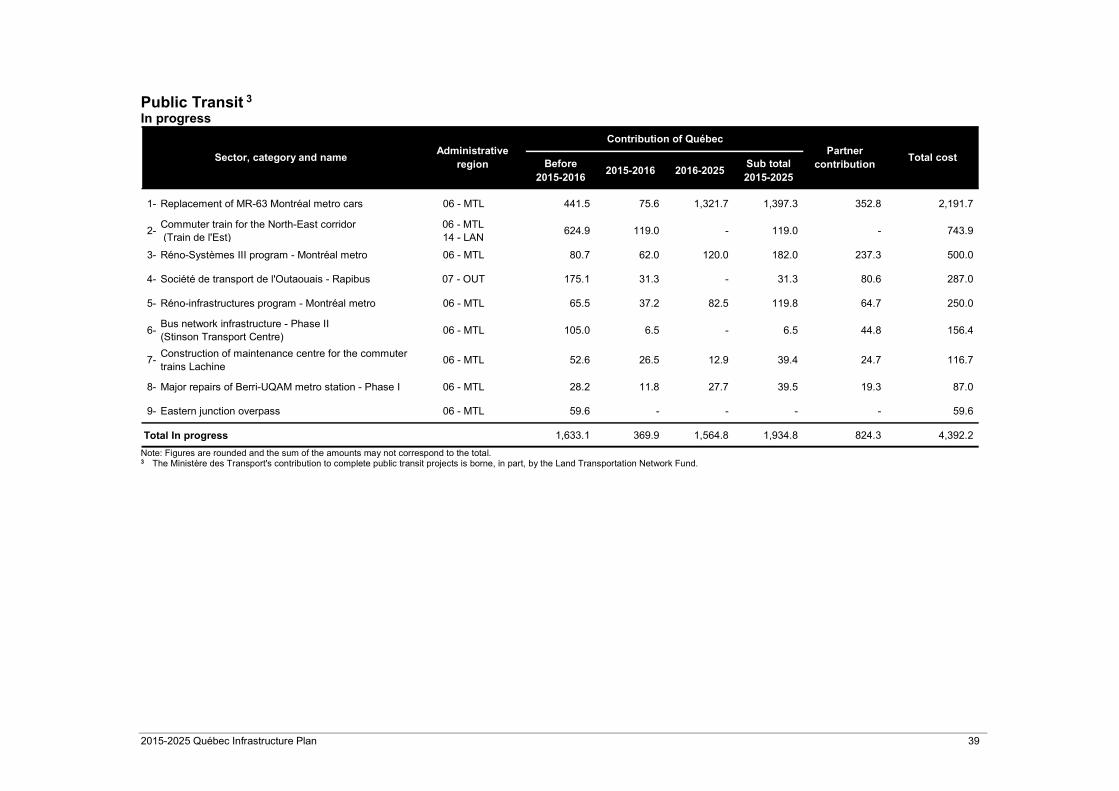
Public Transit 3 In progress
Before2015-2016
2015-2016 2016-2025Sub total2015-2025
1- Replacement of MR-63 Montréal metro cars 06 - MTL 441.5 75.6 1,321.7 1,397.3 352.8 2,191.7
2-Commuter train for the North-East corridor (Train de l'Est)
06 - MTL14 - LAN
624.9 119.0 - 119.0 - 743.9
3- Réno-Systèmes III program - Montréal metro 06 - MTL 80.7 62.0 120.0 182.0 237.3 500.0
4- Société de transport de l'Outaouais - Rapibus 07 - OUT 175.1 31.3 - 31.3 80.6 287.0
5- Réno-infrastructures program - Montréal metro 06 - MTL 65.5 37.2 82.5 119.8 64.7 250.0
6-Bus network infrastructure - Phase II(Stinson Transport Centre)
06 - MTL 105.0 6.5 - 6.5 44.8 156.4
7-Construction of maintenance centre for the commuter trains Lachine
06 - MTL 52.6 26.5 12.9 39.4 24.7 116.7
8- Major repairs of Berri-UQAM metro station - Phase I 06 - MTL 28.2 11.8 27.7 39.5 19.3 87.0
9- Eastern junction overpass 06 - MTL 59.6 - - - - 59.6
Total In progress 1,633.1 369.9 1,564.8 1,934.8 824.3 4,392.2
Sector, category and nameAdministrative
region
Contribution of QuébecPartner
contributionTotal cost
Note: Figures are rounded and the sum of the amounts may not correspond to the total.
3 The Ministère des Transport's contribution to complete public transit projects is borne, in part, by the Land Transportation Network Fund.

40 2015-2025 Québec Infrastructure Plan
Public Transit In the planning stage
1-Construction of maintenance centre for the commuter trains Pointe-Saint-Charles
06 - MTL 5- Pie-IX reserved lane between downtown Montréal and Laval06 - MTL13 - LAV
2- Reconstruction of the Crémazie centre of the Societé de transport de Montréal
06 - MTL 6-06 - MTL 15-LAU13 - LAV 16-MTR
14 - LAN
3- Vendôme multimodal hub 06 - MTL 7- 07 - OUT
4-Réno-tunnel program (Mont Royal tunnel) - Phase II
06 - MTL 8- 16 - MTRConstruction of a new operating centre in Saint-Hubert and acquisition of property by the Réseau de transport de Longueuil
Construction of a second garage for the Société de transport de l'Outaouais
Acquisition of 20 new commuter train cars and 3 locomotives by the Agence métropolitaine de transport
Sector, category and nameAdministrative
regionSector, category and name
Administrative region
Public Transit Under study
1- Project office on the extension of the Montréal metro 06 - MTL 3-06 - MTL16 - MTR
2-Train de l'Ouest de Montréal, including service to
Pierre-Elliot-Trudeau International airport 406 - MTL
Sector, category and nameAdministrative
regionSector, category and name
Administrative region
Public transit service on the new Champlain bridge 4
4 These projects will ultimately be taken on by the Caisse de dépôt et placement du Québec.

2015-2025 Québec Infrastructure Plan 41
Marine, Air, Rail and Other Transportation In progress
Before2015-2016
2015-2016 2016-2025Sub total2015-2025
1- Replacement of the MV Camille-Marcoux01 - B-S-L
09 - C-NOR162.9 12.1 - 12.1 - 175.0
2- Replacement of the MV Lucien-L.03 - C-NAT09 - C-NOR
40.8 44.2 - 44.2 - 85.0
3- Replacement of the MV Radisson03 - C-NAT09 - C-NOR
40.8 44.2 - 44.2 - 85.0
Total In progress 244.6 100.4 - 100.4 - 345.0
Sector, category and nameAdministrative
region
Québec contributionPartner
contributionTotal cost
Note: Figures are rounded and the sum of the amounts may not correspond to the total.
Marine, Air, Rail and Other Transportation In the planning stage
1-Quebec City Jean Lesage International airport - Phase II of the modernization project
03 - C-NAT
Sector, category and nameAdministrative
regionSector, category and name
Administrative region
Marine, Air, Rail and Other Transportation Under study
1- Feasibility of the bypass - Lac-Mégantic 05 - EST 2- 16 - MTR
Sector, category and nameAdministrative
regionSector, category and name
Administrative region
Feasibility of the pôle logistique
42 2015-2025 Québec Infrastructure Plan
Health and Social Services In progress
Before2015-2016
2015-2016 2016-2025Sub total2015-2025
1-Centre hospitalier de l'Université de Montréal (CHUM)
and research centre 506 - MTL 1,915.1 234.8 940.8 1,175.6 540.1 3,630.8
2-Centre universitaire de Santé McGill (CUSM) - Glen site
06 - MTL 1,547.9 50.0 10.0 60.0 855.9 2,463.8
3-Centre hospitalier universitaire Sainte-Justine - Grandir en santé
06 - MTL 520.4 144.7 142.1 286.8 132.5 939.6
4-Sir Mortimer B. Davis Jewish General Hospital - Phases I, II and III
06 - MTL 322.1 40.0 10.0 50.0 6.9 378.9
5- Relocation of Hôpital de Baie-Saint-Paul 03 - C-NAT 7.2 75.0 244.1 319.1 - 326.3
6- Expansion of Hôpital Haut-Richelieu-Rouville 16 - MTR 47.9 42.3 18.2 60.5 1.2 109.6
7-Expansion of the Emergency room and ultra-specialized services at the Hôtel-Dieu Hospital of the Centre hospitalier universitaire de Sherbrooke
05 - EST 96.3 - - - 6.6 102.9
8-Centre hospitalier universitaire de Québec - Hôtel-Dieu de Québec
03 - C-NAT 77.6 - - - - 77.6
9- Hôpital Maisonneuve-Rosemont - Emergency room 06 - MTL 50.1 17.0 5.5 22.5 1.0 73.6
Total In progress 4,584.6 603.9 1,370.6 1,974.5 1,544.1 8,103.2
Sector, category and nameAdministrative
region
Québec contributionPartner
contributionsTotal cost
Note: Figures are rounded and the sum of the amounts may not correspond to the total. 5 The total includes construction costs for the research centre, which has been completed.
2015-2025 Québec Infrastructure Plan 43
Health and Social Services In the planning stage
1-Centre hospitalier régional de Trois-Rivières (Pavillon Sainte-Marie) - Phase II
04 - MAU 5- 12 - C-A
2-Hôpital du Sacré-Coeur-de-Montréal - Centre intégré de traumatologie et unité mère-enfant
06 - MTL 6- 14 - LAN
3-Hôpital Maisonneuve-Rosemont - Construction for dialysis
06 - MTL 7- 15 - LAU
4- Hôpital de Lachine - Lachine campus redeployment project 06 - MTL 8- 15 - LAU
Hôpital régional de Saint-Jérôme - New pavilion for mental health care service
Construction of a 212-beds CHSLD in Saint-Jérôme
Sector, category and nameAdministrative
regionSector, category and name
Administrative region
Construction of an integrated regional cancerology centre atHôtel-Dieu de Lévis
Hôpital Pierre-Le Gardeur - 146 beds
Health and Social Services Under study
1-Hôpital régional de Rimouski - Construction of an operation suite, day surgery and sterelization facility
01 - B-S-L 5- Verdun Hospital - Expansion and modernization 06 - MTL
2-Construction of a new hospital on the site of hôpital L'Enfant-Jésus
03 - C-NAT 6- 06 - MTL
3- Hôpital La Malbaie 03 - C-NAT 7- 15 - LAU
4-Expansion of the Centre Femme-Jeunesse-Famille at the Centre hospitalier universitaire de Sherbrooke(Fleurimont Hospital)
05 - EST 8- 16 - MTR
Montreal Heart Institute - Training centre, grouping outpatient services and ER expansion
Construction of a new hospital in Vaudreuil-Soulanges region
Centre jeunesse des Laurentides - Consolidation and modernization
Sector, category and nameAdministrative
regionSector, category and name
Administrative region

44 2015-2025 Québec Infrastructure Plan
Higher Education and Research In the planning stage
1- Université de Montréal - Outremont science complex 06 - MTL 2- 06 - MTL
Sector, category and nameAdministrative
regionSector, category and name
Administrative region
McGill University - Wilson Hall
Higher Education and Research Under study
1-McGill University - Redevelopment of the Royal-Victoria Hospital
06 - MTL 3- 06 - MTL
2-School of Public Health - Component of the Pôled'excellence en santé de Montréal
06 - MTL
Sector, category and nameAdministrative
regionSector, category and name
Administrative region
HEC Montréal - Construction of a new downtown pavilion or redevelopment of the main pavilion
Culture In progress
Before2015-2016
2015-2016 2016-2025Sub total2015-2025
1- Musée national des beaux-arts du Québec 03 - C-NAT 33.1 12.0 - 12.0 58.3 103.4
2- Redevelopment and expansion of the Wilder Building 06 - MTL 30.9 28.5 7.0 35.5 32.8 99.2
Total In progress 64.0 40.5 7.0 47.5 91.1 202.6
Sector, category and nameAdministrative
region
Québec contributionPartner
contributionsTotal cost
Note: Figures are rounded and the sum of the amounts may not correspond to the total.
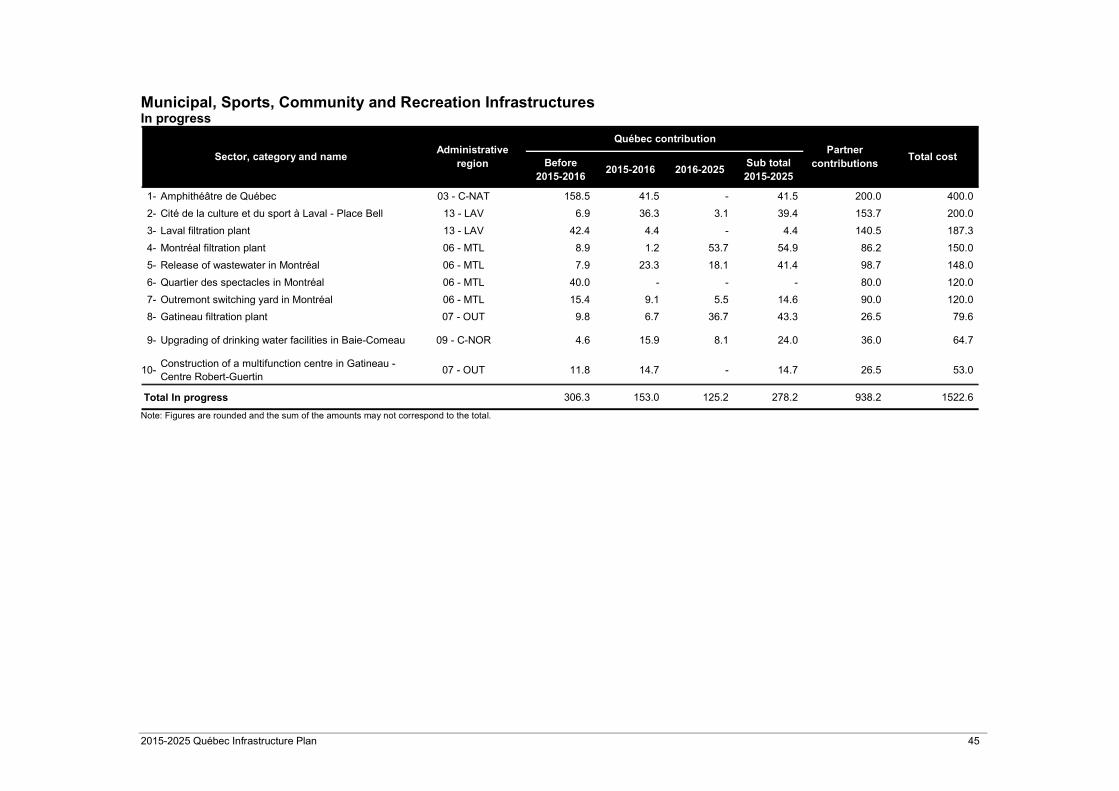
2015-2025 Québec Infrastructure Plan 45
Municipal, Sports, Community and Recreation Infrastructures In progress
Before2015-2016
2015-2016 2016-2025Sub total2015-2025
1- Amphithéâtre de Québec 03 - C-NAT 158.5 41.5 - 41.5 200.0 400.0
2- Cité de la culture et du sport à Laval - Place Bell 13 - LAV 6.9 36.3 3.1 39.4 153.7 200.0
3- Laval filtration plant 13 - LAV 42.4 4.4 - 4.4 140.5 187.3
4- Montréal filtration plant 06 - MTL 8.9 1.2 53.7 54.9 86.2 150.0
5- Release of wastewater in Montréal 06 - MTL 7.9 23.3 18.1 41.4 98.7 148.0
6- Quartier des spectacles in Montréal 06 - MTL 40.0 - - - 80.0 120.0
7- Outremont switching yard in Montréal 06 - MTL 15.4 9.1 5.5 14.6 90.0 120.0
8- Gatineau filtration plant 07 - OUT 9.8 6.7 36.7 43.3 26.5 79.6
9- Upgrading of drinking water facilities in Baie-Comeau 09 - C-NOR 4.6 15.9 8.1 24.0 36.0 64.7
10-Construction of a multifunction centre in Gatineau - Centre Robert-Guertin
07 - OUT 11.8 14.7 - 14.7 26.5 53.0
Total In progress 306.3 153.0 125.2 278.2 938.2 1522.6
Sector, category and nameAdministrative
region
Québec contributionPartner
contributionsTotal cost
Note: Figures are rounded and the sum of the amounts may not correspond to the total.

46 2015-2025 Québec Infrastructure Plan
Municipal, Sports, Community and Recreation Infrastructures In the planning stage
1- Biomethanation project - Québec City 03 - C-NAT 6- 06 - MTL
2-Improvement of the capacity and efficiency of docking facilities for international cruise ships in Québec City
03 - C-NAT 7- 13 - LAV
3-Upgrading to standards of drinking water facilitiesin Shawinigan
04 - MAU 8- 16 - MTR
4- Construction of a sports amphitheatre in Trois-Rivières 04 - MAU 9- 16 - MTR
5- Biomethanation project - Ville de Montréal 06 - MTL 10- 16 - MTR
Biomethanation project - Ville de Longueuil
Biomethanation project - Montréal's southeastern ring
Biomethanation project - Montréal's southwestern ring
Sector, category and nameAdministrative
regionSector, category and name
Administrative region
Rehabilitation of the terminal and Alexandra Pier in the Old Port of Montréal
Biomethanation project - Ville de Laval
Municipal, Sports, Community and Recreation Infrastructures Under study
1- Gaétan-Boucher Skating Oval 03 - C-NAT 3- 06 - MTL
2- Expansion of the Palais des congrès de Montréal 06 - MTL
Administrative region
Replacement of the roof on the Olympic Stadium
Sector, category and nameAdministrative
regionSector, category and name
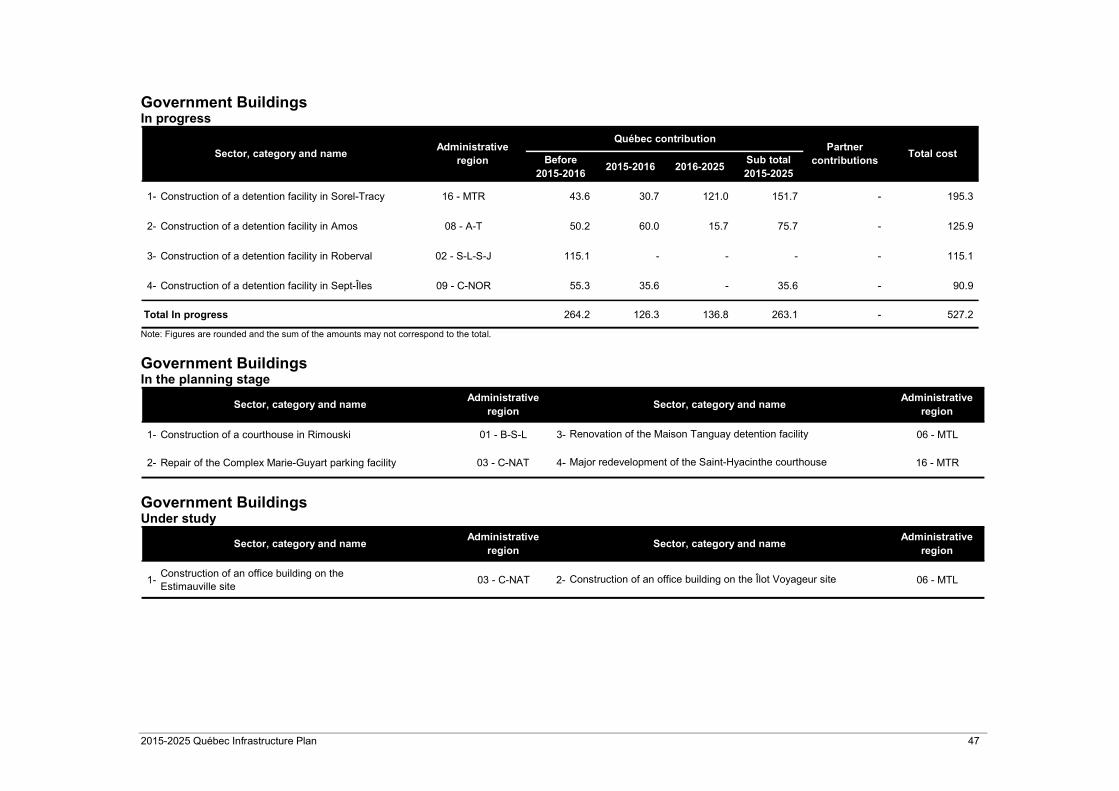
2015-2025 Québec Infrastructure Plan 47
Government Buildings In progress
Before2015-2016
2015-2016 2016-2025Sub total2015-2025
1- Construction of a detention facility in Sorel-Tracy 16 - MTR 43.6 30.7 121.0 151.7 - 195.3
2- Construction of a detention facility in Amos 08 - A-T 50.2 60.0 15.7 75.7 - 125.9
3- Construction of a detention facility in Roberval 02 - S-L-S-J 115.1 - - - - 115.1
4- Construction of a detention facility in Sept-Îles 09 - C-NOR 55.3 35.6 - 35.6 - 90.9
Total In progress 264.2 126.3 136.8 263.1 - 527.2
Sector, category and nameAdministrative
region
Québec contributionPartner
contributionsTotal cost
Note: Figures are rounded and the sum of the amounts may not correspond to the total.
Government Buildings In the planning stage
1- Construction of a courthouse in Rimouski 01 - B-S-L 3- 06 - MTL
2- Repair of the Complex Marie-Guyart parking facility 03 - C-NAT 4- 16 - MTR
Sector, category and nameAdministrative
regionSector, category and name
Administrative region
Renovation of the Maison Tanguay detention facility
Major redevelopment of the Saint-Hyacinthe courthouse
Government Buildings Under study
1-Construction of an office building on theEstimauville site
03 - C-NAT 2- 06 - MTL
Sector, category and nameAdministrative
regionSector, category and name
Administrative region
Construction of an office building on the Îlot Voyageur site
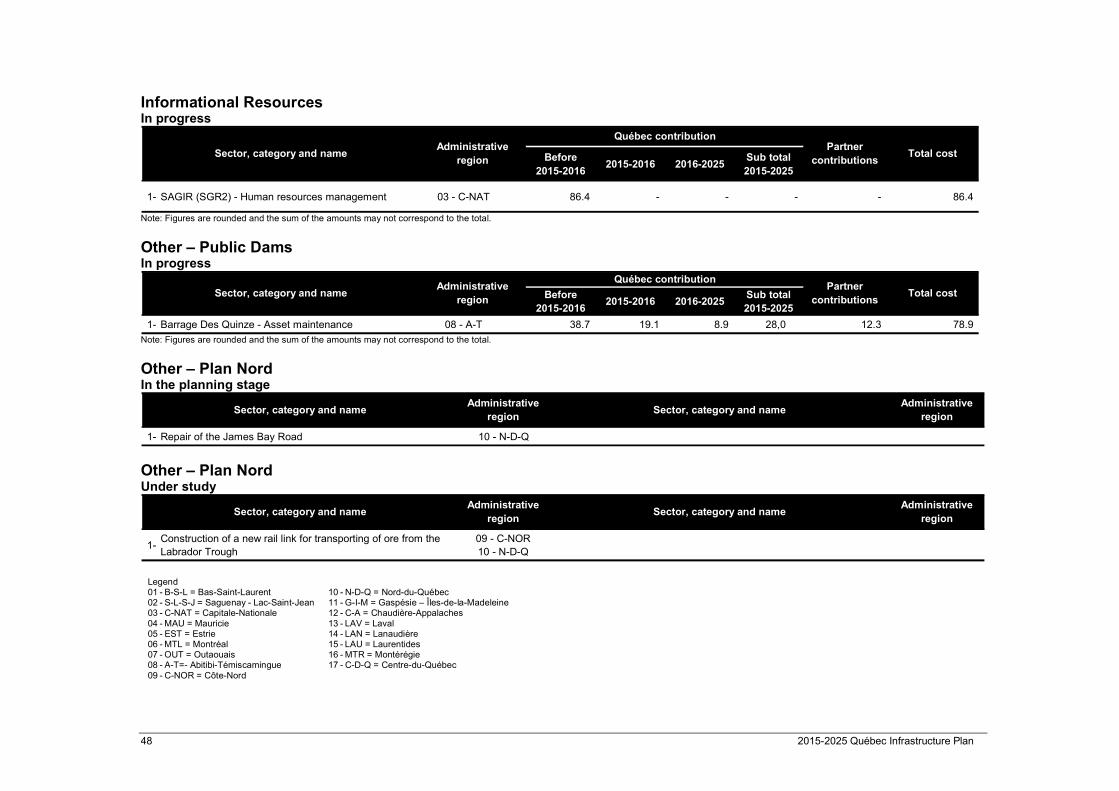
48 2015-2025 Québec Infrastructure Plan
Informational Resources In progress
Before2015-2016
2015-2016 2016-2025Sub total2015-2025
1- SAGIR (SGR2) - Human resources management 03 - C-NAT 86.4 - - - - 86.4
Sector, category and nameAdministrative
region
Québec contributionPartner
contributionsTotal cost
Note: Figures are rounded and the sum of the amounts may not correspond to the total.
Other – Public Dams In progress
Before2015-2016
2015-2016 2016-2025Sub total2015-2025
1- Barrage Des Quinze - Asset maintenance 08 - A-T 38.7 19.1 8.9 28,0 12.3 78.9
Sector, category and nameAdministrative
region
Québec contributionPartner
contributionsTotal cost
Note: Figures are rounded and the sum of the amounts may not correspond to the total.
Other – Plan Nord In the planning stage
1- Repair of the James Bay Road 10 - N-D-Q
Sector, category and nameAdministrative
regionSector, category and name
Administrative region
Other – Plan Nord Under study
1-Construction of a new rail link for transporting of ore from the Labrador Trough
09 - C-NOR10 - N-D-Q
Sector, category and nameAdministrative
regionSector, category and name
Administrative region
Legend 01 - B-S-L = Bas-Saint-Laurent 10 - N-D-Q = Nord-du-Québec 02 - S-L-S-J = Saguenay - Lac-Saint-Jean 11 - G-I-M = Gaspésie – Îles-de-la-Madeleine 03 - C-NAT = Capitale-Nationale 12 - C-A = Chaudière-Appalaches04 - MAU = Mauricie 13 - LAV = Laval 05 - EST = Estrie 14 - LAN = Lanaudière 06 - MTL = Montréal 15 - LAU = Laurentides 07 - OUT = Outaouais 16 - MTR = Montérégie08 - A-T=- Abitibi-Témiscamingue 17 - C-D-Q = Centre-du-Québec09 - C-NOR = Côte-Nord
2015-2025 Québec Infrastructure Plan 49
5.5 Update of probable investments for 2014-2015 According to the Public Infrastructure Act, the Québec Infrastructure Plan must be accompanied by a report on the use of amounts allocated for the current fiscal year. $11.5 billion was forecast for 2014-2015 for all sectors covered by the 2014-2024 Québec Infrastructure Plan. The update of probable investments for 2014-2015 has been evaluated at $10.1 billion, which represents a probable realization rate of 87.8%.
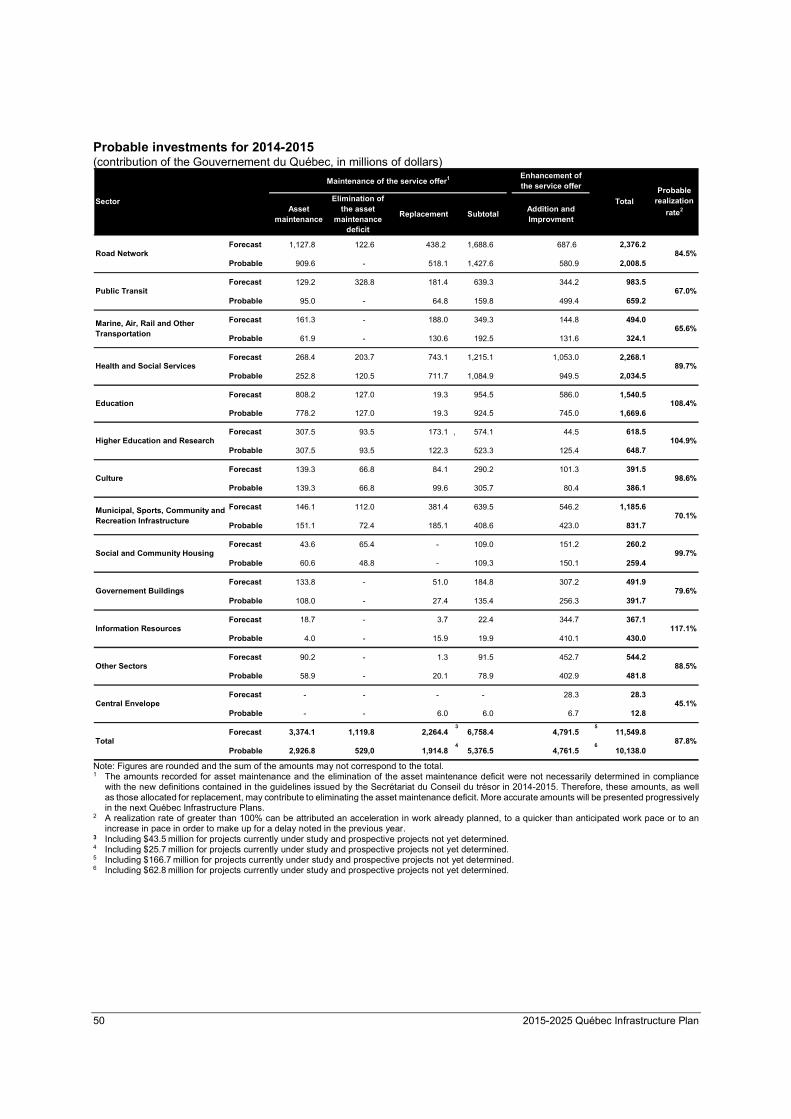
50 2015-2025 Québec Infrastructure Plan
Probable investments for 2014-2015 (contribution of the Gouvernement du Québec, in millions of dollars)
Enhancement of the service offer
Asset maintenance
Elimination of the asset
maintenance deficit
Replacement SubtotalAddition and Improvment
Forecast 1,127.8 122.6 438.2 1,688.6 687.6 2,376.2
Probable 909.6 - 518.1 1,427.6 580.9 2,008.5
Forecast 129.2 328.8 181.4 639.3 344.2 983.5
Probable 95.0 - 64.8 159.8 499.4 659.2
Forecast 161.3 - 188.0 349.3 144.8 494.0
Probable 61.9 - 130.6 192.5 131.6 324.1
Forecast 268.4 203.7 743.1 1,215.1 1,053.0 2,268.1
Probable 252.8 120.5 711.7 1,084.9 949.5 2,034.5
Forecast 808.2 127.0 19.3 954.5 586.0 1,540.5
Probable 778.2 127.0 19.3 924.5 745.0 1,669.6
Forecast 307.5 93.5 173.1 , 574.1 44.5 618.5
Probable 307.5 93.5 122.3 523.3 125.4 648.7
Forecast 139.3 66.8 84.1 290.2 101.3 391.5
Probable 139.3 66.8 99.6 305.7 80.4 386.1
Forecast 146.1 112.0 381.4 639.5 546.2 1,185.6
Probable 151.1 72.4 185.1 408.6 423.0 831.7
Forecast 43.6 65.4 - 109.0 151.2 260.2
Probable 60.6 48.8 - 109.3 150.1 259.4
Forecast 133.8 - 51.0 184.8 307.2 491.9
Probable 108.0 - 27.4 135.4 256.3 391.7
Forecast 18.7 - 3.7 22.4 344.7 367.1
Probable 4.0 - 15.9 19.9 410.1 430.0
Forecast 90.2 - 1.3 91.5 452.7 544.2
Probable 58.9 - 20.1 78.9 402.9 481.8
Forecast - - - - 28.3 28.3
Probable - - 6.0 6.0 6.7 12.8
Forecast 3,374.1 1,119.8 2,264.43
6,758.4 4,791.55
11,549.8
Probable 2,926.8 529,0 1,914.84
5,376.5 4,761.56
10,138.0
Road Network 84.5%
Sector
Maintenance of the service offer1
Total
Probable realization
rate2
Public Transit 67.0%
Marine, Air, Rail and Other Transportation
65.6%
Health and Social Services 89.7%
Education 108.4%
Higher Education and Research 104.9%
Culture 98.6%
Municipal, Sports, Community and Recreation Infrastructure
70.1%
Social and Community Housing 99.7%
Governement Buildings 79.6%
Total 87.8%
Information Resources 117.1%
Other Sectors 88.5%
Central Envelope 45.1%
Note: Figures are rounded and the sum of the amounts may not correspond to the total. 1 The amounts recorded for asset maintenance and the elimination of the asset maintenance deficit were not necessarily determined in compliance
with the new definitions contained in the guidelines issued by the Secrétariat du Conseil du trésor in 2014-2015. Therefore, these amounts, as well as those allocated for replacement, may contribute to eliminating the asset maintenance deficit. More accurate amounts will be presented progressively in the next Québec Infrastructure Plans.
2 A realization rate of greater than 100% can be attributed an acceleration in work already planned, to a quicker than anticipated work pace or to an increase in pace in order to make up for a delay noted in the previous year.
3 Including $43.5 million for projects currently under study and prospective projects not yet determined. 4 Including $25.7 million for projects currently under study and prospective projects not yet determined. 5 Including $166.7 million for projects currently under study and prospective projects not yet determined. 6 Including $62.8 million for projects currently under study and prospective projects not yet determined.

2015-2025 Québec Infrastructure Plan 51
5.6 Final statement for investments made for 2013-2014 The Public Infrastructure Act decrees that the Québec Infrastructure Plan must be accompanied by a report on the use of the amounts allocated during the previous fiscal year. An overall realization rate of 89.9%
For all sectors covered by the Québec Infrastructure Plan, the amount forecast for 2013-2014 was $10.7 billion. Investments made are evaluated at $9.6 billion, a realization rate of 89.9%. This section presents investments made in 2013-2014 by sector. Public Transit, Education, and Municipal, Sports, Community and Recreation
Infrastructure all had realization rates over 100.0%
In the Public Transit sector, $690.9 million was invested, 107.5% of its probable budget.
• $88.1 million has been invested in asset maintenance, mainly in the Montréal metro program, under the Réno-Systèmes 3 and Réno-Infrastructures programs.
• $602.8 million was made in other types of investments. It went toward establishing a commuter train line between Mascouche and downtown Montréal (Train de l’Est). Funds were also allocated to the Rapibus project, with the aim of implementing a rapid transit reserved bus lane system in Gatineau, to the study of the planned extension to the Montréal metro, and to construction of the Stinson transport centre of the Société de transport de Montréal.
In the Education sector, 100.0% of the probable investment was realized, totalling just over $1.0 billion.
• $835.0 million went toward work intended to maintain educational infrastructure assets and the elimination of their asset maintenance deficit. The work primarily covered the repair of roofs and exterior cladding, and replacement of windows and floor coverings.
• $217.0 million was invested in expanding and building new schools in all regions of Québec. In the Municipal, Sports, Community and Recreation Infrastructure sector, $888.3 million was invested, representing 103.4% of the probable investment. For Municipal Infrastructure:
• $244.1 million was invested in asset maintenance and the elimination of the maintenance deficit. In particular, these projects concern drinking water treatment, wastewater treatment and the rehabilitation of underground pipe networks. We would mention the following projects among others: replacement of pipes in Montréal, Québec City, Saint-Lambert, Longueuil and Saguenay as well as the construction of a filtration plant in Laval.
• $491.4 million was invested in replacement, improvement and additions. It went toward the construction of the Amphithéâtre de Québec, upgrading the standards of the drinking water treatment facility in Thetford Mines and the construction of new infrastructure for northern villages.
For Municipal, Sports, Community and Recreation Infrastructure:
• $152.8 million was invested, in particular to expand the Centre des congrès de Québec, carry out the Trame verte et bleue program (bike paths, parks and green spaces) and establish the Institut national du sport du Québec.

52 2015-2025 Québec Infrastructure Plan
Health and Social Services, Higher Education and Research, Culture, Social and Community Housing, realization rates of over 90.0%
Health and Social Services investments amount to $2.4 billion, reflecting a realization rate of 92.8%.
• An amount of $441.2 million was invested in asset maintenance and elimination of the asset maintenance deficit. The funds were used to repair electrical installations, mechanical and ventilation systems and replace the cladding of various buildings across Québec.
• Investments of $1.4 billion in replacements allowed the construction of CHUM, CUSM and the Centre hospitalier universitaire de Sherbrooke and work on the emergency room of Hôpital La Salle and Hôpital d’Alma.
• Investments of $563.1 million in improvements and additions allowed the ongoing realization of major projects such as construction of the Sir Mortimer B. Davis Jewish General Hospital (phases I, II and III), expansion of the Centre hospitalier universitaire Sainte-Justine and improvement to Hôpital Maisonneuve-Rosemont.
An amount of $579.6 million was invested in Higher Education and Research, or 97.2% of the probable investment. Investments of $192.0 million were made in the college network and the Institut de tourisme et d'hôtellerie du Québec.
• An amount of $172.6 million was invested in CEGEPs, mainly for work related to exterior cladding of buildings, roofs, mechanical and electrical systems, and restoration of science laboratories.
• An amount $10.3 million was used to improve access to education, in particular by creating new student spaces at the CEGEPs of Outaouais and Terrebonne.
In the university network, $337.4 million was invested in asset maintenance and elimination of the real estate portfolio's asset maintenance deficit and to replace, improve and add buildings in this portfolio, including work on the dental clinics at Université de Montréal. An amount of $50.2 million was invested in the Research field in 2013-2014.
• A portion of this amount, $27.6 million, was disbursed under the Recherche-Québec Canada Foundation for Innovation Project co-funding program.
• The remaining $22.6 million was mainly invested in improving research infrastructures. Investments of $256.7 million were made in the Cultural sector, for a realization rate of 99.5%.
• An amount of $58.4 million was invested in government corporations. These funds were used to repair the masonry at the Musée de la civilisation and to continue construction to expand the Musée national des beaux-arts du Québec.
• An amount of $183.1 million was invested in cultural facilities. The funds were used to make repairs and expansion to the Wilder building in Montréal, build a performance hall in Saint-Jérôme, build a municipal library in Drummondville and acquire documents for municipal library collections.
• Concerning projects subsidized by the Québec Cultural Heritage Fund, an investment of $15.2 million was made specifically for the conservation of assets protected by the Gouvernement du Québec under the Cultural Property Act (chapter B-4).
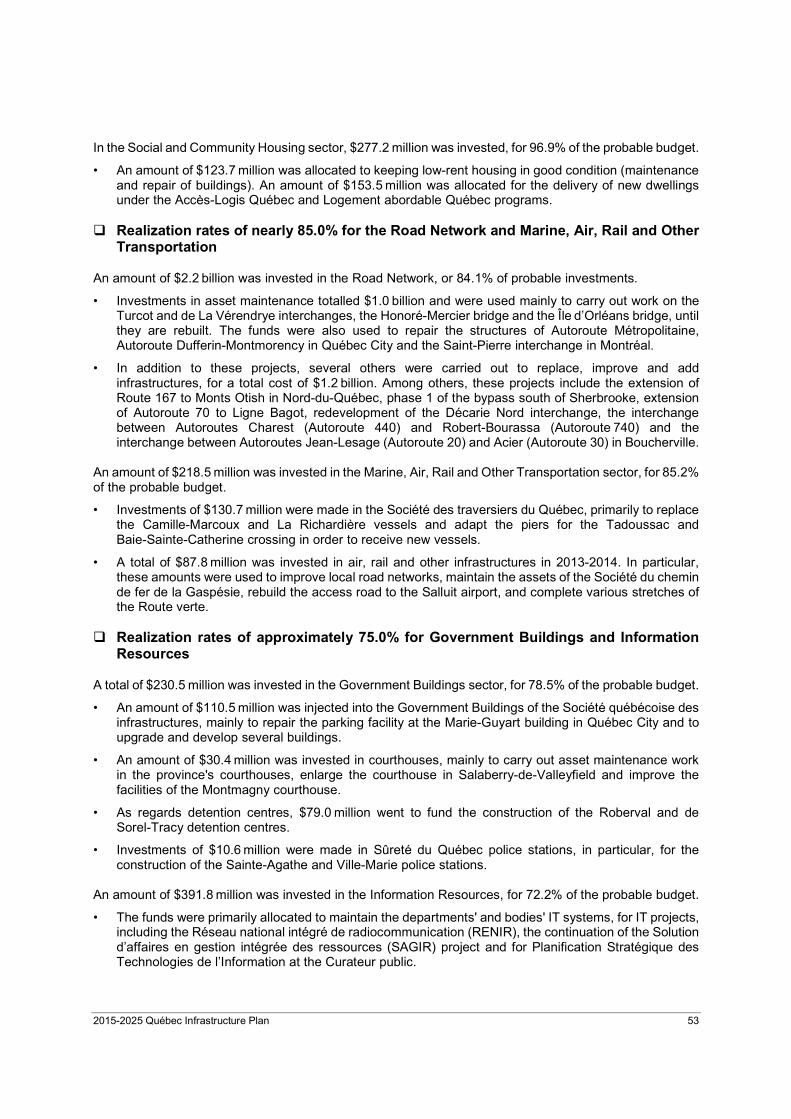
2015-2025 Québec Infrastructure Plan 53
In the Social and Community Housing sector, $277.2 million was invested, for 96.9% of the probable budget.
• An amount of $123.7 million was allocated to keeping low-rent housing in good condition (maintenance and repair of buildings). An amount of $153.5 million was allocated for the delivery of new dwellings under the Accès-Logis Québec and Logement abordable Québec programs.
Realization rates of nearly 85.0% for the Road Network and Marine, Air, Rail and Other
Transportation
An amount of $2.2 billion was invested in the Road Network, or 84.1% of probable investments.
• Investments in asset maintenance totalled $1.0 billion and were used mainly to carry out work on the Turcot and de La Vérendrye interchanges, the Honoré-Mercier bridge and the Île d’Orléans bridge, until they are rebuilt. The funds were also used to repair the structures of Autoroute Métropolitaine, Autoroute Dufferin-Montmorency in Québec City and the Saint-Pierre interchange in Montréal.
• In addition to these projects, several others were carried out to replace, improve and add infrastructures, for a total cost of $1.2 billion. Among others, these projects include the extension of Route 167 to Monts Otish in Nord-du-Québec, phase 1 of the bypass south of Sherbrooke, extension of Autoroute 70 to Ligne Bagot, redevelopment of the Décarie Nord interchange, the interchange between Autoroutes Charest (Autoroute 440) and Robert-Bourassa (Autoroute 740) and the interchange between Autoroutes Jean-Lesage (Autoroute 20) and Acier (Autoroute 30) in Boucherville.
An amount of $218.5 million was invested in the Marine, Air, Rail and Other Transportation sector, for 85.2% of the probable budget.
• Investments of $130.7 million were made in the Société des traversiers du Québec, primarily to replace the Camille-Marcoux and La Richardière vessels and adapt the piers for the Tadoussac and Baie-Sainte-Catherine crossing in order to receive new vessels.
• A total of $87.8 million was invested in air, rail and other infrastructures in 2013-2014. In particular, these amounts were used to improve local road networks, maintain the assets of the Société du chemin de fer de la Gaspésie, rebuild the access road to the Salluit airport, and complete various stretches of the Route verte.
Realization rates of approximately 75.0% for Government Buildings and Information
Resources
A total of $230.5 million was invested in the Government Buildings sector, for 78.5% of the probable budget.
• An amount of $110.5 million was injected into the Government Buildings of the Société québécoise des infrastructures, mainly to repair the parking facility at the Marie-Guyart building in Québec City and to upgrade and develop several buildings.
• An amount of $30.4 million was invested in courthouses, mainly to carry out asset maintenance work in the province's courthouses, enlarge the courthouse in Salaberry-de-Valleyfield and improve the facilities of the Montmagny courthouse.
• As regards detention centres, $79.0 million went to fund the construction of the Roberval and de Sorel-Tracy detention centres.
• Investments of $10.6 million were made in Sûreté du Québec police stations, in particular, for the construction of the Sainte-Agathe and Ville-Marie police stations.
An amount of $391.8 million was invested in the Information Resources, for 72.2% of the probable budget.
• The funds were primarily allocated to maintain the departments' and bodies' IT systems, for IT projects, including the Réseau national intégré de radiocommunication (RENIR), the continuation of the Solution d’affaires en gestion intégrée des ressources (SAGIR) project and for Planification Stratégique des Technologies de l’Information at the Curateur public.

54 2015-2025 Québec Infrastructure Plan
Realization rate of nearly 60.0% in the Other Sectors
A total of $403.4 million was invested in the other sectors, for 59.4% of the probable budget.
• These funds were used for work on the Barrage des Quinze (Abitibi-Témiscamingue), the Barrage Lac-réservoir Kénogami (Saguenay – Lac-Saint-Jean) and the Barrage Sartigan (Chaudière-Appalaches), as well as for the construction of 300 social housing units in Nunavut under the Plan Nord and the cadastral reform carried out by the Territorial Information Fund.

2015-2025 Québec Infrastructure Plan 55
Investments made in 2013-2014 (contribution of the Gouvernement du Québec, in millions of dollars)
Enhancement of the service offer
Asset maintenance
Elimination of the asset
maintenance deficit
Replacement SubtotalAddition and Improvment
Probable 1,417.3 177.0 245.0 1,839.4 772.4 2,611.8
Completed 1,003.0 - 203.7 1,206.7 989.2 2,195.9
Probable 93.9 327.4 109.6 530.9 112.0 642.9
Completed 88.1 - 87.1 175.3 515.7 690.9
Probable 81.7 - 101.9 183.5 72.8 256.3
Completed 48.7 - 105.3 154.0 64.5 218.5
Probable 283.9 203.6 1,492.1 1,979.6 646.6 2,626.2
Completed 321.2 120.0 1,433.7 1,874.9 563.1 2,438.0
Probable 708.0 127.0 12.0 847.0 205.0 1,052.0
Completed 708.0 127.0 12.0 847.0 205.0 1,052.0
Probable 308.9 93.5 151.6 554.0 42.1 596.1
Completed 308.9 93.5 146.8 549.2 30.5 579.6
Probable 55.0 11.5 78.4 144.9 113.1 258.1
Completed 51.0 14.6 79.5 145.1 111.6 256.7
Probable 252.8 64.5 165.7 483.0 375.9 858.9
Completed 247.9 54.5 250.1 552.4 335.9 888.3
Probable 83.7 46.4 - 130.1 155.9 286.0
Completed 77.3 46.4 - 123.7 153.5 277.2
Probable 104.2 - 35.8 140.0 153.8 293.8
Completed 83.0 - 26.4 109.4 121.1 230.5
Probable 16.4 - 3.3 19.7 523.3 543.0
Completed 9.4 - 2.2 11.6 380.3 391.8
Probable 41.7 - 0.1 41.8 636.9 678.7
Completed 26.3 - 19.3 45.6 357.8 403.4
Probable 3,447.6 1,050.9 2,395.43
6,893.9 3,809.85
10,703.7
Completed 2,972.7 456.0 2,366.24
5,794.9 3,828.06
9,622.9
Road Network 84.1%
Sector
Maintenance of the service offer1
TotalRealization
rate2
Public Transit 107.5%
Marine, Air, Rail and Other Transportation
85.2%
Health and Social Services 92.8%
Education 100.0%
Higher Education and Research 97.2%
Culture 99.5%
Municipal, Sports, Community and Recreation Infrastructure
103.4%
Social and Community Housing 96.9%
Governement Buildings 78.5%
Information Resources 72.2%
Other Sectors 59.4%
Total 89.9%
Note: Total might not add up due to rounding. 1 The amounts recorded for asset maintenance and the elimination of the asset maintenance deficit were not necessarily determined in compliance
with the new definitions contained in the guidelines issued by the Secrétariat du Conseil du trésor in 2014-2015. Therefore, these amounts, as well as those allocated for replacement, may contribute to eliminating the asset maintenance deficit. More accurate amounts will be presented progressively in the next Québec Infrastructure Plans.
2 A realization rate of greater than 100% can be attributed an acceleration in work already planned, to a quicker than anticipated work pace or to an increase in pace in order to make up for a delay noted in the previous year.
3 Including $10.0 million for projects currently under study and prospective projects not yet determined. 4 Including $2.3 million for projects currently under study and prospective projects not yet determined. 5 Including $102.4 million for projects currently under study and prospective projects not yet determined. 6 Including $31.2 million for projects currently under study and prospective projects not yet determined.

PART III 2015-2016 Annual Management
Plans for Public Infrastructure Investments


2015-2016 Annual Management Plans for Public Infrastructure Investments 59
1. Background
The Public Infrastructure Act, adopted by the Government in the fall of 2013, provides that each Minister must, starting in 2015-2016, draw up an “Annual Management Plan for Public Infrastructure Investments” made by the Minister’s department and by the public bodies under his or her authority. Although the Chair of the Conseil du trésor is tasked with tabling these plans in the National Assembly, it is the Ministers who must prepare them. Accordingly, as announced by the Government last year, the first Annual Management Plans for Public Infrastructure Investments are being tabled this year as part of the 2015-2016 Budget. This is an unprecedented exercise in transparency for the Government with regard to Québec’s public infrastructure inventory. These plans provide an initial snapshot of the inventory, the condition, and the asset maintenance deficit of the infrastructure belonging to the public bodies, designated by the Government, to which it is allocated at least the majority of the investments budgeted in the Québec Infrastructure Plan. This is an initial estimate based on a new government condition indicator and on new guidelines developed by the Secrétariat du Conseil du trésor which, among other things, define asset maintenance and the asset maintenance deficit. This snapshot will be enhanced on a continuing basis over the coming fiscal years as the public bodies pursue the inspections of their infrastructure. Each Minister’s Annual Management Plan for Public Infrastructure Investments includes the following sections:
• The section on infrastructure management presents the vision, orientations and objectives, the responsibilities, and the description of the departmental and public body infrastructure network that makes up the Minister’s portfolio.
• The section on public infrastructure investment presents, by body or group of bodies, how the amounts allocated to the infrastructure belonging to the public bodies have been used during the previous fiscal year and the current fiscal year, as well as explanations concerning the completion rate and the main projects that have been completed or in progress. The “Probable 2013-2014” and “Forecast 2014-2015” amounts correspond to those published in the 2014-2024 QIP.
— In addition, certain amounts may be lower than the amounts presented in part II of the document, because part II can include investments corresponding to subsidies paid for infrastructure that does not belong to public bodies.
• The section on infrastructure sustainability presents an inventory of the infrastructure of the Department and bodies under the Minister’s authority, including an assessment of their condition and their asset maintenance deficit. Some information currently not available (N/A) will become available when the public bodies will carry out a detailed inventory and an inspection of the infrastructure that make it possible to assess the condition and the asset maintenance deficit:
— The inventory presents the infrastructure (buildings, civil engineering works and equipments) that belong to the public bodies designated by the Government. Infrastructure resulting from investments in information resources are not presented, because the status of these projects is already the subject of specific reporting, available at www.tableaudebordprojetsri.gouv.qc.ca.
60 2015-2016 Annual Management Plans for Public Infrastructure Investments
— The condition of the infrastructure is based, for each body, on the available data and on a new government condition indicator that has been developed according to best practices as part of the Secrétariat du Conseil du trésor guidelines. This indicator provides five possible conditions, ranging from very good to very poor, as well as a threshold beneath which an infrastructure is no longer considered to be in satisfactory condition. If it is not in satisfactory condition, the public body is responsible for implementing risk mitigation measures so that personal safety and health are not compromised, otherwise the infrastructure must be removed from service. Once compiled, the condition of each infrastructure enables the bodies to present the percentage of infrastructure that are in very good to satisfactory condition (A, B or C), the percentage that are in poor condition (D) and the percentage that are in very poor condition (E). This compilation also makes it possible to provide an average condition indicator for all infrastructure.
— The asset maintenance deficits have been assessed by each body, for some of the infrastructure or all of it, depending on the body’s specific situation. Certain asset maintenance deficits account only for the portion of the infrastructure that has been inspected. In other cases, where the inspected infrastructures are deemed to be representative of the whole, the asset maintenance deficits may have been extrapolated to the whole. For infrastructure in poor or very poor condition, these asset maintenance deficits generally represent the investments that should be made in order to restore the condition to a satisfactory or better condition. Consequently, the asset maintenance deficit of an infrastructure does not necessarily equal the investments required to replace it. Furthermore, for infrastructure that post an asset maintenance deficit, all the investments that would make it possible to eliminate that deficit are not necessarily realized, because some of them may be replaced, destroyed or even sold.
• The appendices specify the composition of the groups of bodies and a detailed inventory, if applicable. For the infrastructure assessed until now, these initial plans confirm that the majority are at least in a satisfactory condition and confirmed an asset maintenance deficit of $15.1 billion. In this regard, as mentioned in previous years, the 2015-2025 Québec Infrastructure Plan priorizes the investments that will eliminate the asset maintenance deficits. Accordingly, for the next ten years, it has earmarked $31.3 billion for asset maintenance, $6.0 billion for asset maintenance deficit elimination, and $14.5 billion for replacement of existing infrastructure, an important part of these investments will make it possible to offset significant asset maintenance deficits. Over the coming fiscal years, the work will continue to complete the picture of the infrastructures presented in the Annual Management Plan for Public Infrastructure Investments. Moreover, additional information will be provided, notably to enable the bodies to present the evolution of the asset maintenance deficit and forecast the effect of their investments on the condition of the infrastructures and their asset maintenance deficit. Ultimately, the Annual Management Plan for Public Infrastructure Investments will provide public bodies, and the Government, with a major additional tool that will enable them to help prioritize asset maintenance and infrastructure replacement investments.
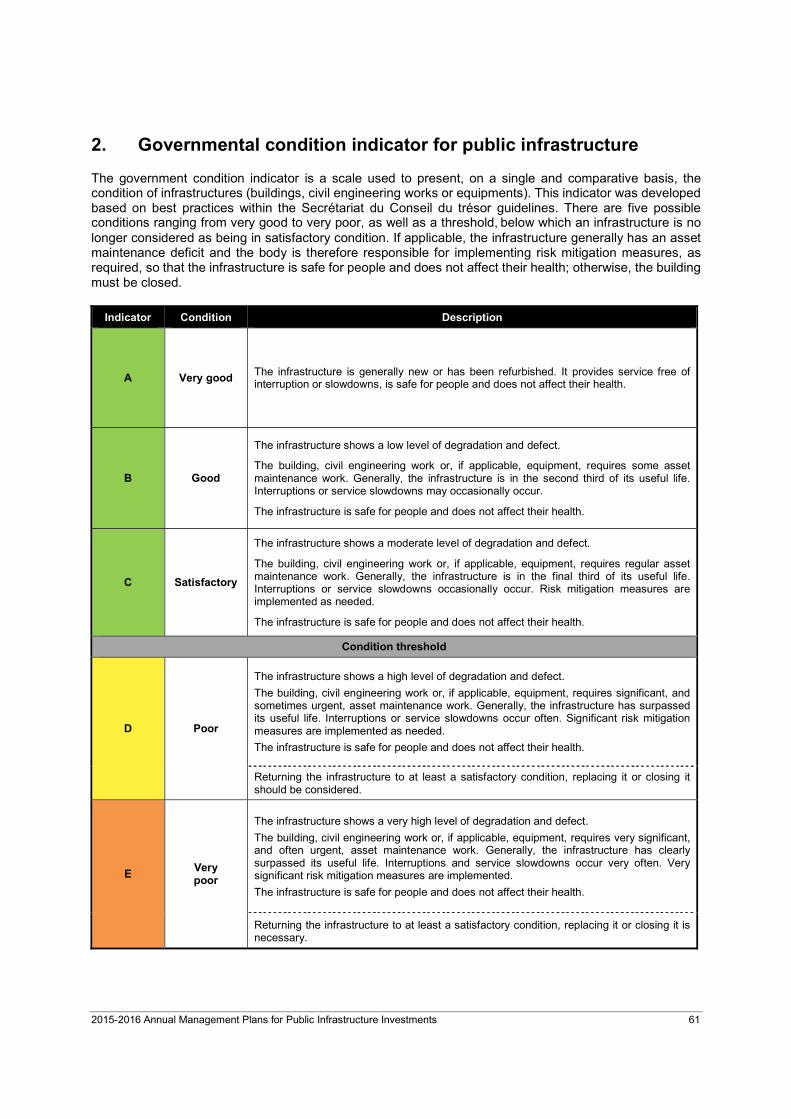
2015-2016 Annual Management Plans for Public Infrastructure Investments 61
2. Governmental condition indicator for public infrastructure
The government condition indicator is a scale used to present, on a single and comparative basis, the condition of infrastructures (buildings, civil engineering works or equipments). This indicator was developed based on best practices within the Secrétariat du Conseil du trésor guidelines. There are five possible conditions ranging from very good to very poor, as well as a threshold, below which an infrastructure is no longer considered as being in satisfactory condition. If applicable, the infrastructure generally has an asset maintenance deficit and the body is therefore responsible for implementing risk mitigation measures, as required, so that the infrastructure is safe for people and does not affect their health; otherwise, the building must be closed.
Indicator Condition Description
A Very good The infrastructure is generally new or has been refurbished. It provides service free of interruption or slowdowns, is safe for people and does not affect their health.
B Good
The infrastructure shows a low level of degradation and defect.
The building, civil engineering work or, if applicable, equipment, requires some asset maintenance work. Generally, the infrastructure is in the second third of its useful life. Interruptions or service slowdowns may occasionally occur.
The infrastructure is safe for people and does not affect their health.
C Satisfactory
The infrastructure shows a moderate level of degradation and defect.
The building, civil engineering work or, if applicable, equipment, requires regular asset maintenance work. Generally, the infrastructure is in the final third of its useful life. Interruptions or service slowdowns occasionally occur. Risk mitigation measures are implemented as needed.
The infrastructure is safe for people and does not affect their health.
Condition threshold
D Poor
The infrastructure shows a high level of degradation and defect.
The building, civil engineering work or, if applicable, equipment, requires significant, and sometimes urgent, asset maintenance work. Generally, the infrastructure has surpassed its useful life. Interruptions or service slowdowns occur often. Significant risk mitigation measures are implemented as needed.
The infrastructure is safe for people and does not affect their health.
Returning the infrastructure to at least a satisfactory condition, replacing it or closing it should be considered.
E Very poor
The infrastructure shows a very high level of degradation and defect.
The building, civil engineering work or, if applicable, equipment, requires very significant, and often urgent, asset maintenance work. Generally, the infrastructure has clearly surpassed its useful life. Interruptions and service slowdowns occur very often. Very significant risk mitigation measures are implemented.
The infrastructure is safe for people and does not affect their health.
Returning the infrastructure to at least a satisfactory condition, replacing it or closing it is necessary.

2015-2016 Annual Management Plans for Public Infrastructure Investments 62
3. 2015-2016 Annual Management Plans for Public Infrastructure Investments
This section contains the 2015-2016 Annual Management Plans for Public Infrastructure Investments developed by the Ministers responsible for the following portfolios:
• Affaires municipales et Occupation du territoire;
• Conseil du trésor et Administration gouvernementale;
• Culture et Communications;
• Développement durable, Environnement et Lutte contre les changements climatiques;
• Éducation, Enseignement supérieur et Recherche;
• Santé et Services sociaux;
• Tourisme;
• Transports.
2015-2016 Annual Management Plans for Public Infrastructure Investments 63
AFFAIRES MUNICIPALES ET OCCUPATION DU TERRITOIRE
INFRASTRUCTURE MANAGEMENT
SOCIÉTÉ D’HABITATION DU QUÉBEC VISION The vision of the Société d’habitation du Québec (SHQ), “Bâtissons ensemble du mieux-vivre,” reflects the mobilizing role that it intends to play, both with its partners and its personnel, in order to optimize its interventions and improve Quebecers’ quality of life. In doing so, the SHQ wants to help all citizens live better:
• By making it easier for households to get access to adequate housing;
• By helping urban and rural environments become more dynamic and revitalizing environments in decline.
ORIENTATIONS AND OBJECTIVES In order to carry out its mission, which is to facilitate citizens’ access to appropriate housing conditions, the SHQ has adopted the following orientations and objectives with regard to the infrastructure under its responsibility: Orientations
• Ensure that a sustainable pool of public and private housing is available;
• Adapt living environment.
Objectives
• Increase the supply of affordable housing;
• Maintain and improve the condition of social and affordable housing;
• Adapt housing to people’s physical needs;
• Help revitalize living environments. RESPONSIBILITIES The SHQ is under the legal authority of the Minister of Municipal Affairs and Land Occupancy and is the main government body responsible for housing in Québec. Under its constituting Act, it has the following responsibilities, among others:
• To make low-rent housing available to the citizens of Québec;
• To facilitate the acquisition of real property by the citizens of Québec;
• To inform the Minister on the requirements, priorities and objectives of all housing sectors in Québec. DESCRIPTION OF THE PORTFOLIO OF INFRASTRUCTURES The SHQ owns a real estate inventory of 3,769 buildings, 2,463 in its regular public component and 1,306 in the Inuit public component, representing a total of 45,268 dwellings.

64 2015-2016 Annual Management Plans for Public Infrastructure Investments Affaires municipales et Occupation du territoire
PUBLIC INFRASTRUCTURE INVESTMENTS INCLUDED IN THE QUÉBEC INFRASTRUCTURE PLAN by Body and Investment Type (contribution of Gouvernement du Québec, millions of dollars)
Asset
Maintenance
Elimination of Asset
Maintenance Deficit
Replacement Subtotal Addition and Improvement
Total Rate of
Completion
Société d’habitation du Québec
2013-2014
Probable 67.7 31.5 — 99.2 — 99.2
Actual 47.2 31.5 — 78.7 — 78.7 79 %
2014-2015
Forecast 36.9 29.7 — 66.6 — 66.6 Probable 36.9 29.7 — 66.6 — 66.6 100 %
ADDITIONAL INFORMATION The investments realized in 2013-2014 for buildings owned by the SHQ total $78.7 million, for a completion rate of 79%. For 2014-2015, the SHQ expects to invest $66.6 million.
These investments are implemented from the replacement, modernization and improvement (RMI) budget, allocated annually to bodies to which the Non-Profit Housing Program applies. The latter use the investments to perform work that maintains and improves buildings, so as to reduce their asset maintenance deficit and maintain or improve the condition of their assets.
The work in question can consist of repairs, replacements, improvements or modernizations, among other things.
The RMI budget thereby makes it possible to maintain the condition and sustainability of our collective heritage of low-rent housing and ensure that the living environments of households benefitting from the Non-Profit Housing Program are healthy and safe.
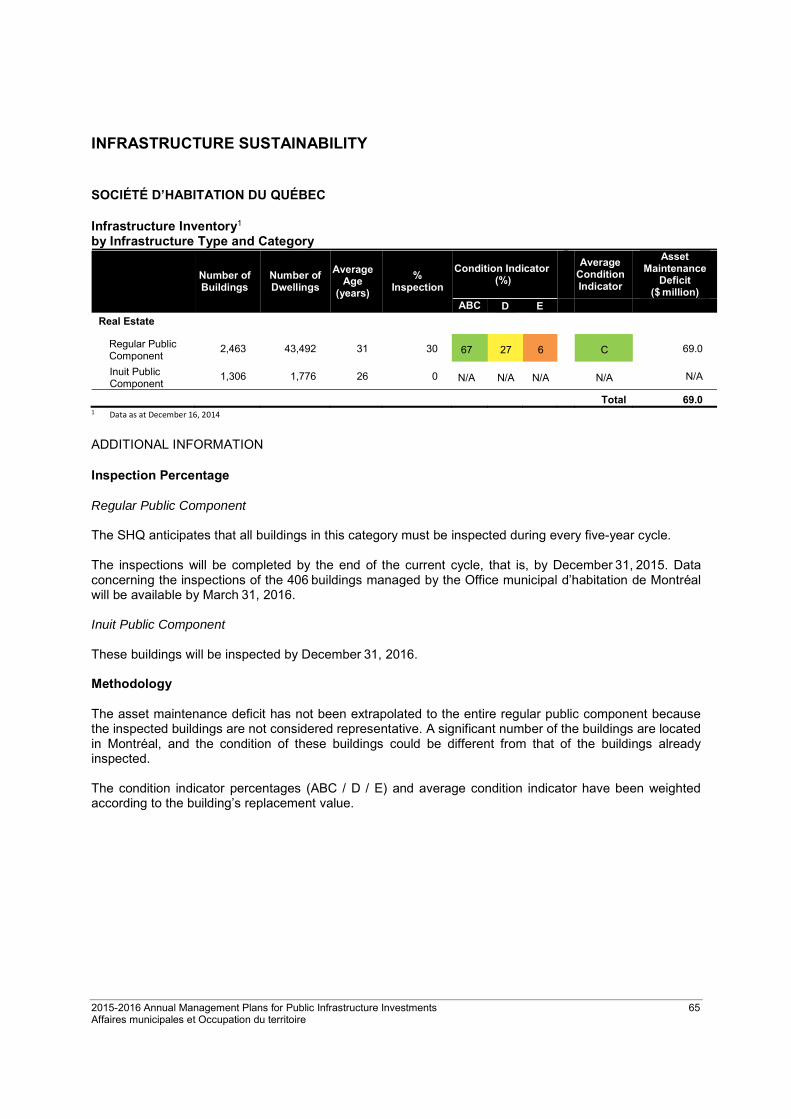
2015-2016 Annual Management Plans for Public Infrastructure Investments 65 Affaires municipales et Occupation du territoire
INFRASTRUCTURE SUSTAINABILITY SOCIÉTÉ D’HABITATION DU QUÉBEC Infrastructure Inventory1
by Infrastructure Type and Category
Number of Buildings
Number of Dwellings
Average Age
(years)
% Inspection
Condition Indicator (%)
Average
Condition Indicator
Asset Maintenance
Deficit ($ million)
ABC D E
Real Estate
Regular Public Component
2,463 43,492 31 30 67 27 6
C 69.0
Inuit Public Component
1,306 1,776 26 0 N/A N/A N/A
N/A N/A
Total 69.0 1 Data as at December 16, 2014 ADDITIONAL INFORMATION Inspection Percentage Regular Public Component The SHQ anticipates that all buildings in this category must be inspected during every five-year cycle. The inspections will be completed by the end of the current cycle, that is, by December 31, 2015. Data concerning the inspections of the 406 buildings managed by the Office municipal d’habitation de Montréal will be available by March 31, 2016. Inuit Public Component These buildings will be inspected by December 31, 2016. Methodology The asset maintenance deficit has not been extrapolated to the entire regular public component because the inspected buildings are not considered representative. A significant number of the buildings are located in Montréal, and the condition of these buildings could be different from that of the buildings already inspected. The condition indicator percentages (ABC / D / E) and average condition indicator have been weighted according to the building’s replacement value.

66 2015-2016 Annual Management Plans for Public Infrastructure Investments Affaires municipales et Occupation du territoire
APPENDIX 1
DETAILED INVENTORY Real Estate
Number of Buildings
Number of Dwellings
Condition Indicator (%) Average
Condition Indicator
Asset Maintenance
Deficit ($ million) ABC D E
0-20 years
Regular Public Component 35 360 83 17 0 B 0.3
21-30 years
Regular Public Component 1,040 17,230 70 24 6 B 16.2
31-40 years
Regular Public Component 1,309 24,464 63 30 7 C 52.1
41-50 years
Regular Public Component 79 1,438 95 5 0 A 0.4
Total 69.0
2015-2016 Annual Management Plans for Public Infrastructure Investments 67
CONSEIL DU TRÉSOR ET ADMINISTRATION GOUVERNEMENTALE
INFRASTRUCTURE MANAGEMENT SOCIÉTÉ QUÉBÉCOISE DES INFRASTRUCTURES
VISION The Société québécoise des infrastructures (SQI) helps plan, build and maintain the asset base of government buildings in accordance with the most stringent practices. It seeks to plan a lasting asset base, not only in terms of quality of construction, but also having regard to the buildings’ long-term impact on government resources and finances; build excellence among all the public infrastructure management teams; and develop trust with its shareholder, its clients, its business partners, and Québec citizens. ORIENTATIONS AND OBJECTIVES In order to carry out its mission, which consists, among other things, of developing, maintaining and managing a real estate inventory that meet its clients’ needs, primarily by putting buildings at their disposal and by providing construction, operations and real estate management services, the SQI has adopted the following orientation and objectives with regard to the infrastructure under its responsibility: Orientation
• Ensure the sustainability of infrastructure. Objectives
• Keep infrastructure in satisfactory condition;
• Monitor the elimination of the asset maintenance deficit for buildings.
RESPONSIBILITIES The SQI is responsible for ensuring the sustainability of one of the largest property portfolios in Québec. It must therefore maintain its assets in a satisfactory condition so that their physical and functional integrity are sustained over the long term. Moreover, it must meet the real estate needs of government departments and bodies by offering premises whose location, availability, quality and costs meet their needs, while ensuring optimal occupancy in order to reduce vacancies to a minimum, and rigorously manage the Government’s rent expense. Taking the Government’s investment capacity into account, it adjusts its interventions based on the condition of the building and with a view to preserve the asset and manage external climate risks. From a sustainable development standpoint, the SQI works to minimize energy consumption and measure the impact of climate change on its buildings to reduce their vulnerability. This is done both to ensure the safety of the occupants and to maintain the Government’s essential missions.
68 2015-2016 Annual Management Plans for Public Infrastructure Investments Conseil du trésor et Administration gouvernementale
With respect to the condition of the buildings it owns1, the SQI is responsible for conducting regular inspections of the components, their maintenance and repair, and the daily operations needed to deliver services to occupants, keep the premises safe and ensure the sustainability of the buildings. DESCRIPTION OF THE PORTFOLIO OF INFRASTRUCTURES The SQI’s real estate inventory consists of 357 owned buildings, with a leasable area of 1.6 million square metres. It includes office buildings used for government administration, as well as courthouses, detention facilities, Sûreté du Québec police stations and other specialized buildings such as transportation centres, music and performing arts conservatories, laboratories, warehouses and a few underground parking facilities and tunnels.
1 With the exception of buildings that are the subject of a lease with a health and social services institution and for which the maintenance of assets is
under their responsibility.

2015-2016 Annual Management Plans for Public Infrastructure Investments 69 Conseil du trésor et Administration gouvernementale
PUBLIC INFRASTRUCTURE INVESTMENTS INCLUDED IN THE QUÉBEC INFRASTRUCTURE PLAN by Infrastructure Category and Investment Type (contribution of the Gouvernement du Québec, millions of dollars)
Asset
Maintenance
Elimination of
Asset Replacement Subtotal
Addition and Improvement
Total Rate of
Completion
Office Buildings and Other Specialized Buildings
2013-2014 Probable 44.1 — 33.2 77.3 56.1 133.4
Actual 35.6 — 25.8 61.4 49.11 110.5 83 % 2014-2015
Forecast 81.3 — 42.6 123.9 69.3 193.2
Probable 58.1 — 25.2 83.3 57.2 140.5 73 %
Courthouses
2013-2014 Probable 20.0 — — 20.0 27.5 47.5 Actual 14.6 — — 14.6 15.8 30.4 64 %
2014-2015
Forecast 29.0 — — 29.0 17.6 46.6
Probable 27.8 — — 27.8 21.4 49.2 106 %
Detention Facilities
2013-2014
Probable 29.2 — 2.1 31.3 67.7 99.0
Actual 24.6 — 0.6 25.2 53.8 79.0 80 %
2014-2015
Forecast 13.5 — 4.9 18.4 220.2 238.6
Probable 13.6 — 2.2 15.8 177.6 193.4 81 %
Sûreté du Québec Police Stations
2013-2014
Probable 11.0 — 0.5 11.5 2.5 14.0
Actual 8.2 — — 8.2 2.4 10.6 76 %
2014-2015
Forecast 10.1 — 3.5 13.6 — 13.6
Probable 8.5 — — 8.5 — 8.5 63 %
Total
2013-2014
Probable 104.3 — 35.8 140.1 153.8 293.9
Actual 83.0 — 26.4 109.4 121.1 230.5 78 %
2014-2015
Forecast 133.9 — 51.0 184.9 307.1 492.0
Probable 108.0 — 27.4 135.4 256.2 391.6 80 % 1 Investments on additions and improvements do not include an accounting of the lease of Édifice Marly, valued at $135.4 million, which is considered
a capital lease.

70 2015-2016 Annual Management Plans for Public Infrastructure Investments Conseil du trésor et Administration gouvernementale
ADDITIONAL INFORMATION The investments realized in 2013-2014 for buildings owned by the SQI total $230.5 million, for an overall completion rate of 78%.
• Specifically, a rate of 64% has been observed for the Courthouses category. It is attributable to delays in carrying out two projects:
— The Palais de justice de Montmagny project, to be delivered by the end of the 2014-2015 fiscal year, for which the delays in the work flow in 2013-2014 are attributable in part to unforeseen structural stabilization work on the existing building and several information requests to professionals aimed at clarifying certain construction details and obtaining particulars about the plans and specifications;
— The Palais de justice de Rimouski project, in which a business case must be completed and submitted to the Government for a decision.
The main projects completed in 2013-2014 are the following:
• Construction of a Sûreté du Québec police station in Sainte-Agathe-des-Monts;
• Construction of a service centre for the Ministère des Transports in Amos;
• Enlargement of the Palais de justice de Salaberry-de-Valleyfield;
• Construction of a Sûreté du Québec police station in Ville-Marie;
• New Ministère des Transports operations centre at the Turcot interchange in Montréal. Probable investments on buildings in 2014-2015 total $391.6 million, which represents an overall completion rate of 80%.
• For the Sûreté du Québec police station category, the anticipated completion rate of 63% is primarily due to the deferral of the project to upgrade the data processing centre at the Sûreté du Québec headquarters so the client can finalize its functional and technical requirements;
• For the Courthouses category, the anticipated completion rate is 106% and is primarily due to the deferral, to 2014-2015, of the planned 2013-2014 investments in the enlargement and renovation of the Palais de justice de Montmagny.
Lastly, the main projects carried out or in progress in 2014-2015 are as follows:
• Renovation, enlargement and redevelopment of the Atrium in Québec City;
• Renovation of the service centre of the Ministère des Transports in Papineauville;
• Construction of a service centre for the Ministère des Transports in Rouyn-Noranda;
• Construction of a detention centre in Roberval;
• Enlargement and redevelopment of the Palais de justice de Montmagny;
• Construction of a massive data processing centre for Revenu Québec;
• Major asset maintenance project at the Québec City detention facility;
• Modernization of the Parliament Hill power supply network.

2015-2016 Annual Management Plans for Public Infrastructure Investments 71 Conseil du trésor et Administration gouvernementale
INFRASTRUCTURE SUSTAINABILITY SOCIÉTÉ QUÉBÉCOISE DES INFRASTRUCTURES
Infrastructure Inventory1
by Infrastructure Type and Category
Quantity Size (m2)
Average Age
(years)
% Inspection
Condition Indicator (%)
Average Condition Indicator
Asset Maintenance
Deficit ($ million) ABC D E
Real Estate
Office Buildings 60 500,300 34 100 91 6 3 B 47.0
Other Specialized Buildings
167 392,300 35 100 92 6 2
B 7.4
Courthouses 43 427,900 35 100 98 1 1 A 0.7
Detention Facilities
14 154,100 29 100 71 23 6
C 53.9
Sûreté du Québec Police Stations
73 171,000 24 100 97 3 0
A 3.2
Total 112.2 1 Data as at October 15, 2014 ADDITIONAL INFORMATION Methodology The condition indicator percentages (ABC / D / E) and average condition indicator are weighted according to the building’s replacement value.


2015-2016 Annual Management Plans for Public Infrastructure Investments 73
CULTURE ET COMMUNICATIONS
INFRASTRUCTURE MANAGEMENT MINISTÈRE DE LA CULTURE ET DES COMMUNICATIONS VISION Culture, a Québec responsibility and essential component of society's development, which is woven into the social, economic, environmental and territorial facets and solicits the engagement of partners. ORIENTATIONS AND OBJECTIVES In order to carry out its mission, which is to contribute to affirming Québec's identity and cultural vitality, promote access to and citizen participation in cultural life, and foster the development of communications, the Ministère de la Culture et des Communications (MCC) has adopted the following orientation and objectives with regard to the infrastructure under its responsibility: Orientation
• Foster access to culture and its dissemination. Objectives
• Prevent the deterioration of the buildings and equipments of government bodies and corporations so as to avoid major renovations;
• Ensure that the clienteles of government bodies and corporations are provided with infrastructures that meet standards;
• Maintain appropriate conditions for displaying and conserving assets and works of art. RESPONSIBILITIES Each year, the MCC allocates substantial sums to government bodies and corporations reporting to the Minister of Culture and Communications to maintain their assets and eliminate the asset maintenance deficit. The MCC ensures that the amounts allocated are used for their intended purposes. The MCC also ensures that information on the infrastructure and required documentation on their condition is available and pertinent, so as to establish an objective, reliable picture of the infrastructure network under its responsibility. The MCC thus provides for proper management of infrastructure in keeping with the constituting acts of the government bodies and corporations reporting to the Minister of Culture and Communications. DESCRIPTION OF THE PORTFOLIO OF INFRASTRUCTURES MCC owns Bibliothèque Saint-Sulpice, a registered historic building, since 2008.

74 2015-2016 Annual Management Plans for Public Infrastructure Investments Culture et Communications
GOVERNMENT BODIES AND CORPORATIONS REPORTING TO THE MINISTER OF CULTURE AND COMMUNICATIONS RESPONSIBILITIES The government bodies and corporations under the responsibility of the Minister of Culture and Communications draw up a detailed plan of their needs in terms of asset maintenance, eliminating the asset maintenance deficit, and infrastructure replacement. They remain responsible for the work performed, regular follow-up and reporting, as well as for evaluating the overall condition of their infrastructure. In fact, government bodies and corporations are responsible for evaluating and documenting the condition of their infrastructure so as to provide optimal management and update this information regularly. DESCRIPTION OF THE PORTFOLIO OF INFRASTRUCTURES The infrastructure network of government bodies and corporations under the responsibility of the Minister of Culture and Communications comprises 46 buildings (including 31 heritage buildings owned by the Société de développement des entreprises culturelles (SODEC)) and specialized equipment required to fulfill their respective missions.

2015-2016 Annual Management Plans for Public Infrastructure Investments 75 Culture et Communications
PUBLIC INVESTMENT IN INFRASTRUCTURE INCLUDED IN THE QUÉBEC INFRASTRUCTURE PLAN by Body or Group of Bodies and by Investment Type (contribution of the Gouvernement du Québec, millions of dollars)
Asset
Maintenance
Elimination of Asset
Maintenance Deficit
Replacement Subtotal Addition and Improvement
Total Rate of
Completion
Ministère de la Culture et des Communications
2013-2014
Probable 0.40 — — 0.40 — 0.40
Actual 0.37 — — 0.37 — 0.37 93 % 2014-2015
Forecast 0.40 — — 0.40 — 0.40
Probable 0.38 — — 0.38 — 0.38 95 % Government Bodies and Corporations reporting to the Minister of Culture and Communications1
2013-2014
Probable 36.0 11.5 — 47.5 9.5 57.0
Actual 35.8 14.6 — 50.4 7.9 58.3 102 % 2014-2015
Forecast 109.2 66.8 — 176.0 38.3 214.3
Probable 109.2 66.8 0.5 176.5 48.8 225.3 105 % 1 Amounts "Probable 2013-2014" and "Forecast 2014-2015" correspond to those published in the QIP 2014-2024. Amounts "Actual 2013-2014"
represent investments realized in 2013-2014. Regarding the amounts "Probable 2014-2015" these include investments that will be realized in 2014-2015 and total investments announced and unrealized before 2014-2015. These basis will be standardized in 2015-2016 and will be reflected in the Annual Investment Management Plans when submitting in the 2016-2017 Budget
ADDITIONAL INFORMATION Ministère de la Culture et des Communications The 2013-2014 and 2014-2015 investments were used to maintain the assets of Bibliothèque Saint-Sulpice. Government Bodies and Corporations reporting to the Minister of Culture and Communications The investments made in 2013-2014 total $58.3 million, which represents a completion rate of 102%. This completion rate is due to the fact that some work was moved up, as well as a faster pace of execution than anticipated. These amounts made it possible to carry out certain projects, including:
• Expansion of the Musée national des beaux-arts du Québec;
• Sound system installation for Salle Louis-Fréchette at the Grand Théâtre;
• Rehabilitation of the colonnade, seating and orchestra pit at Salle Wilfrid-Pelletier;
• Rehabilitation of the masonry at the Musée de la civilisation;
• Acquisition of specialized equipment for all government corporations, as well as miscellaneous work on SODEC heritage buildings.
Probable investments in 2014-2015 total $225.3 million, which represents a completion rate of 105%. Among other things, these amounts will be used to continue certain projects, including:
• Expansion of the Musée national des beaux-arts du Québec;
• Rehabilitation of the masonry at the Musée de la civilisation;
• Renovation of the back-stage area of Place des Arts' Salle Wilfrid-Pelletier;
• Acquisition of specialized equipment for all government corporations, as well as miscellaneous work on SODEC heritage buildings.

76 2015-2016 Annual Management Plans for Public Infrastructure Investments Culture et Communications
INFRASTRUCTURE SUSTAINABILITY MINISTÈRE DE LA CULTURE ET DES COMMUNICATIONS Infrastructure Inventory1 by Infrastructure Type and Category
Quantity Dimension
(m2)
Average Age
(years)
% Inspection
Condition Indicator (%)
Average Condition Indicator
Asset Maintenance
Deficit ($ million)ABC D E
Real Estate
Bibliothèque Saint-Sulpice 1 3,136 102 0 N/A N/A N/A
N/A N/A
1 Data as at December 31, 2014 ADDITIONAL INFORMATION Inspection Percentage Given that Bibliothèque Saint-Sulpice has been vacant for over ten years and that MCC is contemplating selling the building to a private or public buyer, no in-depth inspection will be made to assess its condition or asset maintenance deficit. Until it is sold, MCC has mandated the Société québécoise des infrastructures to perform weekly summary inspections and carry out the minimal asset maintenance work required to ensure safety and safeguard the building's condition.

2015-2016 Annual Management Plans for Public Infrastructure Investments 77 Culture et Communications
GOVERNMENT BODIES AND CORPORATIONS REPORTING TO THE MINISTER OF CULTURE AND COMMUNICATIONS Infrastructure Inventory1 by Infrastructure Type and Category
Quantity Dimension
(m2)
Average Age
(years)
% Inspection
Condition Indicator (%)
Average Condition Indicator
Asset Maintenance
Deficit ($ million) ABC D E
Real Estate
Museums 9 77,302 92 93 86 0 14 C 7.4
Venues 2 146,562 38 100 15 69 16 D 49.1
Libraries 2 51,700 38 100 100 0 0 A —
Broadcast 2 21,109 56 92 100 0 0 C —
Heritage Buildings 31 260,738 234 0 N/A N/A N/A N/A N/A
Equipment Specialized Equipment N/A N/A N/A 0 N/A N/A N/A N/A N/A
Total 56.5 1 Data as at December 31, 2014 ADDITIONAL INFORMATION Inspection Percentage All of the buildings have been inspected, aside from a regional broadcasting facility and heritage buildings. These buildings will be inspected by March 31, 2016. Moreover, some additional expert reports must be completed for certain museums. The specialized equipment of all government bodies and corporations will be evaluated by March 31, 2016 and it is possible that these will be presented in the next Annual Investment Management Plan. Methodology For the museums and broadcast facilities, the condition indicator and asset maintenance deficit were extrapolated by considering that those inspected were deemed representative. The condition indicator percentages (ABC / D / E) and average condition indicator are weighted according to the buildings’ replacement value. For Place des Arts infrastructure, included in the "Venue" category, in 2013, the MCC announced $50.0 million in financial assistance to upgrade this complex. Much work has been completed while other work is ongoing. For the Grand Théâtre de Québec, also included in the "Venue" category, although the inspection has been completed, the evaluation of asset maintenance costs has not been finalized for the deterioration of the exterior cladding, which will require work in upcoming fiscal years.
78 2015-2016 Annual Management Plans for Public Infrastructure Investments Culture et Communications
APPENDIX 1 COMPOSITION OF GROUP OF BODIES Government Bodies and Corporations reporting to the Minister of Culture and Communications Bibliothèque et Archives nationales du Québec Conseil des arts et des lettres du Québec Conservatoire de musique et d’art dramatique du Québec Musée d’Art contemporain de Montréal Musée de la civilisation Musée national des beaux-arts du Québec Régie du cinéma Société de la Place des Arts de Montréal Société de télédiffusion du Québec Société du Grand Théâtre de Québec Société de développement des entreprises culturelles
2015-2016 Annual Management Plans for Public Infrastructure Investments 79
DÉVELOPPEMENT DURABLE, ENVIRONNEMENT ET LUTTE CONTRE LES CHANGEMENTS CLIMATIQUES
INFRASTRUCTURE MANAGEMENT MINISTÈRE DU DÉVELOPPEMENT DURABLE, DE L’ENVIRONNEMENT ET DE LA LUTTE CONTRE LES CHANGEMENTS CLIMATIQUES VISION In keeping with its key responsibilities to citizens and partners, the Ministère du Développement durable, de l’Environnement et de la Lutte contre les changements climatiques (MDDELCC) undertakes to promote sustainable development by protecting Québec’s environment and natural heritage in cooperation with its partners. ORIENTATIONS AND OBJECTIVES MDDELCC's mission is to contribute to the sustainable development of Québec by protecting the environment, preserving biodiversity and fighting against climate change. The operation of public dams falls under the Department's purview. MDDELCC entrusts this responsibility to the Centre d'expertise hydrique du Québec, an administrative unit of the Department with the following orientation and objectives: Orientation
• Manage the Government's public water domain, monitor dam safety and operate public dams. Objectives
• Safely operate dams in compliance with the relevant safety standards;
• Inspect and service dams to ensure they operate safely and efficiently;
• Assess the safety of public dams and coordinate emergency interventions;
• Remove dams not essential to the Government's mission for safety and environmental reasons. RESPONSIBILITIES Dam management is subject to legal obligations that vary with the type of dam (high-capacity, low-capacity, small). In addition to its legal obligations, MDDELCC takes into account the risks associated with dams, along with the budget and human resources it has been allocated for their management. DESCRIPTION OF THE PORTFOLIO OF INFRASTRUCTURES MDDELCC operates and administers 758 dams within the meaning of the Dam Safety Act (chapter S-3.1.01), including 323 high-capacity, 202 low-capacity and 233 small dams. The "high-capacity" and "low-capacity" categories are defined by the Act. All dams more than 1 metre in height that are not "high-capacity" or "low-capacity" but are contemplated by the Act are referred to as "small dams."
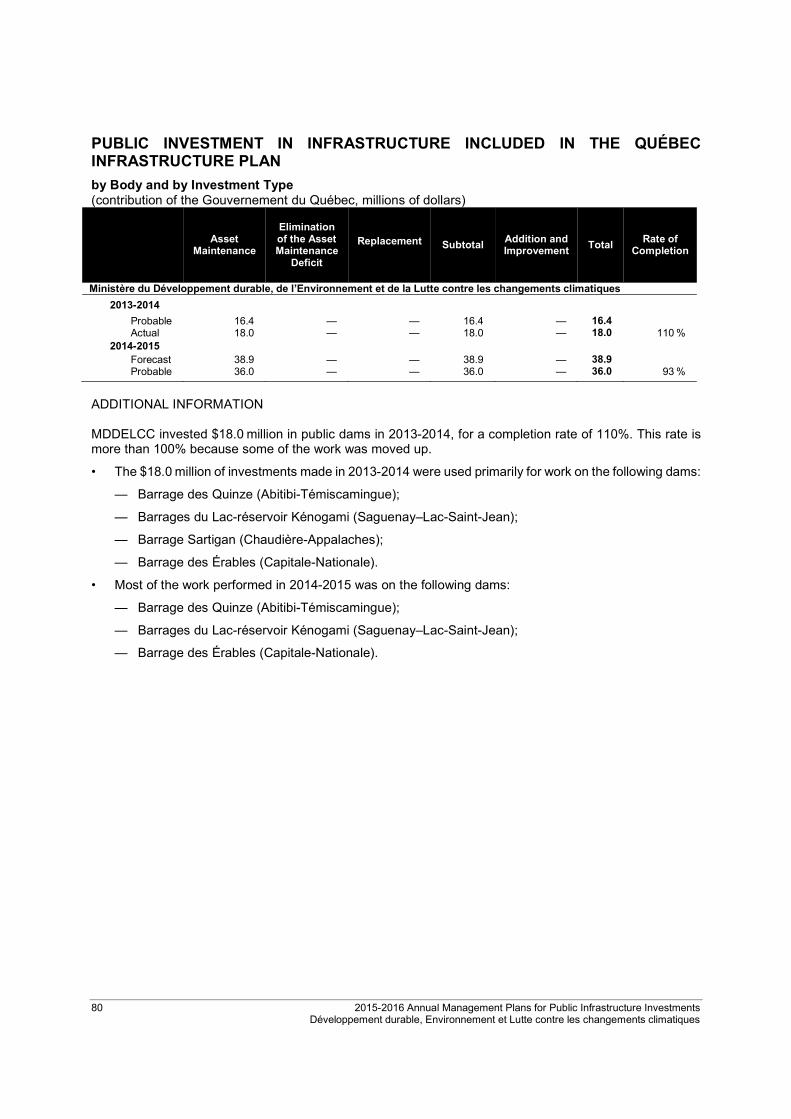
80 2015-2016 Annual Management Plans for Public Infrastructure Investments Développement durable, Environnement et Lutte contre les changements climatiques
PUBLIC INVESTMENT IN INFRASTRUCTURE INCLUDED IN THE QUÉBEC INFRASTRUCTURE PLAN
by Body and by Investment Type (contribution of the Gouvernement du Québec, millions of dollars)
Asset Maintenance
Elimination of the Asset Maintenance
Deficit
Replacement Subtotal Addition and Improvement
Total Rate of
Completion
Ministère du Développement durable, de l’Environnement et de la Lutte contre les changements climatiques
2013-2014
Probable 16.4 — — 16.4 — 16.4 Actual 18.0 — — 18.0 — 18.0 110 %
2014-2015 Forecast 38.9 — — 38.9 — 38.9 Probable 36.0 — — 36.0 — 36.0 93 %
ADDITIONAL INFORMATION MDDELCC invested $18.0 million in public dams in 2013-2014, for a completion rate of 110%. This rate is more than 100% because some of the work was moved up.
• The $18.0 million of investments made in 2013-2014 were used primarily for work on the following dams:
— Barrage des Quinze (Abitibi-Témiscamingue);
— Barrages du Lac-réservoir Kénogami (Saguenay–Lac-Saint-Jean);
— Barrage Sartigan (Chaudière-Appalaches);
— Barrage des Érables (Capitale-Nationale).
• Most of the work performed in 2014-2015 was on the following dams:
— Barrage des Quinze (Abitibi-Témiscamingue);
— Barrages du Lac-réservoir Kénogami (Saguenay–Lac-Saint-Jean);
— Barrage des Érables (Capitale-Nationale).
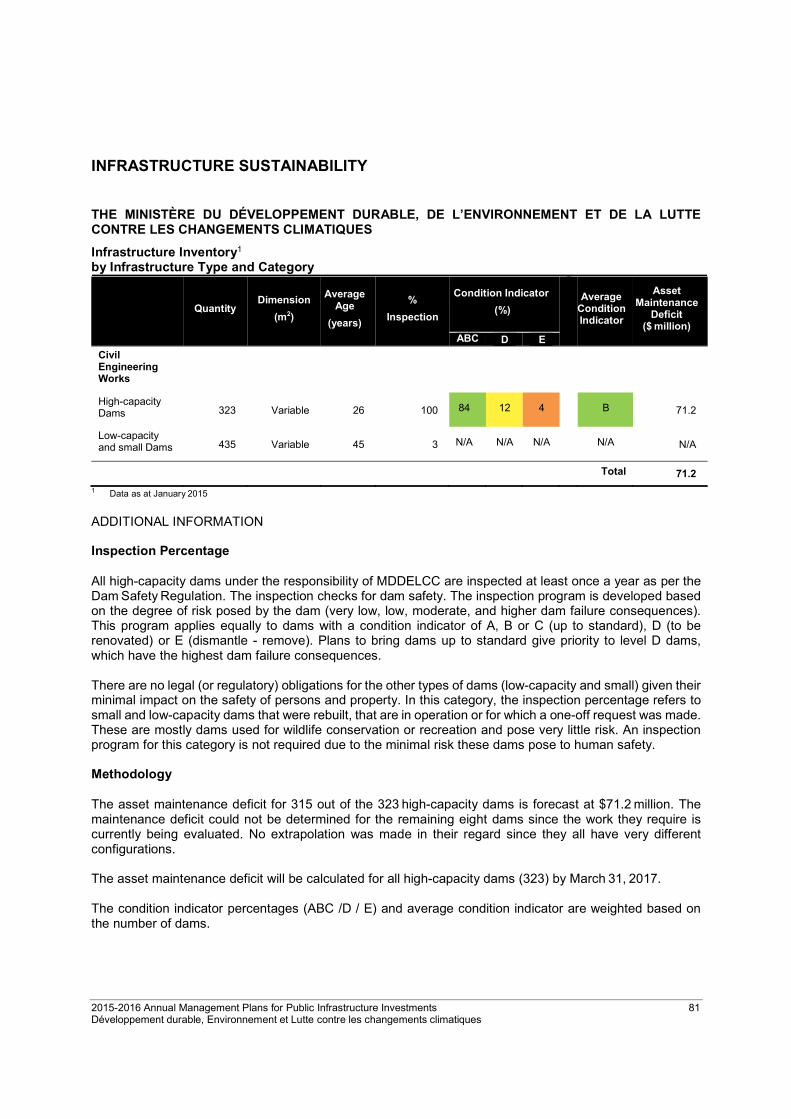
2015-2016 Annual Management Plans for Public Infrastructure Investments 81 Développement durable, Environnement et Lutte contre les changements climatiques
INFRASTRUCTURE SUSTAINABILITY THE MINISTÈRE DU DÉVELOPPEMENT DURABLE, DE L’ENVIRONNEMENT ET DE LA LUTTE CONTRE LES CHANGEMENTS CLIMATIQUES
Infrastructure Inventory1 by Infrastructure Type and Category
Quantity Dimension
(m2)
Average Age
(years)
%
Inspection
Condition Indicator
(%)
Average
Condition Indicator
Asset Maintenance
Deficit ($ million)
ABC D E
Civil Engineering Works
High-capacity Dams 323 Variable 26 100 84 12 4 B 71.2
Low-capacity and small Dams 435 Variable 45 3 N/A N/A N/A N/A N/A
Total 71.2
1 Data as at January 2015
ADDITIONAL INFORMATION Inspection Percentage All high-capacity dams under the responsibility of MDDELCC are inspected at least once a year as per the Dam Safety Regulation. The inspection checks for dam safety. The inspection program is developed based on the degree of risk posed by the dam (very low, low, moderate, and higher dam failure consequences). This program applies equally to dams with a condition indicator of A, B or C (up to standard), D (to be renovated) or E (dismantle - remove). Plans to bring dams up to standard give priority to level D dams, which have the highest dam failure consequences. There are no legal (or regulatory) obligations for the other types of dams (low-capacity and small) given their minimal impact on the safety of persons and property. In this category, the inspection percentage refers to small and low-capacity dams that were rebuilt, that are in operation or for which a one-off request was made. These are mostly dams used for wildlife conservation or recreation and pose very little risk. An inspection program for this category is not required due to the minimal risk these dams pose to human safety. Methodology The asset maintenance deficit for 315 out of the 323 high-capacity dams is forecast at $71.2 million. The maintenance deficit could not be determined for the remaining eight dams since the work they require is currently being evaluated. No extrapolation was made in their regard since they all have very different configurations. The asset maintenance deficit will be calculated for all high-capacity dams (323) by March 31, 2017. The condition indicator percentages (ABC /D / E) and average condition indicator are weighted based on the number of dams.

2015-2016 Annual Management Plans for Public Infrastructure Investments 83
ÉDUCATION, ENSEIGNEMENT SUPÉRIEUR ET RECHERCHE
INFRASTRUCTURE MANAGEMENT EDUCATION VISION The Ministère de l’Éducation, de l’Enseignement supérieur et de la Recherche (MEESR) aims to school board infrastructure to provide healthy, safe and accessible settings that are pleasant and conducive to learning and student development. Investments in them are prioritized according to this criteria. ORIENTATIONS AND OBJECTIVES In order to carry out its mission, which consists to promote education, recreation and sport, the MEESR has adopted the following orientation and objectives with regard to the infrastructure under its responsibility: Orientation
• Maintain conditions conducive to learning, ensuring the quantity, quality and sustainability of infrastructure.
Objectives
• Support the school boards in the planning of middle and long-term needs;
• Monitor the elimination of the asset maintenance deficit;
• Keep average-condition of infrastructure at a satisfactory level;
• Improve infrastructure quality. RESPONSIBILITIES The MEESR enacts orientations and objectives and allocates investments based on government challenges, particularly those related to the education network. According to budget rules in effect, the MEESR allocates to school boards funds to maintain assets, eliminate the asset maintenance deficit, add, replace and improve infrastructure. The MEESR ensures that the amounts allocated to school boards are used for the purpose intended. SCHOOL BOARDS RESPONSIBILITIES The school boards manage the infrastructure they own, working closely with the MEESR. The school boards plan and manage investments and work done based on the projects authorized and the amounts allocated. They ensure that the infrastructure are functional, safe, effective and reliable.
84 2015-2016 Annual Management Plans for Public Infrastructure Investments Éducation, Enseignement supérieur et Recherche
DESCRIPTION OF THE PORTFOLIO OF INFRASTRUCTURES The school boards' infrastructure network consists of 4,132 buildings, representing a surface area of approximately 16.37 million square metres. This network is broken down between the linguistic school boards and special status school boards, and includes buildings in different categories : preschools, primary and secondary schools, vocational and adult education centres, administrative and other buildings as well as surplus buildings. The school boards also have an inventory of equipment that is used for education, recreation and sports.
HIGHER EDUCATION AND RESEARCH VISION The quality of infrastructure for higher education has a direct impact on the image of education available in Québec. Students must have stimulating learning environments that reflect the needs of the labour market. Whether through safe infrastructure, cutting-edge laboratories or environments that meet the needs of students and staff, efforts must converge on the common objective of offering the best quality of teaching possible.
ORIENTATIONS AND OBJECTIVES In order to carry out its mission, which consists to promote higher education, research and science, the MEESR has adopted the following orientation and objectives for infrastructure that fall within its purview:
Orientation
• Maintain conditions favourable to higher education and research, ensuring the quality, safety and sustainability of infrastructure.
Objectives
• Evaluate all buildings designated for funding in the next five years and follow up on the evaluation;
• Maintain in satisfactory condition or improve the condition of buildings frequented by students in higher education networks;
• Improve the annual monitoring of projects related to the asset maintenance deficit and asset maintenance, and improve the quality of information on the condition of infrastructure;
• In the next five years, improve the resource allocation model, in part to take into account, among other things, the condition of infrastructure.
RESPONSIBILITIES The MEESR allocates amounts to colleges and universities for maintaining assets, eliminating the asset maintenance deficit and adding, replacing and improving their infrastructure. It ensures that the amounts allocated to institutions are used for the intended purpose by analyzing the compliance of the projects presented in the institution's capital budget and declared in its reporting.
2015-2016 Annual Management Plans for Public Infrastructure Investments 85 Éducation, Enseignement supérieur et Recherche
CEGEPs AND UNIVERSITIES RESPONSIBILITIES
The MEESR funding model distinguishes between spaces that are designated and not designated for funding. The MEESR pays allocations for asset maintenance, eliminating the asset maintenance deficit and adding, replacing and improving buildings for designated spaces. For these spaces, colleges and universities are responsible for managing their infrastructure and planning work, according to MEESR rules. For these spaces, the institutions must present the projects they intend to complete in the annual capital budget and obtain confirmation from the MEESR that the projects are compliant. The institution must provide a summary or detailed description of each project depending on the scope, funding detail and the building in question. Institutions must also provide the MEESR with information on the condition of these buildings.
The MEESR does not provide an allocation for spaces not designated for funding. Institutions must fund these spaces through their own revenue. For these spaces, each institution is responsible for ensuring the quality, security and sustainability of the infrastructure. DESCRIPTION OF THE PORTFOLIO OF INFRASTRUCTURES The CEGEP infrastructure network includes 925 buildings, representing a surface area of around 2.63 million square metres, of which around 2.50 million square metres in 857 buildings are designated for funding by the MEESR. The university infrastructure network includes 1,016 buildings, representing a surface area of around 4.69 million square metres, of which around 3.48 million square metres in 732 buildings are designated for funding by the MEESR. The college and university networks also have an inventory of equipment. This equipment is used for teaching and research.

86 2015-2016 Annual Management Plans for Public Infrastructure Investments Éducation, Enseignement supérieur et Recherche
PUBLIC INFRASTRUCTURE INVESTMENTS INCLUDED IN THE QUÉBEC INFRASTRUCTURE PLAN by Group of Bodies and by Investment Type (contribution of the Gouvernement du Québec, millions of dollars)
Asset Maintenance
Elimination of the Asset Maintenance
Deficit
Replacement Subtotal Addition and Improvement
Total Rate of
Completion
School Boards1
2013-2014
Probable 708.0 127.0 12.0 847.0 205.0 1 052.0 Actual 708.0 127.0 12.0 847.0 205.0 1 052.0 100 %
2014-2015
Forecast 808.2 127.0 19.3 954.5 586.0 1 540.5
Probable 778.2 127.0 19.3 924.5 745.0 1 669.5 108 %
CEGEPs1
2013-2014 Probable 145.8 26.8 — 172.6 23.4 196.0 Actual 145.8 26.8 — 172.6 15.7 188.3 96 %
2014-2015 Forecast 145.8 26.8 — 172.6 17.5 190.1 Probable 145.8 26.8 1.3 173.9 24.4 198.3 104 %
Universities1 2013-2014
Probable 163.1 66.7 96.6 326.4 11.2 337.6 Actual 163.1 66.7 96.6 326.4 11.1 337.5 100 %
2014-2015 Forecast 161.7 66.7 101.2 329.6 20.2 349.8 Probable 161.7 66.7 101.2 329.6 38.8 368.4 105 %
1 Amounts "Probable 2013-2014" and "Forecast 2014-2015" correspond to those published in the QIP 2014-2024. Amounts "Actual 2013-2014" and "Probable 2014-2015" were determined on the same basis as in previous years, which may vary between some bodies. These basis will be standardized in 2015-2016 and will be reflected in the Annual Investment Management Plans when submitting the 2016-2017 Budget.
ADDITIONAL INFORMATION School Boards Infrastructure investments made in 2013-2014 by school boards total $1,052.0 million, which represents a completion rate of 100%.
• $847.0 million allocated for work to maintain school infrastructure assets and to eliminate the asset maintenance deficit. This work was mainly to redo roofs and exterior cladding and to replace windows and floor coverings;
• $205.0 million invested to expand and build schools across Québec. Furthermore, for 2014-2015, the main addition and improvement projects involve:
• Enlargement of primary schools;
• Building primary schools;
• Adding vocational training infrastructure.

2015-2016 Annual Management Plans for Public Infrastructure Investments 87 Éducation, Enseignement supérieur et Recherche
CEGEPs The investments made by CEGEPs in 2013-2014 total $188.3 million, which represents a completion rate of 96%.
• $172.6 million was invested in CEGEPs, mainly for work on exterior cladding, roofs and mechanical and electrical systems, and for furniture and libraries;
• $15.7 million was used to improve the service offer, in particular by creating new student spaces at the Cégep de l’Outaouais and the Terrebonne campus of the Cégep régional de Lanaudière.
The main projects ongoing in 2014–2015 are:
• $173.9 million, mainly for work on exterior cladding, roofs and mechanical and electrical systems, and for furniture and libraries;
• $24.4 million to improve the service offer, by creating new student spaces at the Cégep de Saint-Hyacinthe and the L’Assomption campus of the Cégep régional de Lanaudière.
Universities The investments made by universities in 2013-2014 total $337.5 million, which represents a completion rate of 100%.
• $326.4 million was invested in universities, mainly for work on exterior cladding, roofs and mechanical and electrical systems, and for furniture and support to libraries;
• $11.1 million was invested to refurbish and renovate certain buildings, in particular the Grand Séminaire of the Université du Québec à Chicoutimi and the dentistry at Université de Montréal.
The main projects ongoing in 2014–2015 are:
• $329.6 million was invested for work on exterior cladding, roofs and mechanical and electrical systems, and for furniture and support to libraries;
• $38.8 million was invested to develop information technology at Université Laval, to upgrade Pavilion Édouard-Asselin at the Institut national de la recherche scientifique and to refurbish the premises at Université de Sherbrooke.

88 2015-2016 Annual Management Plans for Public Infrastructure Investments Éducation, Enseignement supérieur et Recherche
INFRASTRUCTURE SUSTAINABILITY SCHOOL BOARDS
Infrastructure Inventory1
by Infrastructure Type and Category
Quantity Dimension
(m2)
Average Age
(years)
% Inspection
Condition Indicator (%)
Average Condition Indicator
Asset Maintenance
Deficit ($ million) ABC D E
Real Estate
Linguistic School Boards
Educational Institutions
Preschools and Primary Schools
2,195 6,833,372 56 N/A 68 19 13 D 1,031.1
Secondary Schools
463 6,616,413 50 N/A 79 16 5 C 301.5
Vocational and Adult Education Centre
285 1,643,572 52 N/A 74 19 7 C 109.2
Administrative and other uses
562 797,373 51 N/A 61 20 19 D 114.6
Surplus Buildings 144 221,358 66 N/A N/A N/A N/A N/A N/A
Special Status School Boards
481 258,014 26 N/A N/A N/A N/A N/A N/A
Equipment N/A N/A N/A N/A N/A N/A N/A N/A N/A Total 1,556.4
1 Data as at June 2014
ADDITIONAL INFORMATION
Inspection Percentage
The MEESR makes a register available to school boards so that after their own inspection they can enter the work they intend to complete on their buildings. While the majority of buildings have been inspected, the register does not allow to accurately establish the percentage of inspections conducted on all building components. However, the register establishes condition indicators and asset maintenance deficit of all buildings, except for surplus buildings and special status school board buildings. The register does not offer a representative overview for these two categories. In the next five years, the MEESR and school boards will introduce a systematic inspection program to inspect all buildings and the database will be upgraded to obtain a representative picture of the school boards buildings. Furthermore, the MEESR does not have reliable information about the equipment inventory of school boards. This inventory will be discussed by the MEESR and the school boards to assess whether a request for data collection is appropriate. Methodology
The condition indicator percentages (ABC / D / E) and average condition indicator are weighted according to the surface area of buildings.

2015-2016 Annual Management Plans for Public Infrastructure Investments 89 Éducation, Enseignement supérieur et Recherche
CEGEPs Infrastructure Inventory1
by Infrastructure Type and Category
Quantity Dimension
(m2)
Average Age
(years)
%
Inspection
Condition Indicator
(%)
Average
Condition Indicator
Asset Maintenance
Deficit ($ million)
ABC D E
Real Estate
Spaces designated for funding
857 2,501,735 41 100 62 25 13 D 598.9
Spaces not designated for funding
68 126,784 N/A 0 N/A N/A N/A N/A N/A
Equipment N/A N/A N/A N/A N/A N/A N/A N/A N/A Total 598.9
1 Data as at January 2015 ADDITIONAL INFORMATION Inspection Percentage Inspections of buildings designated for funding in the college network were conducted from 2010 to 2012. As part of these inspections, the asset maintenance deficit was identified, and each component was verified and accompanied by a forecast for upgrades. The MEESR does not have information about the condition of college network buildings not designated for funding. Institutions are responsible for following up on the condition of these buildings to ensure quality, safety and sustainability. The MEESR does not have information about the college network equipment inventory. The equipment inventory will be discussed by the MEESR and the institutions to determine whether a request for data collection is appropriate. In the next five years, new inspections of buildings designated for funding will be conducted to update the data. Methodology The condition indicator percentages (ABC / D / E) and average condition indicator are weighted according to the buildings' replacement value.
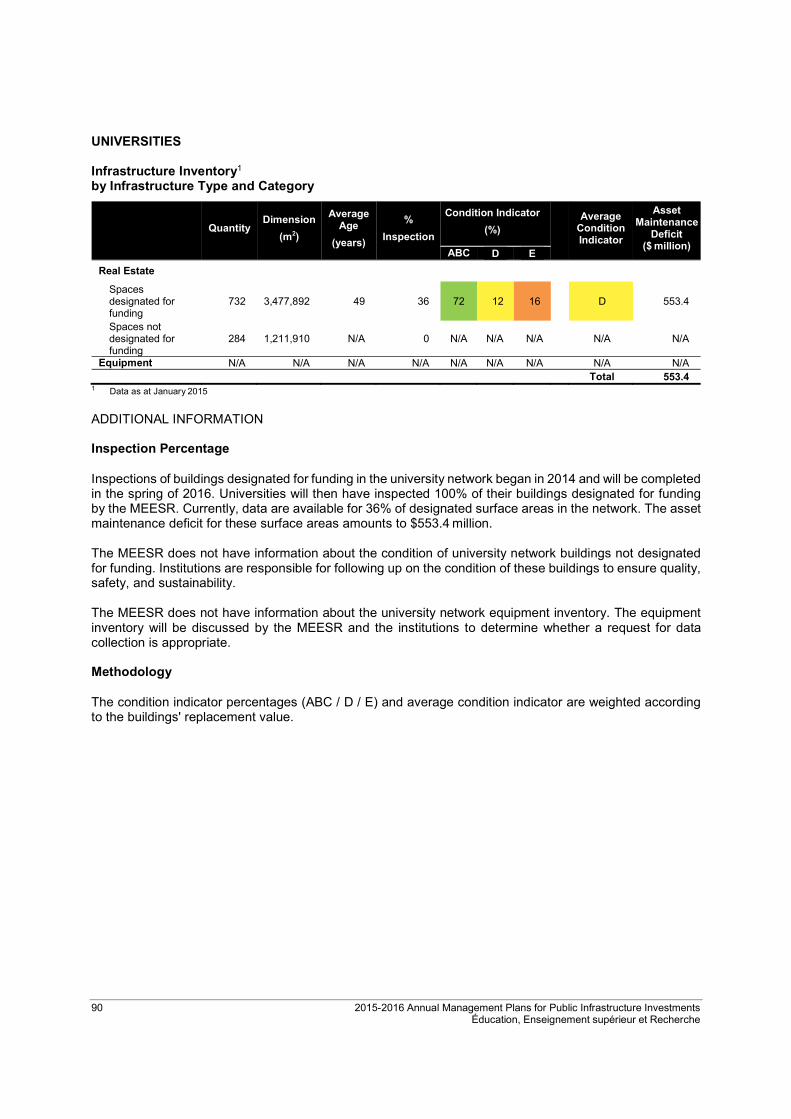
90 2015-2016 Annual Management Plans for Public Infrastructure Investments Éducation, Enseignement supérieur et Recherche
UNIVERSITIES Infrastructure Inventory1
by Infrastructure Type and Category
Quantity Dimension
(m2)
Average Age
(years)
%
Inspection
Condition Indicator
(%)
Average
Condition Indicator
Asset Maintenance
Deficit ($ million)
ABC D E
Real Estate
Spaces designated for funding
732 3,477,892 49 36 72 12 16 D 553.4
Spaces not designated for funding
284 1,211,910 N/A 0 N/A N/A N/A N/A N/A
Equipment N/A N/A N/A N/A N/A N/A N/A N/A N/A Total 553.4
1 Data as at January 2015
ADDITIONAL INFORMATION Inspection Percentage Inspections of buildings designated for funding in the university network began in 2014 and will be completed in the spring of 2016. Universities will then have inspected 100% of their buildings designated for funding by the MEESR. Currently, data are available for 36% of designated surface areas in the network. The asset maintenance deficit for these surface areas amounts to $553.4 million. The MEESR does not have information about the condition of university network buildings not designated for funding. Institutions are responsible for following up on the condition of these buildings to ensure quality, safety, and sustainability. The MEESR does not have information about the university network equipment inventory. The equipment inventory will be discussed by the MEESR and the institutions to determine whether a request for data collection is appropriate. Methodology The condition indicator percentages (ABC / D / E) and average condition indicator are weighted according to the buildings' replacement value.

2015-2016 Annual Management Plans for Public Infrastructure Investments 91 Éducation, Enseignement supérieur et Recherche
APPENDIX 1
COMPOSITION OF GROUPS OF BODIES
School Boards
Linguistic Commission scolaire des Monts-et-Marées Commission scolaire des Phares Commission scolaire du Fleuve-et-des-Lacs Commission scolaire de Kamouraska–Rivière-du-Loup Commission scolaire du Pays-des-Bleuets Commission scolaire du Lac-Saint-Jean Commission scolaire des Rives-du-Saguenay Commission scolaire De La Jonquière Commission scolaire de Charlevoix Commission scolaire de la Capitale Commission scolaire des Découvreurs Commission scolaire des Premières-Seigneuries Commission scolaire de Portneuf Commission scolaire du Chemin-du-Roy Commission scolaire de l’Énergie Commission scolaire des Hauts-Cantons Commission scolaire de la Région-de-Sherbrooke Commission scolaire des Sommets Commission scolaire de la Pointe-de-l'Île Commission scolaire de Montréal Commission scolaire Marguerite-Bourgeoys Commission scolaire des Draveurs Commission scolaire des Portages-de-l’Outaouais Commission scolaire au Cœur-des-Vallées Commission scolaire des Hauts-Bois-de-l'Outaouais Commission scolaire du Lac-Témiscamingue Commission scolaire de Rouyn-Noranda Commission scolaire Harricana Commission scolaire de l’Or-et-des-Bois Commission scolaire du Lac-Abitibi Commission scolaire de l’Estuaire Commission scolaire du Fer Commission scolaire de la Moyenne-Côte-Nord Commission scolaire de la Baie-James Commission scolaire des Îles Commission scolaire des Chic-Chocs Commission scolaire René-Lévesque Commission scolaire de la Côte-du-Sud Commission scolaire des Appalaches Commission scolaire de la Beauce-Etchemin Commission scolaire des Navigateurs Commission scolaire de Laval Commission scolaire des Affluents Commission scolaire des Samares
92 2015-2016 Annual Management Plans for Public Infrastructure Investments Éducation, Enseignement supérieur et Recherche
APPENDIX 1 (cont'd)
Commission scolaire de la Seigneurie-des-Mille-Îles Commission scolaire de la Rivière-du-Nord Commission scolaire des Laurentides Commission scolaire Pierre-Neveu Commission scolaire de Sorel-Tracy Commission scolaire de Saint-Hyacinthe Commission scolaire des Hautes-Rivières Commission scolaire Marie-Victorin Commission scolaire des Patriotes Commission scolaire du Val-des-Cerfs Commission scolaire des Grandes-Seigneuries Commission scolaire de la Vallée-des-Tisserands Commission scolaire des Trois-Lacs Commission scolaire de la Riveraine Commission scolaire des Bois-Francs Commission scolaire des Chênes Commission scolaire Central Québec / Central Québec School Board Commission scolaire Eastern Shores / Eastern Shores School Board Commission scolaire Eastern Townships/ Eastern Townships School Board Commission scolaire Riverside / Riverside School Board Commission scolaire Sir-Wilfrid-Laurier / Sir Wilfrid Laurier School Board Commission scolaire Western Québec / Western Québec School Board Commission scolaire English-Montréal / English Montreal School Board Commission scolaire Lester-B.-Pearson / Lester B. Pearson School Board Commission scolaire New Frontiers / New Frontiers School Board Special Status Commission scolaire du Littoral Commission scolaire Crie / Cree School Board Commission scolaire Kativik / Kativik School Board
2015-2016 Annual Management Plans for Public Infrastructure Investments 93 Éducation, Enseignement supérieur et Recherche
APPENDIX 1 (cont'd)
CEGEPs
Cégep de l’Abitibi-Témiscamingue Cégep d’Ahuntsic Collège d’Alma Cégep André-Laurendeau Cégep de Baie-Comeau Cégep Beauce-Appalaches Cégep de Bois-de-Boulogne Champlain Regional College Cégep de Chicoutimi Collège Dawson / Dawson College Cégep de Drummondville Cégep Édouard Montpetit Cégep de St-Félicien Cégep de Sainte-Foy Cégep François-Xavier Garneau Cégep de la Gaspésie et des Îles Cégep Gérald-Godin Cégep de Granby–Haute-Yamaska Collège Héritage / Heritage College Cégep de St-Hyacinthe Cégep Saint-Jean-sur-Richelieu Cégep de Saint-Jérôme Cégep John Abbott / John Abbott College Cégep de Jonquière Cégep régional de Lanaudière Cégep de La Pocatière Cégep de Saint-Laurent Cégep de Lévis-Lauzon Cégep Limoilou Cégep Lionel Groulx Cégep de Maisonneuve Cégep Marie-Victorin Cégep de Matane Cégep Montmorency Cégep de l’Outaouais Cégep de Rimouski Cégep de Rivière-du-Loup Cégep de Rosemont Cégep de Sept-Îles Collège Shawinigan Cégep de Sherbrooke Cégep de Sorel-Tracy Cégep de Thetford Cégep de Trois-Rivières Cégep de Valleyfield Vanier College Cégep de Victoriaville Cégep du Vieux Montréal
94 2015-2016 Annual Management Plans for Public Infrastructure Investments Éducation, Enseignement supérieur et Recherche
APPENDIX 1 (cont'd)
Universities
École des Hautes Études Commerciales de Montréal École nationale d’administration publique École Polytechnique de Montréal École de technologie supérieure Institut national de la recherche scientifique Télé-université Université Bishop’s / Bishop’s University Université Concordia / Concordia University Université Laval Université de Montréal Université McGill / McGill University Université du Québec (main campus) Université du Québec en Abitibi-Témiscamingue Université du Québec à Chicoutimi Université du Québec à Montréal Université du Québec en Outaouais Université du Québec à Rimouski Université du Québec à Trois-Rivières Université de Sherbrooke
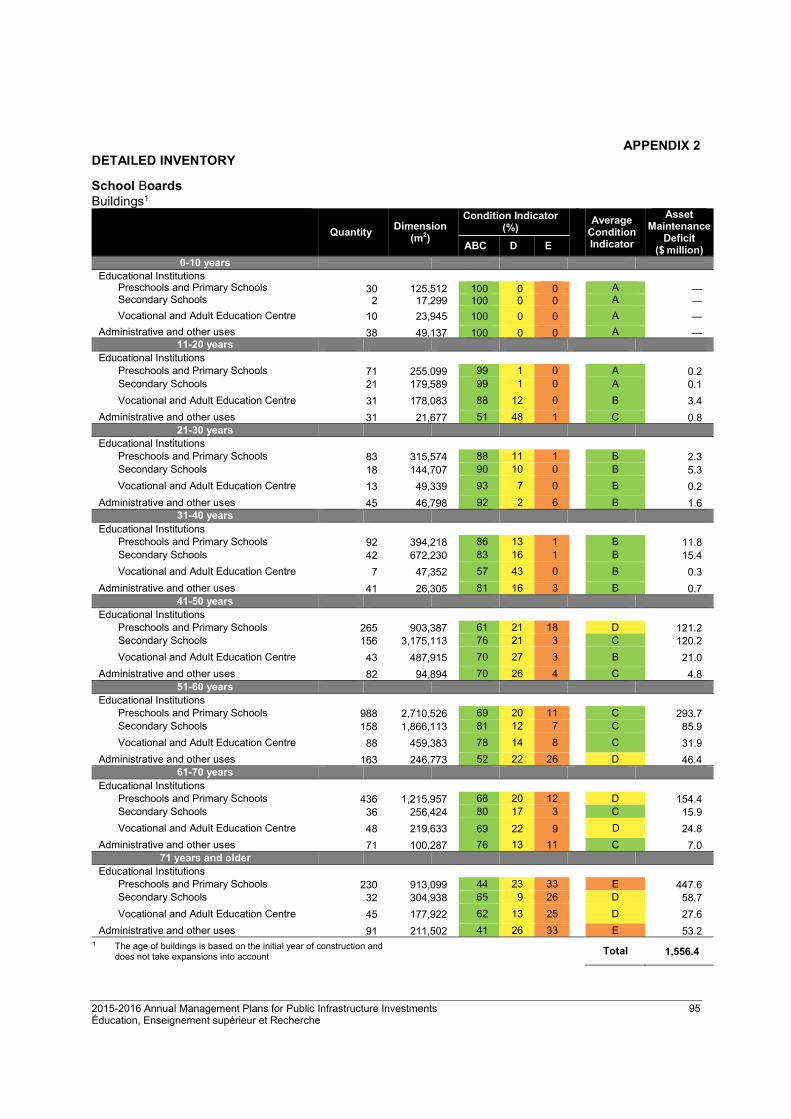
2015-2016 Annual Management Plans for Public Infrastructure Investments 95 Éducation, Enseignement supérieur et Recherche
APPENDIX 2 DETAILED INVENTORY
School Boards Buildings1
Quantity Dimension
(m2)
Condition Indicator (%)
Average
Condition Indicator
Asset Maintenance
Deficit ($ million)ABC D E
0-10 years Educational Institutions
Preschools and Primary Schools 30 125,512 100 0 0 A —Secondary Schools 2 17,299 100 0 0 A —
Vocational and Adult Education Centre 10 23,945 100 0 0 A —
Administrative and other uses 38 49,137 100 0 0 A —11-20 years
Educational Institutions Preschools and Primary Schools 71 255,099 99 1 0 A 0.2Secondary Schools 21 179,589 99 1 0 A 0.1
Vocational and Adult Education Centre 31 178,083 88 12 0 B 3.4
Administrative and other uses 31 21,677 51 48 1 C 0.821-30 years
Educational Institutions Preschools and Primary Schools 83 315,574 88 11 1 B 2.3 Secondary Schools 18 144,707 90 10 0 B 5.3
Vocational and Adult Education Centre 13 49,339 93 7 0 B 0.2
Administrative and other uses 45 46,798 92 2 6 B 1.6 31-40 years
Educational Institutions Preschools and Primary Schools 92 394,218 86 13 1 B 11.8 Secondary Schools 42 672,230 83 16 1 B 15.4
Vocational and Adult Education Centre 7 47,352 57 43 0 B 0.3
Administrative and other uses 41 26,305 81 16 3 B 0.7 41-50 years
Educational Institutions Preschools and Primary Schools 265 903,387 61 21 18 D 121.2Secondary Schools 156 3,175,113 76 21 3 C 120.2
Vocational and Adult Education Centre 43 487,915 70 27 3 B 21.0
Administrative and other uses 82 94,894 70 26 4 C 4.8 51-60 years
Educational Institutions Preschools and Primary Schools 988 2,710,526 69 20 11 C 293.7 Secondary Schools 158 1,866,113 81 12 7 C 85.9
Vocational and Adult Education Centre 88 459,383 78 14 8 C 31.9
Administrative and other uses 163 246,773 52 22 26 D 46.4 61-70 years
Educational Institutions Preschools and Primary Schools 436 1,215,957 68 20 12 D 154.4 Secondary Schools 36 256,424 80 17 3 C 15.9
Vocational and Adult Education Centre 48 219,633 69 22 9 D 24.8
Administrative and other uses 71 100,287 76 13 11 C 7.0 71 years and older
Educational Institutions Preschools and Primary Schools 230 913,099 44 23 33 E 447.6Secondary Schools 32 304,938 65 9 26 D 58.7
Vocational and Adult Education Centre 45 177,922 62 13 25 D 27.6
Administrative and other uses 91 211,502 41 26 33 E 53.21 The age of buildings is based on the initial year of construction and
does not take expansions into account
Total 1,556.4
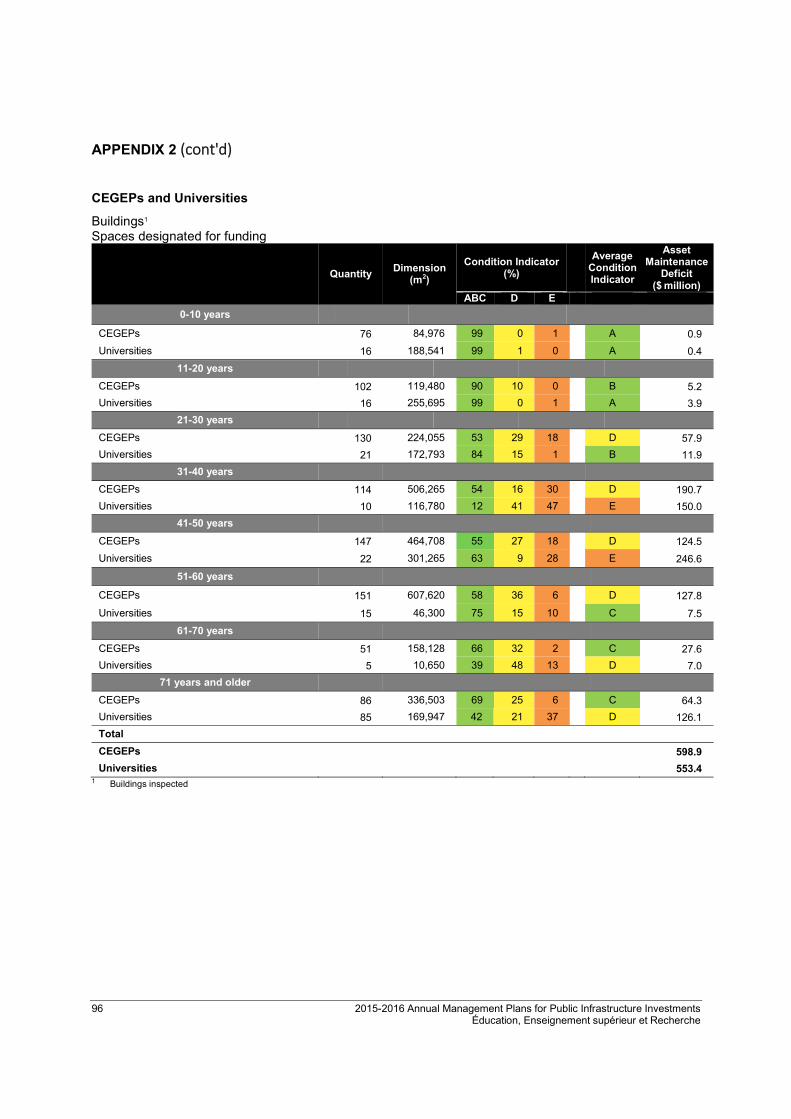
96 2015-2016 Annual Management Plans for Public Infrastructure Investments Éducation, Enseignement supérieur et Recherche
APPENDIX 2 (cont'd)
CEGEPs and Universities
Buildings1
Spaces designated for funding
Quantity Dimension
(m2)
Condition Indicator (%)
Average
Condition Indicator
Asset Maintenance
Deficit ($ million)
ABC D E
0-10 years
CEGEPs 76 84,976 99 0 1 A 0.9
Universities 16 188,541 99 1 0 A 0.4
11-20 years
CEGEPs 102 119,480 90 10 0 B 5.2
Universities 16 255,695 99 0 1 A 3.9
21-30 years
CEGEPs 130 224,055 53 29 18 D 57.9
Universities 21 172,793 84 15 1 B 11.9
31-40 years
CEGEPs 114 506,265 54 16 30 D 190.7
Universities 10 116,780 12 41 47 E 150.0
41-50 years
CEGEPs 147 464,708 55 27 18 D 124.5
Universities 22 301,265 63 9 28 E 246.6
51-60 years
CEGEPs 151 607,620 58 36 6 D 127.8
Universities 15 46,300 75 15 10 C 7.5
61-70 years
CEGEPs 51 158,128 66 32 2 C 27.6
Universities 5 10,650 39 48 13 D 7.0
71 years and older
CEGEPs 86 336,503 69 25 6 C 64.3
Universities 85 169,947 42 21 37 D 126.1
Total
CEGEPs 598.9
Universities 553.4 1 Buildings inspected
2015-2016 Annual Management Plans for Public Infrastructure Investments 97
SANTÉ ET SERVICES SOCIAUX
INFRASTRUCTURE MANAGEMENT MINISTÈRE DE LA SANTÉ ET DES SERVICES SOCIAUX VISION The Ministère de la Santé et des Services sociaux (MSSS) aims to provide an integrated, efficient health and social services network within proximity of people and their living environments. ORIENTATIONS AND OBJECTIVES In order to carry out its mission, which is to “maintain, improve and restore the health and well-being of Quebecers by providing access to a set of integrated and high-quality health and social services, thereby contributing to the social and economic development of Québec”, the MSSS has adopted the following orientations and objectives with regard to the infrastructure under its responsibility: Orientations
• Ensure sound management of the health and social services network (RSSS) infrastructure;
• Make new investments in infrastructure oriented towards priority needs;
• Ensure the safety of persons and property, address building deterioration and ensure their conservation. Objectives
• Keep a reliable and updated inventory of RSSS infrastructure;
• Ensure an adequate level of annual investment to maintain RSSS infrastructure;
• Monitor the physical condition of RSSS infrastructure;
• Promote good infrastructure management practices in RSSS institutions;
• Establish fair and objective prioritization criteria to support investment choices;
• Support RSSS institutions in their project planning process, including developing departmental manuals and directives;
• Optimize procurement and resource use practices.
RESPONSIBILITIES
The MSSS determines all health and social services priorities, objectives and guidelines and oversees their implementation. The MSSS evaluates and allocates the funds required for asset maintenance, elimination of the asset maintenance deficit, and the addition, improvement and replacement of RSSS infrastructure. In this regard, the MSSS ensures that the amounts allocated to the RSSS are used for their intended purposes.
98 2015-2016 Annual Management Plans for Public Infrastructure Investments Santé et Services sociaux
HEALTH AND SOCIAL SERVICES NETWORK RESPONSIBILITIES In accordance with the guidelines set by the MSSS, the agencies and institutions of the RSSS manage the infrastructure they own as well as those owned by the Société québécoise des infrastructures but whose asset maintenance is their responsibility. The agencies and institutions will determine, prioritize, plan and carry out work previously authorized by the agencies or the MSSS. DESCRIPTION OF THE PORTFOLIO OF INFRASTRUCTURES Real estate inventory The health and social services network’s real estate inventory consists of 2,613 buildings whose total surface area is 8.9 million square metres. The inventory is divided into six major building categories, namely:
• Hospital centres, including short-term care centres, health centres and psychiatric centres;
• Residential and long-term care centres (CHSLD);
• Rehabilitation centres;
• Youth centres;
• Local community service centres (CLSC);
• Other buildings include staff and doctors’ quarters, surplus property, administrative spaces, warehouses and laundries.
Medical equipment inventory Medical equipment primarily consists of 11,300 devices or units designed to provide care and services in different specialties.
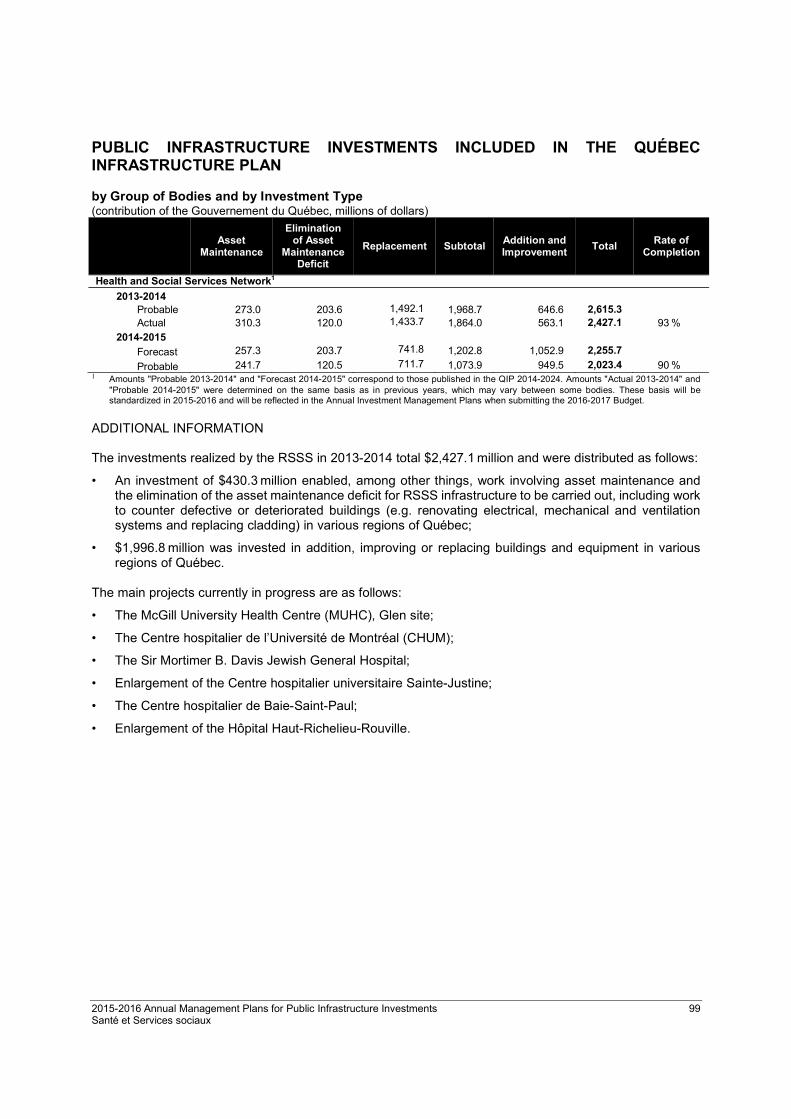
2015-2016 Annual Management Plans for Public Infrastructure Investments 99 Santé et Services sociaux
PUBLIC INFRASTRUCTURE INVESTMENTS INCLUDED IN THE QUÉBEC INFRASTRUCTURE PLAN by Group of Bodies and by Investment Type (contribution of the Gouvernement du Québec, millions of dollars)
Asset Maintenance
Elimination of Asset
Maintenance Deficit
Replacement Subtotal Addition and Improvement
Total Rate of
Completion
Health and Social Services Network1
2013-2014
Probable 273.0 203.6 1,492.1 1,968.7 646.6 2,615.3 Actual 310.3 120.0 1,433.7 1,864.0 563.1 2,427.1 93 %
2014-2015
Forecast 257.3 203.7 741.8 1,202.8 1,052.9 2,255.7
Probable 241.7 120.5 711.7 1,073.9 949.5 2,023.4 90 % 1 Amounts "Probable 2013-2014" and "Forecast 2014-2015" correspond to those published in the QIP 2014-2024. Amounts "Actual 2013-2014" and
"Probable 2014-2015" were determined on the same basis as in previous years, which may vary between some bodies. These basis will be standardized in 2015-2016 and will be reflected in the Annual Investment Management Plans when submitting the 2016-2017 Budget.
ADDITIONAL INFORMATION The investments realized by the RSSS in 2013-2014 total $2,427.1 million and were distributed as follows:
• An investment of $430.3 million enabled, among other things, work involving asset maintenance and the elimination of the asset maintenance deficit for RSSS infrastructure to be carried out, including work to counter defective or deteriorated buildings (e.g. renovating electrical, mechanical and ventilation systems and replacing cladding) in various regions of Québec;
• $1,996.8 million was invested in addition, improving or replacing buildings and equipment in various regions of Québec.
The main projects currently in progress are as follows:
• The McGill University Health Centre (MUHC), Glen site;
• The Centre hospitalier de l’Université de Montréal (CHUM);
• The Sir Mortimer B. Davis Jewish General Hospital;
• Enlargement of the Centre hospitalier universitaire Sainte-Justine;
• The Centre hospitalier de Baie-Saint-Paul;
• Enlargement of the Hôpital Haut-Richelieu-Rouville.
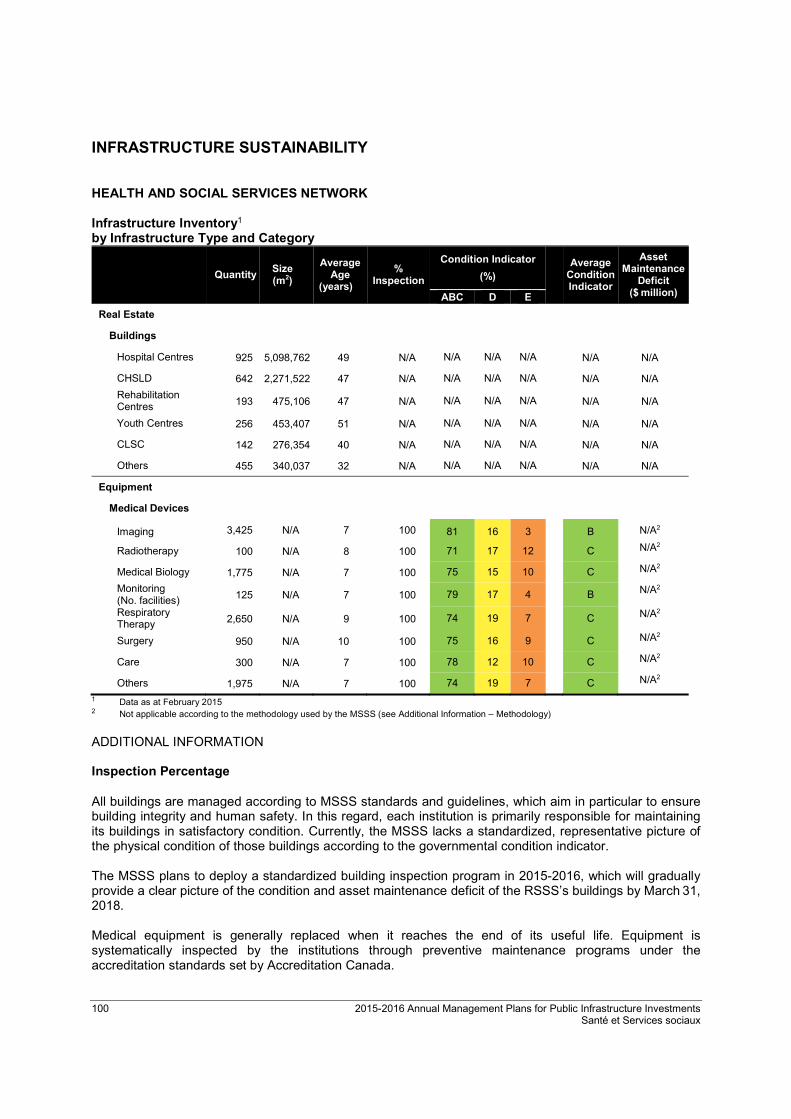
100 2015-2016 Annual Management Plans for Public Infrastructure Investments Santé et Services sociaux
INFRASTRUCTURE SUSTAINABILITY HEALTH AND SOCIAL SERVICES NETWORK Infrastructure Inventory1
by Infrastructure Type and Category
Quantity Size (m2)
Average Age
(years)
% Inspection
Condition Indicator
(%)
Average Condition Indicator
Asset Maintenance
Deficit ($ million) ABC D E
Real Estate
Buildings
Hospital Centres 925 5,098,762 49 N/A N/A N/A N/A N/A N/A
CHSLD 642 2,271,522 47 N/A N/A N/A N/A N/A N/A
Rehabilitation Centres 193 475,106 47 N/A N/A N/A N/A N/A N/A
Youth Centres 256 453,407 51 N/A N/A N/A N/A N/A N/A
CLSC 142 276,354 40 N/A N/A N/A N/A N/A N/A
Others 455 340,037 32 N/A N/A N/A N/A N/A N/A
Equipment
Medical Devices
Imaging 3,425 N/A 7 100 81 16 3 B N/A2
Radiotherapy 100 N/A 8 100 71 17 12 C N/A2
Medical Biology 1,775 N/A 7 100 75 15 10 C N/A2
Monitoring (No. facilities) 125 N/A 7 100 79 17 4 B N/A2
Respiratory Therapy 2,650 N/A 9 100 74 19 7 C N/A2
Surgery 950 N/A 10 100 75 16 9 C N/A2
Care 300 N/A 7 100 78 12 10 C N/A2
Others 1,975 N/A 7 100 74 19 7 C N/A2
1 Data as at February 2015 2 Not applicable according to the methodology used by the MSSS (see Additional Information – Methodology) ADDITIONAL INFORMATION Inspection Percentage All buildings are managed according to MSSS standards and guidelines, which aim in particular to ensure building integrity and human safety. In this regard, each institution is primarily responsible for maintaining its buildings in satisfactory condition. Currently, the MSSS lacks a standardized, representative picture of the physical condition of those buildings according to the governmental condition indicator. The MSSS plans to deploy a standardized building inspection program in 2015-2016, which will gradually provide a clear picture of the condition and asset maintenance deficit of the RSSS’s buildings by March 31, 2018. Medical equipment is generally replaced when it reaches the end of its useful life. Equipment is systematically inspected by the institutions through preventive maintenance programs under the accreditation standards set by Accreditation Canada.
2015-2016 Annual Management Plans for Public Infrastructure Investments 101 Santé et Services sociaux
Methodology Regarding medical devices, the condition of each device represents its actual age compared to its useful life. As a result, devices will not be subject to specific inspections to determine their asset maintenance deficit. The condition indicator percentages (ABC / D / E) and average condition indicator are weighted according to each unit’s replacement value.

102 2015-2016 Annual Management Plans for Public Infrastructure Investments Santé et Services sociaux
APPENDIX 1 COMPOSITION OF GROUP OF BODIES Health and Social Services Network Agencies and other Regional Authorities Agence de la santé et des services sociaux de Chaudière-Appalaches Agence de la santé et des services sociaux de l’Abitibi-Témiscamingue Agence de la santé et des services sociaux de l’Estrie Agence de la santé et des services sociaux de l’Outaouais Agence de la santé et des services sociaux de la Capitale-Nationale Agence de la santé et des services sociaux de la Côte-Nord Agence de la santé et des services sociaux de la Gaspésie–Îles-de-la-Madeleine Agence de la santé et des services sociaux de la Mauricie et du Centre-du-Québec Agence de la santé et des services sociaux de la Montérégie Agence de la santé et des services sociaux de Lanaudière Agence de la santé et des services sociaux de Laval Agence de la santé et des services sociaux de Montréal Agence de la santé et des services sociaux des Laurentides Agence de la santé et des services sociaux du Bas-Saint-Laurent Agence de la santé et des services sociaux du Saguenay–Lac-Saint-Jean Nunavik Regional Board of Health and Social Services Public Institutions Centre de protection et de réadaptation de la Côte-Nord Constance Lethbridge Rehabilitation Centre West Montreal Readaptation Centre Centre de réadaptation de la Gaspésie (Le) Centre de réadaptation en déficience intellectuelle de Québec Centre de réadaptation en déficience intellectuelle et en troubles envahissants du développement de Chaudière-Appalaches Centre de réadaptation en déficience intellectuelle et en troubles envahissants du développement de l’Estrie Centre de réadaptation en déficience intellectuelle et en troubles envahissants du développement de la Mauricie et du Centre-du-Québec–Institut universitaire Centre de réadaptation en déficience intellectuelle et en troubles envahissants du développement de la Montérégie-Est Centre de réadaptation en déficience intellectuelle et en troubles envahissants du développement de Laval Centre de réadaptation en déficience intellectuelle et en troubles envahissants du développement de Montréal Centre de réadaptation en déficience intellectuelle et en troubles envahissants du développement du Bas-Saint-Laurent Centre de réadaptation en déficience intellectuelle et en troubles envahissants du développement du Saguenay–Lac-Saint-Jean

2015-2016 Annual Management Plans for Public Infrastructure Investments 103 Santé et Services sociaux
APPENDIX 1 (cont’d.) Health and Social Services Network Public Institutions Centre de réadaptation en déficience physique Chaudière-Appalaches Centre de réadaptation en déficience physique Le Bouclier Centre de réadaptation en dépendance de Chaudière-Appalaches Centre de réadaptation en dépendance de l’Estrie Centre de réadaptation en dépendance de l’Outaouais Centre de réadaptation en dépendance de Montréal Centre de réadaptation en dépendance de Québec Centre de réadaptation en dépendance des Laurentides Centre de réadaptation en dépendance Domrémy de la Mauricie-Centre-du-Québec Centre de réadaptation en dépendance Le Virage Centre de réadaptation Estrie inc. Centre de réadaptation Foster Centre de réadaptation Interval Centre de réadaptation La Maison Centre de réadaptation La Myriade Centre de santé et de services sociaux Alphonse-Desjardins Centre de santé et de services sociaux Cavendish Centre de santé et de services sociaux Champlain–Charles-Le Moyne Centre de santé et de services sociaux Cléophas-Claveau Centre de santé et de services sociaux d’Ahuntsic et Montréal-Nord Centre de santé et de services sociaux d’Antoine-Labelle Centre de santé et de services sociaux d’Argenteuil Centre de santé et de services sociaux d’Arthabaska-et-de-l’Érable Centre de santé et de services sociaux de Beauce Centre de santé et de services sociaux de Bécancour–Nicolet-Yamaska Centre de santé et de services sociaux de Bordeaux-Cartierville-Saint-Laurent Centre de santé et de services sociaux de Charlevoix Centre de santé et de services sociaux de Chicoutimi Centre de santé et de services sociaux de Dorval-Lachine-Lasalle Centre de santé et de services sociaux de Gatineau Centre de santé et de services sociaux de Jonquière Centre de santé et de services sociaux de Kamouraska Centre de santé et de services sociaux de l’Énergie Centre de santé et de services sociaux de l’Hématite Centre de santé et de services sociaux de l’Ouest-de-l’Île Centre de santé et de services sociaux de la Baie-des-Chaleurs Centre de santé et de services sociaux de la Basse-Côte-Nord Centre de santé et de services sociaux de la Côte-de-Gaspé Centre de santé et de services sociaux de la Haute-Côte-Nord–Manicouagan Centre de santé et de services sociaux de la Haute-Gaspésie Centre de santé et de services sociaux de la Haute-Yamaska Centre de santé et de services sociaux de la Matapédia Centre de santé et de services sociaux de la Minganie Centre de santé et de services sociaux de la Mitis Centre de santé et de services sociaux de la Montagne Centre de santé et de services sociaux de la MRC-de-Coaticook Centre de santé et de services sociaux de la Pointe-de-l’Île

104 2015-2016 Annual Management Plans for Public Infrastructure Investments Santé et Services sociaux
APPENDIX 1 (cont’d.) Health and Social Services Network Public Institutions Centre de santé et de services sociaux de la région de Thetford Centre de santé et de services sociaux de la Vallée-de-l’Or Centre de santé et de services sociaux de la Vallée-de-la-Batiscan Centre de santé et de services sociaux de la Vallée-de-la-Gatineau Centre de santé et de services sociaux de la Vieille-Capitale Centre de santé et de services sociaux de Lac-Saint-Jean-Est Centre de santé et de services sociaux de Laval Centre de santé et de services sociaux de Maskinongé Centre de santé et de services sociaux de Matane Centre de santé et de services sociaux de Memphrémagog Centre de santé et de services sociaux de Montmagny-L’Islet Centre de santé et de services sociaux de Papineau Centre de santé et de services sociaux de Port-Cartier Centre de santé et de services sociaux de Portneuf Centre de santé et de services sociaux de Québec-Nord Centre de santé et de services sociaux de Rimouski-Neigette Centre de santé et de services sociaux de Rivière-du-Loup Centre de santé et de services sociaux de Rouyn-Noranda Centre de santé et de services sociaux de Saint-Jérôme Centre de santé et de services sociaux de Saint-Léonard et Saint-Michel Centre de santé et de services sociaux de Sept-Îles Centre de santé et de services sociaux de Témiscouata Centre de santé et de services sociaux de Thérèse-De Blainville Centre de santé et de services sociaux de Trois-Rivières Centre de santé et de services sociaux de Vaudreuil-Soulanges Centre de santé et de services sociaux des Aurores-Boréales Centre de santé et de services sociaux des Basques Centre de santé et de services sociaux des Collines Centre de santé et de services sociaux des Etchemins Centre de santé et de services sociaux des ÎIes Centre de santé et de services sociaux des Pays-d’en-Haut Centre de santé et de services sociaux des Sommets Centre de santé et de services sociaux des Sources Centre de santé et de services sociaux Domaine-du-Roy Centre de santé et de services sociaux Drummond Centre de santé et de services sociaux du Cœur-de-l’Île Centre de santé et de services sociaux du Granit Centre de santé et de services sociaux du Haut-Saint-François Centre de santé et de services sociaux du Haut-Saint-Laurent Centre de santé et de services sociaux du Haut-Saint-Maurice Centre de santé et de services sociaux du Lac-des-Deux-Montagnes Centre de santé et de services sociaux du Nord de Lanaudière Centre de santé et de services sociaux du Pontiac Centre de santé et de services sociaux du Rocher-Percé Centre de santé et de services sociaux du Sud de Lanaudière Centre de santé et de services sociaux du Sud-Ouest–Verdun Centre de santé et de services sociaux du Suroît
2015-2016 Annual Management Plans for Public Infrastructure Investments 105 Santé et Services sociaux
APPENDIX 1 (cont’d.) Health and Social Services Network Public Institutions Centre de santé et de services sociaux du Témiscamingue Centre de santé et de services sociaux du Val-Saint-François Centre de santé et de services sociaux Haut-Richelieu-Rouville Centre de santé et de services sociaux–Institut universitaire de gériatrie de Sherbrooke Centre de santé et de services sociaux Jardins-Roussillon Centre de santé et de services sociaux Jeanne-Mance Centre de santé et de services sociaux La Pommeraie Centre de santé et de services sociaux Les Eskers de l’Abitibi Centre de santé et de services sociaux Lucille-Teasdale Centre de santé et de services sociaux Maria-Chapdelaine Centre de santé et de services sociaux Pierre-Boucher Centre de santé et de services sociaux Pierre-De Saurel Centre de santé et de services sociaux Richelieu-Yamaska Inuulitsivik Health Centre Ungava Tulattavik Health Centre Grace Dart Extended Care Centre Centre du Florès Centre hospitalier de l’Université de Montréal (CHUM) St. Mary’s Hospital Centre Centre hospitalier universitaire de Sherbrooke Centre hospitalier universitaire Sainte-Justine Centre jeunesse Chaudière-Appalaches Centre jeunesse de l’Abitibi-Témiscamingue (CJAT) Centre jeunesse de l’Estrie Centre jeunesse de la Mauricie et du Centre-du-Québec (Le) Centre jeunesse de la Montérégie Centre jeunesse de Laval Centre jeunesse de Montréal (Le) Centre jeunesse de Québec Centre jeunesse des Laurentides Centre jeunesse du Bas-Saint-Laurent Centre jeunesse du Saguenay–Lac-Saint-Jean (Le) Centre jeunesse Gaspésie–Les Îles Miriam Home and Services Centre montérégien de réadaptation Centre Normand Centre régional de réadaptation La Ressourse Centre régional de santé et de services sociaux de la Baie-James McGill University Health Centre Batshaw Youth and Family Centres Centres jeunesse de Lanaudière (Les) Centres jeunesse de l’Outaouais (Les) Jewish Eldercare Centre CHU de Québec Clair Foyer inc. Naskapi CLSC Cree Board of Health and Social Services of James Bay

106 2015-2016 Annual Management Plans for Public Infrastructure Investments Santé et Services sociaux
APPENDIX 1 (cont’d.) Health and Social Services Network Public Institutions Corporation du Centre de réadaptation Lucie-Bruneau (La) Corporation du Centre hospitalier gériatrique Maimonides (La) Montreal Chinese Hospital (1963) Hôpital du Sacré-Cœur de Montréal Sir Mortimer B. Davis Jewish General Hospital Jeffery Hale Hospital - Saint Brigid’s Home Jewish Rehabilitation Hospital Hôpital Maisonneuve-Rosemont Mount Sinai Hospital Hôpital Rivière-des-Prairies Hôpital Santa Cabrini Canadian-Polish Welfare Institute Montreal Heart Institute Institut de réadaptation en déficience physique de Québec Institut de réadaptation Gingras-Lindsay-de-Montréal Institut Nazareth et Louis-Braille Institut Philippe-Pinel de Montréal Institut Raymond-Dewar Institut universitaire de cardiologie et de pneumologie de Québec Institut universitaire de gériatrie de Montréal Institut universitaire en santé mentale de Montréal Institut universitaire en santé mentale de Québec Douglas Mental Health University Institute La Résidence de Lachute Pavillon du Parc Services de réadaptation du Sud-Ouest et du Renfort (Les)
2015-2016 Annual Management Plans for Public Infrastructure Investments 107
TOURISME
INFRASTRUCTURE MANAGEMENT RÉGIE DES INSTALLATIONS OLYMPIQUES VISION The vision of the Régie des installations olympiques (RIO), as approved by the Board of Directors in 2012, consists of “making the Olympic Park a world reference in terms of modern urban park, a unique crossroads where creation, discovery, entertainment and physical activity are united, in particular for the 40th anniversary of the Olympic Games in 2016 and the 375th anniversary of the founding of the city of Montréal in 2017." ORIENTATIONS AND OBJECTIVES In order to carry out its mission, which is to cultivate the full potential of the Olympic Park and to complement its partners and the surrounding community and by ensuring the protection and development of its unique architectural heritage, the RIO has adopted the following orientation and objectives with regard to the infrastructure under its responsibility: Orientation
• Protect and showcase the architectural, technical and historical heritage of the Olympic Park. Objectives
• Improve health and safety conditions on the Olympic Park site;
• Optimize operation of the various facilities;
• Maintain and improve the ability to use the facilities. RESPONSIBILITIES The RIO, which is under the legal responsibility of the Minister of Tourism, is responsible for managing its infrastructure and planning any actions that need to be taken. DESCRIPTION OF THE PORTFOLIO OF INFRASTRUCTURES The RIO is composed of various infrastructures and systems that are unique. They consist of four groups: the Olympic Stadium and adjoining buildings (Tower, Sports Centre, thermal power plant), the roof, the underground parking areas as well as the Esplanade and all outdoor spaces surrounding the Olympic Stadium.
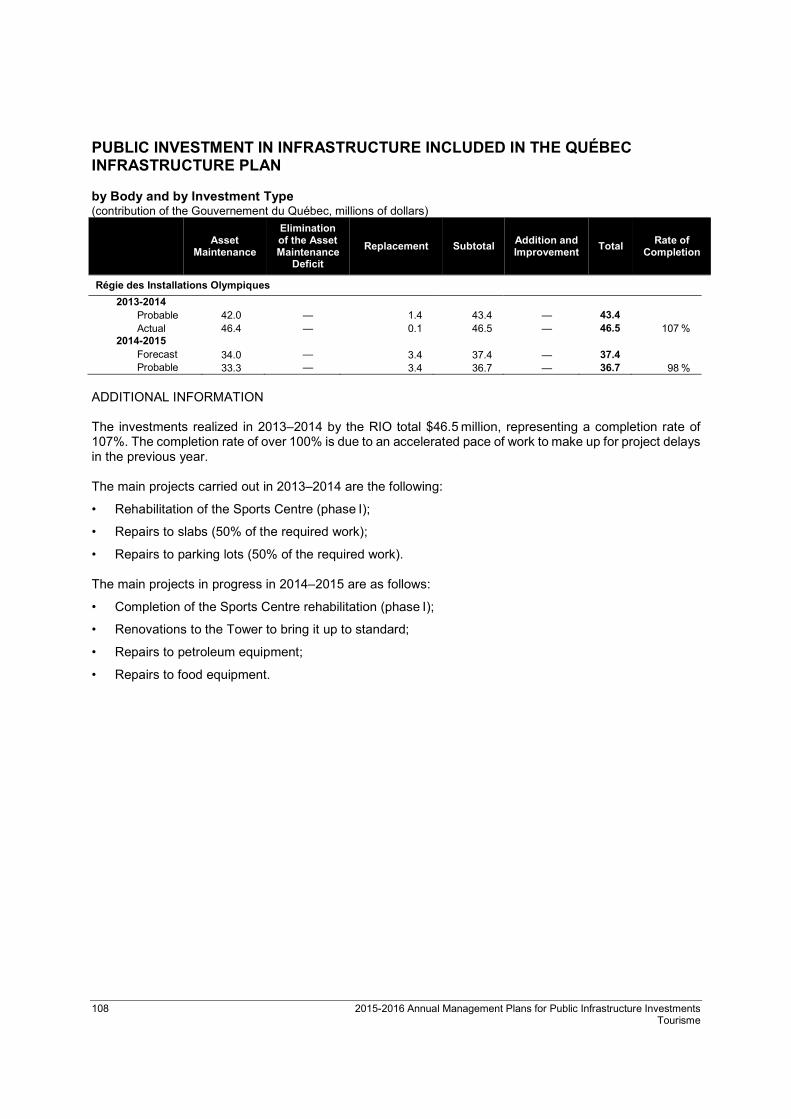
108 2015-2016 Annual Management Plans for Public Infrastructure Investments Tourisme
PUBLIC INVESTMENT IN INFRASTRUCTURE INCLUDED IN THE QUÉBEC INFRASTRUCTURE PLAN by Body and by Investment Type (contribution of the Gouvernement du Québec, millions of dollars)
Asset
Maintenance
Elimination of the Asset Maintenance
Deficit
Replacement Subtotal Addition and Improvement
Total Rate of
Completion
Régie des Installations Olympiques
2013-2014 Probable 42.0 — 1.4 43.4 — 43.4 Actual 46.4 — 0.1 46.5 — 46.5 107 %
2014-2015 Forecast 34.0 — 3.4 37.4 — 37.4 Probable 33.3 — 3.4 36.7 — 36.7 98 %
ADDITIONAL INFORMATION The investments realized in 2013–2014 by the RIO total $46.5 million, representing a completion rate of 107%. The completion rate of over 100% is due to an accelerated pace of work to make up for project delays in the previous year.
The main projects carried out in 2013–2014 are the following:
• Rehabilitation of the Sports Centre (phase I);
• Repairs to slabs (50% of the required work);
• Repairs to parking lots (50% of the required work). The main projects in progress in 2014–2015 are as follows:
• Completion of the Sports Centre rehabilitation (phase I);
• Renovations to the Tower to bring it up to standard;
• Repairs to petroleum equipment;
• Repairs to food equipment.
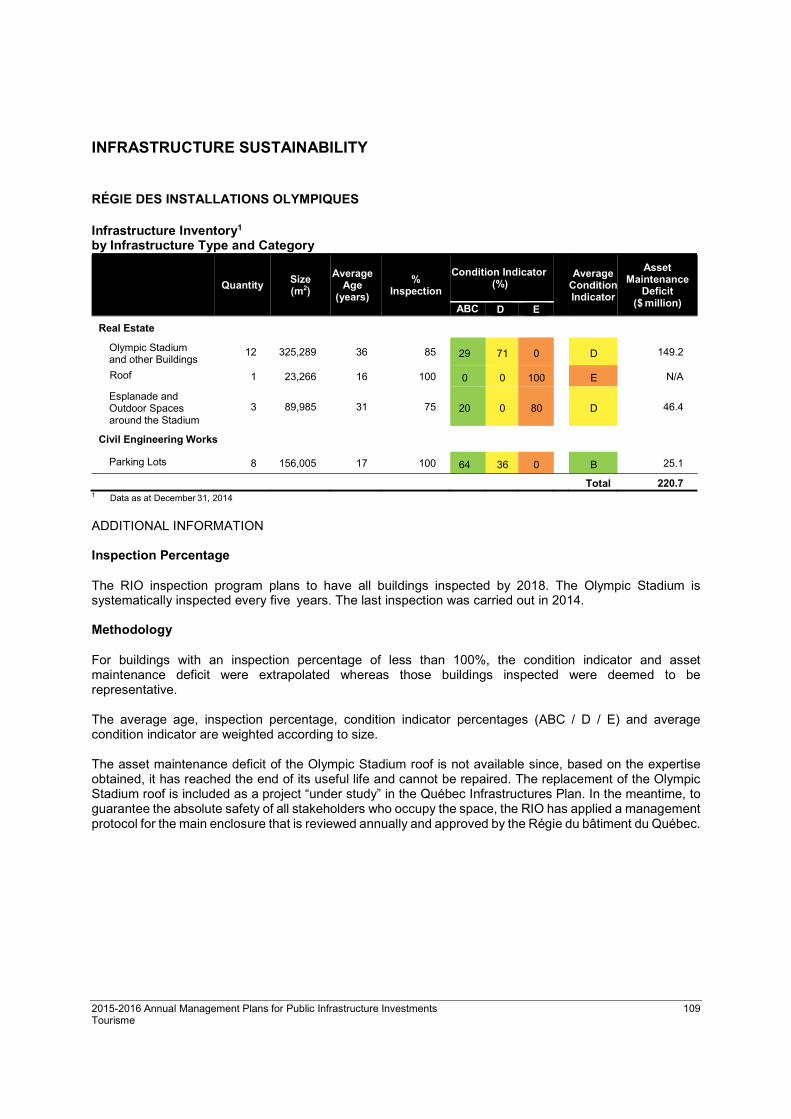
2015-2016 Annual Management Plans for Public Infrastructure Investments 109 Tourisme
INFRASTRUCTURE SUSTAINABILITY RÉGIE DES INSTALLATIONS OLYMPIQUES Infrastructure Inventory1
by Infrastructure Type and Category
Quantity Size (m2)
Average Age
(years)
% Inspection
Condition Indicator (%)
Average
Condition Indicator
Asset Maintenance
Deficit ($ million) ABC D E
Real Estate
Olympic Stadium and other Buildings
12 325,289 36 85 29 71 0
D 149.2
Roof 1 23,266 16 100 0 0 100 E N/A
Esplanade and Outdoor Spaces around the Stadium
3 89,985 31 75 20 0 80
D 46.4
Civil Engineering Works
Parking Lots 8 156,005 17 100 64 36 0 B 25.1
Total 220.7 1 Data as at December 31, 2014 ADDITIONAL INFORMATION Inspection Percentage The RIO inspection program plans to have all buildings inspected by 2018. The Olympic Stadium is systematically inspected every five years. The last inspection was carried out in 2014. Methodology For buildings with an inspection percentage of less than 100%, the condition indicator and asset maintenance deficit were extrapolated whereas those buildings inspected were deemed to be representative. The average age, inspection percentage, condition indicator percentages (ABC / D / E) and average condition indicator are weighted according to size. The asset maintenance deficit of the Olympic Stadium roof is not available since, based on the expertise obtained, it has reached the end of its useful life and cannot be repaired. The replacement of the Olympic Stadium roof is included as a project “under study” in the Québec Infrastructures Plan. In the meantime, to guarantee the absolute safety of all stakeholders who occupy the space, the RIO has applied a management protocol for the main enclosure that is reviewed annually and approved by the Régie du bâtiment du Québec.
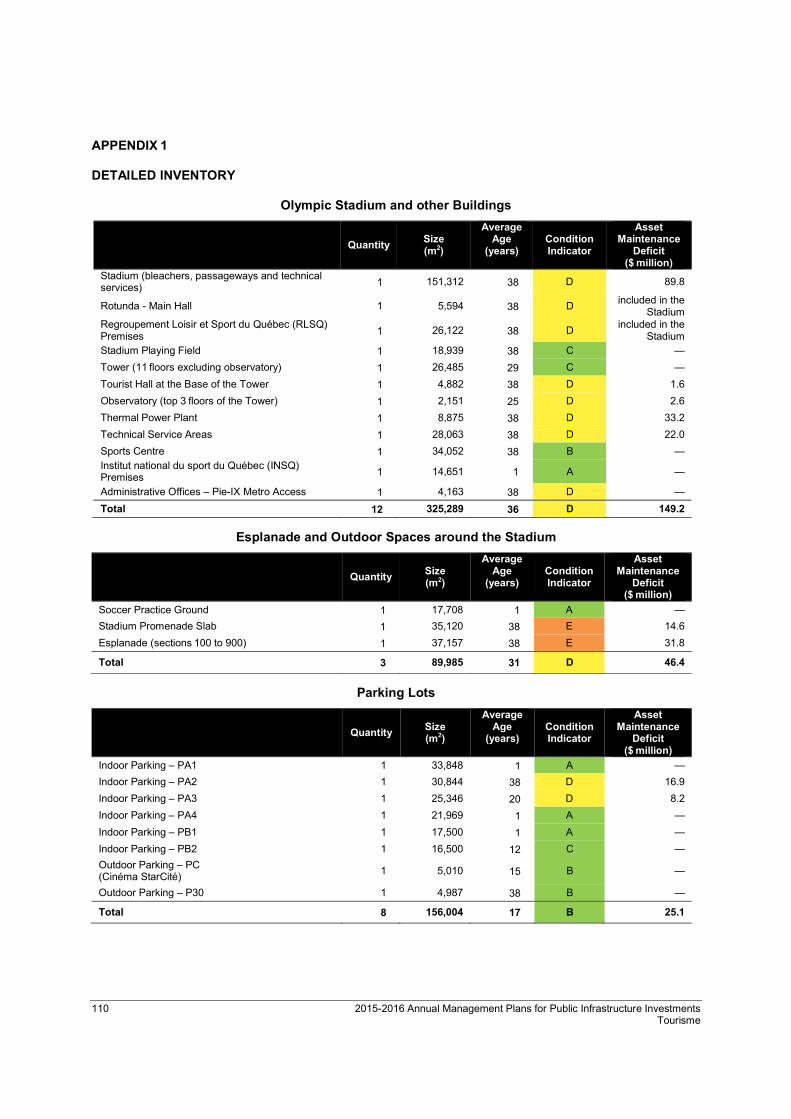
110 2015-2016 Annual Management Plans for Public Infrastructure Investments Tourisme
APPENDIX 1 DETAILED INVENTORY
Olympic Stadium and other Buildings
Quantity Size (m2)
Average Age
(years) Condition Indicator
Asset Maintenance
Deficit ($ million)
Stadium (bleachers, passageways and technical services) 1 151,312 38 D 89.8
Rotunda - Main Hall 1 5,594 38 D included in the
Stadium Regroupement Loisir et Sport du Québec (RLSQ) Premises 1 26,122 38 D
included in the Stadium
Stadium Playing Field 1 18,939 38 C —
Tower (11 floors excluding observatory) 1 26,485 29 C —
Tourist Hall at the Base of the Tower 1 4,882 38 D 1.6
Observatory (top 3 floors of the Tower) 1 2,151 25 D 2.6
Thermal Power Plant 1 8,875 38 D 33.2
Technical Service Areas 1 28,063 38 D 22.0
Sports Centre 1 34,052 38 B — Institut national du sport du Québec (INSQ) Premises 1 14,651 1 A —
Administrative Offices – Pie-IX Metro Access 1 4,163 38 D —
Total 12 325,289 36 D 149.2
Esplanade and Outdoor Spaces around the Stadium
Quantity Size (m2)
Average Age
(years) Condition Indicator
Asset Maintenance
Deficit ($ million)
Soccer Practice Ground 1 17,708 1 A —
Stadium Promenade Slab 1 35,120 38 E 14.6
Esplanade (sections 100 to 900) 1 37,157 38 E 31.8
Total 3 89,985 31 D 46.4
Parking Lots
Quantity Size (m2)
Average Age
(years) Condition Indicator
Asset Maintenance
Deficit ($ million)
Indoor Parking – PA1 1 33,848 1 A —
Indoor Parking – PA2 1 30,844 38 D 16.9
Indoor Parking – PA3 1 25,346 20 D 8.2
Indoor Parking – PA4 1 21,969 1 A —
Indoor Parking – PB1 1 17,500 1 A —
Indoor Parking – PB2 1 16,500 12 C —
Outdoor Parking – PC (Cinéma StarCité)
1 5,010 15 B —
Outdoor Parking – P30 1 4,987 38 B —
Total 8 156,004 17 B 25.1
2015-2016 Annual Management Plans for Public Infrastructure Investments 111
TRANSPORTS
INFRASTRUCTURE MANAGEMENT MINISTÈRE DES TRANSPORTS VISION The Ministère des Transports (MTQ) is a leader in the organization of transportation systems in Québec, committed to offering efficient and accessible transportation systems to people and businesses alike. The MTQ is also committed to competent, rigorous, innovative and transparent management of the infrastructure under its direct responsibility. Among other things, the MTQ is responsible for managing the highway system, essential for trade and for linking Québec's regions. ORIENTATIONS AND OBJECTIVES The MTQ's mission is to ensure the mobility of people and goods throughout Québec using safe, efficient transportation systems that contribute to the development of Québec. A key area of focus is maintenance of the road infrastructure (specifically, roads and structures), to which a very large part of its budget is allocated. In keeping with this mission, major projects to maintain, replace and build new infrastructure due to their condition but also to meet changing demand and to support Québec's economic development are planned in accordance with the following orientation and objectives, contained in the MTQ's 2013-2015 Strategic Plan : Orientation
• Support efficient, diversified and integrated transportation systems. Objectives
• Maintain and restore the conditions of road infrastructure;
• Support efficient intermodal transportation of goods;
• Contribute to regional accessibility and vitality. RESPONSIBILITIES The Minister of Transport is responsible for carrying out all construction, repair and maintenance work required for the infrastructure under his purview. Property acquisitions and disposals also fall under the statutes and regulations defining the Department's responsibilities. In addition, the Minister of Transport is legally responsible for two bodies contemplated by this Annual Management Plan for Public Infrastructure Investments, namely the Agence métropolitaine de transport and the Société des traversiers du Québec. The Act respecting the Ministère des Transports and the Act respecting roads set out the powers and obligations of the Minister of Transport, in particular concerning management of the road network under his responsibility. In this regard, the law states that the Minister of Transport may perform all the acts and exercise all the rights of an owner on such roads, stipulating, however, that roads built or rebuilt by the Government remain the property of the local municipalities in whose territories they are situated unless the MTQ assumes their management following an order made by the Government.

112 2015-2016 Annual Management Plans for Public Infrastructure Investments Transports
DESCRIPTION OF THE PORTFOLIO OF INFRASTRUCTURES The MTQ manages a 30,633 km highway system, consisting of highways and national, regional, collector and resource roads. The highway system also includes 5,412 structures (overpasses, bridges over water courses, tunnels, retaining walls). Since 2007, the MTQ has also been responsible for 4,253 bridges in the municipal network whose management was transferred back to municipalities in 1992. The following infrastructure also fall under the MTQ's authority:
• Real estate: wayside park network, airport terminals;
• Civil engineering works: culverts, overhead signage structures, roadside signage structures;
• Electrotechnical equipment;
• Aerial, rail and marine transportation infrastructures: highway and local road system airports, heliports, Chemin de fer Québec Central (2012), ferry terminals and wharves.
AGENCE MÉTROPOLITAINE DE TRANSPORT VISION The 2020 vision of the Agence métropolitaine de transport (AMT) is to use innovation and a sustainable development approach to improve mobility across the metropolitan territory by facilitating travel and improving citizens' quality of life. ORIENTATIONS AND OBJECTIVES In order to carry out its mission to "support, develop, coordinate and promote shared transportation, including special transportation services for the handicapped, to improve commuter train services and ensure their development, to foster the integration of the services provided by various modes of transportation and to increase the efficiency of traffic corridors," the AMT has adopted the following orientation and objectives with regard to the infrastructure under its responsibility: Orientation
• Ensure an adequate level of asset management maturity and set up the foundation for the associated management system, including application, monitoring and accountability mechanisms.
Objectives
• Respect the regulations governing infrastructure;
• Ensure infrastructures adequately meet user needs;
• Achieve the following service performance targets in a cost-effective manner:
- For fixed infrastructure (buildings and civil engineering works), equipment downtime of more than eight hours during peak hours is considered an unacceptable level of performance and requires a contingency plan;
- For mobile infrastructure (particularly equipment and rolling stock), 95% of trips are on schedule.

2015-2016 Annual Management Plans for Public Infrastructure Investments 113 Transports
RESPONSIBILITIES The AMT is under the legal responsibility of the Minister of Transport. The AMT manages the infrastructure it owns. The AMT must ensure that the infrastructure under its responsibility are functional, safe, efficient and reliable. DESCRIPTION OF THE PORTFOLIO OF INFRASTRUCTURES The AMT is the custodian of greater Montréal's commuter train and metropolitan bus systems. This infrastructure network has been growing steadily since it was established in 1996. Growth has picked up in recent years with, among other things, the addition of major infrastructure such as the purchase of 3000 Class rail cars and dual-mode locomotives, construction of the Mascouche line and acquisition of the electrified Deux-Montagnes line. This infrastructure network essentially consists of equipment, rolling stock (locomotives, electric and passenger rail cars), buildings (stations, metropolitan bus terminals, garages and maintenance shops), civil engineering works (incentive parking lots and reserved bus lanes) and railway structures (reserved lanes, bridges, culverts, walls and tunnels). SOCIÉTÉ DES TRAVERSIERS DU QUÉBEC VISION The vision of the Société des traversiers du Québec (STQ) is to ensure safe, efficient and reliable vessels and land infrastructure so as to efficiently operate its ferry fleet and service network. ORIENTATIONS AND OBJECTIVES In order to carry out its mission which consists to ensure the sustainable mobility of persons and goods through quality, safe and reliable marine services and in so doing, further Québec's development, the STQ has adopted the following orientation and objectives with regard to the infrastructure under its responsibility: Orientation
• Provide its clientele with safe, functional and quality vessels and land infrastructure. Objectives
• Ferry customers to port safely with equipment that is up to standards and qualified staff committed to delivering quality service;
• Maintain clean and comfortable ferry terminals and vessels;
• Ensure vessels are in compliance with the International Safety Management (ISM) Code;
• Maintain a planned crossing completion rate of no less than 99.5%.
114 2015-2016 Annual Management Plans for Public Infrastructure Investments Transports
RESPONSIBILITIES Reporting to the Minister of Transport, the STQ manages the infrastructure it owns, ensuring they are functional, safe, efficient and reliable. To this end, the STQ must allocate the resources required to:
• Ensure their integrity;
• Ensure they are in regulatory compliance;
• Ensure upgrades to extend their useful life;
• Make the necessary improvements to meet new requirements;
• Replace infrastructure at the end of their lifecycle. DESCRIPTION OF THE PORTFOLIO OF INFRASTRUCTURES The STQ's infrastructures are made up of properties such as ferry terminals, pedestrian bridges, warehouses, shops and a head office. Also included are mission-critical vessels and civil engineering works such as wharves, docks and other support assets, in particular waiting areas, gate houses and mechanical rooms. These infrastructures are located mainly along the Saint Lawrence River, between Sorel and the Basse-Côte-Nord, as well as on Anticosti Island and the Îles-de-la-Madeleine.
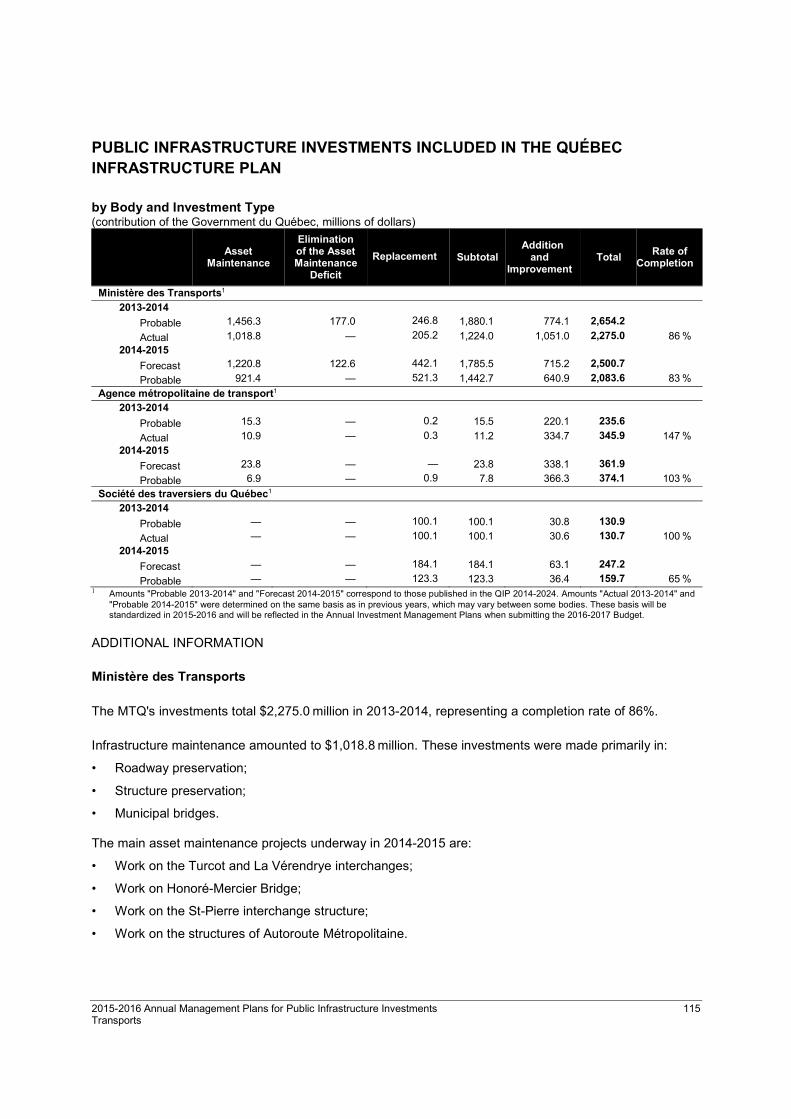
2015-2016 Annual Management Plans for Public Infrastructure Investments 115 Transports
PUBLIC INFRASTRUCTURE INVESTMENTS INCLUDED IN THE QUÉBEC INFRASTRUCTURE PLAN by Body and Investment Type (contribution of the Government du Québec, millions of dollars)
Asset Maintenance
Elimination of the Asset Maintenance
Deficit
Replacement Subtotal Addition
and Improvement
Total Rate of
Completion
Ministère des Transports1
2013-2014
Probable 1,456.3 177.0 246.8 1,880.1 774.1 2,654.2
Actual 1,018.8 — 205.2 1,224.0 1,051.0 2,275.0 86 % 2014-2015
Forecast 1,220.8 122.6 442.1 1,785.5 715.2 2,500.7
Probable 921.4 — 521.3 1,442.7 640.9 2,083.6 83 %
Agence métropolitaine de transport1
2013-2014
Probable 15.3 — 0.2 15.5 220.1 235.6
Actual 10.9 — 0.3 11.2 334.7 345.9 147 %
2014-2015
Forecast 23.8 — — 23.8 338.1 361.9
Probable 6.9 — 0.9 7.8 366.3 374.1 103 %
Société des traversiers du Québec1
2013-2014
Probable — — 100.1 100.1 30.8 130.9
Actual — — 100.1 100.1 30.6 130.7 100 %
2014-2015
Forecast — — 184.1 184.1 63.1 247.2
Probable — — 123.3 123.3 36.4 159.7 65 % 1 Amounts "Probable 2013-2014" and "Forecast 2014-2015" correspond to those published in the QIP 2014-2024. Amounts "Actual 2013-2014" and
"Probable 2014-2015" were determined on the same basis as in previous years, which may vary between some bodies. These basis will be standardized in 2015-2016 and will be reflected in the Annual Investment Management Plans when submitting the 2016-2017 Budget.
ADDITIONAL INFORMATION Ministère des Transports The MTQ's investments total $2,275.0 million in 2013-2014, representing a completion rate of 86%. Infrastructure maintenance amounted to $1,018.8 million. These investments were made primarily in:
• Roadway preservation;
• Structure preservation;
• Municipal bridges. The main asset maintenance projects underway in 2014-2015 are:
• Work on the Turcot and La Vérendrye interchanges;
• Work on Honoré-Mercier Bridge;
• Work on the St-Pierre interchange structure;
• Work on the structures of Autoroute Métropolitaine.
116 2015-2016 Annual Management Plans for Public Infrastructure Investments Transports
The main improvement and extension projects ongoing in 2014-2015 are:
• Redevelopment of the Dorval circle;
• Redevelopment of Route 185, between Témiscouata-sur-le-Lac and the New Brunswick border;
• Doubling and extension of Autoroute 73 from Sainte-Marie-de-Beauce to Saint-Georges;
• Construction of the new Route 112 between Saint-Joseph-de-Coleraine and Thetford Mines;
• Extension of Autoroute 35 between Saint-Jean-sur-Richelieu and Saint-Sébastien. Agence métropolitaine de transport The AMT's investments total $345.9 million in 2013-2014, representing a completion rate of 147%. This completion rate is mainly due to the inclusion, in the actual 2013-2014, of the AMT portion (25%) of the projects funded by the MTQ. This portion was not included in the probable.
An amount of $3.2 million was spent to maintain infrastructure in satisfactory condition and $6.4 million was spent primarily on the following rolling stock projects:
• Overhaul of the 700 series cars, at a cost of $5.1 million;
• Improving the reliability of the F59 locomotives, at a cost of $1.0 million.
The main projects ongoing in 2014-2015 are:
• Commissioning of the Train de l’Est, at a cost of $109.0 million;
• Acquisition of the Deux-Montagnes line, at a cost of $92.2 million;
• The Bureau de projet du métro, at a cost of $13.4 million.
Société des traversiers du Québec The STQ's investments total $130.7 million in 2013-2014, representing a completion rate of 100%.
• This amount was invested primarily on the following projects:
— Adaptation of the land and marine infrastructures at the Matane and Tadoussac crossings;
— Redevelopment of the Lévis terminal at the Québec City crossing;
— Construction of a new vessel for the l’Île-Verte crossing;
— Conversion of a building at the Notre-Dame-des-Sept-Douleurs dock into a ferry terminal;
— Construction of a new ferry terminal at L’Isle-aux-Grues. In 2014-2015, the STQ will invest $159.7 million primarily on the following projects:
• Construction of a new vessel for the Matane – Baie-Comeau – Godbout crossing;
• Construction of two new vessels for the Tadoussac – Baie-Ste-Catherine crossing;
• Construction of a new ferry terminal at Lévis.
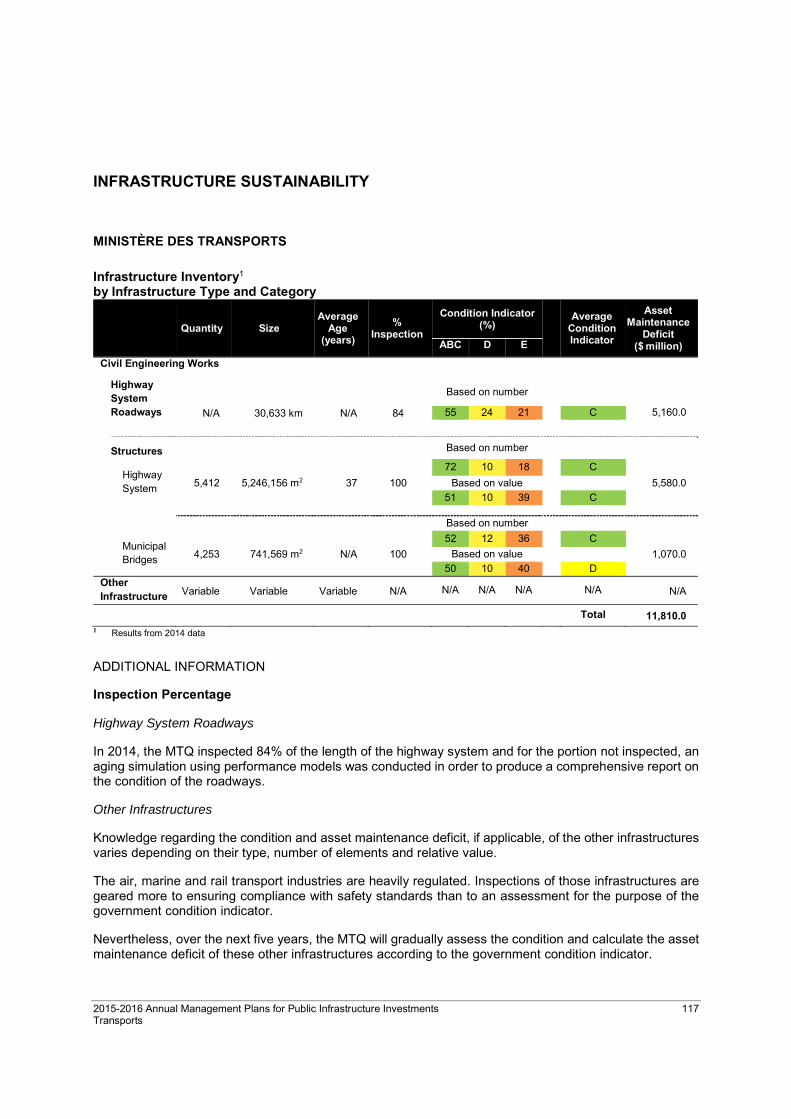
2015-2016 Annual Management Plans for Public Infrastructure Investments 117 Transports
INFRASTRUCTURE SUSTAINABILITY MINISTÈRE DES TRANSPORTS Infrastructure Inventory1 by Infrastructure Type and Category
Quantity Size Average
Age (years)
% Inspection
Condition Indicator (%)
Average Condition Indicator
Asset Maintenance
Deficit ($ million) ABC D E
Civil Engineering Works
Highway System
Based on number
Roadways N/A 30,633 km N/A 84 55 24 21 C 5,160.0
Structures Based on number
Highway System 5,412 5,246,156 m2 37 100
72 10 18 C
5,580.0 Based on value
51 10 39 C
Based on number
Municipal Bridges 4,253 741,569 m2 N/A 100
52 12 36 C
1,070.0 Based on value
50 10 40 D Other Infrastructure Variable Variable Variable N/A N/A N/A N/A N/A N/A
Total 11,810.0 1 Results from 2014 data
ADDITIONAL INFORMATION Inspection Percentage Highway System Roadways In 2014, the MTQ inspected 84% of the length of the highway system and for the portion not inspected, an aging simulation using performance models was conducted in order to produce a comprehensive report on the condition of the roadways. Other Infrastructures Knowledge regarding the condition and asset maintenance deficit, if applicable, of the other infrastructures varies depending on their type, number of elements and relative value. The air, marine and rail transport industries are heavily regulated. Inspections of those infrastructures are geared more to ensuring compliance with safety standards than to an assessment for the purpose of the government condition indicator. Nevertheless, over the next five years, the MTQ will gradually assess the condition and calculate the asset maintenance deficit of these other infrastructures according to the government condition indicator.
118 2015-2016 Annual Management Plans for Public Infrastructure Investments Transports
Methodology Highway System Roadways Currently, the asset maintenance deficit and condition indicator are determined based on inspection data from 2014. The condition and asset maintenance deficit are extrapolated taking into account the representativeness and relative size of the uninspected portions of the system. Condition Indicator For more than 15 years, the MTQ has been inspecting roadways, monitoring changes in their condition and publishing an annual report based on the key indicator of ride comfort. The International Roughness Index (IRI), used to measure the ride quality experienced by vehicle occupants, is a standard employed by the vast majority of road authorities around the world. Its definition and calculation are subject to international standards. The MTQ uses this indicator to define, in its successive strategic plans, performance targets in terms of percentage of road network in good condition. The MTQ publishes the findings in its annual management report and the results of its monitoring in its annual report on the condition of the road network. A roadway in good condition is defined as a stretch of road whose IRI is below a threshold that distinguishes between good condition and condition requiring work to restore ride quality. However, in order to decide what type of work to carry out and the best technique to use, other indicators are taken into account such as rutting, cracking and sensitivity to the effects of freezing. For its 2015-2016 Annual Management Plan for Public Infrastructure Investments, the four condition indicators already used by the MTQ for its internal management, i.e. the IRI, the rutting indicator, the cracking indicator and susceptibility to freezing, were combined to create a new integrated indicator for the purpose of the government condition indicator. The fact is that a stretch of road can offer good ride quality but at the same time have a fairly high cracking rate. Because these four indicators are combined, the picture painted based on the government condition indicator can be different than the one based solely on the IRI. That said, the advantage of using this combination of indicators is that it provides a more accurate picture of the investments required to restore the infrastructure to good condition. Asset Maintenance Deficit The roadway asset maintenance deficit is the cost to repair roadways in poor or very poor condition for which the work was not carried out in time and that have therefore reached or will reach a severely deficient state in less than three years. Structures (highway system and municipal bridges) Condition Indicator For many years, the MTQ has been using different indicators to monitor the safety, functionality and general condition of its structures. The main indicator used by most road authorities is the "proportion of structures in good condition," which for the purpose of the government condition indicator means all the condition indicators above the threshold, i.e. A, B and C (very good, good and satisfactory) while structures considered "require repair" fall under condition indicators D and E (poor and very poor).

2015-2016 Annual Management Plans for Public Infrastructure Investments 119 Transports
At the MTQ, this indicator is based on the inspection data, targeting the main elements whose condition is such that they require work within the next five years. Other indicators are also used, such as:
• The functionality indicator, which measures whether the structure meets user needs;
• The behaviour indicator, which reflects the structure's stability and safety. The combined results of these different indicators help the MTQ choose the most appropriate course of action for the road network. The "proportion of structures in good condition" indicator is expressed as a number, facilitating its interpretation. Conversely, it has the disadvantage of assigning the same weight to every work, regardless of scope. Another way to present the information, which appears in the previous table, is as a percentage of the structure's value. The advantage of reporting the condition of structures in this way is that it creates a link between the need for work and the structure's size. The disadvantage is that large structures skew the overall picture if they are in poor condition. Asset Maintenance Deficit The asset maintenance deficit of the structures in the highway system, as reported, is the total work required to restore to good condition structures that have been requiring work for more than five years. This value is greatly influenced by a few major structures that require work. For example, when work will be carry out in the next few years on several major structures such as the Turcot interchange and the Louis-Hippolyte-La Fontaine tunnel, the asset maintenance deficit will decrease from $5,580 million to $4,086 million. The MTQ will continue to give priority to work required to ensure public safety while proceeding with its plan to replace and maintain aging assets over several years. Lastly, the MTQ has also developed other indicators to meet specific needs such as:
• Work-related needs that allow it to determine the amount required to carry out the work;
• The general condition indicator, which gives the public an overview of the condition of structures by classifying them into four broad categories :
— Structures requiring replacement;
— Structures requiring major work;
— Structures requiring repairs;
— Structures not requiring replacement, work or repairs.
• The rehabilitation investment indicator, developed at the request of the Auditor General of Québec to calculate the investment required to restore structures in poor condition.
The annual report on the condition of structures in the Québec road network presents information on the structures of the highway system and municipal bridges under the MTQ's responsibility. The MTQ's annual management report renders an account on the achievement of the targets defined in the 2013-2015 Strategic Plan. The general structure inspection reports are available on the MTQ website.

120 2015-2016 Annual Management Plans for Public Infrastructure Investments Transports
AGENCE MÉTROPOLITAINE DE TRANSPORT Infrastructure Inventory1, 2
by Infrastructure Type and Category
Quantity Size Average
Age (years)
% Inspection
Condition Indicator
(%) Average
Condition Indicator
Asset Maintenance
Deficit ($ million) ABC D E
Real Estate
Stations 61 1,584,904 m2 15 100 80 18 2 B 5.5 Bus Terminals 16 354,692 m2 20 100 80 12 8 C 10.4
Garages 8 985,571 m2 10 42 95 2 3 A — Shelters 1 13,200 m2 1 100 100 0 0 A —
Civil Engineering Works
Railroad Tracks N/A 88.9 km 21 100 100 0 0 B —
Bridges, Culverts, Tunnels and
204 N/A 55 52 87 13 0 B 3.6
Incentive Parking Lots 18 272,814 m2 15 100 85 9 6 C 0.1
Reserved Lanes
35 141.25 km 16 100 89 10 1 C —
Equipment
Locomotives 41 N/A 10 78 96 4 0 B 0.3 Passenger Rail Cars 206 N/A 8 89 100 0 0 A —
Electric Rail Cars 58 N/A 20 100 0 100 0 D 39.2
Emergency Response Vehicles
25 N/A 2 100 80 8 12 C N/A
Signalling 175 N/A 22 52 93 7 0 B 0.8 Catenary N/A 47.25 km 19 100 100 0 0 B — Switches 53 N/A 9 100 100 0 0 B —
Total 59.9
1 Data as at February 12, 2015 2 The inventory excludes, in accordance with the decision taken by the government, the infrastructure for the extension of the subway network in Laval to be transferred to the
Société de transport de Montréal on March 31, 2015. ADDITIONAL INFORMATION Inspection Percentage In addition to daily regulatory inspections, the AMT's inspection programs require that all infrastructures will be inspected by 2020 to assess their condition and to calculate the asset maintenance deficit. Methodology For infrastructures with an inspection percentage of less than 100%, the condition indicator percentages and the asset maintenance deficit were not extrapolated. The inspection percentages, condition indicator percentages (ABC / D / E) and average condition indicator are weighted according to the number of infrastructure.
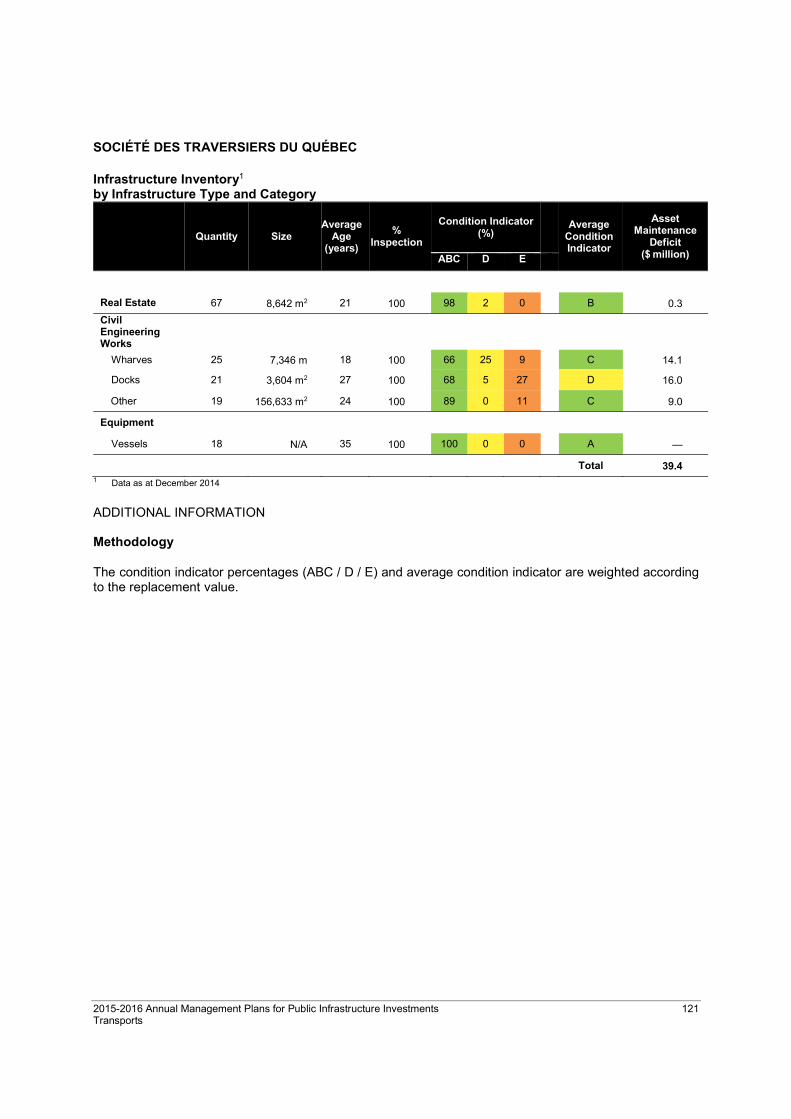
2015-2016 Annual Management Plans for Public Infrastructure Investments 121 Transports
SOCIÉTÉ DES TRAVERSIERS DU QUÉBEC Infrastructure Inventory1 by Infrastructure Type and Category
Quantity Size Average
Age (years)
% Inspection
Condition Indicator (%)
Average Condition Indicator
Asset Maintenance
Deficit ($ million) ABC D E
Real Estate 67 8,642 m2 21 100 98 2 0 B 0.3
Civil Engineering Works
Wharves 25 7,346 m 18 100 66 25 9 C 14.1
Docks 21 3,604 m2 27 100 68 5 27 D 16.0
Other 19 156,633 m2 24 100 89 0 11 C 9.0
Equipment
Vessels 18 N/A 35 100 100 0 0 A —
Total 39.4 1 Data as at December 2014
ADDITIONAL INFORMATION Methodology The condition indicator percentages (ABC / D / E) and average condition indicator are weighted according to the replacement value.


APPENDIX

125
Appendix 1
Statute, Directive and other measures
1. The Public Infrastructure Act
The Public Infrastructure Act establishes rules for public infrastructure investment planning and management. The Act’s objectives are to:
• Establish a long-term vision for government infrastructure investments;
• Ensure appropriate planning of public infrastructures;
• Contribute to the quality and longevity of public infrastructures;
• Contribute to the prioritization of public infrastructure investments;
• Ensure optimal management, by the Société québécoise des infrastructures, of immovable assets.
The Public Infrastructure Act (chapter I-8.3) was assented to on October 30, 2013 by the National Assembly of Québec. This Act established governance rules for public infrastructure investment planning and public infrastructure management.
The Act also established the Société québécoise des infrastructures, whose main mission is to support public bodies in managing their public infrastructure projects, and to ensure that immovable assets meet their needs, mainly by putting immovables at their disposal and providing construction, operation and management services.
This Act proposes a long-term vision for government infrastructures, based on best practices in the field. Thus, it promotes appropriate planning of public infrastructures by prescribing the rigorous and transparent administration of the amounts allocated to public infrastructures and by promoting best management practices and improved accountability.
The measures introduced by this Act also contribute to the quality and longevity of public infrastructures, in particular by ensuring that investments are properly apportioned between asset maintenance and infrastructure development.
126
2. Société québécoise des infrastructures
The result of a merger between the Société immobilière du Québec and Infrastructure Québec, the Société québécoise des infrastructures has implemented a unique project management service offering. While ensuring continuity in the management and maintenance of property assets, this merger brought together both organizations’ respective skills, and consequently, improved the management, planning and execution of public infrastructure projects. The mission of the Société québécoise des infrastructures is to:
• Support public bodies in the management of their infrastructure projects;
• Develop, maintain and manage the immovable assets that respond to these bodies’ needs.
3. Directive sur la gestion des projets majeurs d’infrastructure publique
The Directive sur la gestion des projets majeurs d’infrastructure publique provides a better framework for the governance process of major projects and aligns government decisions with the degrees of advancement set out in the Québec Infrastructure Plan.
The Directive sur la gestion des projets majeurs d’infrastructure publique came into effect on February 12, 2014, replacing the Framework Policy for the Governance of Major Public Infrastructure Projects.
This directive was the result of the Public Infrastructure Act (chapter I-8.3), which gives the Conseil du trésor the power to prepare a directive for investment planning and public infrastructure management.
It determines the measures required to ensure the rigorous management of major public infrastructure projects, and in particular, aims to advance best project management practices in order to make the right investment choices for obtaining quality infrastructures, while complying with established investment limits.
It also allows the government to have the necessary information to agree on the relevance of major projects and to ensure that all necessary actions have been planned and completed from the project's start to finish.
127
4. Infrastructure management frameworks
An infrastructure management framework sets out the practices, rules and standards that a body must follow to maintain and, if necessary, restore existing infrastructures.
To this end, at the beginning of fiscal 2014-2015, the Secrétariat du Conseil du trésor issued the "Guide d’élaboration et de mise en œuvre des cadres de gestion des infrastructures publiques" based on best practices in this field. Therefore, in 2014-2015, each government body developed a new management framework according to the guidelines of the Conseil du trésor, which calls for, among other things, that it be reviewed every three years.
To ensure the longevity of public infrastructures, in 2007 the Government adopted the Act to promote the maintenance and renewal of public infrastructures. The bodies therefore drew up an initial management framework for their investments in accordance with best practices and prepared an initial summary evaluation of their asset maintenance deficit.
The Public Infrastructure Act, adopted in 2013 to replace the 2007 version, kept the objective of contributing to the longevity of public infrastructures, in particular by ensuring that investments are adequately apportioned between asset maintenance, including elimination of the asset maintenance deficit, and infrastructure development. Under the new Act, each government body is required to draw up a new management framework in accordance with the guidelines issued by the Secrétariat du Conseil du trésor and compile an inventory of the infrastructures under their responsibility, including an assessment of their condition and any asset maintenance deficit.