Embed Size (px)
Citation preview

CCOP/SOPAC Technical Report 61
March 1990
QUATERNARY GEOLOGY OF THE GUADALCANAL COASTAL PLAIN AND ADJACENT SEABED,
SOLOMON ISLANDS
A basis for Resources Assessment and Planning Economic Developments
by
Peter S. Roy* Department of Mineral Resources
New South Wales Government GPO Box 5288, Sydney New South Wales 2001
Prepared for: South Pacific Applied Geoscience Commission (SOPAC) formely the Committee for Co-ordination of Joint Prospecting for Mineral Resources in South Pacific Offshore Areas (CCOP/SOPAC) Solomon Islands Project: SI.25
*Contributed by: ESCAP/UNDPProject RAS/81/102 Investigation of Mineral Potential of the South Pacific

[3]
CONTENTS
Page
ACKNOWLEDGEMENTS 8
INTRODUCTION ............................................................................................................. 9
METHODS ..................................................................................................................... 11
GEOLOGICAL SETTING ........................................................................................... 13
RESULTS The Rivers and Coastal Plain .......................................................................... 17
The foothills ........................................................................................................ 20 Rivers and flood channel zones ................................................................. 23 Flood plains and coastal swamps ................................ 29 Beaches and beach ridges ................................................................................ 30 Vegetation patterns on the coastal plain and historical trends ....................... 32
The Coast and Adjacent Seabed ................................................................................... 36 Morphology
The delta front zone ........................................................................................ 36 The shelf platform and outer reef zone ............................................... 41
Sediment types on the delta front and shelf ......................... 42
ABSTRACT .................................................................................................................. 7
...............................................................................................
Sediment trends .............................................................................................. 46
Stratigraphy of the Coastal Plain ....................................................................... 51
Cyclone Namu Background ............................................................................................................ 54 Coastal Observations ..................................................................................... 56 Aerial Observations ......................................................................................... 59
DISCUSSION Origin of the Lengo platform and Coastal Plain ............................................ 62 Historical Shoreline Changes .......................................................................... 66 Future Development of the Guadalcanal Plains
Commercial/industrial developments ........................................................ 74 Agriculture/social developments ................................................................... 76
CONCLUSIONS ........................................................................................................... 79
REFERENCES ...................................................................................................... 83
[TR61 - Roy]

[4]
CONTENTS...continued
APPENDICES Page
1 CCSP/SI-25 Work Programme ....................................................................... 85
2 Offshore survey tracklines, sampling sites and cross sections showing seabed morphology and sediment types .......................... 89
Flight path and film data for aerial survey of Cyclone Namu flood damages, 5/6/86 .................................................................................... 99
3
LIST OF FIGURES
Rear Pocket Large scale fold-out map of Guadalcanal Plains showing environments of deposition
Figure Page
1 Locality map of the Solomon Islands and regional setting of Guadalcanal .............................................................................................. 10
2 Simplifted geology of Guadalcanal ................................................................. 14
3 Attitude and depositional environments of rocks in the Honiara area ............................................................................................ 16
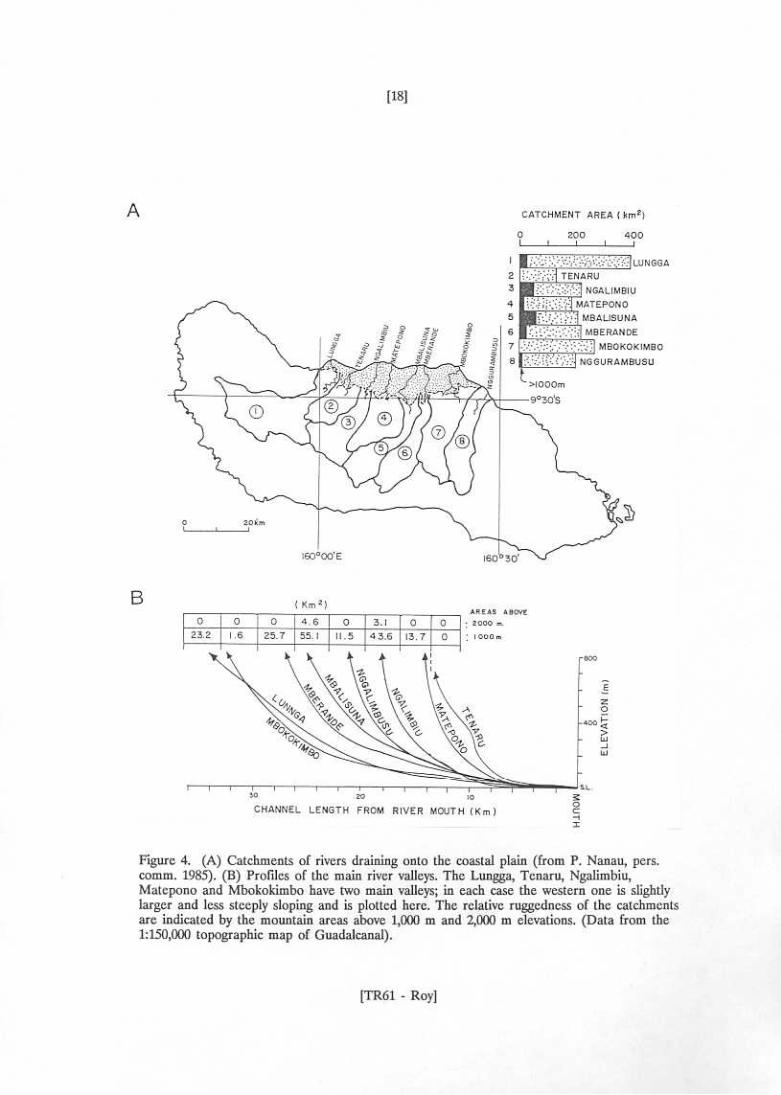
Catchments and gradients of rivers draining onto the Guadalcanal Plains ...................................................................................... 18
Depositional environments of the coastal plain ............................................. 21
Maps of flood channel zones of individual coastal plain rivers .................................................................................................... 24,25,26
Flood channel types and their distribution on the coastal plain ............................................................................................. 27
Distribution of beach deposits on the coastal
4
5
6
7
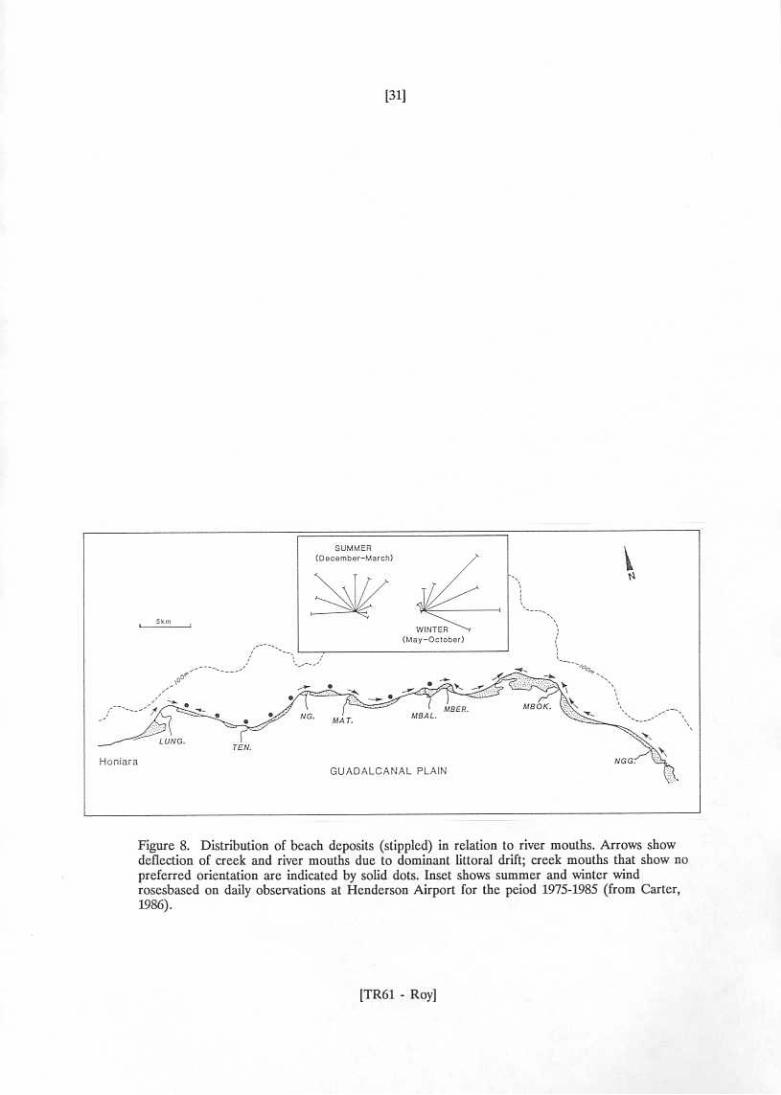
8 plain and indications of net littoral drift .......................................................... 31
9 Vegetation patterns in 1944 and 1984 ....................................................... 33
10 Historical changes in vegetation patterns throughout thecoastalplain ........................................................................................ 34
11 Bathymetry of the Lengo shelf platform ........................................................... 37
[TR61 - Roy ]

[5]
LIST OF FIGURES...continued
Figure Page
12 Morphology of the Lengo shelf platform ................................................... 38
13 Representative offshore cross sections showing seabed morphology and marine sediment types ............................................ 39
14 Delta front sediment distribution ....................................................................... 43
15 Sediments of the shelf plain and outer reef zone ................... 44
16 Water depth ranges of individual sediment units ........................................... 45
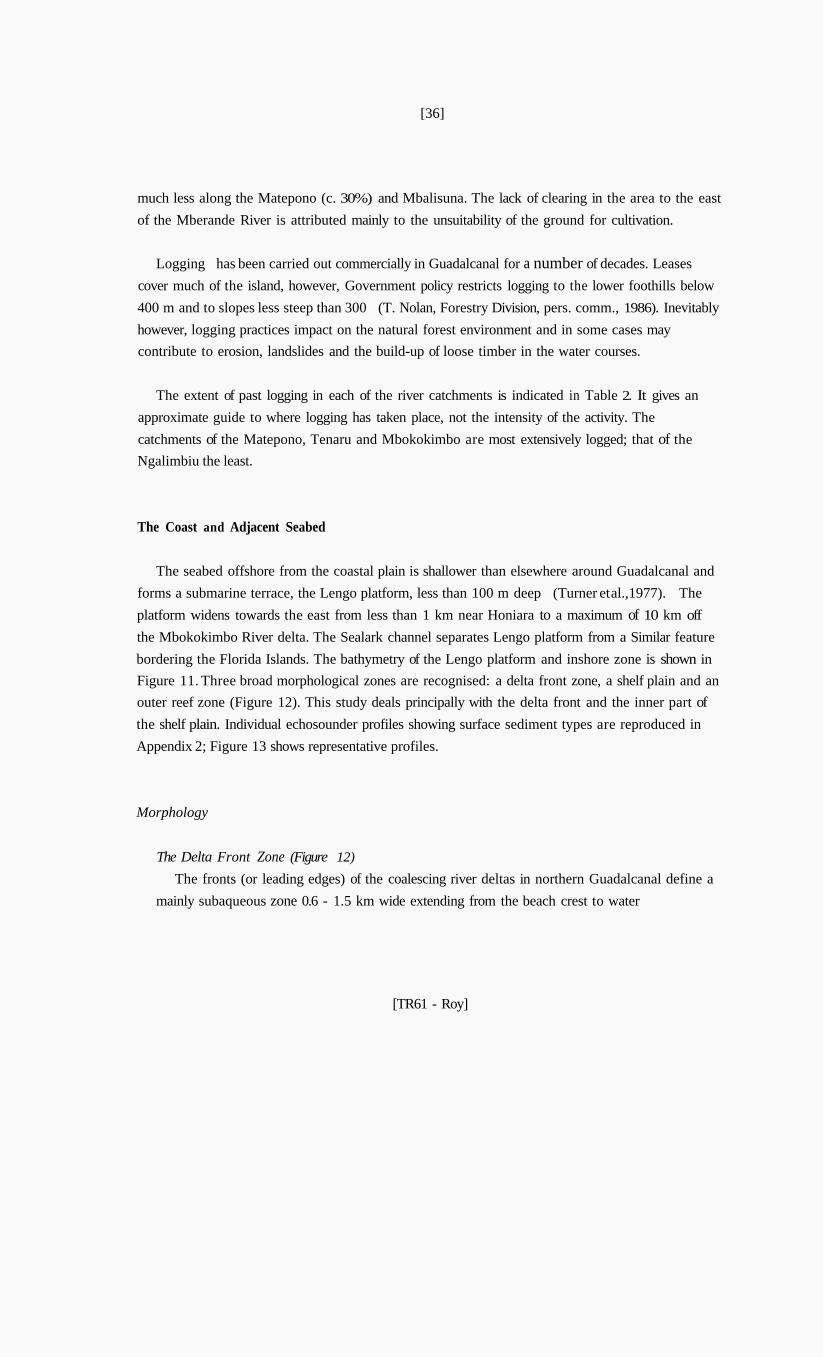
17 Depth variations in marine sediment properties .................................................. 47
18 Alongshore variations in marine sediment properties .................................... 48
19 Mineral characteristics of sediments at the coast and lithologies in the river catchments ............................................................. 50
20 Geological cross sections of the coastal plain based on drilling and seismic data ........................................................................... 52
21 Flood siltation patterns after Cyclone Namu ............................................. 57
22 Interpreted flood discharge pathways on the coastal plain .................................................................................................... 61
23 Generalised Quaternary sedimentation patterns .................................... 63
24 Cross sections through the coastal plain and Lengo platform showing Holocene sediments ........................................... 65
25 Variations in recent tectonic styles along the Guadalcanal Plains ........................................................................................ 67
26 Shoreline displacements between 1944 and 1984 ................................................. 68
27 Annual coastal accretion at individual delta lobes .......................................... 70
28 Relationships between progradation rates and river catchment sizes ......................................................................................... 73
29 Proposed developments (in 1986) for the Lungga delta lobe ....................................................................................... 75
30 Sedimentation and sediment dispersal model for ................................................. 80 the Guadalcanal Plains and Lengo shelf platform
[TR61 - Roy]

[6]
LIST OF TABLES
Table Page 1 Datasources .............................................................................................................. 12
2 River data ................................................................................................................... 19
3 Elevations of flood channel deposits at rear of coastal plain .......................................................................................................... 22
Vegetation changes on the Guadalcanal Plains .................................................... 35
Relationship between rock types in the river catchments and sediment assemblages at the coast .................................................. 49
6 Selected drill hole numbers .................................................................................. 53
7 Rates of delta lobe accretion ......................................................................... 71
4
5
[TR61 - Roy]

[7]
ABSTRACT
Guadalcanal Plains on the north coast of Guadalcanal Island is the largest alluvial plain in the southwest Pacific outside of Papua New Guinea and probably the richest land resource in the Solomon Islands. It is the product of eight coalescing river deltas. Since the mid-Holocene, the rivers have built a sediment pile 290 km in area and up to SO m thick on a slowly subsiding shelf platform, itself a former delta plain.
Coastal changes measured over the last 40 years indicate an average annual progradation for the whole delta complex of about 1 million m of sediment; most of this (65%) is concentrated in
the eastern half of the coastal plain. Subaqueous delta front deposits that extend 1-2 km offshore are composed of sand, mud and minor gravel. Variations in the rates of accretion at individual delta lobes may be linked to differences in storm reworking of the delta front sediments.
Depositional environments that make up the coastal plain include the flood channel zones of the rivers, their flood plains, coastal swamps and beach ridges at the present coast. Originally, most of the coastal plain was forested; now almost 50% has been cleared for plantations of oil palm, coconut and rice. Cultivated areas mainly correspond to flood plain environments; uncleared land, in the eastern part of the coastal plain is mostly swamp forest and may not be suitable for this type of land use. Rivers on the coastal plain show distinctly different morphologies, sediment loads and flow
regimes. Delta lobes of high-energy rivers have prograded about twice as fast as the low-energy rivers, despite similar catchment sizes. Forest clearing in flood channel zones, especially in those rivers with high-energy flood discharges, has probably exacerbated flood damage. The experience of
Cyclone Namu in May 1986 showed that development in flood channel zones is particularly hazardous. The severity of the damage to the country’s main rice growing area then was due to
overbank flood flows from adjacent rivers.
[TR61 - Roy]

[8]
ACKNOWLEDGEMENTS
The project was carried out at the request of the Chief Geologist, Stephen Danitofea, and with the support of members of the Geological Division, Ministry of Mines, Energy, Forestry and Conservation in Honiara, Solomon Islands. In particular, the assistance in the field of Patrick Nanau, Anthony Bana and other field officers was greatly appreciated. Stephen Booth of the Geological Division and members of the Cyclone Namu Disaster Council arranged the use of the Solair plane for reconnaissance aerial photography in June 1986. This involved taking virtually continuous shots while in the air using two cameras alternatively; in this regard the assistance of Ron Canarello of the U.S. Peace Corps was invaluable. Stephen Booth was responsible for the difficult task of navigating the fight. Copies of the various maps used in this study were supplied by Ellison Suri, Chief Cartographer with the Department of Lands and Survey. Geoffery Dennis of Honiara loaned his personal copies of 1944 war-time aerial photographs of the Guadalcanal Plains. The Council of Tumumbosa Village kindly allowed their school buildings to be used as a base for
field work in 1985 and provided overnight accommodation and hospitality to the field crew in 1986.
Marie Ferland reviewed the report and her comments are appreciated.
[TR61 - Roy]

[9]
INTRODUCTION
The Guadalcanal coastal plain is the product of eight coalescing river deltas and covers an area of about 280 km (Figure 1). It is the largest alluvial plain in the southwestern Pacific outside of New Guinea and arguably Solomon Island's most valuable land resource in terms of both agriculture and development potential. According to Baines (1986), "The Guadalcanal Plains is one of critical economic importance for the whole of the Solomon Islands. This area has: - - -
- irrigated rice; - - - - -
It is of vital importance that the opportunities and potential of this region be secured. The nation's future will rely heavily on the success with which this is done".
soils which, for the Solomons, are unusually fertile; terrain which is well suited to plantation agriculture; existing, extensive plantations of oil palm;
the nation's main international airfield; a coastal highway of considerable economic importance linking Honiara with east Guadalcanal; space for future expansion of Honiara; a small industrial base, with opportunities for further development; long-established communities with strong cultural and economic associations with the area.
A programme of coastal and nearshore geological mapping of the Guadalcanal coastal plain was suggested in mid 1985 and adopted later the same year by the Solomon Islands Government at the 14th Session CCOP/SOPAC Meeting at Honiara. It constitutes programme element CCSP/SI-25 within CCOP/SOPAC's work commitment to the Solomon Islands; its specific objectives and tasks are set out in detail in Appendix 1.
In essence, the project involves aerial photographic interpretation and reconnaissance field mapping of the deltaic plain between Honiara and the Nggurambusu River mouth, northern Guadalcanal, and a marine geological survey of the seabed offshore. Its main objective is to describe the area's Quaternary geology, its evolution and present-day sedimentation patterns, thus creating a framework within which to assess resource potential and development options.
As well as fulfilling this main aim, the project was also intended to contribute to a number of other CCOP/SOPAC programme elements. These include an assessment of detrital gold in beach
[TR61 - Roy]


[11]
and nearshore areas (CCSP/SI-5) and offshore sand and gravel resources in the Honiara area and the likely effects of dredging (CCSP/SI-20).
Field data collection commenced in mid September 1985 but most of the work was carried out in late November - early December of that year. Together with the interpretation of the aerial photographs, this forms the main part of the report. In May 1986, Cyclone Namu devastated the study area and in June the author briefly returned to Guadalcanal to inspect coastal changes and to make a photographic reconnaissance from the air. These observations are also included in the report.
METHODS
Mapping of the coastal plain is based on the study of vertical aerial photographs and topographic maps supplemented by limited field inspections. Data sources are listed in Table 1. Access to the coastal plain was by four-wheel-drive vehicle and by boat along navigable sections of
the rivers. The marine survey used an outboard powered work-boat 6 m long equipped with a Raytheon 219B echosounder and a small hand winch for dredge sampling.
Field work was carried out by Peter Roy, marine geologist with CCOP/SOPAC and Patrick Nanau, geologist with the Geological Division of the Solomon Islands Ministry of Mines, Energy, Forestry and Conservation. Anthony Bana operated the boat with assistance from a number of other members of the Geological Division. Bruce Richmond, also of CCOP/SOPAC, was involved in the early stages of the marine survey. For much of the time, work was carried out from a field base at Kulu School, Tumumbosa Village on Tadhimboko Bay located 40 km east of Honiara.
A total of 17 days were spent in the field - 12 days on the marine survey and 5 days working on the coastal plain. An additional 3 days were spent in June 1986 inspecting the coast and rivers after Cyclone Namu and, with the assistance of the Disaster Relief Council, an aerial photographic survey was made of the coastal plain and foothills.
Sediment samples were collected from the seabed with a small pipe dredge along echosounder lines oriented approximately shore-normal. Positioning at sea was by sextant and dead-reckoning. Samples were also obtained from the beaches and in the navigable sections of the river channels. At
[TR61 - Roy]

[12]
Table 1. Data Sources
Aerial Photographs 1984 Runs J,K,L 1944, 2 enlargements covering the western and central plain (Mr G. Dennis - personal loan)
1:150,000, 1977. Series S00-6 Guadalcanal, Solomon Islands (2nd Edition)
1:50,000, 1976. DOS Ordnance Survey sheets 9/159/8, 9/160/5 and 9/160/6. (Based on 1962/3 aerial photography)
1:10,000, 1979. Guadalcanal Island, XK Series (12 sheets) (Published by SI Ministry of Agriculture and Lands, based on 1968 aerial photographs)
Topographic Maps
Geological Maps 1:150,000, 1980. Geological map of Guadalcanal, Solomon Islands. (Compiled by B.D. Hackman as part of IGS Overseas Memoir 6, 1980)
1:50,000, 1979 and 1986. Guadalcanal Geological map sheets GU4- Honiara and GU9-Gold Ridge and provisional sheets GU 5-Tetare- Tenaru and GU 6-Tadhimboka
1:10,000, 1985. Geology of the Honiara Urban Area by S.J. Tickell et al., (Manuscript copy)
Charts 1:100,000, 1978. Navy Hydrographic chart 1713-Sealark channel and approaches to Honiara (based mainly on U.S. Surveys in 1944-47)
[TR61 - Roy]

[13]
beach sites, bulk samples (c. 25 kg) were collected to assay for heavy minerals including gold. Initial mineral concentration by panning was to be carried out at the Geological Division in Honiara with the final analysis done commercially. At the time of writing, this work had not been completed.
Twenty four transects were surveyed and 234 samples collected along a 60 km section of coast. The survey tracklines and sample data (corrected for tide) are plotted in Appendix 2. Including intermediate zig-zag traverses, approximately 220 line kilometers of marine surveying was completed. Sediment samples were wet sieved through a 75 micron sieve to remove mud (silt plus clay sized material) and the mud content determined by volume loss. The sand fraction was examined under binocular microscope to estimate texture and composition. Granulometric analyses and quantitative mineralogical identifications were not undertaken. Because of limitations in time and facilities, no subsurface data (drilling or seismic) were collected during this study. Existing data included drillings logs, mainly from water bores in the western half of the coastal plain (compiled by Patrick Nanau) and results of an earlier CCOP/SOPAC seismic and coring survey over part of the offshore area (Turner et al., 1977). These data were incorporated in the study.
GEOLOGICAL SETTING
The Melanesian Borderland, a NW-SE trending island arc complex that includes the Solomon Islands, lies between the descending northern edge of the Indo-Australian Plate and the Ontong Java Plateau (Kroenke, 1984). Guadalcanal (latitude 9030'S, longitude 1600E), one of the largest of the Solomon islands, is located on the northern side of the San Cristobal Trench, a northeasterly dipping subduction zone that has been active since latest Miocene times about 8 m.y. ago (Coleman and Kroenke,1981) (Figure 1).
Oceanic basement rocks and intrusives crop out in the island's southern mountain zone and successively younger Tertiary deposits - reef limestones, fluvial clastics and deltaic mark and mudstones - occur to the north (Figure 2). The coastal plain is composed of Quaternary sediments. Underplating of Guadalcanal in the late Cainozoic has led to uplift and tilting. The southern side of the island, which borders a major fault, is elevated while its north-central side has subsided a
maximum of about 5 km since late Miocene time in the Mbokokimbo Basin (Hackman, 1980)
(Figure 2). Here, the sequence of sediments thickens towards the east away from a NE-SW trending basement high - the Tetare anomaly - (Landmesser, 1977). This depocentre, together with
[TR61 - Roy]


[15]
the drowned coastal morphology of Florida Island, suggests that the amount of subsidence increases towards the east and north. Whether Sealark Channel marks an E-W trending ("pull-apart") structural linement as suggested by R. Walshaw (pers. comm., 1985) or is a zone of current scour between old reef complexes is unclear. On its southern side it borders a shallow shelf platform (termed the Lengo platform) that has strongly influenced recent sedimentation on the northern Guadalcanal coast. Unlike most other sectors of the island's coast that border deep water, the Lengo platform has afforded a shallow substrate over which deltaic sediments have prograded (Figure 2).
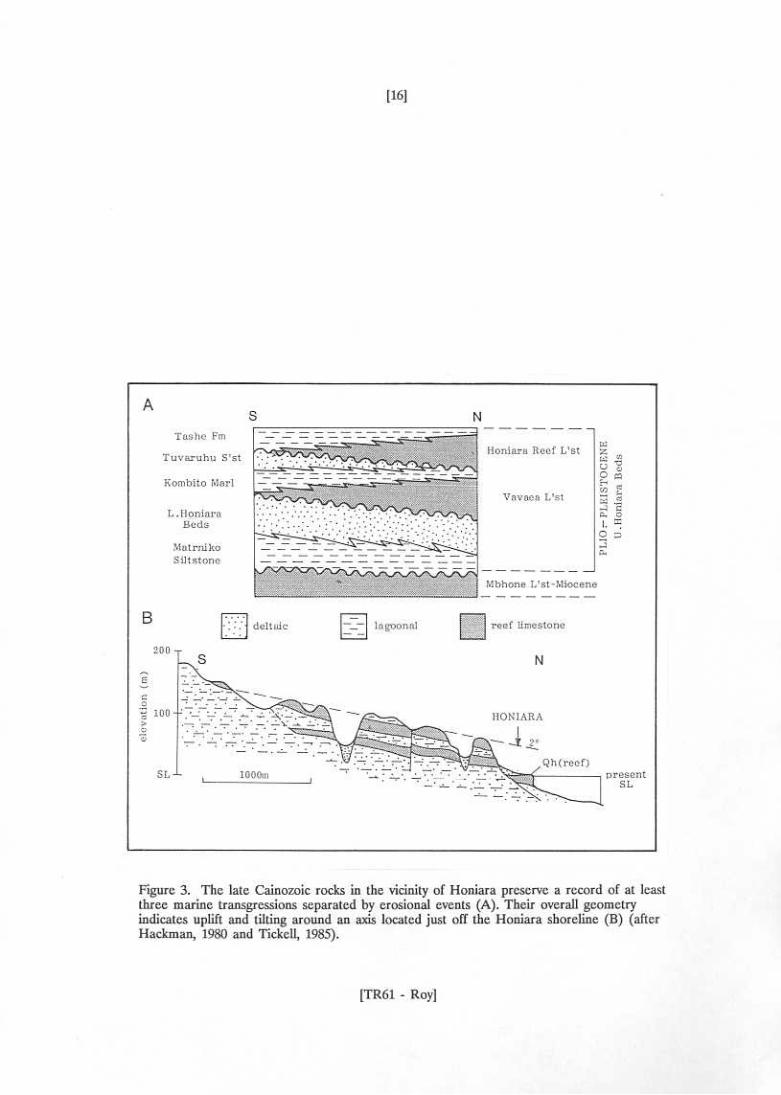
Evidence of pronounced tilting and uplift is shown in the vicinity of Honiara (Figure 3) by the attitude of reefal limestones, marls and volcaniclastic sandstones of the Honiara Beds - in part, the same age as the sediments underlying the Lengo platform. According to Tickell (1985), the sequence comprises at least three eustatic cycles separated by erosion surfaces (Figure 3a). Cycles typically include transgressive reef and lagoonal facies overlain by regressive fluvial/deltaic deposits that probably represent the combined effect of tectonism and glacio-eustatic fluctuations in sea level. The uppermost unit - the Honiara Reef limestone- now forms an uplifted and tilted surface rising from about 30 m at the coast to 100 m just over 2 km inland (Figure 3b). The axis of tilting is apparently located about 1 km offshore from Honiara and presumably extends to the east through the coastal plain. The occurrence of progressively younger beds towards the north (Figure 2a) suggests that with time, the axis of tilting has migrated in that direction.
Along the Honiara foreshore, a narrow fringe of coral reefs is elevated about 1 m above presently living corals (Tickell, 1985) (Figure 3b). The lack of recrystallisation or calcite infilling of the corals strongly suggests a mid Holocene age of formation (F. Taylor, pers. comm. 1986). Their elevation indicates a relative sea level change averaging c. 0.2 m/thousand years. Evidence of continuing uplift is also clear on the island's south coast by raised Holocene reefs at Cape Henslow (Hackman, 1980) and by Korasulu Reef nearby which was suddenly elevated 2 m in the 1977 earthquake (F. Taylor, pers. comm., 1986).
[TR61 - Roy]

[17]
RESULTS
The Rivers and Coastal Plain
The geomorphology of the Guadalcanal coastal plain is described by Hackman (1980) as "..built up from the progressive coalescing of the main river deltas which are still expanding. The rivers bifurcate and meander extensively in their own alluvium which ranges in grade from clay to coarse gravel; much of the area is poorly drained" (p.11). Because of tilting, river catchments on the island have tended to migrate towards the south with the result that the largest rivers drain northwards (Figure 4a). The deltas of eight of these (the Lungga, Tenaru, Ngalimbiu, Matepono, Mbalisuna, Mberande, Mbokokimbo and Nggurambusu) have amalgamated to form a coastal plain 47 km long and up to 10 km wide (Figure 4a). According to Hackman (1980) the coastal plain is underlain by more than 1000 m of reefal and volcaniclastic sediments of Quaternary age.
The location and general characteristics of the coastal plain rivers and their catchments are summarised in Figure 4 and Table 2. The Lungga is the largest river followed by the Mbokokimbo; both have long hut relatively gently sloping channels. The Mberande, Ngalimbiu, Mbalisuna and Nggurambusu have similar sized catchments but the lengths and gradients of their channels vary quite considerably. The Mbalisuna and Ngalimbiu drain some of the highest and most rugged terrain on the island; 21% and 28% respectively of their catchments lie above 1,000 m. The Matepono and Tenaru are the smallest rivers but have steepest overall channel gradients. The other values listed in Table 2 are discussed later in the text.
Mapping of coastal plain environments is based mainly on interpretation of aerial photographs and principally follows vegetation and cultivation patterns. These usually reflect substrate type and elevation although land management practices may have modified this relationship in some areas. Field inspections were made along four-wheel-drive tracks, the coverage of which is good in the western and central plain but is increasingly sparse further away from Honiara. Because of this, the confidence level of the mapping diminishes in the east, especially beyond the Mberande River where thick forest cover obscures all but the most prominent land forms and detailed topographic maps do not exist.
The 1:10,000 topographic maps show the surface of the coastal plain to rise gently landwards and intersect the foothills at elevations that vary from west to east. Elevations are generally less
[TR61 - Roy]

[19]
Table 2. River Data.
Z Y X W V U T S
Catchment areas (km) 388 129 221 186 210 221 268 205
Valley gradient
(1 steep-8 gentle) 7 1 3 2 5 6 8 4
high ground
>1,000 m (km) 23 0 43 14 55 26 2 11
River type B A B A A B A B
lity (1 mobile-8 stable) 1 8 2 7 4 3 6 5
(x 1,000 m) 155 166 49 75 131 420
segment (km) 15 57 52 62 61 50 68 <10
plain cleared (%) 87 64 m 68 60 (25) (20) (20)
(km) c. 1970-1986 29 46 6 46 36 21 40 11
Historical channel mobi-
Annual delta accretion
Area of coastal plain
Percentage of coastal
Logging in catchments
Where: Z = Lungga X = Ngalimbiu V = Mbalisuna T = Mbokokimbo Y = Tenaru W = Matepono U = Mberande S = Nggurambusu
NOTES:
1. Valley gradients and channel mobility are shown in relative terms; the former is based on profiles shown in Figure 4b, the latter from data shown in Figure 7.
The basis for designating river type is discussed in the text and illustrated in Figure 8.
Coastal plain segments are arbitrarily defined sectors of the coastal plain bordering each of the rivers. The percentage of clearing is calculated within each segment (see Table 3).
Bracketed values for the Mberande, Mbokokimbo and Nggurambusu rivers are estimated.
2.
3.
4.
[TR61 - Roy]

[20]
than 1.5 m in the west but between the Ngalimbiu and Mberande Rivers about 40% of the plain is above this level (see inset in Figure 5). Although detailed topographic data are not available east of the Mberande River, the vast area of forest around the Mbokokimbo is thought to indicate swampy conditions and somewhat lower relief. The dynamic elements of the coastal plain are the rivers and the coastal processes that disperse the fluvial sediment. The resulting depositional environments are shown on the large-scale fold-out map at the back of the report and on Figure 5. They include the rivers and their flood channels, flood plains and coastal swamps, and beaches and beach ridges at the present coast. Because of the high rainfall, fluvial processes are dominant at the coast and true estuarine environments are restricted to relatively few area5 bordering abandoned creek and river channels. The inland margin of the coastal plain is defined by the "lower foothills" (Hackman, 1980) which begin at elevations ranging from 4 to 30 m (Table 3).
The Foothills
The foothills typically rise abruptly to a gently inclined surface 30 m + in elevation; its relief is highly irregular due to the incision of steep-sided valleys. In section they comprise semi-consolidated muddy sands in the lower part overlain by up to 10 m of weathered gravels and boulders in a clay matrix. The size of the boulders (up to 50 cm) indicates very high-energy fluvial (?fan) sedimentation. The mud matrix is the result of in situ weathering of what originally was sand-size material - a phenomenon that is evident throughout the tropics, even in Holocene sediment. Tickell (1985) ascribes a Pliocene-Pleistocene age to the foothills near Honiara and correlates them to the Honiara Beds.
In plan-view the foothills display a range of morphologies at their contact with the coastal plain:
* In the far eastern and far western parts of the coastal plain their outline is highly irregular, with a dendritic pattern of small valleys incised during multiple erosion cycles. The valley floors are infilled with flood plain and swamp deposits which probably include Pleistocene as well as Holocene sediments.
* In the central part of the coastal plain, the foothills commonly show linear escarpments and
[TR61 - Roy]


[22]
Table 3. Elevations above sea level of flood channel deposits where the rivers debouch onto the coastal plain. Data from 1:10,000 topographic maps except for (*) which are estimated.
River Approximate elevation Distance inland from coast (m bsl) (km)
Lungga 4 2.5
Tenaru 12 6
Ngalimbiu 18 10.5
Matepono 20 10.5
Mbalisuna 25 11
Mberande 30 9.5
Mbokokimbo >20 (*) 7
Nggurambusu >05 (*) 2
[TR61 - Roy]

[23]
sharp contacts Little modified by fluvial erosion. These are interpreted as evidence of relatively recent faulting. The distribution of the faults is indicated in the inset in Figure 5.
Between the Mbalisuna and Mberande Rivers there is a planar, grass-covered surface, inclined at about 1.00, that rises to elevations of 60 m against an uplifted fault block on its southeast side (Figure 5). It is incised by the Mbalisuna River along its south west side where cliff exposures show similar lithologies to those found elsewhere in the foothills. Headwaters of small creeks draining this area have deeply incised valleys (see fold-out map at back of report). This section of the coastal plain is believed to be a down-faulted, but otherwise little modified, remnant of the foothills deposits and therefore much older than the rest of the coastal plain.
*
The Rivers and their Flood Channel Zones
The modern river beds vary in elevation from 4 to 30 m where they debouch onto the coastal plain (Table 3). In most cases the differences can be attributed to their distance from the Coast. These range between 2 and 11 kms and the deposits generally rise about 1.7 m for each kilometer inland from the coast. Around the Mberande River however, there is sufficient survey data to show that its modern channel is up to 10 m higher and slopes almost twice as steeply (c. 3.0 m/km) as elsewhere. Where the eight main rivers traverse the coastal plain they have left a pattern of abandoned meanders and braids, scarped banks and depositional terraces and bars. These characteristics define flood channel zones over which the rivers have actively migrated in recent geological times. Figure 6 documents the present day rivers and their flood channel zones and shows some previous channels based on earlier maps and aerial photographs.
Flood channels vary in character from broad gravel fans to zones of levees within swamps; an intermediate type has meandering and braided channels incised into flood plain deposits. Figure 7(A) illustrates the diversity of flood channel morphologies; their distribution in each of the main coastal rivers is shown in Figure 6.
In the foothills the river valleys are steep-sided with floors made up of meandering and braided channels and gravelly terrace deposits (a in Figure 7(A)). As many as three separate terrace
[TR61 - Roy]


[28]
levels are recognised in the Lungga River (Tickell, 1985) and in the Ngalimbiu and Matepono Rivers erosional benches also occur well up the valley sides (See fold-out map at back of report).
Gravel fan deposits (b in Figure 7(A)) occur where particularly high-energy rivers debouch onto the coastal plain. They comprise a chaotic array of abandoned channels and gravel bars, mostly vegetated, that rise above the adjacent flood plain surface; the active channel tends to be braided. The Mberande fan forms an enormous lobe extending virtually to the present coast; it is 4 km wide and rises about 10 m above the general level of the coastal plain. (Compare inset in Figure 5 with distribution of fan deposits shown in same figure).
Further downstream, usually in the central parts of the coastal plain, flood channel zones are incised below the flood plain surface. The present river beds show broad meanders and straight reaches. They lie within a relatively narrow zone (0.5 - 1.0 km wide) between steep, erosional banks 3 to 4 m high (c and d in Figure 7(A)). Channel sediments are poorly sorted gravels and sands that tend to fine in a downstream direction.
Swampy flood channels (e in Figure 7)) occur in the Tenaru, Matepono, Mbalisuna and Mbokokimbo Rivers which flow through swampy areas near the coast. Here present and past river courses are marked by complex patterns of levees and sinuous channel meanders. The swamps are densely vegetated but, because the levees are slightly sandy and higher than the surrounding swamp, they are usually cultivated. Swampy flood channels are most widespread in the Mbokokimbo delta lobe where at least two abandoned (as well as the presently active) flood channel zones are recognised (Figure 5). In the case of the Matepono and Mbalisuna Rivers, broad swampy flood channel zones near the coast are bounded by slightly elevated (and cultivated) flood plains.
The distribution of the various flood channel morphologies are compared in in Figure 7(B). Two types of rivers, designated A and B, can be identified (Table 2) on the basis of the presence or absence of morphologies (d) and (e).
Type A rivers are characterised by narrow, steep-sided, meandering channels and a sediment load that is fine grained. The Tenaru, Matepono, Mbokokimbo and Mbalisuna Rivers belong to this group. Type B rivers have broader channels with wide sand and gravel bars and braids and a very coarse sediment load. These are the Lungga, Ngalimbiu, Mberande and Nggurambusu Rivers. Near the coast, type A rivers are relatively deep (2-4 m) with a sand bed and are navigable by
[TR61 - Roy]

[29]
small boats for distances of up to 5 km inland. In contrast, type B rivers have shallow, gravel beds that restrict navigation to within a few kilometers of their months (approximate limits of navigation are shown in Figure 6). The sediment-carrying capacity and competence of type B rivers is also much greater than for type A rivers. Channel changes are more pronounced in type B rivers when measured from historical records or immediately following floods. From observations made after Cyclone Namu (see below), flood damage also appeared to be more severe in type B than in type A rivers.
Statistical analysis of independent variables such as those listed in Table 2 confirm the A/B grouping but reveal no general explanation. Catchment size accounts for some differences: the type B character of the Lungga River can be attributed to its very large catchment, high discharge and the relatively short distance between its mouth and the foothills. The reverse is true for the Tenaru (and possibly the Matepono) which have small catchments and are type A rivers. The Mbokokimbo, with a large catchment, discharges through extensive coastal swamps. These absorb flood waters and reduce discharge rates thus accounting for its fine-grained sediment load and type A character. However, much less clear are the reasons why the Mbalisuna River (type A) differs so much from the Ngalimbiu and Mberande Rivers (type B), especially since their catchment sizes are so similar. Except for recent forest clearing in the flood channels of some rivers (see below), there seems to be no strong evidence to link river type to historical land-usage practices in their catchments or on the coastal plain.
Flood Plains and Coastal Swamps
Flood plains are composed of brown (oxidised), muddy sediments deposited by overbank flow during floods. River bank exposures usually show horizontal bedding; typically they overlie river gravels. Flood plain surfaces rise gently landward to elevations of 15-25 m at the base of the foothills. Except for the old land surface between the Mbalisuna and Mberande Rivers which is much steeper, overall gradients range from 0.100 to 0.170. Broad, low relief levees border the rivers on the lower flood plain below elevations of about 15 m.
Coastal swamps: Areas of natural rainforest left standing in the midst of plantations and cleared areas in the western and central parts of the coastal plain usually prove to be swampy on inspection. They occur most extensively around the river mouths (Figure 5). Assuming the same
[TR61 - Roy]

[30]
relationship holds in the east, Figure 5 shows the swampland to increase dramatically in extent to the west of the Mberande River. Reed swamps also occur in many of the foothill valleys between the Mbokokimbo and Nggurambusu Rivers where a continuous line of beach ridges blocks the escape of surface runoff to the sea. Typically, in areas of swamp forest, the ground surface is highly irregular (relief c. 1.0 m) with water-filled depressions and hummocks. Because of the dense vegetation, even during floods, water movements are slow. Sediments are organic-rich muds and peats and accumulation rates are presumed to be relatively slow.
Beaches and Beach ridges
The beaches that extend unbrokenly along the coastal plain are generally 10-20 m wide with planar faces and small berms in accreted sections of coast. Typically they are backed by sandy beach deposits - the product of past phases of coastal accretion (Figure 8); only in a few small areas (both on the western side of major river mouths) has coastal recession exposed old flood plain silts on the shoreface (e in Figure 8). Weather data compiled by Carter (1986) indicate that the dominant winds are roughly coast-parallel; they blow towards the west in summer and towards the east in winter (inset in Figure 8). Local wind waves generated under these conditions redistribute sand at river mouths and transport it along-coast in the beach and nearshore zone - a process of littoral drift. In some areas, subtle changes in coastal alignment favour littoral drift in one direction over the other with the result that creek mouths tend to be deflected in a down-drift direction. Littoral drift convergences, divergences or along-shore changes in the rate of littoral drift indicate local imbalances in the coastal sediment budget that lead to coastal accretion or erosion.
Figure 8 shows net littoral drift directions inferred from the orientation of creek and river mouths near the coast. Despite the apparent predominance of winter winds (Figure 8 inset), many creek mouths in the western and central parts of the coastal plain tend to be deflected towards the east. However, others show no preferred orientation, which suggests that this coast is divided into isolated littoral drift cells rather than forming one continuous system. In contrast, littoral drift patterns in the eastern part of the coastal plain are more varied. Strong westward littoral drift dominates the sector to the east of the Mbokokimbo River but to the west of this there are a number of convergence (accretion) zones on the Mbokokimbo and Mberande delta lobes. Areas of drift divergence (erosion) occur in Tadhimboko Bay and to the west of the Mbokokimbo River mouth (Figure 8).
[TR61 - Roy]

[32]
Beach ridges are wave-deposited accumulations of sand and pebbles at the coast. They reach elevations of 2-3 m and relief between ridge crests and troughs is usually less than 0.5 m. Figure 8
shows beach ridges concentrated around river mouths and a trend of increasing development towards the east; on the Mbokokimbo delta lobe they form a zone 1.5 km wide. Here, the succession of ridges is clear evidence of coastal progradation and a continuing supply of sediment; their alignment records past shoreline positions (see fold-out map at back of report). Because of their elevation, sandy composition and good drainage, they are the preferred sites for coastal villages. Although beaches fringe the entire delta coastline and have done so throughout its evolution, the resulting beach ridge plains are subject to a number of modifications: (1) with time they become buried beneath flood plain deposits - a combination of delta top accretion and subsidence due to both compaction and tectonism; (2) they are reworked by migrating distributary channels at river mouths and (3) the sands of which they are composed disintegrate in situ under conditions of tropical weathering. These factors largely explain the absence of beach ridge morphologies away from the present coast in the interior of the coastal plain.
Vegetation Patterns on the Coastal Plain and Historical Trends
Originally the Guadalcanal coastal plain was covered with rainforest, possibly with some small areas of natural grassland. The suspicion that grasslands, such as occurs on the upper interfluve between the Mbalisuna and Mberande Rivers (Figure 9), have long existed in Guadalcanal is based on the presence of endemic species of quail and rail-birds that must have evolved in grassland habitats (G. Dennis, pers. comm., 1986).
After European settlement, land was cleared for plantations (coconut, oil palm and rice) and today only about 50% (or 190 km) of the natural vegetation remains. Figure 9 indicates the extent of natural vegetation in 1944 and 1984 based on aerial photographs. From this, the amounts of clearing or cultivation in the various parts of the coastal plain have been calculated or, in the case of the Mbokokimbo and Nggurambusu Rivers, estimated (Figure 10; Table 4). Most activity has taken place in the western and central coastal plain for both time periods: before 1944 and 1944 - 1984.
Clearing of forest immediately adjacent to the rivers - mainly in their flood channels - has been most extensive in the case of the Mberande (almost 100%) and the Lungga (c. 80%) and
[TR61 - Roy]


[35]
Table 4. Vegetation changes on the Guadalcanal Plains based on comparison of aerial photographs flown in 1944 and 1984. For convenience the coastal plain is divided into segments centered on individual rivers; vegetation changes are shown for each segment.
River Area of coastal Area (and %) of Areas and %) plain segment grass-land in of forest cleared
1944 photos between 1944 and 1984 (km)
(km) (km)
Lungga 14.7 07.8 (53) 05.0 (34)
Tenaru 57.4 12.0 (21) 24.8 (43)
Ngalimbiu 52.5 25.9 (49) 11.3 (21)
Matepono 62.5 32.7 (52) 10.2 (16)
Mbalisuna 61.1 22.9 (37) 14.3 (23)
Mberande 27.3 00.7 ( 2) 11.0 (22
Mbokokimbo 68 c.17 (25)
Nggurambusu 10 c.2 (20)
Note: The 1944 air photo coverage does not include the Mbokokimbo and Nggurambusu segments. Values for these rivers are for cleared areas shown in 1984 photographs.
[TR61 - Roy]
[36]
much less along the Matepono (c. 30%) and Mbalisuna. The lack of clearing in the area to the east of the Mberande River is attributed mainly to the unsuitability of the ground for cultivation.
Logging has been carried out commercially in Guadalcanal for a number of decades. Leases cover much of the island, however, Government policy restricts logging to the lower foothills below 400 m and to slopes less steep than 300 (T. Nolan, Forestry Division, pers. comm., 1986). Inevitably however, logging practices impact on the natural forest environment and in some cases may contribute to erosion, landslides and the build-up of loose timber in the water courses.
The extent of past logging in each of the river catchments is indicated in Table 2. It gives an approximate guide to where logging has taken place, not the intensity of the activity. The catchments of the Matepono, Tenaru and Mbokokimbo are most extensively logged; that of the Ngalimbiu the least.
The Coast and Adjacent Seabed
The seabed offshore from the coastal plain is shallower than elsewhere around Guadalcanal and forms a submarine terrace, the Lengo platform, less than 100 m deep (Turner et al.,1977). The platform widens towards the east from less than 1 km near Honiara to a maximum of 10 km off the Mbokokimbo River delta. The Sealark channel separates Lengo platform from a Similar feature bordering the Florida Islands. The bathymetry of the Lengo platform and inshore zone is shown in Figure 11. Three broad morphological zones are recognised: a delta front zone, a shelf plain and an outer reef zone (Figure 12). This study deals principally with the delta front and the inner part of the shelf plain. Individual echosounder profiles showing surface sediment types are reproduced in Appendix 2; Figure 13 shows representative profiles.
Morphology
The Delta Front Zone (Figure 12)
mainly subaqueous zone 0.6 - 1.5 km wide extending from the beach crest to water The fronts (or leading edges) of the coalescing river deltas in northern Guadalcanal define a
[TR61 - Roy]


[40]
depths averaging 30 m along the entire length of the coastal plain. Four units are recognised within the delta front: * beach and shoreface * delta top * delta slope * delta toe
The beach and shoreface form a continuous zone along the entire delta coast but the other three are developed to varying degrees off delta lobes compared to inter-lobe embayments (figure 12). Subaqueous delta morphologies - tops, slopes and toes - are best developed on delta lobes. In embayments they lose their definition; here the seabed slopes gently and uniformly seawards to merge with the shelf plain (Figure 12, inset).
The beach and shoreface extends from a maximum berm elevation of +2-3 m to water depths of between 1 and 3 m. Deeper shorefaces occur on the flanks of the Lungga delta lobe and are thought to coincide with areas of coastal erosion. Beach morphologies range from narrow, planar beach faces in embayments to complex swash ridges, bars and shoal areas at active river mouths. Small scarps and undercut vegetation mark sectors of coast that show evidence of recent erosion.
The delta top is a gently sloping surface extending from the base of the shoreface to depths ranging from 4 m off active river mouths to 10 m on the flanks of the lobes. Widths vary from less than 20 m off river mouths to 700 m in embayments. Low-amplitude offshore bars are recognised on some profile lines - mainly in exposed embayments and on the flanks of lobes. Crests are usually in about 2 m of water and are the result of "normal" storm waves. Outer bars with crests in depths of 4-5 m occur less frequently and are presumably relicts of rare, very high-energy events (profiles 14, 18, 19, 20 in Appendix 2 and figure 13).
Shore-parallel echosounder traverses in water depths of about 3 m show at least three scales of bedforms on the delta top: wave ripples and undulations of two sizes. Of the latter, the smaller have amplitudes of about 0.5 m and wave lengths of 50 - 100 m; they are commonly asymmetrical in cross section but show no preferred orientation. In places these are superimposed on larger, irregular undulations with amplitudes of 1.0 - 1.5 m and wave lengths of 200 - 600 m - possibly storm bars aligned obliquely to the coast.
[TR61 - Roy]

[41]
Delta slopes typically extend to depths of between 20 and 50 m. Average slopes range from 100 off river mouths where progradation is most rapid to 30 or less on delta flanks. Locally, even steeper gradients occur: Off the Lungga and Mberande Rivers they reach 280 and approach the maximum angle of repose for saturated sandy sediment (profiles 21 and 9
respectively in Figure 13 and Appendix 2). Delta slopes appear smooth and featureless in shore-normal profiles; whether transverse scour channels exist is unknown.
The more gently sloping delta toe at the base of the slope zone is a transition with the shelf plain. It is usually quite narrow off active river mouths and in one case (profile 14, Figure 13) it is absent - possibly due to scouring. It widens in embayments and also off former river mouths that are no longer active. This is the case off the northern Mbokokimbo lobe (profiles 2 and 3) where the delta toe is 700 m wide and occupies a depth zone of 15-43 m. Here fine sediments are apparently burying the former delta face.
The Shelf Platform and Outer Reef Zone Water depths over the shelf platform range from about 30-65 m (Figure 11). Its surface,
which slopes gently offshore, is planar to gently undulating; relief increases towards the outer reef zone (profiles 1 and 11, Figure 13). Turner et al. (1977) recognise a number of submarine terraces and shallow channels on its surface. One sinuous channel off the Matepono delta lobe is 1-5 m deep and connects with the head of a submarine canyon beyond the shelf edge (Figure 11). The presence of shelf channels in this area imply scouring bottom currents and offshore sediment transport.
A zone of coral reefs, in part living, extend along the outermost part of the shelf platform (Figure 12). The closest they approach to the coast is about 6 km - a distance probably related to the balance between turbid water discharged from river mouths and its dispersal by ocean currents flowing across the shelf platform. The zone beyond the platform was not investigated in
this study. According to Turner et al. (1977), the shelf break is at about 65 m; beyond this the seafloor slopes steeply (c. 80) into Iron Bottom Sound and Sealark Channel.
[TR61 - Roy]

[42]
Sediment Types on the Delta Front and Shelf
In general terms there are two marine sediment populations on the Lengo platform: calcareous sediments occur on the shelf plain and in the zone of outer reefs; clastic, river-derived sediments are found on the delta front. Seven sediment types (or lithofacies) are reconised based on grain size, mud content and abundance of calcareous material. These are shown in Figures 14 and 15 and on cross-sections in Appendix 2. Their depth ranges are shown in Figure 16.
The uppermost part of the delta front is made up of beach and nearshore sands (unit 1), which are composed of fine to coarse sand and, in places, gravel but with virtually no mud or shell fragments. These sands form a continuous shoreface zone 4-7 m thick extending from the crest of the beach ridges to water depths of 2-5 m offshore (Figure 16). They correspond to the zone of most frequent wave reworking.
Delta front sediments that occur below the zone of active wave stirring (modal wave base) usually are medium to very fine grained and muddy. Termed deltaic sands and muds, they include: clean sand, muddy sand/sandy mud, mud and unsorted fine to coarse sand and muddy sand (units 2.1 - 2.4, respectively, in Figure 14). They occur in discontinuous bands aligned parallel to the coast and generally become more muddy offshore. An exception is unit 2.4 which occurs on the steep front of the Lungga delta and on terraces on its eastern side and between the Ngalimbiu and Matepono River mouths (Figure 14). The sediments are relatively coarse and occur in water depths much greater than do normal delta front sands. The terrace deposits are probably remnants of abandoned delta lobes that have eroded and are now veneered by coarse, winnowed lags. In contrast, the unsorted, coarse sediments on the front of the Lungga delta (e.g., profile 21), are the result of active progradation of material discharged directly into deep water.
The shelf plain, in water depths of 40-60 m, is blanketed by coarse, generally non-muddy, calcareous sand in the east (unit 3.1) and by muddy, fine calcareous sand in the west (unit 3.2)
(Figure 15). The calcareous material is generated in situ on the shelf surface. Mud is supplied as a suspended load by rivers during floods. The lack of mud on the eastern shelf is thought to be due to bottom currents that prevent mud settling and carry it over the shelf edge. Clearly, from the much higher mud content of unit 3.2, current action is less strong on the western shelf.
[TR61 - Roy]


[46]
Sediment Trends
Some sediment properties reflect changing water depth offshore (Figure 17); others vary laterally along the delta front (Figure 18). Figure 17 shows deltaic sediments fining with depth - presumably a function of the intensity and frequency of wave stirring at the bed. Fine to very coarse sands occur on the beaches and subaqueous delta top; the latter commonly also contain a very fine sand fraction. They include abundant gravel around the Lungga delta lobe and to a lesser degree around the mouths of the Ngalimbiu and Mberande Rivers (Figure 18). Below about 10 m, the sand becomes significantly finer (fine to very fine grained). Muds occur in all water depths below about 2 m. Although Figure 17B shows no relationship between mud content and water depth, on individual profiles sediments usually become more muddy away from the coast (Appendix 2).
Delta front sediments are only very slightly calcareous. Figure 17C shows shell content increasing from 0-5% on the delta top to 10-15% on the delta toe. The marked increase in calcareous material below 30 m corresponds to the calcareous deposits (units 3.1 and 3.2) on the shelf plain. Sediments in the west (unit 3.2) contain a mixture of fine sand, shell fragments and mud (Figure 15) (see also Turner et al., 1977). contrast, the eastern part of the shelf plain (unit 3.1) is blanketed by mainly coarse calcareous sand (>80% CaC03) composed of Bryozoa, Halimeda, calcareous algae and Mollusca fragments; mud content is low (0-20%). Coral detritus mainly occurs in the outer reef zone.
Alongcoast trends in the character of the deltaic sediments include a poorly defined coarsening trend towards the west in both upper and lower delta front sediments (Figure 18A). This plot shows no consistent relationship between delta morphology and sediment size - some lobes are coarse (e.g., Lungga, Mberande and Mbalisuna) but others are relatively fine (Ngalimbiu and Mbokokimbo). This may be due, in part, to the wide spacing between samples. Figure 18B shows along-coast variations in mud in the deltaic sediments. A change occurs abruptly off the Matepono River mouth - sediments to the east arc 5-6 times as muddy as those to the west. This discontinuity coincides with a narrowing of the shelf plain where, according to Turner et al. (1977), the head of a submarine canyon approaches within 2 km of the coast (Figure 11).
Although detailed mineralogical studies were not carried out, the cursory microscopic examination revealed a number of characteristic assemblages of minerals and rock fragments in the delta sediments. The assemblages appear to be related to metamorphic and igneous rock types in
[TR61 - Roy]


[49]
Table 5. Relationships between the main non-sedimentary rock types in the hinterland and the characteristic rock and mineral assemblages in the coastal sediments (see Figure 19).
Rock Type Coastal Sediment Assemblage
Diorites A. Quartz + feldspar + light and dark grey rock fragments
Basalts and gabbros B. Multicoloured grains, (minor diorite and partly oxidised: dard metamorphics) green and grey, brown, red,
yellow, reddish-brown (+ minor quartz and feldspar)
Ultrabasics C. Dark green, grey and (minor metamorphics) minor brown grains
Metamorphics D. Chlorite-rich, pale greenish white grains
[TR61 - Roy]


[51]
the river catchments. The relationships are indicated in Table 5 and the distribution of both non-sedimentary rocks in the catchments and sediment assemblages at the coast are shown in Figure 19.
The distribution of sediment assemblages on the delta front can be explained mostly by the nature of the rock types in individual river catchments although alongshore sediment mixing undoubtedly plays a contributing role in some areas. The sharp break between assemblages C and D between the Mbalisuna and Mberande Rivers can be understood solely in terms of the very different lithologies in the river catchments. It also indicates negligible alongshore mixing of sediments. Similarly, in Tenaru Bay, the overlap between assemblages A and B mainly reflects the presence of similar rock types in the catchment of the Ngalimbiu, Tenara and Lungga Rivers, since there is little evidence of littoral drifting of sand along this shoreline (see Figure 8). On the east coast the dominant winter easterlies and north easterlies (Figure 8, inset) undoubtedly cause littoral drifting towards the west and (as discussed below) are thought to be responsible for transferring sand from the Nggurambusu River month to the Mbokokimbo delta lobe. Here, intermixing of sediments from different sources is not seen mineralogically as both catchments have similar rock types.
Stratigraphy of the Coastal Plain
Subsurface data include drilling logs from water wells and bridge foundation test bores and marine seismic data reported by Turner et al. (1977). They are almost entirely restricted to the western and central part of the coastal plain.
The drill holes shown in Figure 20 record a sequence. of clastic sediments described in driller’s logs as clays, silts, muds, sands, and gravels. Their official designations are listed in Table 6. Drill hole locations are only approximately known and heights above sea level were not recorded; in the cross-sections their elevations are interpreted from topographic maps. The presence of shells and hard layers and the colour of the sediment are only occasionally noted in the logs and there is no direct evidence of the age of the sediments - whether Holocene or Pleistocene. However, most of the deeper holes are thought to have intersected the basal Holocene contact overlying a former land surface. It is often indicated in the drill holes by increased hardness, weathering (yellow/brown cplouration) and the occurrence of river gravels. According to the interpretation in Figure 20, the
[TR61 - Roy]


[53]
Table 6. Selected drill holes shown in Figure 20 correspond to the following drill hole designations by the Water Resources section of the Ministry of Natural Resources, Solomon Islands.
Drill hole Numbers
In Figure 21
1 40.38 2 40.82 3 Henderson Field 4 40.57 5 40.42 6 8/81 7 40.56 8 40.66 9 40.67 10 40.62 11 40.92 12 40.95 13 40.93 14 40.101/3 15 7/81 16 4/81 17 40.22
19 40.40
SI Natural Resources
18 5/81
[TR61 - Roy]

[54]
basal surface occurs at depths ranging down to 50 m below ground level (hole s) and slopes gently seawards. It coincides with a hard layer associated with root and grass remains reported by Baker (1950) to occur at c.45 m bsl in a hole drilled near the head of Tenaru Bay (halfway between cross-sections A and B). Immediately offshore, Turner et al. (1977) show a prominent seismic reflector shallowly underlying the shelf plain (Figure 20). According to them the underlying sediments are Pleistocene. They contain a number of channels incised to 60-70 m bsl with complex infill sequences that predate the Holocene phase of delta progradation.
The Holocene sediment wedge includes beach and delta front facies in its seaward part overlain to landwards by alluvium containing coarse channel deposits. Laterally the wedge appears to thicken towards the west from c. 30 m in cross section C to 50 m in cross section A. Although subsurface data for the eastern part of the coastal plain is virtually non-existent, it is probable that the thinning trend continues in this direction. A water bore was drilled at Kula School in Tadhimoko Bay (1.5 km east of Mberande River) but there are no drilling logs. According to Clifford Siria (ex-school principal - pers. comm., 1986), surface muddy sediments less than 2 m thick graded down into old beach sands that extended to about 22 m bsl. Here 5 m of corals and "hard layers" were encountered that possibly mark a Pleistocene land surface that was briefly colonised by reef organisms during the postglacial marine transgression. If, like its western counterpart, the eastern shelf plain also mirrors a prior land-surface then it, extrapolated onshore, defines the base of the Holocene deposits in the vicinity of the Mbokokimbo delta lobe. Figure 24 (discussed later) shows the Holocene deposits here to be in the order of 20-25 m thick, which is in accord with information from the Kula School bore.
Cyclone Namu
Data on Cyclone Namu is drawn from newspaper accounts, published reports and from observations of damage on the Guadalcanal Plains made by the author some weeks after the event (Roy, 1986).
Background
Cyclone Namu ravaged the Solomon Islands - mainly Malaita and Guadalcanal - on Sunday 18th and Monday 19th of May, 1986 and caused the worst (and most costly) destruction in living
[TR61 - Roy]
[55]
memory of the island people (Solomon Nius, 22 May and 11 June, 1986; Fisher, 1986; Jones and Clark, 1986). It left an estimated 90,000 people homeless and 103 dead; 95 of these died on Guadalcanal (Solomon Nius, 11 June 1986). Here the cyclone delivered heavy rain for three. days before storm and hurricane-force winds struck the highlands on May 19th. Winds recorded at Henderson Airport were from the northwest at 30 knots, gusting to 60knots. Waves reported off Honiara were between 1.0 and 1.5 m (Fisher, 1986). In the highlands winds were even stronger and, on steep slopes, uprooted trees loosened the supersaturated soil triggering landslides which deluged the already swollen rivers with debris - mud, boulders, trees, etc. On the morning of the 19th catastrophic floods surged down the valleys of the coastal rivers which burst their banks and spread over the coastal plain (Fiji Times, May 23, 1986). In the highlands whole villages and food gardens were swept away; 38 of the 43 inhabitants of Vaibaibai Village near Gold Ridge lost their lives (Solomon Nius, June 11, 1986). People were reportedly swept down rivers clinging to logs and out to sea where they were rescued by canoes.
In statistical terms, Carter (1986) estimates a 6-year recurrence interval for a cyclone of Namu's intensity but the accompanying flooding on Guadalcanal is thought to be a one in 50 year pheonomenon.
At the height of the flood, rivers rose up to 9 m above their normal level and the whole coastal plain disappeared under meters of flood water (Solomon Nius, June 11, 1986). Huge piles of tree trunks and debris accumulated against bridges and two - those on the Mbalisuna and Ngalimbiu Rivers - were destroyed by the build-up. Bush timber carried to the sea littered beaches, especially on the eastern Honiara shoreline and Ranadi Beach, and ships reported rafts of logs floating in the ocean hundreds of nautical miles to the ESE of Guadalcanal. Henderson Airport was closed to commercial traffic and the runway eventually submerged under 0.5 - 1.0 m of water. High seas and strong winds wrecked a number of boats that broke their moorings off Honiara and threatened the hospital, which was evacuated (Solomon Nius, May 29, 1986).
As the sediment-laden flood waters receded they deposited a meter or more of mud and sand over much of the Guadalcanal Plains burying village food gardens as well as houses, commercial properties and plantations. In a post-cyclone survey, Jones and Clark (1986) identified flood-related phenomena as causing far more damage on the coastal plain than winds or storm waves. Their results indicate that 80% of all gardens and more than 50% of village livestock were lost. Of the village cash crops, cocoa was badly hit but coconut trees suffered only minor wind damage. Flood waters wrecked
[TR61 - Roy]

[56]
a quarter of the village houses and facilities. As a direct result of Namu, the country underwent a severe shortage of food and building materials that lasted for many months (Kieth-Reid, 1986; Jones and Clark, 1986). Costs of rebuilding bridges, schools and plantations, together with lost production through the breakdown of commercial and public infrastructure, has run into many millions of dollars and severely stressed the country's economy (Keith-Reid, 1986; Solomon Nius, June 11, 1986).
Coastal Observations
Access to the coast was mainly by boat, which restricted observations to the shoreline and the lowermost parts of the navigable waterways. Only around Kula School in Tadhimboko Bay was the hinterland inspected on foot. In general, the shoreline showed only minor damage; this was due more to erosion by flood waters than to storm wave attack.
Flood waters that reputedly covered the whole coastal plain for most of Monday 19th May discharged into the sea at river mouths as well as through numerous breaches in the shoreline. The main discharge points are shown in Figure 21 and, not surprisingly, are concentrated near low lying areas - mainly swampy flood channels. Here, as in most parts of the coastal plain, the shoreline is bordered by sandy beach ridges that are slightly elevated above the swampy hinterland. Flood waters that became impounded eventually cut through the beach ridges, undercut trees and, in a number of places, destroyed houses. Ruavatu Mission near the Mbokokimbo River mouth and Suaghi Village near the mouth of the Mbalisuna were damaged in this way (Figure 21).
The eye of Cyclone Namu was located to the southeast of Guadalcanal and, because of this, winds were stronger in the highlands and on the weather coast than on the northern side of the island. This accounts for the relatively minor wind damage to coconut and oil palm plantations on the Guadalcanal Plains and may explain why wave heights offshore, reported to be less than 1.5 m, were considerably lower than predicted by Carter (19%). Debris levels along the coastal plain shoreline accord with storm wave run-up in the order of 1.5 m above msl. Figure 21 shows accumulations of timber at the coast to be more abundant in the west than in the east although the distribution is patchy. At Ranadi Beach, large piles of timber and coarse sediment onlap an erosion scarp indicating that waves caused erosion at the height of the cyclone but this was followed later by a phase. of
[TR61 - Roy]


[58]
accretion - a trend that was generally found to hold where timber had accumulated on the coast. In contrast, the absence of timber usually was found to correspond to scarped beach faces that were continuing to erode. However, nowhere did the coast show signs of large-scale storm recession.
As anticipated from the pre-cyclone survey, the coastal plain rivers displayed a marked difference in their response to flooding in their seaward reaches. In all cases their navigable reaches were greatly reduced after Cyclone Namu (by about half) suggesting substantial sedimentation on the channel beds. Bed sediments were not sampled in sufficient detail either before or after the cyclone to determine whether they had changed significantly; random observations suggested considerable variability within each river. However, distinct differences appear to exist in their suspended sediment loads. Two weeks after the cyclone, type A rivers were still discharging extremely muddy water while type B rivers were much cleaner and were no longer transporting significant amounts of suspended sediment.
The high energy, type B rivers - Lungga, Ngalimbiu, Mberande and Nggurambusu - showed the most dramatic flood effects. There were huge piles of logs up to 3 m high in their lower channels (Figure 21). Zones up to 250 m wide were largely swept clear of vegetation and contained a chaotic profusion of sand and gravel bars 1-3 m in amplitude. Scour holes were infilled with soft mud and overbank deposits up to 0.5 m thick blanketed the adjacent flood plains and extended into the forests. Fallen trees provided evidence of bank undercutting and channel migration. The over-riding impression was of high velocity and extremely destructive flood discharge carrying massive amounts of sediment as evidenced by large river-mouth sand and gravel bars at the coast. Because of the north-westerly winds (and waves), most bars show displacements towards the east relative to the river mouths; the Mbokokimbo and Nggurambusu on the leeward coast are exceptions - they are displaced towards the northwest.
In contrast, type A rivers such as the Tenaru, Matepono, Mbalisuna and Mbokokimbo, suffered far less flood damage in their lower reaches. Undercutting and channel migration was minimal and relatively few trees had fallen. The channels tend to be relatively narrow (c. 50 m or less) and flood discharge was largely through the swamp forests where velocities were reduced by the dense vegetation. Here mud and fine sands were deposited to form generally thin veneers (c. 0.2 m) adjacent to the channel and as thicker (c. 1 m+) deposits in low areas in the forests. However, observations around Kula School and Tivale and Kema Creeks show little sediment on higher, cultivated ground around the villages. That flood flows were relatively slow and non-destructive in type
[TR61 - Roy]

[59]
A rivers is evidenced by the preservation of grass-covered terraces beside the Matepono River and banana palms still growing on the side of the Mbokokimbo River.
Aerial Observations
Observations of the interior of the coastal plain and foothills are based on 35 mm colour
slides taken by hand on the 5th June, 1986 while flying at elevations of 900 to 1200 m. The flight track-chart is shown in Appendix 3. The photo coverage of the coast was good but attempts to follow the river valleys into the foothills was hampered by cloud cover. The Mbokokimbo River was missed completely due to a navigational error.
When the colour slides are projected, the limit of resolution is about 3-4 m: huts, piles of timber and individual large trees can usually be seen. Flow directions of the flood waters could often be determined by debris lines in the flood channels but not on the surface of the flood plain or in the swamp forests. Data from the slides were transferred to copies of the 1984 vertical aerial photographs which cover the coastal plain. Unfortunately the same data were not available for the foothills and, because of this as well as the incompleteness of the photo survey, no systematic data were obtained in this area. The most dramatic effect of Cyclone Namu in the river catchments were the landslides - more than 70 major ones were reported in the headwaters of the Ngalimbiu and Mbalisuna Rivers alone and about 150 for the island as a whole (Jones and Clark, 1986); this is probably a conservative estimate. Timber and debris that these added to the flooded rivers was the principal cause of the destruction of bridges, buildings and crops on the coastal plain. Unfortunately, data to establish relationships between rainfall patterns, the behaviour of individual river catchments and damage on the coastal plain are not yet available.
Because the aerial survey was carried out two and a half weeks after the flood, its impact could only be judged indirectly. Deposits of sediment left on the ground are clearly seen in the slides as a brown colouration in cleared or sparsely vegetated areas but are obscured in oil palm plantations and dense swamp forests. Areas of siltation are shown in Figure 21 in relation to major geomorphic and vegetational features. Also shown are erosional breaches at the coast and log piles on the beaches and in the rivers; the latter are shown diagramatically. Time was not available to "ground truth" the data and it is therefore necessary to make certain assumptions:
[TR61 - Roy]

[60]
1. Obvious areas of siltation on the colour slides indicate relatively thick deposit of sediment, which can be assumed to range from coarse sand and gravel in channels to fine sand and mud in overbank deposits. Areas of "heavy" siltation delineate the main flood pathways on the coastal plain.
2. In most other areas where siltation is not apparent, the flood deposits are thin and fine grained. Presumably in these areas flooding was much less severe.
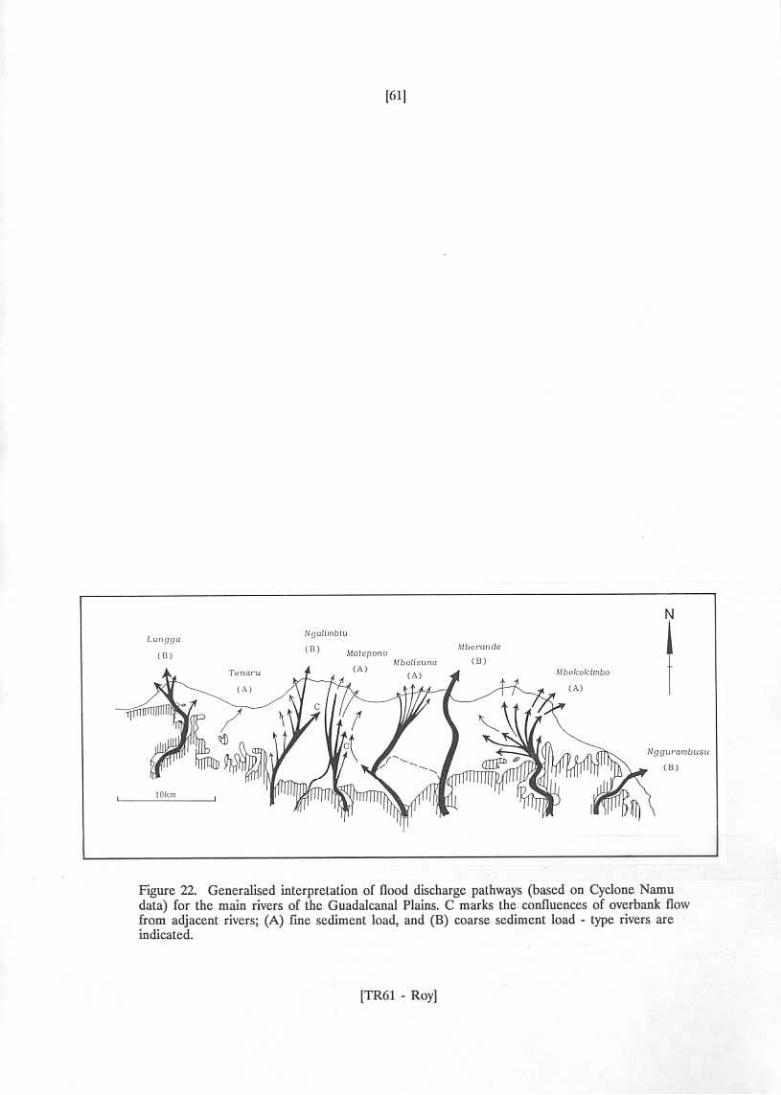
Even though virtually the whole coastal plain was covered by flood waters, local topography and vegetation has served to focus individual river discharges into flood pathways that cut across the coastal plain to the sea. These are shown diagramatically in Figure 22. Some flood pathways closely follow the river's flood channels while others do not. Examples of the former are the Lungga, Nggurambusu and Mberande; are type B rivers. The same generally applies to the Mbalisuna except that where the river makes a sharp right-angle bend, some of its flood waters seem to have diverted to the Matepono. The Ngalimbiu's flood discharge, although concentrated in its flood channel, also spread far beyond it and, like the Mbalisuna, lost some of its flood waters to the Matepono via an intervening creek system (Figure 22). Of all the rivers for which there are data, the Matepono appears to have behaved least conventionally. Despite its relatively small size, the contributions of other rivers have apparently augmented its flood discharge and resulted in very extensive siltation: The Matepono is responsible for the destruction of the country's main rice growing area (Figure 21).
Although photo-survey data are not available for the Mbokokimbo River, it is assumed that the large swamp forest surrounding the river acted as a retention basin for flood waters thus reducing their destructive effect. Certainly, small cultivated areas near the coast show evidence of only minor siltation.
Figure 21 shows that, at the coast, breaching of the beach ridges is concentrated in sectors adjacent to low-lying swampy areas on delta lobes that also correspond to areas of coastal accretion (see below). In contrast, fewer breaches occur where flood plains occur near the coast or the beach ridge plain is wide.
[TR61 - Roy]

[62]
DISCUSSION
Origin of the Lengo Platform and Coastal Plain
Seismic reflection data, (Turner et al. 1977), show a prominent sub-bottom reflector dipping gently seawards just beneath the seabed offshore from the Guadalcanal Plains (Figure 20) and provide strong evidence that the Lengo platform is an old land surface that has been drowned and thinly veneered with recent sediments. Formation of the land surface during "the last low stand of sea level" is suggested by Turner et al (1977). However, we consider it more likely that it represents the surface of a deltaic plain of Last Interglacial age (c. 120,000 - 140,000 yr BP) which has subsided tectonically, been subareally weathered and incised by rivers during the last glacial low-stand of the sea and then drowned by the Postglacial marine transgression (c.17,000-6,000 yr BP).
A rough estimate of long-term subsidence in the coastal plain is in the order of 0.6 m/1,000 yr based on the accumulation of 5 km of sediment in the Mbokokimbo Basin in 8 m.y. (Hackman, 1980). This same subsidence rate, applied to the last 120,000 years accounts for about 70 m of downwarping which accords well with present maximum water depths over not only the Lengo platform, but also the shelf surrounding Florida Island immediately to the north.
The coalescing deltas that make up the Guadalcanal Plains show a comparatively clear, onlapping relationship to the surface of the Lengo platform near the present coast. The Lengo platform itself is presumably made up of successive fluvio-deltaic sequences bounded by erosional unconformities - the product of numerous glacio-eustatic sea level oscillations in the Pleistocene. Further inland in the vicinity of the foothills, erosional events predominate in a terrain that is slowly uplifting. Here Holocene sediments onlap much older land surfaces. The general pattern of Quaternary stratigraphy is illustrated in Figure 23.
Although the field data are insufficient to reconstruct a detailed picture of the evolution of the deltaic plain in the late Holocene, clearly such a reconstruction would incorporate two main components: fluvial sediment inputs and local tectonism.
Holocene coastal sedimentation is represented by a seaward-thickening wedge of fluvio-deltaic deposits that partially overlie the Lengo platform and reach a maximum thickness of about 50 m
[TR61 - Roy]


[64]
beneath the present coast. Present-day sedimentation is represented by a zone of prograded marine, delta-front sands and muddy sands that extend up to 2 km offshore (Turner et al., 1977; and this study) and grade into a thin veneer of prodelta muds. Carbonate sediments that occur on the outer part of the Lengo Platform beyond the limit of deltaic sedimentation presumably thinly blanket the old land surface. Reefs located around its outer edge (Maxwell and Hutcheson Shoals, Tanapari Island and Sealark Reef) have grown in place (possibly on a core of older corals) as the Postglacial sea level rose; the upper parts of these features are Holocene.
In Figure 24 an attempt is made to integrate the morphology and geology of the coastal plain with that of the Lengo Platform. Drilling and seismic data from Figure 21 are used to plot spot thicknesses
of the Holocene deltaic sequence and to infer attitudes of their basal contacts on a number of north-south transects. Evidence of faulting is taken from Figure 5. Although data for the eastern part of the coastal plain is quite poor, the trend previously identified for the Holocene sediment wedge to thin and flatten towards the east, away from Honiara, is generally substantiated.
Ways in which local tectonism may have influenced the Holocene evolution of the coastal plain can only be inferred indirectly. Evidence that may indicate differing styles of tectonism included
1. Faulted contacts occur between the coastal plain and the foothills in some areas but, in others, old
incised landforms have been partially infilled with deltaic sediments but without signs of faulting (Figure 5).
2. A Holocene accretionary sediment wedge that appears to be thickest in the western part of the
coastal plain and thinner in the east (Figure 24).
3. A predominance of swamps in the eastern part of the coastal plain and in the valleys of the
adjacent foothills (presumably indicating low-lying land) compared to somewhat higher and better drained land in the west.
4. A progressive widening towards the east of the Lengo platform is interrupted by an abrupt
narrowing offshore from the mouth of the Ngalimbiu River. This shelf discontinuity corresponds to the head of a submarine canyon and may be in line with a NW-SE fault that, in part, controls the course of the Mbalisuna River (figure 24).
[TR61 - Roy]


[66]
These disparate phenomena can perhaps be explained by different deformational styles as illustrated in Figure 25 Downwarping in the west and faulting (possibly with a slight reverse tilt) in the centre and east. The implication here is that tectonism has operated over Holocene time spans.
Tectonic instability in northern Guadalcanal undoubtedly has also influenced contemporary sedimentation at the coast. Studies in relatively stable areas such as southeastern Australia indicate a stillstand of the sea since the end of the postglacial marine transgression about 6,500 years BP (Thom and Roy, 1984). Over this same period, the Lengo platform has probably subsided tectonically 2-3 m. Thus seaward progradation of the deltaic plain has been accompanied by aggradation of its surface. The aggradation possibly accounts for its relatively thick cover of flood plain alluvium and the occurrence of beach deposits only near the present coast. The tendency for the seaward margin of the deltas to subside promotes coastal erosion in areas of slow delta growth between active distributary channels, especially where sand is also being removed by littoral drift.
Historical Shoreline Changes
Changes in the position of the deltaic shoreline of the Guadalcanal Plain over recent historical times have been measured from aerial photographs flown in 1944 and 1984. These cover the central and western delta. For the eastern delta, less precise data come from comparing the 1976 map (which is based on 1962/3 air photos) with the 1984 photographs. The various shoreline positions are indicated on Figure 6. The accuracy of most measurements are in the order of + 10-20%.
The results, in terms of total shoreline displacement (normalised to the 40 year period) are shown diagramatically in Figure 26. All delta lobes have prograded - many hundreds of meters in the case of
the Mbokokimbo, Ngalimbiu and Mberande, hut much less for the Lungga, Tenaru, Matepono and Nggurambusu. There is also evidence of accretion on the northern coast of the Mbokokimbo lobe, even though former river mouths in this area are shown to have been abandoned by 1962/3. Presumably this is the result of the converging littoral drift systems shown in Figure 8.
Changes around the mouth of the Nggurambusu River and along the far eastern delta coast are
very small. Here, the coast is fully exposed to easterly waves that wash littoral sand towards the
[TR61 - Roy]


[69]
northwest. Living coral in fringing reefs and islets immediately south of the river mouth attest to clean water conditions, presumably maintained by a persistent current flowing to the northwest. The present coastal alignment is tied to Pleistocene limestones that crop out on the beach 4 km north of the river month (Figure 26).
Figure 26 also shows areas of coastal erosion between the delta lobes. The most pronounced erosion is in the eastern delta adjacent to the main areas of accretion. According to local reports, coastal recession in Tadhimboko Bay just east of the Mberande River month completely destroyed at least one village in historical times (P. Nanau, pers. comm., 1985). In the head of the bay small patch reefs are presently growing. These provide evidence of relatively clear water conditions and erosional, rather than depositional, conditions at the coast. A similar argument can be applied to the western side of the coastal plain. Like its eastern counterpart, the presence of living corals fringing the Honiara shoreline attest to relatively clean water conditions and indicate that currents here flow mainly eastwards, towards the Lungga River mouth. Ranadi Beach on the western side of the Lungga delta lobe has eroded at rates of 1-2 m/yr over the last 40 years (Howorth, 1985); a trend possibly aggravated in recent years by quarrying sand and gravel from the beach. Ranadi Beach and the back-beach area are composed of coarse sand and gravel - the product of the Lungga River, but with the finer material winnowed-out by wave reworking. Offshore from the receding beach is a submarine terrace 3-5 m deep and 100-200 m wide (profiles 22 and 23, Appendix 2). This is interpreted as the base of the erosion zone. Similar, but considerably wider, terraces extend along the eastern flank of the delta plain between the Nggurambusu and Mbokokimbo Rivers (profiles 5, 6, and 7 in Appendix 2) and on the eastern side of the Lungga delta lobe. In all cases erosion is confined to a shallow depth zone
(<c. 5 m) and thus represents a relatively small volumetric reduction (c. 7%) in overall delta growth. Erosion is presumably due to wave action; however, the precise mechanisms and sediment dispersal paths are not well understood.
The indicated shoreline changes in Figure 26 can be expressed volumetrically by including the thickness of the prograding delta. This corresponds to the delta front zone delineated previously in morphological and sedimentological terms. Table 7 shows the delta thicknesses adopted to estimate total (net) accretion over the historical period as well as average rates of progradation for individual delta lobes.
[TR61 - Roy]


[71]
Table 7. Delta lobe accretion based on shoreline changes measured from aerial photographs in 1944 and 1984 for all rivers except the Mbokokimbo and Nggurambusu Rivers. These have data sets for 1962 and 1984 and their changes (shown in brackets) have been normalised to a 40-year period for comparison with the other rivers. Delta thicknesses are from offshore survey data.
Change in delta Thickness of Total net Average delta area (m) delta lobe accretion annual
-ve decrease zone) (m) (m x 10) River +ve increase and (erosion (m x 10) accretion
1. Lungga + 110,000 60 + 6.22 155
2. Tenaru "no change"
3. Ngalimbiu + 225,000 30 + 6.63 166
4. Matepono + 86,000 23 + 1.98 49
5. Mbalisuna + 106,000 30 + 2.98 75
- 76,000 (5)
- 24,000 (5)
- 40,000 (5)
- 168,000 (5)
(-100,000) (5)
6. Mberande + 217,000 28 + 5.23 131
7. Mbokokimbo (+ 325,000) 30 (+ 9.25) 420
8. Nggurambusu "no change"
[TR61 - Roy]

[72]
Some idea of the reliability of the values in Table 7 can be obtained from engineering calculations of sediment discharge in the Lungga River that were made by Preecen et al. (1977) in a feasibility study for a proposed dam on the river 22 km inland from the coast. Using various sediment transport formulas they predicted sediment trapping by the dam of 117,000 m/yr assuming only sediment 2 mm and finer was transported. The dam calculations are for 96% of the rivers catchment - for the total catchment, the sediment discharge would be almost 130,000 m/yr. This figure is only 16% under that calculated from historical coastline changes (155,000 m/yr) - a surprisingly good agreement (considering the very different approaches) and one that may even be closer if gravel-size material, which clearly is discharged at the river mouth, had been included in the engineering calculations.
The volumetric changes shown in Table 7 are summarised in Figure 27, which highlights apparent discrepancies between rates of progradation of some of the delta lobes and river size (as expressed by catchment area). In particular, the Mbokokimbo has grown extremely rapidly while the reverse is true for the Lungga and Nggurambusu delta lobes. The remaining rivers, except for the Tenaru, have similar catchment sizes and show a relationship between delta growth and river type: type B rivers have prograded about twice as rapidly as type A rivers.
The same trends are illustrated in Figure 28A where growth rates at individual river mouths are plotted against catchment areas. While some rivers show a consistent relationship, - more rapid progradation with increasing river size - others clearly do not. To some extent these anomalies are resolved by combining adjacent rivers into four composite delta lobes that correspond to the main coastal promontories of the Guadalcanal Plains (Figure 28B):
The Lungga (1),
The Ngalimbiu and Matepono Rivers (3 4), The Mbalisuna and Mberande Rivers (5 6) and
The Mbokokimbo and Nggurambusu Rivers (7 8)
(Because of its small size and intermediate position between two promontories, the Tenaru River is not included in Figure 28B).
The combination of the Mbokokimbo and Nggurambusu Rivers fits the trend line in Figure 28B and supports the conclusion that sediment is transported alongshore from the Nggurambusu and added
[TR61 - Roy]


[74]
to the Mbokokimbo delta lobe. The contributions of sediment from each river, based on the theoretical trend line in Figure 28A are about 320,000 m/yr for the Mbokokimbo and 100,000 m/yr for the Nggurambusu. The implication is that the average littoral transport rate along the eastern delta coast is in the order of 100,000 m/yr. According to the prevailing weather patterns, this occurs mainly in winter (May-October, Figure 8).
The displacement of composite lobe 5 + 6 (Mbalisuna and Mberande rivers) to the left of the trend line on Figure 28B indicates a growth rate somewhat slower than predicted from relative catchment size. The discrepancy is in the order of 40,000 to 50,000 m of sediment annually. Conceivably this may be the result of diverting some of the Mbalisuna's flood discharge into the Matepono (river 4) as was exemplified during Cyclone Namu (Figures 21 and 22).
Future Development of the Guadalcanal Plains
Future development of the coastal plain can be considered in two categories: industrial/commercial and agricultural/social. Each category is influenced by somewhat different geological factors.
Commercial/Industrial Developments
Honiara, the commercial and industrial centre for the Solomon Islands, is sited on a narrow
coastal strip bordered by the sea on one side and a maze of gullies and steep-sided ridges on the other. There is no room for industrial expansion in the present city limits and the nearest areas of flat land are on the Lungga delta at the western end of the coastal plain. Already, a number of industrial estates have spread onto the beach ridge plain at Ranadi Beach and the international airport is sited on the flood plain to the east of the Lungga River.
During 1985, a number of new developments were being contemplated for the Lungga delta lobe
(Figure 29). However, after the experience of Cyclone Namu the location of some, in particular those sited in the flood channel of the Lungga River, need to be reassessed. The village resettlement and the
[TR61 - Roy]


[76]
hotel and tourist development are both potentially vulnerable to flooding. In addition, the outer part of the delta lobe may be subject to earthquake damage (Tickell, 1985). Unlike the rest of the coastal plain, which has been built upon the shallow Lengo platform, the Lungga delta has prograded into deep water and has submarine slopes sufficiently steep that an earthquake could trigger slumping and liquifaction.
Geological conditions elsewhere on the Lungga delta and its associated flood plain seem more suitable for development. The Ranadi beachridges are underlain by a thick sand sequence providing relatively firm foundation conditions and, as Cyclone Namu showed, the area is not affected by destructive flooding (Figure 21). Coastal erosion is a factor (Howorth, 1985) but adverse effects can be mitigated by establishing set-back lines and controlling gravel extraction.
The flood plain to the east of the Lungga River and north of the airport possibly has greatest potential for future development in terms of area available (c. 4.2 km) and accessability to Honiara. However, like most deltaic deposits, the subsurface is made up of a mixture of sands and muds that are only partially consolidated; foundation conditions for each development therefore need to be investigated thoroughly. The coast and offshore seabed are composed of coarse sands which probably will provide a suitable substrate for structures and pipelines associated with the proposed fuel depot and offshore terminal (Carter, 1986). Although the area suffered short-term inundation during Cyclone Namu, destructive flooding and heavy siltation did not occur (Figure 22). However, before the area is developed, consideration should be given to flood mitigation works in the area (Carter, 1986). The foothills that constrict the Lungga channel just upstream of the bridge undoubtedly impede flood discharge and, in conjunction with a log-jam at the bridge itself, raised flood levels during Cyclone Namu to the point that the airport was submerged. It may be feasable to excavate a flood overflow channel through a natural low area that exists to the south and east of the airport (Figure 29). This would divert flood waters so that they discharge into the sea well to the east of the present river
mouth. Naturally the feasibility and cost/benefit of this or other works would need careful study.
Agricultural and Social Developments
Plans for future developments on the rest of the Guadalcanal Plains are not specifically known, however past trends indicate that more land is likely to be cleared for commercial plantations. While it
[TR61 - Roy]

[77]
is not the purpose here to address commercial, political or social factors attending these changes, the geological study does identify a range of physical matters that planners need to consider. These include: firstly, the variable nature of the coastal plain and its suitability for various forms of development and secondly, the impact of flooding in relation lo forest clearing and the security of villages on the coast.
The vegetation patterns in 1984 (Figure 9) show that most clearing in the past has taken place on the flood plains of the rivers. The largest areas of natural (or semi-natural) vegetation remaining on the coastal plain lie to the east of the Mberande River. The geological interpretation (Figure 5) indicates that depositional environments here may be less suitable for plantation style development than the areas already cleared further to the west; the Mberande River is bordered by broad alluvial fan deposits while the Mbokokimbo discharges through extensive coastal swamps. The very different flood behaviour of these two environments will undoubtedly influence future development. There seems little that could be done to mitigate the high-energy, destructive flooding of the Mberande River except perhaps to increase vegetation cover on the fan deposits. Certainly to allow more clearing here would be detrimental. On the other hand, there may be more potential to expand agriculture in the Mbokokimbo coastal swamp
by carrying out drainage works and selecting suitable crops to withstand the swampy environment (e.g., rice or high quality rainforest timbers).
To construct drainage canals would undoubtedly be expensive and may not even be feasible in some areas if the natural terrain is as flat as this study infers. Also, because of the high littoral drift rate along the northeastern coast, man-made canal outlets to the sea could only be maintained here with extreme difficulty. Alternatively, it would be preferrable to connect drainage systems to natural creek and river mouths (e.g., the present Mbokokimbo mouth or its former mouths at Tivale and Kema
Creeks) or to site a new outlet at the littoral drift divide in Tadhimboko Bay (Figure 8).
Occasional severe flooding is one of the major natural constraints on both present and future coastal plain developments. The flood channel zones are the areas of prime risk and their general correspondence with the flood pathways followed during cyclone Namu (Figure 21) highlights the danger of developing in these zones. This is exemplified by the almost complete destruction of Selwyn College by the Namu flood (Solomon Nius, 11 June 1986). The college was built on a levee bank within the flood channel zone of the Ngalimbiu (Figure 6). Past clearing of the natural vegetation growing in the flood channels is likely to have increased flood velocities and sediment scour as well as allowed fallen
[TR61 - Roy]

[78]
bush timber to be carried from the foothills across the coastal plain and to endanger bridges, buildings, etc Removal of the forest beside the flood channel zones also allow high-velocity flood waters to spread out across the adjacent flood plains and to cause more damage to crops and houses than would otherwise occur. Extensive siltation on the flood plains of the Ngalimbiu and Matepono Rivers may in large part be attributed to heavy clearing in, and beside their flood channels.
The phenomenon of flood waters breaching the beachridges at the coast has the potential to cause considerable damage and human suffering if coastal villages are wrongly sited. That this type of damage during Cyclone Namu was apparently quite limited is probably due to the custom wisdom of the villagers. However, with the recent experience of Namu, there is undoubtedly the potential to improve the security of some settlements by means of low-level engineering works, such as channels and embankments, tree planting, etc.
[TR61 - Roy]
[79]
CONCLUSIONS
The broad pattern of Quaternary sedimentation on the Guadalcanal Plains seems to be for
separate bodies of fluvio-deltaic sediment to be laid down each glacial/interglacial cycle. Prograded delta lobes formed at high stands of the sea, later were stranded when sea level fell and rivers cut to new base-levels. The locus of sedimentation then shifted downwards and seawards, but reversed with the next marine transgression. Superimposed on these relatively rapid fluctuations are regional tectonic trends which are an order of magnitude slower - in this case subsidence in the north and uplift in the south. The result is for successive interglacial deposits to be superimposed those of Holocene age overlie their late Pleistocene counterparts, which have subsided over the intervening 100,000 + years. In cross-section the individual sediment bodies tend to be wedge-shaped, thickening towards the sea.
The Holocene (and most recent) delta complex extends over a land area of about 265 km, and is made up of interbedded muds, sands and gravels that reach thicknesses of 25-50 m at the coast and extend offshore 1-2 km as subaqueous, delta front deposits. Beyond this the Lengo platform - the surface of a former delta plain - is thinly mantled with calcareous sediments. Coral reefs occur along its remote northern margin, and its outer surface is apparently swept clean of mud by ocean currents. Generalised patterns of deposition and sediment dispersal are illustrated in Figure 30.
Although eight rivers contribute material to the delta plain, their sediments become intermixed to varying degrees through the action of overbank flood flows and littoral drifting along the coast. Figure 30 depicts the tendency for adjacent bodies of river sediment to coalesce with the result that, at the present coast, there are now four composite delta lobes prograding at rates of up to 14 m/yr. On average, about 1 million m of sediment is added to the delta fronts each year but, as Cyclone Namu demonstrates, the rates of supply must be highly variable. Nor is the sedimentation evenly distributed; an estimated 65% is concentrated in the eastern part of the delta plain between the Mbalisuna and Mbokokimbo River months. This corresponds spacially to the widest part of the Lengo shelf platform and also, according to Hackman (1980), to the thickest part of the Neogene sequence in the Mbokokimbo Basin. Clearly the present-day focus of sedimentation in northern Guadalcanal mirrors
similar patterns in the past.
[TR61 - Roy]


[81]
Reasons for this trend are far from clear. Variations in tectonism within the coastal plain are
suspected. However it is postulated that external dynamic factors are more likely to influence the composition and growth rates of the delta front deposits. The Florida Islands lie to the north of the Guadalcanal Plains and provide some protection to the eastern delta from long-period storm waves approaching from open sea areas to the northwest and east. Figure 18 shows that the eastern delta
front sediments are much more muddy and somewhat finer grained than those in the west. Possibly this distribution arises through waves reworking and winnowing the western delta front deposits which tend to lose fine sediment to deeper water offshore (Figure 30). In contrast, suspended sediments discharged at the mouths of the Mbalisuna, Mberande and Mbokokimbo Rivers in the east tend to be "trapped inshore and re-incorporated into the subaqueous delta front deposits which, with the added sediment,
prograde relatively rapidly.
On a coast-wide scale, net littoral sand movements in northern Guadalcanal tend to be convergent
along the eastern and western flanks of the delta plain. Within the delta itself, there is little morphological or mineralogical evidence for net alongshore transfer of material between the composite delta lobes. This presumably means that potential gold-bearing sands deposited at the mouth of the Matepono River will have remained essentially in place. Although no new data on their mineral contents were obtained for this report, clearly their prospectivity warrants further investigation.
The experience of Cyclone Namu shows that, of the various coastal plain environments, the flood
channels of the main rivers are the most dynamic and potentially dangerous; they also present the greatest challenge for improving the island's system of communications and transport. The different morphologies and flood regimes of type A and B rivers are largely due to the presence in the former (the Matepono, Mbalisuna and Mbokokimbo) of coastal swamps that absorb much of the flood discharges. This is not the case with type B rivers (the Lungga, Ngalimbiu, Mberande and Nggurambusu which carry a much coarser sediment load and flood more destructively. The underlying causes for these differences are not well understood. All except low-level developments in flood channels, especially those of type B rivers, should be avoided where possible. Their deforestation in the
past has almost certainly increased the severity of flood damage and the possibility of replanting these areas, possibly using commercially useful species, should be considered.
[TR61 - Roy]

[82]
The present-day delta sediments originated through erosion of older fluvial deposits in the foothills and young island arc volcanics in the interior of the island. This highly immature material weathers
rapidly in the tropical climate and produces some of the richest soils in the country. The most easily cultivated parts of the Guadalcanal Plains are the flood plain environments and these are almost completely cleared of native forests. They are now used mainly for western-style mono-cultures - oil palm, coconut and rice. This form of land use plays an important role in the country's economy but may be more vulnerable to natural disasters (e.g., Cyclone Namu flooding of rice areas) than are less centralised farming techniques. For this reason, the expansion of plantation type farming into other coastal plain environments needs to be carefully considered in the constantly changing context of local and world economics. This applies especially to areas of coastal swamp on the Mbokokimbo delta lobe. This environment is much less amenable to western farming techniques than are the flood plains but, on
the other hand, may have enormous potential for supplying increasingly rare rainforest products and for tourism providing both are carried out in an environmentally sensitive fashion.
Clearly, the limited data available to this survey make many of its findings highly speculative. In particular, detailed studies of the rivers are needed to evaluate differences in their flow regimes and morphologies - a prerequisite for devising strategies to cope with their flood channel zones. Land use surveys of the large coastal swamps, especially those around the Mbokokimbo River, should also be undertaken with a view of assessing their long-term value in environmental, human and commercial terms. Finally, it would seem appropriate to identify vulnerable sites on the coastal plain (such as
coastal villages and areas near Honiara that are likely to be developed) while the experience of Cyclone Namu is still relatively fresh in peoples memory and to devise ways of mitigating the impacts on them
of future floods.
[TR61 - Roy]

[83]
REFERENCES
Baines, Graham, 1986: Guadalcanal Plains development area. Discussion paper, Ministry of Natural Resources, 6 June, 1986, 3 pages, (unpublished).
Baker, R.C., 1950: An occurrence of saline ground water in Guadalcanal, Transactions of the American Geophysical Union, 3: 58-60.
Carter, R., 1986: Baseline oceanographic data collection and analysis from off Lungga Point in Tenaru Bay, Guadalcanal, Solomon Islands - Hurricane and Flooding Frequency in the Lungga Delta area. CCOP/SOPAC Technical Report 67: 17 pages, 11 figures.
Coleman, P.J. and Kroenke, L.W., 1981: Subduction without volcanism in the Solomon Islands arc. Geo-Marine Letters, I : 129-134.
Fiji Times, Friday May 23, 1986, Namu kills 71 in Solomon Islands, Page 1.
Fisher, N.K., 1986: Tropical Cyclone Namu, preliminary report, 9pp, Solomon Islands Meteorological Service, Ministry of Posts and Communications, Honiara, Solomon Islands, 23 September, 1986, (unpublished).
Hackman, B.D., 1980: The geology of Guadalcanal, Solomon Islands, Overseas Memoir, Institute of
Howorth, R., 1985 Report on visit to Honiara, Solomon Islands 2-9 September, 1985 Ranadi Beach
Geological Sciences, 6 115 pages.
Study, Honiara, Solomon Islands. CCOP/SOPAC Trip Report 21: 11 pages, (unpublished).
Jones, S. and Clark, S., 1986: Report on the Post-Cyclone Survey. Draft Report prepared for the National Disaster Council, Solomon Islands Government, Honiara, November, 1986.
Keith-Reid, R., 1986, Solomons face the task of rebuilding. Cover story, Islands Business, Volume 12, Number 6, June 1986: 11-13.
Kroenke, L.W., 1984, Solomon Islands: San Cristobal to Bougainville and Buka, Ch. 4, in Kroenke, L.W., (ed.), Cenozoic tectonic development of the southwest Pacific: UN ESCAP, CCOP/SOPAC Technical Bulletin 6 47-61.
Landmesser, C.W., 1977, Evaluation of potential hydrocarbon occurrence in the Solomon Islands, South Pacific Marine Geological Notes, 1(5): 47-53, CCOP/SOPAC Technical Secretariat, Suva.
Preece, Caden and Rider, 1977, Report on the feasibility study for the Lungga-hydropower project, Solomon Islands.
Roy, P.S., 1986, Geological impacts of Cyclone Namu on the coastal plain of Guadalcanal, Solomon Islands, June 1986. CCOP/SOPAC Trip Report 22: (unpublished).
Solomon Nius, No. 24, 22 May, 1986.
[TR61 - Roy]
[84]
Solomon Nius, No. 25, 29 May, 1986.
Solomon Nius, No. 26, Special Disaster Issue, 11 June 1986.
Thom, B.G. and Roy, P.S., 1985, Relative sea levels and coastal sedimentation in southeast Australia in the Holocene. Journal of Sedimentary Petrology, 55(2): 257-264.
Tickell, S.J., 1985, Geology of the Honiara urban area: Report, Geology Department, Ministry of Natural Resources, Honiara, Solomon Islands, 41 pages, (unpublished).
Turner, C.C., Eade, J.V., Danitofea, S. and Oldnall, R., 1977, Gold bearing sediments on the continental shelf, northern Guadalcanal, Solomon Islands. South Pacific Marine Geological Notes Volume I , Number 6: 55-69, CCOP/SOPAC Technical Secretariat, Suva, Fiji.
[TR61 - Roy]

[85]
APPENDIX 1
PROGRAMME ELEMENT: CCSP/SI-25, COASTAL AND NEARSHORE MAPPING
Objectives
1. To describe the geology and morphology of sedimentary deposits in coastal and nearshore zones of areas extending over many tens to hundreds of square kilometers.
2. To make assessments of potential mineral resources (such as construction material, phosphate, detrital minerals etc.) in the sediments.
3. To provide a scientific framework within which to evaluate broad geological trends, identify areas of particular environmental sensitivity and assess future coastal developments.
4. To develop an understanding of the country's recent geological evolution and to relate this to present-day sedimentation trends, especially those related to coastal erosion.
5. To train local geologists in techniques of regional coastal and nearshore mapping and resource assessment.
Tasks
1. Interpret the patterns shown on aerial photographs of coastal and shallow nearshore areas in geological and morphological terms.
2. Carry out geological field work to check the air photo interpretation and determine the morphology, type and distribution of the sedimentary deposits.
3. Prepare maps and reports describing the geology, geomorphology and mode of formation of coastal and nearshore land forms.
4. Make preliminary assessments of mineral resource potential, and identify factors of environmental importance.
5. In collaboration with representatives of the country, identify particular problems concerning mineral resources, future developments or the environment and design detailed, site-specific studies to address the problems.
Modus Operandi
As envisaged here, coastal and nearshore mapping is a reconnaissance technique. It employs relatively simple and rapid field sampling methods linked to the interpretation of aerial photographs. The field
[TR61 - Roy]

[86]
work can be expected to take 2 to 3 times as long as the air photo interpretation; data analysis and reportage requires at least twice as much time as these two together.
More sophisticated, time consuming and expensive techniques - seismic, sidescan sonar, vibrocoring, drilling and environmental measurements - are more appropriately applied to detailed studies of relatively small areas. However, without some subsurface information provided by techniques such as these, it is impossible to validate the reconnaissance mapping or extend the results much beyond the theoretical level.
CCSP/SI-25: Job Sheet November/December 1985
To carry out Quaternary Mapping and Resource Assessment of the deltaic plain and adjacent offshore area - north central Guadalcanal.
The work will contribute to the following projects:
CCSP/SI-25 Coastal and Nearshore Mapping - north central Guadalcanal.
CCSP/SI-5 Detrital gold in Beach and Nearshore Areas of North Central Guadalcanal.
CCSP/SI-17 Inshore studies related to coastal development (the effect of mining construction materials at Ranandi Beach).
CCSP/SI-20 Investigation for construction materials in Honiara Bay and its effect on the coastal environment.
Specific Objectives
1. To produce a map based on an interpretation of aerial photographs of the main depositional environments of the coastal plain extending from Honiara eastward to Nggurambusu River and inland to the foothills.
To carry out field checking of selected features to verify the airphoto interpretation.
To map the distribution of sediment types on the delta front in water depths ranging down to 60 m and relate the sediment distribution to seabed morphology.
To collect and analyse representative samples from all depositional environments to assess detrital mineral content and io delineate sediment transport pathways.
To report on the sand and gravel resources in beach, river and, nearshore environments of the Lungga delta near Honiara.
To make a preliminary evaluation of the Lungga delta as a potential site for development (airport extension and industry and resort development) in terms of the likelihood of coastal erosion, flooding storm effects and foundation conditions.
2.
3.
4.
5.
6.
[TR61 - Roy]

[87]
7. To assess the coastal sediment budget of the Lungga delta under present day conditions and consider whether, by damming the river and reducing the supply of sediment to the coast, shoreline erosion will increase significantly.
Devise a preliminary geological model of deltaic sedimentation in North Guadalcanal during the late Cainozoic and relate it to current ideas on tectonic and eustatic movements of relative sea level.
8.
Methods
1.
2.
Interpretation of 1984, 1:25000 aerial photographs.
Field inspection of beaches, river bank exposures and hand augering to sample the shallow subsurface.
Compile data from past water well drilling.
Select sites and geological targets for future deep drilling using MRD percussion rig.
Collect surface sediment samples offshore using pipe dredge, and if possible, a diver operated suction corer. Sampling traverses to be oriented shore-normal and spaced 1.0-1.5 km apart or as indicated by geological factors.
Carry out echosounding and relate samples to bottom morphology.
Compile historical data on shoreline and river channel changes, and on flooding using local records and comparison of airphotographs and beach profiling (this is to be carried out as part of the coastal mapping workshop in June 1986).
3.
4.
5.
6.
7.
Sample Processing
1. Small (200 gm) sub samples of all samples to be sent to Fiji for grainsize and microscope analyses. Field descriptions to be made in the field and in Honiara by local geologist.
Bulk sediment samples to be weighed, sieved to remove gravel, and carefully panned at the Geology Division in Honiara to obtain an initial concentrate. Magnetic minerals to be separated out and weighed. The non-magnetic concentrate to be sent via CCOP/SOPAC for detailed mineral identification and assessment by outside consultant.
If possible, organic material for radiocarbon dating to be collected to establish an absolute time frame for delta evolution. Age dating to be carried out under contract.
2.
3.
[TR61 - Roy]

[88]
CCSP/SI-25: Job Sheet June 1986
General Objective
To inspect storm damage caused by Cyclone Namu in north central Guadalcanal.
Justification
The work will contribute to existing projects.
CCSP/SI-25 Coastal and Nearshore Mapping - north central Guadalcanal.
CCSP/SI-17 Inshore studies related to coastal development.
This activity was initiated in response to Cyclone Namu (May 20 1986) which caused extensive damage to the coast and deltaic plain of north central Guadalcanal. Coastal and nearshore mapping was carried out in the area in November - December 1985 and provides pre-cyclone baseline data against which to assess geological changes caused by the cyclone.
The comparative study will contribute information relevant to planning future coastal developments and extend understanding of how coastal and river systems in this area change during extremely violent events.
Specific Objectives
1.
2.
Compile information on waves, winds, storm surge, set up and flood levels and velocities.
Obtain local informaition on cyclone event - wave heights, water levels, extent of salt water intrusion etc.
Record changes to coastline and rivers, extent of overbank deposition on the coastal plain, landslides and depositional and erosional trends in the river valleys.
3.
Methods
1.
2.
Carry out low level ,aerial photography of coastal plain and river valleys using hand held cameras.
Compile data on river channel and coastal changes and sedimentation patterns on maps to compare with earlier data sets.
Inspect the coast and lower parts of the river channels using a local boat and crew.
Obtain information on weather conditions during the cyclone.
3.
4.
[TR61 - Roy]

[89]
APPENDIX 2
Marine survey coverage of the seabed off the Guadalcanal Plains, Solomon Islands showing echosounder track lines and sediment sampling sites. Positioning was by a combination of dead reckoning and sextant bearings. The data was collected in the periods 11 to 13 September, 1985 and 28 November to 6 December, 1985.
Cross sections 1 to 24 show seabed morphologies, sediment sampling sites and the distribution of surficial sediment types along shore-normal survey lines. The local tidal range is about 0.4 m. Water depths were recalculated to tide datum (approximate Indian Spring Low Water at Honiara) using the predicted tide tables for Mbugana Island to Florida Island.
[TR61 - Roy]

[91]
APPENDIX 2A. (In pocket) Guadalcanal Coastal Plain - showing offshore survey tracklines and sampling sites.
[TR61 - Roy]

[93]
APPENDIX 2B. Cross sections showing seabed morphology and sediment types.
[TR61 - Roy]