Embed Size (px)
Citation preview
JOURNAL OF MECHANICS OF MATERIALS AND STRUCTURES
Vol. 3, No. 7, 2008
QUASISTATIC DEFORMATION AND FAILURE MODES OF COMPOSITESQUARE HONEYCOMBS
BENJAMIN P. RUSSELL, VIKRAM S. DESHPANDE AND HAYDN N. G. WADLEY
Carbon fibre epoxy matrix composite honeycombs have been fabricated by slotting, assembling andadhesively bonding composite laminate sheets with various fibre architectures. Their out-of-plane com-pressive and in-plane shear responses were measured as a function of relative density, ratio of the cellheight to width and the number of cells in the specimen. The measurements indicate that the response isrelatively insensitive to the ratio of the cell height to cell width and number of cells in the specimen butis strongly dependent on the laminate type and fibre orientation. For example, the compressive strengthof the honeycombs made from 0 − 90◦ laminates with fibres aligned with the compression direction wasgreater than that of honeycombs made from a woven material with fibres at ±45◦. However, the shearstrengths exhibited the opposite trend. These differences were attributed to a change in failure mode. Incompression the honeycombs failed by either elastic buckling or plastic microbuckling while in shear thetwo main failure modes were elastic buckling or shear failure of the composite sheet material. Analyticalmodels are derived for these collapse modes and used to predict the strength of the honeycomb structure.The predicted strengths are substantially higher than the measurements due to the presence of manufactur-ing imperfections in the honeycombs that are not accounted for in the analytical models. A limited finiteelement (FE) investigation is also reported to quantify the effects of imperfections on the compressivestrength of the composite honeycombs. The measurements and analytical predictions reported hereindicate that composite cellular materials such as honeycombs reside in a gap in the strength versusdensity material property space, providing new opportunities for lightweight, high strength structuraldesign.
1. Introduction
The failure strength of sandwich panel structures depends upon many factors including the strength andthickness of the face sheets, the core topology and the parent material. A variety of polymeric foamsand honeycombs are used for the cores of stiffness dominated designs. The need for higher strength,impact energy dissipating structures has stimulated the development of stronger metallic foams, see forexample [Ashby et al. 2000]. These are mostly produced by the introduction of gas bubbles into the metal[Wadley 2002]. The bubble expansion process leads to random cellular structures, and minimization ofsurface energy leads to a low nodal connectivity, with typically three to four struts per joint. The resultingmechanical properties are far from optimal due to the fact that the cell walls deform by local bending[Deshpande et al. 2001a]. This led to a search for open-cell microstructures which have high nodalconnectivities and deform by the stretching of constituent cell members, giving a much higher stiffnessand strength per unit mass. These cellular solids, known as lattice materials — a term we define to
Keywords: mattice materials, composites, microbuckling, honeycomb, carbon fiber, carbon fibre.
1315
1316 BENJAMIN P. RUSSELL, VIKRAM S. DESHPANDE AND HAYDN N. G. WADLEY
mean any micro-architectured cellular solid with straight webs or struts — have a stiffness and strengthwhich scale linearly with relative density ρ; in contrast, the Young’s modulus and yield strength ofmetallic foams scale with ρ2 and ρ3/2, respectively. An example of a lattice material is the octet-trussstructure with a face-centred cubic microstructure [Deshpande et al. 2001b]. Its joint connectivity is12, and this spatially periodic material has the feature that the cell members deform by local stretchingfor all macroscopic loading states. Consequently, the specific mechanical properties (stiffness, strength,toughness and energy absorption) of the Octet-truss far exceed those of open-cell foams. Many variantsof this structure have been explored and novel methods for their fabrication and multifunctional propertieshave been recently reviewed [Wadley 2006].
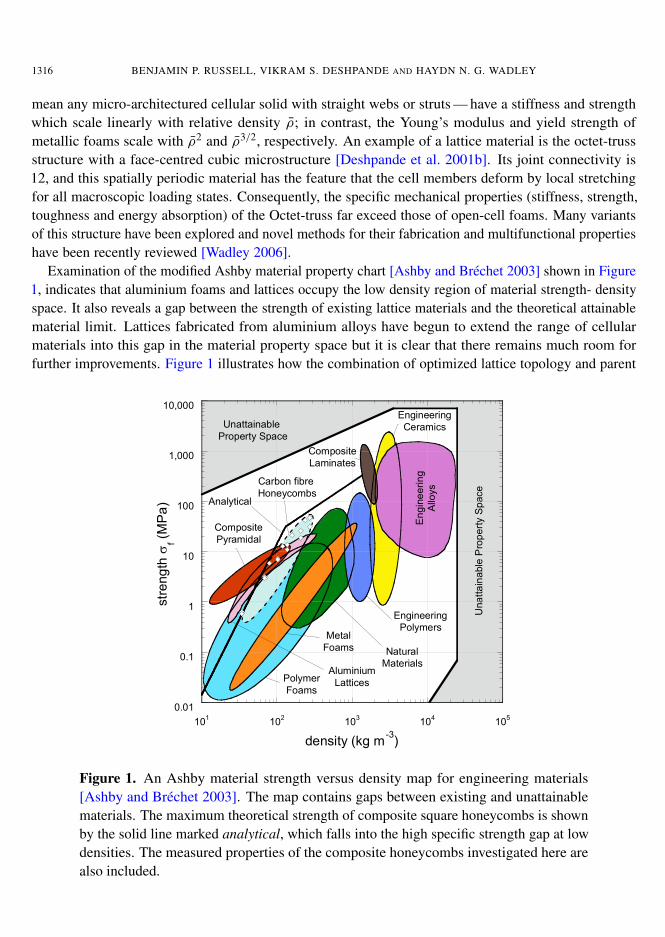
Examination of the modified Ashby material property chart [Ashby and Brechet 2003] shown in Figure1, indicates that aluminium foams and lattices occupy the low density region of material strength- densityspace. It also reveals a gap between the strength of existing lattice materials and the theoretical attainablematerial limit. Lattices fabricated from aluminium alloys have begun to extend the range of cellularmaterials into this gap in the material property space but it is clear that there remains much room forfurther improvements. Figure 1 illustrates how the combination of optimized lattice topology and parent
Unattainable
Property Space
Una
tta
ina
ble
Pro
pe
rty S
pa
ce
0.01
0.1
1
10
100
1,000
10,000
101
102
103
104
105
str
eng
th V
f (M
Pa
)
density (kg m-3
)
En
gin
ee
rin
g
Allo
ys
Engineering
Polymers
Natural
Materials
Metal
Foams
Polymer
Foams
Composite
Laminates
Engineering
Ceramics
Aluminium
Lattices
Carbon fibre
Honeycombs
Composite
Pyramidal
Analytical
Figure 1. An Ashby material strength versus density map for engineering materials[Ashby and Bréchet 2003]. The map contains gaps between existing and unattainablematerials. The maximum theoretical strength of composite square honeycombs is shownby the solid line marked analytical, which falls into the high specific strength gap at lowdensities. The measured properties of the composite honeycombs investigated here arealso included.
QUASISTATIC DEFORMATION AND FAILURE MODES OF COMPOSITE SQUARE HONEYCOMBS 1317
material properties can be combined to expand material property space by creating new engineeringmaterials or cellular structures. For instance, suppose composites containing fibres configured to providehigh uniaxial specific strengths were used for the trusses or webs of a lattice structure. If buckling doesnot occur, the resulting lattice structures have anticipated compressive strengths that fill the gap in thestrength versus density space for densities less than about 100 kgm−3.
Continuous fibre polymer matrix composites such as carbon-epoxy systems have found extensive useas face-sheets in sandwich construction, particularly in aerospace and sports equipment applications.Typically carbon-epoxy laminate face-sheets are combined with an aluminium hexagonal honeycombcore: the high strength and stiffness per unit mass of carbon-fibre materials boost their ranking in face-sheet materials selection for light-weight structural applications. The use of composites as a core materialis a natural progression for increasing the specific strength and stiffness of sandwich structures. The mainexamples include the Z-fiber and X-Cor1 truss structures fabricated by angled carbon fibre rods embeddedin a polymeric foam; and Nomex-phenolic resin honeycombs which find application in flooring panelsfor passenger aircraft. There exists little data on such sandwich core materials and that data suggeststhat the strength per unit mass of these sandwich cores is only marginally better than metallic structures[Marasco et al. 2006].
It is clear that topologically structuring composite materials shows promise for filling gaps in thestrength versus density map of all known materials. The aim of the present study is to begin to investigatethe expansion of the strength – density material space at low densities by using carbon fibre composites tobuild lattice materials. A related study explored the behaviour of carbon fibre composite lattice structureswith an open cell pyramidal truss topology [Finnegan et al. 2007]. The measured peak compressivestrengths from that study are included in Figure 1. Clearly the composite pyramidal lattices begin to filla gap in the known material property space in that they have a strength greater than most known materialsat densities less than 100 kgm−3. However, the designs of the composite pyramidal cores in [Finneganet al. 2007] do not achieve the full potential of composite lattice materials primarily due to the inefficientutilization of material in the nodes.
In general three classes of sandwich core architecture have been proposed: (i) prismatic cores, (ii) 3Dtrusses and (iii) honeycombs. The most suitable choice of sandwich core architecture depends upon thespecific application. For example, trusses with their open celled architecture are ideal for multifunctionalapplications involving heat transfer in addition to load carrying capacity [Evans et al. 1998]. On the otherhand, these sandwich cores have a low in-plane stretching strength. Thus, for panels subjected to largebending loads (where in in-plane core stretching is important), stretch resistant cores are superior to thetruss cores. Traditionally, hexagonal honeycombs have been extensively employed in sandwich construc-tion; see for example [Gibson and Ashby 1997]. However, hexagonal honeycombs also suffer from a lowin-plane stretching strength. Square honeycombs overcome this drawback (at least for loadings alongthe directions of the cell walls) and thereby have promise for sandwich construction as demonstratedin a number of studies [Cote et al. 2004; Xue and Hutchinson 2004; Fleck and Deshpande 2004]. Theout-of-plane compressive and shear deformation of carbon fibre composite square honeycombs is thefocus of this study.
1Z-fiber and X-core are registered trademarks of Aztex Inc., Waltham, MA, USA.
1318 BENJAMIN P. RUSSELL, VIKRAM S. DESHPANDE AND HAYDN N. G. WADLEY
The outline of the paper is as follows. First the composite sheet materials are described along withthe route for fabricating the square-honeycombs cores from these materials. Second, the measured com-pressive and shear responses of the cores are detailed along with the observed failure modes. Analyticaland finite element models are then developed for the elastic stiffness and collapse strengths of the com-posite honeycombs and these are compared with measurements. Finally, the measured strengths of thecomposite honeycombs are plotted on a map of density versus strength of all known materials in orderto gauge the performance of these materials in terms of their strength to weight ratio.
2. Materials and manufacture
Square-honeycombs were manufactured from prefabricated composite sheet materials. The methodologyfollows closely that developed for metallic honeycombs by [Cote et al. 2004].
2.1. Parent materials. Two types of carbon fibre composite sheet material with an average sheet thick-ness t = 0.355 mm were employed in this study. One was a ±45◦, 2 × 2 twill weave (3.7 tows percentimetre and 6000 fibres per tow) panel and the second was a laminate with a 4-ply symmetric balanced[0◦, 90◦
] lay-up. These two types of materials are referred to as the woven and laminate materials, respec-tively. In both cases, the composite sheets were made from T300-6k fibres (6–7.5 µm fibre diameter) anda high-heat resistant epoxy matrix (Fiberite 934). The as-fabricated densities of the woven and laminatecomposites were 1370 kgm−3 and 1590 kgm−3, respectively.
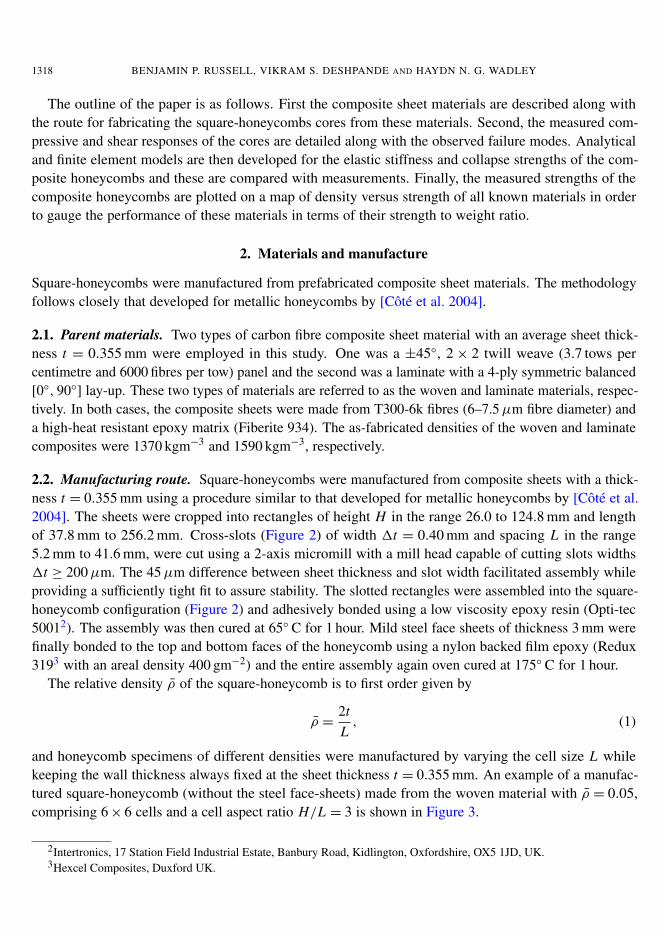
2.2. Manufacturing route. Square-honeycombs were manufactured from composite sheets with a thick-ness t = 0.355 mm using a procedure similar to that developed for metallic honeycombs by [Cote et al.2004]. The sheets were cropped into rectangles of height H in the range 26.0 to 124.8 mm and lengthof 37.8 mm to 256.2 mm. Cross-slots (Figure 2) of width 1t = 0.40 mm and spacing L in the range5.2 mm to 41.6 mm, were cut using a 2-axis micromill with a mill head capable of cutting slots widths1t ≥ 200 µm. The 45 µm difference between sheet thickness and slot width facilitated assembly whileproviding a sufficiently tight fit to assure stability. The slotted rectangles were assembled into the square-honeycomb configuration (Figure 2) and adhesively bonded using a low viscosity epoxy resin (Opti-tec50012). The assembly was then cured at 65◦ C for 1 hour. Mild steel face sheets of thickness 3 mm werefinally bonded to the top and bottom faces of the honeycomb using a nylon backed film epoxy (Redux3193 with an areal density 400 gm−2) and the entire assembly again oven cured at 175◦ C for 1 hour.
The relative density ρ of the square-honeycomb is to first order given by
ρ =2tL
, (1)
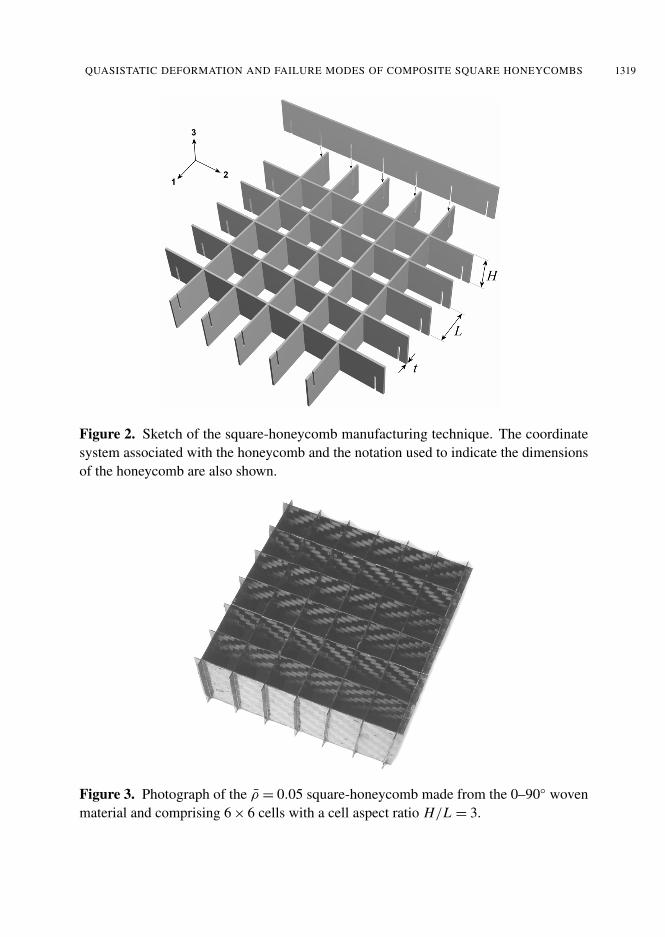
and honeycomb specimens of different densities were manufactured by varying the cell size L whilekeeping the wall thickness always fixed at the sheet thickness t = 0.355 mm. An example of a manufac-tured square-honeycomb (without the steel face-sheets) made from the woven material with ρ = 0.05,comprising 6 × 6 cells and a cell aspect ratio H/L = 3 is shown in Figure 3.
2Intertronics, 17 Station Field Industrial Estate, Banbury Road, Kidlington, Oxfordshire, OX5 1JD, UK.3Hexcel Composites, Duxford UK.
QUASISTATIC DEFORMATION AND FAILURE MODES OF COMPOSITE SQUARE HONEYCOMBS 1319
Figure 2. Sketch of the square-honeycomb manufacturing technique. The coordinatesystem associated with the honeycomb and the notation used to indicate the dimensionsof the honeycomb are also shown.
Figure 3. Photograph of the ρ = 0.05 square-honeycomb made from the 0–90◦ wovenmaterial and comprising 6 × 6 cells with a cell aspect ratio H/L = 3.
1320 BENJAMIN P. RUSSELL, VIKRAM S. DESHPANDE AND HAYDN N. G. WADLEY
0-90° 0-90°
±45° ±45°
(a) ±45° ±45°
(b)
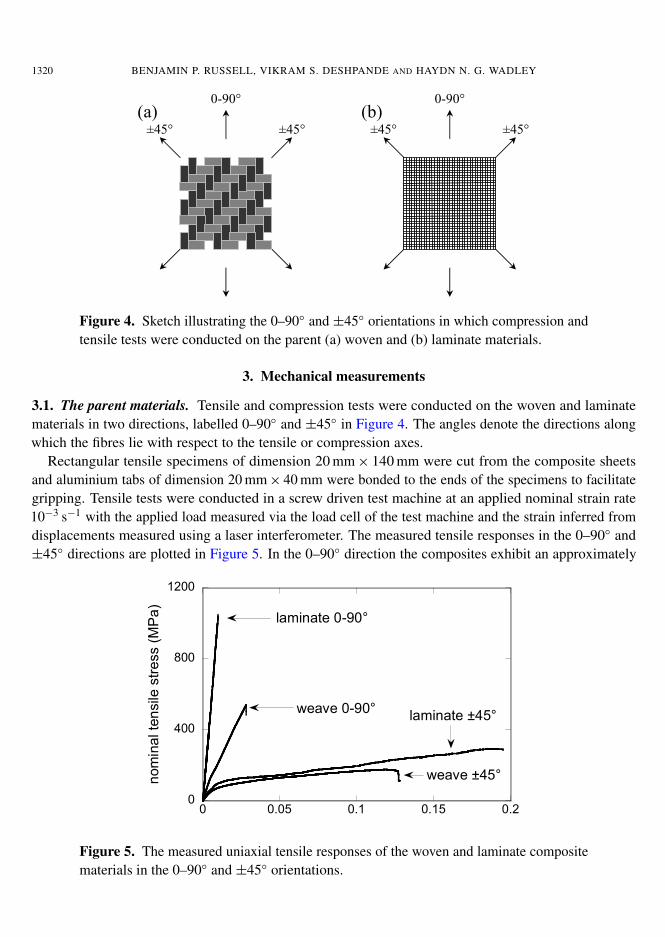
Figure 4. Sketch illustrating the 0–90◦ and ±45◦ orientations in which compression andtensile tests were conducted on the parent (a) woven and (b) laminate materials.
3. Mechanical measurements
3.1. The parent materials. Tensile and compression tests were conducted on the woven and laminatematerials in two directions, labelled 0–90◦ and ±45◦ in Figure 4. The angles denote the directions alongwhich the fibres lie with respect to the tensile or compression axes.
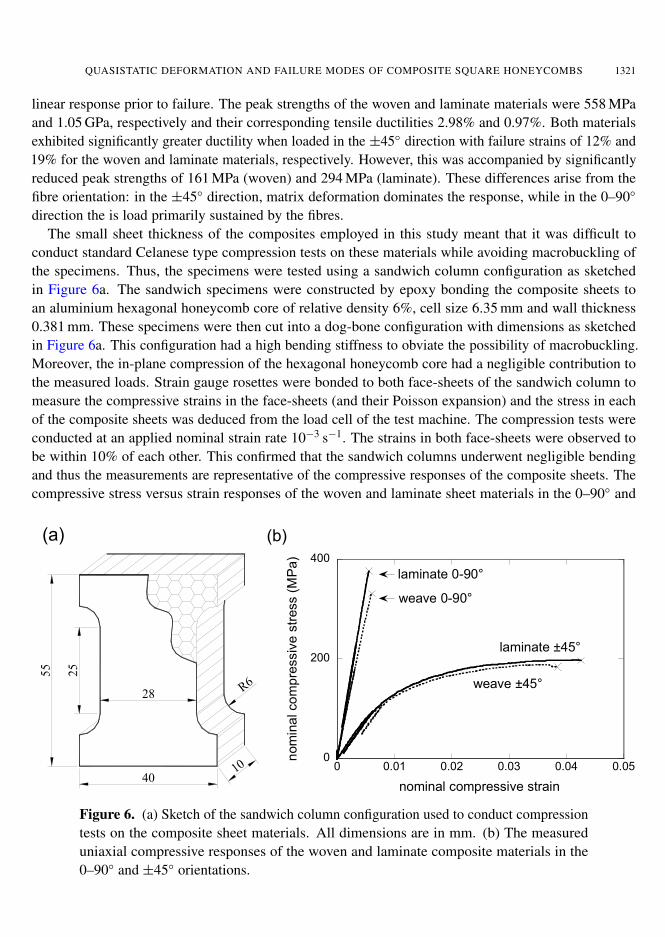
Rectangular tensile specimens of dimension 20 mm × 140 mm were cut from the composite sheetsand aluminium tabs of dimension 20 mm × 40 mm were bonded to the ends of the specimens to facilitategripping. Tensile tests were conducted in a screw driven test machine at an applied nominal strain rate10−3 s−1 with the applied load measured via the load cell of the test machine and the strain inferred fromdisplacements measured using a laser interferometer. The measured tensile responses in the 0–90◦ and±45◦ directions are plotted in Figure 5. In the 0–90◦ direction the composites exhibit an approximately
0
400
800
1200
0 0.05 0.1 0.15 0.2
nom
ina
l te
nsile
str
ess (
MP
a)
weave 0-90°
weave ±45°
laminate ±45°
laminate 0-90°
Figure 5. The measured uniaxial tensile responses of the woven and laminate compositematerials in the 0–90◦ and ±45◦ orientations.
QUASISTATIC DEFORMATION AND FAILURE MODES OF COMPOSITE SQUARE HONEYCOMBS 1321
linear response prior to failure. The peak strengths of the woven and laminate materials were 558 MPaand 1.05 GPa, respectively and their corresponding tensile ductilities 2.98% and 0.97%. Both materialsexhibited significantly greater ductility when loaded in the ±45◦ direction with failure strains of 12% and19% for the woven and laminate materials, respectively. However, this was accompanied by significantlyreduced peak strengths of 161 MPa (woven) and 294 MPa (laminate). These differences arise from thefibre orientation: in the ±45◦ direction, matrix deformation dominates the response, while in the 0–90◦
direction the is load primarily sustained by the fibres.The small sheet thickness of the composites employed in this study meant that it was difficult to
conduct standard Celanese type compression tests on these materials while avoiding macrobuckling ofthe specimens. Thus, the specimens were tested using a sandwich column configuration as sketchedin Figure 6a. The sandwich specimens were constructed by epoxy bonding the composite sheets toan aluminium hexagonal honeycomb core of relative density 6%, cell size 6.35 mm and wall thickness0.381 mm. These specimens were then cut into a dog-bone configuration with dimensions as sketchedin Figure 6a. This configuration had a high bending stiffness to obviate the possibility of macrobuckling.Moreover, the in-plane compression of the hexagonal honeycomb core had a negligible contribution tothe measured loads. Strain gauge rosettes were bonded to both face-sheets of the sandwich column tomeasure the compressive strains in the face-sheets (and their Poisson expansion) and the stress in eachof the composite sheets was deduced from the load cell of the test machine. The compression tests wereconducted at an applied nominal strain rate 10−3 s−1. The strains in both face-sheets were observed tobe within 10% of each other. This confirmed that the sandwich columns underwent negligible bendingand thus the measurements are representative of the compressive responses of the composite sheets. Thecompressive stress versus strain responses of the woven and laminate sheet materials in the 0–90◦ and
28R6
40
55
25
10
(a)
0
200
400
0 0.01 0.02 0.03 0.04 0.
nom
ina
l co
mp
ressiv
e s
tress (
MP
a)
nominal compressive strain
weave 0-90°
weave ±45°
laminate 0-90°
(b)
laminate ±45°
05
Figure 6. (a) Sketch of the sandwich column configuration used to conduct compressiontests on the composite sheet materials. All dimensions are in mm. (b) The measureduniaxial compressive responses of the woven and laminate composite materials in the0–90◦ and ±45◦ orientations.
1322 BENJAMIN P. RUSSELL, VIKRAM S. DESHPANDE AND HAYDN N. G. WADLEY
±45◦ directions are plotted in Figure 6b. Similar to the tensile responses, the composite sheets have a highstrength but low failure strain in the 0–90◦ direction and vice-versa in the ±45◦ direction. Interestingly,both the woven and laminate materials have approximately the same compressive strength in the 0–90◦
direction suggesting that fibre waviness even in the laminates significantly reduces its peak compressivestrength. We note that in the 0–90◦ direction, the composite sheets have a lower compressive strengthcompared to the tensile strength due to the fact that the tensile strength is governed by the failure strengthof the fibres while the compressive strength of the materials is governed by fibre waviness which causesmicrobuckling failure of the composite materials.
3.2. Compressive response of the honeycombs. Compressive tests were conducted on the compositesquare honeycombs to investigate the effects of (i) relative density ρ, (ii) parent material type and ori-entation, (iii) cell geometry as characterized by the aspect ratio H/L and (iv) number of cells in thecompressive test specimen. The compression tests were conducted in a screw driven test machine at anominal applied strain rate 10−3 s−1. The compressive stress was inferred from the load cell output of thetest machine while the average compressive strain was deduced from laser inferometer measurements ofthe relative approach of the two steel face sheets of the test specimens. A few loading-unloading cycleswere conducted during each test in order to infer the compressive Young’s modulus of the honeycombs.At least one repeat test was conducted on each of the specimens in order to confirm the repeatability ofthe results presented subsequently.
3.2.1. Effect of specimen geometry. The majority of the tests were conducted on square-honeycombspecimens manufactured from the woven composite material oriented such that one set of fibres wasaligned with the compression direction; such square-honeycombs are referred to as the 0–90◦ wovenhoneycombs and the effect of specimen geometry is investigated using these types of honeycombs. The
0
10
20
30
40
0
0.5
1
0 0.01 0.02 0.03 0.04 0.05
nom
ina
l str
ess (
MP
a) n
om
ina
l stre
ss (M
Pa
)
nominal strain
U = 0.2
U = 0.025
U = 0.075
_
_
_
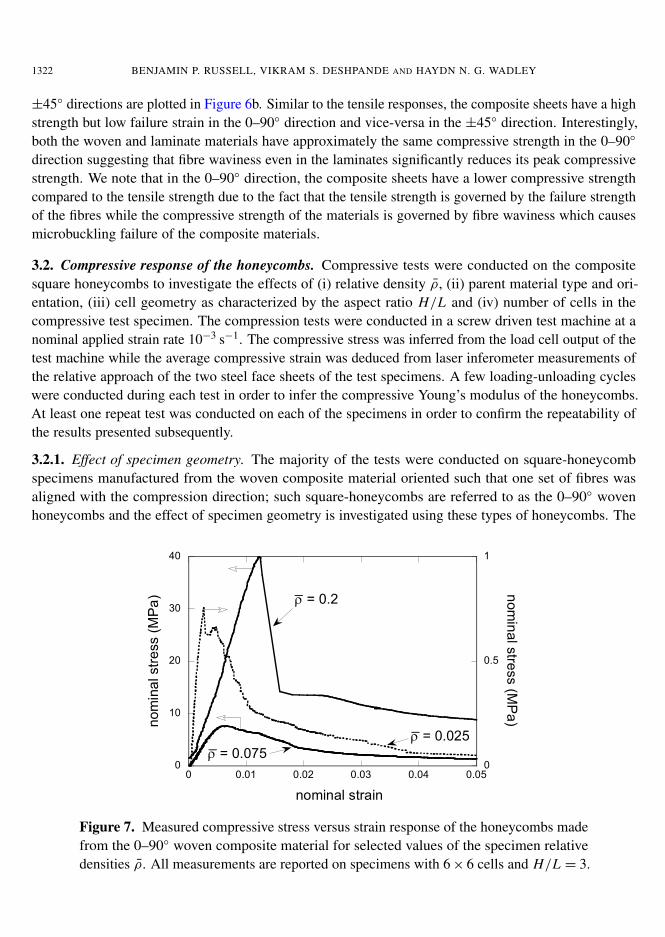
Figure 7. Measured compressive stress versus strain response of the honeycombs madefrom the 0–90◦ woven composite material for selected values of the specimen relativedensities ρ. All measurements are reported on specimens with 6 × 6 cells and H/L = 3.
QUASISTATIC DEFORMATION AND FAILURE MODES OF COMPOSITE SQUARE HONEYCOMBS 1323
ρaspect ratio (H/L)
1 3 5
0.025 6×6 4×4, 6×6 –
0.05 6×6 4×4, 6×6, 12×12 –
0.075 6×6 4×4, 6×6, 12×12 –
0.1 6×6 4×4, 6×6, 12×12 6×6
0.15 – 4×4, 6×6, 12×12 6×6
0.2 – 4×4, 6×6, 12×12 6×6
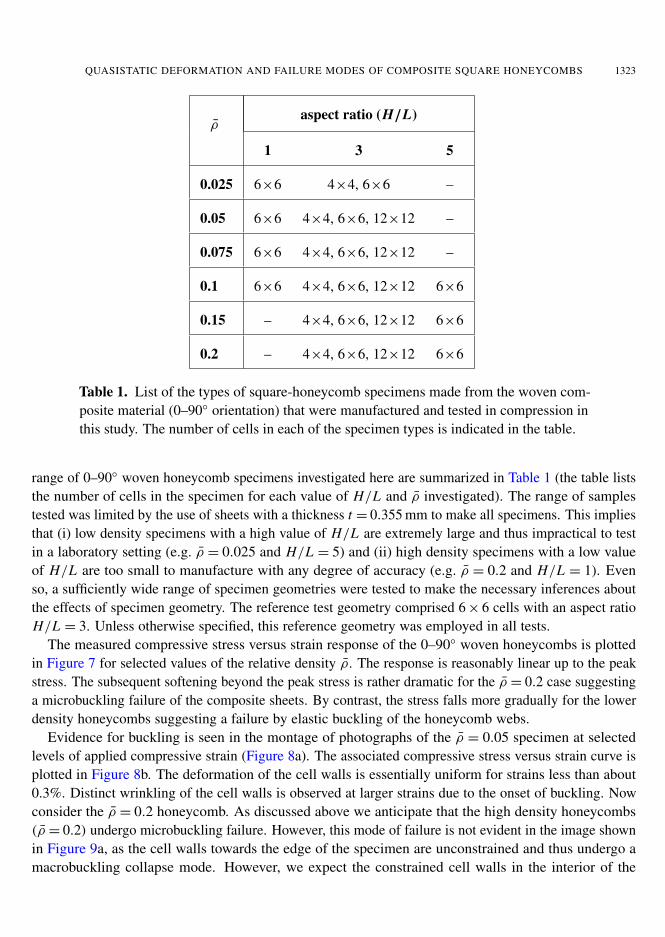
Table 1. List of the types of square-honeycomb specimens made from the woven com-posite material (0–90◦ orientation) that were manufactured and tested in compression inthis study. The number of cells in each of the specimen types is indicated in the table.
range of 0–90◦ woven honeycomb specimens investigated here are summarized in Table 1 (the table liststhe number of cells in the specimen for each value of H/L and ρ investigated). The range of samplestested was limited by the use of sheets with a thickness t = 0.355 mm to make all specimens. This impliesthat (i) low density specimens with a high value of H/L are extremely large and thus impractical to testin a laboratory setting (e.g. ρ = 0.025 and H/L = 5) and (ii) high density specimens with a low valueof H/L are too small to manufacture with any degree of accuracy (e.g. ρ = 0.2 and H/L = 1). Evenso, a sufficiently wide range of specimen geometries were tested to make the necessary inferences aboutthe effects of specimen geometry. The reference test geometry comprised 6 × 6 cells with an aspect ratioH/L = 3. Unless otherwise specified, this reference geometry was employed in all tests.
The measured compressive stress versus strain response of the 0–90◦ woven honeycombs is plottedin Figure 7 for selected values of the relative density ρ. The response is reasonably linear up to the peakstress. The subsequent softening beyond the peak stress is rather dramatic for the ρ = 0.2 case suggestinga microbuckling failure of the composite sheets. By contrast, the stress falls more gradually for the lowerdensity honeycombs suggesting a failure by elastic buckling of the honeycomb webs.
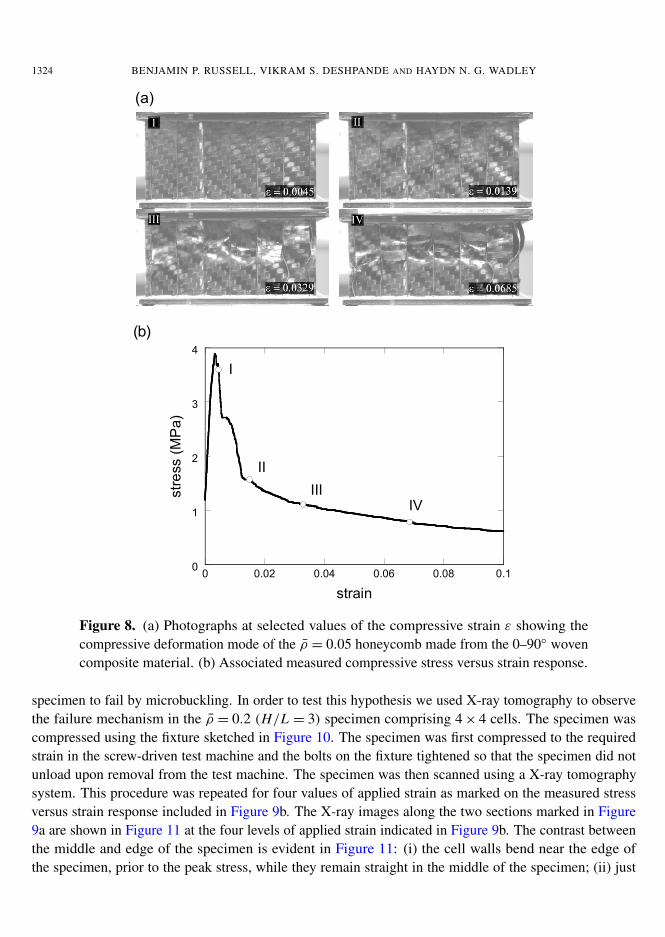
Evidence for buckling is seen in the montage of photographs of the ρ = 0.05 specimen at selectedlevels of applied compressive strain (Figure 8a). The associated compressive stress versus strain curve isplotted in Figure 8b. The deformation of the cell walls is essentially uniform for strains less than about0.3%. Distinct wrinkling of the cell walls is observed at larger strains due to the onset of buckling. Nowconsider the ρ = 0.2 honeycomb. As discussed above we anticipate that the high density honeycombs(ρ = 0.2) undergo microbuckling failure. However, this mode of failure is not evident in the image shownin Figure 9a, as the cell walls towards the edge of the specimen are unconstrained and thus undergo amacrobuckling collapse mode. However, we expect the constrained cell walls in the interior of the
1324 BENJAMIN P. RUSSELL, VIKRAM S. DESHPANDE AND HAYDN N. G. WADLEY
(a)
0
1
2
3
4
0 0.02 0.04 0.06 0.08 0.1
str
ess (
MP
a)
strain
(b)
I
II
IIIIV
Figure 8. (a) Photographs at selected values of the compressive strain ε showing thecompressive deformation mode of the ρ = 0.05 honeycomb made from the 0–90◦ wovencomposite material. (b) Associated measured compressive stress versus strain response.
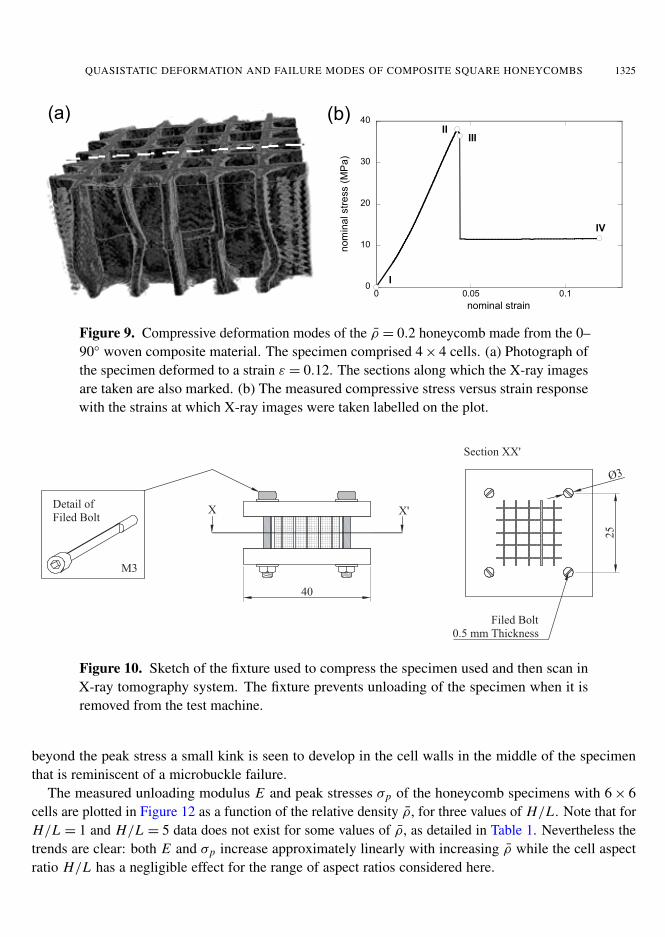
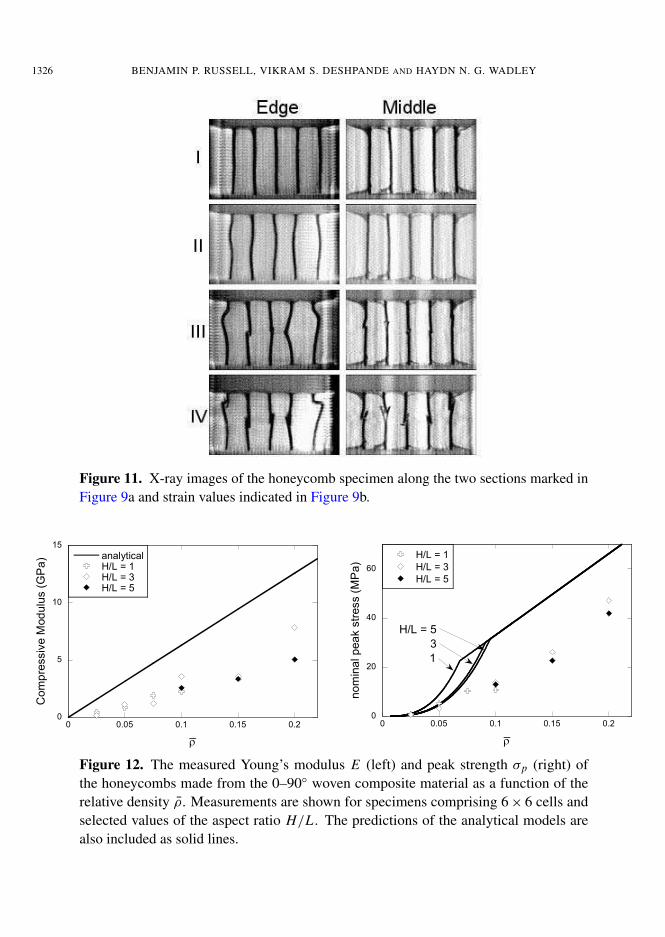
specimen to fail by microbuckling. In order to test this hypothesis we used X-ray tomography to observethe failure mechanism in the ρ = 0.2 (H/L = 3) specimen comprising 4 × 4 cells. The specimen wascompressed using the fixture sketched in Figure 10. The specimen was first compressed to the requiredstrain in the screw-driven test machine and the bolts on the fixture tightened so that the specimen did notunload upon removal from the test machine. The specimen was then scanned using a X-ray tomographysystem. This procedure was repeated for four values of applied strain as marked on the measured stressversus strain response included in Figure 9b. The X-ray images along the two sections marked in Figure9a are shown in Figure 11 at the four levels of applied strain indicated in Figure 9b. The contrast betweenthe middle and edge of the specimen is evident in Figure 11: (i) the cell walls bend near the edge ofthe specimen, prior to the peak stress, while they remain straight in the middle of the specimen; (ii) just
QUASISTATIC DEFORMATION AND FAILURE MODES OF COMPOSITE SQUARE HONEYCOMBS 1325
(a)
(c)
0
10
20
30
40
0 0.05 0.1
nom
ina
l str
ess (
MP
a)
nominal strain
I
IIIII
IV
(b)
Figure 9. Compressive deformation modes of the ρ = 0.2 honeycomb made from the 0–90◦ woven composite material. The specimen comprised 4 × 4 cells. (a) Photograph ofthe specimen deformed to a strain ε = 0.12. The sections along which the X-ray imagesare taken are also marked. (b) The measured compressive stress versus strain responsewith the strains at which X-ray images were taken labelled on the plot.
Detail of
Filed Bolt
M3
40
X
25
Filed Bolt
0.5 mm Thickness
Section XX'
X'
Ø3
Figure 10. Sketch of the fixture used to compress the specimen used and then scan inX-ray tomography system. The fixture prevents unloading of the specimen when it isremoved from the test machine.
beyond the peak stress a small kink is seen to develop in the cell walls in the middle of the specimenthat is reminiscent of a microbuckle failure.
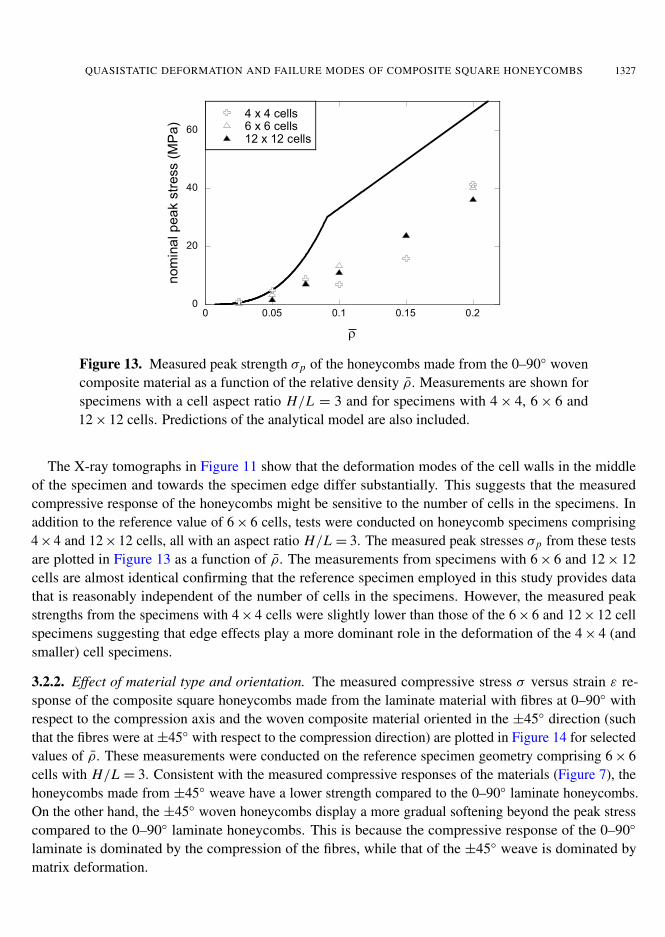
The measured unloading modulus E and peak stresses σp of the honeycomb specimens with 6 × 6cells are plotted in Figure 12 as a function of the relative density ρ, for three values of H/L . Note that forH/L = 1 and H/L = 5 data does not exist for some values of ρ, as detailed in Table 1. Nevertheless thetrends are clear: both E and σp increase approximately linearly with increasing ρ while the cell aspectratio H/L has a negligible effect for the range of aspect ratios considered here.
1326 BENJAMIN P. RUSSELL, VIKRAM S. DESHPANDE AND HAYDN N. G. WADLEY
(c)
Figure 11. X-ray images of the honeycomb specimen along the two sections marked inFigure 9a and strain values indicated in Figure 9b.
0
5
10
15
0 0.05 0.1 0.15 0.2
analyticalH/L = 1H/L = 3H/L = 5
Co
mp
ressiv
e M
od
ulu
s (
GP
a)
U_
0
20
40
60
0 0.05 0.1 0.15 0.2
H/L = 1
H/L = 3
H/L = 5
nom
ina
l p
ea
k s
tress (
MP
a)
U_
H/L = 5
3
1
Figure 12. The measured Young’s modulus E (left) and peak strength σp (right) ofthe honeycombs made from the 0–90◦ woven composite material as a function of therelative density ρ. Measurements are shown for specimens comprising 6 × 6 cells andselected values of the aspect ratio H/L . The predictions of the analytical models arealso included as solid lines.
QUASISTATIC DEFORMATION AND FAILURE MODES OF COMPOSITE SQUARE HONEYCOMBS 1327
0
20
40
60
0 0.05 0.1 0.15 0.2
4 x 4 cells6 x 6 cells12 x 12 cells
nom
ina
l p
ea
k s
tress (
MP
a)
U_
Figure 13. Measured peak strength σp of the honeycombs made from the 0–90◦ wovencomposite material as a function of the relative density ρ. Measurements are shown forspecimens with a cell aspect ratio H/L = 3 and for specimens with 4 × 4, 6 × 6 and12 × 12 cells. Predictions of the analytical model are also included.
The X-ray tomographs in Figure 11 show that the deformation modes of the cell walls in the middleof the specimen and towards the specimen edge differ substantially. This suggests that the measuredcompressive response of the honeycombs might be sensitive to the number of cells in the specimens. Inaddition to the reference value of 6 × 6 cells, tests were conducted on honeycomb specimens comprising4×4 and 12×12 cells, all with an aspect ratio H/L = 3. The measured peak stresses σp from these testsare plotted in Figure 13 as a function of ρ. The measurements from specimens with 6 × 6 and 12 × 12cells are almost identical confirming that the reference specimen employed in this study provides datathat is reasonably independent of the number of cells in the specimens. However, the measured peakstrengths from the specimens with 4 × 4 cells were slightly lower than those of the 6 × 6 and 12 × 12 cellspecimens suggesting that edge effects play a more dominant role in the deformation of the 4 × 4 (andsmaller) cell specimens.
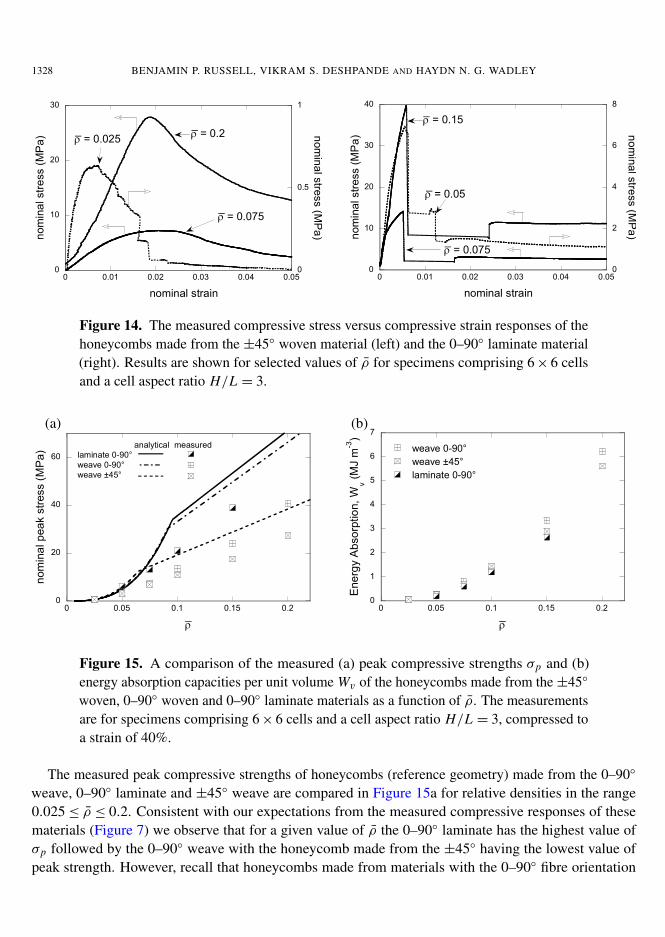
3.2.2. Effect of material type and orientation. The measured compressive stress σ versus strain ε re-sponse of the composite square honeycombs made from the laminate material with fibres at 0–90◦ withrespect to the compression axis and the woven composite material oriented in the ±45◦ direction (suchthat the fibres were at ±45◦ with respect to the compression direction) are plotted in Figure 14 for selectedvalues of ρ. These measurements were conducted on the reference specimen geometry comprising 6 × 6cells with H/L = 3. Consistent with the measured compressive responses of the materials (Figure 7), thehoneycombs made from ±45◦ weave have a lower strength compared to the 0–90◦ laminate honeycombs.On the other hand, the ±45◦ woven honeycombs display a more gradual softening beyond the peak stresscompared to the 0–90◦ laminate honeycombs. This is because the compressive response of the 0–90◦
laminate is dominated by the compression of the fibres, while that of the ±45◦ weave is dominated bymatrix deformation.
1328 BENJAMIN P. RUSSELL, VIKRAM S. DESHPANDE AND HAYDN N. G. WADLEY
0
10
20
30
0
0.5
1
0 0.01 0.02 0.03 0.04 0.05
nom
ina
l str
ess (
MP
a) n
om
ina
l stre
ss (M
Pa
)
nominal strain
U = 0.2U = 0.025
U = 0.075_
__
0
10
20
30
40
0
2
4
6
8
0 0.01 0.02 0.03 0.04 0.05
nom
ina
l str
ess (
MP
a) n
om
ina
l stre
ss (M
Pa
)
nominal strain
U = 0.15
U = 0.05
U = 0.075_
_
_
Figure 14. The measured compressive stress versus compressive strain responses of thehoneycombs made from the ±45◦ woven material (left) and the 0–90◦ laminate material(right). Results are shown for selected values of ρ for specimens comprising 6 × 6 cellsand a cell aspect ratio H/L = 3.
(a) (b)
0
20
40
60
0 0.05 0.1 0.15 0.2
nom
ina
l p
ea
k s
tress (
MP
a)
U_
(a)
analytical measured
laminate 0-90°
weave 0-90°
weave ±45°
(b)
0
1
2
3
4
5
6
7
0 0.05 0.1 0.15 0.2
weave 0-90°
weave ±45°
laminate 0-90°
Ene
rgy A
bso
rptio
n,
Wv (
MJ m
-3)
U_
Figure 15. A comparison of the measured (a) peak compressive strengths σp and (b)energy absorption capacities per unit volume Wv of the honeycombs made from the ±45◦
woven, 0–90◦ woven and 0–90◦ laminate materials as a function of ρ. The measurementsare for specimens comprising 6 × 6 cells and a cell aspect ratio H/L = 3, compressed toa strain of 40%.
The measured peak compressive strengths of honeycombs (reference geometry) made from the 0–90◦
weave, 0–90◦ laminate and ±45◦ weave are compared in Figure 15a for relative densities in the range0.025 ≤ ρ ≤ 0.2. Consistent with our expectations from the measured compressive responses of thesematerials (Figure 7) we observe that for a given value of ρ the 0–90◦ laminate has the highest value ofσp followed by the 0–90◦ weave with the honeycomb made from the ±45◦ having the lowest value ofpeak strength. However, recall that honeycombs made from materials with the 0–90◦ fibre orientation
QUASISTATIC DEFORMATION AND FAILURE MODES OF COMPOSITE SQUARE HONEYCOMBS 1329
typically undergo a catastrophic collapse beyond the peak stress and loose all energy absorption capacity,while the honeycombs made from the ±45◦ woven materials have a more benign response beyond thepeak stress. These differences are expected to alter the rankings of the materials in terms of their energyabsorption capacity per unit volume Wv defined as
Wv =
∫ ε
0σ dε. (2)
Wv is plotted in Figure 15b with the choice of strain ε = 0.4 as a function of ρ for the three configurationsconsidered in Figure 15a. The results indicate that honeycombs made from the 0–90◦ weave, 0–90◦
laminate and ±45◦ weave all have approximately the same energy absorption capacity per unit volumeover the range of ρ investigated here. This is rationalised by noting that the lower peak strength of the±45◦ woven honeycomb is compensated by its higher energy absorption beyond its peak stress comparedto the honeycombs with a 0–90◦ fibre orientation.
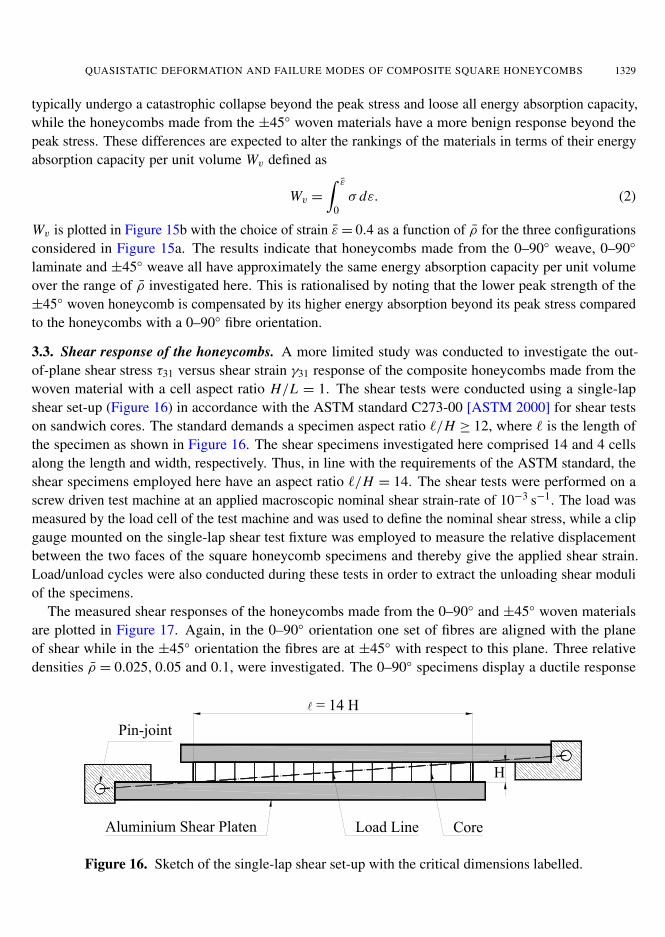
3.3. Shear response of the honeycombs. A more limited study was conducted to investigate the out-of-plane shear stress τ31 versus shear strain γ31 response of the composite honeycombs made from thewoven material with a cell aspect ratio H/L = 1. The shear tests were conducted using a single-lapshear set-up (Figure 16) in accordance with the ASTM standard C273-00 [ASTM 2000] for shear testson sandwich cores. The standard demands a specimen aspect ratio `/H ≥ 12, where ` is the length ofthe specimen as shown in Figure 16. The shear specimens investigated here comprised 14 and 4 cellsalong the length and width, respectively. Thus, in line with the requirements of the ASTM standard, theshear specimens employed here have an aspect ratio `/H = 14. The shear tests were performed on ascrew driven test machine at an applied macroscopic nominal shear strain-rate of 10−3 s−1. The load wasmeasured by the load cell of the test machine and was used to define the nominal shear stress, while a clipgauge mounted on the single-lap shear test fixture was employed to measure the relative displacementbetween the two faces of the square honeycomb specimens and thereby give the applied shear strain.Load/unload cycles were also conducted during these tests in order to extract the unloading shear moduliof the specimens.
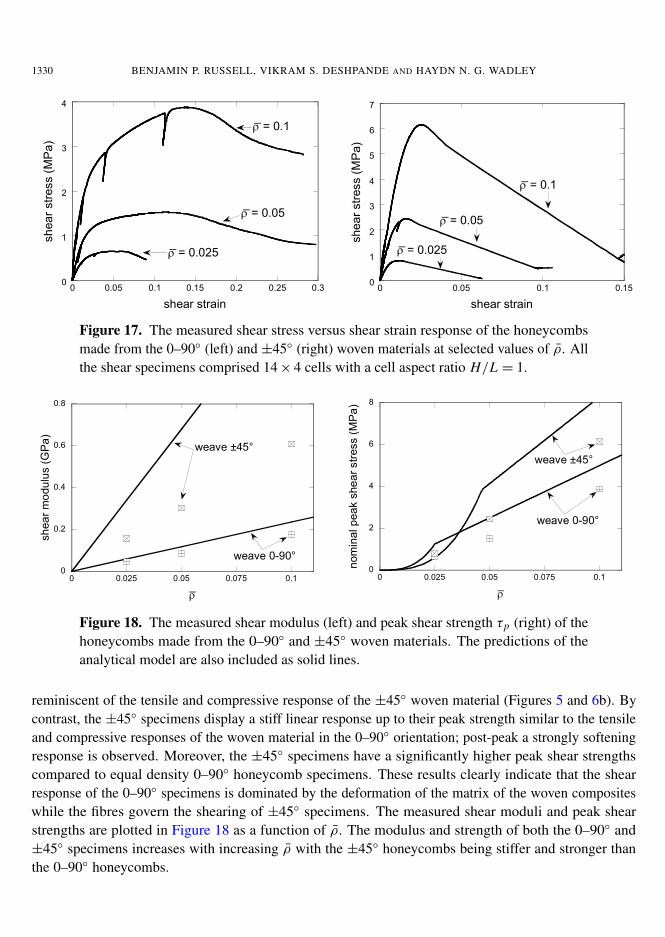
The measured shear responses of the honeycombs made from the 0–90◦ and ±45◦ woven materialsare plotted in Figure 17. Again, in the 0–90◦ orientation one set of fibres are aligned with the planeof shear while in the ±45◦ orientation the fibres are at ±45◦ with respect to this plane. Three relativedensities ρ = 0.025, 0.05 and 0.1, were investigated. The 0–90◦ specimens display a ductile response
A = 14 H
Pin-joint
Aluminium Shear Platen Load Line Core
H
Figure 16. Sketch of the single-lap shear set-up with the critical dimensions labelled.
1330 BENJAMIN P. RUSSELL, VIKRAM S. DESHPANDE AND HAYDN N. G. WADLEY
0
1
2
3
4
0 0.05 0.1 0.15 0.2 0.25 0.3
sh
ea
r str
ess (
MP
a)
shear strain
U = 0.1
U = 0.025
U = 0.05_
_
_
0
1
2
3
4
5
6
7
0 0.05 0.1
sh
ea
r str
ess (
MP
a)
shear strain
U = 0.1
0.15
U = 0.025
U = 0.05_
_
_
Figure 17. The measured shear stress versus shear strain response of the honeycombsmade from the 0–90◦ (left) and ±45◦ (right) woven materials at selected values of ρ. Allthe shear specimens comprised 14 × 4 cells with a cell aspect ratio H/L = 1.
0
0.2
0.4
0.6
0.8
0 0.025 0.05 0.075 0.1
sh
ea
r m
odu
lus (
GP
a)
U_
weave ±45°
weave 0-90°
)
(b)
0
2
4
6
8
0 0.025 0.05 0.075 0.1
nom
ina
l p
ea
k s
he
ar
str
ess (
MP
a)
U_
weave 0-90°
weave ±45°
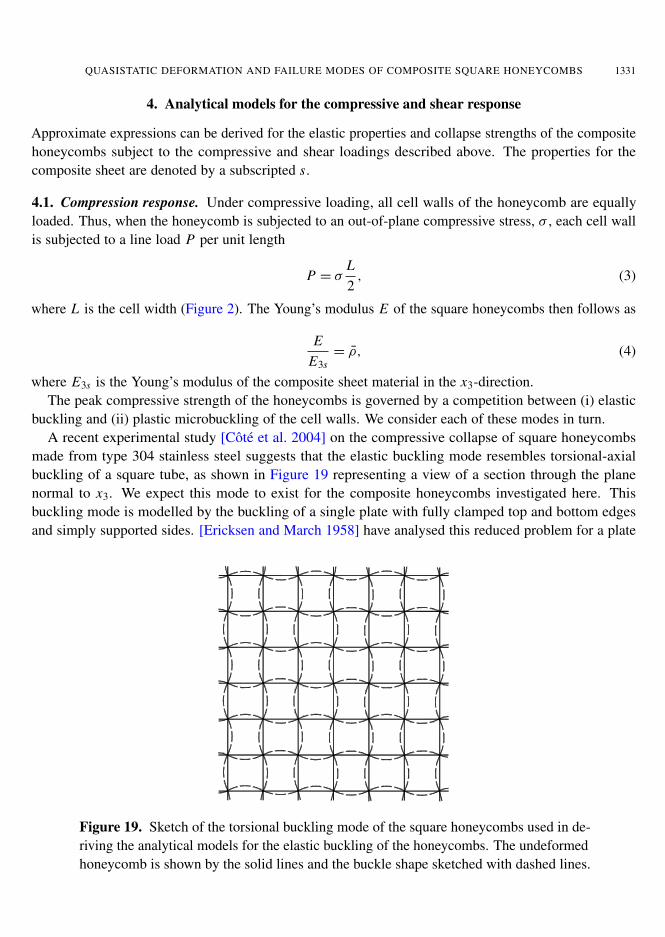
Figure 18. The measured shear modulus (left) and peak shear strength τp (right) of thehoneycombs made from the 0–90◦ and ±45◦ woven materials. The predictions of theanalytical model are also included as solid lines.
reminiscent of the tensile and compressive response of the ±45◦ woven material (Figures 5 and 6b). Bycontrast, the ±45◦ specimens display a stiff linear response up to their peak strength similar to the tensileand compressive responses of the woven material in the 0–90◦ orientation; post-peak a strongly softeningresponse is observed. Moreover, the ±45◦ specimens have a significantly higher peak shear strengthscompared to equal density 0–90◦ honeycomb specimens. These results clearly indicate that the shearresponse of the 0–90◦ specimens is dominated by the deformation of the matrix of the woven compositeswhile the fibres govern the shearing of ±45◦ specimens. The measured shear moduli and peak shearstrengths are plotted in Figure 18 as a function of ρ. The modulus and strength of both the 0–90◦ and±45◦ specimens increases with increasing ρ with the ±45◦ honeycombs being stiffer and stronger thanthe 0–90◦ honeycombs.
QUASISTATIC DEFORMATION AND FAILURE MODES OF COMPOSITE SQUARE HONEYCOMBS 1331
4. Analytical models for the compressive and shear response
Approximate expressions can be derived for the elastic properties and collapse strengths of the compositehoneycombs subject to the compressive and shear loadings described above. The properties for thecomposite sheet are denoted by a subscripted s.
4.1. Compression response. Under compressive loading, all cell walls of the honeycomb are equallyloaded. Thus, when the honeycomb is subjected to an out-of-plane compressive stress, σ , each cell wallis subjected to a line load P per unit length
P = σL2
, (3)
where L is the cell width (Figure 2). The Young’s modulus E of the square honeycombs then follows as
EE3s
= ρ, (4)
where E3s is the Young’s modulus of the composite sheet material in the x3-direction.The peak compressive strength of the honeycombs is governed by a competition between (i) elastic
buckling and (ii) plastic microbuckling of the cell walls. We consider each of these modes in turn.A recent experimental study [Cote et al. 2004] on the compressive collapse of square honeycombs
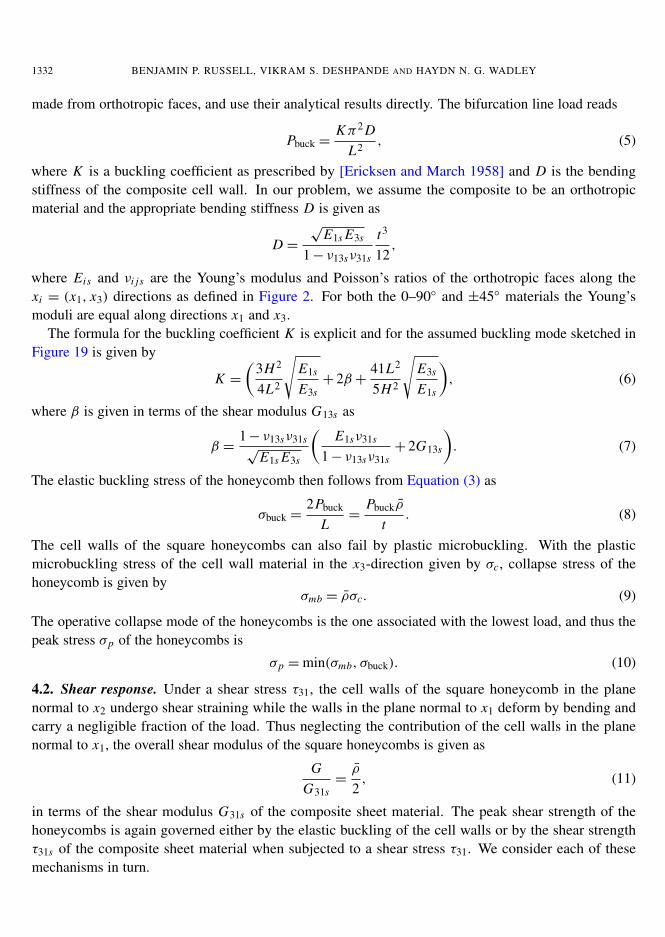
made from type 304 stainless steel suggests that the elastic buckling mode resembles torsional-axialbuckling of a square tube, as shown in Figure 19 representing a view of a section through the planenormal to x3. We expect this mode to exist for the composite honeycombs investigated here. Thisbuckling mode is modelled by the buckling of a single plate with fully clamped top and bottom edgesand simply supported sides. [Ericksen and March 1958] have analysed this reduced problem for a plate
Figure 19. Sketch of the torsional buckling mode of the square honeycombs used in de-riving the analytical models for the elastic buckling of the honeycombs. The undeformedhoneycomb is shown by the solid lines and the buckle shape sketched with dashed lines.
1332 BENJAMIN P. RUSSELL, VIKRAM S. DESHPANDE AND HAYDN N. G. WADLEY
made from orthotropic faces, and use their analytical results directly. The bifurcation line load reads
Pbuck =Kπ2 D
L2 , (5)
where K is a buckling coefficient as prescribed by [Ericksen and March 1958] and D is the bendingstiffness of the composite cell wall. In our problem, we assume the composite to be an orthotropicmaterial and the appropriate bending stiffness D is given as
D =
√E1s E3s
1 − ν13sν31s
t3
12,
where Eis and νi js are the Young’s modulus and Poisson’s ratios of the orthotropic faces along thexi = (x1, x3) directions as defined in Figure 2. For both the 0–90◦ and ±45◦ materials the Young’smoduli are equal along directions x1 and x3.
The formula for the buckling coefficient K is explicit and for the assumed buckling mode sketched inFigure 19 is given by
K =
(3H 2
4L2
√E1s
E3s+ 2β +
41L2
5H 2
√E3s
E1s
), (6)
where β is given in terms of the shear modulus G13s as
β =1 − ν13sν31s√
E1s E3s
(E1sν31s
1 − ν13sν31s+ 2G13s
). (7)
The elastic buckling stress of the honeycomb then follows from Equation (3) as
σbuck =2Pbuck
L=
Pbuckρ
t. (8)
The cell walls of the square honeycombs can also fail by plastic microbuckling. With the plasticmicrobuckling stress of the cell wall material in the x3-direction given by σc, collapse stress of thehoneycomb is given by
σmb = ρσc. (9)
The operative collapse mode of the honeycombs is the one associated with the lowest load, and thus thepeak stress σp of the honeycombs is
σp = min(σmb, σbuck). (10)
4.2. Shear response. Under a shear stress τ31, the cell walls of the square honeycomb in the planenormal to x2 undergo shear straining while the walls in the plane normal to x1 deform by bending andcarry a negligible fraction of the load. Thus neglecting the contribution of the cell walls in the planenormal to x1, the overall shear modulus of the square honeycombs is given as
GG31s
=ρ
2, (11)
in terms of the shear modulus G31s of the composite sheet material. The peak shear strength of thehoneycombs is again governed either by the elastic buckling of the cell walls or by the shear strengthτ31s of the composite sheet material when subjected to a shear stress τ31. We consider each of thesemechanisms in turn.
QUASISTATIC DEFORMATION AND FAILURE MODES OF COMPOSITE SQUARE HONEYCOMBS 1333
Consider the elastic buckling of the cell walls that lie along the x1-direction direction. The principalbending rigidities of this cell wall are given as
D1 =E1s t3
12(1 − ν13sν31s), D3 =
E3s t3
12(1 − ν31sν13s), D31 =
G31s t3
12. (12)
The elastic shear buckling stress of a plate clamped along the edges x3 = 0 and x3 = H and simplysupported along the other two edges is given in terms of the above rigidities as [Seydel 1930]
τb = Ksπ2
t L24√
D1 D33 . (13)
In this case the factor Ks is only a function of the nondimensional group
η ≡D31
√D1 D3
, (14)
and lies in the range 7 ≤ Ks ≤ 14 for η in the range 0 to 2.0 as specified in [Krivetsky 1959]. The elasticbuckling strength of the honeycomb then follows as
τbuck = τbρ
2. (15)
When the peak stress of the honeycomb is governed by the shear failure of the composite material,the strength τs of the honeycombs is given in terms of the strength τ13s of the cell wall material as
τs = τ31sρ
2. (16)
Combining, Equations (15) and (16), the peak shear strength of the honeycombs is
τp = min(τs, τbuck). (17)
Note that this analysis remains unchanged for shear loading τ32.
4.3. Extraction of material properties. The compressive tests on the sandwich specimen described inSection 3.1 were used to extract the material properties required to use in the models discussed above.The moduli E1s = E3s , and peak compressive strength σc for the woven and laminate materials followdirectly from the measurements plotted in Figure 7 for the materials in the 0–90◦ and ±45◦ orientations.The Poisson’s ratios ν13s = ν31s were also measured in these tests using strain gauge rosettes (see Section3.1). These measured material properties for the woven and laminate materials are listed in Table 2.
The required shear elastic properties of the composite sheets were estimated from compression testsconducted by rotating the composite sheet material through 45◦ as described subsequently. In order todetermine the shear modulus G31s of the woven material in the 0–90◦ orientation, consider the compres-sion test on the ±45◦ woven material plotted in Figure 7. Write the applied compressive stress as σx ,and the corresponding axial strain and transverse strains as εx and εy , respectively. Then, the requiredshear stress τ versus shear strain γ relation is obtained via the connections τ = σx/2 and γ = εx − εy .The shear modulus G31s follows immediately as the initial slope of the τ versus γ response and we takethe shear strength of the material to be given as τ31s = σc/2, where σc is the peak measured values of
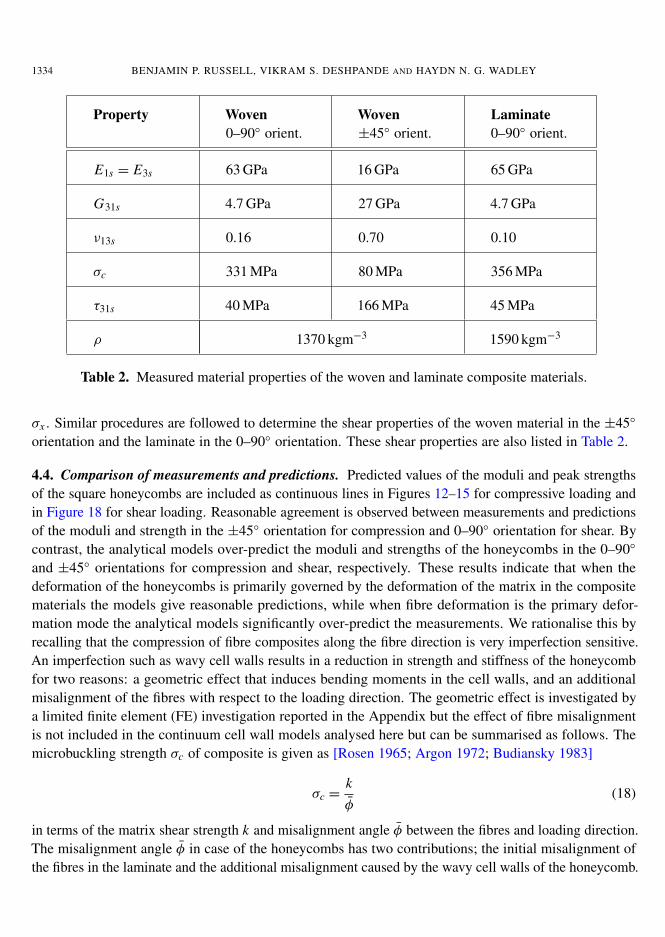
1334 BENJAMIN P. RUSSELL, VIKRAM S. DESHPANDE AND HAYDN N. G. WADLEY
Property Woven0–90◦ orient.
Woven±45◦ orient.
Laminate0–90◦ orient.
E1s = E3s 63 GPa 16 GPa 65 GPa
G31s 4.7 GPa 27 GPa 4.7 GPa
ν13s 0.16 0.70 0.10
σc 331 MPa 80 MPa 356 MPa
τ31s 40 MPa 166 MPa 45 MPa
ρ 1370 kgm−3 1590 kgm−3
Table 2. Measured material properties of the woven and laminate composite materials.
σx . Similar procedures are followed to determine the shear properties of the woven material in the ±45◦
orientation and the laminate in the 0–90◦ orientation. These shear properties are also listed in Table 2.
4.4. Comparison of measurements and predictions. Predicted values of the moduli and peak strengthsof the square honeycombs are included as continuous lines in Figures 12–15 for compressive loading andin Figure 18 for shear loading. Reasonable agreement is observed between measurements and predictionsof the moduli and strength in the ±45◦ orientation for compression and 0–90◦ orientation for shear. Bycontrast, the analytical models over-predict the moduli and strengths of the honeycombs in the 0–90◦
and ±45◦ orientations for compression and shear, respectively. These results indicate that when thedeformation of the honeycombs is primarily governed by the deformation of the matrix in the compositematerials the models give reasonable predictions, while when fibre deformation is the primary defor-mation mode the analytical models significantly over-predict the measurements. We rationalise this byrecalling that the compression of fibre composites along the fibre direction is very imperfection sensitive.An imperfection such as wavy cell walls results in a reduction in strength and stiffness of the honeycombfor two reasons: a geometric effect that induces bending moments in the cell walls, and an additionalmisalignment of the fibres with respect to the loading direction. The geometric effect is investigated bya limited finite element (FE) investigation reported in the Appendix but the effect of fibre misalignmentis not included in the continuum cell wall models analysed here but can be summarised as follows. Themicrobuckling strength σc of composite is given as [Rosen 1965; Argon 1972; Budiansky 1983]
σc =kφ
(18)
in terms of the matrix shear strength k and misalignment angle φ between the fibres and loading direction.The misalignment angle φ in case of the honeycombs has two contributions; the initial misalignment ofthe fibres in the laminate and the additional misalignment caused by the wavy cell walls of the honeycomb.
QUASISTATIC DEFORMATION AND FAILURE MODES OF COMPOSITE SQUARE HONEYCOMBS 1335
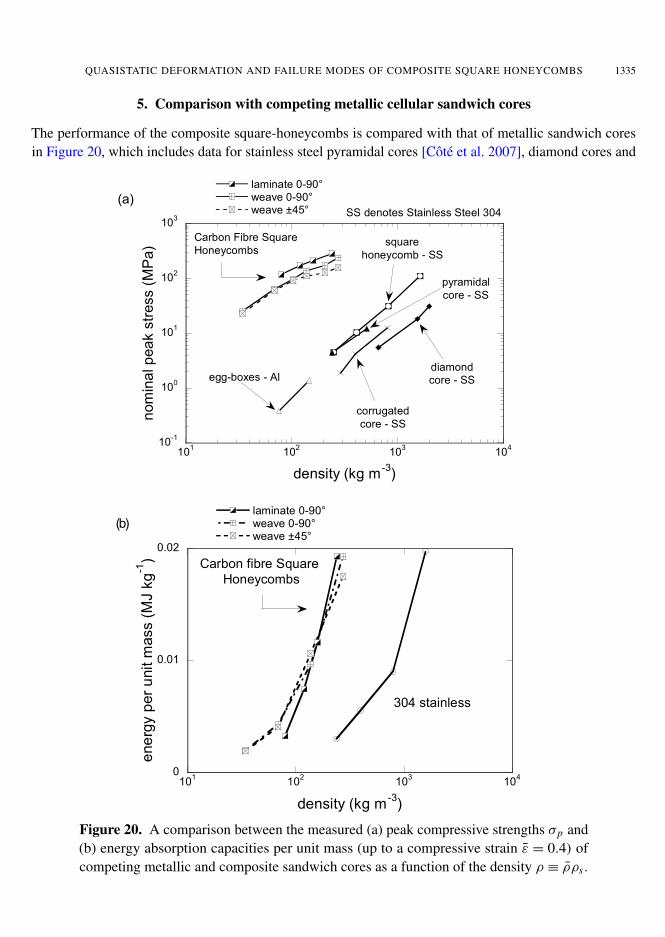
5. Comparison with competing metallic cellular sandwich cores
The performance of the composite square-honeycombs is compared with that of metallic sandwich coresin Figure 20, which includes data for stainless steel pyramidal cores [Cote et al. 2007], diamond cores and
10-1
100
101
102
103
101
102
103
104
laminate 0-90°weave 0-90°weave ±45°
nom
ina
l p
ea
k s
tress (
MP
a)
density (kg m-3
)
diamond
core - SS
corrugated
core - SS
pyramidal
core - SS
Carbon Fibre Square
Honeycombssquare
honeycomb - SS
egg-boxes - Al
(a)SS denotes Stainless Steel 304
0
0.01
0.02
101
102
103
104
laminate 0-90°weave 0-90°weave ±45°
ene
rgy p
er
unit m
ass (
MJ k
g-1
)
density (kg m-3
)
304 stainless
Carbon fibre Square
Honeycombs
(b)
Figure 20. A comparison between the measured (a) peak compressive strengths σp and(b) energy absorption capacities per unit mass (up to a compressive strain ε = 0.4) ofcompeting metallic and composite sandwich cores as a function of the density ρ ≡ ρρs .
1336 BENJAMIN P. RUSSELL, VIKRAM S. DESHPANDE AND HAYDN N. G. WADLEY
corrugated cores [Cote et al. 2006] as well as aluminium egg-boxes [Zupan et al. 2003]. This comparisonis presented for the compressive peak strength in Figure 20a and the compressive energy absorption perunit mass Wv/ρ up to a strain ε = 0.4 in Figure 20b. For a given core density ρ ≡ ρρs , where ρs isthe density of the solid cell wall material, the composite square honeycombs outperform metallic coresboth in terms of their peak strength and energy absorption capacity. More significantly, the compositematerials appear to lie in an area of material space where metallic materials do not seem to exist at all.
To further explore the potential of composite cellular materials, consider the Ashby material propertychart [Ashby and Brechet 2003] shown in Figure 1. Aluminium foams and lattices occupy the low densityregion of material strength – density space. It also reveals a gap between the strength of existing latticematerials and the unattainable materials limit. The compressive strengths of composite honeycombsmeasured in the current study are included in Figure 1 and clearly show that cellular composite materialsexplored here reside in the gap in the material strength versus density space. Also included in Figure1 is the theoretical prediction of the compressive strength of the 0–90◦ laminate (solid line). It is clearthat topologically structuring composite materials in configurations such as the square honeycomb showpromise for filling gaps in the strength versus density map of all known materials; the challenge is foundin manufacturing these materials with minimum imperfections so as to attain their ideal strengths.
6. Concluding remarks
A preliminary investigation of the mechanical properties of square-honeycomb sandwich structures man-ufactured from carbon fibre reinforced polymers has been conducted. Honeycomb cores with relativedensities ρ in the range 2.5% to 20% were manufactured by slotting, assembling and adhesively bondingcomposite sheets. Their out-of-plan compressive and shear response are measured as a function ofrelative density, ratio of the specimen height to cell width, and number of cells in the specimen. Theeffect of the composite material type (laminate and woven) and material orientation on the compressiveand shear responses of the honeycombs is also reported. The measurements indicate that the response isrelatively insensitive to the ratio of the specimen height to cell width and number of cells in the specimen,but strongly dependent on the material type and orientation. In particular, the compressive strength ofthe honeycombs made from laminates with fibres aligned with the compression direction (i.e., 0-90◦
honeycombs) was greater than that of the honeycombs made from the woven material with fibres at±45◦ with respect to the compression direction. However, the energy absorption capacities of these twotypes of honeycombs were almost equal. The role of material orientation reversed for shear loading withthe shear strength of the ±45◦ honeycombs exceeding that of the 0–90◦ honeycombs.
In compression the honeycombs failed by either elastic buckling or plastic microbuckling while inshear the two main failure modes were elastic buckling or shear failure of the composite sheet material.Analytical models are derived for both collapse modes. The predicted strengths are substantially higherthan the measurements especially when fibre deformation dominates the deformation of the compositesheets. These discrepancies result from imperfections arising in the manufacturing of the honeycombsand not accounted for in the analytical models. A limited finite element investigation quantified thesignificant effects of geometric imperfections on the compressive strength of the composite honeycombs.
The measurements and predictions reported here indicate that composite cellular materials with asquare honeycomb topology reside in a gap in the strength versus density material property space, pro-viding new opportunities for lightweight, high strength structural design.
QUASISTATIC DEFORMATION AND FAILURE MODES OF COMPOSITE SQUARE HONEYCOMBS 1337
Appendix A. Finite element calculations of the compressive response of the square honeycombs
The measured values of the peak strengths of the composite honeycombs are substantially below theanalytical predictions. We have attributed this discrepancy to the presence of imperfections in the man-ufactured honeycombs that are not accounted for in the analytical model. In this Appendix we report alimited set of finite element (FE) calculations in order to gauge the effect of geometrical imperfectionson the compressive response of the honeycombs.
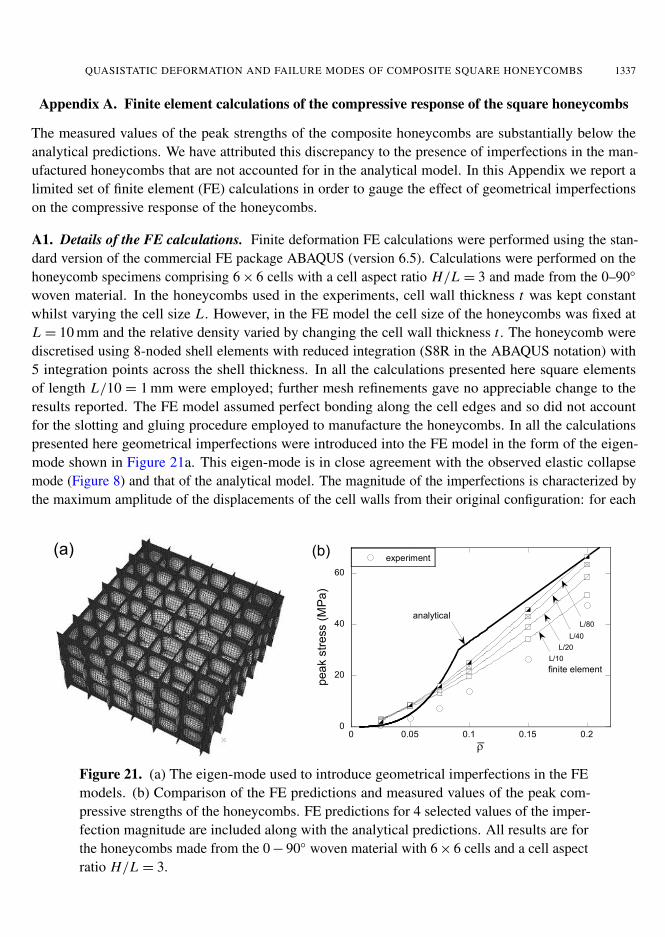
A1. Details of the FE calculations. Finite deformation FE calculations were performed using the stan-dard version of the commercial FE package ABAQUS (version 6.5). Calculations were performed on thehoneycomb specimens comprising 6 × 6 cells with a cell aspect ratio H/L = 3 and made from the 0–90◦
woven material. In the honeycombs used in the experiments, cell wall thickness t was kept constantwhilst varying the cell size L . However, in the FE model the cell size of the honeycombs was fixed atL = 10 mm and the relative density varied by changing the cell wall thickness t . The honeycomb werediscretised using 8-noded shell elements with reduced integration (S8R in the ABAQUS notation) with5 integration points across the shell thickness. In all the calculations presented here square elementsof length L/10 = 1 mm were employed; further mesh refinements gave no appreciable change to theresults reported. The FE model assumed perfect bonding along the cell edges and so did not accountfor the slotting and gluing procedure employed to manufacture the honeycombs. In all the calculationspresented here geometrical imperfections were introduced into the FE model in the form of the eigen-mode shown in Figure 21a. This eigen-mode is in close agreement with the observed elastic collapsemode (Figure 8) and that of the analytical model. The magnitude of the imperfections is characterized bythe maximum amplitude of the displacements of the cell walls from their original configuration: for each
(a)
0
20
40
60
0 0.05 0.1 0.15 0.2
experiment
pea
k s
tress (
MP
a)
U
L/10
_
L/20
L/40
L/80
finite element
(b)
analytical
Figure 21. (a) The eigen-mode used to introduce geometrical imperfections in the FEmodels. (b) Comparison of the FE predictions and measured values of the peak com-pressive strengths of the honeycombs. FE predictions for 4 selected values of the imper-fection magnitude are included along with the analytical predictions. All results are forthe honeycombs made from the 0 − 90◦ woven material with 6 × 6 cells and a cell aspectratio H/L = 3.
1338 BENJAMIN P. RUSSELL, VIKRAM S. DESHPANDE AND HAYDN N. G. WADLEY
value of the relative density ρ, we shall report calculations with imperfection amplitudes L/10, L/20,L/40 and L/80.
The top and bottom surfaces of the honeycomb were tied to two rigid surfaces with all degrees offreedom of the bottom surface constrained. A displacement rate δ = 0.002 ms−1 in the x3 direction wasapplied to the top surface with displacements of that surface in the x1 and x2 directions prevented. Theapplied stress on the honeycomb was inferred from the work conjugate force to the applied displacementin the x3 direction.
Unless otherwise specified, the cell wall material was modelled as an elastic-plastic solid. While theelastic response was assumed to be orthotropic (elastic properties listed in Table 2) for the 0–90◦ wovencomposite, the failure of the composite material under compression was assumed to be approximatelycaptured by a nonhardening J2 flow theory plastic response with a yield strength given by the compressivestrength σc listed in Table 2.
A2. Summary of findings. The FE predictions of the compressive peak strength of the honeycombs areplotted in Figure 21b as a function of ρ for selected values of the imperfection magnitude. The measuredvalues of the peak strengths and the corresponding analytical predictions are also included in Figure 21b.We observe that the imperfections not only significantly reduce the peak strengths of the honeycombsbut also affect the form of the variation of the peak strength σp with relative density ρ when comparedwith the analytical predictions. Reasonable agreement between the measurements and FE predictions,especially at high values of ρ, is observed for the largest imperfection magnitude of L/10.
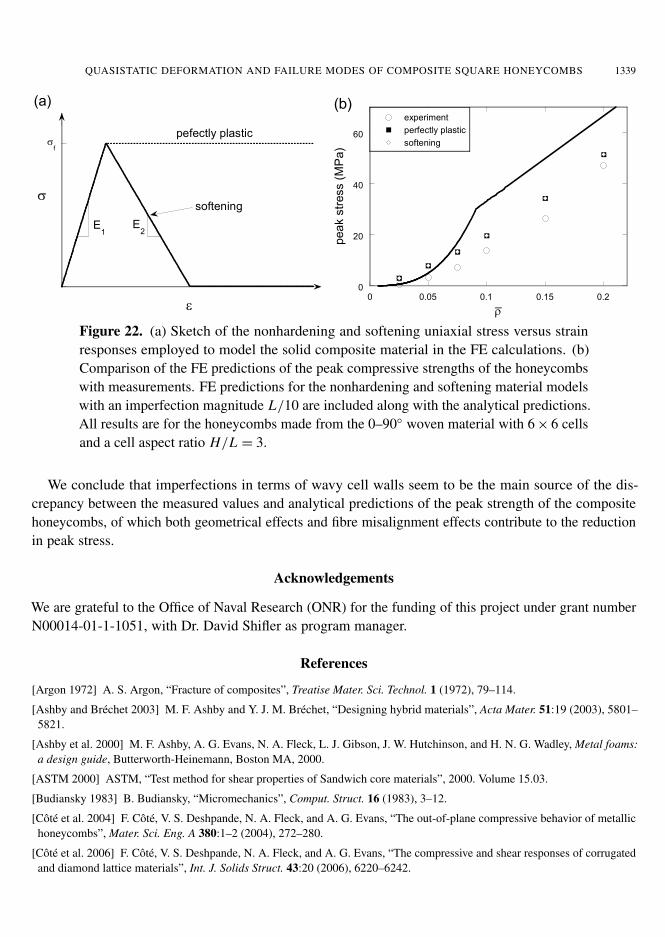
Recall that under compression, the composite displays a strongly softening response; while in the FEresults presented in Figure 21b, the material was assumed to be ideally plastic. In order to explore thevalidity of the material model, we conducted some additional FE calculations with the material describedby a softening post-yield material response as sketched in Figure 22a. In particular the material wasassumed to be orthotropic elastic up to the yield strength σc. Subsequently the material was again assumedas a J2 flow theory material but with a linearly softening post-yield response. The softening rate in termsof the uniaxial stress versus strain response was assumed −dσ/dε = 0.5E3s . FE predictions of the peakstrengths with this new material model are plotted in Figure 22b (for an imperfection magnitude L/10)
along with the corresponding FE calculations assuming nonhardening plasticity from Figure 21b andthe experimental measurements. Including the softening post-yield response of the composite materialappears to have a negligible effect on the peak strength of the honeycombs and thus suggesting thata nonhardening plasticity model is an adequate representation of the composite material in terms ofmodelling the peak strength of the honeycombs.
In addition to the FE calculations presented here, we also performed the following FE calculations inorder to further explore the origins of the rather low measured strengths of the honeycombs:
(i) In order to investigate the effect of loading asymmetry in the experiments, a loading rate δ +ωx2
was imposed on the top rigid surface with the rotation rate ω = 0.03 rad s−1. This had a negligibleeffect on the predicted peak strengths.
(ii) Recall that the honeycombs were manufactured by slotting together sheets and gluing the assembly.The effect of this manufacturing process was modelled in the FE calculations by detaching thecells walls along half the height of the honeycomb (using the “seams” option in ABAQUS). FEpredictions using this model gave results very similar to those presented in Figure 22b.
QUASISTATIC DEFORMATION AND FAILURE MODES OF COMPOSITE SQUARE HONEYCOMBS 1339
Vf
V
H
E2
E1
pefectly plastic
softening
(a)
0
20
40
60
0 0.05 0.1 0.15 0.2
experiment
perfectly plastic
softening
pea
k s
tress (
MP
a)
(b)
U_
Figure 22. (a) Sketch of the nonhardening and softening uniaxial stress versus strainresponses employed to model the solid composite material in the FE calculations. (b)Comparison of the FE predictions of the peak compressive strengths of the honeycombswith measurements. FE predictions for the nonhardening and softening material modelswith an imperfection magnitude L/10 are included along with the analytical predictions.All results are for the honeycombs made from the 0–90◦ woven material with 6 × 6 cellsand a cell aspect ratio H/L = 3.
We conclude that imperfections in terms of wavy cell walls seem to be the main source of the dis-crepancy between the measured values and analytical predictions of the peak strength of the compositehoneycombs, of which both geometrical effects and fibre misalignment effects contribute to the reductionin peak stress.
Acknowledgements
We are grateful to the Office of Naval Research (ONR) for the funding of this project under grant numberN00014-01-1-1051, with Dr. David Shifler as program manager.
References
[Argon 1972] A. S. Argon, “Fracture of composites”, Treatise Mater. Sci. Technol. 1 (1972), 79–114.
[Ashby and Bréchet 2003] M. F. Ashby and Y. J. M. Bréchet, “Designing hybrid materials”, Acta Mater. 51:19 (2003), 5801–5821.
[Ashby et al. 2000] M. F. Ashby, A. G. Evans, N. A. Fleck, L. J. Gibson, J. W. Hutchinson, and H. N. G. Wadley, Metal foams:a design guide, Butterworth-Heinemann, Boston MA, 2000.
[ASTM 2000] ASTM, “Test method for shear properties of Sandwich core materials”, 2000. Volume 15.03.
[Budiansky 1983] B. Budiansky, “Micromechanics”, Comput. Struct. 16 (1983), 3–12.
[Côté et al. 2004] F. Côté, V. S. Deshpande, N. A. Fleck, and A. G. Evans, “The out-of-plane compressive behavior of metallichoneycombs”, Mater. Sci. Eng. A 380:1–2 (2004), 272–280.
[Côté et al. 2006] F. Côté, V. S. Deshpande, N. A. Fleck, and A. G. Evans, “The compressive and shear responses of corrugatedand diamond lattice materials”, Int. J. Solids Struct. 43:20 (2006), 6220–6242.
1340 BENJAMIN P. RUSSELL, VIKRAM S. DESHPANDE AND HAYDN N. G. WADLEY
[Côté et al. 2007] F. Côté, N. A. Fleck, and V. S. Deshpande, “Fatigue performance of sandwich beams with a pyramidal core”,Int. J. Fatigue 29:8 (2007), 1402–1412.
[Deshpande et al. 2001a] V. S. Deshpande, M. F. Ashby, and N. A. Fleck, “Foam topology: bending versus stretching dominatedarchitectures”, Acta Mater. 49:6 (2001), 1035–1040.
[Deshpande et al. 2001b] V. S. Deshpande, N. A. Fleck, and M. F. Ashby, “Effective properties of the octet-truss latticematerial”, J. Mech. Phys. Solids 49:8 (2001), 1747–1769.
[Ericksen and March 1958] W. S. Ericksen and H. W. March, “Compressive buckling of sandwich panels having dissimilarfacings of unequal thickness”, Report 1583-B, Forest Products Laboratory, Madison, WI, 1958.
[Evans et al. 1998] A. G. Evans, J. W. Hutchinson, and M. F. Ashby, “Multifunctionality of cellular metal systems”, Prog.Mater. Sci. 43:3 (1998), 171–221.
[Finnegan et al. 2007] K. Finnegan, G. Kooistra, H. N. G. Wadley, and V. S. Deshpande, “The compressive response of carbonfiber composite pyramidal truss sandwich cores”, Int. J. Mater. (2007), 1264–1272.
[Fleck and Deshpande 2004] N. A. Fleck and V. S. Deshpande, “The resistance of clamped sandwich beams to shock loading”,ASME J. Appl. Mech. 71 (2004), 386–401.
[Gibson and Ashby 1997] L. J. Gibson and M. F. Ashby, Cellular solids, structure and properties, 2nd ed., Cambridge Univer-sity Press, Cambridge, 1997.
[Krivetsky 1959] A. Krivetsky, “Buckling of orthotropic plates (corrugated plate applications)”, Report 7-60-941001, BellAerospace Company, 1959.
[Marasco et al. 2006] A. I. Marasco, D. D. R. Cartié, I. K. Partridge, and A. Rezai, “Mechanical properties balance in novelZ-pinned sandwich panels: Out-of-plane properties”, Compos. A: Appl. Sci. Manuf. 37:2 (2006), 295–302.
[Rosen 1965] B. W. Rosen, “Mechanics of composite strengthening”, Chapter 3, pp. 37–75 in Fiber composite materials,American Society for Metals, Metals Park, OH, 1965.
[Seydel 1930] E. Seydel, “Jahrbuch 1930 der Deutschen Versuchsanstalt fur Luftfahrt”, NACA Technical Memorandum 602,1930.
[Wadley 2002] H. N. G. Wadley, “Cellular materials manufacturing”, Advanced Eng. Mat. 4:10 (2002), 726–733.
[Wadley 2006] H. N. G. Wadley, “Multifunctional periodic cellular metals”, Phil. Trans. R. Soc. A 364 (2006), 31–68.
[Xue and Hutchinson 2004] Z. Xue and J. W. Hutchinson, “A comparative study of impulse-resistant metal sandwich plates”,Int. J. Impact Eng. 30:10 (2004), 1283–1305.
[Zupan et al. 2003] M. Zupan, C. Chen, and N. A. Fleck, “The plastic collapse and energy absorption capacity of egg-boxpanels”, Int. J. Mech. Sci. 45:5 (2003), 851–871.
Received 21 Feb 2008. Revised 23 May 2008. Accepted 1 Jun 2008.
BENJAMIN P. RUSSELL: [email protected] Department, Trumpington Street, University of Cambridge, Cambridge CB2 1PZ, United Kingdom
VIKRAM S. DESHPANDE: [email protected] Department, Trumpington Street, University of Cambridge, Cambridge CB2 1PZ, United Kingdom
HAYDN N. G. WADLEY: [email protected] of Materials Science and Engineering, University of Virginia, 395 McCormick Road, Charlottesville VA 22904,USA