Embed Size (px)
Citation preview
Pergamon
J. Mech. Phys. Solids, Vol. 45, No. 11/L& pp. 1955-1999, 1997 0 1997 Elsevier Science Ltd
Printed in Great Britain. All rights reserved
PII : s0022-5096(!37)ooo21-5 0022-5096/97 $17.00+0.00
QUASISTATIC AND DYNAMIC REGIMES OF GRANULAR MATERIAL DEFORMATION UNDER IMPULSE
LOADING
D. J. BENSON, V. F. NESTERENKO, F. JONSDOTTIR and M. A. MEYERS
Institute for Mechanics and Materials, Department of Applied Mechanics and Engineering Sciences, University of California, San Diego, CA 92093, U.S.A.
(Received 18 November 1996 ; in revisedform 13 March 1997)
ABSTRACT
A two-dimensional computer code, using a multi-material Eulerian finite element formulation, was used to investigate the dynamic micromechanical behavior of granular material. The main results are :
The strain-rate insensitive material model provides the correct increase in the dissipated energy with an increase of shock pressure ;
An increase in the initial porosity or the pressure results in the transition from the quasistatic to the dynamic regime of particle deformation, which can be characterized by the intensive localized plastic flow on the particles’ interfaces. A new space scale is introduced into the system-the width of localized plastic flow ;
The macro and micro-scale responses of the granular material do not depend on the particle size for a rate independent material model ;
The energy of the shock wave compression at high pressures cannot be completely dissipated during the pore collapse at the shock front ;
The transition pressure from the quasistatic to the dynamic deformation regime does not depend on the density of the solid material for a given porosity with the other material properties fixed ;
A well developed dynamic regime correlates with a critical value of the microkinetic energy, which is comparable to the geometrically necessary energy for complete pore collapse.
The results of computer calculations are in qualitative agreement with the experiments. 0 1997 Elsevier Science Ltd.
Keywords: A. shock waves, A. powder compaction, B. granular material, C. finite elements.
1. THE STATE OF THE ART IN THE MICROMECHANICS OF GRANULAR MATERIALS UNDER SHOCK LOADING
Continuum level models, based on the shock Hugoniot curve, are unable to describe the highly heterogeneous state of the material behind the shock wave in porous materials. Processes on the microstructural level depend not only on such mac- roparameters as porosity and pressure, but also on the particle (pore) morphology, and the distribution of the plastic deformation and the temperature, which is very heterogeneous. Processes on the particle interfaces are responsible for the good bonds between the particles, phase transformations, and chemical reactions under intense dynamic loading.
1955

1956 D. J. BENSON CC al.
a
a,=Rvs
b,=RVG
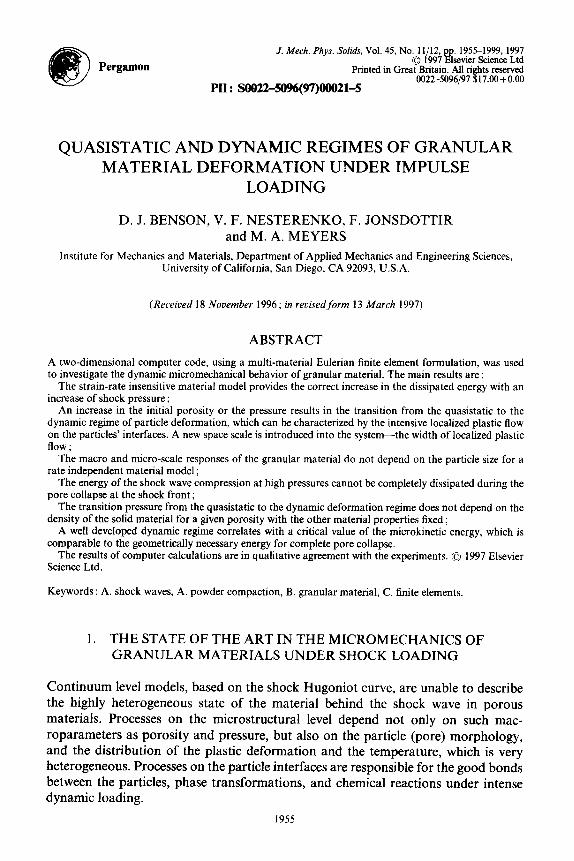
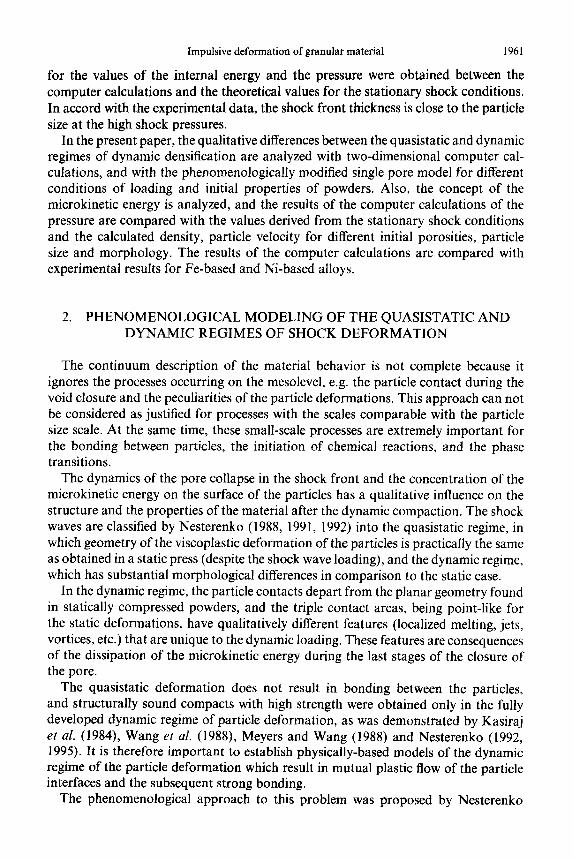
b C Fig. 1. “Real” material (a), geometry of Carroll-Holt model (b) and modified model (c).
Carroll and Holt (1972) used the hollow-sphere model to investigate the behavior of porous materials on the microlevel. They obtained a dynamic compaction equation with inertial effects. In this approach, the porosity and the average pore size of the real material [Fig. I(a)] are described by the porosity and the initial inner radius of the model sphere [Fig. 1 (b)]. The resulting differential equations describe the elastic- plastic work, the kinetic energy of compacted material and the stationary shock wave structure. Butcher et al. (1974) included both viscous dissipation and deviatoric stress effects in the same model geometry, and they were able to obtain good agreement with the experimental data for shock waves in porous aluminum.
The principal importance of the strain rate effects (viscous dissipation) for energy dissipation in the spherical pore model was emphasized in the analysis of the non- equilibrium heating of porous materials by Dunin and Surkov (1982), and Attetkov et al. (1984). In these papers, the yield strength and the viscosity were temperature independent to permit an analytical treatment, despite the temperature ranging from ambient to melting.
In extending the analyses, Carroll et al. (1986) included linear thermal softening for the yield strength. They also postulated an exponential dependence of the viscosity on the temperature, based on the experimental values of the viscosity at large defor- mations and in the melted state. They obtained a good description of the shock front thickness in copper powder, which was demonstrated to be sensitive to the powder structure in experiments by Nesterenko (1975). The inclusion of the temperature
Impulsive deformation of granular material 1957
effects clearly demonstrated that there are two qualitatively different regimes of powder densification, resulting in different final structures in the compacted material. The increase of the pressure amplitude, or the initial preheating, results in a transition to the range “where the inertial effect dominates the compaction process, that tur- bulent flow occurs. . . ” as was emphasized by Carroll et al. (1986). A single-pore model predicts this change in the compressed material structure, due to the transition from low to high pressures (at normal initial temperatures), at I-10 GPa for a copper powder with an initial porosity cp = 0.5 (the ratio of the void volume to the total volume), which is in agreement with the experiments.
Nesterenko (1988, 1992) modified the geometry of the single-pore model by intro- ducing a non-deformable central core [Fig. 1 (c)l. For granular materials, the particle mass was used as a “size” parameter instead of the non-existent pore size. The core prevents the spherically symmetric convergence of the outer shell to the center as in the hollow sphere model, and separates the dissipation process into two states : during pore closure and afterward. It also allowed the introduction of the concept of the microkinetic energy, which is the microlevel energy dissipated by the viscopiastic flow of the material after the pore collapse, and to divide the shock wave loading into quasistatic and dynamic regimes. It is possible to discern one regime from the other according to the “deviations of particle contact geometry from straight lines and joint points of neighborhood particles, which are point like for a quasistatic regime and have peculiarities (melts, jets) for a dynamic regime as a result of the microkinetic energy on the last stage of pore collapse,” as emphasized by Nesterenko, et al. (1990, 1991, 1992). Quasistatic deformation does not result in the bonding between the particles even under high pressures, and structurally sound compacts were obtained only in the fully developed dynamic regime of the particle deformation.
The proposed criteria for the transition between the two regimes was based on the ratio of the minimum plastic work necessary for the collapse of the spherical pore to the total internal shock energy. For some materials, the necessary plastic work can be connected with the initial microhardness of particles, which is easily measurable in experiments (Nesterenko and Lazaridi, 1990 ; Nesterenko 1995).
Recently Tong and Ravichandran (1993, 1994) used the classical single hollow- sphere model with an elastic/viscoplastic material that included strain-rate sensitivity, strain hardening, and thermal softening. They obtained good agreement with the available data on the shock front thickness in copper powder as measured by Nes- terenko (1975) and with the data of Holman et al. (1994) for 2Al+ Fe,O, powder mixtures.
The micromechanical models based on the single-pore approach play a very impor- tant role in the analysis of the dynamic processes, and they provide guidelines in
understanding the densification kinetics of powders and granular materials. The single-pore models are useful when their application results in analytical equations and qualitative predictions which may be compared to experiments. Unfortunately, the single pore approach has very strong geometrical constraints. It does not take into account the real geometry of the particles and the pores, the resulting non- uniform plastic flow, the pore collapse in porous mixtures of particles with different mechanical properties, and the mutual interactions of the collapsing pores through the non-uniform pressure field surrounding the pores. The essential disadvantage of
1958 D. J. BENSON et al.
the single-pore models is that, for a strong shock, the actual shock front thickness is close to the particle size, which makes very questionable any continuum level approach to understanding processes on the shock front. Even “perfectly” cylindrically sym- metrical pore collapse is accompanied by shear localization and a subsequent break of the cylindrical symmetry during the last stage of pore closure, as was experimentally shown by Nesterenko and Bondar (1994) for several materials. Approaches that neglect the aforementioned problems, while trying at the same time to saturate the single pore model with “exact” material behavior models, heat conductivity effects, melting, etc. have rapidly diminishing returns.
It has been demonstrated that the material structure is responsible for the energy distribution between the components in powder mixtures, and that an increase of the particle size can result in an increase of the particle contact non-equilibrium tem- perature as was demonstrated by Nesterenko (1975, 1992). Kruegen et al. (1992) and Tadhani et al. (1994) have shown experimentally that the particle morphology determines the thermomechanical response of the components in porous mixtures and the possibility of chemical reactions. Therefore, it is very important to develop models which take into account the real geometry of the powder and the resulting non-uniform plastic flow.
A qualitatively different approach to this problem, microlevel numerical modeling was proposed by Williamson and Berry (1986). This modeling takes into account the real geometry of particles and the void space. They considered a two-dimensional model of a closest-packed unit cell which was represented by three layers of 304 SS cylinders with diameters of 75 pm, placed within rigid boundaries on the bottom and sides. The compaction was initiated by the impact of a stainless steel flyer having an initial velocity of 1 km s-‘. An elastic/perfectly plastic model without work hardening and rate dependence was used to model the powder particles. The conduction heat transfer effects were included, along with the solid to liquid melt transition, and the dependence of the material strength on temperature. The model predicted the localization of the plastic deformation on the particle boundaries, resulting in the concentration of heat on the surfaces of the particle and local melting.
Williamson et al. (1989, 1990) investigated the dynamic compaction of a porous mixture of two different materials (Sic fiber-reinforced aluminum matrix composite) with a two-dimensional computer model and experiments. Fracture was taken into account by using a simple maximum tension criterion and introducing a localized crack resulting in the relief of the tension. During the initial stress wave propagation through the particles, tensile stresses in excess of the estimated dynamic fracture stress of SIC were obtained in the computer calculations, thus predicting the fracture within the SIC fibers detected in the experiments. For impact plate velocities greater than 0.5 km s-l, the melting of the aluminum matrix was predicted in the regions of the greatest flow, which is in accord with experimental observation. The pores with the greatest volume (without the SIC fibers) are the sites of largest thermal energy depo- sition during consolidation. It is worthwhile to mention that the pore collapse in this model results from the plastic flow of approximately one-half of the material (from the side of the shock propagation) around the pore, which is in disagreement with the spherical single-pore model. The authors also mentioned the local high pressure spikes at the moment of pore closure, which clearly demonstrates that plastic flow during

Impulsive deformation of granular material 1959
the pore closure is unable to dissipate all of the shock energy. The remaining energy is represented by the microkinetic energy, which is dissipated in the fully compacted material. These features cannot be taken into consideration within the limited frame- work of the hollow sphere model.
Williamson (1990) has undertaken an extensive study of the dynamic compaction of a granular material (304 SS) with different particle morphologies (monosized, bimodal particle distribution, and a matrix of identical hollow cylinders) within the framework of a two-dimensional model. The influence of the gas trapped in the interstitials in a monosized system was also considered. As in the previous papers (Williamson and Berry, 1986 ; Williamson et al., 1989 ; Williamson and Wright, 1990) the material strength in the solid phase is approximated by an elastic, perfectly plastic constitutive relation without work hardening, but which includes the effects of pressure and temperature on the shear modulus and flow stress. An important result of this paper is the demonstration (according to determination by Nesterenko, 1992, 1995), of the transition from quasistatic (projectile impact velocity 0.5 km s-l) to the dynamic regime of powder compaction (impact at 1 and 2 km SC’). At impact velocities of 1 and 2 km s-l, the heating of the particles near their surfaces is a result not only of the plastic flow of the material inside the empty space, but to a comparable extent, it is also a result of the local high pressures resulting from the pore collapse. It demonstrates the qualitative importance of the collective character of the pore dynamics on the heterogeneous heat release. The system with the bimodal particle distribution has a decrease in the heating in the vicinity of the large particle surfaces in comparison with monosized system (note that porosities of the systems are differ- ent), and the relative degree of deformation of small particles is much greater than for the large ones, as was detected in experiments by Nesterenko (1985, 1992). The analysis of the porous material with the hollow particles demonstrated that the final temperature distribution is qualitatively different from the solid particles, resulting in a greater energy density at complete consolidation in the case of the solid particles. The collapse of the cylindrical holes created hot spots separated at a distance close to the radius of the initial hole. A gas trapped in the interstitials greatly increased the local temperature on the particle surfaces, but only slightly changed the internal energy and the size of the melted zones.
The results of the papers on microlevel numerical modelling provide important, qualitatively new information about the material behaviour during dynamic con- solidation, which is in many aspects outside the range of the single-pore models. Nevertheless, these results are only for a powder element with a few cylindrical particles, and the complicated morphology of real granules can result in qualitative differences. The small unit cell in their investigations cannot be used to obtain the averaged parameters of the material, e.g. pressure or wave speed, which could be compared with values measured in experiments. The geometry of the model does not permit comparison with the state behind a stationary shock wave and the question is open whether these results are applicable for stationary shocks, or if they are typical only for an experimental geometry close to the idealized geometry of the computer calculations, which permits only symmetric material flow according to the wave propagation direction.
Benson (1994, 1995) developed a two-dimensional computer code which is able

1960 D. 1. BENSON et al.
to address these problems. Benson and Nellis (1994a, b) considered the dynamic consolidation of a copper powder, as a model material, in a two-dimensional geometry with cylindrical and rectangular particles of different sizes. It was demonstrated that the averaged pressures behind the impulse front at the same initial densities did not depend on the particle shape, and the computed shock velocity-particle velocity relation is close to the corresponding data obtained from available experimental results. The plastic deformation is localized on the particle surfaces and the ratio of the temperatures between the surface of the particles and their interior was approxi- mately five at a piston velocity of 1 km s-l and 3.5 at 2 km SF’ for an initial porosity of 9 = 0.19. An interesting peculiarity of the rectangular particles is that the plastic flow is much less turbulent (as defined by the deformed particle geometry) than for the cylindrical particles at the same initial porosity. It can be connected to the lower microkinetic energy in the first case as a result of the more effective dissipation process. The faces of the rectangular particles, which are parallel to the piston surface, are practically undisturbed by the shock passage. The characteristic heterogeneous tem- peratures for these particle geometries are close, and the transition from quasistatic to dynamic deformation, accompanied by jet and vortex formation, was observed when piston velocity changed from 0.25 to 1 km s-l.
Benson and Nellis (1994a, b) compared the results of two-dimensional computer calculations of a model powder consisting of approximately 100 cylindrical particles with diameters ranging from 15 to 20 pm to an experiment with a copper powder having the same size distribution with spherical particles at the same initial density of 6.2 g cm-3. The piston velocity in the calculation was equal to 0.2 km s-‘, cor- responding to a shock pressure 2 GPa according to the author’s calculation (Benson and Nellis, 1994b). A good agreement was obtained between the quasistatic geometry of the particle deformation in the computer calculation and in the physical experiment.
Meyers et al. (1994) and Shang et al. (1994) analyzed the difference between the final particle geometry of Cu and Sic powders with the same particle sizes, initial density (80% of the theoretical density) and particle velocity (1 km s-l) using the results of two-dimensional computer calculations. It was demonstrated that the defor- mation regime for the copper powder was the dynamic one, while it was quasistatic for the Sic powder. The difference in behaviour of these two materials is due to the fact that the copper powder shock energy exceeds the “geometrically necessary” energy for complete consolidation. The remaining “redundant” energy, in the form of microkinetic energy, is dissipated into jet and vortex formation. It provides a dynamic regime of deformation and good bonding in accord with Nesterenko’s approach (Nesterenko and Lazaridi, 1990; Nesterenko, 1992, 1995), which explains why the pressures which are necessary for the consolidation of SIC are much greater than to consolidate a copper powder.
Benson et al. (1995) demonstrated experimentally and in two-dimensional computer calculations that the particle contact surfaces undergo non-uniform plastic defor- mation and subsequent bonding. Benson et al. (1996) also have shown that increasing the shock pressure results in a transition from the quasistatic to the dynamic defor- mation regimes, that this transition pressure depends on the porosity and does not depend on the particle size or the particle material density, and that the well-developed dynamic regime correlates with the microkinetic energy. In addition, good agreement
Impulsive deformation of granular material 1961
for the values of the internal energy and the pressure were obtained between the computer calculations and the theoretical values for the stationary shock conditions. In accord with the experimental data, the shock front thickness is close to the particle size at the high shock pressures.
In the present paper, the qualitative differences between the quasistatic and dynamic regimes of dynamic densification are analyzed with two-dimensional computer cal- culations, and with the phenomenologically modified single pore model for different conditions of loading and initial properties of powders. Also, the concept of the microkinetic energy is analyzed, and the results of the computer calculations of the pressure are compared with the values derived from the stationary shock conditions and the calculated density, particle velocity for different initial porosities, particle size and morphology. The results of the computer calculations are compared with experimental results for Fe-based and Ni-based alloys.
2. PHENOMENOLOGICAL MODELING OF THE QUASISTATIC AND DYNAMIC REGIMES OF SHOCK DEFORMATION
The continuum description of the material behavior is not complete because it ignores the processes occurring on the mesolevel, e.g. the particle contact during the void closure and the peculiarities of the particle deformations. This approach can not be considered as justified for processes with the scales comparable with the particle size scale. At the same time, these small-scale processes are extremely important for the bonding between particles, the initiation of chemical reactions, and the phase transitions.
The dynamics of the pore collapse in the shock front and the concentration of the microkinetic energy on the surface of the particles has a qualitative influence on the structure and the properties of the material after the dynamic compaction. The shock waves are classified by Nesterenko (1988, 1991, 1992) into the quasistatic regime, in which geometry of the viscoplastic deformation of the particles is practically the same as obtained in a static press (despite the shock wave loading), and the dynamic regime, which has substantial morphological differences in comparison to the static case.
In the dynamic regime, the particle contacts depart from the planar geometry found in statically compressed powders, and the triple contact areas, being point-like for the static deformations, have qualitatively different features (localized melting, jets, vortices, etc.) that are unique to the dynamic loading. These features are consequences of the dissipation of the microkinetic energy during the last stages of the closure of the pore.
The quasistatic deformation does not result in bonding between the particles, and structurally sound compacts with high strength were obtained only in the fully developed dynamic regime of particle deformation, as was demonstrated by Kasiraj ef al. (1984), Wang et al. (1988), Meyers and Wang (1988) and Nesterenko (1992, 1995). It is therefore important to establish physically-based models of the dynamic regime of the particle deformation which result in mutual plastic flow of the particle interfaces and the subsequent strong bonding.
The phenomenological approach to this problem was proposed by Nesterenko

1962 D. J. BENSON et al.
(1988, 1992, 1995) on the basis of a comparison of the energy, Ed, which could be dissipated during dynamic pore collapse with the geometric conditions typical of static deformation, and the internal shock wave energy, E. The corresponding criterion for the transition from the static regime to the dynamic can be written as
where K is a constant.
Ed/E = K, (1)
The physical meaning of (1) is that if, at the end of void collapse into the quasistatic geometry, the amount of the dissipated energy is small enough in comparison to the total energy E, the remaining energy (represented by the microkinetic energy) will produce specific changes in the particle geometry and material structure during and after the void closure. This provides the conditions for the pressure-shear deformation which is favorable for phase transformations, jetting and local melting, chemical reactions, and bonding between particles. In the quasi-static case, when the mic- rokinetic energy is small during the collapse of the pore, there is no need for the material to undergo plastic deformation geometrically different from the static process of compaction.
It is interesting to evaluate Ed with a spherically symmetrical model, e.g. the modified Carroll-Holt model, and for the cylindrically symmetrical model (Fig. 1). The spherical symmetry ensures the maximum dissipation of energy for a given material at a specified porosity under quasistatic conditions as was suggested by Nesterenko (1992). If the material properties allow the viscous part of the dissipation to be neglected, and the averaged, constant magnitude of yield strength, F, is intro- duced, then the equation for E,, in the spherical case for the modified model can be written as
H(x) = xlnx-(x-l)ln(x-l),
a0 aI x0 = __
Q-1 ’ a,-1’
PS 1
a=r-9’ (4
where ps and pP are the density of solid material and density of powder, cp is the porosity, and ~1~ and CI, are the density ratios for initial and densified states behind the shock. It is necessary to use the initial and final coefficients a0 and a, for the traditional Carroll-Holt model [Fig. 1 (b)], instead of x0 and x1 for the modified Carroll-Holt model [Fig. 1 (c)l.
First we compare the energy of plastic deformation, Eds, which is necessary to completely collapse the pore in the spherical geometry, with Ed0 the same quantity for the axisymmetric model of porous material [Fig. l(d)] to be sure that the two geometries do not produce qualitatively different results per unit mass.
The plastic work increment per unit volume is

Impulsive deformation of granular material
dw = cef deef,
where oer and E,‘ are effective stress and effective strain :
o,f=i[(~1-02)2+(o*-63)2+(bj-6,)*]1’2, G G
E,f = -+ -Ed2 +(E* --E3)2 + (&3 -&,)2]“2.
1963
(3)
(4)
For the axisymmetric model geometry,
& =E 1 ,r =ln PO 0 P ’
E2 = E,, = -In fi = _-E,,
0 P
E3 = E, = 0,
E.,=$~E;+Ef+.:~2 =$El.
Using the von Mises criterion,
(5)
((TI -02)2+(fJ2 -a#+@,--o,)2 = 2Y2, (6)
where Y is the yield stress in uniaxial tension, for a cylindrical geometry gef = Y. For the rigid-plastic material, the plastic deformation work w, per unit volume at a point having a final radius of p is
(7)
where R,, is initial pore radius. The work of the plastic deformation per unit mass, Edc (R, is the final outer radius)
is :
Edc =&jOR’ln(l+$)pdp. (8)
Introducing the expression for the initial density ratio Q,
JG Lx0 = l+F’
I (9)
and using a table of definite integrals (Gradshtein and Ryzhik, 1980), the final expression for Edc is
Edc = __ ’ [a,lna,-(a,-l)lncr,-11. J&S
(10)
It is important that Edc and Eds depend only on the initial density ratio a, (porosity). A comparison of (2) and (10) reveals that the geometrically necessary dissipation energies have an identical dependence on the porosity for both geometries, and their ratio is
1964 D. J. BENSON et al
Edc a z 0.87 _=- Ec,s 2 '
(11)
This difference between the characteristic energies Edc and Eds is too small to quali- tatively change the dynamic behavior of powders.
The expression for the total internal energy per unit mass, E, supplied to the material during shock densification, can be easily obtained if the final density is close to the theoretical solid density pS :
E = ;u2 = &(a0 - l), \
(12)
where u is particle velocity behind shock front. From (I), (2) and (12), a criterion for the transition from the quasistatic to the dynamic regime is
P>P,= 2~sEci K(%rl)
(13)
if the potential energy can be ignored, and Ed is the geometrically necessary energy for complete pore collapse : PC is the transition pressure.
Nesterenko and Lazaridi (1990, 1992) proposed to put P equal to its initial value Y,,. In this case, all materials can be compared according to their initial yield strength. This approximation is reasonable for some rapidly solidified granular materials if their microhardness does not change drastically during compaction and the viscous dissipation can be neglected. The coefficient K was taken to be 0.5 for the beginning of the dynamic deformation regime at a critical pressure PC,. The value of K = 0.25 was proposed to describe the transition to the developed dynamic deformation regime at a critical pressure Pc2, resulting in structurally sound compacts. The calculated values based on this approach for the critical pressure PC2 are in good agreement with experiments of Kasiraj et al. (1984) and Nesterenko and Lazaridi (1990) for rapidly solidified stainless steel granules, where the final tensile strength of compacts was measured.
For the nickel superalloy IN 7 18, the microhardness increased from an initial value Hv = 230 to Hv = 500 during the dynamic consolidation as demonstrated by Wang et al. (1988) which should result in an increase of Y which is used in the calculation of Ed. If we formally take the value F = Y, = 0.714 GPa, then at K = 0.5, the critical pressures for the transition to the dynamic regime are 3.2 and 2.1 GPa for the Carroll- Holt and the modified models with an initial porosity cp = 0.4.
Wang et al. (1988) and Meyers and Wang (1988) observed for IN71 8 powders with an initial porosity ‘p = 0.4 the beginning of melting in separate spots (that can be associated with the beginning of the dynamic regime) at 3 GPa and relatively good bonding at 15 GPa. The comparison between these data and the results of the model calculations demonstrates reasonable qualitative agreement, taking into account the role of hardening. Plastic hardening can increase the values of P,, up to 2.2 times if Y can be considered proportional to the microhardness.
The importance of this approach, which is based on the experimental results for one material, and is expected to be true for others, is in clarifying the tendencies which
Impulsive deformation of granular material 1965
can be expected if the material properties are changed. For example, PC, in (13) does not depend on the particle size and the solid density, which is in agreement with the independence of the compact strength on the initial particle sizes (Nesterenko, 1992). It is necessary to mention that this conclusion is valid only if the viscous dissipation, strain hardening, and thermal softening can be ignored. For metals, this approach can be used to estimate a lower bound on the transition pressure. The critical pressure is dependent on the particle size and ps if the viscous effects dominate the dissipation stage of the quasistatic deformation, which can be expected for polymers and low strength metals.
Evidently, this model suffers from many uncertainties, such as the validity of using the value of K obtained for one material for another, and the impossibility of including the dependence of Y on the temperature, strain and strain rate effects, etc. Also, despite the determination that the quasistatic and dynamic regimes are of a qualitative nature, and that the boundary between them is determined apriori, the vastly different behaviour of the granular material in these two regimes, resulting in different proper- ties of the compacts, justifies their separation. The situation resembles the transition from laminar to turbulent flow. It is important to establish the dependence of the transition pressure on the material properties and the morphology of powder particles, or at least to clarify the main tendencies.
Computer modelling can be a powerful instrument to determine the qualitative regimes of powder deformation as a function of their mechanical properties and particle morphology.
3. TWO-DIMENSIONAL COMPUTER MODELLING OF THE SHOCK CONSOLIDATION PROCESS
3.1. Geometry of the model
Since the powder particles have an initially random packing, a representative element of volume must have a moderate to large number of particles to represent the powder. A Monte Carlo technique, which used an experimentally measured particle size distribution, was combined with a pseudo-gravity particle packing method to generate an initial particle distribution with over 100 particles.
The different initial geometries of packing of the cylindrically symmetrical particles with various sizes and porosities are shown in Fig. 2. The pseudo-gravity method for cylindrically symmetric particles typically packs the particles to a density of approximately 80% of the solid density [Fig. 2(a,c)]. Most real powders have a density closer to 50% of the solid density. One means of obtaining a lower density from the initial pseudo-gravity packing is to delete individual particles randomly until the correct density is obtained. Calculations performed using this approach show a large amount of jetting, even at low shock pressures, that is not found in the experiments. The reason is that this approach produces the holes with the sizes which are absent in real 3-D granular material, where “pores” are distributed more or less uniformly around a particle surface.
A more successful approach to reducing the density of the initial pseudo-gravity

1966 D. J. BENSON et al.
Transmitting Boundary Condition
a
b C
Fig. 2. Initial geometry of cylindrical particles in 2-D computer calculations : a-particles with porosity 0.19, large spread in sizes (0.5-10 pm), b-particles with porosity 0.4, small spread in sizes (31WO pm), c-particles with porosity 0.19, small spread in sizes (74-88 pm). The arrow shows direction of shock wave
propagation.
packing is motivated by examining a two-dimensional slice through a three-dimen- sional packing of particles. Naturally, the particles being in contact in three dimensions are not necessarily in contact in the two-dimensional slice [Fig. 2(b)]. The apparent two-dimensional size distribution is altered because the slice does not cut through the center of all the particles in a 3-D packing geometry.
In the present calculations, the particle size distribution is scaled by a constant factor, S. The particles are packed using the pseudo-gravity method, and the diameters of the packed particles are resealed by l/S while keeping their locations fixed. The factor is chosen so that the final density after the resealing is correct.
Impulsive deformation of granular material 1967
A Monte-Carlo sampling could alter the size distribution of the cylindrical particles in the two-dimensional model to reflect the apparent size distribution of the slice through the three-dimensional packing. It is not clear that the altered size distribution would produce a better solution. The mean diameter of a particle that the shock wave “sees” as it propagates through the powder is equal to the volume of the particle divided by the diameter of the particle (the thickness of the particle parallel to the shock front), which is approximately 0.82 of the original diameter in the cylindrical geometry. Until sensitive statistical methods for characterizing the morphology of the shocked powders is developed, it is unlikely that the 0.18 constant size difference will be discernible. The original size distribution is therefore used in the present calculations.
A velocity boundary condition imposes the particle velocity u behind the shock in the powder. To minimize the numerical noise within the wave front, the velocity of the piston generating the shock is ramped with the quadratic function
u(t) = umin(l,(0,,,,#), (14)
where u is the steady state particle velocity and tblend is equal to the first output step time.
The left and right boundaries are symmetry planes, with normal and tangential unit vectors n and t respectively, which impose
u*n=O,
o-t = 0, (15)
on the particle velocity u and Cauchy stress cr. A transmitting boundary condition, developed by McGlaun (1982), permits the wave to pass through the powder without reflection.
3.2. Material modelling
The numerical solutions for the model problem were obtained with a multi-material Eulerian finite element program (Benson, 1995). The Eulerian mesh is fixed in space and the material is transported through it. A high resolution interface reconstruction method developed by Youngs (1982) and extended by Johnson (1990) resolves the material boundaries within each element. The transport between the adjacent elements is computed with the second order accurate monotonic MUSCL method developed by van Leer (1977). A computational mesh of 100 elements on each side, for a total of 10,000 elements in two dimensions, is used in the calculations. Test calculations with 200 elements on each side have demonstrated that higher mesh resolution is not needed for the present purposes.
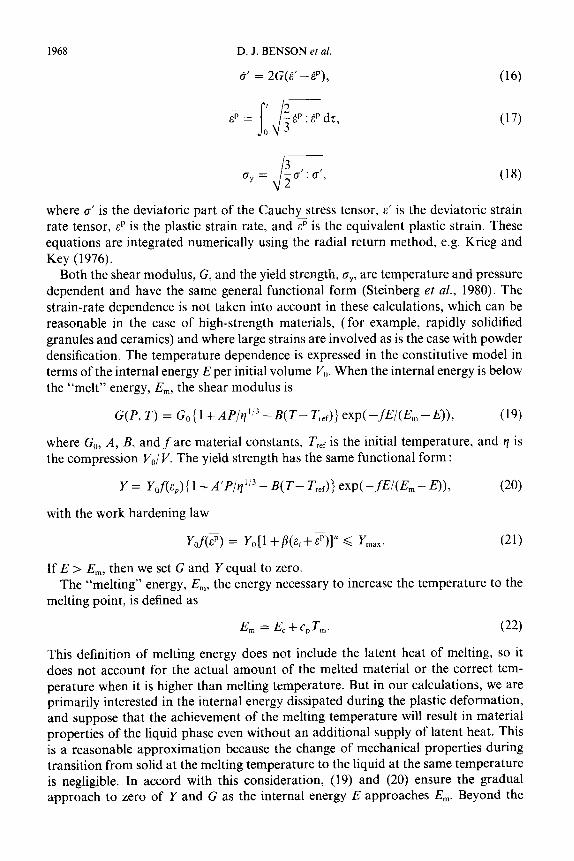
The strength of the particles is modelled even though their behaviour is dominated by the equation of state except at the very lowest shock pressures. The plasticity model of Steinberg and Guinan (1978, 1996) and Steinberg et al. (1980), and the Gruneisen equation of state, are used to describe the material behaviour. The differ- ential equations for the Steinberg-Guinan plasticity model follow the well established framework of .J2 flow theory with isotropic hardening defined by
1968 D. J. BENSON et al.
6’ = 2G(B’-BP), (16)
’ 2
- s\i- sp = _ 8P . EP &
“3’ ’ (17)
J 3 Lry = --‘: c’,
2 (18)
where (T’ is the deviatoric part of the Cauchy stress tensor, E’ is the deviatoric strain rate tensor, sp is the plastic strain rate, and 2 is the equivalent plastic strain. These equations are integrated numerically using the radial return method, e.g. Krieg and Key (1976).
Both the shear modulus, G, and the yield strength, dy, are temperature and pressure dependent and have the same general functional form (Steinberg et al., 1980). The strain-rate dependence is not taken into account in these calculations, which can be reasonable in the case of high-strength materials, (for example, rapidly solidified granules and ceramics) and where large strains are involved as is the case with powder densification. The temperature dependence is expressed in the constitutive model in terms of the internal energy E per initial volume VO. When the internal energy is below the “melt” energy, Em, the shear modulus is
G(P,T) = G,{l+AP/y”‘-_(T-T,,,)}exp(-fE/(E,-E)), (19)
where G,,, A, B, andf’are material constants, T,, is the initial temperature, and n is the compression VO/ V. The yield strength has the same functional form :
Y = Y&&J{ 1 fA’P/r]“3 - NT- T,,r)) exp(-,fE/(E,-E)),
with the work hardening law
(20)
Y&&p) = Y”[l +&+P)]” 6 Y,,,.
If E > E,,,, then we set G and Y equal to zero.
(21)
The “melting” energy, E,,,, the energy necessary to increase the temperature to the melting point, is defined as
Em = E,+q,T,. (22)
This definition of melting energy does not include the latent heat of melting, SO it does not account for the actual amount of the melted material or the correct tem- perature when it is higher than melting temperature. But in our calculations, we are primarily interested in the internal energy dissipated during the plastic deformation, and suppose that the achievement of the melting temperature will result in material properties of the liquid phase even without an additional supply of latent heat. This is a reasonable approximation because the change of mechanical properties during transition from solid at the melting temperature to the liquid at the same temperature is negligible. In accord with this consideration, (19) and (20) ensure the gradual approach to zero of Y and G as the internal energy E approaches Em. Beyond the

Impulsive deformation of granular material 1969
melting temperature, the internal energy is correct but the calculated temperature is inaccurate.
The melting temperature, T,,,, based on a modified Lindemann law, according to Steinberg et al. (1980) is approximated as
T,,, = T,,,,,exp {2a(l- 1/~)}r$(10--O~‘*3), (23)
where T,,,, is the melting temperature at ambient pressure and a is the first order volume correction factor for the Gruneisen parameter y :
Y=Yo+a t-1 =yo+ay. ( ) v- v. 0
(24)
The temperature T is defined by
E-E, T=-----,
CP (25)
where EC is the cold compression energy. The constant specific heat cP is assumed to be
RPO cp = 3---,
A4 (26)
where R is the gas constant, M is the atomic mass, and p. is reference (initial) density. For the calculation of E, we used
(27)
where the first terms is the integral on the zero Kelvin isotherm. The energy is supposed to be zero at T = 300K in an uncompressed material (q = 1) where EC = -300~~.
The Gruneisen equation of state used in the calculations in compression (p = q - 1 > 0) is
P= PoC~~~2+(2-~o)~-~~o--a)~21
211 -G, - 1)P--2PZ/(P+ l)-Q31(cL+ 11212 + bo + (YO -4/W> (28)
and in tension (11 < 0), the pressure is
P = ~oCb+yoE, (29)
where Co is the sound speed and S,, S,, and S3 are the coefficients in the shock velocity (u,)-particle velocity (u,) relation :
24, = co+s~u,+s* (3u,+s3 (3%. (30)
For metals, the linear approximation is very accurate in the pressure ranges considered

1970
Parameters
D. J. BENSON et al.
Table 1. Materials parameters
Ni-based alloy 1 Stainless steel
G, (Mbar) I’, (Mbar)
B n
Y,,, (Mbar) A (Mbar-‘) A’ (Mbar-‘)
?I (K-1) f M
TmoW YO a PO 62 cm-3 C, (cm ps-‘) cp (Mbar cm3g K -‘)
S,
0.85 0.77 0.007136 0.0205 2.75 43 0.475 0.35 0.012 0.024 1.63 2.6 1 2.6 1 1 0.000326 0.00045 0.001 0.001
58.7 55.35 2330 2380
1.93 1.93 1.4 1.4 8.26 7.77 0.465 0.457 0.000040 1 0.0000423 1.445 1.49
in the present investigation. The parameters which were used in calculations for comparison with the physical experiments are presented in Table 1.
Details concerning the computational model can be found in Benson (1992). Data for stainless steel were taken mostly from data for SS304 (Steinberg et al., 1980; Steinberg, 1996). The most important stainless steel parameters for this type of calculation were obtained from experimental measurements of initial microhardness (to calculate Y,) and the maximal microhardness (to calculate Y,,,,,) of the heavily deformed peripheral layers of the particles of alloy EP-450 after densification without melting (Nesterenko et al., 1989) with Y = HV/3. Data for the Ni-based alloy 1 are also taken from Steinberg (1996) data for Ni, except for the values for p, n, p,, and Y,, which were taken from the properties of Ni-based alloy IN7 18 investigated by Wang et al. (1988).
Two-dimensional computer calculations were carried out for Ni-based alloy 1 at qDo = 0.4 and q0 = 0.19 for three different particle velocities behind the shock front : 0.22,0.75 and 1.1 km SK’. This set of particle velocities guaranteed the transition from the quasistatic to the well developed dynamic regime of particle deformation for the Ni alloys according to the phenomenological criterion (4). The particle sizes were chosen to have uniform distributions in the intervals 0.74-0.88, 2.22-2.64 and 74-88
pm. The shock densification of the stainless steel powders was investigated at ‘pO = 0.39
for two particle velocities behind the shock front : 0.7 and 1.29 km SK’, and for particle sizes 31M40 ,um.
Additional computer calculations were made for artificial materials with one of the parameters different from the set presented in Table 1:

Impulsive deformation of granular material 1971
1. Y,, was decreased by one order of magnitude from 0.0205 to 0.00205 Mbar for stainless steel ;
2. Y, was set to 0 retaining the other parameters for the IN-718 (fluid-model) ; 3. The Ni-based alloy 2 with density 8.9 g cme3 and with the other parameters
for the Ni-based alloy 1 ; 4. The density was increased to 19.35 g cmp3 with the other parameters for the
Ni-based alloy 1.
It is important to mention (it will be discussed in detail later) that no qualitative dependence of the powder behaviour on the initial particle size was observed for a fixed particle velocity.
3.3. Results of the computer calculations
To evaluate the results of the computer calculations, mean values of parameters were defined by
d(y) = ; s h(x, y) dx,
’ 0 (31)
where 0(x, y) is a solution variable, x is parallel to the shock front, and y is the distance from the wall with the velocity boundary condition. These data are presented in Figs 3-7, 9-12, 14 and 15 which are plotted as a function of y. The following were calculated in every element : Total kinetic energy :
E Tkm (32)
Internal energy :
(33)
Pressure and density :
NMAT NMAT
P = 1 P,(P,, EJ vf, P = 1 pivf. I= I i= 1
(34)
Here NMAT is the number of materials in the element at the current time, p, is the current density of material i, Vf is the volume fraction of material i in the element and Vy is the current volume of material i :
(35)
Note that V: is not the specific volume of the material i. Additionally two mesoscopic parameters were calculated :
1972
Microkinetic energy :
D. J. BENSON et al.
E - &km mkm - -EMkin EMkin = k,dfi, ti(y) = f s ‘u~(x,Y) dy, (36) 0
where E~kin is the macrokinetic energy. Note that the definition of the microkinetic energy uses the mean value of the velocity ti in its definition. Spin :
_q!!p). (37)
Note that these parameters are not measurable in the experiments but they are very important to the overall material behaviour, e.g. bonding between particles or the initiation of chemical reactions.
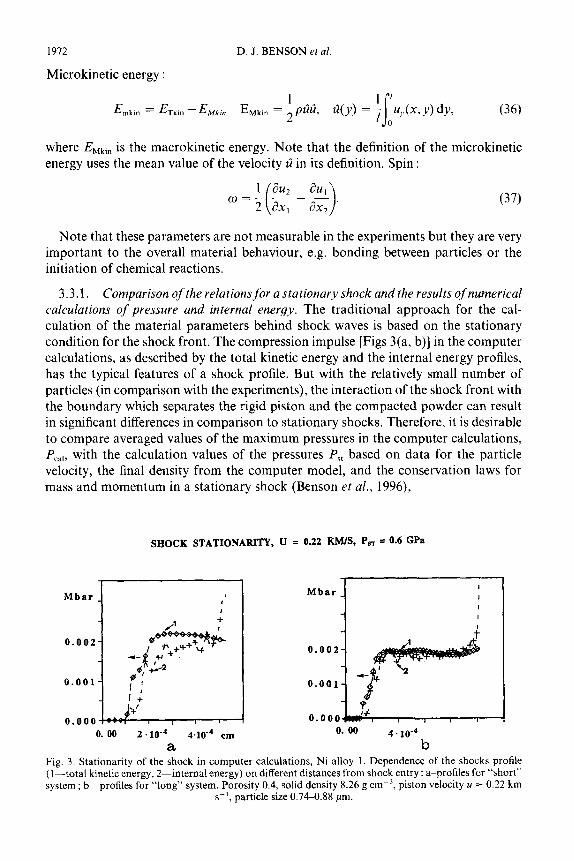
3.3.1. Comparison of the relationsfor a stationary shock and the results of numerical
calculations of pressure and internal energy. The traditional approach for the cal- culation of the material parameters behind shock waves is based on the stationary condition for the shock front. The compression impulse [Figs 3(a, b)] in the computer calculations, as described by the total kinetic energy and the internal energy profiles, has the typical features of a shock profile. But with the relatively small number of particles (in comparison with the experiments), the interaction of the shock front with the boundary which separates the rigid piston and the compacted powder can result in significant differences in comparison to stationary shocks. Therefore, it is desirable to compare averaged values of the maximum pressures in the computer calculations, P,,,, with the calculation values of the pressures P,, based on data for the particle velocity, the final density from the computer model, and the conservation laws for mass and momentum in a stationary shock (Benson et al., 1996),
SHOCK STATIONARITY, U = 0.22 KM/S, P,, = 0.6 GPa
0.000 o.ooo+ad~, I I , 1
0. 00 2.10-4 4m-4 cm 0. 00 4 10-q
a b Fig. 3. Stationarity of the shock in computer calculations, Ni alloy I. Dependence of the shocks profile (I-total kinetic energy, 2-internal energy) on different distances from shock entry : a-profiles for “short” system ; &profiles for “long” system. Porosity 0.4, solid density 8.26 g cm-‘, piston velocity u = 0.22 km
s-‘, particle size 0.74-0.88 pm.
Impulsive deformation of granular material 1973
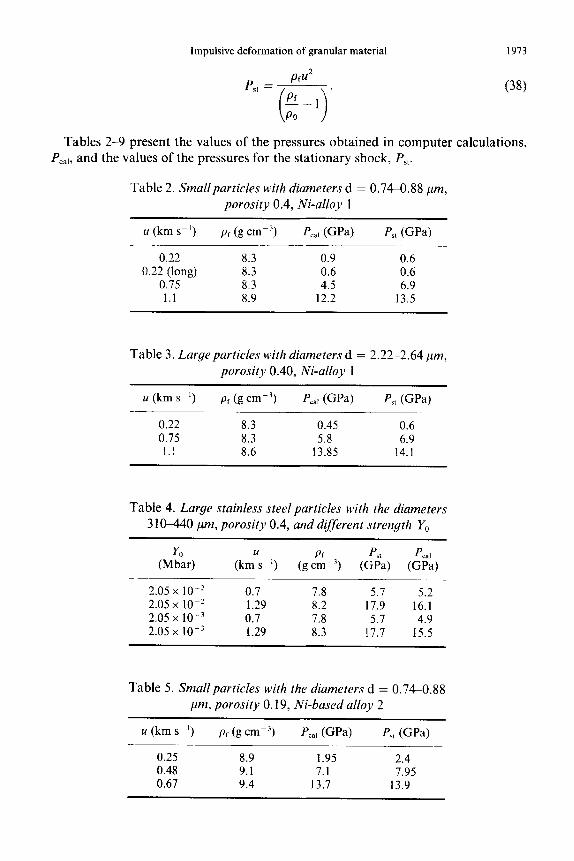
Tables 2-9 present the values of the pressures obtained in computer calculations, PC,,, and the values of the pressures for the stationary shock, P,,.
Table 2. Smallparticles with diameters d = 0.740.88 pm,
porosity 0.4, Ni-alloy 1
u (km SC’) pf (g cm-‘) PC,, (GPa) P,, (GPa)
0.22 8.3 0.9 0.6 0.22 (long) 8.3 0.6 0.6
0.75 8.3 4.5 6.9 1.1 8.9 12.2 13.5
Table 3. Largeparticles with diameters d = 2.22-2.64 pm,
porosity 0.40, Ni-alloy 1
u (km SK’)
0.22 0.75 1.1
h (g cm-‘)
8.3 8.3 8.6
PC,, @Pa)
0.45 5.8
13.85
P,, (GPa)
0.6 6.9
14.1
Table 4. Large stainless steel particles with the diameters
310-440 ,um, porosity 0.4, and different strength Y,
YO (Mbar) (kmUs-I) (g c%‘) ($a) (&L)
2.05 x 1O-2 0.7 7.8 5.1 5.2 2.05 x 1O-2 1.29 8.2 17.9 16.1 2.05 x 1O-3 0.7 7.8 5.7 4.9 2.05 x 1O-3 1.29 8.3 17.7 15.5
Table 5. Smallparticles with the diameters d = 0.74-0.88
pm, porosity 0.19, Ni-based alloy 2
u (km SK’) pf (g cm-‘) PC,, (GW P,, (GW
0.25 8.9 1.95 2.4 0.48 9.1 7.1 7.95 0.67 9.4 13.7 13.9

1974 D. J. BENSON et al.
Table 6. Particles with the large spread of diameters 0.5 1 .O pm, porosity 0.19, Ni-based alloy 2
u (km SC’)
0.48 0.67
pf (g cm-‘)
9.15 9.35
PC,, (@a)
7.85 13.9
P,, (GW
7.9 14.7
Table I. Small particles with the diameters d = 0.74-0.88 ,um, porosity 0.18, Ni-alloy 1
u (km SC’) pf (g cm-‘) PC,, (GPa) f’,, (GW
0.48 8.46 6.5 7.8 0.67 8.65 11.8 14
Table 8. Shock parameters ,for heavy particles, solid den- sity 19.35 .9 crne3 initial porosity 0.4, particle diameters
0.74088 pm
u (km SC’)
0.14 0.49 0.72
pf (g cm-‘)
19.36 19.5 19.5
PC,, (@a)
0.53 8
11.1
p,, @Pa)
0.57 6.9
14.9
Table 9. Shock parameters ,for jluid model, solid density 8.26 g cm-‘, initial porosity 0.4, particle diameters
d = 2.22-2.64 pm
u (km SC’) pr (g cm-‘) f’,,, @Pa) f’,, @Pa)
0.22 8.19 0.39 0.6
For the pressure, the average values can be significantly different from the maximum and minimum values [Fig. 4(b, d)]. In this case, PC,, was defined as (Pm,,+ P,,,)/2, where the corresponding maximum and minimum pressures [shown by arrows in Fig. 4(b, d)] were taken at the moment after the porosity became zero.
From a comparison of Pea, and P,, in Tables 2-9, we conclude that there is qualitative correlation between them and a satisfactory quantitative agreement for the inves-

Impulsive deformation of granular material
u = 0.75 KM/s, P‘T = 6.9 GPa, INI’M& POROSITY 0.40
0.04-
0.02-
,.,,.*,,k
1.0 I I 4 I I I I I I I 0. 00 2.10-4 5W’ cm 0. 00 2.w’ S.lV4 cm
1975
a b
0 = 0.40 KM/S, PJ, = 8.0 Gpn, INITLAL POROSITY 0.19
0. 00 2 .lo-4 5-10m4 cm
C
Mbnr Pq
%f a bP,*
&g
0 ; 6.d.n
0.04 - _:
0.02 - d
d’ 0.00 -wewed
I 1 I I , , 0. 00 2 *10-d 5.w” cm
d Fig. 4. The characteristic profiles of pressures and densities behind shock front for different conditions demonstrating the amount of data spread : adensity profile, b-pressure profile (Pst = 6.9 GPa, initial porosity 0.40, piston velocity 0.75 km SK’) ; cdensity profile, d-pressure profile (P,, = 8 GPa, initial porosity 0.19, piston velocity 0.48 km SC’). Arrows show the maximal (P,,,) and minimal (P,,,J pressures used to calculate the P,,. Solid density 8.26 g cm-j, Ni alloy 1 (a, b) and 8.9 g cm-‘, Ni alloy 2 (c, d),
particle size 0.740.88 pm.
tigated pressure range. The relatively large pressure spread characteristic of the com- puter results reflects the actual large spread of local pressures in the shock front and in the vicinity behind, which was found in the experimental results (Nesterenko, 1992). In the investigated conditions, the pressure spread from the calculated average values was in the interval of 7-34%, except in the case of large particles, where at particle velocity 0.75 km s-l, this value was 52%. In contrast to the pressure, the spread in the densities and the average particle velocities, in the direction of shock

1976 D. J. BENSON et Q/.
propagation, was much less (5510%). This is due to the strong non-linear dependence of the cold (and overall) pressures on the density, which magnifies the oscillations of the density behind the shock wave. In the cases of the total kinetic energy, internal energy, and particle velocity of the porous material, the computer calculations provide a relatively small data spread (5510%) in Figs 3(a, b) and 4(a, c).
Another important feature of the stationary shock conditions is that the internal energy per unit mass must be equal to the corresponding macrokinetic energy
Emkin = l&n- EMkln. Total kinetic energy, internal energy and microkinetic energy were calculated from (32), (33) and (36) and the typical behaviour is represented on the Fig. 3(a, b).
A comparison of “short” and “long” systems, consisting of 5 and 11 particles in the shock direction, respectively (Fig. 3) shows that the density, particle velocity, and total and microkinetic and, correspondingly, the macrokinetic energy, are close for these two cases. This behaviour shows that the shock wave is close to a stationary one after covering the distance of a few particle diameters. Nevertheless, we notice the elevated values of the dissipated energy at the piston boundary, a result of the non-stationary wave propagation (Nesterenko, 1992).
From Tables 2 to 9 we can conclude that the numerical values of the pressures do not reveal a significant dependence on the particle size, which agrees with the independence of the experimentally measured shock Hugoniots of granular materials on the initial particle size.
The main conclusion of the discussion in this section is that the two-dimensional computer calculations produce averaged data for shocked powders that are in close agreement with the stationary shock conditions for a large variety of materials, particle geometries, porosities, and pressures. This result allows us to interpret the data from the computer calculations as representative for stationary shock loading and not just as representative for the loading of a finite cell of powder with a few particles inside.
3.3.2. Microkinetic energy and pressure induced transition from quasistatic to dynamic regime ofparticle deformation. Nesterenko (1988, 1992) introduced the term “microkinetic energy” to describe the qualitative transition from the quasistatic type of particle deformation to the dynamic under the shock wave loading of powders. One of the most interesting qualitative results of the two-dimensional computer calculations is the possibility of explaining the transition from the quasistatic to the dynamic particle deformation. The energy explanation for this transition is the adjustment of the geometry of the plastic flow of the particles to balance the amount of the energy supplied by the shock loading. The manifestation of this transition can be followed by introducing a new parameter, the microkinetic energy.
This parameter (Emkin) was calculated by (36) and the maximum values of Emk,,, and internal energy Ei, at the moment of complete pore collapse for different conditions, are shown in Tables l&17. The data for the energies were converted into kJ kg-’ by dividing the computed results by the density of completely consolidated material. For practically all investigated conditions of loading and porosity, the internal energy was close to the dissipated energy.
The increase of the shock pressure results in the qualitative change of the particle

Impulsive deformation of granular material 1977
Table 10. Porosity 0.40, small particles with diameters d = 0.74-0.88 pm, Ni-alloy
p,, @Pa) u (km SC’) Emkin (kJ kg-‘) Lx (kJ kg-‘) Type of regime
0.6 0.22 6.0 19.3 0.6 0.22 (long) 4.8 21.1 6.9 0.75 66.3 217
13.5 1.1 157.3 449
quasistatic quasistatic dynamic dynamic
Table 11. Porosity 0.4, large particles with diameters d = 2.22-2.64 pm, Ni-alloy 1 (compare with data of Table 10)
p,, WY u (km SC’) ~%kln (kJ kg-‘) Cm @J kg-‘) Type of regime
0.6 0.22 3.6 19.3 quasistatic 6.9 0.75 48.2 150.6 dynamic 14.1 1.1 93.0 464.9 dynamic
Table 12. Porosity 0.19, smallparticles with the diameters d = 0.740.88 pm, Ni-based alloy 2 (compare with data of Table 13)
u (km SC’) Glnn (kJ kg- ‘> Em, @J kg- ‘> Type of regime
2.4 0.25 2.1 21.4 quasistatic 7.95 0.48 19.6 55.8 quasistatic, dynamic locally 13.9 0.67 50.7 114.0 dynamic
Table 13. Porosity 0.19, mixture of large andsmallparticles, d = 0.5-1.0 pm, Ni-based alloy 2
f’,, @Pa)
7.9 14.7
u (km SC’)
0.48 0.67
EmkIn (kJ kg-‘) &t &J kg-‘) Type of regime
22.2 68.0 quasistatic, dynamic locally 45.0 87.0 dynamic
Table 14. Large stainless steel particles with the diameters 3 lo-440 pm, porosity 0.4, and different initial strength Y,
yo u
(Mbar) ($a) (km SK’) -Lx,, @J k-9 4”’ @J kg-‘) Type of regime
2.05 x lo-* 5.7 0.7 48.4 184.3 quasistatic 2.05 x lo-* 17.9 1.29 164.5 598 dynamic 2.05 x lO-3 5.7 0.7 78.7 189.3 dynamic 2.05 x 1O-3 17.7 1.29 221.9 486 dynamic
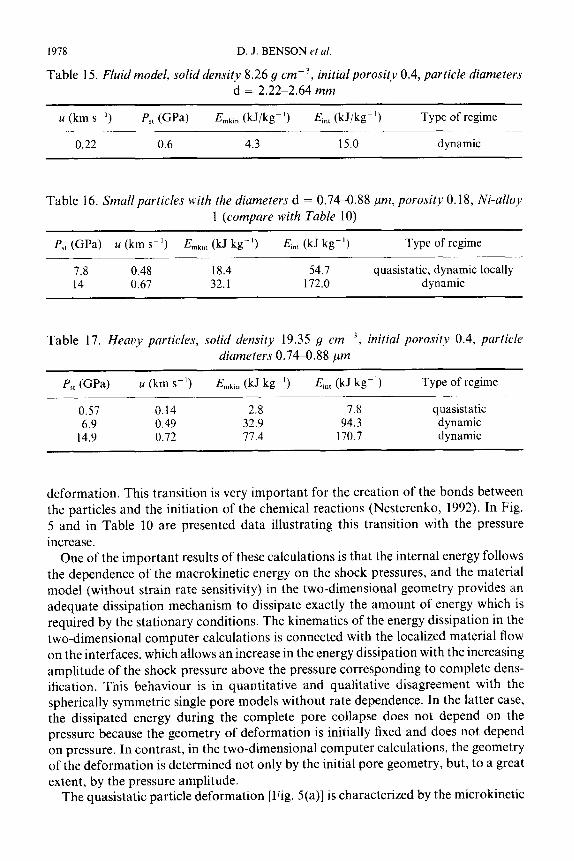
1978 D. J. BENSON et al
Table 15. Fluid model, solid density 8.26 g cm-3, initial porosity 0.4, particle diameters d = 2.22-2.64 mm
u (km s-‘) p,, @Pa)
0.22 0.6
EmkIn @J/W’)
4.3
&, &J/k- ‘)
15.0
Type of regime
dynamic
Table 16. Small particles with the diameters d = 0.74-0.88 ,am, porosity 0.18, Ni-alloy
1 (compare with Table 10)
P,, (GPa) u (km SK’) Emkln (kJ kg-‘) E,, (kJ kg-‘) Type of regime
7.8 0.48 18.4 54.7 quasistatic, dynamic locally 14 0.67 32.1 172.0 dynamic
Table 17. Heaoy particles, solid density 19.35 g cm-‘, initial porosity 0.4, particle
diameters 0.740.88 pm
p,, 0’4
0.57 6.9
14.9
u (km s-‘)
0.14 0.49 0.72
&k,n (kJ kg-‘)
2.8 32.9 77.4
Em, (kJ kc’)
7.8 94.3
170.7
Type of regime
quasistatic dynamic dynamic
deformation. This transition is very important for the creation of the bonds between the particles and the initiation of the chemical reactions (Nesterenko, 1992). In Fig. 5 and in Table 10 are presented data illustrating this transition with the pressure
increase. One of the important results of these calculations is that the internal energy follows
the dependence of the macrokinetic energy on the shock pressures, and the material model (without strain rate sensitivity) in the two-dimensional geometry provides an adequate dissipation mechanism to dissipate exactly the amount of energy which is
required by the stationary conditions. The kinematics of the energy dissipation in the two-dimensional computer calculations is connected with the localized material flow on the interfaces, which allows an increase in the energy dissipation with the increasing
amplitude of the shock pressure above the pressure corresponding to complete dens- ification. This behaviour is in quantitative and qualitative disagreement with the spherically symmetric single pore models without rate dependence. In the latter case, the dissipated energy during the complete pore collapse does not depend on the pressure because the geometry of deformation is initially fixed and does not depend on pressure. In contrast, in the two-dimensional computer calculations, the geometry of the deformation is determined not only by the initial pore geometry, but, to a great extent, by the pressure amplitude.
The quasistatic particle deformation [Fig. 5(a)] is characterized by the microkinetic

Impulsive deformation of granular material
U = 0.22 KM/S, Psr = 0.6 GPa, QUASISTATIC REGIME
1979
a
U = 0.75 KM/S, P,, = 6.9 GPa, DYNAMIC REGIME
b
Mbar
d
U = 1.10 KM/S, P,, = 13.5 GPa, DYNAMIC REGIME
e f Fig. 5. The pressure induced transition from quasistatic to dynamic deformation and corresponding profiles of total kinetic energy (l), internal energy (2) and microkinetic energy (3) for Ni alloy I. Shape of the deformed particles : a-P,, = 0.6 GPa, quasistatic regime ; c--P,, = 6.9 GPa, dynamic regime ; e-P,, = 13.5 GPa, dynamic regime. Profiles of energies: b-P,, = 0.6 GPa, quasistatic regime, d-P,, = 6.9 GPa, dynamic regime, f--P,, = 13.5 GPa, dynamic regime. Solid density 8.26 g cme3, particle size 0.74-0.88 pm,
cp = 0.4. Arrows mark the point of complete densification.

1980 D. I. BENSON et al.
energy, which is approximately 334 times less (Table 10) than the energy dissipated up to the moment of complete densification for low pressures. This dissipated energy, at a pressure that is just enough to get complete densification, can be considered to be close to the geometrically necessary energy for quasistatic pore collapse. Therefore we can conclude that quasistatic deformation of the particles correlates with the microkinetic energy being small in comparison to the geometrically necessary energy of the plastic deformation.
An increase in the particle velocities in the wave [Table 10 and Fig. 5(c-f)] results in the increase of the microkinetic energy and the occurrence of the dynamic regime of particle deformation, which is characterized by deviations of the particle contact geometry from straight lines, and with the experimentally observed peculiarities (melts, jets) in the joint triple points of neighboring particles. At large pressures [Fig. 5(c-f)], the material cannot dissipate all the internal energy during the densification stage and it has some additional movement in the compacted state. This additional movement is very important for the bonding process, and the initiation of the chemical reactions in the compressed state, because it provides favorable conditions for the combined pressure and shear deformation that is paramount for the initiation of chemical transformations.
From Fig. 5(b, d and f), it is evident that the microkinetic energy can be considered to be, so to speak, a “virtual” parameter. We use the word “virtual” because, in general, for the final state after the passage of a steady shock wave, Emkln cannot be simply added to the internal energy as its separate part. This is evident because the dissipation processes will finally transform the microkinetic energy into thermal energy.
The microkinetic energy exists in some areas on the shock front, and just behind the densification front, but not in the final state which is determined by the Hugoniot relation. As usual, the profile of the microkinetic energy is relatively symmetric for the quasistatic regime, and asymmetric for the dynamic regime. But in both cases, the build-up time and the decay time have the same order of magnitude. It means that additional motion in the completely densified powder continues on a scale comparable with the thickness of the densification front behind it.
The microkinetic energy is not important for shock relations as a parameter by itself, unlike the internal energy. But it is important as an indication of the existence of a qualitatively important channel in the energy transformation through visco- plastic deformation from the initial macrokinetic energy ahead of the shock into heat behind it. This channel of energy dissipation is responsible for the new space scale in the compacted powders, namely the width of the shear localization zones on particle interfaces, the jet thickness, and finally, the compact quality. A relatively small value of this parameter results in identifying the shock wave consolidation with the quasistatic one [Fig. 5(a)].
The existence of E,,,k,n after the full pore collapse has a fundamental importance because it demonstrates a mechanism of energy dissipation that the framework of the hollow sphere model does not represent, even qualitatively. In the case of a visco- plastic material, the hollow sphere model can dissipate any amount of energy since the strain rate approaches infinity as the pore radius approaches zero.
This result creates a problem for modelling the micromechanical motion after the

Impulsive deformation of granular material 1981
pore collapse within the framework of phenomenological relations. The process of the pore collapse only prepares the material for this final stage, as was emphasized by Nesterenko (1992) in the modified Carroll-Holt model, where the process of symmetrical collapse is stopped by the central undeformable core. This very important part of the process, the material plastic flow in the compressed state after complete densification, cannot be modelled by single pore models.
3.3.3. Dependence of the quasistatic-dynamic transition on particle size. The particle size is an important structural parameter which can effect the interface temperature and determine the space scale of the shock transition, as shown by Nesterenko (1975, 1992). That is why it is very interesting to investigate how this parameter is able to effect the transition from the quasistatic to the dynamic deformation regime. In Figs 6 and 7 and in Tables 11, 12 and 13 are presented data for powders with particles that are large in comparison to the data of Table 10 and Fig. 5. The powders are identical except for the particle morphology as characterized by the particle size or the size distribution.
From Tables 10 to 11, we can see that the two-dimensional computer model predicts for IN-71 8 (porosity 0.4) a transition from the quasistatic to the dynamic deformation regime in the shock pressure interval Pst = 0.6-6.9 GPa, and a well-developed dynamic regime exists at P,, = 14.1 GPa, independent of the particle size. A change of the particle size does not result in a change of the deformation regime or the particle shape after densification.
The reason why the particle size does not effect the deformation regime in the computer calculations is due to the independence of the plastic work on the pore size for a strain rate insensitive model.
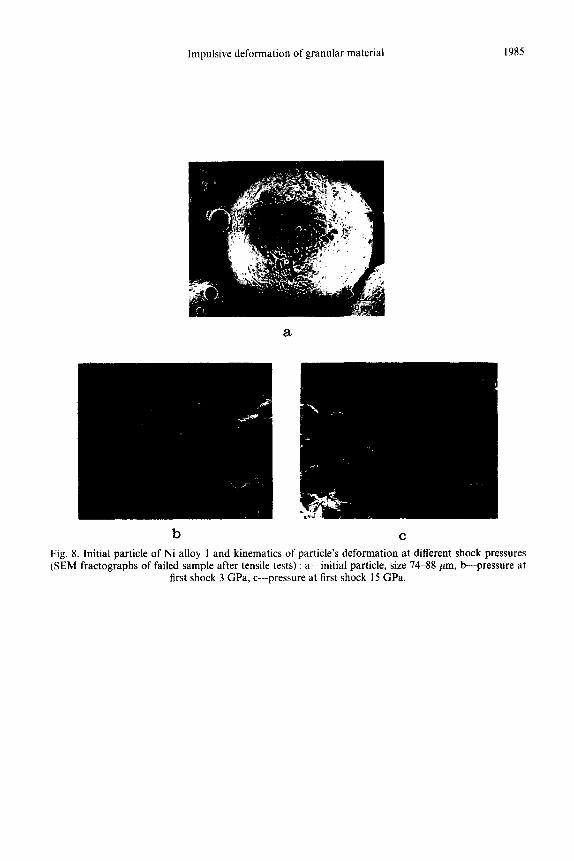
These data are in qualitative agreement with the compacted material structures from the experiments by Meyers and Wang (1988) depicted in Fig. 8 for IN-718, and corresponding to an initial porosity 0.4 and shock pressure 3 GPa [mainly quasistatic regime, Fig. 8(b)], and 15 GPa [dynamic regime, Fig. 8(c)].
The independence of the deformation regime on the particle size is also in agreement with the observed independence of the strength of the consolidated material in a wide range of rapidly solidified stainless steel particle sizes, ranking from less than 40 pm to 31&440 pm as demonstrated by Nesterenko, Lazaridi et al. (1989, 1990, 1992). It is worthwhile to mention that in some models, the local temperatures are very sensitive to the particle size, and criteria based on them have failed to explain the observed independence of the compact strength on the initial particle size, as demonstrated by Nesterenko (1992, 1995).
The perfect scaling of the geometry of the total particle deformation, as well as the localized areas on their interfaces, was observed in the calculations with the strain rate insensitive model. This result is natural since no scale in addition to the particle size exists in this model. Thus, this insensitivity of the computer results to the initial particle size demonstrates the consistency of the results. This is especially valuable because no exact solutions of the problem exist for checking the computer results. The introduction of strain rate sensitivity of the powder material will definitely change this behaviour. The variation of the particle sizes for strain-rate sensitive materials should result in the change of the powder behaviour, including the transition from the quasistatic to the dynamic regime of particle deformation (Nesterenko, 1992).
1982 D. J. BENSON er al.
U = 0.22 KM/S, P,, = 0.6 GPa, QUASISTATIC REGIME
a b
U = 0.75 KM/S, P,, = 6.9 GPa, DYNAMIC REGIME
U = 1.10 KM/S, P,, = 13.5 GPa, DYNAMIC REGIME
e
Mbar
0.02
1-1, t
0.02 I, t-2
i._,
I 4&_.. ‘0
0.00 0. 00 1.10-4 4.10.4 em
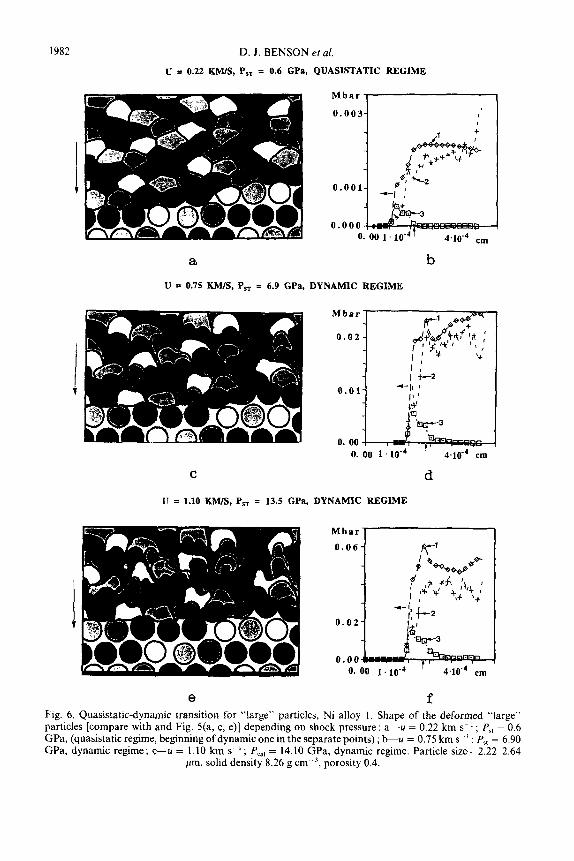
f Fig. 6. Quasistatic-dynamic transition for “large” particles, Ni alloy I. Shape of the deformed “large” particles [compare with and Fig 5(a, c, e)] depending on shock pressure : a--u = 0.22 km s-l ; P,, = 0.6 GPa, (quasistatic regime, beginning of dynamic one in the separate points) ; b-u = 0.75 km ss’ ; P,, = 6.90 GPa, dynamic regime ; c-u = 1.10 km s-’ ; P,,, = 14.10 GPa, dynamic regime. Particle size-2.22-2.64
pm, solid density 8.26 g cm-‘, porosity 0.4.

PARTICLE SIZE 0.74 - 0.85 pm
u = 0.48 KM/s
a b
C d PARTICLE SIZE 0.5 - 10 C1-m
Mbar
0.02
h
Fig. 7 Influence of initial particle distribution on sizes of Ni-alloy 2 particles on the transition from . . ^__ quaslstatlc to dynamic regime ofdetbrmation. a-d: particle size 0.74-0.88 pm; e--h : particle size 0.5-10 ,um. Geometry of particle’s deformation: a, e-u = 0.48 km SC’, P,, = 7.9 GPa, c-u = 0.67 km SC’. Ps, = 13.9 GPa, g-u = 0.67 km SC’, P,, = 14.7 GPa. Profiles of total kinetic energy (l), dissipated energy (2) and microkinetic energy (3) : b, f-u = 0.48 km SK’ ; d, h-u = 0.67 km SK’. Solid density 8.9 g cmm3, porosity 0.19. Arrows mark the point of complete densification and direction of shock wave propagation.
e U = 0.67 KM/S

1984 D. J. BENSON er al.
3.3.4. The influence of initial material strength on the transition from the quasistatic
to the dynamic regime of particle deformation, The mechanisms of energy trans- formation can be investigated via computer calculations by changing the initial material strength of the particles, and even setting the strength of the material equal to zero (fluid model). Parameters of the shock profile for these cases are presented in Fig. 9 and Table 14 for stainless steel particles with different initial strengths.
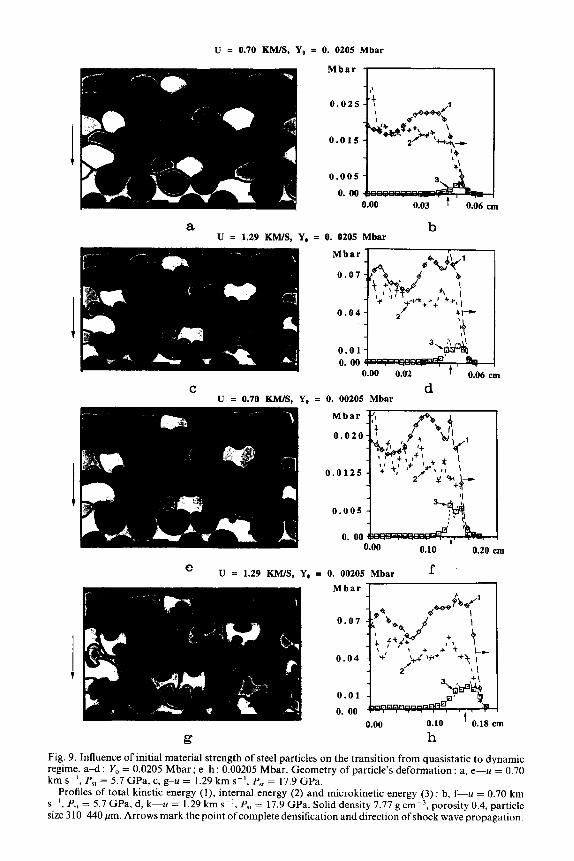
There are some very interesting features which are evident from Tables 4 and 14 and Fig. 9 :
l The values of pressures PC,, and P,, do not depend on the material strength. l The amount of the dissipated energy does not change significantly with the decrease
of the initial strength by one order of magnitude despite the same change in the porosity during shock densification for both cases.
l The microkinetic energy increases with a decrease of the initial material strength. For u = 1.29 km SK’ the microkinetic energy is asymmetric for the material with the low initial strength : it has a fast growth with a subsequent slow decay behind the shock.
It is natural that the lower initial strength results in a much more turbulent plastic flow of the particles at the same level of dissipated energy. The reason that the dissipated energy does not depend significantly on the initial strength is connected with the physics of the stationary shock. As was discussed in Section 3.3.1, the shock parameters in the calculations are close to the expected ones for the stationary shock conditions. In this case, the amount of the internal energy is equal to the macrokinetic energy and does not depend on the initial material strength if the particle velocity is kept the same. It is interesting that this property for the stationary shock is valid also for an assemblage of a relatively small number of particles and for shock distances equal only to the length of 5-7 particle diameters.
The extreme case is the material with zero initial strength (fluid). Data for this case are presented in Table 15 and in Fig. 10.
The density in the zero strength model is the same as in the model where dissipation due to the plastic flow was included with the same loading conditions [Figs 5(a) and 6(a)] for smaller and larger particles. It is evident that despite the absence of plastic dissipation in the fluid model during the fluid flow, we have a significant increase in the internal energy during shock compression. The amount of the internal energy cannot be attributed to the cold energy at a calculated density of 8.28 g cmm3. The only mechanism for dissipation in the fluid is the shock reverberations (cycles of shock loading and isentropic rarefraction) inside the particles during the pore collapse. In this case, the shock viscosity, which is introduced in the calculations, provides the energy dissipation. This behaviour is analogous to the dissipation process in the Thouvenin model (Thouvenin, 1966), where the plastic deformation of the particles is absent and the necessary amount of dissipated energy is provided by the many reverberations, as was shown by Hofmann et al. (1968). In the one-dimensional geometry, this process takes a long time (as was demonstrated in experiments and computer calculations) in comparison with the experiments on powders having the same initial density as the laminar Touhvenin model, but with a spherical or cubic geometry (Nesterenko, 1992).
Impulsive deformation of granular material 1985
a
Fig. 8. Initial particle of Ni alloy 1 and kinematics of particle’s deformation at different shock pressures (SEM fractographs of failed sample after tensile tests) : a-initial particle, size 7488 pm, &pressure at
first shock 3 GPa, c-pressure at first shock 15 GPa.
1986
b
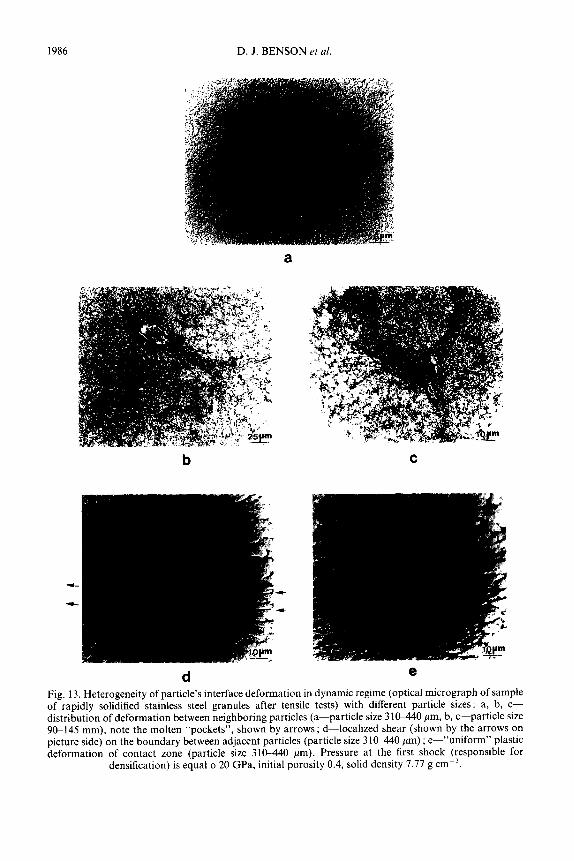
d e Fig. 13. Heterogeneity of particle’s interface deformation in dynamic regime (optical micrograph of sample of rapidly solidified stainless steel granules after tensile tests) with different particle sizes: a, b, c- distribution of deformation between neighboring particles (a-particle size 3 l&440 pm, b, c-particle size 90-145 mm), note the molten “pockets”, shown by arrows ; d-localized shear (shown by the arrows on picture side) on the boundary between adjacent particles (particle size 3 IWO pm) ; e-“uniform” plastic deformation of contact zone (particle size 31@440 pm). Pressure at the first shock (responsible for
densification) is equal o 20 GPa, initial porosity 0.4, solid density 7.77 g cmm3.
U = 0.70 KM/S, Y, = 0. 0205 Mbar
a b U = 1.29 KM/S, Y, = 0. 0205 Mbar
h
Fig. 9. Influence of initial material strength of steel particles on the transition from quasistatic to dynamic regime. ad : Y,, = 0.0205 Mbar ; e-h : 0.00205 Mbar. Geometry of particle’s deformation : a, e-u = 0.70 km SK’, P,, = 5.7 GPa, c, g-u = 1.29 km SK’, P,, = 17.9 GPa.
Profiles of total kinetic energy (I), internal energy (2) and microkinetic energy (3) : b, f--u = 0.70 km SK’, P,, = 5.7 GPa, d, k--u = 1.29 km s-‘, P,, = 17.9 GPa. Solid density 7.77 g cm-‘, porosity 0.4, particle size 3 1 WI40 pm. Arrows mark the point of complete densification and direction of shock wave propagation.
1988 D. J. BENSON et al.
Y, = 0, u = 0.22 KM/s, P, = 0.6 GPO, DYNAMIC REGIME
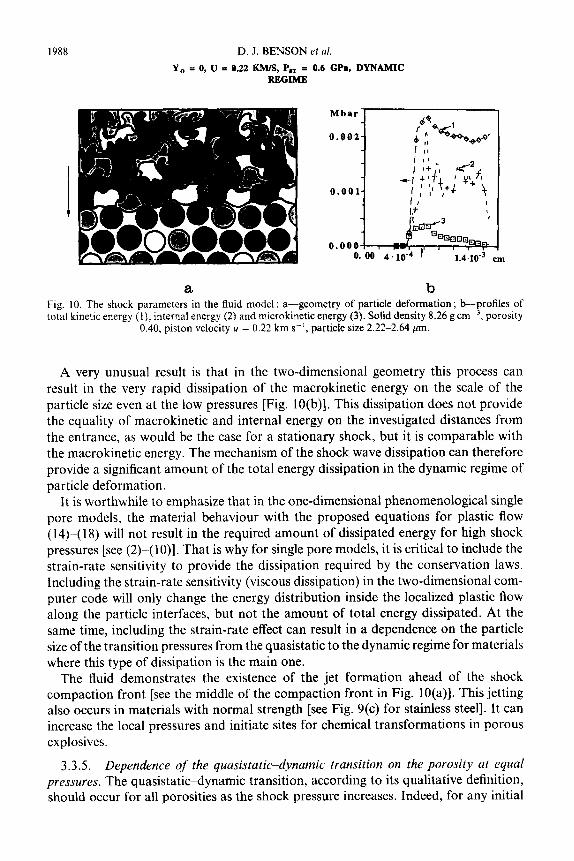
a b Fig. 10. The shock parameters in the fluid model : a-geometry of particle deformation; &profiles of total kinetic energy (I), internal energy (2) and microkinetic energy (3). Solid density 8.26 g cm-j, porosily
0.40, piston velocity u = 0.22 km SC’, particle size 2.22-2.64 pm.
A very unusual result is that in the two-dimensional geometry this process can result in the very rapid dissipation of the macrokinetic energy on the scale of the particle size even at the low pressures [Fig. IO(b)]. This dissipation does not provide the equality of macrokinetic and internal energy on the investigated distances from the entrance, as would be the case for a stationary shock, but it is comparable with the macrokinetic energy. The mechanism of the shock wave dissipation can therefore provide a significant amount of the total energy dissipation in the dynamic regime of particle deformation.
It is worthwhile to emphasize that in the one-dimensional phenomenological single pore models, the material behaviour with the proposed equations for plastic flow (14)-(18) will not result in the required amount of dissipated energy for high shock pressures [see (2)-( lo)]. That is why for single pore models, it is critical to include the strain-rate sensitivity to provide the dissipation required by the conservation laws. Including the strain-rate sensitivity (viscous dissipation) in the two-dimensional com- puter code will only change the energy distribution inside the localized plastic flow along the particle interfaces, but not the amount of total energy dissipated. At the same time, including the strain-rate effect can result in a dependence on the particle size of the transition pressures from the quasistatic to the dynamic regime for materials where this type of dissipation is the main one.
The fluid demonstrates the existence of the jet formation ahead of the shock compaction front [see the middle of the compaction front in Fig. 10(a)]. This jetting also occurs in materials with normal strength [see Fig. 9(c) for stainless steel]. It can increase the local pressures and initiate sites for chemical transformations in porous explosives.
3.3.5. Dependence of’ the quasistatic-dynamic transition on the porosity at equal pressures. The quasistaticcdynamic transition, according to its qualitative definition, should occur for all porosities as the shock pressure increases. Indeed, for any initial
Impulsive deformation of granular material 1989
porosity, the increase of the energy supply to some threshold value will result in a qualitative change in the powder behaviour, but the character of this change depends on the initial porosity. For example, for very small porosities, we can not expect the large changes in the particle geometry in comparison to the quasistatic geometry. Local melting will be the main hallmark of the dynamic regime in this case.
The evaluation of the capacity of powders with different initial porosities to accumu- late microkinetic energy is important, because a small initial porosity will provide better conditions to reach high shock pressures. At the same time, the decrease of the initial porosity will decrease the internal energy and probably the microkinetic energy as well.
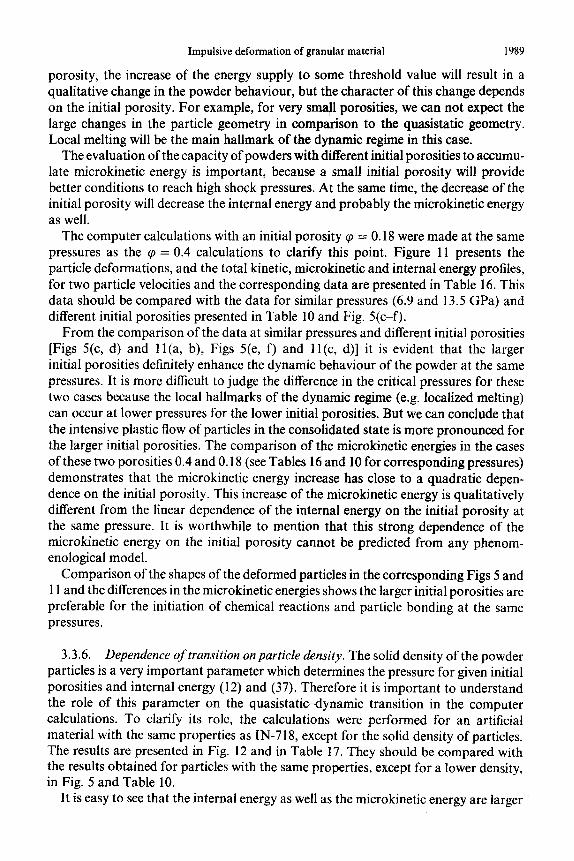
The computer calculations with an initial porosity cp = 0.18 were made at the same pressures as the rp = 0.4 calculations to clarify this point. Figure 11 presents the particle deformations, and the total kinetic, microkinetic and internal energy profiles, for two particle velocities and the corresponding data are presented in Table 16. This data should be compared with the data for similar pressures (6.9 and 13.5 GPa) and different initial porosities presented in Table 10 and Fig. 5(c-f).
From the comparison of the data at similar pressures and different initial porosities [Figs 5(c, d) and 11 (a, b), Figs 5(e, f) and I 1 (c, d)] it is evident that the larger initial porosities definitely enhance the dynamic behaviour of the powder at the same pressures. It is more difficult to judge the difference in the critical pressures for these two cases because the local hallmarks of the dynamic regime (e.g. localized melting) can occur at lower pressures for the lower initial porosities. But we can conclude that the intensive plastic flow of particles in the consolidated state is more pronounced for the larger initial porosities. The comparison of the microkinetic energies in the cases of these two porosities 0.4 and 0.18 (see Tables 16 and 10 for corresponding pressures) demonstrates that the microkinetic energy increase has close to a quadratic depen- dence on the initial porosity. This increase of the microkinetic energy is qualitatively different from the linear dependence of the internal energy on the initial porosity at the same pressure. It is worthwhile to mention that this strong dependence of the microkinetic energy on the initial porosity cannot be predicted from any phenom- enological model.
Comparison of the shapes of the deformed particles in the corresponding Figs 5 and 11 and the differences in the microkinetic energies shows the larger initial porosities are preferable for the initiation of chemical reactions and particle bonding at the same pressures.
3.3.6. Dependence of transition on particle density. The solid density of the powder particles is a very important parameter which determines the pressure for given initial porosities and internal energy (12) and (37). Therefore it is important to understand the role of this parameter on the quasistatic-dynamic transition in the computer calculations. To clarify its role, the calculations were performed for an artificial material with the same properties as IN-7 18, except for the solid density of particles. The results are presented in Fig. 12 and in Table 17. They should be compared with the results obtained for particles with the same properties, except for a lower density, in Fig. 5 and Table 10.
It is easy to see that the internal energy as well as the microkinetic energy are larger
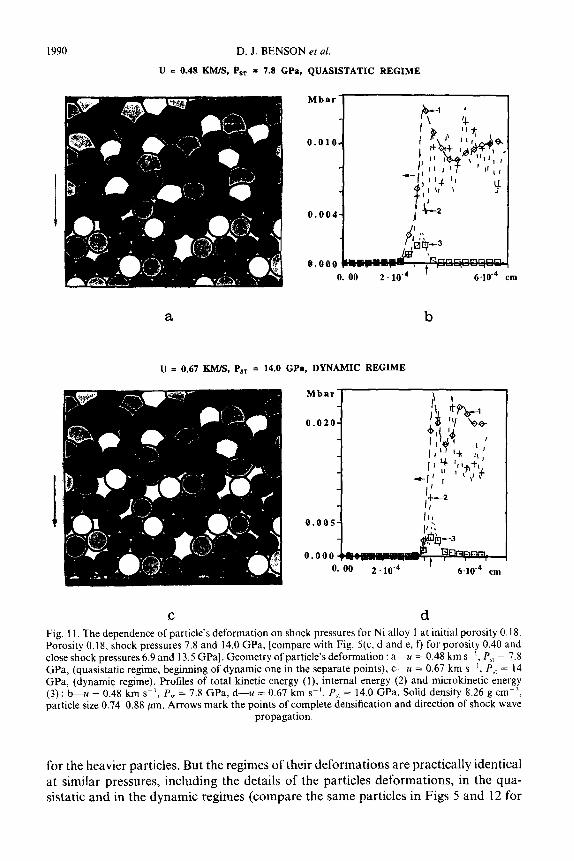
D. .i. BENSON et al.
U = 0.48 KM/S, P,, = 7.8 GPa, QUASISTATIC REGIME
0. 00 2.10-d ’ 6.W4 cm
a b
U = 0.67 KM/S, PST = 14.0 GPs, DYNAMIC REGIME
Mbar
0.020-
C d
Fig. 1 I. The dependence of particle’s deformation on shock pressures for Ni alloy 1 at initial porosity 0.18. Porosity 0.18, shock pressures 7.8 and 14.0 GPa, [compare with Fig. 5(c, d and e, f) for porosity 0.40 and close shock pressures 6.9 and 13.5 GPa]. Geometry of particle’s deformation : a--u = 0.48 km SC’, P,, = 7.X GPa, (quasistatic regime, beginning of dynamic one in the separate points), C-U = 0.67 km s- ‘, P,, = 14 GPa, (dynamic regime). Profiles of total kinetic energy (I), internal energy (2) and microkinetic energy (3) : &u = 0.48 km SC’, P,, = 7.8 GPa, d-u = 0.67 km SC’, P,, = 14.0 GPa. Solid density 8.26 g cm-‘, particle size 0.740.88 pm. Arrows mark the points of complete densification and direction of shock wave
propagation.
for the heavier particles. But the regimes of their deformations are practically identical at similar pressures, including the details of the particles deformations, in the qua- sistatic and in the dynamic regimes (compare the same particles in Figs 5 and 12 for

Impulsive deformation of granular material
u = 0.14 KM/s
Mbar
a b
Mbar
0.02
U = 0.72 JIM/S d
Fig. 12. Influence of particle density on the quasistaticdynamic transition (compare with Fig. 5 for lower solid density 8.26 g cmm3, but the same initial porosity 0.4 and close pressures). Geometry of particle’s deformation a-u = 0.14 km SK’, P,, = 0.6 GPa, C-U = 0.49 km s-I, P,, = 6.9 GPa, e-u = 0.72 km SK’, P,, = 14.9 GPa. Profiles of total kinetic energy (I), internal energy (2) and microkinetic energy (3) : & u = 0.14 km s-‘, d-u = 0.49 km s-‘, f--u = 0.72 km SK’. Arrows mark the moments of complete
densification. Solid density 19.35 g cme3, initial porosity 0.4, particle size 0.740.88 pm.
the similar pressures). It means that the initial density of the particles is not an important parameter for the quasistaticdynamic transition despite the dependence of the shock parameters on the solid density. This is in perfect agreement with the

1992 D. J. BENSON et al.
transition criteria proposed by Nesterenko (1988, 1992, 1995) based on the ratio of the shock internal energy and the geometrically necessary energy for the complete densification in the static regime. We emphasize, however, that if viscous deformation is the main mechanism of the energy dissipation process, then the solid density will be an important parameter for the transition pressure (Nesterenko, 1992).
3.3.7. Heterogeneity of the contact deformation in the dynamic regime. A quali- tatively important experimental feature of the shock wave deformation of granular materials is the heterogeneity of the contact deformation in the dynamic regime (Fig. 13). Even for adjacent particles, the deformation does not necessarily have the same character. In some locations, the intensive localized deformation on the contact surfaces initiates without involving adjacent particle contacts. This feature was absent in the quasistatic regime, where all contacts were deformed in the same manner. This results in the concentration of intensive shear on individual, separate interfaces and the absence of this behaviour on neighboring particles [Fig. 13(a)], and it is especially visible for large particles. The intensive shear deformation [Fig. 13(b)], partially under high shock pressure, results in good bonding without significant melting. Dynamic pressure by itself is not enough to get good bonding without shear localization on the particle interfaces [Fig. 13(c) and the locations shown in Fig. 13(a, d, e) by arrows].
This behaviour apparently is out of the range of the single pore models, but it is adequately described by the two-dimensional computer model (Fig. 14). As in the experiments, the adjacent particle interfaces in the computer calculations can have qualitatively different localized plastic deformations. This qualitatively important feature of the two-dimensional model provides the natural introduction of the new deformation scale, namely, the size of the localized deformation zone on the particle interface. The central part of the particle undergoes much less plastic deformation, and the size of this region agrees with the modified model (Nesterenko, 1992), decreas- ing with an increase of the initial porosity.
3.3.8. Spin characteristics in the shockedpowders. The two-dimensional computer modelling permits the calculation of qualitatively new parameters in the shocked powders (like microkinetic energy) which are very important for the global material behavior, e.g. the bonding between particles or the initiation of the chemical reactions, but which are, in principle, outside the scope of any straightforward experimental method to be measured. One of these parameters is the spin, which is represented by (36), and it describes the rotation in the material of the particles. The spin profiles are presented for the quasistatic and dynamic regimes in Fig. 15. It is easy to see the correlation between the microkinetic energy and the spin for these two qualitatively different regimes. The vanishing of the microkinetic energy is in good agreement with the vanishing of the spin immediately after the complete densification for the quasistatic regime [Fig. 15(a)], which exhibits no additional motion in the compacted material. A completely different behaviour of the spin and microkinetic energy is evident in Fig. 15(b, c) for the dynamic regime. In the latter case, the magnitude of the spin does not change immediately after full compaction [compare Fig. 15(a) and 15(b, c)]. The existence of the spin in the fully compacted material ensures the mutual plastic flow of the particle contacts, which is favorable for good bonding and the initiation of chemical reactions.
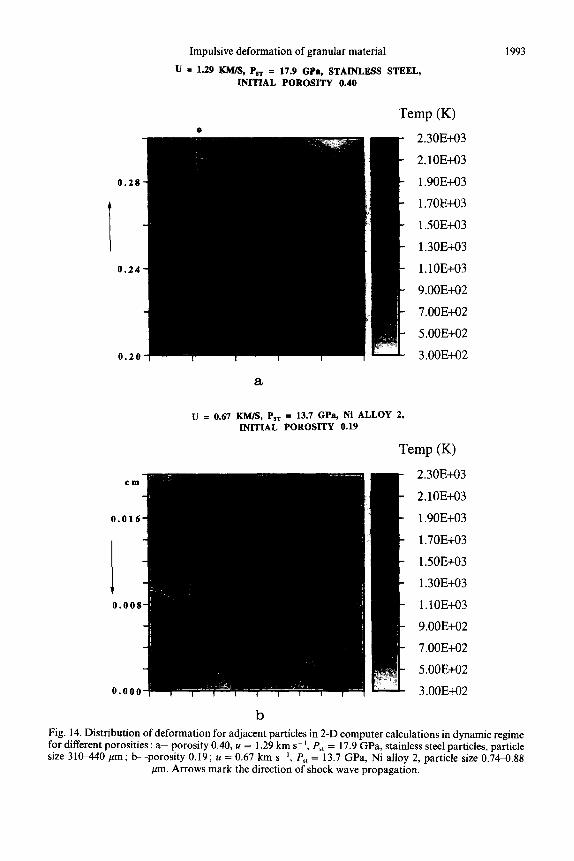
0.24
0.20
0.016
i 0.008
Impulsive deformation of grantiar material
tJ = 1.29 KM/s, P,, = 17.9 GPs, STAINLESS STEEL, INITIAL POROSITY 0.40
Temp (K) 2.3OE+O3
2.1OE+O3
1.9OE+O3
1.7OE+O3
1.5OE+O3
1.3OE+O3
l.lOE+O3
9.OOE+O2
7.OOE+O2
5.OOE+O2
3.OOE+O2
a
U = 0.67 KM/S, I’,, = 13.7 GPO, Ni ALLOY 2,
INITIAL POROSITY 0.19
Temp WI
- 2.3OE+O3
- 2.1OE+O3
- 1.9OE+O3
- 1.7OE+O3
- 1.5OE+O3
- 1.3OE+O3
- l.lOE+O3
- 9.OOE+O2
- 7.OOE+O2
- 5.OOE+O2
- 3.OOE+O2
1993
b Fig. 14. Distribution of deformation for adjacent particles in 2-D computer calculations in dynamic regime for different porosities : a-porosity 0.40, u = 1.29 km s- ‘, PSt = 17.9 GPa, stainless steel particles, particle size 31WO pm; &porosity 0.19; u = 0.67 km SK’, P,, = 13.7 GPa, Ni alloy 2, particle size 0.74-0.88
pm. Arrows mark the direction of shock wave propagation.

1994 D. J. BENSON et al.
QUASISTATIC REGIME
-8 ,,, 0. 00 6 * lo- it’ ” ’ 1.2*10s3 cm
a
DYNAMIC REGIME
p-’
4 o-
-4o- $ ‘!
I I I 1 I I 4 I
0. 00 6 ho-’ 1.2*10-’ cm
DYNAMIC REGIME
-25t ( , ( , , , , , 0. 00 6. 10f4 1.2.10‘~ cm
Fig. 15. Spin behavior at quasistatic and dynamic regimes : a--u = 0.22 km s-‘, Ps, = 0.6 GPa, Ni alloy 1, quasistatic; b-u = 1.10 km SK’, P,, = 13.5 GPa, Ni alloy 1, dynamic; C-U = 0.22 km SC’, P,, = 0.6 GPa, Auid model, dynamic. Solid density 8.26 g cmm-3, porosity 0.4, particle size 2.22-2.63 pm. Arrows mark the
point of complete densification.
3.3.9. Shock wave thickness. This parameter is especially interesting because, for relatively strong shocks, the experimentally measured front width is close to the particle size (Nesterenko, 1975, 1992). The continuum single pore models provide this result for strong shocks (Carroll et al., 1986), but the validity of the continuum approach on a space scale close to the particle diameter is not evident. The 0.1-0.9 shock front thicknesses, A, for different particle diameters d, porosities and pressures are presented in Table 18. The particle diameters of small granules for porosities 0.19 and 0.40 were the same, and the diameters of large granules were 3 times larger.
The main features of shock front dependence on the porosity and the initial particle sizes can be summarized as follows :
1. The shock front width, A, is close to the particle diameter and decreases with increases in pressure ;
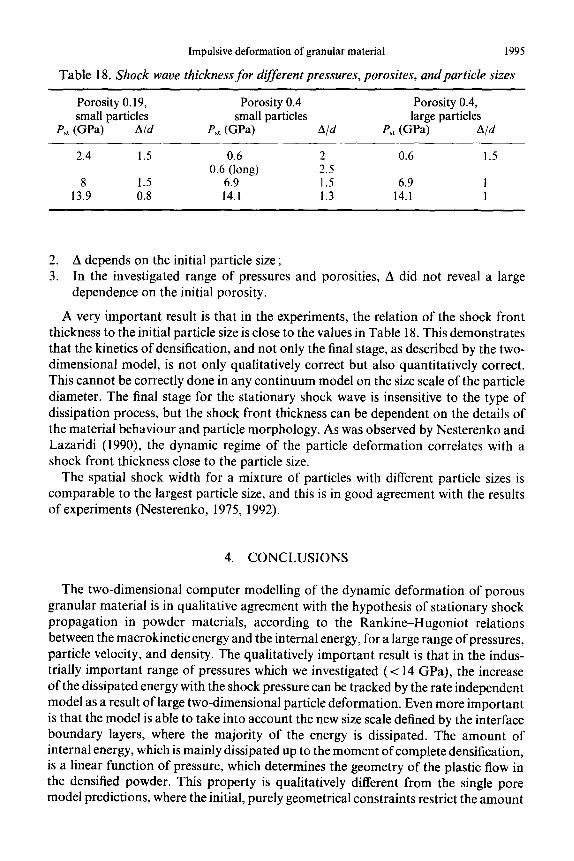
Impulsive deformation of granular material 1995
Table 18. Shock wave thickness for different pressures, porosites, andparticle sizes
Porosity 0.19, Porosity 0.4 Porosity 0.4, small particles small particles large particles
p,, @Pa) AId P, @Pa) A/d J’,, @Pa) A/d
2.4 1.5 0.6 2 0.6 1.5 0.6 (long) 2.5
8 1.5 6.9 1.5 6.9 1 13.9 0.8 14.1 1.3 14.1 1
2. A depends on the initial particle size ; 3. In the investigated range of pressures and porosities, A did not reveal a large
dependence on the initial porosity.
A very important result is that in the experiments, the relation of the shock front thickness to the initial particle size is close to the values in Table 18. This demonstrates that the kinetics of densification, and not only the final stage, as described by the two- dimensional model, is not only qualitatively correct but also quantitatively correct. This cannot be correctly done in any continuum model on the size scale of the particle diameter. The final stage for the stationary shock wave is insensitive to the type of dissipation process, but the shock front thickness can be dependent on the details of the material behaviour and particle morphology. As was observed by Nesterenko and Lazaridi (1990) the dynamic regime of the particle deformation correlates with a shock front thickness close to the particle size.
The spatial shock width for a mixture of particles with different particle sizes is comparable to the largest particle size, and this is in good agreement with the results of experiments (Nesterenko, 1975, 1992).
4. CONCLUSIONS
The two-dimensional computer modelling of the dynamic deformation of porous granular material is in qualitative agreement with the hypothesis of stationary shock propagation in powder materials, according to the Rankine-Hugoniot relations between the macrokinetic energy and the internal energy, for a large range of pressures, particle velocity, and density. The qualitatively important result is that in the indus- trially important range of pressures which we investigated (< 14 GPa), the increase of the dissipated energy with the shock pressure can be tracked by the rate independent model as a result of large two-dimensional particle deformation. Even more important is that the model is able to take into account the new size scale defined by the interface boundary layers, where the majority of the energy is dissipated. The amount of internal energy, which is mainly dissipated up to the moment of complete densification, is a linear function of pressure, which determines the geometry of the plastic flow in the densified powder. This property is qualitatively different from the single pore model predictions, where the initial, purely geometrical constraints restrict the amount
1996 D. J. BENSON et al.
of the dissipated energy, which is independent of the shock pressure for pressures greater than the densification pressure for a rate independent elastic-plastic model.
The transition from the quasistatic regime of particle deformation to the dynamic one correlates with a critical value of a qualitatively new virtual parameter, the microkinetic energy, which exists on the densification front at relatively large pres- sures. The ratio of the microkinetic energy to the geometrically necessary energy is close to 3.5 for an initial porosity 0.4.
The transition to the dynamic regime can be obtained by a pressure increase, and depends on the initial porosity as well as the initial strength of the material. For the investigated materials, the dependence of the particle deformation on the initial particle size was not observed, and the solid density of the particles is not an important parameter for this transition.
The wave reverberations can provide dissipation on the scale of the particle size (shock front width) in a two-dimensional model, in addition to the dissipation from the plastic flow during pore collapse.
The well-developed dynamic regime of particle deformation also coincides with the vortex motion of the material in the compacted state.
The results of the two-dimensional computer calculations for the shock front width are in good agreement with the experimental data.
The comparisons of the two-dimensional computer results with the experimentally observed peculiarities of the powder behaviour in the process of shock loading justify the further development of this approach to include the chemical reactions into combined mechanochemical consideration.
ACKNOWLEDGEMENTS
This research is supported by the U.S. Army Research Office, Contract DAAH 04-94-G- 0314 and U.S. Office of Naval Research, Contract NOOO14-94-1-1040 (Program Office Dr J. Goldwasser) and by the Institute for Mechanics and Materials, Department of Applied Mech- anics and Engineering Sciences, University of California, San Diego. The help of A.N. Lazaridi with experiments on EP-450 alloy and H.C. Chen with metallography is highly appreciated.
REFERENCES
Attetkov, A. V., Vlasova, L. N., Sehvanov, V. V. and Solov’ev, V. S. (1984) Effect of non- equilibrium heating on the behavior of a porous material in shock compression. J. Appl. Mech. and Tech. Phys. 25, 12&127 (in Russian) ; English trans. (1985) J. Appi. Mech. and Tech. Phys. May, 914-921.
Benson, D. J. (1992) Computational methods in Lagrangian and Eulerian hydrocodes. Com- puter Methods in Applied Mechanics and Engineering 99, 235-394.
Benson, D. J. (1994) An analysis by direct numerical simulation of the effects of particle morphology on the shock compaction of copper powder. Modelling Simul. Mater. Sci. Eng. 2,535-550.
Benson, D. J. (1995) A multi-material eulerian formulation for the efficient solution of impact and penetration problems. Computational Mechanics 15, 558-571.
Benson, D. J. and Nellis, W. J. (1994) Numerical simulation of the shock compaction of copper powder. Proceedings of the Joint Meeting of the International Association for the Advancement
Impulsive deformation of granular material 1997
of High Pressure Science and Technology and the American Physical Society Topical Group on Shock Compression of Condensed Matter, ed. S. C. Schmidt, J. W. Shaner, G. A. Samara and M. Ross), pp. 1243-1245. AIP Press, New York.
Benson, D. J. and Nellis, W. J. (1994) Dynamic compaction of copper powder : computation and experiment. Appl. Phys. Lett. 65,418-420.
Benson, D. J., Nesterenko, V. F. and Jonsdottir, F. (1995) Numerical simulations of dynamic compaction. Net Shape Processing of Powder Materials, ed. S. Krishnaswami, R. M. McMee- king, and J. R. L. Trasorras, AMD 216, pp. 1-8. ASME, New York.
Benson, D. J., Nesterenko, V. F. and Jonsdottir, F. (1996) Micromechanics of shock defor- mation of granular materials. SHOCK COMPRESSION OF CONDENSED MATTER- 1995 : Proceedings of the Conference of the American Physical Society Topical Group on Shock Compression of Condensed Matter, ed. S. C. Schmidt and W. C. Tao, pp. 603-606. AIP Press, New York.
Bondar, M. P. and Nesterenko, V. F. (1991) Contact deformation and bonding criteria under impulsive loading. Physics of Explosion, Combustion and Shock Waves 27, 103-l 17 (in Russian) ; English trans. (1991) Physics of Explosion, Combustion and Shock Waves, Novem- ber, 364-376.
Butcher, B. M., Carroll, M. M. and Holt, A. C. (1974) Shock-wave compaction of porous aluminum. J. Appl. Phys. 45,3864-3875.
Carroll, M. M. and Holt, A. C. (1972) Static and dynamic pore-collapse relations for ductile porous materials. J. Appl. Phys. 43, 1626-1635.
Carroll, M. M., Kim, K. T. and Nesterenko, V. F. (1986) The effect of temperature on viscoplastic pore collapse. J. Appl. Phys. 59, 1962-1967.
Dunin, S. Z. and Surkov, V. V. (1982) Effects of energy dissipation and melting on shock compression of porous bodies. J. Appl. Mech. and Tech. Phys. 23, 131-142 (in Russian); English trans. (1982) J. Appl. Mech. and Tech. Phys. July, 123-134.
Gradshteyn, I. S. and Ryzhik, I. M. (1980) Table of Integrals, Series, and Products (Corrected and Enlarged Edition), p. 205. Academic Press, San Diego.
Johnson, N. (1990) Personal communication, Los Alamos National Laboratory. Hofmann, R., Andrews, D. J. and Maxwell, D. E. (1968) Computed shock response of porous
aluminum. J. Appl. Phys. 39,4555-4562. Holman, G. T., Graham, R. A. and Anderson, M. U. (1993) Shock response of porous
2Al+Fe,O, powder mixtures. Proceedings of the Joint Meeting of the International Associ- ation for the Advancement of High Pressure Science and Technology and the American Physical Society Topical Group on Shock Compression of Condensed Matter, ed. S. C. Schmidt, J. W. Shaner, G. A. Samara and M. Ross, pp. 1119-l 122. AIP Press, New York.
Holt, A. C., Carroll, M. M. and Butcher, B. M. (1974) Application of a new theory for the pressure-induced collapse for pores in ductile materials. Pore Structure and Properties qf Materials, ed. S. Modry, 5, pp. D63-D68. Academia, Prague.
Kasiraj, P., Vreeland, T. Jr., Schwarz, R. B. and Ahrens, T. J. (1984) Mechanical properties of a shock consolidated steel powder. Shock Waves in Condensed Matter : Proc. Amer. Phys. Sot. Topical Conf., ed. J. R. Asay, R. A. Graham and G. K. Straub, pp. 435-438. Elsevier Sci. Pub]., Amsterdam.
Kreig, R. D. and Key, S. W. (1976) Implementation of a time dependent plasticity theory into structural programs. Constitutive Equations in Viscoplasticity : Computational and Engin- eering Aspects, pp. 125-137. ASME, New York.
Krueger, B. A., Mutz, A. H. and Vreeland, T. Jr. (1992) Shock-induced and self-propagating high-temperature synthesis reactions in two powder mixtures : 5 : 3 atomic ratio Ti/Si and 1 : 1 atomic ratio Ni/Si. Metallurgical Transactions 23A, 55-58.
McGlaun, J. M. (1982) Improvements in CSQII : a transmitting boundary condition. Technical Report SAND82-1248, Sandia National Laboratories, Albuquerque, NM.
Meyers, M. A. and Wang, S. L. (1988) An improved method for shock consolidation of powders. Acta Metall. 36, 925-936.
Meyers, M. A., Benson, D. J. and Shang, S. S. (1994) Energy expenditure and limitations in shock consolidation. Proceedings qf the Joint Meeting of the International Association for the

1998 D. J. BENSON et al.
Advancement of High Pressure Science and Technology and the American Physical Society Topical Group on Shock Compression of Condensed Matter, ed. S. C. Schmidt, J. W. Shaner, G. A. Samara and M. Ross, pp. 1239-1242. AIP Press, New York.
Nesterenko, V. F. (1975) Electrical effects under shock loading of metals contact. Physics of Explosion, Combustion and Shock Waves, 11, 444456 (in Russian) ; English trans. (1976) Physics of Explosion, Combustion and Shock Waves, 11, 376-385.
Nesterenko, V. F. (1985) Potential of shock-wave methods for preparing and compacting rapidly quenched materials. Physics of Explosion, Combustion and Shock Waves 21, 85-98 (in Russian) ; English trans. (1986) Physics of Explosion, Combustion and Shock Waves May, 73&740.
Nesterenko, V. F. (1988) Micromechanics of powders under strong impulse loading. Computer Methods in Theory of Elasticity and Plasticity : Proceedings of X All-Union Conference, ed. F. M. Fomin, pp. 212-220. ITPM SO AN SSSR, Novosibirsk.
Nesterenko, V. F., Lazaridi, A. N., Pershin, S. A., Miller, V. Y., Feschiev, N. H., Krystev, M. R., Minev, R. M. and Panteleeva, D. B. (1989) Properties of compacts from rapidly solidified steel granules of different sizes after shock-wave consolidation. Proc. International Seminar on High-Energy Working of Rapidly Solidt$ed Materials and High-T,. Ceramics, ed. V. F. Nesterenko and A. A. Shtertzer, pp. 118-126. Siberian Branch USSR Academy of Sciences, Novosibirsk (in Russian).
Nesterenko, V. F. and Lazaridi, A. N. (1990) Regimes of shock-wave compaction of granular materials. High Pressure Science and Technology : Proceedings of XII AIRAPT and XXVII EMPRG Intern. Co@., ed. W. B. Holzapfel and P. G. Johansen, pp. 835-837. Gordon & Breach, New York.
Nesterenko, V. F. (1992) High-Rate Deformation of Heterogeneous Materials. Nauka, Novo- sibirsk.
Nesterenko, V. F. and Bondar, M. P. (1994) Investigation of deformation localization by the “Thick-Walled Cylinder” method. DYMAT Journal 1,245-251.
Nesterenko, V. F. (1995) Dynamic loading of porous materials : potential and restrictions for novel materials applications. Metallurgical and Materials Applications of Shock- Wave and High-Strain-Rate Phenomena: Proceedings of the 1995 International Conference EXPLO- MET-95, ed. L. E. Murr, K. P. Staudhammer and M. A. Meyers, pp. 3-13. Elsevier, Amsterdam.
Shang, S. S., Benson, D. J. and Meyers, M. A. (1994) Microstructurally-based analysis and computational modeling of shock consolidation. Journal de Physique, 4, C8-521-C8-526.
Steinberg, D. J. (1996) Equation of state and strength properties of selected materials. Uni- versity of California, Lawrence Livermore National Laboratory, Rept. UCRL-MA-106439.
Steinberg, D. J. and Guinan, M. W. (1978) A high-strain-rate constitutive model for metals. University of California, Lawrence Livermore National Laboratory, Rept. UCRL-80465.
Steinberg, D. J., Cochran, S. G. and Guinan, M. W. (1980) A constitutive model for metals applicable at high-strain rate. J. Appl. Phys. 51, 149881504.
Tadhani, N. N., Dunbar, E. and Graham, R. A. (1994) Characteristics of shock-compressed configuration of Ti and Si powder mixtures. Proceedings of the Joint Meeting of the Inter- national Association for the Advancement of High Pressure Science and Technology and the American Physical Society Topical Group on Shock Compression of Condensed Matter, ed. S. C. Schmidt, J. W. Shaner, G. A. Samara and M. Ross), pp. 1307-1310. AIP Press, New York.
Thouvenin, J. (1966) Action d’une onde de choc sur un solide poreux. J. Physics 27, 183-189. Tong, W. and Ravichandran, G. (1993) Dynamic pore collapse in viscoplastic materials. J.
Appl. Phys. 74,2425-2435. Tong, W. and Ravichandran, G. (1994) Rise time in shock consolidation of materials. Appl.
Phys. Lett. 65,2783-2785. van Leer, B. (1977) Towards the ultimate conservative difference scheme-IV. A new approach
to numerical convection. Journal of Computational Physics 23,276299. Wang, S. L., Meyers, M. A. and Szecket, A. (1988) Warm shock consolidation of IN718
powder. J. Mater. Science 23, 178&l 804.
Impulsive deformation of granular material 1999
Williamson, R. L. (1990) Parametric studies of dynamic powder consolidation using a particle- level numerical model. J. Appl. Phys. 68,1287-1296.
Williamson, R. L. and Berry, R. A. (1986) Microlevel numerical modeling of the shock wave induced consolidation of metal powders. Proceedings of the Fourth American Physical Society Topical Conference on Shock Waves in Condensed Matter, ed. Y. M. Gupta, pp. 341-346. Plenum Press, New York.
Williamson, R. L. and Wright, R. N. (1990) A particle-level numerical simulation of the dynamic consolidation of a metal matrix composite material. Shock Waves of Condensed Matter-1989 : Proceedings of the American Physical Society Topical Conference, ed. S. C. Schmidt, J. N. Johnson, and L. W. Davison, pp. 487490. Elsevier Science, Amsterdam.
Williamson, R. L., Wright, R. N., Korth, G. T. and Rabin, B. H. (1989) Numerical simulation of dynamic consolidation of SIC fiber-reinforced aluminum composite. J. Appl. PhJjs. 66, 18261831.
Youngs, D. L. (1982) Time dependent multi-material flow with large fluid distortion. Numerical Methods for Fluid Dynamics, ed. K. W. Morton and M. J. Baines, pp. 273-285.

![Linear Momentum Density in Quasistatic Electromagnetic Systems · arXiv:physics/0404139v1 [physics.ed-ph] 29 Apr 2004 Linear Momentum Density in Quasistatic Electromagnetic Systems](https://img.pdfslide.us/doc/110x75/5e00efafeeb98575462d5f23/linear-momentum-density-in-quasistatic-electromagnetic-systems-arxivphysics0404139v1.jpg)