Embed Size (px)
Citation preview

Quasi-Biennial Oscillation InfluenceOn The Madden-Julian Oscillation
Presenters Name:
Wes Lee JohnsonMentor’s Name:
Senior Research Scientist Lon Hood of The Lunar and Planetary Laboratory at the University of Arizona
Credit: Jon Gottschalck
The Madden Julian Oscillation (MJO) is a subseasonal (30 to 90-day) variation of tropical convection and precipitation that produces effects on weather outside of the tropics (similar to El Nino but on a shorter time scale).The Madden Julian Oscillation (MJO) both suppresses and increases precipitation.
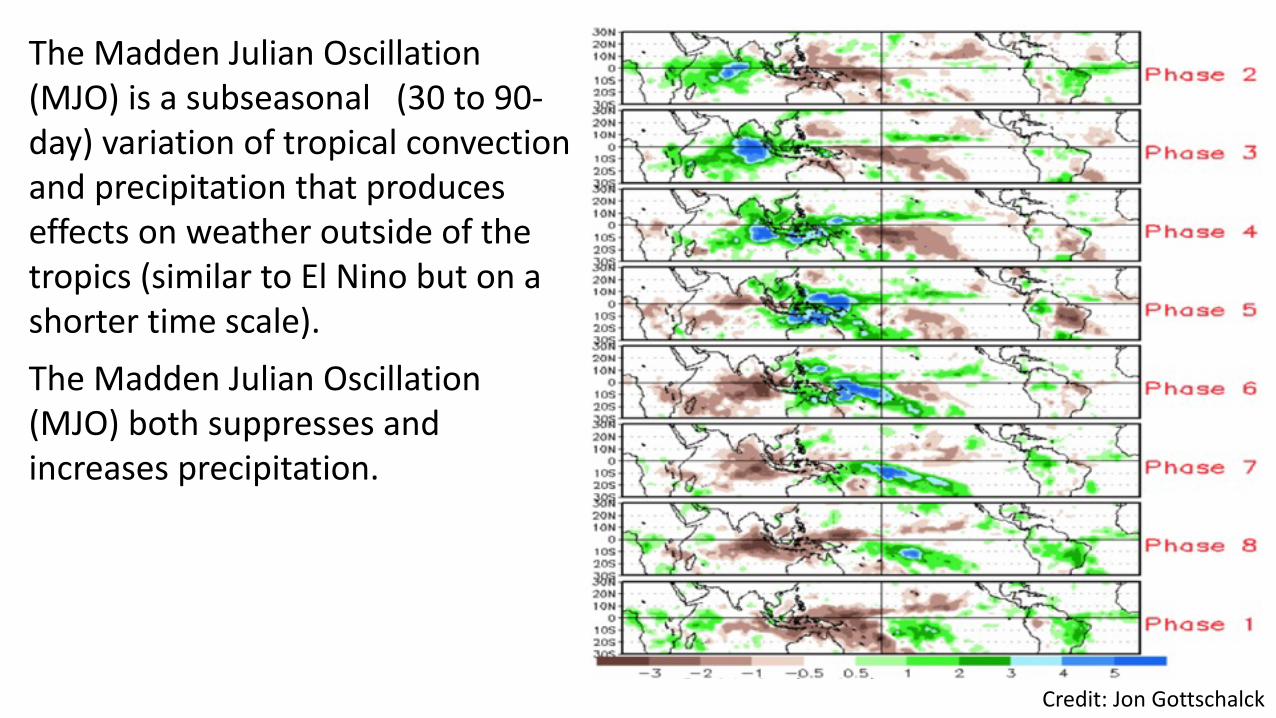
MJO
Credit: Cici Zhang
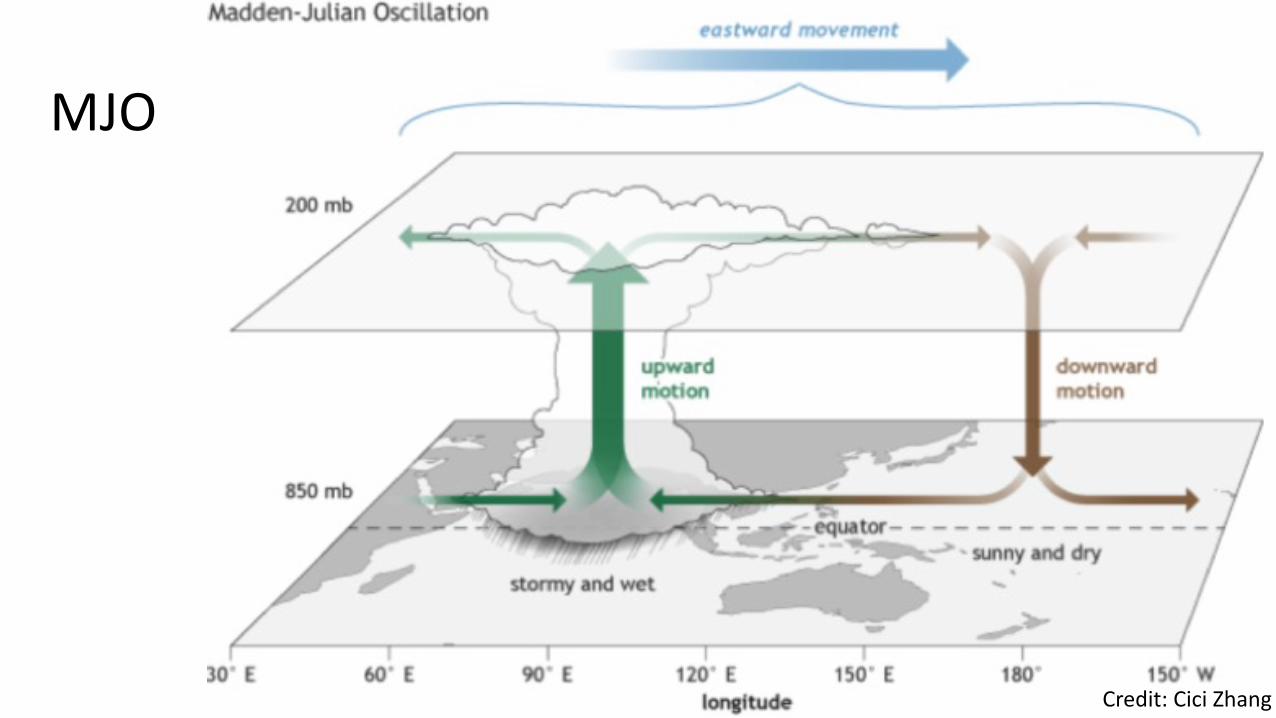
This plot shows the difference between the surface precipitation during strong MJO events over the November to April season and the average precipitation.
Red: West PhaseBlue: East Phase
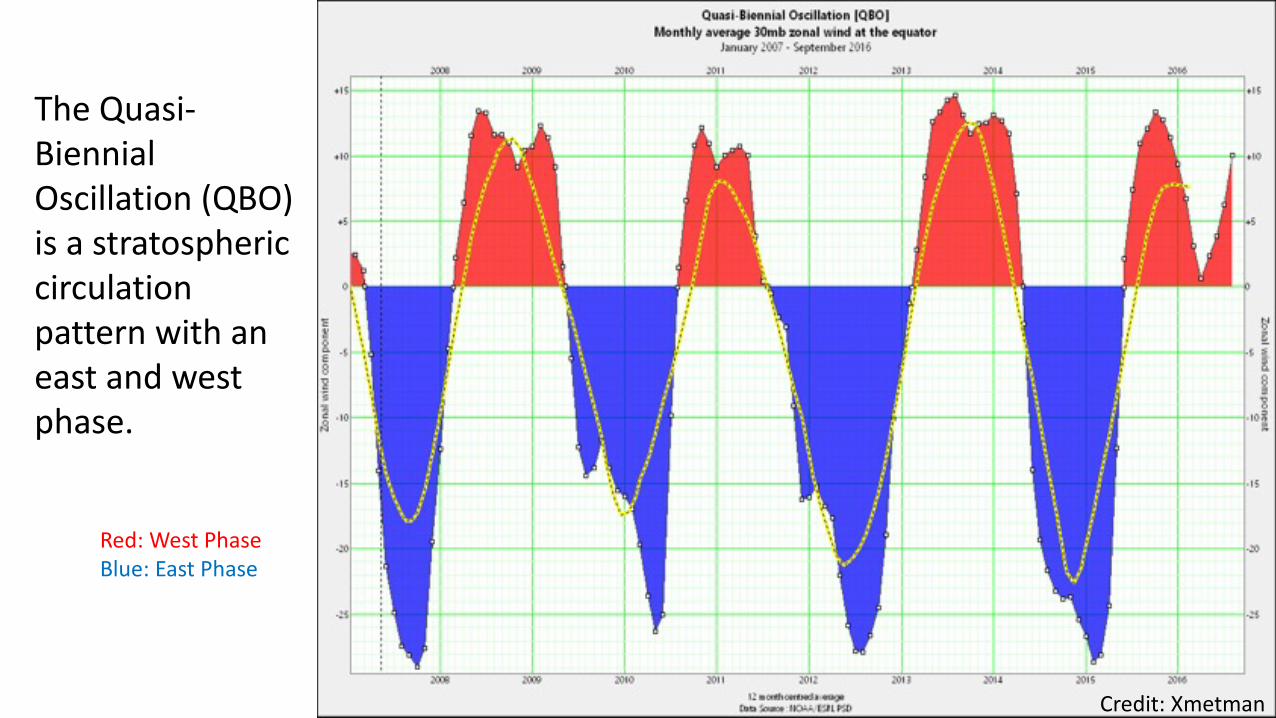
The Quasi-Biennial Oscillation (QBO) is a stratospheric circulation pattern with an east and west phase.
Credit: Xmetman
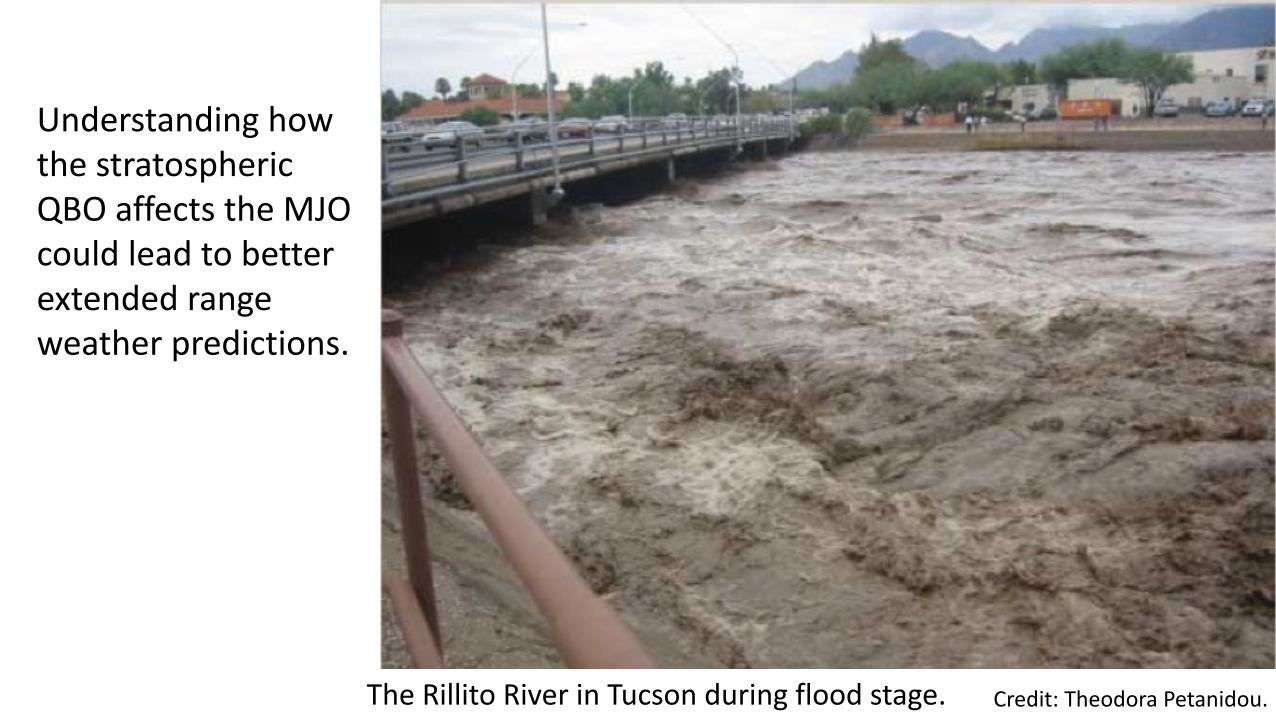
Credit: Theodora Petanidou.The Rillito River in Tucson during flood stage.
Understanding how the stratospheric QBO affects the MJO could lead to better extended range weather predictions.
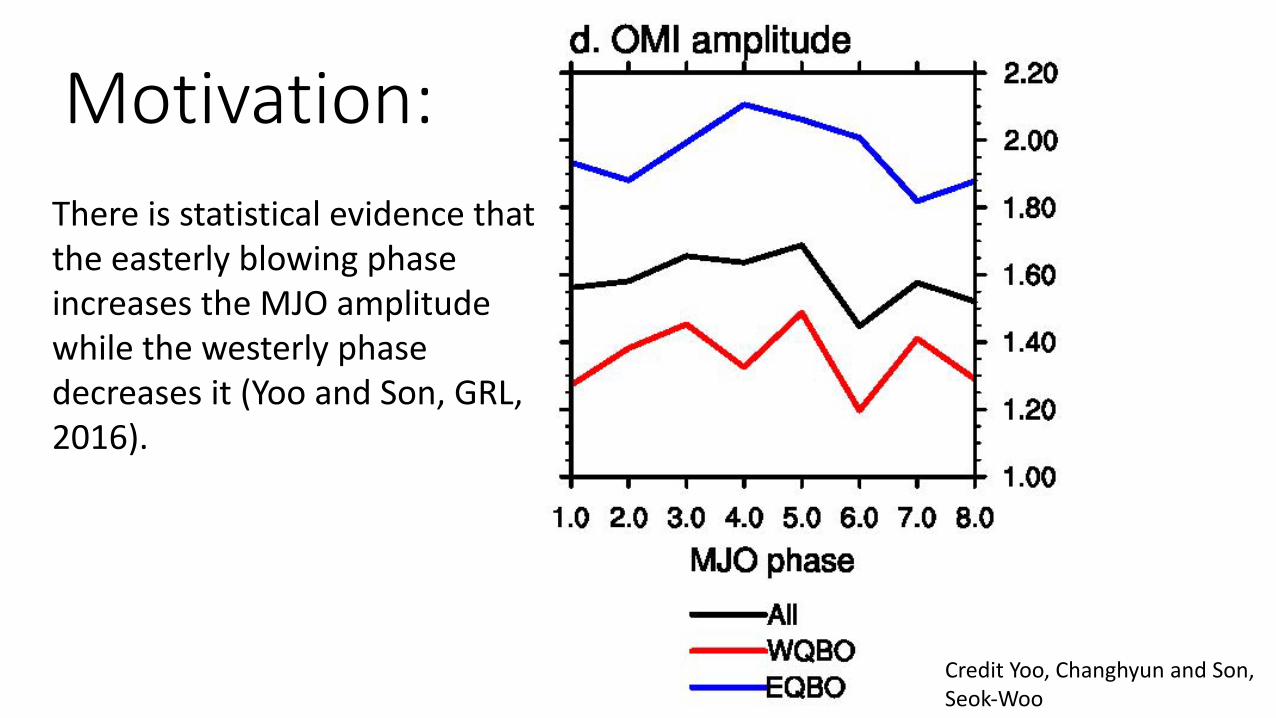
Motivation:There is statistical evidence that the easterly blowing phase increases the MJO amplitude while the westerly phase decreases it (Yoo and Son, GRL, 2016).
Credit Yoo, Changhyun and Son, Seok-Woo
Why would the QBO interact with the MJO?
•The MJO is an eastward propagating tropical weather disturbance with convection sometimes reaching up into the lower stratosphere.•The QBO lower stratospheric wind oscillation affects temperature in the tropopause region, which can affect the efficiency of convection in the troposphere.
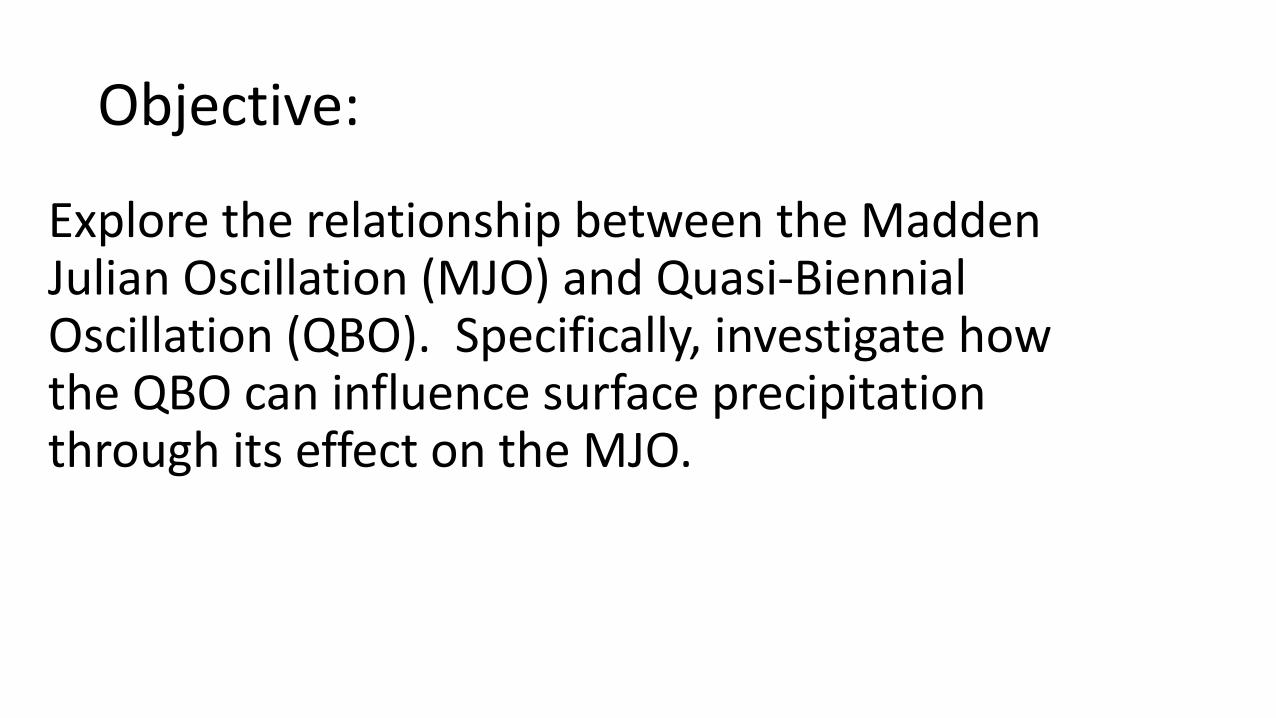
Objective:
Explore the relationship between the Madden Julian Oscillation (MJO) and Quasi-Biennial Oscillation (QBO). Specifically, investigate how the QBO can influence surface precipitation through its effect on the MJO.
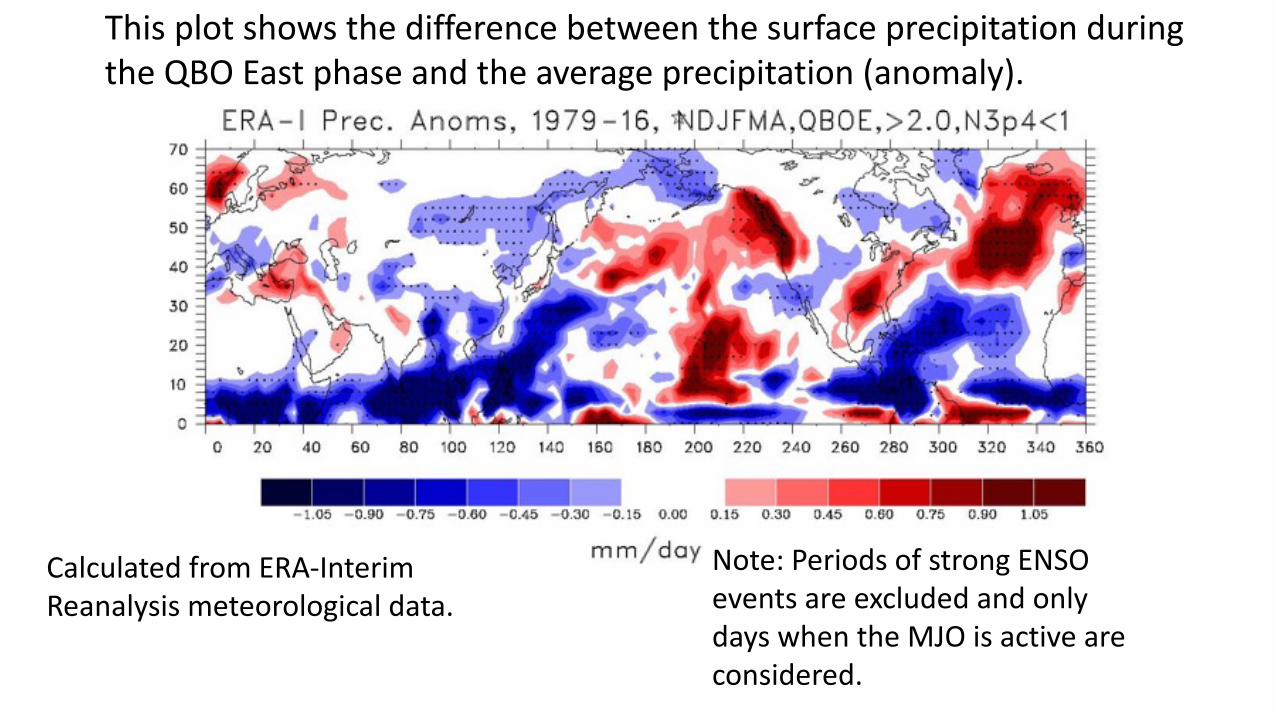
This plot shows the difference between the surface precipitation during the QBO East phase and the average precipitation (anomaly).
Note: Periods of strong ENSO events are excluded and only days when the MJO is active are considered.
Calculated from ERA-Interim Reanalysis meteorological data.
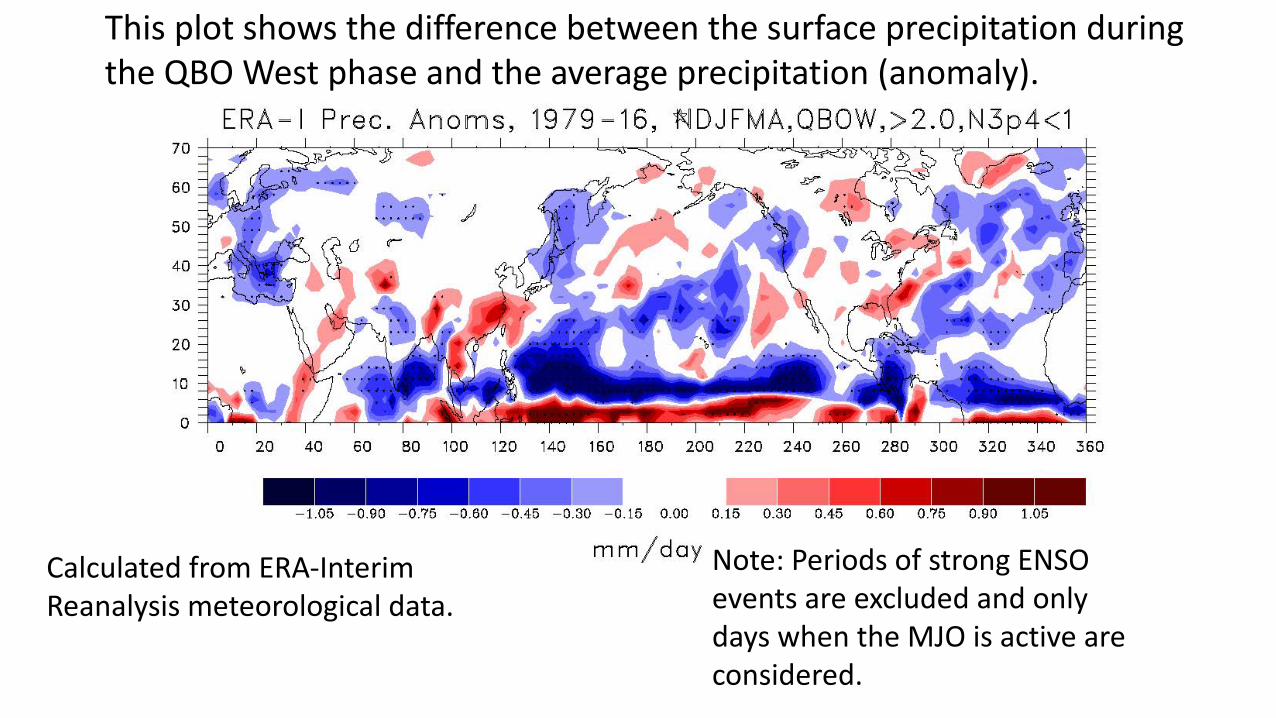
This plot shows the difference between the surface precipitation during the QBO West phase and the average precipitation (anomaly).
Note: Periods of strong ENSO events are excluded and only days when the MJO is active are considered.
Calculated from ERA-Interim Reanalysis meteorological data.
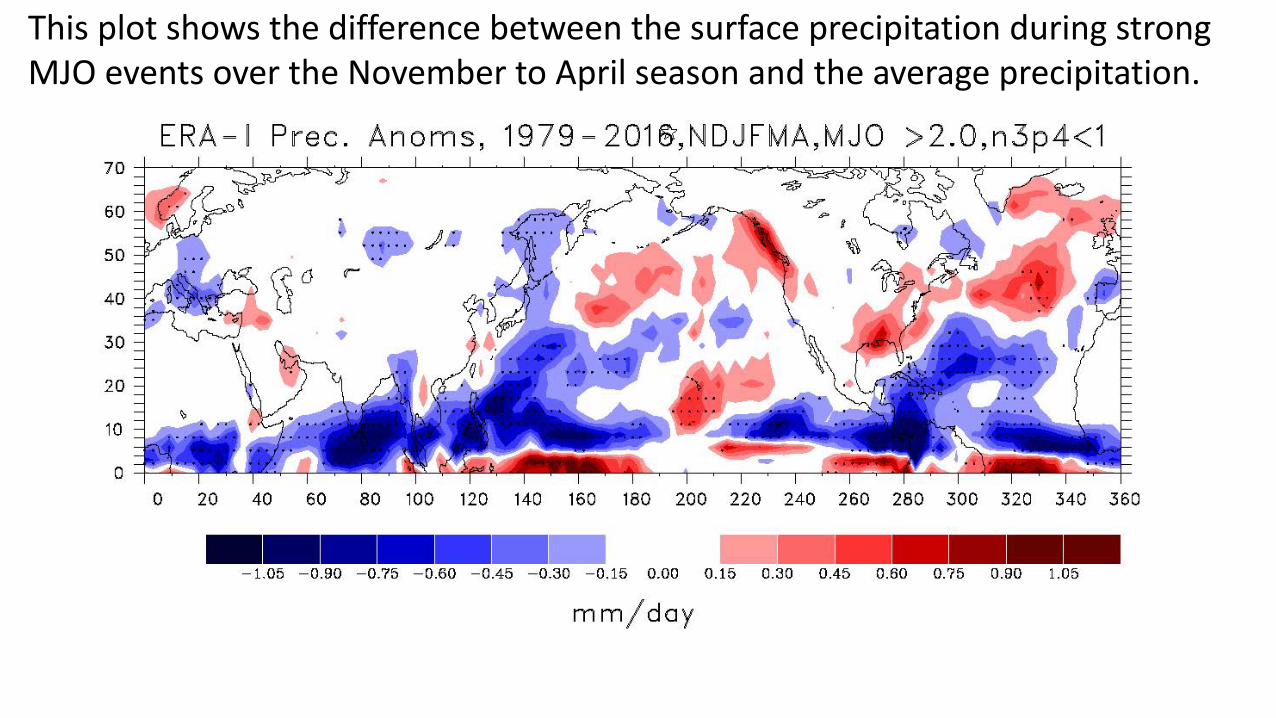
This plot shows the difference between the surface precipitation during strong MJO events over the November to April season and the average precipitation.
Conclusions• From the graphs above we see that during the QBOE phase,
the surface precipitation increases in regions that are influenced by the MJO relative to that during the QBOW phase. This is consistent with the hypothesis that the increased MJO amplitude during QBOE can affect surface precipitation conditions.• Knowing this, we can see that the stratospheric QBO can
potentially impact surface weather conditions.• This could lead to improvements in extended range (weeks
to months) weather forecasting.
AcknowledgementsThanks to the Arizona Space Grant Consortium and the NSF Climate and Large-Scale Dynamics Program for funding.
Thanks to my mentor Lon Hood, who has helped me greatly.
Thanks to my peer Malori Redman.
And all the Space Grant Consortium Organizers.

Measurements •We use the European Reanalysis data (ERA Interim) data.• This data are created in a process called data assimilation.• Observational data from satellites, weather balloons, and
weather stations are fed into global weather models.• Their predictions are compared with actual data and the
model’s predictions become better over time. • The ERA reanalysis data contains temperature and
precipitation data across the whole globe that span back 39 years (among many other variables).
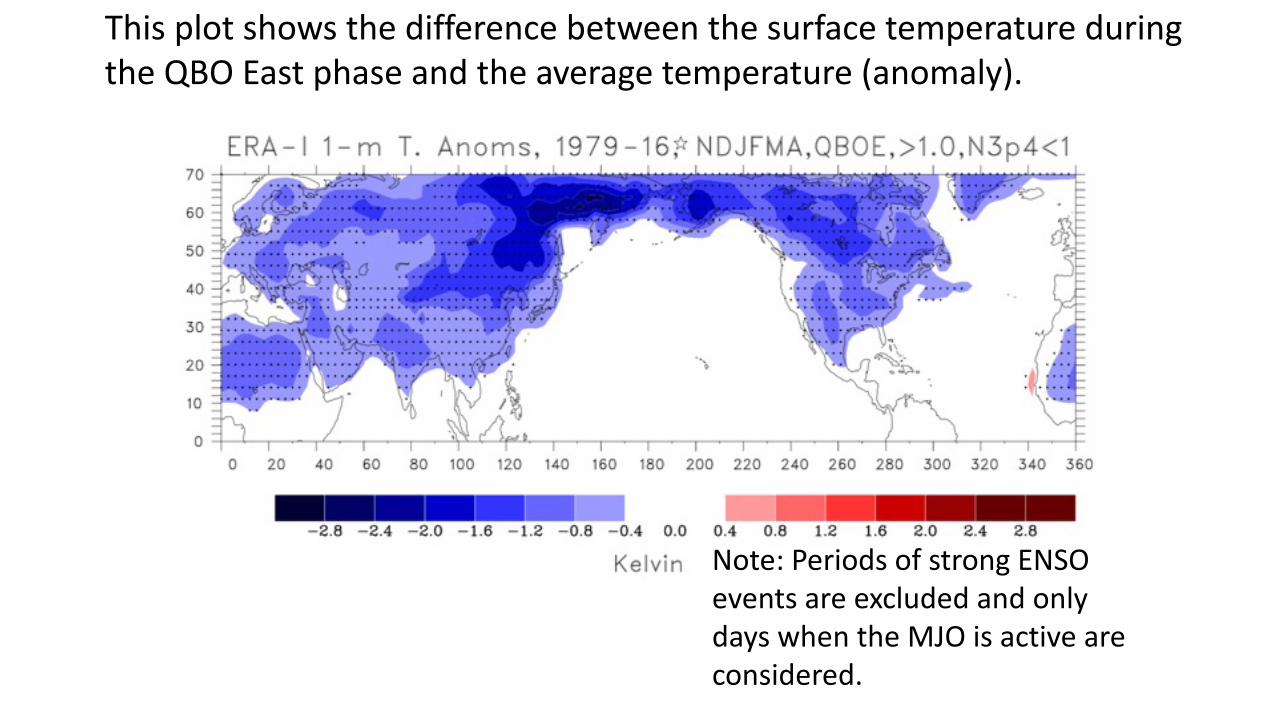
This plot shows the difference between the surface temperature during the QBO East phase and the average temperature (anomaly).
Note: Periods of strong ENSO events are excluded and only days when the MJO is active are considered.
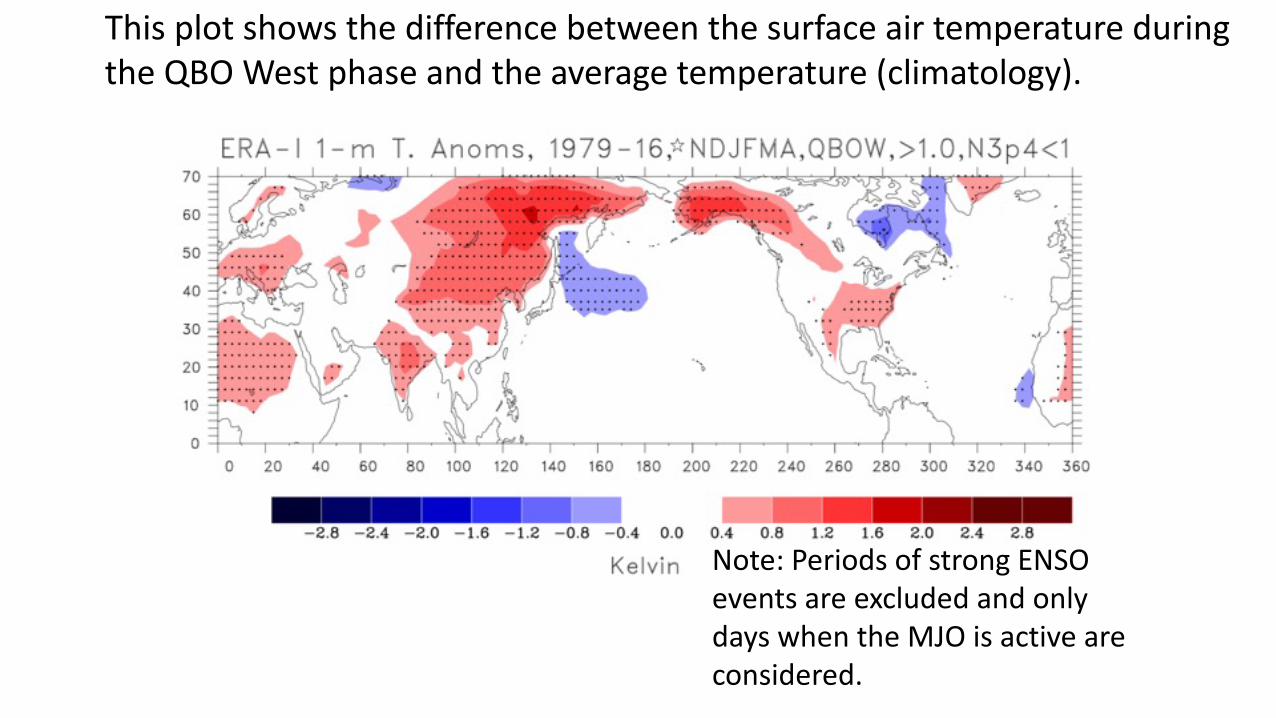
This plot shows the difference between the surface air temperature during the QBO West phase and the average temperature (climatology).
Note: Periods of strong ENSO events are excluded and only days when the MJO is active are considered.
Credit: Gustavo Moreira, Carlos & Pacifico, Maria & Romaña, Sergio.