Embed Size (px)
Citation preview
International Research Journal
Vol. 4(4), 9-16, April (2016)
International Science Community Association
Quartimax Rotational Principal Component Analysis for Land Use and Land
Department of Remote Sensing, BIT Mesra, Ranchi, Jharkhand
AvailableReceived 16th January
Abstract
LULC classification were performed using Rotational Principal component approach on multispectral Landsat8 OLI datasets
to increase the spectral divergence among the classes, which result better classification accuracy. We adopted Quartimax
Rotational criteria to perform rotation using PC layers, which were obtained by performing PCA transformation using
multispectral bands. We observed that, Quartimax rotational criteria improved the level of
enhancing the spectral characteristics of the different spectral land cover
than an ordinary PCA transformation approach over the same multispectral dataset.
Keywords: Quartimax Rotational PCA; Land use and Land cover; Eigenvector;
Introduction
Accurate extraction of land cover features for land use and land
cover classification in a complex landscape environments is
always a big issue and a major challenge from the past and to
solve this issue many researchers adopted different spectral
enhancement algorithms like Principal component analysis
(PCA)1-4
, Canonical discriminant analysis (CDA)
index factor (OIF)6, Brightness value overlapping index
(BVOI)7, Linear discriminant analysis (LDA)
component analysis (CCA)10
, Minimum noise fraction
(MNF)11,12
, Independent component analysis (ICA)
Principal component analysis is a lower order multivariate
statistical dimensionality reduction algorithm widely ac
and used in remote sensing digital image processing as a
spectral enhancement algorithm to process multispectral and
hyper spectral dataset during LULC classification and change
detection analysis for accurate mapping and extraction of
different spectral land cover features1,16,17
. Rotational Principal
component analysis is a multivariate statistical approach
perform rotation using an ordinary principal component layers
to obtained more better spectral situation, that can’t obtained
from ordinary PC layers18-23
. It is a procedure in which the
eigenvectors (factors) are rotated in an attempt to achieve simple
structure2,19
. Explain through rotation of the factor or PC vectors
we obtain simple and interpretable factors. Figure
hierarchy chain of different rotational approaches widely
accepted and used in different statistical analysis.
Quartimax Rotational criteria is an orthogonal rotational criteria
like Varimax criteria3, which re-orients and redistributes the
spectral features from PC vectors space into newly generated
orthogonal coordinate vector space. It maximize the difference
of square factor loading for each variable across the factors,
Journal of Earth Sciences_____________________________________
Association
Quartimax Rotational Principal Component Analysis for Land Use and Land
Cover Classification Md Shahid Latif
Department of Remote Sensing, BIT Mesra, Ranchi, Jharkhand-835215, India
Available online at: www.isca.in, www.isca.me January 2016, revised 16th March 2016, accepted 15th April 2016
LULC classification were performed using Rotational Principal component approach on multispectral Landsat8 OLI datasets
to increase the spectral divergence among the classes, which result better classification accuracy. We adopted Quartimax
perform rotation using PC layers, which were obtained by performing PCA transformation using
multispectral bands. We observed that, Quartimax rotational criteria improved the level of
s of the different spectral land cover class and satisfied higher classification accuracy
than an ordinary PCA transformation approach over the same multispectral dataset.
: Quartimax Rotational PCA; Land use and Land cover; Eigenvector; Eigen value; Factor loading Matrix.
Accurate extraction of land cover features for land use and land
cover classification in a complex landscape environments is
always a big issue and a major challenge from the past and to
solve this issue many researchers adopted different spectral
enhancement algorithms like Principal component analysis
, Canonical discriminant analysis (CDA)5, Optimum
Brightness value overlapping index
inant analysis (LDA)8,9
, Canonical
Minimum noise fraction
, Independent component analysis (ICA)13-15
.
Principal component analysis is a lower order multivariate
statistical dimensionality reduction algorithm widely accepted
and used in remote sensing digital image processing as a
spectral enhancement algorithm to process multispectral and
dataset during LULC classification and change
detection analysis for accurate mapping and extraction of
Rotational Principal
component analysis is a multivariate statistical approach to
perform rotation using an ordinary principal component layers
to obtained more better spectral situation, that can’t obtained
It is a procedure in which the
eigenvectors (factors) are rotated in an attempt to achieve simple
through rotation of the factor or PC vectors
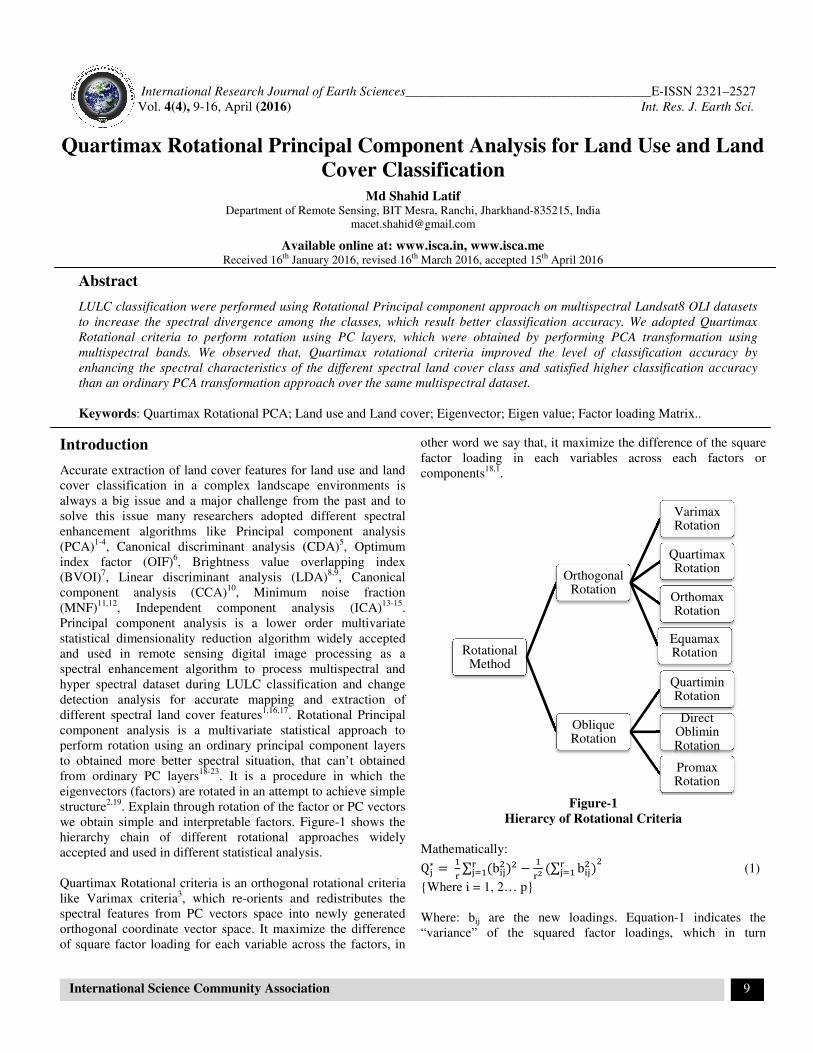
we obtain simple and interpretable factors. Figure-1 shows the
chain of different rotational approaches widely
accepted and used in different statistical analysis.
Quartimax Rotational criteria is an orthogonal rotational criteria
orients and redistributes the
C vectors space into newly generated
orthogonal coordinate vector space. It maximize the difference
of square factor loading for each variable across the factors, in
other word we say that, it maximize the difference of the square
factor loading in each variables across each factors or
components18,1
.
Figure-
Hierarcy of Rotational Criteria
Mathematically:
Q�∗ �
�
�∑ b��
� � ��
��∑ b��
� ����
�����
{Where i = 1, 2… p}
Where: bij are the new loadings. Equation
“variance” of the squared factor loadings, which in turn
Rotational Method
Orthogonal Rotation
Oblique Rotation
iences_____________________________________E-ISSN 2321–2527
Int. Res. J. Earth Sci.
9
Quartimax Rotational Principal Component Analysis for Land Use and Land
LULC classification were performed using Rotational Principal component approach on multispectral Landsat8 OLI datasets
to increase the spectral divergence among the classes, which result better classification accuracy. We adopted Quartimax
perform rotation using PC layers, which were obtained by performing PCA transformation using
multispectral bands. We observed that, Quartimax rotational criteria improved the level of classification accuracy by
satisfied higher classification accuracy
; Factor loading Matrix..
other word we say that, it maximize the difference of the square
riables across each factors or
-1
Hierarcy of Rotational Criteria
(1)
are the new loadings. Equation-1 indicates the
“variance” of the squared factor loadings, which in turn
Orthogonal Rotation
Varimax Rotation
Quartimax Rotation
Orthomax Rotation
Equamax Rotation
Oblique Rotation
Quartimin Rotation
Direct Oblimin Rotation
Promax Rotation
International Research Journal of Earth Sciences_
Vol. 4(4), 9-16, April (2015)
International Science Community Association
represent contribution to variance of the variables and maximize
the Equation-218
.
Q � ∑ Q�∗�
���
Equation (2) represents the sum of variances of the rotated
loadings. Since the Quartimax criterion attempts to maximize
variance across the components.
The objective of this research is to perform Quartimax rotation
after performing principal component analysis using
multispectral band and then we analytically compared
performing LULC classification with PCA on the basis of their
classification statistics like producer’s accuracy, user’s
accuracy, Kappa statistic and overall accuracy. All the rotational
process were performed using Microsoft Excel sheet 10 and
ERDAS IMAGINE 9.2.
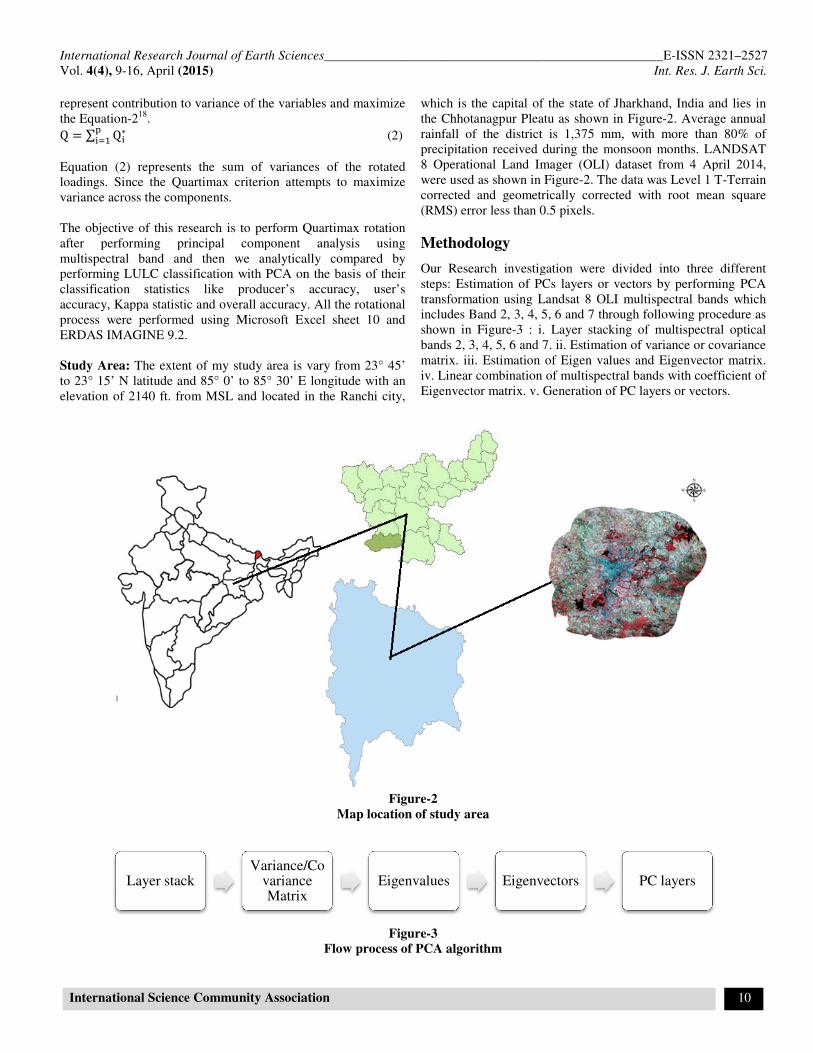
Study Area: The extent of my study area is vary from 23° 45’
to 23° 15’ N latitude and 85° 0’ to 85° 30’ E longitude with an
elevation of 2140 ft. from MSL and located in the Ranchi city,
Layer stackVariance/Co
variance Matrix
Sciences___________________________________________________
Association
represent contribution to variance of the variables and maximize
(2)
Equation (2) represents the sum of variances of the rotated
. Since the Quartimax criterion attempts to maximize
The objective of this research is to perform Quartimax rotation
after performing principal component analysis using
multispectral band and then we analytically compared by
performing LULC classification with PCA on the basis of their
classification statistics like producer’s accuracy, user’s
accuracy, Kappa statistic and overall accuracy. All the rotational
process were performed using Microsoft Excel sheet 10 and
The extent of my study area is vary from 23° 45’
to 23° 15’ N latitude and 85° 0’ to 85° 30’ E longitude with an
elevation of 2140 ft. from MSL and located in the Ranchi city,
which is the capital of the state of Jharkhand, India
the Chhotanagpur Pleatu as shown in Figure
rainfall of the district is 1,375 mm, with more than 80% of
precipitation received during the monsoon months. LANDSAT
8 Operational Land Imager (OLI) dataset from 4 April 2014,
were used as shown in Figure-2. The data was Level 1 T
corrected and geometrically corrected with root mean square
(RMS) error less than 0.5 pixels.
Methodology
Our Research investigation were divided into three different
steps: Estimation of PCs layers or vectors by performing PCA
transformation using Landsat 8 OLI multispectral bands which
includes Band 2, 3, 4, 5, 6 and 7 through following procedure as
shown in Figure-3 : i. Layer stacking of multispectral optical
bands 2, 3, 4, 5, 6 and 7. ii. Estimation of variance or covariance
matrix. iii. Estimation of Eigen values and Eigenvector matrix.
iv. Linear combination of multispectral bands with coefficient of
Eigenvector matrix. v. Generation of PC layers or vectors.
Figure-2
Map location of study area
Figure-3
Flow process of PCA algorithm
Variance/Covariance Matrix
Eigenvalues Eigenvectors
___________E-ISSN 2321–2527
Int. Res. J. Earth Sci.
10
which is the capital of the state of Jharkhand, India and lies in
the Chhotanagpur Pleatu as shown in Figure-2. Average annual
rainfall of the district is 1,375 mm, with more than 80% of
precipitation received during the monsoon months. LANDSAT
8 Operational Land Imager (OLI) dataset from 4 April 2014,
2. The data was Level 1 T-Terrain
corrected and geometrically corrected with root mean square
Our Research investigation were divided into three different
or vectors by performing PCA
transformation using Landsat 8 OLI multispectral bands which
7 through following procedure as
3 : i. Layer stacking of multispectral optical
tion of variance or covariance
values and Eigenvector matrix.
iv. Linear combination of multispectral bands with coefficient of
Eigenvector matrix. v. Generation of PC layers or vectors.
PC layers
International Research Journal of Earth Sciences___________________________________________________E-ISSN 2321–2527
Vol. 4(4), 9-16, April (2015) Int. Res. J. Earth Sci.
International Science Community Association 11
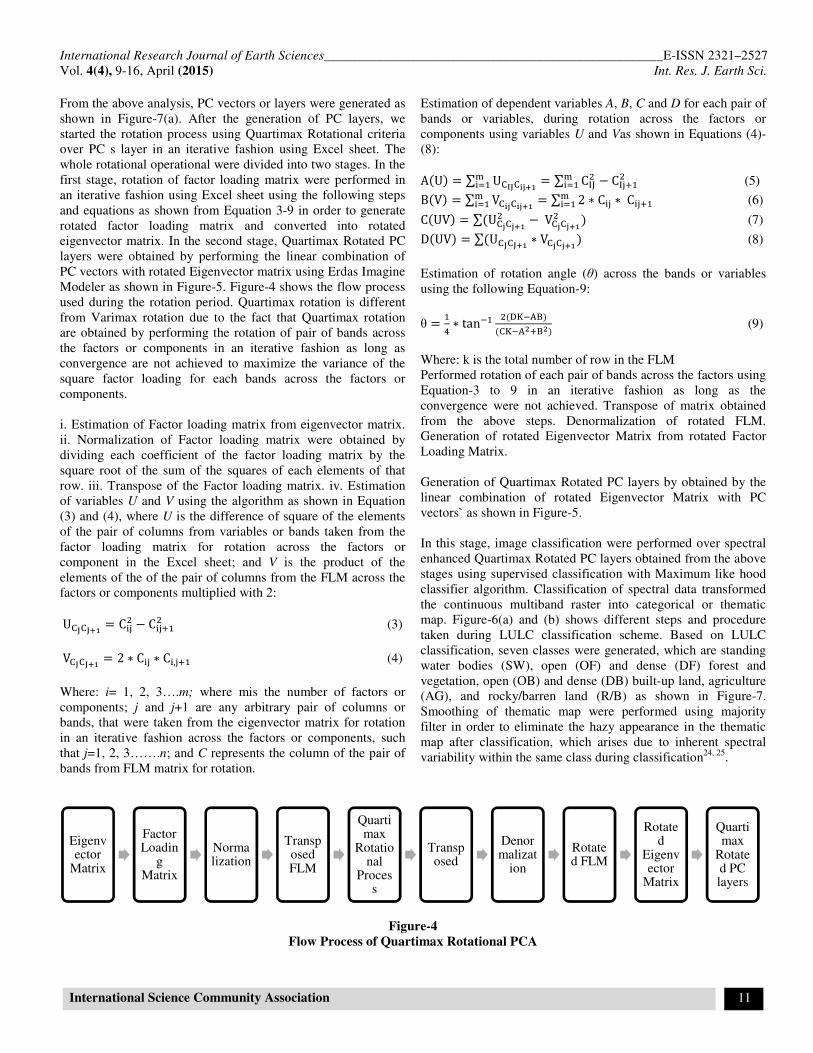
From the above analysis, PC vectors or layers were generated as
shown in Figure-7(a). After the generation of PC layers, we
started the rotation process using Quartimax Rotational criteria
over PC s layer in an iterative fashion using Excel sheet. The
whole rotational operational were divided into two stages. In the
first stage, rotation of factor loading matrix were performed in
an iterative fashion using Excel sheet using the following steps
and equations as shown from Equation 3-9 in order to generate
rotated factor loading matrix and converted into rotated
eigenvector matrix. In the second stage, Quartimax Rotated PC
layers were obtained by performing the linear combination of
PC vectors with rotated Eigenvector matrix using Erdas Imagine
Modeler as shown in Figure-5. Figure-4 shows the flow process
used during the rotation period. Quartimax rotation is different
from Varimax rotation due to the fact that Quartimax rotation
are obtained by performing the rotation of pair of bands across
the factors or components in an iterative fashion as long as
convergence are not achieved to maximize the variance of the
square factor loading for each bands across the factors or
components.
i. Estimation of Factor loading matrix from eigenvector matrix.
ii. Normalization of Factor loading matrix were obtained by
dividing each coefficient of the factor loading matrix by the
square root of the sum of the squares of each elements of that
row. iii. Transpose of the Factor loading matrix. iv. Estimation
of variables U and V using the algorithm as shown in Equation
(3) and (4), where U is the difference of square of the elements
of the pair of columns from variables or bands taken from the
factor loading matrix for rotation across the factors or
component in the Excel sheet; and V is the product of the
elements of the of the pair of columns from the FLM across the
factors or components multiplied with 2:
U������ � C��� � C����
� (3)
V������ � 2 ∗ C�� ∗ C�,��� (4)
Where: i= 1, 2, 3….m; where mis the number of factors or
components; j and j+1 are any arbitrary pair of columns or
bands, that were taken from the eigenvector matrix for rotation
in an iterative fashion across the factors or components, such
that j=1, 2, 3…….n; and C represents the column of the pair of
bands from FLM matrix for rotation.
Estimation of dependent variables A, B, C and D for each pair of
bands or variables, during rotation across the factors or
components using variables U and Vas shown in Equations (4)-
(8):
AU � ∑ U�������� ��� � ∑ C!"
� � C!����
��� (5)
BV � ∑ V�������� ��� � ∑ 2 ∗ C�� ∗ C����
��� (6)
CUV � ∑U������� �V������
� (7)
DUV � ∑U������ ∗ V������ (8)
Estimation of rotation angle (θ) across the bands or variables
using the following Equation-9:
θ ��
%∗ tan)�
�(*+),-)
(�+),��-�) (9)
Where: k is the total number of row in the FLM
Performed rotation of each pair of bands across the factors using
Equation-3 to 9 in an iterative fashion as long as the
convergence were not achieved. Transpose of matrix obtained
from the above steps. Denormalization of rotated FLM.
Generation of rotated Eigenvector Matrix from rotated Factor
Loading Matrix.
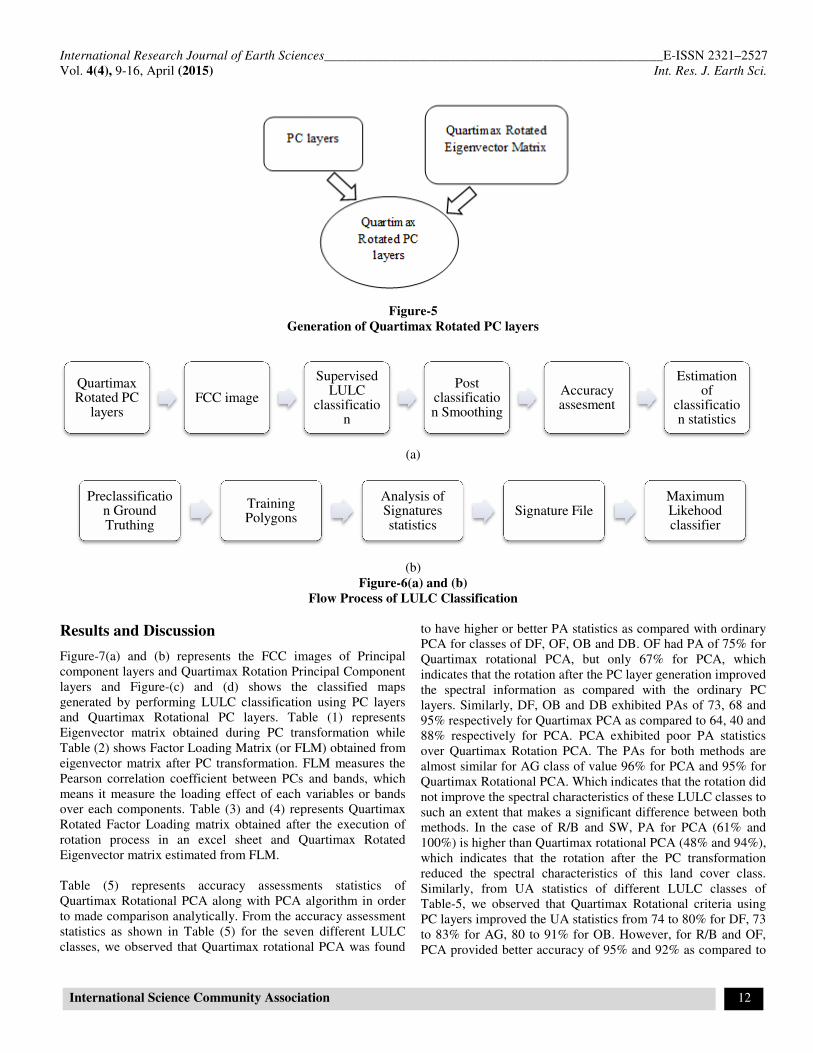
Generation of Quartimax Rotated PC layers by obtained by the
linear combination of rotated Eigenvector Matrix with PC
vectors` as shown in Figure-5.
In this stage, image classification were performed over spectral
enhanced Quartimax Rotated PC layers obtained from the above
stages using supervised classification with Maximum like hood
classifier algorithm. Classification of spectral data transformed
the continuous multiband raster into categorical or thematic
map. Figure-6(a) and (b) shows different steps and procedure
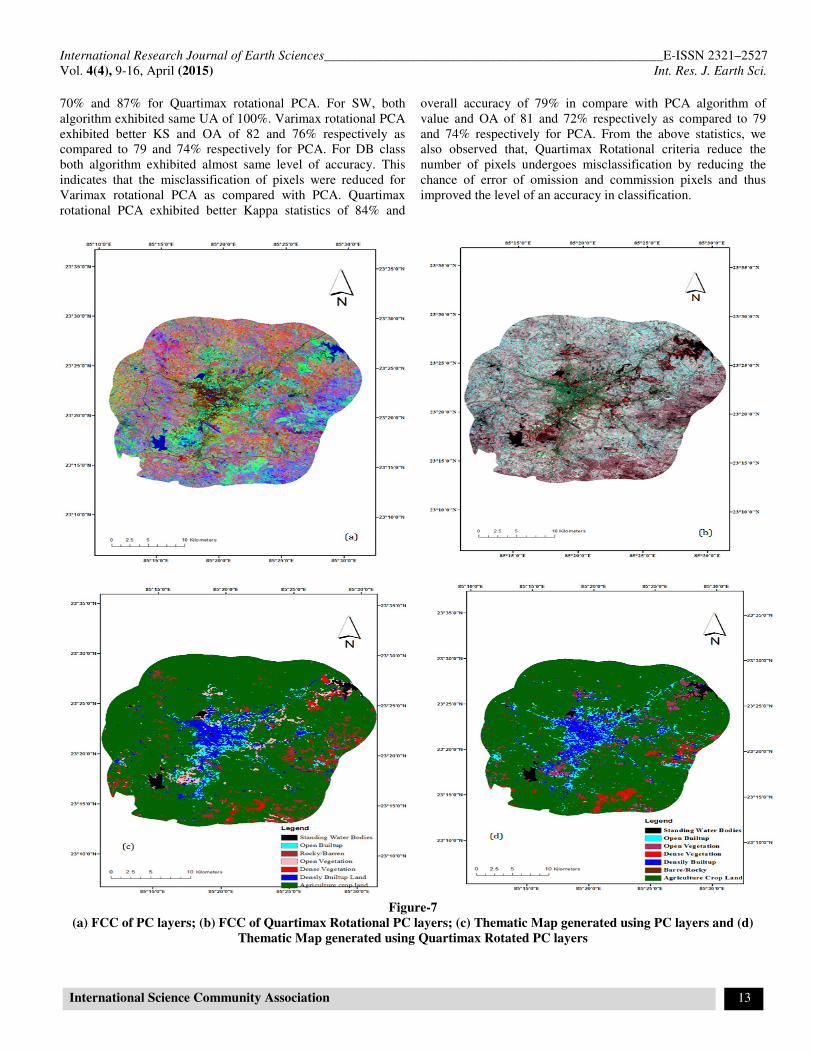
taken during LULC classification scheme. Based on LULC
classification, seven classes were generated, which are standing
water bodies (SW), open (OF) and dense (DF) forest and
vegetation, open (OB) and dense (DB) built-up land, agriculture
(AG), and rocky/barren land (R/B) as shown in Figure-7.
Smoothing of thematic map were performed using majority
filter in order to eliminate the hazy appearance in the thematic
map after classification, which arises due to inherent spectral
variability within the same class during classification24, 25
.
Figure-4
Flow Process of Quartimax Rotational PCA
Eigenvector
Matrix
Factor Loadin
g Matrix
Normalization
Transposed FLM
Quartimax
Rotational
Process
Transposed
Denormalizat
ion
Rotated FLM
Rotated
Eigenvector
Matrix
Quartimax
Rotated PC layers
International Research Journal of Earth Sciences_
Vol. 4(4), 9-16, April (2015)
International Science Community Association
Generation of Quartimax Rotated PC layers
Results and Discussion
Figure-7(a) and (b) represents the FCC images of
component layers and Quartimax Rotation Principal Component
layers and Figure-(c) and (d) shows the classified maps
generated by performing LULC classification using PC layers
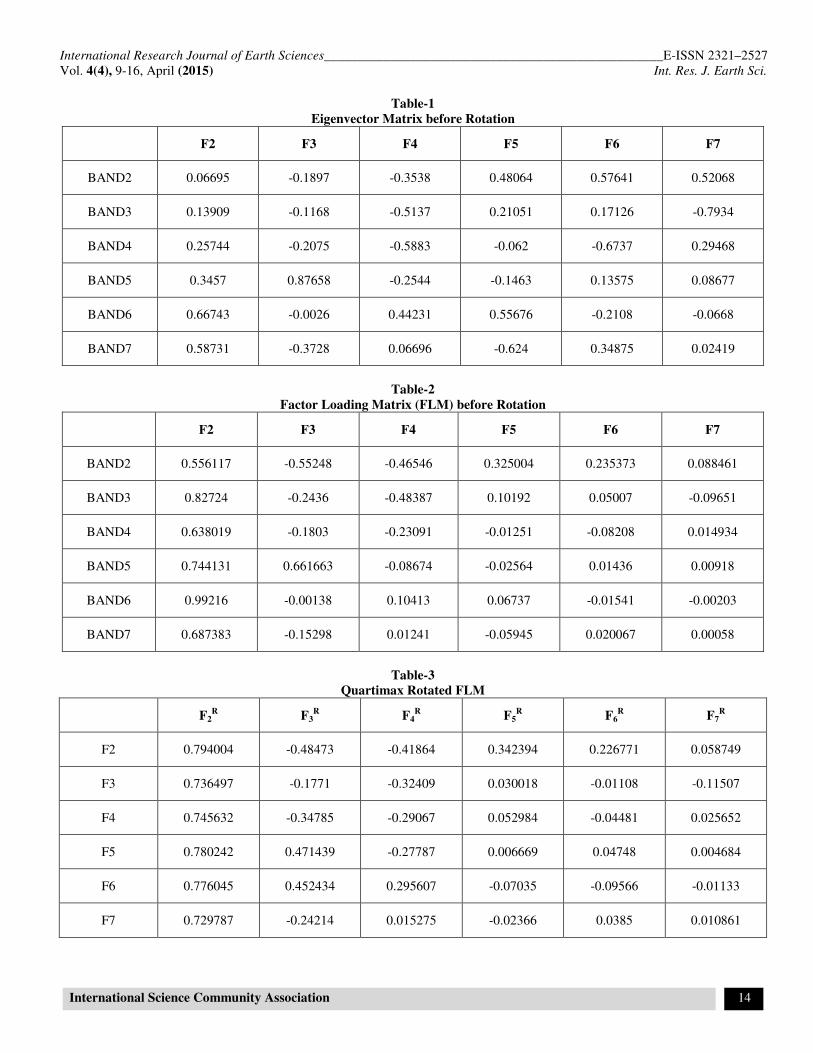
and Quartimax Rotational PC layers. Table (1) represents
Eigenvector matrix obtained during PC transformation while
Table (2) shows Factor Loading Matrix (or FLM) obtained from
eigenvector matrix after PC transformation. FLM measures the
Pearson correlation coefficient between PCs and bands, which
means it measure the loading effect of each variables or bands
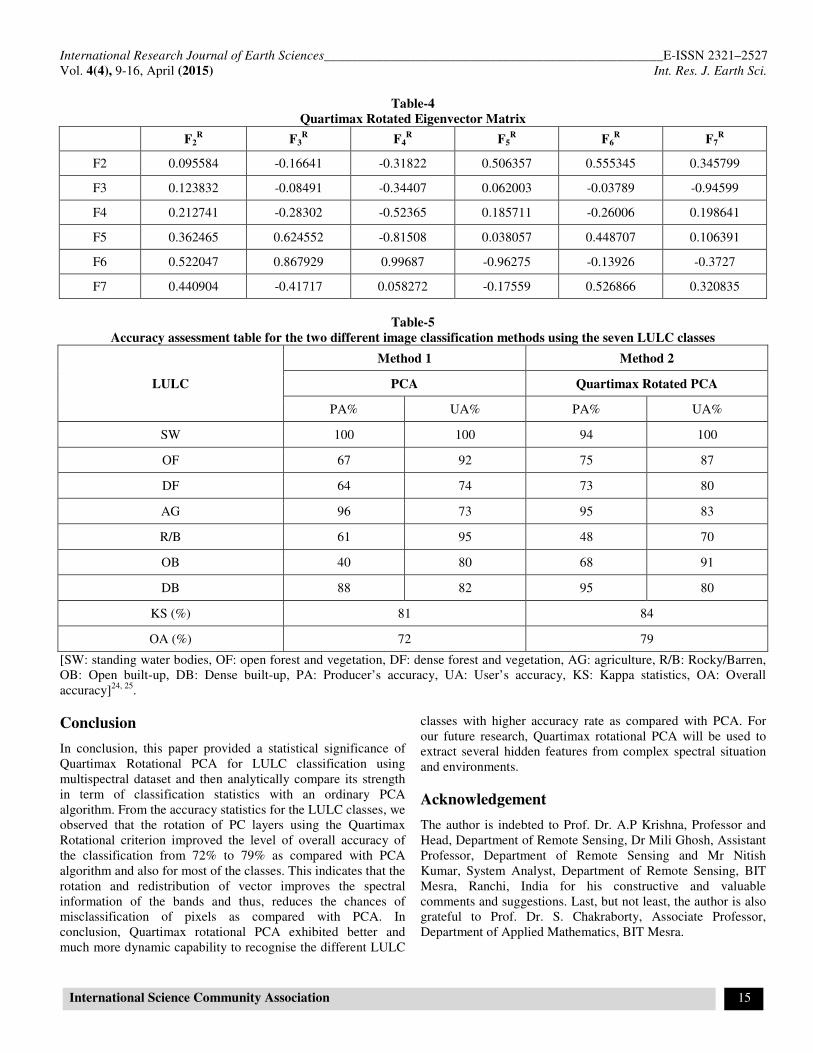
over each components. Table (3) and (4) represents Quartimax
Rotated Factor Loading matrix obtained after the execution of
rotation process in an excel sheet and Quartimax Rotated
Eigenvector matrix estimated from FLM.
Table (5) represents accuracy assessments statistics of
Quartimax Rotational PCA along with PCA algorithm in order
to made comparison analytically. From the accuracy assessment
statistics as shown in Table (5) for the seven different LULC
classes, we observed that Quartimax rotational PCA was found
Quartimax Rotated PC
layersFCC image
Preclassification Ground Truthing
Training Polygons
Sciences___________________________________________________
Association
Figure-5
Generation of Quartimax Rotated PC layers
(a)
(b)
Figure-6(a) and (b)
Flow Process of LULC Classification
7(a) and (b) represents the FCC images of Principal
component layers and Quartimax Rotation Principal Component
(c) and (d) shows the classified maps
generated by performing LULC classification using PC layers
and Quartimax Rotational PC layers. Table (1) represents
atrix obtained during PC transformation while
Table (2) shows Factor Loading Matrix (or FLM) obtained from
eigenvector matrix after PC transformation. FLM measures the
Pearson correlation coefficient between PCs and bands, which
g effect of each variables or bands
over each components. Table (3) and (4) represents Quartimax
obtained after the execution of
rotation process in an excel sheet and Quartimax Rotated
Table (5) represents accuracy assessments statistics of
Quartimax Rotational PCA along with PCA algorithm in order
to made comparison analytically. From the accuracy assessment
statistics as shown in Table (5) for the seven different LULC
ved that Quartimax rotational PCA was found
to have higher or better PA statistics as compared with ordinary
PCA for classes of DF, OF, OB and DB. OF had PA of 75% for
Quartimax rotational PCA, but only 67% for PCA, which
indicates that the rotation after the PC layer generation improved
the spectral information as compared with the ordinary PC
layers. Similarly, DF, OB and DB exhibited PAs of 73, 68 and
95% respectively for Quartimax PCA as compared to 64, 40 and
88% respectively for PCA. PCA exhibited poo
over Quartimax Rotation PCA. The PAs for both methods are
almost similar for AG class of value 96% for PCA and 95% for
Quartimax Rotational PCA. Which indicates that the rotation did
not improve the spectral characteristics of these LULC
such an extent that makes a significant difference between both
methods. In the case of R/B and SW, PA for PCA (61% and
100%) is higher than Quartimax rotational PCA (48% and 94%),
which indicates that the rotation after the PC transformation
reduced the spectral characteristics of this land cover class.
Similarly, from UA statistics of different LULC classes of
Table-5, we observed that Quartimax Rotational criteria using
PC layers improved the UA statistics from 74 to 80% for DF, 73
to 83% for AG, 80 to 91% for OB. However, for R/B and OF,
PCA provided better accuracy of 95% and 92% as compared to
Supervised LULC
classification
Post classification Smoothing
Accuracy assesment
Analysis of Signatures statistics
Signature File
___________E-ISSN 2321–2527
Int. Res. J. Earth Sci.
12
to have higher or better PA statistics as compared with ordinary
PCA for classes of DF, OF, OB and DB. OF had PA of 75% for
Quartimax rotational PCA, but only 67% for PCA, which
the PC layer generation improved
the spectral information as compared with the ordinary PC
layers. Similarly, DF, OB and DB exhibited PAs of 73, 68 and
95% respectively for Quartimax PCA as compared to 64, 40 and
88% respectively for PCA. PCA exhibited poor PA statistics
over Quartimax Rotation PCA. The PAs for both methods are
almost similar for AG class of value 96% for PCA and 95% for
Which indicates that the rotation did
not improve the spectral characteristics of these LULC classes to
such an extent that makes a significant difference between both
methods. In the case of R/B and SW, PA for PCA (61% and
100%) is higher than Quartimax rotational PCA (48% and 94%),
which indicates that the rotation after the PC transformation
duced the spectral characteristics of this land cover class.
Similarly, from UA statistics of different LULC classes of
5, we observed that Quartimax Rotational criteria using
PC layers improved the UA statistics from 74 to 80% for DF, 73
AG, 80 to 91% for OB. However, for R/B and OF,
PCA provided better accuracy of 95% and 92% as compared to
Accuracy assesment
Estimation of
classification statistics
Maximum Likehood classifier
International Research Journal of Earth Sciences___________________________________________________E-ISSN 2321–2527
Vol. 4(4), 9-16, April (2015) Int. Res. J. Earth Sci.
International Science Community Association 13
70% and 87% for Quartimax rotational PCA. For SW, both
algorithm exhibited same UA of 100%. Varimax rotational PCA
exhibited better KS and OA of 82 and 76% respectively as
compared to 79 and 74% respectively for PCA. For DB class
both algorithm exhibited almost same level of accuracy. This
indicates that the misclassification of pixels were reduced for
Varimax rotational PCA as compared with PCA. Quartimax
rotational PCA exhibited better Kappa statistics of 84% and
overall accuracy of 79% in compare with PCA algorithm of
value and OA of 81 and 72% respectively as compared to 79
and 74% respectively for PCA. From the above statistics, we
also observed that, Quartimax Rotational criteria reduce the
number of pixels undergoes misclassification by reducing the
chance of error of omission and commission pixels and thus
improved the level of an accuracy in classification.
Figure-7
(a) FCC of PC layers; (b) FCC of Quartimax Rotational PC layers; (c) Thematic Map generated using PC layers and (d)
Thematic Map generated using Quartimax Rotated PC layers
International Research Journal of Earth Sciences___________________________________________________E-ISSN 2321–2527
Vol. 4(4), 9-16, April (2015) Int. Res. J. Earth Sci.
International Science Community Association 14
Table-1
Eigenvector Matrix before Rotation
F2 F3 F4 F5 F6 F7
BAND2 0.06695 -0.1897 -0.3538 0.48064 0.57641 0.52068
BAND3 0.13909 -0.1168 -0.5137 0.21051 0.17126 -0.7934
BAND4 0.25744 -0.2075 -0.5883 -0.062 -0.6737 0.29468
BAND5 0.3457 0.87658 -0.2544 -0.1463 0.13575 0.08677
BAND6 0.66743 -0.0026 0.44231 0.55676 -0.2108 -0.0668
BAND7 0.58731 -0.3728 0.06696 -0.624 0.34875 0.02419
Table-2
Factor Loading Matrix (FLM) before Rotation
F2 F3 F4 F5 F6 F7
BAND2 0.556117 -0.55248 -0.46546 0.325004 0.235373 0.088461
BAND3 0.82724 -0.2436 -0.48387 0.10192 0.05007 -0.09651
BAND4 0.638019 -0.1803 -0.23091 -0.01251 -0.08208 0.014934
BAND5 0.744131 0.661663 -0.08674 -0.02564 0.01436 0.00918
BAND6 0.99216 -0.00138 0.10413 0.06737 -0.01541 -0.00203
BAND7 0.687383 -0.15298 0.01241 -0.05945 0.020067 0.00058
Table-3
Quartimax Rotated FLM
F2R F3
R F4
R F5
R F6
R F7
R
F2 0.794004 -0.48473 -0.41864 0.342394 0.226771 0.058749
F3 0.736497 -0.1771 -0.32409 0.030018 -0.01108 -0.11507
F4 0.745632 -0.34785 -0.29067 0.052984 -0.04481 0.025652
F5 0.780242 0.471439 -0.27787 0.006669 0.04748 0.004684
F6 0.776045 0.452434 0.295607 -0.07035 -0.09566 -0.01133
F7 0.729787 -0.24214 0.015275 -0.02366 0.0385 0.010861
International Research Journal of Earth Sciences___________________________________________________E-ISSN 2321–2527
Vol. 4(4), 9-16, April (2015) Int. Res. J. Earth Sci.
International Science Community Association 15
Table-4
Quartimax Rotated Eigenvector Matrix
F2R F3
R F4
R F5
R F6
R F7
R
F2
0.095584 -0.16641 -0.31822 0.506357 0.555345 0.345799
F3
0.123832 -0.08491 -0.34407 0.062003 -0.03789 -0.94599
F4 0.212741 -0.28302 -0.52365 0.185711 -0.26006 0.198641
F5
0.362465 0.624552 -0.81508 0.038057 0.448707 0.106391
F6
0.522047 0.867929 0.99687 -0.96275 -0.13926 -0.3727
F7
0.440904 -0.41717 0.058272 -0.17559 0.526866 0.320835
Table-5
Accuracy assessment table for the two different image classification methods using the seven LULC classes
LULC
Method 1 Method 2
PCA Quartimax Rotated PCA
PA% UA% PA% UA%
SW 100 100 94 100
OF 67 92 75 87
DF 64 74 73 80
AG 96 73 95 83
R/B 61 95 48 70
OB 40 80 68 91
DB 88 82 95 80
KS (%) 81 84
OA (%) 72 79
[SW: standing water bodies, OF: open forest and vegetation, DF: dense forest and vegetation, AG: agriculture, R/B: Rocky/Barren,
OB: Open built-up, DB: Dense built-up, PA: Producer’s accuracy, UA: User’s accuracy, KS: Kappa statistics, OA: Overall
accuracy]24, 25
.
Conclusion
In conclusion, this paper provided a statistical significance of
Quartimax Rotational PCA for LULC classification using
multispectral dataset and then analytically compare its strength
in term of classification statistics with an ordinary PCA
algorithm. From the accuracy statistics for the LULC classes, we
observed that the rotation of PC layers using the Quartimax
Rotational criterion improved the level of overall accuracy of
the classification from 72% to 79% as compared with PCA
algorithm and also for most of the classes. This indicates that the
rotation and redistribution of vector improves the spectral
information of the bands and thus, reduces the chances of
misclassification of pixels as compared with PCA. In
conclusion, Quartimax rotational PCA exhibited better and
much more dynamic capability to recognise the different LULC
classes with higher accuracy rate as compared with PCA. For
our future research, Quartimax rotational PCA will be used to
extract several hidden features from complex spectral situation
and environments.
Acknowledgement
The author is indebted to Prof. Dr. A.P Krishna, Professor and
Head, Department of Remote Sensing, Dr Mili Ghosh, Assistant
Professor, Department of Remote Sensing and Mr Nitish
Kumar, System Analyst, Department of Remote Sensing, BIT
Mesra, Ranchi, India for his constructive and valuable
comments and suggestions. Last, but not least, the author is also
grateful to Prof. Dr. S. Chakraborty, Associate Professor,
Department of Applied Mathematics, BIT Mesra.
International Research Journal of Earth Sciences___________________________________________________E-ISSN 2321–2527
Vol. 4(4), 9-16, April (2015) Int. Res. J. Earth Sci.
International Science Community Association 16
References
1. Eklundh L. and Singh A. (1993). A comparative analysis
of standardized and unstandardized principal components
analysis in remote sensing. Int. J. Remote Sens., 14,
1359-1370.
2. Hirosawa Y., Marsh S.E. and Kilman D.H. (1996).
Application of standardized principal component analysis
to LULC classification using multispectral AVHHR data.
Remote Sens Environ., 58, 267-81.
3. Lay D. (2000). Linear Algebra and Its Applications.
Addison-Wesley, New York. ISBN: 978-0321780720.
4. Laparra V., Tuia D., Jimenez S., Camps-vall G. and Malo
J. (2011). Principal polynomial analysis for remote
sensing data processing. 2011 Int. Geosci. Remote Sens.
Symp (IGARSS 2011), 24-29, Vancouver.
5. Guang Z. and Maclean A. (2000). A comparison of
canonical discriminant analysis and principal component
analysis for spectral transformation. Photogramm. Eng.
Remote Sens., 66, 841-847.
6. Ali M.Q. and Basavarajappa H.T. (2008). Application of
Optimum Index Factor Technique to Landsat-7 Data for
Geological Mapping of North East of Hajjah, Yemen.
Am. Euras. J. Sci. Res.,3, 84-91.
7. Joshi P.K., Gupta B. and Roy P.S. (2008). Spectral
evaluation of vegetation features using multi-satellite
sensor system (Terra ASTER, Landsat ETM+ and IRS
1D LISS III) in man-made and natural landscape. Sensor
Rev., 28, 52–61.
8. Martinez. and Kak A. (2001). PCA versus LDA. IEEE T.
Pattern Anal., 23, 228-233.
9. Sakarya U. (2014). Hyperspectral dimension reduction
using global and local information based linear
discriminant analysis. ISPRS Annals of the
Photogrammetry, Remote Sensing and Spatial
Information Sciences, ISPRS Technical Commission VII
Symposium, Volume II-7.
10. Lillesand T.M., Kiefer R. and Chipman J.W. (2014).
Remote Sensing and Image Interpretation. John Wiley
and Sons, Inc., New York. ISBN: 978-81-265-3223-0.
11. Gu H.Y., Li H.T. and Yang J.H., (2007). The remote
sensing image fusion method based on minimum noise
fraction. Remote Sens. Land Resour.,19, 53-55.
12. Marwaha R., Kumar A., Raju P.L.N. and Murthy
Y.V.N.K. (2014). Target detection algorithm for airborne
thermal hyperspectral data. The International Archives of
the Photogrammetry, Remote Sensing and Spatial
Information Science, ISPRS Technical Commission VIII
Symposium, XL-8.
13. Aapo H. (1999). Fast and robust fixed-point algorithms
for independent component analysis. IEEE T. Neural
Networ., 10, 626-634.
14. Quian D, Ivica K. and Harold S. (2006). Independent-
component analysis for hyperspectral remote sensing
imagery classification. Opt Eng. 45(1), 017008 (1-13).
15. Stephen R. and Richards E. (2015). Principal Component
Analysis Principal and Practice. Cambridge University
Press.
16. Christopher M. (2004). Use of Principal Component
Analysis (PCA) of Remote Sensing Images in Wetland
Change Detection on the Kafue Flats, Zambia. Geocarto
Int., 19(3).
17. Jensen JR. (1996). Introductory Digital Image
Processing: A Remote Sensing Perspective, 2nd
Ed. Upper
Saddle River, NJ, Prentice- Hall. ISBN-13: 978-
0134058160.
18. Basilevsky A. (1994). Statistical Factor Analysis and
Related Methods Theory and Application. Wiley, New
Jersey. ISBN: 978-0-471-57082-0.
19. Bryant F.B. and Yarnold P.R. (1995). Principal-
components analysis and confirmatory factor analysis. In
Grimm, L.G. and Yarnold, P.R. (Eds.), Reading and
Understanding Multivariate Statistics American
Psychological Association, Washington D.C, 99-136.
20. Gorsuch R.L. (1997). Exploratory factor analysis: Its role
in intern analysis. J. Pers. Assess., 68, 532-560.
21. Johnson R.A. and Wichern D.W. (1992). Applied
Multivariate Statistical Analysis, 6th
Ed. Prentice Hall,
Englewood Cliffs, New Jersey. ISNB:-978-81-203-4587-
4.
22. McDonald R.P. (1985). Factor Analysis and Related
Methods. Lawrence Erlbaum Associates, Hillsdale, New
Jersey.
23. Tabachnick B.G. and Fidell L.S. (2007). Using
Multivariate Statistics, 5th
Ed. Pearson Allyn and Bacon,
Upper Saddle River, New Jersey.
24. Congalton R.G., Oderwald R.G. and Mead R.A., (1983).
Assessing Landsat classification accuracy using discrete,
multivariate analysis statistical technique, Photogramm.
Eng. Remote Sens., 49, 1671-78.
25. Foody G.M. (2002). Status of land cover classification
accuracy assessment. Remote Sens Environ., 80, 185–201