Embed Size (px)
Citation preview

1
QUARTERLY STATUS REPORT
MARCH 31, 2018
Financing projects to preserve, protect and enhance
the environment of the U.S.-Mexico border

NADB QUARTERLY REPORT MARCH 31, 2018
TABLE OF CONTENTS
1. NADB and BECC merged ................................................................................................................. 1
2. Summary of Financial & Operational Activity ....................................................................... 2
3. Project & Financing Activity ......................................................................................................... 4
3.1. Loan Program ...................................................................................................................... 4
3.2. Grant Programs ................................................................................................................... 7
3.2.1. Community Assistance Program (CAP) ....................................................................... 7
3.2.2. Border Environment Infrastructure Fund (BEIF) ......................................................... 9
3.2.3. Water Conservation Investment Fund (WCIF) .......................................................... 12
4. Technical Assistance .................................................................................................................... 13
4.1. NADB Program ................................................................................................................... 13
4.2. Project Development Assistance Program (PDAP) ............................................................ 14
4.3. U.S.-Mexico Border 2020 Program .................................................................................... 14
4.4. Funding Partnerships ......................................................................................................... 17
5. Project Closeout & Results Measurement ............................................................................ 19
5.1. Project Closeout Reports ................................................................................................... 19
5.2. Impact Assessments .......................................................................................................... 19
ANNEX – Active Projects by State .................................................................................................... 21

NADB QUARTERLY REPORT MARCH 31, 2018
1
1. NADB and BECC merged
On November 10, 2017, the Second Protocol of Amendment to the Agreement between the Government of the United States and the Government of Mexico Concerning the Establishment of the Border Environment Cooperation Commission (BECC) and the North American Development Bank (NADB) entered into force, merging the two institutions into a single entity. Under the merger, the institutions’ shared mission of supporting the development of sustainable infrastructure projects that preserve, protect and enhance the environment in order to advance the well-being of residents along the U.S.-Mexico border remains unchanged. The functions of BECC have been fully integrated into NADB, thereby streamlining the project development process, making more efficient use of resources and maximizing service to border communities. The ten-member Board of Directors that governed both institutions also remains unchanged. However, to further ensure the continuity of the functions and programs previously administered by BECC, the position of Chief Environmental Officer (CEVO) was created within the integrated institution. In addition to verifying that all projects continue to comply with the criteria for certification, the CEVO will advise Management and the Board of Directors regarding the environmental integrity of the operations of the Bank. Technical assistance and grant management programs have also been maintained, and public participation, transparency and access to information continue to be central to all NADB operations. The current offices located in San Antonio, Texas, and Ciudad Juarez, Chihuahua, will continue to serve the border region. Following approval of a Board resolution recommending their merger in December 2014, NADB and BECC developed and began implementing a transition plan to integrate their internal processes and operations, align their information and accounting systems and harmonize their policies. These efforts resulted in the seamless administrative and organizational integration of the institutions during 2016. Consequently, upon entry into force of the protocol in November 2017, all BECC operations, personnel and resources had been successfully transferred and integrated into NADB. This report reflects the first full quarter of merged operations. A closeout audit of BECC was done, and the 2017-2018 financial figures contained herein reflect the merged balances. As illustrated in the following charts and report, project development and financing activities have continued uninterrupted during this process and are expected to proceed with even greater efficiency under the integrated institution.

NADB QUARTERLY REPORT MARCH 31, 2018
2
2. Summary of Financial & Operational Activity
NADB FINANCIAL SUMMARY 2014-20181, 2
(US$ Thousands)
1st Qtr.
2018 2017 2016 2015 2014
Balance Sheet Data
Cash and investments 941,654$ 954,962$ 511,558$ 504,861$ 442,954$
Loans outstanding3 1,279,843 1,293,807 1,411,296 1,324,777 1,185,514
Total assets 2,138,498 2,145,753 1,812,866 1,780,599 1,633,369
Borrowings outstanding, gross 1,493,443 1,493,443 1,187,505 1,190,550 1,059,953
Total liabilities 1,506,282 1,511,438 1,208,832 1,215,017 1,090,683
Total equity 632,215 634,315 604,034 565,582 542,686
Callable capital 2,351,667 2,351,667 2,351,667 2,295,000 2,295,000
Income Statement Data
Total interest income 17,449$ 68,622$ 59,012$ 51,246$ 43,710$
Loans 13,940 57,761 52,427 45,892 38,487
Investments 3,509 10,861 6,585 5,354 5,224
Interest expense 9,891 31,640 19,950 15,101 13,548
Net interest income 7,559 36,982 39,061 36,145 30,163
Total operating expenses 3,822 8,448 17,934 18,143 10,816
Provision for loan losses 185 (3,945) 5,134 8,559 2,199
Total non-interest income (expense) 1,832 3,156 (369) 2,388 (1,093)
Income before program activity 5,569 31,690 20,758 20,389 18,254
Net program expenses4 566 2,163 1,088 4,873 2,077
Net income 5,003 29,527 19,670 15,516 16,177
Ratios
Total equity / loans outstanding 49.4% 49.0% 42.8% 42.7% 45.8%
Gross debt / callable capital 63.5% 63.5% 50.5% 51.9% 46.2%
Gross debt / total equity 236.2% 235.4% 196.6% 210.5% 195.3%
Interest coverage5 1.4x 1.8x 2.3x 2.8x 2.6x
Liquid assets / total assets 43.9% 44.3% 25.3% 25.3% 23.8%
Income before program activity /
total equity 0.9% 5.0% 3.4% 3.6% 3.4%
Income before program activity /
average assets 0.3% 1.6% 1.2% 1.2% 1.1%
Credit Ratings
Moody’s Investor Service Aa1/P-1 Aa1/P-1 Aa1/P-1 Aa1/P-1 Aa1/P-1
Fitch Ratings AA/F1+ AA/F1+ AA/F1+ AA/F1+ AA/F1+
1 The figures exclude the U.S. domestic program.
2 Beginning as of November 10, 2017, figures reflect the finances of the merged institution.
3 Before allowance for loan losses, unamortized fees, and effect of foreign exchange adjustments and hedged items.
4 Program expenses include grant financing and technical assistance funded from the Bank's retained earnings.
5 Interest coverage ratio is defined as interest income minus operating expenses less provision for loan losses divided by interest expense.

NADB QUARTERLY REPORT MARCH 31, 2018
3
SUMMARY OF PROJECT AND FINANCING OPERATIONS 2014-2018
(US$ Thousands)
1st Qtr.
2018 2017 2016 2015 2014
Project Certification
Total projects certified1 2 9 15 14 16
By Sector
Water 1 4 7 7 10
Waste management - - 5 - -
Air quality2 - - 1 1 1
Basic urban infrastructure3 - - - 1 1
Clean and efficient energy 1 5 2 5 4
By Financing Type
Loans 2 5 3 8 7
NADB-funded grants - - 7 2 2
NADB-administered grants - 4 5 4 7
Lending Operations
Loans approved 111,610$ 273,186$ 96,876$ 239,177$ 323,670$
Loans committed - 229,536 146,767 178,262 304,323
Loans disbursed 42,988 101,426 136,253 249,556 254,163
Grant Operations
NADB-funded grants4
Approved -$ -$ 3,100$ 1,000$ 765$
Contracted - 1,500 1,600 1,450 315
Disbursed5 497 1,178 550 3,694 1,318
NADB-administered grants6
Approved - 6,236 25,022 20,274 24,936
Contracted 1,000 14,535 21,231 16,219 12,047
Disbursed 7,019 11,278 10,228 8,698 14,673
1Project certification and financing proposals are approved simultaneously by the Board of Directors.
3 These projects consist of works from various sectors, such as roadway improvements, water and sewer lines, storm drainage, and
public lighting.4 Grants funded from designated retained earnings of the Bank for certified infrastructure projects (excludes technical assistance).
6 Grants funded by the U.S Environmental Protection Agency (EPA) and administered by NADB through the Border Environment
Infrastructure Fund (BEIF).
2 This category includes street paving, other roadway improvements, industrial emissions reduction and public transportation.
5 Includes both grant disbursements and expenditures for project supervision.
NADB QUARTERLY REPORT MARCH 31, 2018
4
3. Project & Financing Activity
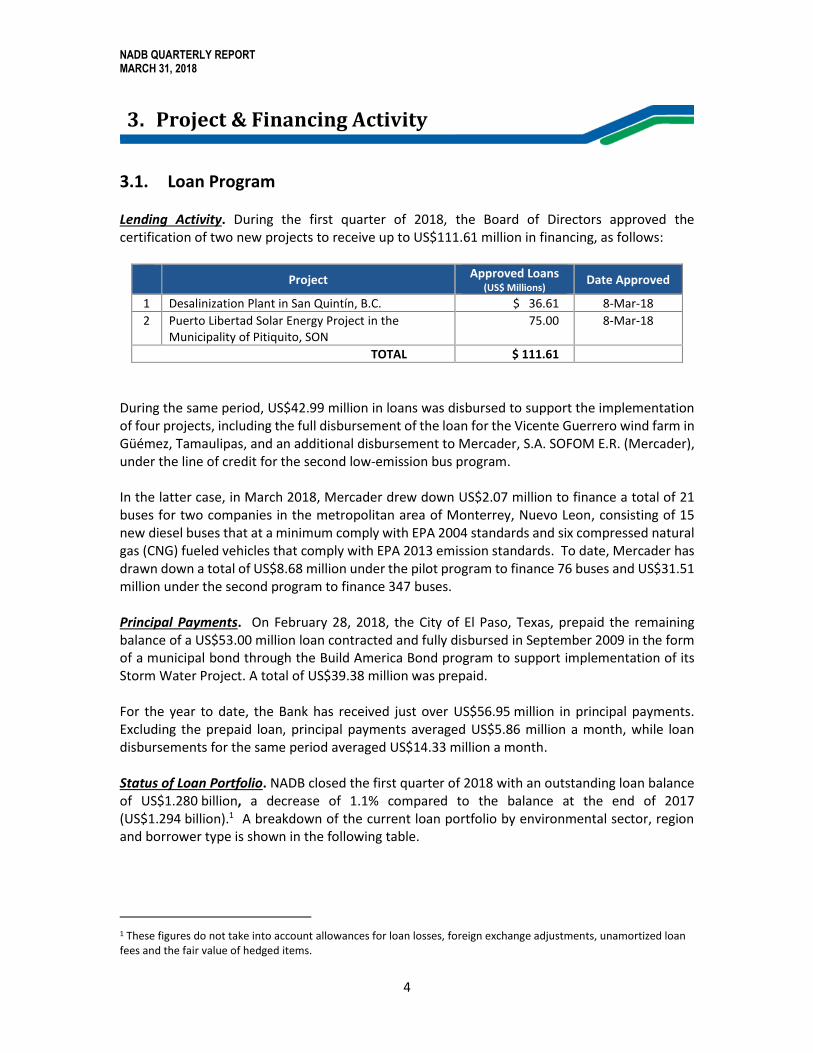
3.1. Loan Program Lending Activity. During the first quarter of 2018, the Board of Directors approved the certification of two new projects to receive up to US$111.61 million in financing, as follows:
Project Approved Loans (US$ Millions)
Date Approved
1 Desalinization Plant in San Quintín, B.C. $ 36.61 8-Mar-18
2 Puerto Libertad Solar Energy Project in the Municipality of Pitiquito, SON
75.00 8-Mar-18
TOTAL $ 111.61
During the same period, US$42.99 million in loans was disbursed to support the implementation of four projects, including the full disbursement of the loan for the Vicente Guerrero wind farm in Güémez, Tamaulipas, and an additional disbursement to Mercader, S.A. SOFOM E.R. (Mercader), under the line of credit for the second low-emission bus program. In the latter case, in March 2018, Mercader drew down US$2.07 million to finance a total of 21 buses for two companies in the metropolitan area of Monterrey, Nuevo Leon, consisting of 15 new diesel buses that at a minimum comply with EPA 2004 standards and six compressed natural gas (CNG) fueled vehicles that comply with EPA 2013 emission standards. To date, Mercader has drawn down a total of US$8.68 million under the pilot program to finance 76 buses and US$31.51 million under the second program to finance 347 buses. Principal Payments. On February 28, 2018, the City of El Paso, Texas, prepaid the remaining balance of a US$53.00 million loan contracted and fully disbursed in September 2009 in the form of a municipal bond through the Build America Bond program to support implementation of its Storm Water Project. A total of US$39.38 million was prepaid. For the year to date, the Bank has received just over US$56.95 million in principal payments. Excluding the prepaid loan, principal payments averaged US$5.86 million a month, while loan disbursements for the same period averaged US$14.33 million a month. Status of Loan Portfolio. NADB closed the first quarter of 2018 with an outstanding loan balance of US$1.280 billion, a decrease of 1.1% compared to the balance at the end of 2017 (US$1.294 billion).1 A breakdown of the current loan portfolio by environmental sector, region and borrower type is shown in the following table.
1 These figures do not take into account allowances for loan losses, foreign exchange adjustments, unamortized loan fees and the fair value of hedged items.

NADB QUARTERLY REPORT MARCH 31, 2018
5
Outstanding Loan Portfolio As of March 31, 2018
* These projects consist of components from various sectors, such as street paving, water and sewer lines, storm drainage and public lighting. ** Other clean energy currently includes two biogas projects.
Additionally, at the end of the quarter, the Bank had US$147.11 million in loan commitments pending disbursement for 11 projects, as well as up to US$247.75 million in approved loans pending commitment for nine projects. Consequently, loans outstanding plus loan commitments at the end of the quarter totaled almost US$1.67 billion.
No. % Amount (US$) %
Public / Private
Public 35 50.0% 209,195,549$ 16.3%
Private 30 42.9% 975,119,409 76.2%
Public-private 5 7.1% 95,528,471 7.5%
70 100.0% 1,279,843,429 100.0%
Country
U.S. 18 25.7% 429,725,213 33.6%
Mexico 52 74.3% 850,118,216 66.4%
70 100.0% 1,279,843,429 100.0%
Project Type
Air quality 8 11.4% 93,620,633 7.3%
Basic urban infrastructure* 3 4.3% 37,134,667 2.9%
Other clean energy** 2 2.9% 4,107,196 0.3%
Public transportation 2 2.9% 31,598,737 2.5%
Solar energy 15 21.4% 289,502,959 22.6%
Storm drainage 1 1.4% 13,024,938 1.0%
Water / wastewater 27 38.6% 158,513,593 12.4%
Wind energy 12 17.1% 652,340,705 51.0%
70 100.0% 1,279,843,429$ 100.0%
3/31/2018 12/31/2017
Outstanding balance, beginning of year 1,293.81$ 1,411.30$
Loan disbursements 42.99 101.42
Principal repayments (56.95) (218.91)
Outstanding balance, end of year 1,279.84 1,293.81
Loan commitments, pending disbursement 147.11 188.35
Loan approvals, pending commitment 247.75 136.14
Total loan approvals & commitments 394.86 324.49
Outstanding loans & loan commitments 1,674.70$ 1,618.30$
ANNUAL LENDING ACTIVITY (US$ Millions)
Oustanding balances, before allowance for loan losses, unamortized fees, and effect of
foreign exchange adjustments and hedged items.
NADB QUARTERLY REPORT MARCH 31, 2018
6
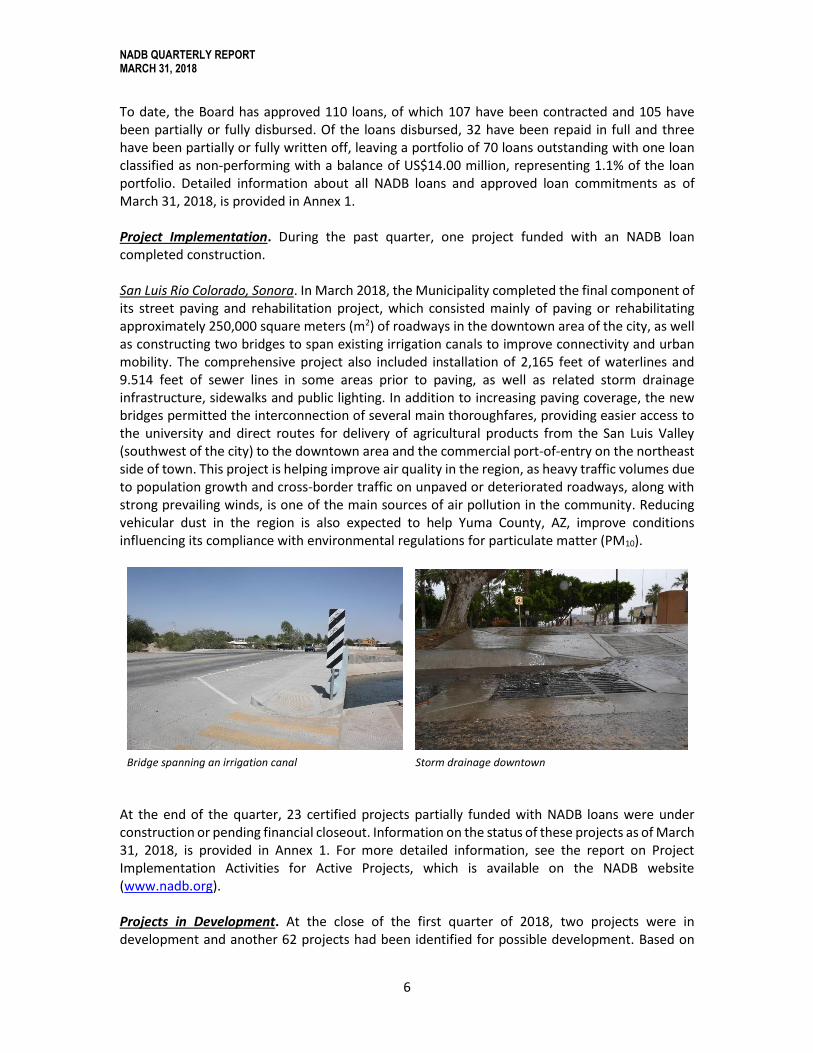
To date, the Board has approved 110 loans, of which 107 have been contracted and 105 have been partially or fully disbursed. Of the loans disbursed, 32 have been repaid in full and three have been partially or fully written off, leaving a portfolio of 70 loans outstanding with one loan classified as non-performing with a balance of US$14.00 million, representing 1.1% of the loan portfolio. Detailed information about all NADB loans and approved loan commitments as of March 31, 2018, is provided in Annex 1. Project Implementation. During the past quarter, one project funded with an NADB loan completed construction. San Luis Rio Colorado, Sonora. In March 2018, the Municipality completed the final component of its street paving and rehabilitation project, which consisted mainly of paving or rehabilitating approximately 250,000 square meters (m2) of roadways in the downtown area of the city, as well as constructing two bridges to span existing irrigation canals to improve connectivity and urban mobility. The comprehensive project also included installation of 2,165 feet of waterlines and 9.514 feet of sewer lines in some areas prior to paving, as well as related storm drainage infrastructure, sidewalks and public lighting. In addition to increasing paving coverage, the new bridges permitted the interconnection of several main thoroughfares, providing easier access to the university and direct routes for delivery of agricultural products from the San Luis Valley (southwest of the city) to the downtown area and the commercial port-of-entry on the northeast side of town. This project is helping improve air quality in the region, as heavy traffic volumes due to population growth and cross-border traffic on unpaved or deteriorated roadways, along with strong prevailing winds, is one of the main sources of air pollution in the community. Reducing vehicular dust in the region is also expected to help Yuma County, AZ, improve conditions influencing its compliance with environmental regulations for particulate matter (PM10).
Bridge spanning an irrigation canal Storm drainage downtown
At the end of the quarter, 23 certified projects partially funded with NADB loans were under construction or pending financial closeout. Information on the status of these projects as of March 31, 2018, is provided in Annex 1. For more detailed information, see the report on Project Implementation Activities for Active Projects, which is available on the NADB website (www.nadb.org). Projects in Development. At the close of the first quarter of 2018, two projects were in development and another 62 projects had been identified for possible development. Based on

NADB QUARTERLY REPORT MARCH 31, 2018
7
current information, the loan projects which could potentially be submitted for approval to the Board during the second quarter of 2018 are:
• Salitrillos Wind Energy Project (93 MW) in Reynosa, Tamaulipas, and
• Loan extension for the Border-wide Program for the Purchase of Low-Emission Vehicles in Mexico sponsored by Mercader Financial, S.A., SOFOM, E.R. (certified in 2016).
3.2. Grant Programs
3.2.1. Community Assistance Program (CAP) Through this program, NADB provides grant financing from its retained earnings for critical environmental infrastructure projects in low income-communities. Grants are available for projects in all sectors eligible for NADB financing, with priority given to drinking water, wastewater, water conservation and solid waste infrastructure. During the first quarter of 2018, no new projects were certified to receive a CAP grant. However, a total US$465,054 in CAP grants was disbursed for the implementation of four projects, including the initial grant disbursement for the water system improvement project in Tombstone, Arizona. Annual financing activity and the overall status of the CAP program as of March 31, 2018, is summarized in the table below.
2018 2017
Cumulative
since 2011
Retained earnings allocated (1) -$ 2.62$ 14.09$
Funds allocated for supervision - 0.22 0.73
Grants approved (2)- - 6.61
Grants contracted (2) - 1.50 6.61
Grants disbursed (3) 0.47 0.98 3.70
Grant cancellations (4) - (0.17) (0.43)
Contracted grants, not yet disbursed 2.91$
Additional approved grants, not yet contracted -
Funding available for future projects (5) 6.75
(2) Annual and cumulativ e figures, less unused funds deobligated from completed projects.
(3) Ex cludes disbursements for superv ision.
(4) Unused funds deobligated from completed projects and returned to the CAP program for future projects.
(5) Allocated retained earnings less approv ed grants and funds allocated for superv ision.
Community Assistance Program
Annual Financing Activity and Program Status (US$ Millions)
(1) Funding allocations in 2017 include the approv al of US$2.0 million in additional retained earnings and US$619,425 in
deobligated funds rolled ov er from Water Conserv ation Inv estment Fund (WCIF).

NADB QUARTERLY REPORT MARCH 31, 2018
8
Project Implementation. During the first quarter of 2018, two projects funded with a CAP grant were fully or substantially completed. Sabinas, Coahuila. In January, work was completed on the replacement of 13,366 feet of 8-inch sewer lines and 484 sewer connections in downtown Sabinas, directly benefitting an estimated 1,694 residents. This project is part of an ongoing multiannual investment program initiated in 2008 to rehabilitate the wastewater collection system. Built in 1954, sections of the sewer system were experiencing frequent collapses and major blockages that negatively impacted hydraulic capacity and reduced flow rates, increasing the potential for silting and septic conditions in the system, as well as sewage spills in the street. The new sewer lines are safely collecting and conveying an estimated 111,840 gallons a day of wastewater to the new treatment plant, which was completed with state funding in 2018. Nuevo Casas Grandes, Chihuahua. In February 2018, equipment to operate the new sanitary landfill was delivered to the Department of Public Services, which provides waste collection and disposal services to more than 59,300 residents in the municipality. The new equipment includes a dump truck, bulldozer, backhoe loader, water tank truck and 4-ton truck. With this equipment the landfill operator will be able to properly disperse, cover and compact up to 55 metric tons of solid waste a day in compliance with the applicable regulations, reducing the health risks associated with exposure to decaying garbage and preventing the creation of breeding grounds for disease-carrying vectors, such as flies and mosquitos. Training in the proper operation and maintenance of the equipment has also been provided. As an additional guaranty, the equipment purchase includes a service agreement that will be funded by the CAP grant over the next two years.

NADB QUARTERLY REPORT MARCH 31, 2018
9
Of the 16 projects funded with CAP grants, nine have been completed, six are in various stages of implementation and one was preparing to begin bidding at the end of the quarter. Information on the status of projects currently in the process of being implemented or pending financial closeout as of March 31, 2018, is provided in Annex 1. For more detailed information, see the report on Project Implementation Activities for Active Projects, which is available on the NADB website (www.nadb.org). Projects in Development. NADB continued to work with eight communities to complete development activities related to their water and/or wastewater infrastructure projects. Two projects have completed the development activities required to be ready for certification and are expected to be submitted to the Board for approval in the second quarter of 2018:
• New Water System for the Community of Jose Silva Sanchez in Soto La Marina, Tamaulipas; and
• Water System Improvements in Whetstone, Arizona.
3.2.2. Border Environment Infrastructure Fund (BEIF) Through this program, NADB administers grant resources provided by the Environmental Protection Agency (EPA) for the implementation of priority water and wastewater infrastructure projects. During the first quarter of 2018, no new projects were certified to receive a BEIF grant. However, on January 15, 2018, the grant agreement for the wastewater treatment plant in Sunland Park, New Mexico, was amended to include an additional US$1.00 million in BEIF funding, bringing the total grant for this project to US$9.00 million. Moreover, during the quarter, the Bank disbursed US$7.02 million in BEIF grants for the implementation of 12 projects, including the initial disbursement for the fifth wastewater project in Nogales, Sonora. Annual financing activity and the status of the BEIF program as of March 31, 2018, is summarized in the following table.
NADB QUARTERLY REPORT MARCH 31, 2018
10
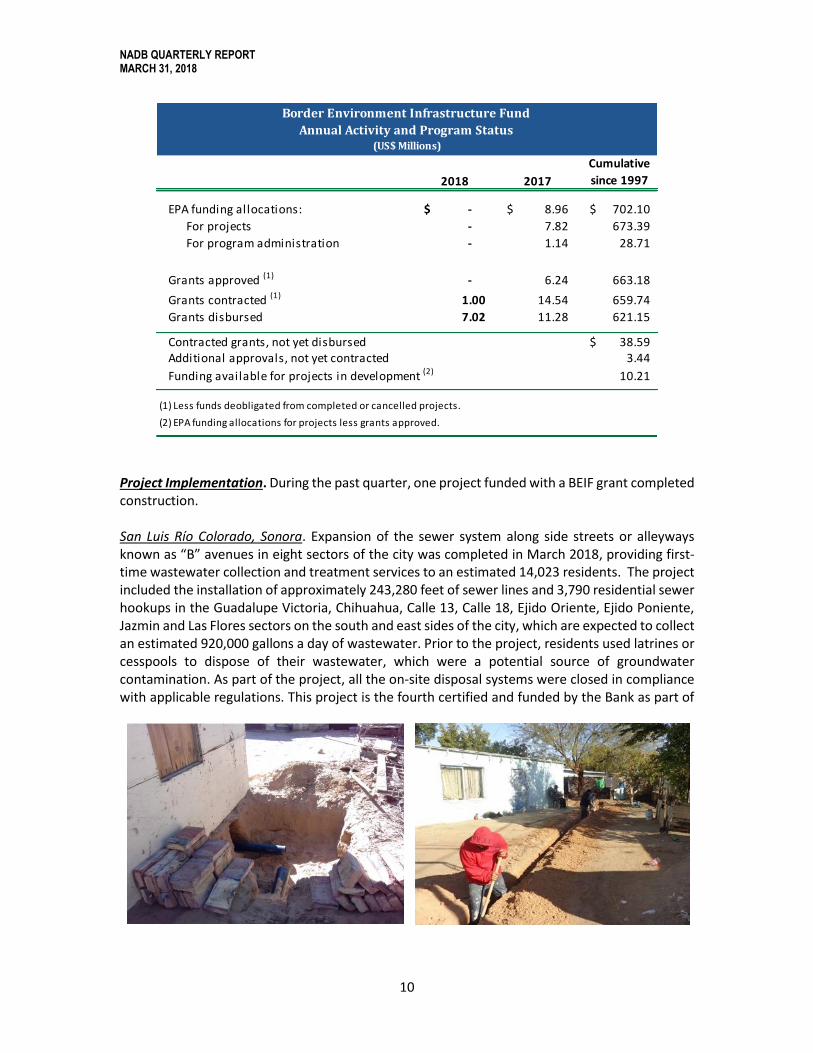
Project Implementation. During the past quarter, one project funded with a BEIF grant completed construction. San Luis Río Colorado, Sonora. Expansion of the sewer system along side streets or alleyways known as “B” avenues in eight sectors of the city was completed in March 2018, providing first-time wastewater collection and treatment services to an estimated 14,023 residents. The project included the installation of approximately 243,280 feet of sewer lines and 3,790 residential sewer hookups in the Guadalupe Victoria, Chihuahua, Calle 13, Calle 18, Ejido Oriente, Ejido Poniente, Jazmin and Las Flores sectors on the south and east sides of the city, which are expected to collect an estimated 920,000 gallons a day of wastewater. Prior to the project, residents used latrines or cesspools to dispose of their wastewater, which were a potential source of groundwater contamination. As part of the project, all the on-site disposal systems were closed in compliance with applicable regulations. This project is the fourth certified and funded by the Bank as part of
2018 2017
Cumulative
since 1997
EPA funding allocations: -$ 8.96$ 702.10$
For projects - 7.82 673.39
For program administration - 1.14 28.71
Grants approved (1) - 6.24 663.18
Grants contracted (1) 1.00 14.54 659.74
Grants disbursed 7.02 11.28 621.15
Contracted grants, not yet disbursed 38.59$ Additional approvals, not yet contracted 3.44
Funding available for projects in development (2) 10.21
Border Environment Infrastructure Fund
Annual Activity and Program Status (US$ Millions)
(2) EPA funding allocations for projects less grants approved.
(1) Less funds deobligated from completed or cancelled projects.

NADB QUARTERLY REPORT MARCH 31, 2018
11
a comprehensive wastewater infrastructure improvement plan initiated by the local water utility in 2000. With this project, wastewater collection coverage has increased from 80% in 2014 to 84% of the population. Of the 119 projects funded with BEIF grants, 104 have been completed and/or closed out, 12 are in various stages of implementation, and three are in bidding or preparing to begin bidding.2 Information on the status of certified projects that are currently in the process of being implemented or pending financial closeout as of March 31, 2018, is provided in Annex 1. For more detailed information, see the report on Project Implementation Activities for Active Projects, which is available on the NADB website (www.nadb.org). Projects in Development. At the end of the first quarter of 2018, there were 11 previously prioritized projects in development: eight in EPA Region 6 and three in EPA Region 9. Based on current information, a wastewater collection and treatment project in Camargo, Tamaulipas, could potentially be submitted for certification by the Board of Directors during the second quarter of 2018. Project Application and Prioritization Process. During the latter half of 2017, EPA Region 6 and Region 9 initiated a new project application and prioritization cycle for drinking water and wastewater infrastructure projects located within 100 km of U.S.-Mexico. Based on an initial evaluation process, 56 applications were deemed eligible for funding consideration. Of those, 25 are for projects in Region 9 and 31 for project in Region 6. The total investment represented by these applications is nearly US$275 million. A breakdown of the number of applications and associated construction costs by state and region are shown in the tables below.
BEIF Applications Eligible for Prioritization (US$ Million)
EPA Region 9 EPA Region 6
State No. Estimated Cost (US$)
State No. Estimated Cost (US$)
Arizona 9 $ 16.62
New Mexico 2 $ 5.40
California 3 62.75
Texas 7 35.50
Sonora 3 12.25
Tamaulipas 16 41.40
Baja California 10 58.05
Chihuahua 6 40.50
Total 25 $ 149.67
Total 31 $ 122.80
NADB is working closely with EPA to further evaluate the application ranking results and anticipates project selection to be finalized in the second quarter of 2018.
2 There are 113 certified projects with BEIF funding contracted; however, one of those projects (the Texas Plan) consists of seven individual projects with seven individual grants, for a total of 119 water and wastewater projects.

NADB QUARTERLY REPORT MARCH 31, 2018
12
3.2.3. Water Conservation Investment Fund (WCIF) At the beginning of the year, one project funded through the WCIF was still in the implementation phase. The grant agreement for the project totals US$989,832, of which 90% (or US$894,238) has been disbursed, leaving approximately US$95,594 in grant funds pending disbursement or financial closeout at the end of the quarter.

NADB QUARTERLY REPORT MARCH 31, 2018
13
4. Technical Assistance
4.1. NADB Program To support project sponsors and border communities in the development of sustainable projects for certification and financing, NADB offers various types of technical assistance in three categories: project development, institutional capacity-building and sector studies to identify needs and generate knowledge about a new sector or technology. During the first quarter of 2018, no new grants were approved through the technical assistance program; however, one previously approved study was completed. Energy Efficiency Learning Network in Coahuila. The second and final phase of this capacity-building initiative for water utilities in the state of Coahuila was completed in February 2018, in partnership with the German agency for international cooperation and development in Mexico (GIZ) and the Coahuila State Water and Wastewater Commission. Under the umbrella of this project initiated in 2015, 14 municipal water utilities participated in diverse training and project development activities supported by technical assistance, including energy and water audits, utility and energy management workshops and development of improvement plans. Altogether, the utilities identified potential cost savings of up to $11.2 million pesos (US$581,826) annually as a result of these activities. With the preliminary investments and operational improvements implemented to date, participants have already saved a combined $2.7 million pesos (US$140,255). In addition, 38 utility operators took training courses related to various standardized energy efficiency and operation and management (O&M) practices, and 27 have obtained certification from the Mexican Ministry of Education (SEP). Through this network, the participating utilities now have the tools to carry out the rest of the energy efficiency measures identified.
Energy efficiency workshop in Monclova Efficiency in operating pumping equipment
At the end of the quarter, there were seven studies in process with a total grant commitment of US$610,500.

NADB QUARTERLY REPORT MARCH 31, 2018
14
4.2. Project Development Assistance Program (PDAP)
Under the merger, NADB continues to administer this EPA-funded program to assist communities in the development of water and wastewater projects that have been prioritized by EPA to receive BEIF grants. During the first quarter of 2018, US$22,253 in PDAP grants were awarded to support the development of two wastewater projects.
Community /
Sponsor Project
Type Description Amount
(US$)
1 Anthony, NM WW Additional activities related to the final design of a wastewater lift station
$ 10,831
2 Nueva Ciudad Guerrero, TAM
WW Additional activities related to the environmental assessment document for a comprehensive wastewater collection and treatment project
11,422
TOTAL: $ 22,253
WW = Wastewater No studies were competed during the quarter. As of March 31, 2108, there were 14 PDAP-funded studies in process with a total grant commitment of just under US$2.18 million.
4.3. U.S.-Mexico Border 2020 Program This binational program, developed by EPA and its Mexican counterpart, Secretaría de Medio Ambiente y Recursos Naturales (SEMARNAT) to improve the environment and protect the health of the millions of residents within 100 kilometers of both sides of the U.S.-Mexico border, focuses on initiatives for clean air, safe drinking water, reduced risk of exposure to hazardous waste and emergency preparedness. Under the merger, NADB continues to perform the logistical and administrative services previously provided by BECC with respect to identifying, contracting and managing projects and workshops funded under the program. Following a request for proposals in mid-2017, EPA Regions 6 and 9 authorized approximately US$1.42 million in grant funding for 26 projects to be implemented beginning in 2018: 14 projects in Region 6 for a total cost of US$612,572 and 12 projects in Region 9 for a total of US$805,000. During the first quarter of 2018, two activities funded through Border 2020 were completed. Healthy and Resilient Housing in Western Ciudad Juárez, CHIH. The project consisted of identifying and implementing energy efficiency and water conservation improvements in housing in low-income communities in the western area of Ciudad Juárez, benefiting 200 residents. In collaboration with the non-profit community development organization, Federación Mexicana de Asociaciones Privadas de Salud y Desarrollo Comunitario A.C. (FEMAP), and local efficiency experts, a catalogue of 32 water and energy efficiency measures was developed specifically for the region, along with a methodology for their implementation. Ten FEMAP advisors received training in promoting the catalogue in order to explain the environmental and economic benefits of the improvements to low-income homeowners and facilitate their access to micro-financing

NADB QUARTERLY REPORT MARCH 31, 2018
15
and technical assistance in designing and planning improvements. Fifty homeowners participated in the program with customized, multi-phased improvement plans, ranging from the installation of LED light bulbs, low-flow shower heads and dual-valve toilets to the insulation of roofs and/or walls and the sealing or replacement of windows. Just four to six months after installation, homeowners are reporting combined water savings of 139,656 gallons per month and monthly energy savings per household of $108 to $200 pesos (US$5.60 – US$10.38) depending on the type of improvements made. FEMAP will measure the long-term impact of the program as it continues working with these families to achieve their dream homes. Based on its success, FEMAP plans to expand the program.
Original window
Proposed efficiency improvements explained to a homeowner New dual-pane window
Waste Characterization Assessment, Zero Waste Plan and Transfer Station Implementation Plan in Campo, CA. The main purpose of this project was to provide a solution to the problem of illegal, open-air dumping in the Tijuana River watershed, as well as develop a modern and self-sustaining waste management system for the Campo Band of Diegueno Mission Indians in Campo, California. The waste assessment determined that the residents and local casino generate approximately 440 tons a year of waste and identified waste streams that could be diverted to the transfer station and recycling facilities. By implementing all the programs and policies outlined in the Zero Waste Plan, it is estimated that up to 70% of the waste generated could be diverted away from landfills. Construction of the transfer station would also support these effort by providing residents and businesses with easier access to recycling facilities. The proposed transfer station would

NADB QUARTERLY REPORT MARCH 31, 2018
16
handle up to 1.7 tons a day of waste. Three conceptual designs of the transfer station—including an open-air, a partially covered, and a fully enclosed facility—were developed with cost estimates ranging between US$655,000 and US$2.97 million. The next step will be to select one of the above options and develop the final design of the transfer station, which will benefit approximately 351 residents. At the end of the quarter, there were 16 Border 2020 initiatives in process with a total grant commitment of US$923,467.
SUMMARY OF TECHNICAL ASSISTANCE ACTIVITY 2014-2018
(US$ Thousands)
1st Qtr.
2018 2017 2016 2015 2014
NADB Program1
Funding
Approved -$ 1,167$ 972$ 1,931$ 1,154$
Disbursed 69 1,275 1,342 2,277 759
Activities
Approved2 0 14 18 35 11
Studies completed 1 16 14 1 2
Seminars/workshops held 0 7 14 13 7
Project Development Assistance Program3
Funding
Approved 22$ 1,030$ 788$ 1,016$ 1,690$
Disbursed 29 867 761 1,311 2,223
Activities4
Approved 2 11 10 8 19
Completed 0 10 8 10 12
U.S.-Mexico Border 2020 Program3
Funding
Approved 723$ 335$ 761$ 759$ 1,381$
Disbursed 28 378 1,034 747 722
Activities5
Approved 15 6 20 15 28
Completed 2 14 18 24 18
1Prior to the merger, this program was funded jointly by NADB and the Border Environment Cooperation Commission (2014-2017).
2 Includes project development studies and related activites, seminars and capacity-building initiatives, and other sector studies to
identify needs and generate knowledge about a new sector or technology.
3 Program funded with grants from the U.S. Enviornmental Protection Agency (EPA). Figures reflect activity under BECC
administration prior to merger and under NADB administration following merger on November 10, 2017. Disbursements exclude
administrative expenses. 4 Includes project development studies and related activities, such as final design.
5 Includes studies and workshops on topics related to clean air, safe drinking water, reduced risk of exposure to hazardous waste and
emergency preparedness.

NADB QUARTERLY REPORT MARCH 31, 2018
17
4.4. Funding Partnerships In carrying out its mission, NADB pursues partnerships with other public and private organizations in an effort to promote environmental initiatives and projects on the border and identify additional support for their development and implementation. Inter-American Development Bank (IDB) Emerging Sustainable Cities Initiative
The IDB Emerging and Sustainable Cities (ESC) initiative directly supports governments in the development and implementation of urban sustainability plans and uses a comprehensive, multidisciplinary approach to identify, organize and prioritize urban actions to tackle the main roadblocks preventing the sustainable growth of emerging cities in Latin America. In 2016, NADB teamed up with IDB to introduce the program to Mexican border communities and selected Hermosillo as the first candidate. The border research institute, Colegio de la Frontera Norte (COLEF), oversaw this project and worked with the consultant firm, IDOM Ingeniería, S.A. de C.V., which was contracted to perform the baseline studies. The two-stage, five-phase ESC methodology was launched in August 2016, with the support of 97 government, academic and community stakeholders, who met to provide information on the main opportunities and challenges facing the community in a wide array of sectors, as well as the plans, programs and projects proposed to address them. Based on the results, 127 indicators were identified, quantified and ranked—ranging from water services, waste management and vulnerabilities to natural disasters to social services, economic development and municipal finances, among many others. In addition, a general survey to determine the infrastructure priorities of the community was conducted. The final report has been completed, and the results will be presented jointly by NADB and IDB to the Municipality of Hermosillo in May 2018. In conjunction with this effort, the Harvard University Graduate School of Design (GSD) launched a study entitled “Rethinking Hermosillo – Future Vision of the City,” which consists of an urban analysis of the city to identify individual projects that can be developed and executed in the short and medium term. The results will serve to complement Hermosillo’s action plan in the areas of urban development, housing and land use, as well as create a vision for the future and redirect the transformation of the city towards sustainable development environmentally, economically and socially. The study has been completed, and NADB has been working with Hermosillo to define the action plan for 2018. The study was also turned into a course entitled, “Emerging Urbanism: Designing Visions for the City of Hermosillo, Mexico,” which was taught during the 2017 fall semester at Harvard. IDB Multilateral Investment Fund (MIF)
In December 2014, BECC signed an agreement with IDB to develop a sustainable e-waste management and recycling system in Mexicali, Baja California. The Massachusetts Institute of Technology (MIT), SEMARNAT, EPA, NADB, the Baja California Ministry of Environmental Protection and the Universidad Autónoma de Baja California (UABC) are also collaborating with this initiative, which is intended to promote the safe and efficient recycling of used electronic devices by training around 100 micro-businesses in the e-waste management industry to serve as collection points for workers in the field. The three-year project consists of four components: 1) environmental awareness and public education campaign; 2) training and certifying informal e-
NADB QUARTERLY REPORT MARCH 31, 2018
18
waste pickers and recyclers; 3) creation of a new e-waste system; and 4) knowledge management and dissemination. During the first quarter of 2018 the project entered its final stage, which includes hiring a consultant to develop the final recommendations for its completion. In addition, NADB and EPA, through the 2020 Border Program, are organizing the first binational e-waste recycling forum to be held in Mexicali in October 2018. The methodology and results of this project will be presented at the event in an effort to encourage its replication in other border cities.

NADB QUARTERLY REPORT MARCH 31, 2018
19
5. Project Closeout & Results Measurement
5.1. Project Closeout Reports The final stage of project implementation is the closeout process, which serves to assess and document the achievement of the fundamental objectives of a project with respect to the investments made and the infrastructure built or equipment and services provided. In addition, the closeout report provides important feedback on lessons learned and best practices to be applied to future projects. During the past quarter, no new closeout reports were completed for projects funded by NADB. Reports for six projects funded with loans and four projects funded with CAP grants were in process at the end of the quarter. In the case of BEIF-funded projects, two closeout reports were completed and delivered to EPA Region 9 regarding the following projects: Wastewater Gravity Main (Outfall) Replacement, and Wastewater Collection System Expansion, both in Holtville, California. Reports for seven projects in Region 6 and four projects in Region 9 were in process at the end of the quarter. To date, 28 closeout reports for NADB-funded projects have been completed and delivered to the Board, and 51 closeout reports for BEIF-funded projects have been finalized and delivered to EPA. A fact sheet for each project that has completed the closeout process is available on the NADB website.
5.2. Impact Assessments An impact assessment is performed on select projects to evaluate their long-term environmental and human health impacts, as well as to identify opportunities for improving the project development process. To date, three impact assessments have been completed covering several water-related projects in ten border communities, and the corresponding reports have been published on the NADB website. For its next impact assessment, NADB is developing a study of the wastewater projects implemented in the sister cities of Nogales, Arizona and Nogales, Sonora, which is aimed at documenting project results in a binational context. Having finalized the scope of work and terms of reference for the Nogales impact assessment in the last quarter of 2017, a public procurement process was initiated in January 2018, and the Nogales Campus of the Mexican research institute, Colegio de la Frontera Norte (COLEF), was
Completed Impact Assessments
1. Juarez Valley, Chihuahua 4 wastewater projects constructed between 2009 and 2010 in the communities of Dr. Porfirio Parra, Guadalupe, Praxedis G. Guerrero and El Porvenir.
2. Baja California 21 wastewater projects constructed between 2001 and 2013 in the communities of Mexicali, Playas de Rosarito, Tecate and Tijuana.
3. El Paso County, Texas A water and wastewater collection project completed in 2003 in the communities of Socorro and San Elizario.

NADB QUARTERLY REPORT MARCH 31, 2018
20
selected as the principal consultant to carry out the study. COLEF will be supported in this endeavor by a binational work team, including partners from the University of Arizona in Tucson, the local utilities and authorities of both communities and NADB staff. The study is expected to take six months to complete, and the meeting to kick it off is scheduled for May 2018. In addition to examining the achievement of project objectives in terms of wastewater collection and treatment, the study will also look at impacts to the economy, employment, urban development and community health, to the extent possible. Moreover, unlike previous assessments that only considered the impact on the community directly benefitted, this study will evaluate how infrastructure improvements in one city have impacted the adjacent city on the other side of the border.

21
ANNEX
ACTIVE PROJECTS BY STATE March 31, 2018


ANNEX 1 NADB QUARTERLY REPORT
MARCH 31, 2018
Certification Total
Date Cost Approved Contracted Disbursed Develop. Construct. Complete
UNITED STATES
ARIZONA1 1 Douglas (Bay Acres) WW 17,378 17-Nov-16 16.33 7.48 7.48 1
2 2 Nogales W 1,178 14-May-15 0.65 0.50 0.50 0.49 1
3 3 Tombstone W 1,380 16-Jun-16 0.74 0.50 0.50 0.04 1
4 4 Willcox WW 3,757 14-May-15 14.86 4.70 4.62 3.74 1
TOTAL ARIZONA 23,693 32.58 13.17 13.09 4.27 1 2 1
CALIFORNIA 5 1 Holtville (WWTP) WW 6,594 24-Feb-14 14.35 6.89 6.89 6.65 1
6 2 SEPV Solar (Dixieland) SE 6,436 15-Nov-16 Reserved 11.00 11.00 3.31 1
TOTAL CALIFORNIA 13,030 14.35 17.89 17.89 9.95 0 0 2
NEW MEXICO7 1 Anthony WW 8,700 6-May-16 2.81 2.81 2.81 1
8 2 Mesilla W 1,450 23-Nov-15 0.76 0.70 0.70 0.42 1
9 3 Sunland Park/Santa Teresa (WWTP) WW 6,438 23-Apr-15 12.70 9.00 9.00 2.69 1
TOTAL NEW MEXICO 16,588 16.27 12.51 12.51 3.11 1 1 1
TEXAS10 1 Brownsville WW 2,630 24-Nov-15 29.74 3.63 3.63 1.23 1
11 2 Cameron Irrigation District No. 6 WC 16-Dec-08 1.98 0.99 0.99 0.89 1
12 3 Clint WW 1,099 10-Dec-09 11.56 2.30 2.30 1.72 1
13 4 El Paso County (Cuadrilla) WW 85 3-Mar-17 1.80 1.80 1.80 1
14 5 El Paso County (Vista del Este) W 1,068 17-Nov-16 1.56 0.50 0.50 1
15 6 North Alamo WSC (Hidalgo County) WW 1,616 16-Jun-16 11.78 1.90 1.90 1.24 1
16 7 Socorro (Cotton Valley) WW 288 3-Dec-14 1.29 1.29 1.29 0.74 1
17 8 Tornillo (2) W/WW 3,500 28-Aug-14 3.75 3.75 3.75 3.47 1
TOTAL TEXAS 10,286 63.47 16.16 16.16 9.30 2 4 2
U.S. BORDER REGION18 1 CleanFund PACE Program EE/WC 13-Sep-16 63.00 50.00 25.00 1
TOTAL US Border 63.00 50.00 25.00 0.00 1 0 0
18 TOTAL U.S. 63,597 206.67 109.73 84.65 26.63 5 7 6
NORTH AMERICAN DEVELOPMENT BANK
ACTIVE PROJECTS BY STATE March 31, 2018
ProjectPopulation to
Benefit1
Total NADB Funding Construction Phase2
1

ANNEX 1
ACTIVE PROJECTS BY STATE
NADB QUARTERLY REPORT
MARCH 31, 2018
Certification Total
Date Cost Approved Contracted Disbursed Develop. Construct. CompleteProject
Population to
Benefit1
Total NADB Funding Construction Phase2
MEXICO
BAJA CALIFORNIA1 1 Ensenada W 96,000 6-Dec-12 55.81 31.60 31.60 31.60 1
2 2 Mexicali (Col. Loma Linda/Esperanza) WW 2,230 3-Dec-14 1.36 0.59 0.59 0.36 1
3 3 Playas de Rosarito BUI 90,688 14-May-15 14.56 13.65 13.65 13.65 1
4 4 Tecate (Col. Piedra Angular) WW 644 3-Dec-14 0.45 0.45 0.45 0.23 1
5 5 Tijuana y Rosarito W/WW 1,373,931 21-Jul-09 29.75 16.09 16.09 13.89 1
6 6 Tec.-La Gloria WWTP WW 187,036 1-Feb-11 8.23 4.13 4.13 1
7 7 Tijuana WW 2014 WW 524,908 3-Dec-14 7.05 4.04 4.04 2.35 1
TOTAL B.C. 1,562,849 101.928 66.428 66.428 62.075 0 6 1
CHIHUAHUA8 1 Ahumada SW 11,457 16-Jun-16 0.29 0.30 0.30 1
9 2 Cd. Juarez (South-South) WW 180,000 10-Dec-09 42.30 17.37 17.37 16.17 1
10 3 Colonia Esperanza WW 1,267 28-Sep-07 2.18 0.43 0.43 0.43 1
11-13 6 - 8 El Millón, Jesús Carranza & Tres Jacales WW 1,723 4-May-10 3.65 1.05 1.05 0.93 3
14 7 Los Santos Solar (Ahumada) SE 21,016 1-Apr-15 Reserved 18.50 18.50 17.39 1
15 8 Madera SW 17,050 16-Jun-16 0.29 0.30 0.30 1
16 9 Nuevo Casas Grandes SW 59,337 16-Jun-16 0.50 0.50 0.50 0.44 1
17 10 Praxedis W 3,641 8-Dec-11 1.83 0.55 0.55 0.24 1
18 11 San Agustin W/WW 1,569 8-Nov-12 2.64 0.79 0.79 0.67 1
19 12 Santa Maria Solar (Galeana) SE 195,340 22-Jun-17 Reserved 55.50 30.00 4.08 1
TOTAL CHIH. 480,943 258.79 95.29 69.79 40.34 0 5 7
COAHUILA20 1 AHMSA (Monclova) AQ 216,206 13-Aug-15 Reserved 23.20 18.00 1
21 2 Región Centro SW 345,797 16-Jun-16 0.55 0.50 0.50 1
22 3 Reg. 5 Manantiales SW 77,800 16-Jun-16 0.55 0.50 0.50 0.15 1
23 4 Sabinas WW 1,694 6-Nov-15 0.62 0.50 0.50 0.28 1
TOTAL COAH. 641,497 1.72 24.70 19.50 0.43 1 3 0
NUEVO LEÓN24 1 El Mezquite Wind (Mina) WE 432,965 27-Jun-17 Reserved 105.00 74.10 35.13 1
25 2 Monterrey WW 3,592,474 21-Jun-06 66.34 27.31 27.31 27.31 1
TOTAL N.L. 4,025,439 66.34 132.31 101.41 62.43 0 2 0
2

ANNEX 1
ACTIVE PROJECTS BY STATE
NADB QUARTERLY REPORT
MARCH 31, 2018
Certification Total
Date Cost Approved Contracted Disbursed Develop. Construct. CompleteProject
Population to
Benefit1
Total NADB Funding Construction Phase2
SONORA26 1 Hermosillo WW 784,342 1-Apr-11 86.15 47.82 31.57 31.57 1
27 2 Hermosillo BUI 784,342 9-May-13 66.29 19.10 19.10 16.10 1
28 3 Nogales (SW colonias) W/WW 16,701 17-Nov-16 10.48 5.26 5.26 0.20 1
29 7 Orejana Solar (Hermosillo) SE 175,417 7-Jul-17 Reserved 50.00 26.75 3.69 1
30 4 San Luis Rio C. SW 161,795 16-Oct-01 4.01 1.59 1.59 1.59 1
31 5 San Luis Rio C. (2) AQ 178,380 17-Sep-13 14.67 8.60 8.60 8.60 1
32 6 San Luis Rio C. (4) WW 14,023 8-May-14 6.91 3.46 3.46 3.07 1
33 8 Sonoyta WW 12,439 16-Dec-08 4.10 2.30 2.30 2.00 1
TOTAL SON. 1,167,279 192.61 138.11 98.62 66.82 0 7 1
TAMAULIPAS 34 1 Frontera Ribereña SW 67,035 16-Dec-08 3.43 1.55 1.55 1.55 1
35 2 La Mesa Wind (Güémez) WE 91,127 5-Feb-15 Reserved 40.00 40.00 40.00 1
36 3 Matamoros (2) W / WW 160,879 17-Jul-12 69.73 28.79 28.79 28.31 1
37 4 Miguel Alemán (2) WW 19,230 17-Jul-12 6.25 1.98 1.98 1.38 1
38 5 Nuevo Laredo (2) WW 86,869 17-Jul-12 5.01 2.90 2.90 2.50 1
39 6 Reynosa (2) WW 266,853 6-May-16 15.66 7.08 7.08 2.64 1
40 7 Tres Mesas Wind (Llera de Canales) WE 255,424 25-Jun-14 Reserved 55.00 55.00 55.00 1
41 8 Vicente Guerrero Wind (Güémez) WE 224,287 8-Feb-17 Reserved 30.00 30.00 30.00 1
TOTAL TAMP. 1,152,474 788.87 167.30 167.30 161.37 0 6 2
MEXICAN BORDER REGION42 1 Mercader Pilot Program PT 24-Jun-14 11.40 9.34 9.34 8.68 1
43 2 Mercader Bus Program PT 13-Sep-16 40.46 31.95 31.95 31.51 1
TOTAL MX Border 51.86 41.29 41.29 40.18 0 2 0
43 TOTAL MEX. 9,030,481 1,953.52 665.43 564.33 433.66 1 31 11
61 TOTAL NADB 9,094,078 2,160.19 775.16 648.98 460.29 6 38 17
1 Populations benefiting from more than one project are only counted once.
2 Projects in development are either under final design, in preparation for bidding or in bidding. Projects that have completed construction may still be considered active because financing is still in process (pending disbursement or deobligation).
AQ = Air quality; BUI = Basic urban infrastructure; EE = Energy efficiency; ENE-B = Energy from biogas; PT = Public transportation; SD = Storm drainage; SE = Solar energy; SW = Solid waste; W = Water; WC = Water conservation; WE = Wind energy;
WW = Wastewater; WWTP = Wastewater treatment plant
3