Embed Size (px)
Citation preview
QUARTERLY STATISTICAL &
ECONOMIC REPORT,
Executive Summary 2nd Quarter 2018
TABLE of CONTENTS, Exec Summary
Part I. Economic Trends and Outlook State of the Economy 3 2018 Quarterly Economic Indicators:
Table 1. State 4 Outlook of the Economy 5 Actual & Forecast Key Economic Indicators for Hawaii: 2016-2021 6 County Economic Conditions 7 2018 Quarterly Economic Indicators:
Table 2. City & County of Honolulu 8 Table 3. Hawaii County 9 Table 4. Maui County 10 Table 5. Kauai County 11
Part II. Economic Overview and Data A. Labor Force and Jobs 12
A-6. Non-Ag Wage and Salary Jobs 13 B. Income and Prices 14
B-4. Personal Income by Major Sources 15 B-14. Honolulu and U.S. CPI-U 16
C. Tax Revenues 18 C-1. General Fund Tax Rev. & Major Comp. 19
D. Tourism 21 D-1. Visitor Arrivals & Aver. Daily Visitor Census- By Air 22 D-15. Hotel Occupancy Rate 24
E. Construction 25 E-1. Estim. Value of Completed Construction, New Priv. Bldg Auth & Gov't Contracts Awarded 26
F. Other Indicators 28
QSER 2018 Quarter 2, Executive Summary Page 1 of 28 http://dbedt.hawaii.gov/economic/qser/
This Quarterly Statistical and Economic Report has been prepared by the staff of the Research and Economic Analysis Division of the State Department of Business, Economic Development & Tourism (DBEDT). The report provides concise statistical information and analyses on Labor, Income and Prices, Taxes, Tourism, Construction, and other indicators, as well as an overview of the State of Hawaii and the four counties.
Technical notes and source descriptions have been kept to a minimum. However, the staff of the Research and Economic Analysis Division would be happy to respond to any inquiries of a technical nature that readers may have (586-2466). The quarterly information contained in this report reflects data received by the Research Division on or before May 23, 2018.
On-line availability of Quarterly Statistical and Economic Report
Since 1988, the Hawaii Department of Business, Economic Development & Tourism has had the State of Hawaii Data Book available on-line to anyone with a personal computer and a modem. Since 1997, the Quarterly Statistical and Economic Report, State of Hawaii Data Book and other DBEDT publications and information have been made available via the Internet at http://dbedt.hawaii.gov/economic/.
Printing of the QSER was discontinued in March 2000. The full version and a QSER Executive Summary will be available on-line at http://dbedt.hawaii.gov/economic/qser/.
For further information about available data and sources, users should call the Research and Economic Analysis Division at (808) 586-2466.
This report has been catalogued as follows:
Hawaii. Dept. of Business, Economic Development and Tourism. Research and Economic Analysis Division. Quarterly statistical and economic report-State of Hawaii. Honolulu: 1975-
Quarterly.
Hawaii-Statistics.
HA4007.H359
QSER 2018 Quarter 2, Executive Summary Page 2 of 28 http://dbedt.hawaii.gov/economic/qser/
STATE OF THE ECONOMY Hawaii’s major economic indicators were mostly positive in the first quarter of 2018. Visitor arrivals, visitor expenditures, State general fund tax revenues, wage and salary jobs, personal income (through the fourth quarter of 2017) and government contracts awarded all increased, but private building authorizations, and State CIP expenditures decreased in the quarter compared to first quarter 2017.
In the first quarter of 2018, the total number of visitors arriving by air to Hawaii increased 214,708 or 9.7 percent. Due to shorter lengths of stay, the daily visitor census increased 7.6 percent in the quarter. Since visitors spent more on a daily basis in the first quarter of 2018, total visitors by air spending increased 10.1 percent in the quarter. Historical data shows that, after seventeen quarters of positive growth from the third quarter of 2009 to the third quarter of 2013, Hawaii’s tourism sector experienced one quarter of negative growth in the fourth quarter of 2013. Since the first quarter of 2014, however, Hawaii’s tourism sector has shown positive growth compared with the same quarter in the previous year.
In the first quarter of 2018, the construction sector added 100 jobs, the government contracts awarded increased $318.7 million or 149.1 percent, but the permit value for private construction decreased $219.7 million or 23.9 percent, and State CIP expenditures decreased $0.2 million or 0.1 percent, compared with the same quarter of 2017. According to the most recent excise tax base data available, current construction put-in-place decreased $43.2 million or 1.9 percent in the fourth quarter of 2017, compared with that quarter in 2016.
In the first quarter of 2018, State general fund tax revenues were up $130.2 million or 8.3 percent over the same period of 2017. State general excise tax revenue increased $127.2 million or 15.3 percent in the first quarter of 2018, compared to first quarter 2017. In 2017, State general fund tax revenues increased $270.1 million or 4.3 percent, and state general excise tax revenue increased $144.1 million or 4.5 percent, compared to 2016.
Labor market conditions were positive. Hawaii's jobs increased for the 30th consecutive quarter beginning in fourth quarter 2010. In the first quarter of 2018, Hawaii’s non-agricultural wage and salary jobs averaged 659,800 jobs, an increase of 8,800 jobs or 1.4 percent from the same quarter of 2017.
The job growth in the first quarter of 2018 was due to job increases in the private sector. In this quarter, the private sector added about 10,300 non-agricultural jobs compared to the first quarter of 2017. Jobs increased the most in Food Services and Drinking Places, adding 4,200 jobs or 6.1 percent. This was followed by Health Care &
Social Assistance, adding 2,900 jobs or 4.2 percent, Professional & Business Services, adding 2,100 jobs or 2.6 percent, Accommodation, adding 1,300 jobs or 3.2 percent, and Transportation, Warehousing, and Utilities, adding 900 jobs or 2.8 percent in the quarter. In the private sector, in the first quarter of 2018, Retail Trade lost the most jobs, 1,000 jobs or 1.4 percent; followed by Educational Services which lost 300 jobs or 2.1 percent in the quarter. The three levels of government lost 1,500 jobs or 1.2 percent in the first quarter of 2018 compared to the same quarter of 2017. The Federal Government jobs were unchanged; State Government lost 1,700 jobs or 2.2 percent, while Local Government added 200 jobs or 1.1 percent, compared to the first quarter of 2017.
The U.S. Bureau of Economic Analysis (BEA) estimates of quarterly GDP show, in the fourth quarter of 2017, total annualized nominal GDP increased $3,707 million or 4.3 percent, from the fourth quarter of 2016. In 2017, total annualized nominal GDP increased $3,232 million or 3.8 percent from the previous year. In the fourth quarter of 2017, total annualized real GDP (in chained 2009 dollar) increased $1,463 million or 2.0 percent from the fourth quarter of 2016. In 2017, total annualized real GDP increased $1,232 million or 1.7 percent from the previous year.
In the fourth quarter of 2017, total non-farm private sector annualized earnings increased $1,625.5 million or 4.6 percent from the fourth quarter of 2016. In dollar terms, the largest increase occurred in health care and social assistance; followed by accommodation and food services, transportation and warehousing, retail trade, other services, and real estate and rental and leasing. During the fourth quarter of 2017, total government earnings increased $368.1 million or 2.4 percent from the same quarter of 2016. Earnings from the federal government increased $184.1 million or 2.2 percent. Earnings from the state and local governments increased $184.0 million or 2.6 percent in the quarter.
In the second half of 2017, Honolulu’s Consumer Price Index for Urban Consumers (CPI-U) increased 2.5 percent from the same period in 2016. This is 0.5 of a percentage point above 2.0 percent increase for the U.S. average CPI-U and is higher than the second half of 2016 Honolulu CPI-U increase of 1.5 percent from the same period of the previous year. In the second half of 2017 over 2016, the Honolulu CPI-U increased the most in Housing (3.6 percent), followed by Food and Beverages (2.9 percent), Transportation (2.8 percent), Medical Care (2.0 percent), Apparel (1.5 percent), Other Goods and Services (0.5 percent), and Recreation (0.5 percent), while Education and Communication decreased 3.6 percent.
QSER 2018 Quarter 2, Executive Summary Page 3 of 28 http://dbedt.hawaii.gov/economic/qser/
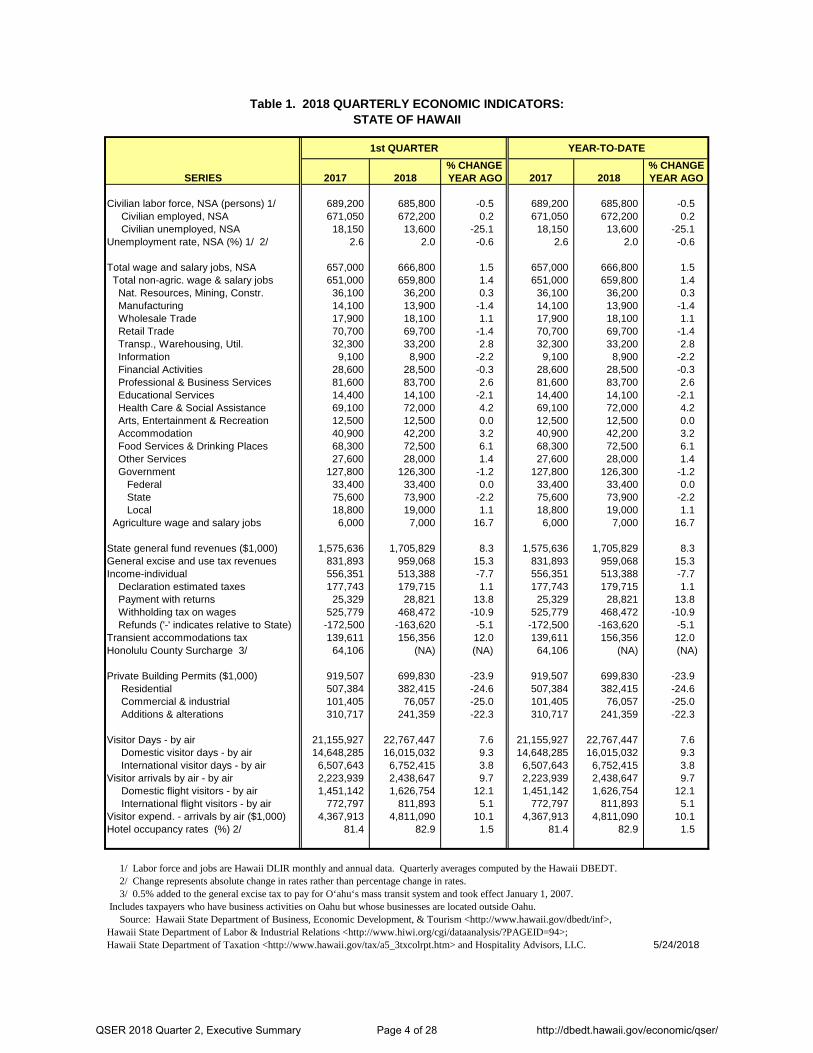
Table 1. 2018 QUARTERLY ECONOMIC INDICATORS: STATE OF HAWAII
1st QUARTER YEAR-TO-DATE
% CHANGE % CHANGESERIES 2017 2018 YEAR AGO 2017 2018 YEAR AGO
Civilian labor force, NSA (persons) 1/ 689,200 685,800 -0.5 689,200 685,800 -0.5 Civilian employed, NSA 671,050 672,200 0.2 671,050 672,200 0.2 Civilian unemployed, NSA 18,150 13,600 -25.1 18,150 13,600 -25.1 Unemployment rate, NSA (%) 1/ 2/ 2.6 2.0 -0.6 2.6 2.0 -0.6
Total wage and salary jobs, NSA 657,000 666,800 1.5 657,000 666,800 1.5 Total non-agric. wage & salary jobs 651,000 659,800 1.4 651,000 659,800 1.4 Nat. Resources, Mining, Constr. 36,100 36,200 0.3 36,100 36,200 0.3 Manufacturing 14,100 13,900 -1.4 14,100 13,900 -1.4 Wholesale Trade 17,900 18,100 1.1 17,900 18,100 1.1 Retail Trade 70,700 69,700 -1.4 70,700 69,700 -1.4 Transp., Warehousing, Util. 32,300 33,200 2.8 32,300 33,200 2.8 Information 9,100 8,900 -2.2 9,100 8,900 -2.2 Financial Activities 28,600 28,500 -0.3 28,600 28,500 -0.3 Professional & Business Services 81,600 83,700 2.6 81,600 83,700 2.6 Educational Services 14,400 14,100 -2.1 14,400 14,100 -2.1 Health Care & Social Assistance 69,100 72,000 4.2 69,100 72,000 4.2 Arts, Entertainment & Recreation 12,500 12,500 0.0 12,500 12,500 0.0 Accommodation 40,900 42,200 3.2 40,900 42,200 3.2 Food Services & Drinking Places 68,300 72,500 6.1 68,300 72,500 6.1 Other Services 27,600 28,000 1.4 27,600 28,000 1.4 Government 127,800 126,300 -1.2 127,800 126,300 -1.2 Federal 33,400 33,400 0.0 33,400 33,400 0.0 State 75,600 73,900 -2.2 75,600 73,900 -2.2 Local 18,800 19,000 1.1 18,800 19,000 1.1 Agriculture wage and salary jobs 6,000 7,000 16.7 6,000 7,000 16.7
State general fund revenues ($1,000) 1,575,636 1,705,829 8.3 1,575,636 1,705,829 8.3 General excise and use tax revenues 831,893 959,068 15.3 831,893 959,068 15.3 Income-individual 556,351 513,388 -7.7 556,351 513,388 -7.7 Declaration estimated taxes 177,743 179,715 1.1 177,743 179,715 1.1 Payment with returns 25,329 28,821 13.8 25,329 28,821 13.8 Withholding tax on wages 525,779 468,472 -10.9 525,779 468,472 -10.9 Refunds ('-' indicates relative to State) -172,500 -163,620 -5.1 -172,500 -163,620 -5.1 Transient accommodations tax 139,611 156,356 12.0 139,611 156,356 12.0 Honolulu County Surcharge 3/ 64,106 (NA) (NA) 64,106 (NA) (NA)
Private Building Permits ($1,000) 919,507 699,830 -23.9 919,507 699,830 -23.9 Residential 507,384 382,415 -24.6 507,384 382,415 -24.6 Commercial & industrial 101,405 76,057 -25.0 101,405 76,057 -25.0 Additions & alterations 310,717 241,359 -22.3 310,717 241,359 -22.3
Visitor Days - by air 21,155,927 22,767,447 7.6 21,155,927 22,767,447 7.6 Domestic visitor days - by air 14,648,285 16,015,032 9.3 14,648,285 16,015,032 9.3 International visitor days - by air 6,507,643 6,752,415 3.8 6,507,643 6,752,415 3.8 Visitor arrivals by air - by air 2,223,939 2,438,647 9.7 2,223,939 2,438,647 9.7 Domestic flight visitors - by air 1,451,142 1,626,754 12.1 1,451,142 1,626,754 12.1 International flight visitors - by air 772,797 811,893 5.1 772,797 811,893 5.1 Visitor expend. - arrivals by air ($1,000) 4,367,913 4,811,090 10.1 4,367,913 4,811,090 10.1 Hotel occupancy rates (%) 2/ 81.4 82.9 1.5 81.4 82.9 1.5
1/ Labor force and jobs are Hawaii DLIR monthly and annual data. Quarterly averages computed by the Hawaii DBEDT. 2/ Change represents absolute change in rates rather than percentage change in rates. 3/ 0.5% added to the general excise tax to pay for O‘ahu‘s mass transit system and took effect January 1, 2007. Includes taxpayers who have business activities on Oahu but whose businesses are located outside Oahu. Source: Hawaii State Department of Business, Economic Development, & Tourism <http://www.hawaii.gov/dbedt/inf>, Hawaii State Department of Labor & Industrial Relations <http://www.hiwi.org/cgi/dataanalysis/?PAGEID=94>; Hawaii State Department of Taxation <http://www.hawaii.gov/tax/a5_3txcolrpt.htm> and Hospitality Advisors, LLC. 5/24/2018
QSER 2018 Quarter 2, Executive Summary Page 4 of 28 http://dbedt.hawaii.gov/economic/qser/
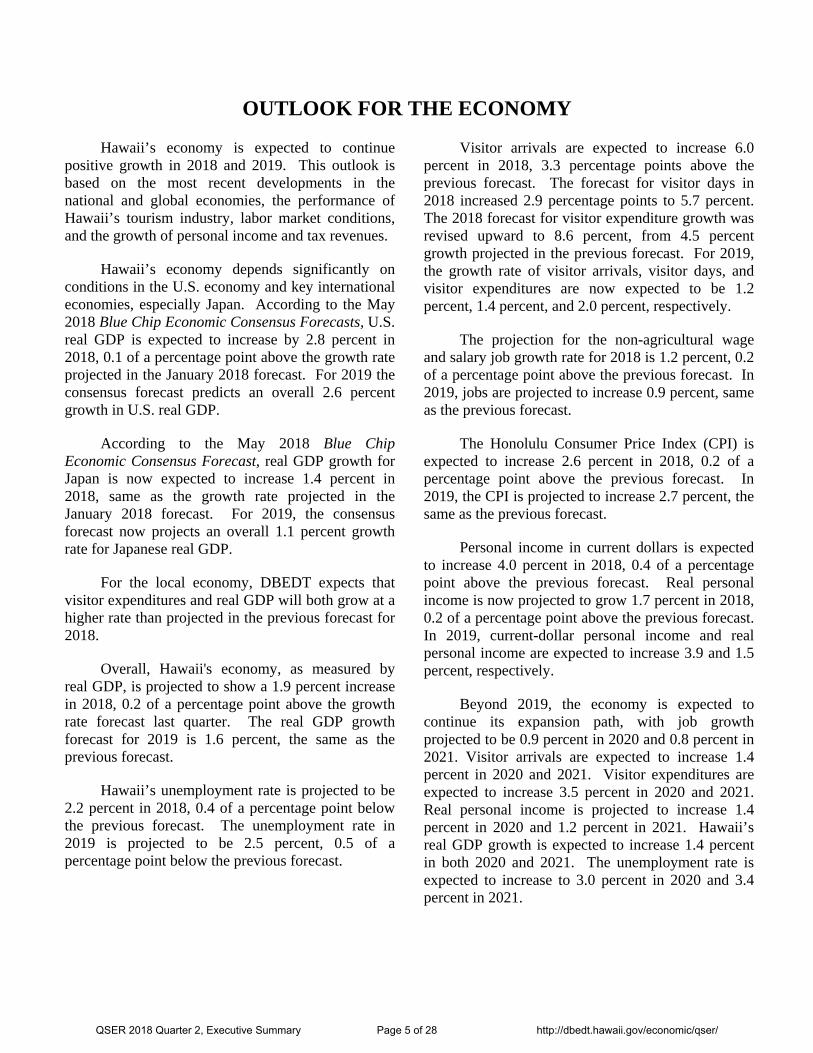
OUTLOOK FOR THE ECONOMY
Hawaii’s economy is expected to continue positive growth in 2018 and 2019. This outlook is based on the most recent developments in the national and global economies, the performance of Hawaii’s tourism industry, labor market conditions, and the growth of personal income and tax revenues.
Hawaii’s economy depends significantly on conditions in the U.S. economy and key international economies, especially Japan. According to the May 2018 Blue Chip Economic Consensus Forecasts, U.S. real GDP is expected to increase by 2.8 percent in 2018, 0.1 of a percentage point above the growth rate projected in the January 2018 forecast. For 2019 the consensus forecast predicts an overall 2.6 percent growth in U.S. real GDP.
According to the May 2018 Blue Chip Economic Consensus Forecast, real GDP growth for Japan is now expected to increase 1.4 percent in 2018, same as the growth rate projected in the January 2018 forecast. For 2019, the consensus forecast now projects an overall 1.1 percent growth rate for Japanese real GDP.
For the local economy, DBEDT expects that visitor expenditures and real GDP will both grow at a higher rate than projected in the previous forecast for 2018.
Overall, Hawaii's economy, as measured by real GDP, is projected to show a 1.9 percent increase in 2018, 0.2 of a percentage point above the growth rate forecast last quarter. The real GDP growth forecast for 2019 is 1.6 percent, the same as the previous forecast.
Hawaii’s unemployment rate is projected to be 2.2 percent in 2018, 0.4 of a percentage point below the previous forecast. The unemployment rate in 2019 is projected to be 2.5 percent, 0.5 of a percentage point below the previous forecast.
Visitor arrivals are expected to increase 6.0 percent in 2018, 3.3 percentage points above the previous forecast. The forecast for visitor days in 2018 increased 2.9 percentage points to 5.7 percent. The 2018 forecast for visitor expenditure growth was revised upward to 8.6 percent, from 4.5 percent growth projected in the previous forecast. For 2019, the growth rate of visitor arrivals, visitor days, and visitor expenditures are now expected to be 1.2 percent, 1.4 percent, and 2.0 percent, respectively.
The projection for the non-agricultural wage and salary job growth rate for 2018 is 1.2 percent, 0.2 of a percentage point above the previous forecast. In 2019, jobs are projected to increase 0.9 percent, same as the previous forecast.
The Honolulu Consumer Price Index (CPI) is expected to increase 2.6 percent in 2018, 0.2 of a percentage point above the previous forecast. In 2019, the CPI is projected to increase 2.7 percent, the same as the previous forecast.
Personal income in current dollars is expected to increase 4.0 percent in 2018, 0.4 of a percentage point above the previous forecast. Real personal income is now projected to grow 1.7 percent in 2018, 0.2 of a percentage point above the previous forecast. In 2019, current-dollar personal income and real personal income are expected to increase 3.9 and 1.5 percent, respectively.
Beyond 2019, the economy is expected to continue its expansion path, with job growth projected to be 0.9 percent in 2020 and 0.8 percent in 2021. Visitor arrivals are expected to increase 1.4 percent in 2020 and 2021. Visitor expenditures are expected to increase 3.5 percent in 2020 and 2021. Real personal income is projected to increase 1.4 percent in 2020 and 1.2 percent in 2021. Hawaii’s real GDP growth is expected to increase 1.4 percent in both 2020 and 2021. The unemployment rate is expected to increase to 3.0 percent in 2020 and 3.4 percent in 2021.
QSER 2018 Quarter 2, Executive Summary Page 5 of 28 http://dbedt.hawaii.gov/economic/qser/
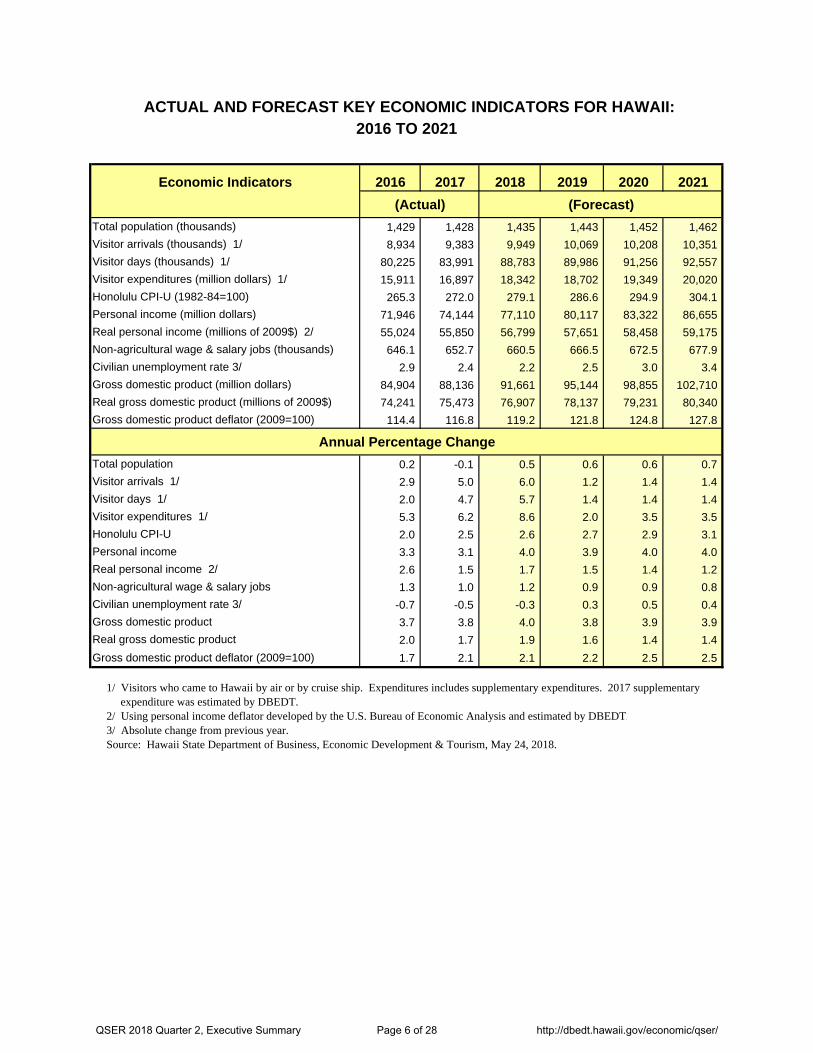
ACTUAL AND FORECAST KEY ECONOMIC INDICATORS FOR HAWAII:2016 TO 2021
Economic Indicators 2016 2017 2018 2019 2020 2021
(Actual) (Forecast)
Total population (thousands) 1,429 1,428 1,435 1,443 1,452 1,462
Visitor arrivals (thousands) 1/ 8,934 9,383 9,949 10,069 10,208 10,351
Visitor days (thousands) 1/ 80,225 83,991 88,783 89,986 91,256 92,557
Visitor expenditures (million dollars) 1/ 15,911 16,897 18,342 18,702 19,349 20,020
Honolulu CPI-U (1982-84=100) 265.3 272.0 279.1 286.6 294.9 304.1
Personal income (million dollars) 71,946 74,144 77,110 80,117 83,322 86,655
Real personal income (millions of 2009$) 2/ 55,024 55,850 56,799 57,651 58,458 59,175
Non-agricultural wage & salary jobs (thousands) 646.1 652.7 660.5 666.5 672.5 677.9
Civilian unemployment rate 3/ 2.9 2.4 2.2 2.5 3.0 3.4
Gross domestic product (million dollars) 84,904 88,136 91,661 95,144 98,855 102,710
Real gross domestic product (millions of 2009$) 74,241 75,473 76,907 78,137 79,231 80,340
Gross domestic product deflator (2009=100) 114.4 116.8 119.2 121.8 124.8 127.8
Annual Percentage Change
Total population 0.2 -0.1 0.5 0.6 0.6 0.7
Visitor arrivals 1/ 2.9 5.0 6.0 1.2 1.4 1.4
Visitor days 1/ 2.0 4.7 5.7 1.4 1.4 1.4
Visitor expenditures 1/ 5.3 6.2 8.6 2.0 3.5 3.5
Honolulu CPI-U 2.0 2.5 2.6 2.7 2.9 3.1
Personal income 3.3 3.1 4.0 3.9 4.0 4.0
Real personal income 2/ 2.6 1.5 1.7 1.5 1.4 1.2
Non-agricultural wage & salary jobs 1.3 1.0 1.2 0.9 0.9 0.8
Civilian unemployment rate 3/ -0.7 -0.5 -0.3 0.3 0.5 0.4
Gross domestic product 3.7 3.8 4.0 3.8 3.9 3.9
Real gross domestic product 2.0 1.7 1.9 1.6 1.4 1.4
Gross domestic product deflator (2009=100) 1.7 2.1 2.1 2.2 2.5 2.5
1/ Visitors who came to Hawaii by air or by cruise ship. Expenditures includes supplementary expenditures. 2017 supplementary expenditure was estimated by DBEDT. 2/ Using personal income deflator developed by the U.S. Bureau of Economic Analysis and estimated by DBEDT. 3/ Absolute change from previous year. Source: Hawaii State Department of Business, Economic Development & Tourism, May 24, 2018.
QSER 2018 Quarter 2, Executive Summary Page 6 of 28 http://dbedt.hawaii.gov/economic/qser/
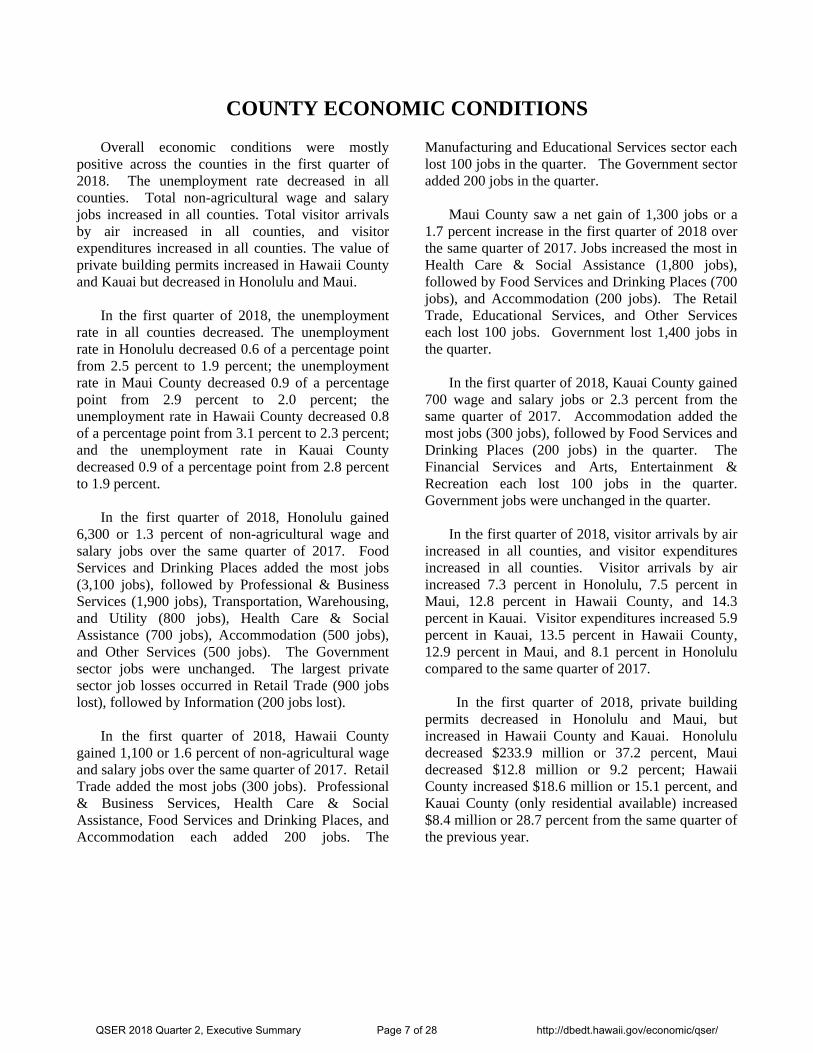
COUNTY ECONOMIC CONDITIONS
Overall economic conditions were mostly positive across the counties in the first quarter of 2018. The unemployment rate decreased in all counties. Total non-agricultural wage and salary jobs increased in all counties. Total visitor arrivals by air increased in all counties, and visitor expenditures increased in all counties. The value of private building permits increased in Hawaii County and Kauai but decreased in Honolulu and Maui.
In the first quarter of 2018, the unemployment rate in all counties decreased. The unemployment rate in Honolulu decreased 0.6 of a percentage point from 2.5 percent to 1.9 percent; the unemployment rate in Maui County decreased 0.9 of a percentage point from 2.9 percent to 2.0 percent; the unemployment rate in Hawaii County decreased 0.8 of a percentage point from 3.1 percent to 2.3 percent; and the unemployment rate in Kauai County decreased 0.9 of a percentage point from 2.8 percent to 1.9 percent.
In the first quarter of 2018, Honolulu gained
6,300 or 1.3 percent of non-agricultural wage and salary jobs over the same quarter of 2017. Food Services and Drinking Places added the most jobs (3,100 jobs), followed by Professional & Business Services (1,900 jobs), Transportation, Warehousing, and Utility (800 jobs), Health Care & Social Assistance (700 jobs), Accommodation (500 jobs), and Other Services (500 jobs). The Government sector jobs were unchanged. The largest private sector job losses occurred in Retail Trade (900 jobs lost), followed by Information (200 jobs lost).
In the first quarter of 2018, Hawaii County
gained 1,100 or 1.6 percent of non-agricultural wage and salary jobs over the same quarter of 2017. Retail Trade added the most jobs (300 jobs). Professional & Business Services, Health Care & Social Assistance, Food Services and Drinking Places, and Accommodation each added 200 jobs. The
Manufacturing and Educational Services sector each lost 100 jobs in the quarter. The Government sector added 200 jobs in the quarter.
Maui County saw a net gain of 1,300 jobs or a
1.7 percent increase in the first quarter of 2018 over the same quarter of 2017. Jobs increased the most in Health Care & Social Assistance (1,800 jobs), followed by Food Services and Drinking Places (700 jobs), and Accommodation (200 jobs). The Retail Trade, Educational Services, and Other Services each lost 100 jobs. Government lost 1,400 jobs in the quarter.
In the first quarter of 2018, Kauai County gained
700 wage and salary jobs or 2.3 percent from the same quarter of 2017. Accommodation added the most jobs (300 jobs), followed by Food Services and Drinking Places (200 jobs) in the quarter. The Financial Services and Arts, Entertainment & Recreation each lost 100 jobs in the quarter. Government jobs were unchanged in the quarter.
In the first quarter of 2018, visitor arrivals by air
increased in all counties, and visitor expenditures increased in all counties. Visitor arrivals by air increased 7.3 percent in Honolulu, 7.5 percent in Maui, 12.8 percent in Hawaii County, and 14.3 percent in Kauai. Visitor expenditures increased 5.9 percent in Kauai, 13.5 percent in Hawaii County, 12.9 percent in Maui, and 8.1 percent in Honolulu compared to the same quarter of 2017.
In the first quarter of 2018, private building
permits decreased in Honolulu and Maui, but increased in Hawaii County and Kauai. Honolulu decreased $233.9 million or 37.2 percent, Maui decreased $12.8 million or 9.2 percent; Hawaii County increased $18.6 million or 15.1 percent, and Kauai County (only residential available) increased $8.4 million or 28.7 percent from the same quarter of the previous year.
QSER 2018 Quarter 2, Executive Summary Page 7 of 28 http://dbedt.hawaii.gov/economic/qser/
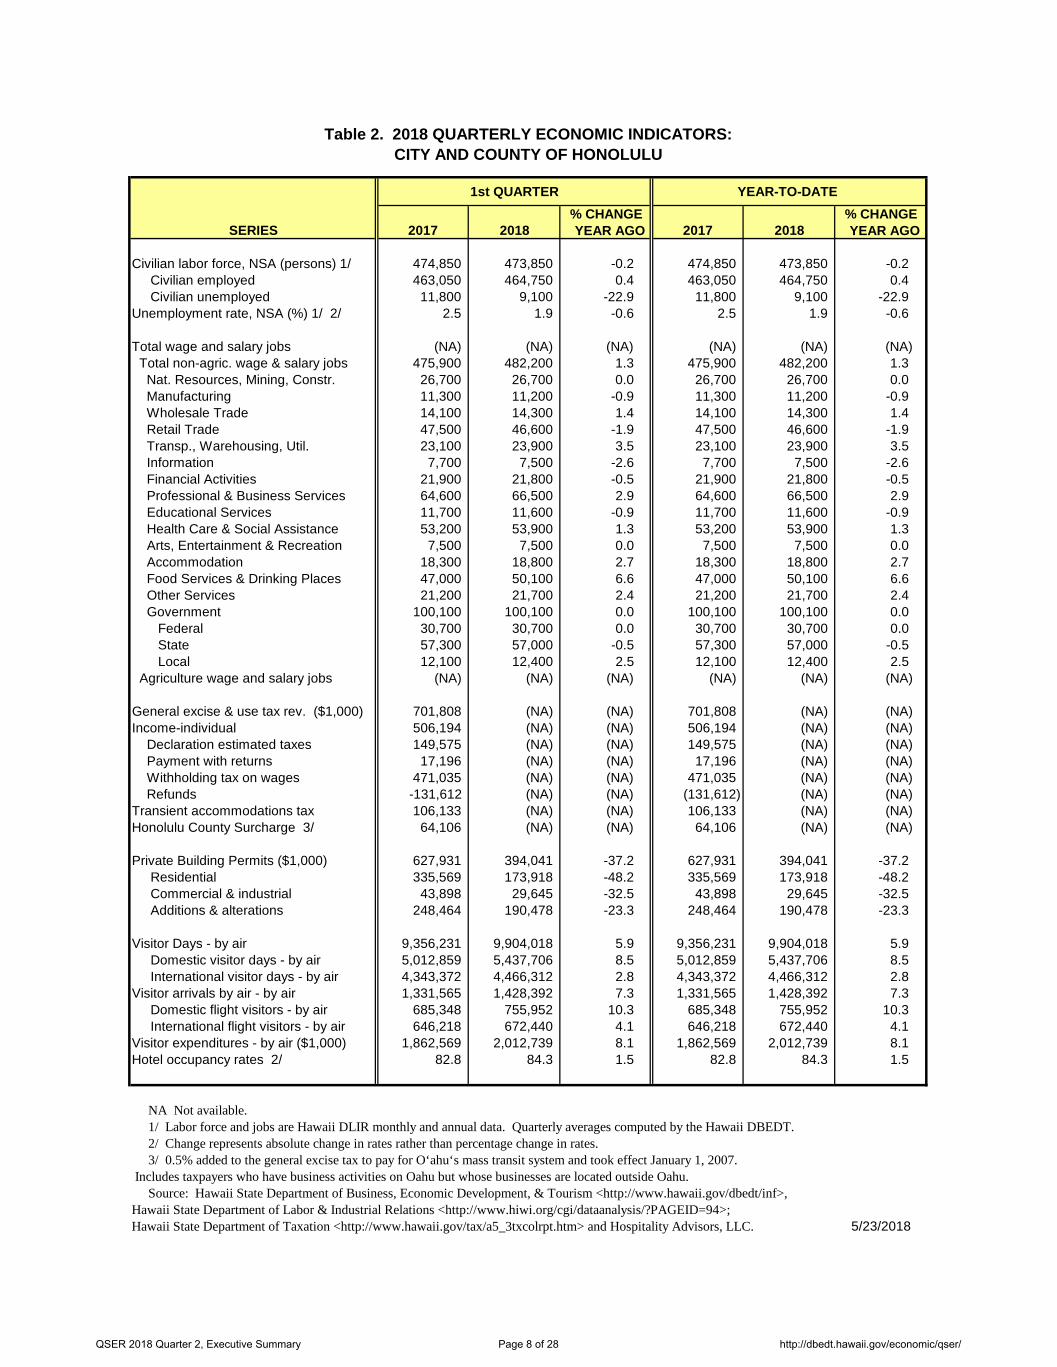
Table 2. 2018 QUARTERLY ECONOMIC INDICATORS: CITY AND COUNTY OF HONOLULU
1st QUARTER YEAR-TO-DATE
% CHANGE % CHANGESERIES 2017 2018 YEAR AGO 2017 2018 YEAR AGO
Civilian labor force, NSA (persons) 1/ 474,850 473,850 -0.2 474,850 473,850 -0.2 Civilian employed 463,050 464,750 0.4 463,050 464,750 0.4 Civilian unemployed 11,800 9,100 -22.9 11,800 9,100 -22.9 Unemployment rate, NSA (%) 1/ 2/ 2.5 1.9 -0.6 2.5 1.9 -0.6
Total wage and salary jobs (NA) (NA) (NA) (NA) (NA) (NA) Total non-agric. wage & salary jobs 475,900 482,200 1.3 475,900 482,200 1.3 Nat. Resources, Mining, Constr. 26,700 26,700 0.0 26,700 26,700 0.0 Manufacturing 11,300 11,200 -0.9 11,300 11,200 -0.9 Wholesale Trade 14,100 14,300 1.4 14,100 14,300 1.4 Retail Trade 47,500 46,600 -1.9 47,500 46,600 -1.9 Transp., Warehousing, Util. 23,100 23,900 3.5 23,100 23,900 3.5 Information 7,700 7,500 -2.6 7,700 7,500 -2.6 Financial Activities 21,900 21,800 -0.5 21,900 21,800 -0.5 Professional & Business Services 64,600 66,500 2.9 64,600 66,500 2.9 Educational Services 11,700 11,600 -0.9 11,700 11,600 -0.9 Health Care & Social Assistance 53,200 53,900 1.3 53,200 53,900 1.3 Arts, Entertainment & Recreation 7,500 7,500 0.0 7,500 7,500 0.0 Accommodation 18,300 18,800 2.7 18,300 18,800 2.7 Food Services & Drinking Places 47,000 50,100 6.6 47,000 50,100 6.6 Other Services 21,200 21,700 2.4 21,200 21,700 2.4 Government 100,100 100,100 0.0 100,100 100,100 0.0 Federal 30,700 30,700 0.0 30,700 30,700 0.0 State 57,300 57,000 -0.5 57,300 57,000 -0.5 Local 12,100 12,400 2.5 12,100 12,400 2.5 Agriculture wage and salary jobs (NA) (NA) (NA) (NA) (NA) (NA)
General excise & use tax rev. ($1,000) 701,808 (NA) (NA) 701,808 (NA) (NA) Income-individual 506,194 (NA) (NA) 506,194 (NA) (NA) Declaration estimated taxes 149,575 (NA) (NA) 149,575 (NA) (NA) Payment with returns 17,196 (NA) (NA) 17,196 (NA) (NA) Withholding tax on wages 471,035 (NA) (NA) 471,035 (NA) (NA) Refunds -131,612 (NA) (NA) (131,612) (NA) (NA) Transient accommodations tax 106,133 (NA) (NA) 106,133 (NA) (NA) Honolulu County Surcharge 3/ 64,106 (NA) (NA) 64,106 (NA) (NA)
Private Building Permits ($1,000) 627,931 394,041 -37.2 627,931 394,041 -37.2 Residential 335,569 173,918 -48.2 335,569 173,918 -48.2 Commercial & industrial 43,898 29,645 -32.5 43,898 29,645 -32.5 Additions & alterations 248,464 190,478 -23.3 248,464 190,478 -23.3
Visitor Days - by air 9,356,231 9,904,018 5.9 9,356,231 9,904,018 5.9 Domestic visitor days - by air 5,012,859 5,437,706 8.5 5,012,859 5,437,706 8.5 International visitor days - by air 4,343,372 4,466,312 2.8 4,343,372 4,466,312 2.8 Visitor arrivals by air - by air 1,331,565 1,428,392 7.3 1,331,565 1,428,392 7.3 Domestic flight visitors - by air 685,348 755,952 10.3 685,348 755,952 10.3 International flight visitors - by air 646,218 672,440 4.1 646,218 672,440 4.1 Visitor expenditures - by air ($1,000) 1,862,569 2,012,739 8.1 1,862,569 2,012,739 8.1 Hotel occupancy rates 2/ 82.8 84.3 1.5 82.8 84.3 1.5
NA Not available. 1/ Labor force and jobs are Hawaii DLIR monthly and annual data. Quarterly averages computed by the Hawaii DBEDT. 2/ Change represents absolute change in rates rather than percentage change in rates. 3/ 0.5% added to the general excise tax to pay for O‘ahu‘s mass transit system and took effect January 1, 2007. Includes taxpayers who have business activities on Oahu but whose businesses are located outside Oahu. Source: Hawaii State Department of Business, Economic Development, & Tourism <http://www.hawaii.gov/dbedt/inf>, Hawaii State Department of Labor & Industrial Relations <http://www.hiwi.org/cgi/dataanalysis/?PAGEID=94>; Hawaii State Department of Taxation <http://www.hawaii.gov/tax/a5_3txcolrpt.htm> and Hospitality Advisors, LLC. 5/23/2018
QSER 2018 Quarter 2, Executive Summary Page 8 of 28 http://dbedt.hawaii.gov/economic/qser/
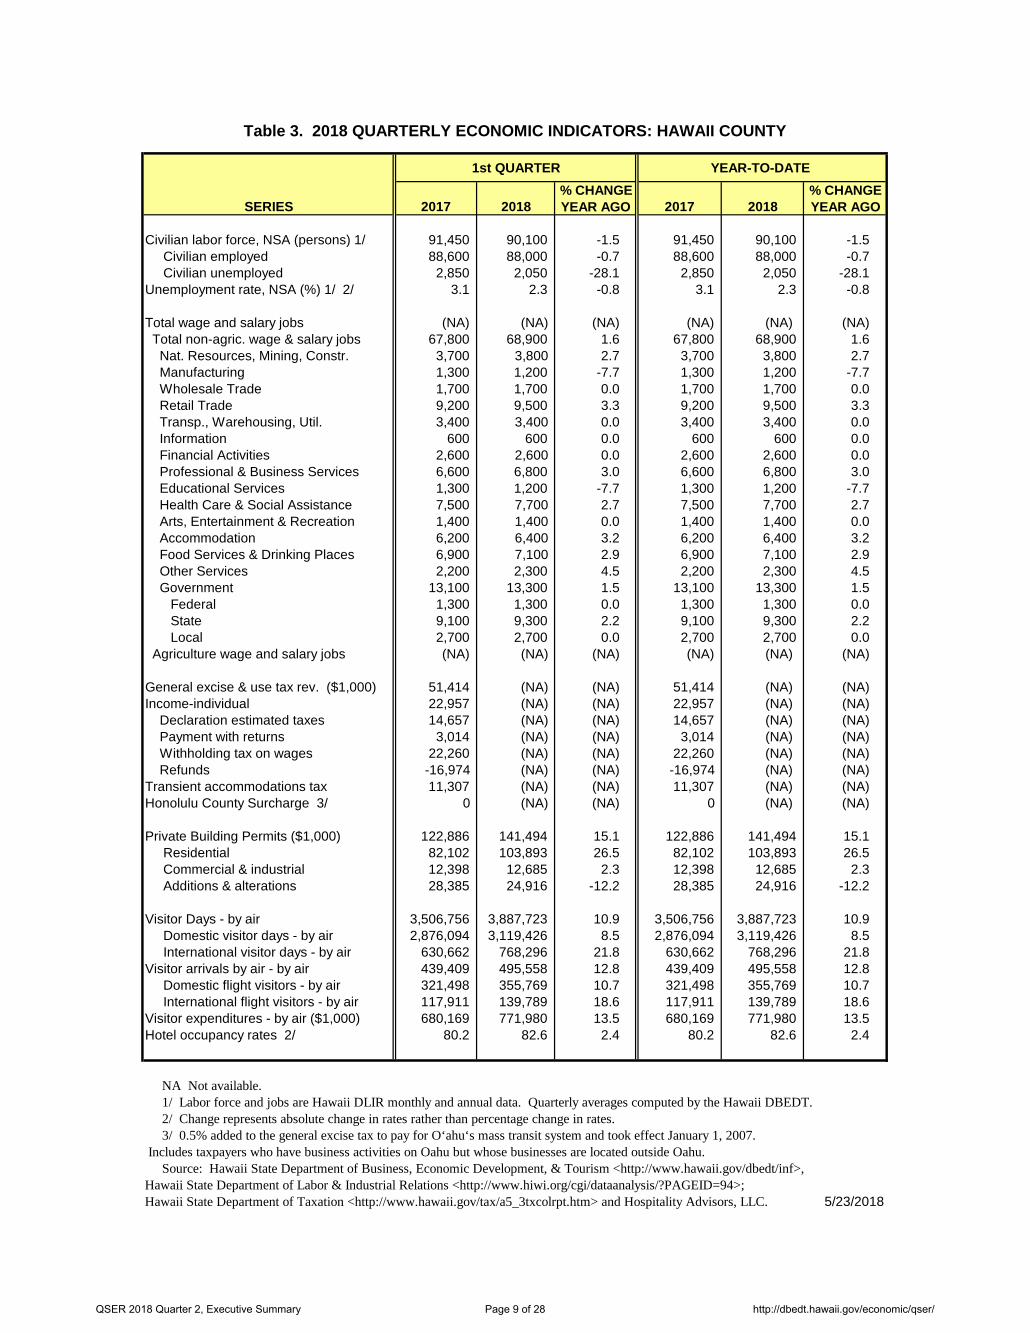
Table 3. 2018 QUARTERLY ECONOMIC INDICATORS: HAWAII COUNTY
1st QUARTER YEAR-TO-DATE
% CHANGE % CHANGESERIES 2017 2018 YEAR AGO 2017 2018 YEAR AGO
Civilian labor force, NSA (persons) 1/ 91,450 90,100 -1.5 91,450 90,100 -1.5 Civilian employed 88,600 88,000 -0.7 88,600 88,000 -0.7 Civilian unemployed 2,850 2,050 -28.1 2,850 2,050 -28.1 Unemployment rate, NSA (%) 1/ 2/ 3.1 2.3 -0.8 3.1 2.3 -0.8
Total wage and salary jobs (NA) (NA) (NA) (NA) (NA) (NA) Total non-agric. wage & salary jobs 67,800 68,900 1.6 67,800 68,900 1.6 Nat. Resources, Mining, Constr. 3,700 3,800 2.7 3,700 3,800 2.7 Manufacturing 1,300 1,200 -7.7 1,300 1,200 -7.7 Wholesale Trade 1,700 1,700 0.0 1,700 1,700 0.0 Retail Trade 9,200 9,500 3.3 9,200 9,500 3.3 Transp., Warehousing, Util. 3,400 3,400 0.0 3,400 3,400 0.0 Information 600 600 0.0 600 600 0.0 Financial Activities 2,600 2,600 0.0 2,600 2,600 0.0 Professional & Business Services 6,600 6,800 3.0 6,600 6,800 3.0 Educational Services 1,300 1,200 -7.7 1,300 1,200 -7.7 Health Care & Social Assistance 7,500 7,700 2.7 7,500 7,700 2.7 Arts, Entertainment & Recreation 1,400 1,400 0.0 1,400 1,400 0.0 Accommodation 6,200 6,400 3.2 6,200 6,400 3.2 Food Services & Drinking Places 6,900 7,100 2.9 6,900 7,100 2.9 Other Services 2,200 2,300 4.5 2,200 2,300 4.5 Government 13,100 13,300 1.5 13,100 13,300 1.5 Federal 1,300 1,300 0.0 1,300 1,300 0.0 State 9,100 9,300 2.2 9,100 9,300 2.2 Local 2,700 2,700 0.0 2,700 2,700 0.0 Agriculture wage and salary jobs (NA) (NA) (NA) (NA) (NA) (NA)
General excise & use tax rev. ($1,000) 51,414 (NA) (NA) 51,414 (NA) (NA) Income-individual 22,957 (NA) (NA) 22,957 (NA) (NA) Declaration estimated taxes 14,657 (NA) (NA) 14,657 (NA) (NA) Payment with returns 3,014 (NA) (NA) 3,014 (NA) (NA) Withholding tax on wages 22,260 (NA) (NA) 22,260 (NA) (NA) Refunds -16,974 (NA) (NA) -16,974 (NA) (NA) Transient accommodations tax 11,307 (NA) (NA) 11,307 (NA) (NA) Honolulu County Surcharge 3/ 0 (NA) (NA) 0 (NA) (NA)
Private Building Permits ($1,000) 122,886 141,494 15.1 122,886 141,494 15.1 Residential 82,102 103,893 26.5 82,102 103,893 26.5 Commercial & industrial 12,398 12,685 2.3 12,398 12,685 2.3 Additions & alterations 28,385 24,916 -12.2 28,385 24,916 -12.2
Visitor Days - by air 3,506,756 3,887,723 10.9 3,506,756 3,887,723 10.9 Domestic visitor days - by air 2,876,094 3,119,426 8.5 2,876,094 3,119,426 8.5 International visitor days - by air 630,662 768,296 21.8 630,662 768,296 21.8 Visitor arrivals by air - by air 439,409 495,558 12.8 439,409 495,558 12.8 Domestic flight visitors - by air 321,498 355,769 10.7 321,498 355,769 10.7 International flight visitors - by air 117,911 139,789 18.6 117,911 139,789 18.6 Visitor expenditures - by air ($1,000) 680,169 771,980 13.5 680,169 771,980 13.5 Hotel occupancy rates 2/ 80.2 82.6 2.4 80.2 82.6 2.4
NA Not available. 1/ Labor force and jobs are Hawaii DLIR monthly and annual data. Quarterly averages computed by the Hawaii DBEDT. 2/ Change represents absolute change in rates rather than percentage change in rates. 3/ 0.5% added to the general excise tax to pay for O‘ahu‘s mass transit system and took effect January 1, 2007. Includes taxpayers who have business activities on Oahu but whose businesses are located outside Oahu. Source: Hawaii State Department of Business, Economic Development, & Tourism <http://www.hawaii.gov/dbedt/inf>, Hawaii State Department of Labor & Industrial Relations <http://www.hiwi.org/cgi/dataanalysis/?PAGEID=94>; Hawaii State Department of Taxation <http://www.hawaii.gov/tax/a5_3txcolrpt.htm> and Hospitality Advisors, LLC. 5/23/2018
QSER 2018 Quarter 2, Executive Summary Page 9 of 28 http://dbedt.hawaii.gov/economic/qser/
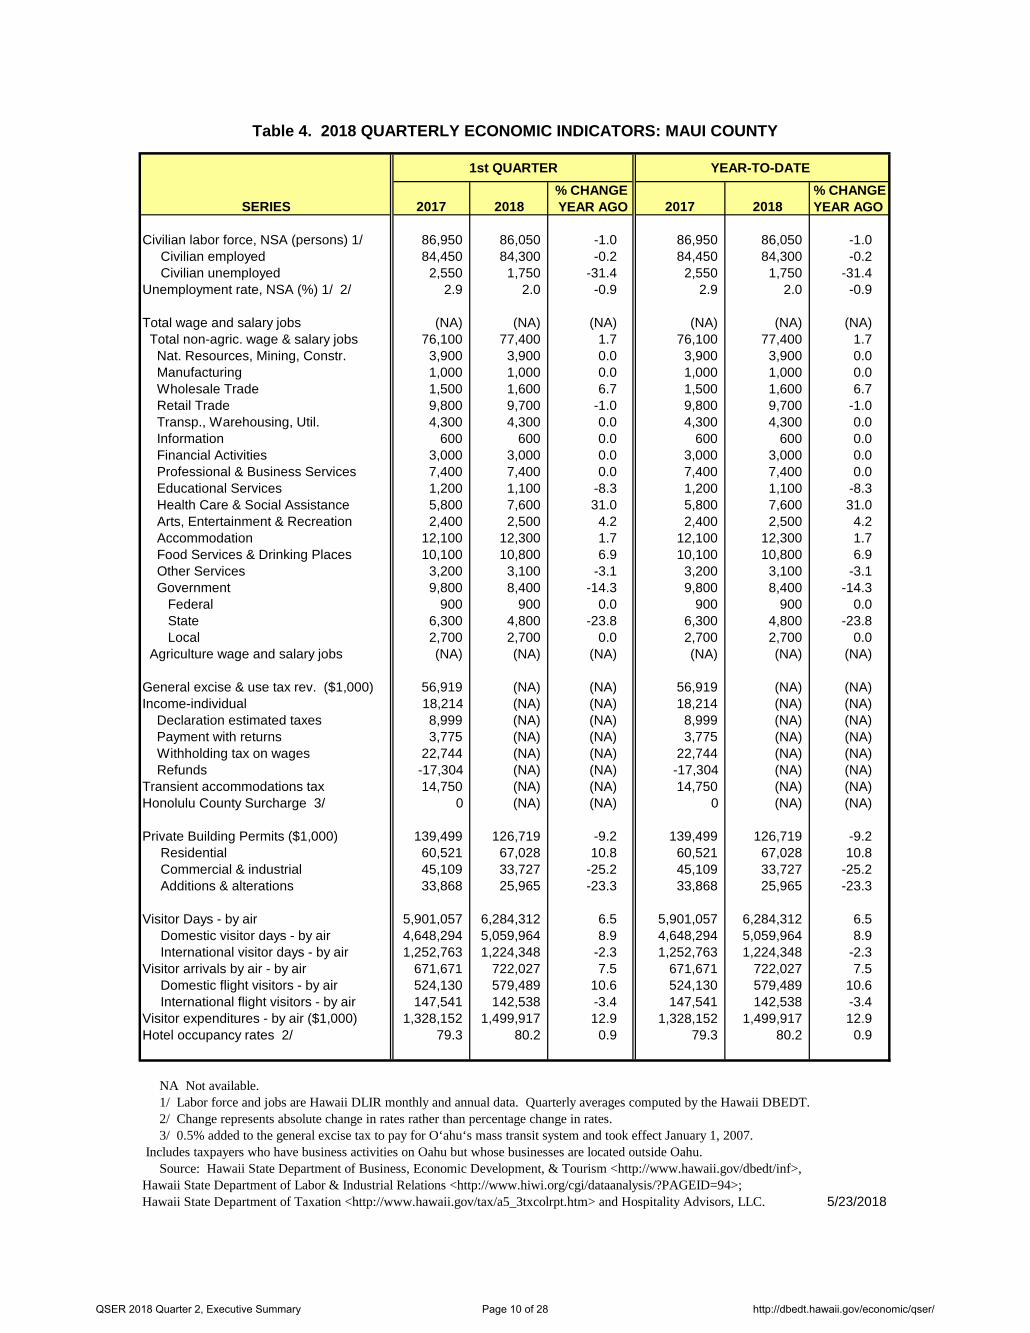
Table 4. 2018 QUARTERLY ECONOMIC INDICATORS: MAUI COUNTY
1st QUARTER YEAR-TO-DATE
% CHANGE % CHANGESERIES 2017 2018 YEAR AGO 2017 2018 YEAR AGO
Civilian labor force, NSA (persons) 1/ 86,950 86,050 -1.0 86,950 86,050 -1.0 Civilian employed 84,450 84,300 -0.2 84,450 84,300 -0.2 Civilian unemployed 2,550 1,750 -31.4 2,550 1,750 -31.4 Unemployment rate, NSA (%) 1/ 2/ 2.9 2.0 -0.9 2.9 2.0 -0.9
Total wage and salary jobs (NA) (NA) (NA) (NA) (NA) (NA) Total non-agric. wage & salary jobs 76,100 77,400 1.7 76,100 77,400 1.7 Nat. Resources, Mining, Constr. 3,900 3,900 0.0 3,900 3,900 0.0 Manufacturing 1,000 1,000 0.0 1,000 1,000 0.0 Wholesale Trade 1,500 1,600 6.7 1,500 1,600 6.7 Retail Trade 9,800 9,700 -1.0 9,800 9,700 -1.0 Transp., Warehousing, Util. 4,300 4,300 0.0 4,300 4,300 0.0 Information 600 600 0.0 600 600 0.0 Financial Activities 3,000 3,000 0.0 3,000 3,000 0.0 Professional & Business Services 7,400 7,400 0.0 7,400 7,400 0.0 Educational Services 1,200 1,100 -8.3 1,200 1,100 -8.3 Health Care & Social Assistance 5,800 7,600 31.0 5,800 7,600 31.0 Arts, Entertainment & Recreation 2,400 2,500 4.2 2,400 2,500 4.2 Accommodation 12,100 12,300 1.7 12,100 12,300 1.7 Food Services & Drinking Places 10,100 10,800 6.9 10,100 10,800 6.9 Other Services 3,200 3,100 -3.1 3,200 3,100 -3.1 Government 9,800 8,400 -14.3 9,800 8,400 -14.3 Federal 900 900 0.0 900 900 0.0 State 6,300 4,800 -23.8 6,300 4,800 -23.8 Local 2,700 2,700 0.0 2,700 2,700 0.0 Agriculture wage and salary jobs (NA) (NA) (NA) (NA) (NA) (NA)
General excise & use tax rev. ($1,000) 56,919 (NA) (NA) 56,919 (NA) (NA) Income-individual 18,214 (NA) (NA) 18,214 (NA) (NA) Declaration estimated taxes 8,999 (NA) (NA) 8,999 (NA) (NA) Payment with returns 3,775 (NA) (NA) 3,775 (NA) (NA) Withholding tax on wages 22,744 (NA) (NA) 22,744 (NA) (NA) Refunds -17,304 (NA) (NA) -17,304 (NA) (NA) Transient accommodations tax 14,750 (NA) (NA) 14,750 (NA) (NA) Honolulu County Surcharge 3/ 0 (NA) (NA) 0 (NA) (NA)
Private Building Permits ($1,000) 139,499 126,719 -9.2 139,499 126,719 -9.2 Residential 60,521 67,028 10.8 60,521 67,028 10.8 Commercial & industrial 45,109 33,727 -25.2 45,109 33,727 -25.2 Additions & alterations 33,868 25,965 -23.3 33,868 25,965 -23.3
Visitor Days - by air 5,901,057 6,284,312 6.5 5,901,057 6,284,312 6.5 Domestic visitor days - by air 4,648,294 5,059,964 8.9 4,648,294 5,059,964 8.9 International visitor days - by air 1,252,763 1,224,348 -2.3 1,252,763 1,224,348 -2.3 Visitor arrivals by air - by air 671,671 722,027 7.5 671,671 722,027 7.5 Domestic flight visitors - by air 524,130 579,489 10.6 524,130 579,489 10.6 International flight visitors - by air 147,541 142,538 -3.4 147,541 142,538 -3.4 Visitor expenditures - by air ($1,000) 1,328,152 1,499,917 12.9 1,328,152 1,499,917 12.9 Hotel occupancy rates 2/ 79.3 80.2 0.9 79.3 80.2 0.9
NA Not available. 1/ Labor force and jobs are Hawaii DLIR monthly and annual data. Quarterly averages computed by the Hawaii DBEDT. 2/ Change represents absolute change in rates rather than percentage change in rates. 3/ 0.5% added to the general excise tax to pay for O‘ahu‘s mass transit system and took effect January 1, 2007. Includes taxpayers who have business activities on Oahu but whose businesses are located outside Oahu. Source: Hawaii State Department of Business, Economic Development, & Tourism <http://www.hawaii.gov/dbedt/inf>, Hawaii State Department of Labor & Industrial Relations <http://www.hiwi.org/cgi/dataanalysis/?PAGEID=94>; Hawaii State Department of Taxation <http://www.hawaii.gov/tax/a5_3txcolrpt.htm> and Hospitality Advisors, LLC. 5/23/2018
QSER 2018 Quarter 2, Executive Summary Page 10 of 28 http://dbedt.hawaii.gov/economic/qser/
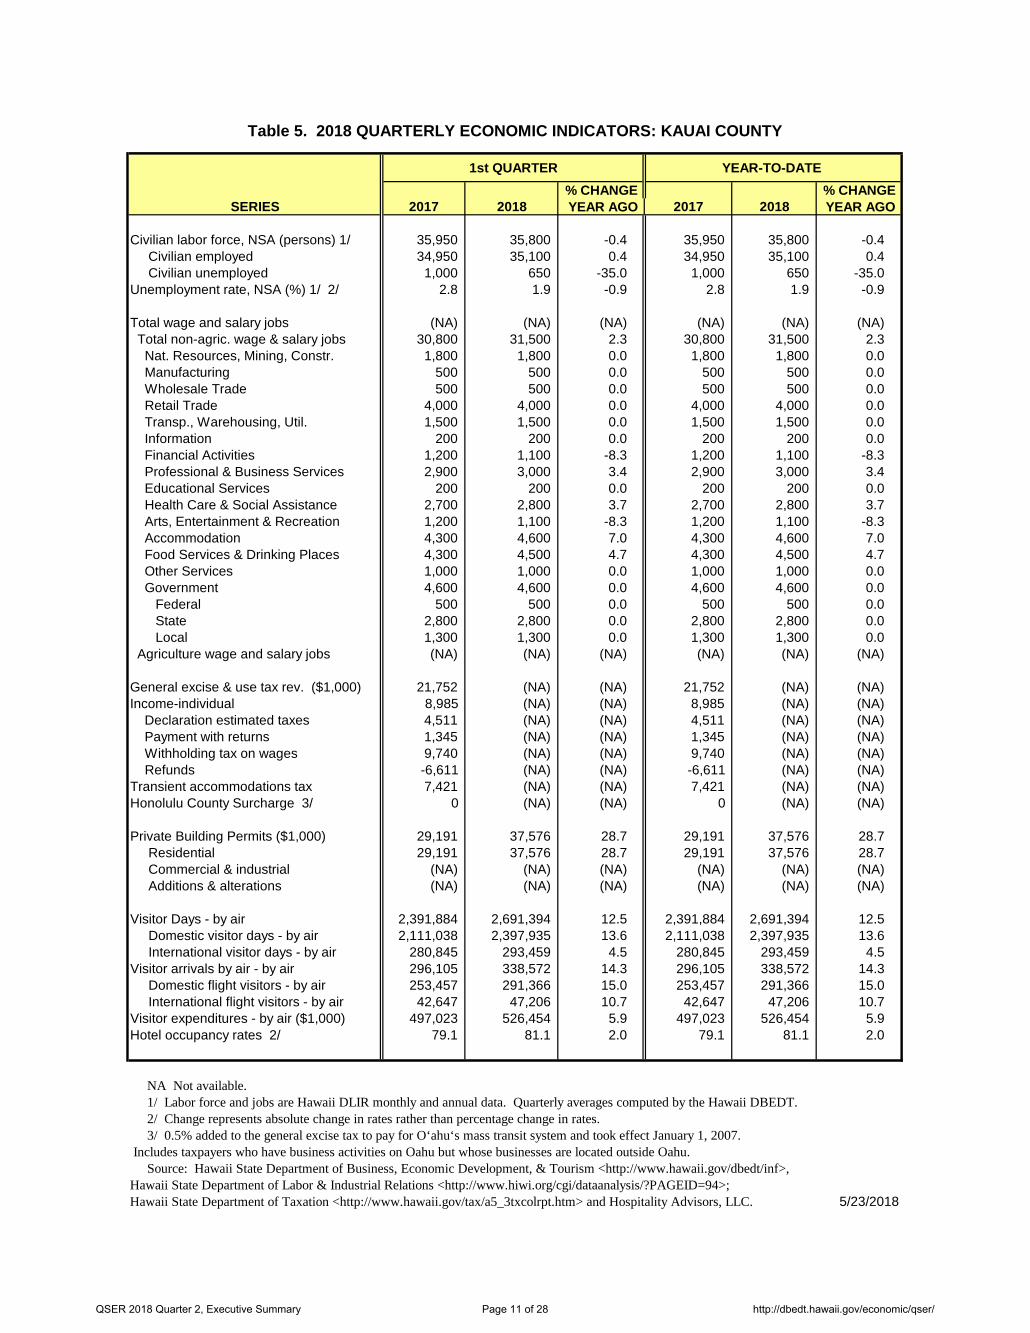
Table 5. 2018 QUARTERLY ECONOMIC INDICATORS: KAUAI COUNTY
1st QUARTER YEAR-TO-DATE
% CHANGE % CHANGESERIES 2017 2018 YEAR AGO 2017 2018 YEAR AGO
Civilian labor force, NSA (persons) 1/ 35,950 35,800 -0.4 35,950 35,800 -0.4 Civilian employed 34,950 35,100 0.4 34,950 35,100 0.4 Civilian unemployed 1,000 650 -35.0 1,000 650 -35.0 Unemployment rate, NSA (%) 1/ 2/ 2.8 1.9 -0.9 2.8 1.9 -0.9
Total wage and salary jobs (NA) (NA) (NA) (NA) (NA) (NA) Total non-agric. wage & salary jobs 30,800 31,500 2.3 30,800 31,500 2.3 Nat. Resources, Mining, Constr. 1,800 1,800 0.0 1,800 1,800 0.0 Manufacturing 500 500 0.0 500 500 0.0 Wholesale Trade 500 500 0.0 500 500 0.0 Retail Trade 4,000 4,000 0.0 4,000 4,000 0.0 Transp., Warehousing, Util. 1,500 1,500 0.0 1,500 1,500 0.0 Information 200 200 0.0 200 200 0.0 Financial Activities 1,200 1,100 -8.3 1,200 1,100 -8.3 Professional & Business Services 2,900 3,000 3.4 2,900 3,000 3.4 Educational Services 200 200 0.0 200 200 0.0 Health Care & Social Assistance 2,700 2,800 3.7 2,700 2,800 3.7 Arts, Entertainment & Recreation 1,200 1,100 -8.3 1,200 1,100 -8.3 Accommodation 4,300 4,600 7.0 4,300 4,600 7.0 Food Services & Drinking Places 4,300 4,500 4.7 4,300 4,500 4.7 Other Services 1,000 1,000 0.0 1,000 1,000 0.0 Government 4,600 4,600 0.0 4,600 4,600 0.0 Federal 500 500 0.0 500 500 0.0 State 2,800 2,800 0.0 2,800 2,800 0.0 Local 1,300 1,300 0.0 1,300 1,300 0.0 Agriculture wage and salary jobs (NA) (NA) (NA) (NA) (NA) (NA)
General excise & use tax rev. ($1,000) 21,752 (NA) (NA) 21,752 (NA) (NA) Income-individual 8,985 (NA) (NA) 8,985 (NA) (NA) Declaration estimated taxes 4,511 (NA) (NA) 4,511 (NA) (NA) Payment with returns 1,345 (NA) (NA) 1,345 (NA) (NA) Withholding tax on wages 9,740 (NA) (NA) 9,740 (NA) (NA) Refunds -6,611 (NA) (NA) -6,611 (NA) (NA) Transient accommodations tax 7,421 (NA) (NA) 7,421 (NA) (NA) Honolulu County Surcharge 3/ 0 (NA) (NA) 0 (NA) (NA)
Private Building Permits ($1,000) 29,191 37,576 28.7 29,191 37,576 28.7 Residential 29,191 37,576 28.7 29,191 37,576 28.7 Commercial & industrial (NA) (NA) (NA) (NA) (NA) (NA) Additions & alterations (NA) (NA) (NA) (NA) (NA) (NA)
Visitor Days - by air 2,391,884 2,691,394 12.5 2,391,884 2,691,394 12.5 Domestic visitor days - by air 2,111,038 2,397,935 13.6 2,111,038 2,397,935 13.6 International visitor days - by air 280,845 293,459 4.5 280,845 293,459 4.5 Visitor arrivals by air - by air 296,105 338,572 14.3 296,105 338,572 14.3 Domestic flight visitors - by air 253,457 291,366 15.0 253,457 291,366 15.0 International flight visitors - by air 42,647 47,206 10.7 42,647 47,206 10.7 Visitor expenditures - by air ($1,000) 497,023 526,454 5.9 497,023 526,454 5.9 Hotel occupancy rates 2/ 79.1 81.1 2.0 79.1 81.1 2.0
NA Not available. 1/ Labor force and jobs are Hawaii DLIR monthly and annual data. Quarterly averages computed by the Hawaii DBEDT. 2/ Change represents absolute change in rates rather than percentage change in rates. 3/ 0.5% added to the general excise tax to pay for O‘ahu‘s mass transit system and took effect January 1, 2007. Includes taxpayers who have business activities on Oahu but whose businesses are located outside Oahu. Source: Hawaii State Department of Business, Economic Development, & Tourism <http://www.hawaii.gov/dbedt/inf>, Hawaii State Department of Labor & Industrial Relations <http://www.hiwi.org/cgi/dataanalysis/?PAGEID=94>; Hawaii State Department of Taxation <http://www.hawaii.gov/tax/a5_3txcolrpt.htm> and Hospitality Advisors, LLC. 5/23/2018
QSER 2018 Quarter 2, Executive Summary Page 11 of 28 http://dbedt.hawaii.gov/economic/qser/
A. LABOR FORCE AND JOBS
Hawaii’s labor market conditions continued to improve in the first quarter of 2018. With reduced civilian labor force and increased civilian employment, the civilian unemployment rate decreased 0.6 of a percentage point in the quarter. For the 30th consecutive quarter-over-quarter, civilian non-agricultural wage and salary jobs increased.
In the first quarter of 2018, the civilian labor force averaged 685,800 people, a decrease of 3,400 people or 0.5 percent from the same quarter of 2017 (Table A-1). In 2017, the civilian labor force increased 1,250 people or 0.2 percent from the previous year.
Civilian employment totaled 672,200 people in the first quarter of 2018, an increase of 1,150 people or 0.2 percent compared to the same quarter of 2017 (Table A-2). In 2017, average civilian employment increased 5,200 people or 0.8 percent from the previous year.
In the first quarter of 2018, the number of civilian unemployed averaged 13,600, a decrease of 4,550 people or 25.1 percent from the same quarter of 2017 (Table A-3). In 2017, the number of unemployed decreased 3,950 people or 19.6 percent from the previous year.
The unemployment rate (not seasonally adjusted) decreased from 2.6 percent in the first quarter of 2017 to 2.0 percent in the first quarter of 2018 (Table A-4). In 2017, the unemployment rate decreased 0.5 of a percentage point from the previous year.
In the first quarter of 2018, Hawaii’s non-agricultural wage and salary jobs averaged 659,800 jobs, an increase of 8,800 jobs or 1.4 percent from the same quarter of 2017 (Table A-6). This is the 30th consecutive quarter-over-quarter increase in non-agricultural wage and salary jobs after ten consecutive quarter-over-
quarter decreases in jobs since the second quarter of 2008. In 2017, average non-agricultural wage and salary jobs increased 1.0 percent or 6,600 jobs from the previous year.
The job growth in the first quarter of 2018 was due to job increases in the private sector. In this quarter, the private sector added about 10,300 non-agricultural jobs compared to the first quarter of 2017. Jobs increased the most in Food Services and Drinking Places, adding 4,200 jobs or 6.1 percent (Table A-19). This was followed by Health Care & Social Assistance, adding 2,900 jobs or 4.2 percent (Table A-16), Professional & Business Services, adding 2,100 jobs or 2.6 percent (Table A-14), Accommodation, adding 1,300 jobs or 3.2 percent (Table A-18), and Transportation, Warehousing, and Utilities, adding 900 jobs or 2.8 percent (Table A-11) in the quarter.
For the private sector, in the first quarter of 2018, Retail Trade lost the most jobs, 1,000 jobs or 1.4 percent (Table A-10); followed by Educational Services which lost 300 jobs or 2.1 percent (Table A-15) in the quarter.
The three levels of government lost 1,500 jobs or 1.2 percent (Table A-21) in the first quarter of 2018 compared to the same quarter of 2017. The Federal Government jobs were unchanged (Table A-22); State Government lost 1,700 jobs or 2.2 percent (Table A-23), while Local Government added 200 jobs or 1.1 percent (Table A-24), compared to the first quarter of 2017.
The initial liable claims for unemployment, which measures the number of people who lost jobs in Hawaii and moved to other states, decreased 19.1 percent in the first quarter of 2018 compared to the same quarter of 2017 (Table A-27). In 2017, the initial liable claims for unemployment decreased 11.2 percent from the previous year.
QSER 2018 Quarter 2, Executive Summary Page 12 of 28 http://dbedt.hawaii.gov/economic/qser/
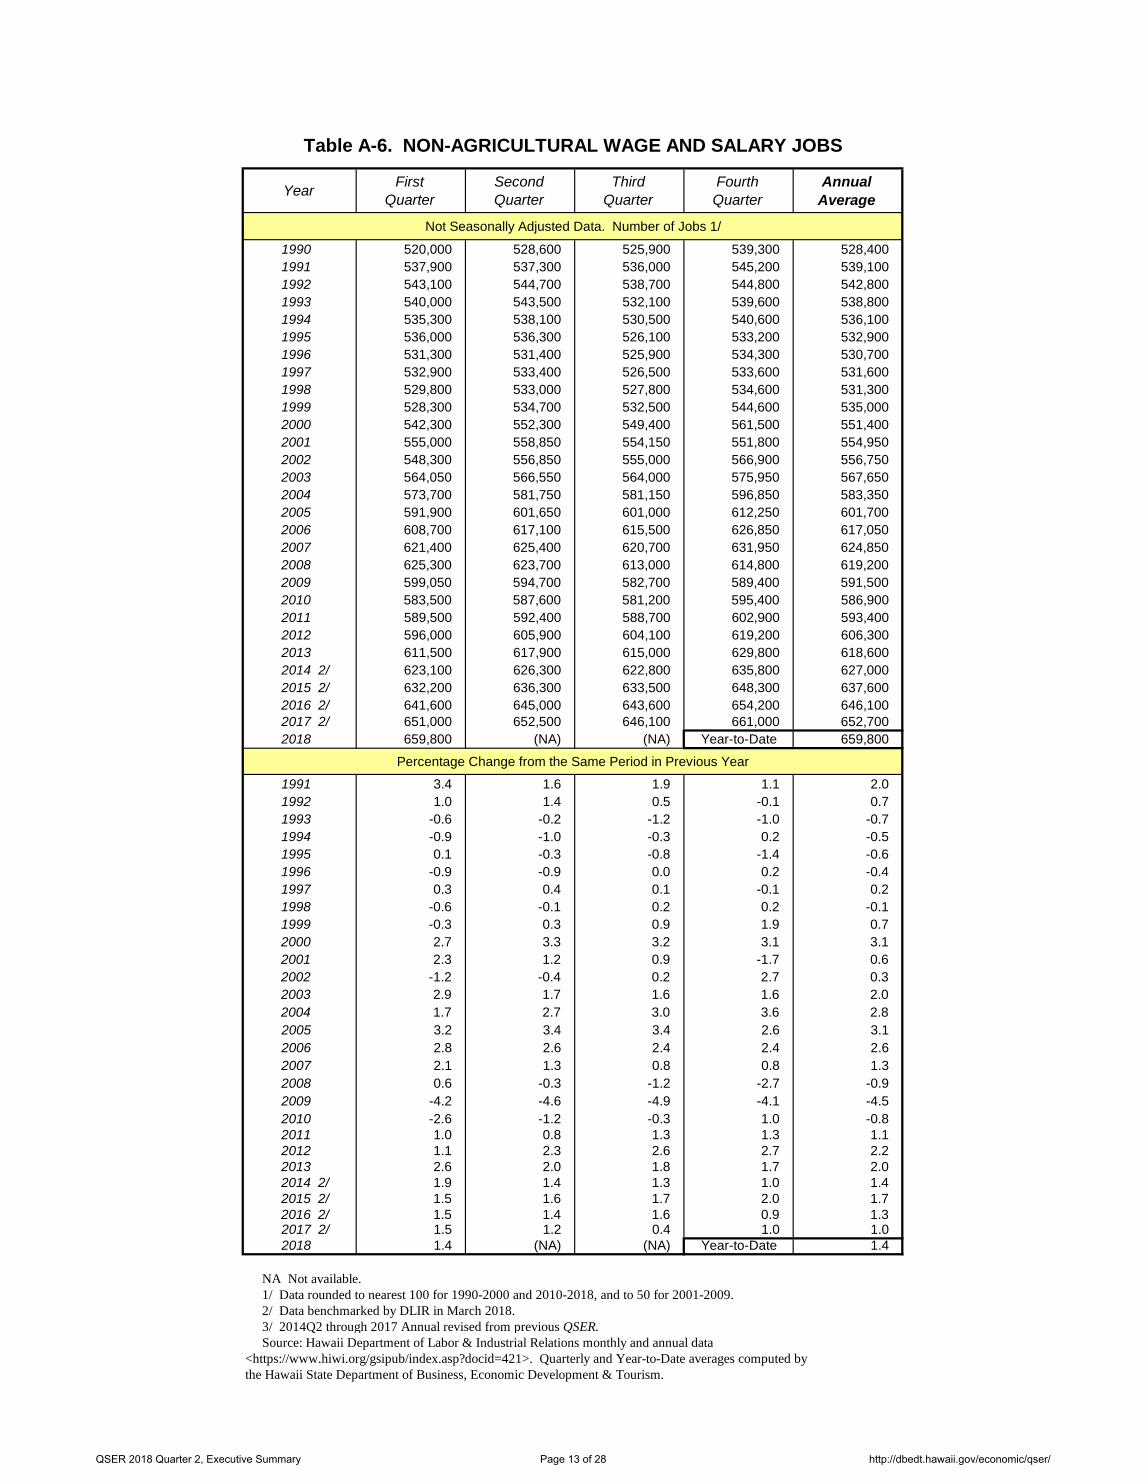
Table A-6. NON-AGRICULTURAL WAGE AND SALARY JOBS
Year FirstQuarter
SecondQuarter
ThirdQuarter
FourthQuarter
AnnualAverage
Not Seasonally Adjusted Data. Number of Jobs 1/
1990 520,000 528,600 525,900 539,300 528,400 1991 537,900 537,300 536,000 545,200 539,100 1992 543,100 544,700 538,700 544,800 542,800 1993 540,000 543,500 532,100 539,600 538,800 1994 535,300 538,100 530,500 540,600 536,100 1995 536,000 536,300 526,100 533,200 532,900 1996 531,300 531,400 525,900 534,300 530,700 1997 532,900 533,400 526,500 533,600 531,600 1998 529,800 533,000 527,800 534,600 531,300 1999 528,300 534,700 532,500 544,600 535,000 2000 542,300 552,300 549,400 561,500 551,400 2001 555,000 558,850 554,150 551,800 554,950 2002 548,300 556,850 555,000 566,900 556,750 2003 564,050 566,550 564,000 575,950 567,650 2004 573,700 581,750 581,150 596,850 583,350 2005 591,900 601,650 601,000 612,250 601,700 2006 608,700 617,100 615,500 626,850 617,050 2007 621,400 625,400 620,700 631,950 624,850 2008 625,300 623,700 613,000 614,800 619,200 2009 599,050 594,700 582,700 589,400 591,500 2010 583,500 587,600 581,200 595,400 586,900 2011 589,500 592,400 588,700 602,900 593,400 2012 596,000 605,900 604,100 619,200 606,300 2013 611,500 617,900 615,000 629,800 618,600 2014 2/ 623,100 626,300 622,800 635,800 627,000 2015 2/ 632,200 636,300 633,500 648,300 637,600 2016 2/ 641,600 645,000 643,600 654,200 646,100 2017 2/ 651,000 652,500 646,100 661,000 652,700 2018 659,800 (NA) (NA) Year-to-Date 659,800
Percentage Change from the Same Period in Previous Year
1991 3.4 1.6 1.9 1.1 2.0 1992 1.0 1.4 0.5 -0.1 0.7 1993 -0.6 -0.2 -1.2 -1.0 -0.7 1994 -0.9 -1.0 -0.3 0.2 -0.5 1995 0.1 -0.3 -0.8 -1.4 -0.6 1996 -0.9 -0.9 0.0 0.2 -0.4 1997 0.3 0.4 0.1 -0.1 0.2 1998 -0.6 -0.1 0.2 0.2 -0.1 1999 -0.3 0.3 0.9 1.9 0.7 2000 2.7 3.3 3.2 3.1 3.1 2001 2.3 1.2 0.9 -1.7 0.6 2002 -1.2 -0.4 0.2 2.7 0.3 2003 2.9 1.7 1.6 1.6 2.0 2004 1.7 2.7 3.0 3.6 2.8 2005 3.2 3.4 3.4 2.6 3.1 2006 2.8 2.6 2.4 2.4 2.6 2007 2.1 1.3 0.8 0.8 1.3 2008 0.6 -0.3 -1.2 -2.7 -0.9 2009 -4.2 -4.6 -4.9 -4.1 -4.5 2010 -2.6 -1.2 -0.3 1.0 -0.8 2011 1.0 0.8 1.3 1.3 1.1 2012 1.1 2.3 2.6 2.7 2.2 2013 2.6 2.0 1.8 1.7 2.0 2014 2/ 1.9 1.4 1.3 1.0 1.4 2015 2/ 1.5 1.6 1.7 2.0 1.7 2016 2/ 1.5 1.4 1.6 0.9 1.3 2017 2/ 1.5 1.2 0.4 1.0 1.0 2018 1.4 (NA) (NA) Year-to-Date 1.4
NA Not available. 1/ Data rounded to nearest 100 for 1990-2000 and 2010-2018, and to 50 for 2001-2009. 2/ Data benchmarked by DLIR in March 2018. 3/ 2014Q2 through 2017 Annual revised from previous QSER. Source: Hawaii Department of Labor & Industrial Relations monthly and annual data <https://www.hiwi.org/gsipub/index.asp?docid=421>. Quarterly and Year-to-Date averages computed by the Hawaii State Department of Business, Economic Development & Tourism.
QSER 2018 Quarter 2, Executive Summary Page 13 of 28 http://dbedt.hawaii.gov/economic/qser/
B. INCOME AND PRICES The U.S. Bureau of Economic Analysis (BEA)
estimates of quarterly GDP (Table B-1 to B-3) show, in the fourth quarter of 2017, total annualized nominal GDP increased $3,707 million or 4.3 percent, from the fourth quarter of 2016. In 2017, total annualized nominal GDP increased $3,232 million or 3.8 percent from the previous year. In the fourth quarter of 2017, total annualized real GDP (in chained 2009 dollar) increased $1,463 million or 2.0 percent from the fourth quarter of 2016. In 2017, total annualized real GDP increased $1,232 million or 1.7 percent from the previous year.
Hawaii’s total personal income increased during he fourth quarter of 2017 over the same quarter of 2016; all major components of personal income increased in the quarter. In dollar terms, the largest increases occurred in wages and salaries, followed by dividends, interest, and rent, personal current transfer receipts, supplements to wages and salaries, and proprietors' income (Table B-4).
In the fourth quarter of 2017, total nominal
annualized personal income (i.e. not adjusted for inflation) increased $2,858.6 million or 4.0 percent over that of 2016 (Table B-5). In 2017, total annualized personal income was $74,144.4 million, an increase of 3.1 percent from the previous year.
In the fourth quarter of 2017, wages and salaries
increased $1,494.8 million or 4.2 percent over that of 2016. This was the 30th consecutive quarterly year-over-year increase since the third quarter of 2010. In 2017, wages and salaries increased 2.8 percent from the previous year (Table B-8).
Supplements to wages and salaries, consisting of
employer payments to retirement plans, private group health insurance plans, private workers compensation plans, and other such benefits, increased $339.4 million or 3.3 percent in the fourth quarter of 2017, from the same quarter of 2016 (Table B-9). In 2017, supplements to wages and salaries increased 2.6 percent from the previous year.
Proprietors' income increased $172.9 million or 3.3
percent in the fourth quarter of 2017, over that of 2016 (Table B-10). In 2017, proprietors’ income was up 3.5 percent from the previous year.
Dividends, interest, and rent increased $656.7 million or 4.3 percent in the fourth quarter of 2017, from the same quarter of 2016. In 2017, income in this category was up 3.4 percent from the previous year (Table B-11).
The annualized personal current transfer receipts
grew by $501.6 million or 4.4 percent in the fourth quarter of 2017 from the same quarter of 2016 (Table B-12). In 2017, personal current transfer receipts increased 4.1 percent from the same period of the previous year.
Contributions to government social insurance, which
is subtracted from total personal income, increased $306.8 million or 5.2 percent in the fourth quarter of 2017, compared to the fourth quarter of 2016. In 2017, contributions to government social insurance increased 3.8 percent from the previous year (Table B-13).
In the fourth quarter of 2017, total non-farm private
sector annualized earnings increased $1,625.5 million or 4.6 percent from the fourth quarter of 2016. In dollar terms, the largest increase occurred in health care and social assistance; followed by accommodation and food services, transportation and warehousing, retail trade, other services, and real estate and rental and leasing. During the fourth quarter of 2017, total government earnings increased $368.1 million or 2.4 percent from the same quarter of 2016. Earnings from the federal government increased $184.1 million or 2.2 percent. Earnings from the state and local governments increased $184.0 million or 2.6 percent in the quarter.
In the second half of 2017, Honolulu’s Consumer
Price Index for Urban Consumers (CPI-U) increased 2.5 percent from the same period in 2016. (Table B-14). This is 0.5 of a percentage point above 2.0 percent increase for the U.S. average CPI-U and is higher than the second half of 2016 Honolulu CPI-U increase of 1.5 percent from the same period of the previous year. In the second half of 2017, the Honolulu CPI-U increased the most in Housing (3.6 percent), followed by Food and Beverages (2.9 percent), Transportation (2.8 percent), Medical Care (2.0 percent), Apparel (1.5 percent), Other Goods and Services (0.5 percent), and Recreation (0.5 percent). The price of Education and Communication decreased 3.6 percent compared to the second half of 2016.
QSER 2018 Quarter 2, Executive Summary Page 14 of 28 http://dbedt.hawaii.gov/economic/qser/
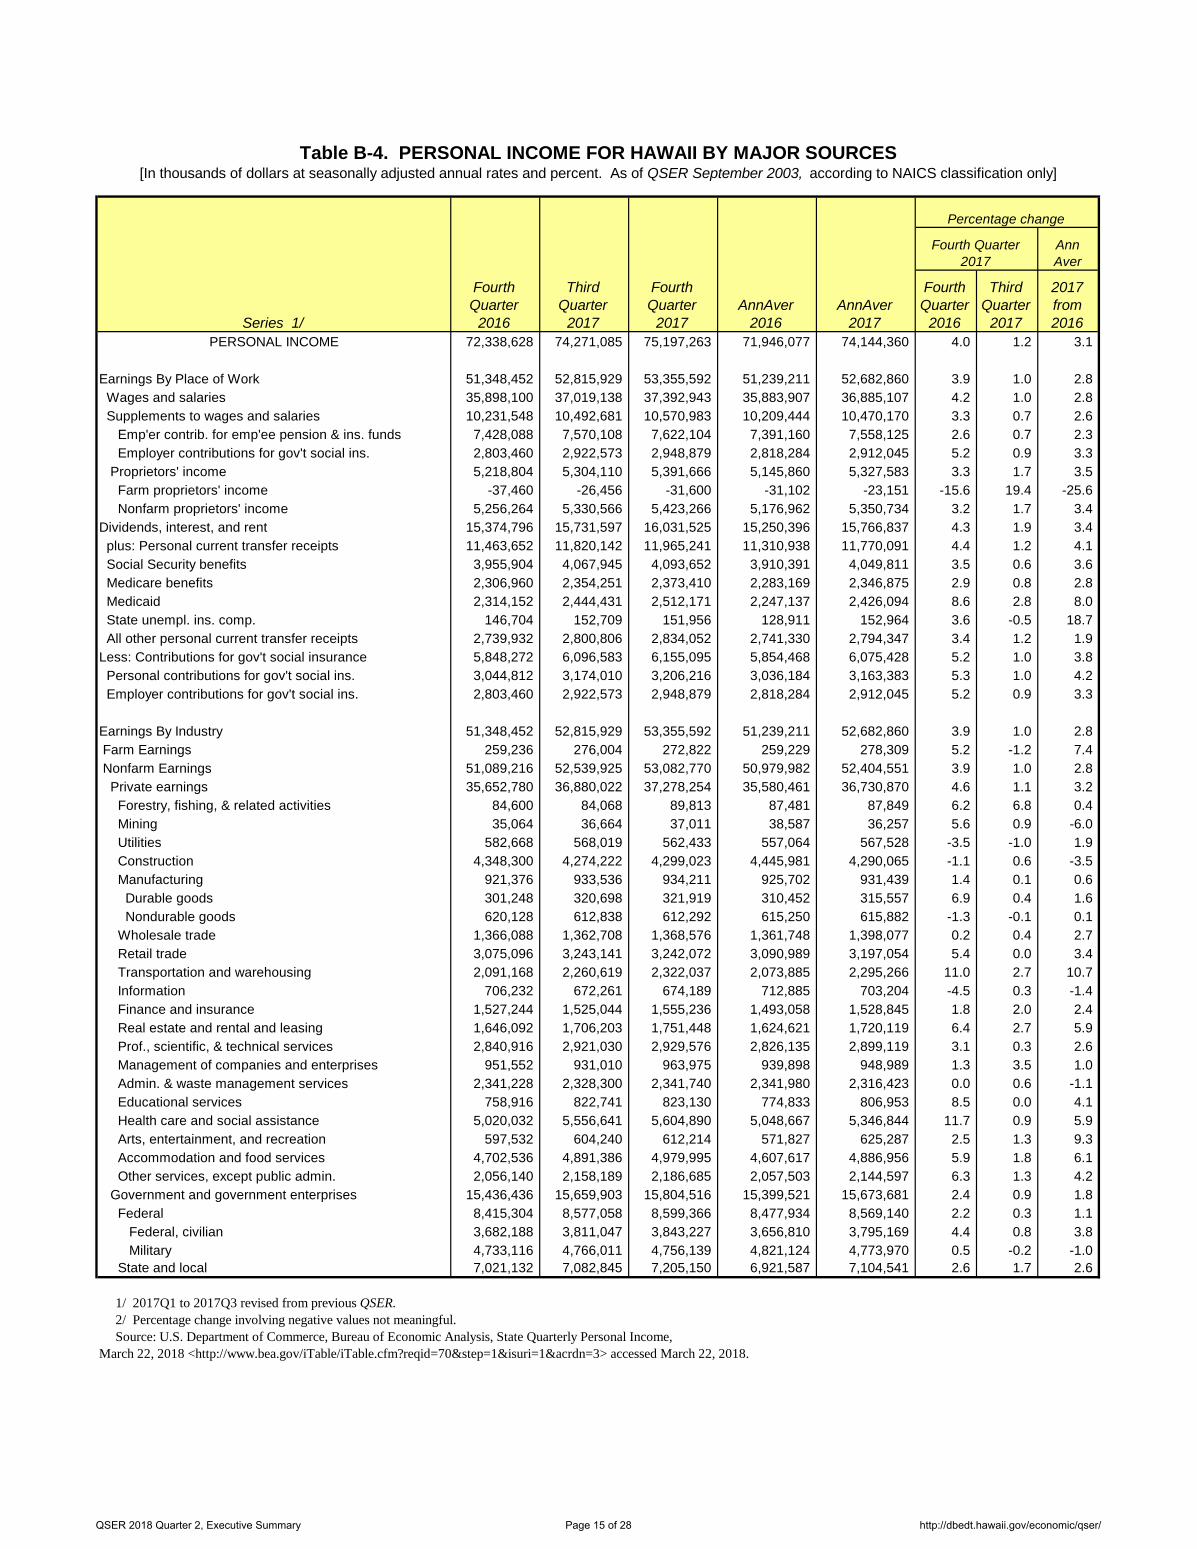
Table B-4. PERSONAL INCOME FOR HAWAII BY MAJOR SOURCES[In thousands of dollars at seasonally adjusted annual rates and percent. As of QSER September 2003, according to NAICS classification only]
Fourth Quarter 2017
AnnAver
Series 1/
Fourth Quarter
2016
Third Quarter
2017
Fourth Quarter
2017AnnAver
2016AnnAver
2017
Fourth Quarter
2016
Third Quarter
2017
2017 from 2016
PERSONAL INCOME 72,338,628 74,271,085 75,197,263 71,946,077 74,144,360 4.0 1.2 3.1
Earnings By Place of Work 51,348,452 52,815,929 53,355,592 51,239,211 52,682,860 3.9 1.0 2.8 Wages and salaries 35,898,100 37,019,138 37,392,943 35,883,907 36,885,107 4.2 1.0 2.8 Supplements to wages and salaries 10,231,548 10,492,681 10,570,983 10,209,444 10,470,170 3.3 0.7 2.6
Emp'er contrib. for emp'ee pension & ins. funds 7,428,088 7,570,108 7,622,104 7,391,160 7,558,125 2.6 0.7 2.3 Employer contributions for gov't social ins. 2,803,460 2,922,573 2,948,879 2,818,284 2,912,045 5.2 0.9 3.3
Proprietors' income 5,218,804 5,304,110 5,391,666 5,145,860 5,327,583 3.3 1.7 3.5 Farm proprietors' income -37,460 -26,456 -31,600 -31,102 -23,151 -15.6 19.4 -25.6 Nonfarm proprietors' income 5,256,264 5,330,566 5,423,266 5,176,962 5,350,734 3.2 1.7 3.4 Dividends, interest, and rent 15,374,796 15,731,597 16,031,525 15,250,396 15,766,837 4.3 1.9 3.4 plus: Personal current transfer receipts 11,463,652 11,820,142 11,965,241 11,310,938 11,770,091 4.4 1.2 4.1 Social Security benefits 3,955,904 4,067,945 4,093,652 3,910,391 4,049,811 3.5 0.6 3.6 Medicare benefits 2,306,960 2,354,251 2,373,410 2,283,169 2,346,875 2.9 0.8 2.8 Medicaid 2,314,152 2,444,431 2,512,171 2,247,137 2,426,094 8.6 2.8 8.0 State unempl. ins. comp. 146,704 152,709 151,956 128,911 152,964 3.6 -0.5 18.7 All other personal current transfer receipts 2,739,932 2,800,806 2,834,052 2,741,330 2,794,347 3.4 1.2 1.9 Less: Contributions for gov't social insurance 5,848,272 6,096,583 6,155,095 5,854,468 6,075,428 5.2 1.0 3.8 Personal contributions for gov't social ins. 3,044,812 3,174,010 3,206,216 3,036,184 3,163,383 5.3 1.0 4.2 Employer contributions for gov't social ins. 2,803,460 2,922,573 2,948,879 2,818,284 2,912,045 5.2 0.9 3.3
Earnings By Industry 51,348,452 52,815,929 53,355,592 51,239,211 52,682,860 3.9 1.0 2.8 Farm Earnings 259,236 276,004 272,822 259,229 278,309 5.2 -1.2 7.4 Nonfarm Earnings 51,089,216 52,539,925 53,082,770 50,979,982 52,404,551 3.9 1.0 2.8 Private earnings 35,652,780 36,880,022 37,278,254 35,580,461 36,730,870 4.6 1.1 3.2 Forestry, fishing, & related activities 84,600 84,068 89,813 87,481 87,849 6.2 6.8 0.4 Mining 35,064 36,664 37,011 38,587 36,257 5.6 0.9 -6.0 Utilities 582,668 568,019 562,433 557,064 567,528 -3.5 -1.0 1.9 Construction 4,348,300 4,274,222 4,299,023 4,445,981 4,290,065 -1.1 0.6 -3.5 Manufacturing 921,376 933,536 934,211 925,702 931,439 1.4 0.1 0.6 Durable goods 301,248 320,698 321,919 310,452 315,557 6.9 0.4 1.6 Nondurable goods 620,128 612,838 612,292 615,250 615,882 -1.3 -0.1 0.1 Wholesale trade 1,366,088 1,362,708 1,368,576 1,361,748 1,398,077 0.2 0.4 2.7 Retail trade 3,075,096 3,243,141 3,242,072 3,090,989 3,197,054 5.4 0.0 3.4 Transportation and warehousing 2,091,168 2,260,619 2,322,037 2,073,885 2,295,266 11.0 2.7 10.7 Information 706,232 672,261 674,189 712,885 703,204 -4.5 0.3 -1.4 Finance and insurance 1,527,244 1,525,044 1,555,236 1,493,058 1,528,845 1.8 2.0 2.4 Real estate and rental and leasing 1,646,092 1,706,203 1,751,448 1,624,621 1,720,119 6.4 2.7 5.9 Prof., scientific, & technical services 2,840,916 2,921,030 2,929,576 2,826,135 2,899,119 3.1 0.3 2.6 Management of companies and enterprises 951,552 931,010 963,975 939,898 948,989 1.3 3.5 1.0 Admin. & waste management services 2,341,228 2,328,300 2,341,740 2,341,980 2,316,423 0.0 0.6 -1.1 Educational services 758,916 822,741 823,130 774,833 806,953 8.5 0.0 4.1 Health care and social assistance 5,020,032 5,556,641 5,604,890 5,048,667 5,346,844 11.7 0.9 5.9 Arts, entertainment, and recreation 597,532 604,240 612,214 571,827 625,287 2.5 1.3 9.3 Accommodation and food services 4,702,536 4,891,386 4,979,995 4,607,617 4,886,956 5.9 1.8 6.1 Other services, except public admin. 2,056,140 2,158,189 2,186,685 2,057,503 2,144,597 6.3 1.3 4.2 Government and government enterprises 15,436,436 15,659,903 15,804,516 15,399,521 15,673,681 2.4 0.9 1.8 Federal 8,415,304 8,577,058 8,599,366 8,477,934 8,569,140 2.2 0.3 1.1
Federal, civilian 3,682,188 3,811,047 3,843,227 3,656,810 3,795,169 4.4 0.8 3.8 Military 4,733,116 4,766,011 4,756,139 4,821,124 4,773,970 0.5 -0.2 -1.0
State and local 7,021,132 7,082,845 7,205,150 6,921,587 7,104,541 2.6 1.7 2.6
1/ 2017Q1 to 2017Q3 revised from previous QSER. 2/ Percentage change involving negative values not meaningful. Source: U.S. Department of Commerce, Bureau of Economic Analysis, State Quarterly Personal Income, March 22, 2018 <http://www.bea.gov/iTable/iTable.cfm?reqid=70&step=1&isuri=1&acrdn=3> accessed March 22, 2018.
Percentage change
QSER 2018 Quarter 2, Executive Summary Page 15 of 28 http://dbedt.hawaii.gov/economic/qser/
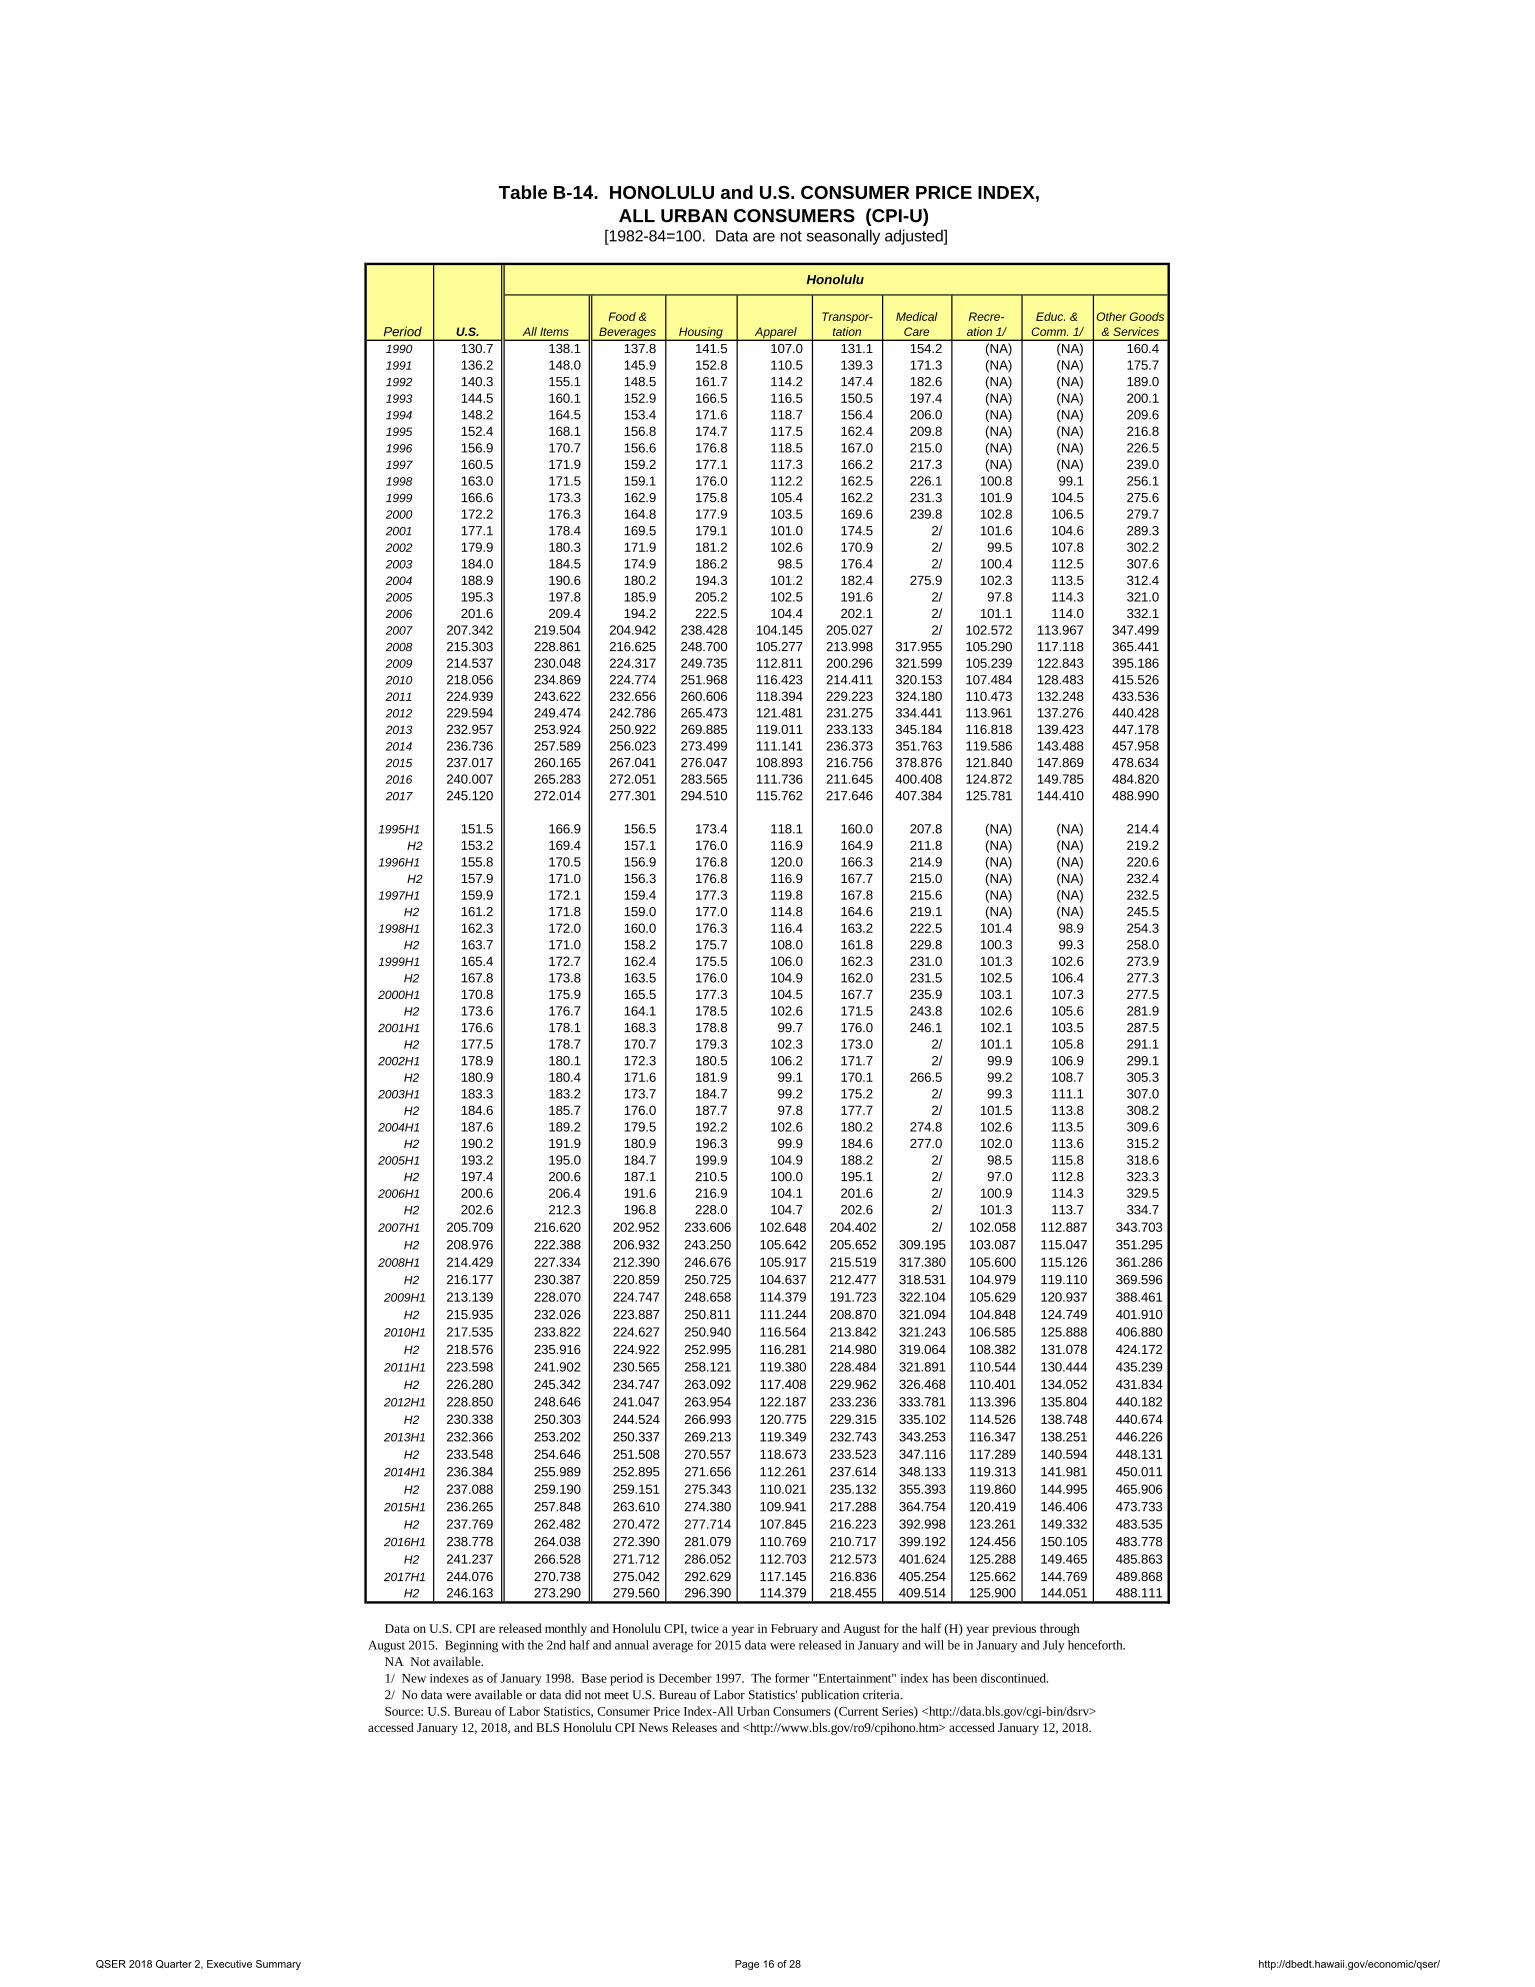
Table B-14. HONOLULU and U.S. CONSUMER PRICE INDEX,ALL URBAN CONSUMERS (CPI-U)
[1982-84=100. Data are not seasonally adjusted]
Honolulu
Period U.S. All ItemsFood &
Beverages Housing ApparelTranspor-
tationMedical
CareRecre- ation 1/
Educ. & Comm. 1/
Other Goods & Services
1990 130.7 138.1 137.8 141.5 107.0 131.1 154.2 (NA) (NA) 160.4 1991 136.2 148.0 145.9 152.8 110.5 139.3 171.3 (NA) (NA) 175.7 1992 140.3 155.1 148.5 161.7 114.2 147.4 182.6 (NA) (NA) 189.0 1993 144.5 160.1 152.9 166.5 116.5 150.5 197.4 (NA) (NA) 200.1 1994 148.2 164.5 153.4 171.6 118.7 156.4 206.0 (NA) (NA) 209.6 1995 152.4 168.1 156.8 174.7 117.5 162.4 209.8 (NA) (NA) 216.8 1996 156.9 170.7 156.6 176.8 118.5 167.0 215.0 (NA) (NA) 226.5 1997 160.5 171.9 159.2 177.1 117.3 166.2 217.3 (NA) (NA) 239.0 1998 163.0 171.5 159.1 176.0 112.2 162.5 226.1 100.8 99.1 256.1 1999 166.6 173.3 162.9 175.8 105.4 162.2 231.3 101.9 104.5 275.6 2000 172.2 176.3 164.8 177.9 103.5 169.6 239.8 102.8 106.5 279.7 2001 177.1 178.4 169.5 179.1 101.0 174.5 2/ 101.6 104.6 289.3 2002 179.9 180.3 171.9 181.2 102.6 170.9 2/ 99.5 107.8 302.2 2003 184.0 184.5 174.9 186.2 98.5 176.4 2/ 100.4 112.5 307.6 2004 188.9 190.6 180.2 194.3 101.2 182.4 275.9 102.3 113.5 312.4 2005 195.3 197.8 185.9 205.2 102.5 191.6 2/ 97.8 114.3 321.0 2006 201.6 209.4 194.2 222.5 104.4 202.1 2/ 101.1 114.0 332.1 2007 207.342 219.504 204.942 238.428 104.145 205.027 2/ 102.572 113.967 347.499 2008 215.303 228.861 216.625 248.700 105.277 213.998 317.955 105.290 117.118 365.441 2009 214.537 230.048 224.317 249.735 112.811 200.296 321.599 105.239 122.843 395.186 2010 218.056 234.869 224.774 251.968 116.423 214.411 320.153 107.484 128.483 415.526 2011 224.939 243.622 232.656 260.606 118.394 229.223 324.180 110.473 132.248 433.536 2012 229.594 249.474 242.786 265.473 121.481 231.275 334.441 113.961 137.276 440.428 2013 232.957 253.924 250.922 269.885 119.011 233.133 345.184 116.818 139.423 447.178 2014 236.736 257.589 256.023 273.499 111.141 236.373 351.763 119.586 143.488 457.958 2015 237.017 260.165 267.041 276.047 108.893 216.756 378.876 121.840 147.869 478.634 2016 240.007 265.283 272.051 283.565 111.736 211.645 400.408 124.872 149.785 484.820 2017 245.120 272.014 277.301 294.510 115.762 217.646 407.384 125.781 144.410 488.990
1995H1 151.5 166.9 156.5 173.4 118.1 160.0 207.8 (NA) (NA) 214.4 H2 153.2 169.4 157.1 176.0 116.9 164.9 211.8 (NA) (NA) 219.2
1996H1 155.8 170.5 156.9 176.8 120.0 166.3 214.9 (NA) (NA) 220.6 H2 157.9 171.0 156.3 176.8 116.9 167.7 215.0 (NA) (NA) 232.4
1997H1 159.9 172.1 159.4 177.3 119.8 167.8 215.6 (NA) (NA) 232.5 H2 161.2 171.8 159.0 177.0 114.8 164.6 219.1 (NA) (NA) 245.5
1998H1 162.3 172.0 160.0 176.3 116.4 163.2 222.5 101.4 98.9 254.3 H2 163.7 171.0 158.2 175.7 108.0 161.8 229.8 100.3 99.3 258.0
1999H1 165.4 172.7 162.4 175.5 106.0 162.3 231.0 101.3 102.6 273.9 H2 167.8 173.8 163.5 176.0 104.9 162.0 231.5 102.5 106.4 277.3
2000H1 170.8 175.9 165.5 177.3 104.5 167.7 235.9 103.1 107.3 277.5 H2 173.6 176.7 164.1 178.5 102.6 171.5 243.8 102.6 105.6 281.9
2001H1 176.6 178.1 168.3 178.8 99.7 176.0 246.1 102.1 103.5 287.5 H2 177.5 178.7 170.7 179.3 102.3 173.0 2/ 101.1 105.8 291.1
2002H1 178.9 180.1 172.3 180.5 106.2 171.7 2/ 99.9 106.9 299.1 H2 180.9 180.4 171.6 181.9 99.1 170.1 266.5 99.2 108.7 305.3
2003H1 183.3 183.2 173.7 184.7 99.2 175.2 2/ 99.3 111.1 307.0 H2 184.6 185.7 176.0 187.7 97.8 177.7 2/ 101.5 113.8 308.2
2004H1 187.6 189.2 179.5 192.2 102.6 180.2 274.8 102.6 113.5 309.6 H2 190.2 191.9 180.9 196.3 99.9 184.6 277.0 102.0 113.6 315.2
2005H1 193.2 195.0 184.7 199.9 104.9 188.2 2/ 98.5 115.8 318.6 H2 197.4 200.6 187.1 210.5 100.0 195.1 2/ 97.0 112.8 323.3
2006H1 200.6 206.4 191.6 216.9 104.1 201.6 2/ 100.9 114.3 329.5 H2 202.6 212.3 196.8 228.0 104.7 202.6 2/ 101.3 113.7 334.7
2007H1 205.709 216.620 202.952 233.606 102.648 204.402 2/ 102.058 112.887 343.703 H2 208.976 222.388 206.932 243.250 105.642 205.652 309.195 103.087 115.047 351.295
2008H1 214.429 227.334 212.390 246.676 105.917 215.519 317.380 105.600 115.126 361.286 H2 216.177 230.387 220.859 250.725 104.637 212.477 318.531 104.979 119.110 369.596
2009H1 213.139 228.070 224.747 248.658 114.379 191.723 322.104 105.629 120.937 388.461 H2 215.935 232.026 223.887 250.811 111.244 208.870 321.094 104.848 124.749 401.910
2010H1 217.535 233.822 224.627 250.940 116.564 213.842 321.243 106.585 125.888 406.880 H2 218.576 235.916 224.922 252.995 116.281 214.980 319.064 108.382 131.078 424.172
2011H1 223.598 241.902 230.565 258.121 119.380 228.484 321.891 110.544 130.444 435.239 H2 226.280 245.342 234.747 263.092 117.408 229.962 326.468 110.401 134.052 431.834
2012H1 228.850 248.646 241.047 263.954 122.187 233.236 333.781 113.396 135.804 440.182 H2 230.338 250.303 244.524 266.993 120.775 229.315 335.102 114.526 138.748 440.674
2013H1 232.366 253.202 250.337 269.213 119.349 232.743 343.253 116.347 138.251 446.226 H2 233.548 254.646 251.508 270.557 118.673 233.523 347.116 117.289 140.594 448.131
2014H1 236.384 255.989 252.895 271.656 112.261 237.614 348.133 119.313 141.981 450.011 H2 237.088 259.190 259.151 275.343 110.021 235.132 355.393 119.860 144.995 465.906
2015H1 236.265 257.848 263.610 274.380 109.941 217.288 364.754 120.419 146.406 473.733 H2 237.769 262.482 270.472 277.714 107.845 216.223 392.998 123.261 149.332 483.535
2016H1 238.778 264.038 272.390 281.079 110.769 210.717 399.192 124.456 150.105 483.778 H2 241.237 266.528 271.712 286.052 112.703 212.573 401.624 125.288 149.465 485.863
2017H1 244.076 270.738 275.042 292.629 117.145 216.836 405.254 125.662 144.769 489.868 H2 246.163 273.290 279.560 296.390 114.379 218.455 409.514 125.900 144.051 488.111
Data on U.S. CPI are released monthly and Honolulu CPI, twice a year in February and August for the half (H) year previous through August 2015. Beginning with the 2nd half and annual average for 2015 data were released in January and will be in January and July henceforth. NA Not available. 1/ New indexes as of January 1998. Base period is December 1997. The former "Entertainment" index has been discontinued. 2/ No data were available or data did not meet U.S. Bureau of Labor Statistics' publication criteria. Source: U.S. Bureau of Labor Statistics, Consumer Price Index-All Urban Consumers (Current Series) <http://data.bls.gov/cgi-bin/dsrv> accessed January 12, 2018, and BLS Honolulu CPI News Releases and <http://www.bls.gov/ro9/cpihono.htm> accessed January 12, 2018.
QSER 2018 Quarter 2, Executive Summary Page 16 of 28 http://dbedt.hawaii.gov/economic/qser/
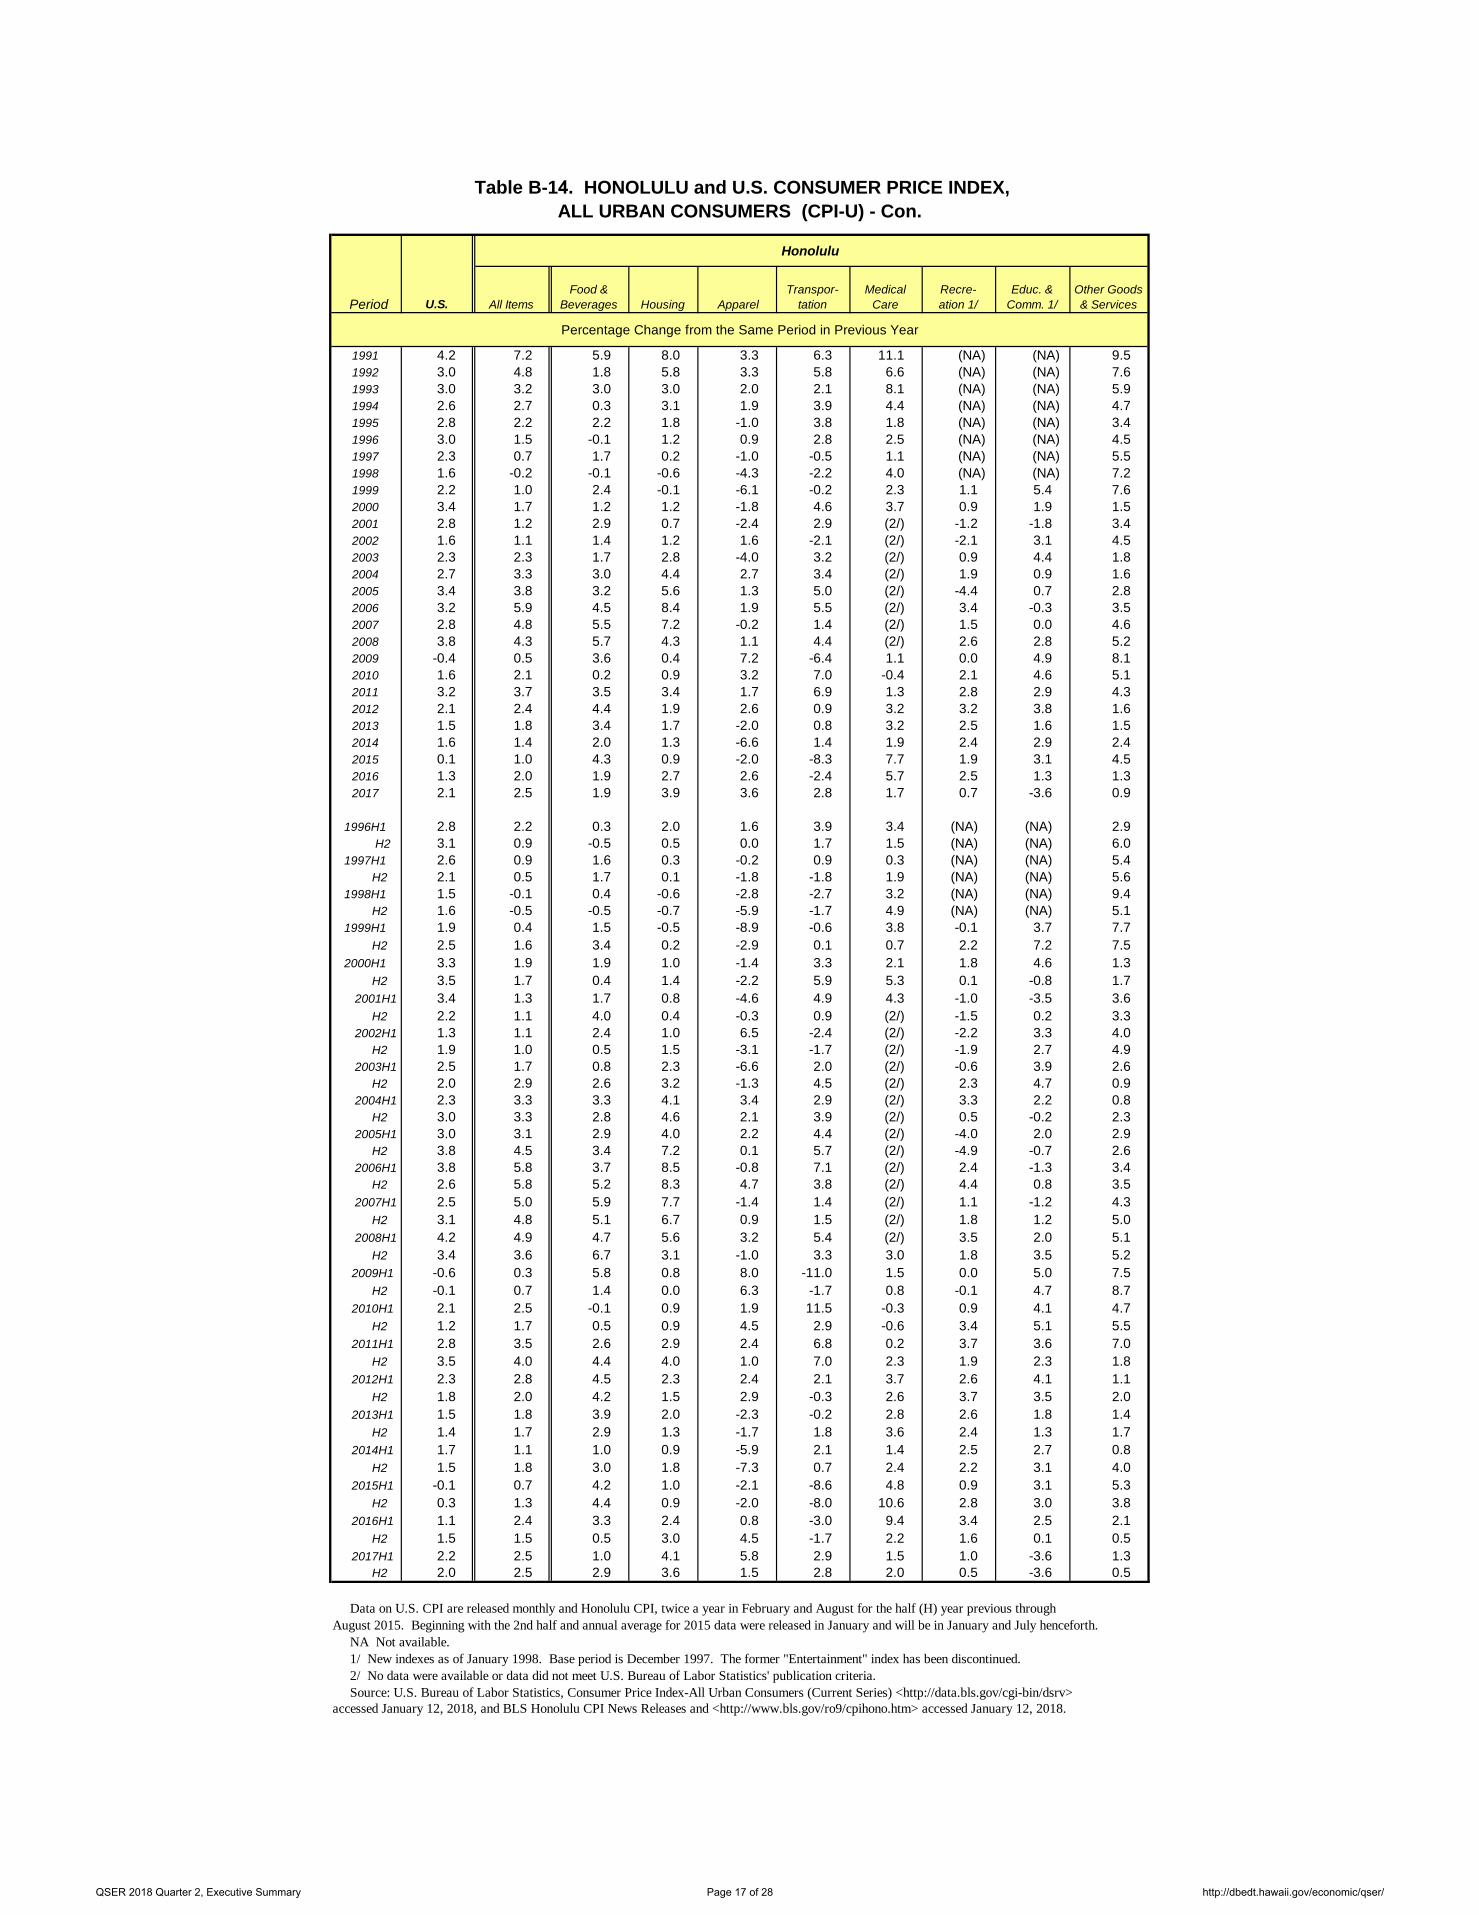
Table B-14. HONOLULU and U.S. CONSUMER PRICE INDEX, ALL URBAN CONSUMERS (CPI-U) - Con.
Honolulu
Period U.S. All ItemsFood &
Beverages Housing ApparelTranspor-
tationMedical
CareRecre- ation 1/
Educ. & Comm. 1/
Other Goods & Services
Percentage Change from the Same Period in Previous Year
1991 4.2 7.2 5.9 8.0 3.3 6.3 11.1 (NA) (NA) 9.5 1992 3.0 4.8 1.8 5.8 3.3 5.8 6.6 (NA) (NA) 7.6 1993 3.0 3.2 3.0 3.0 2.0 2.1 8.1 (NA) (NA) 5.9 1994 2.6 2.7 0.3 3.1 1.9 3.9 4.4 (NA) (NA) 4.7 1995 2.8 2.2 2.2 1.8 -1.0 3.8 1.8 (NA) (NA) 3.4 1996 3.0 1.5 -0.1 1.2 0.9 2.8 2.5 (NA) (NA) 4.5 1997 2.3 0.7 1.7 0.2 -1.0 -0.5 1.1 (NA) (NA) 5.5 1998 1.6 -0.2 -0.1 -0.6 -4.3 -2.2 4.0 (NA) (NA) 7.2 1999 2.2 1.0 2.4 -0.1 -6.1 -0.2 2.3 1.1 5.4 7.6 2000 3.4 1.7 1.2 1.2 -1.8 4.6 3.7 0.9 1.9 1.5 2001 2.8 1.2 2.9 0.7 -2.4 2.9 (2/) -1.2 -1.8 3.4 2002 1.6 1.1 1.4 1.2 1.6 -2.1 (2/) -2.1 3.1 4.5 2003 2.3 2.3 1.7 2.8 -4.0 3.2 (2/) 0.9 4.4 1.8 2004 2.7 3.3 3.0 4.4 2.7 3.4 (2/) 1.9 0.9 1.6 2005 3.4 3.8 3.2 5.6 1.3 5.0 (2/) -4.4 0.7 2.8 2006 3.2 5.9 4.5 8.4 1.9 5.5 (2/) 3.4 -0.3 3.5 2007 2.8 4.8 5.5 7.2 -0.2 1.4 (2/) 1.5 0.0 4.6 2008 3.8 4.3 5.7 4.3 1.1 4.4 (2/) 2.6 2.8 5.2 2009 -0.4 0.5 3.6 0.4 7.2 -6.4 1.1 0.0 4.9 8.1 2010 1.6 2.1 0.2 0.9 3.2 7.0 -0.4 2.1 4.6 5.1 2011 3.2 3.7 3.5 3.4 1.7 6.9 1.3 2.8 2.9 4.3 2012 2.1 2.4 4.4 1.9 2.6 0.9 3.2 3.2 3.8 1.6 2013 1.5 1.8 3.4 1.7 -2.0 0.8 3.2 2.5 1.6 1.5 2014 1.6 1.4 2.0 1.3 -6.6 1.4 1.9 2.4 2.9 2.4 2015 0.1 1.0 4.3 0.9 -2.0 -8.3 7.7 1.9 3.1 4.5 2016 1.3 2.0 1.9 2.7 2.6 -2.4 5.7 2.5 1.3 1.3 2017 2.1 2.5 1.9 3.9 3.6 2.8 1.7 0.7 -3.6 0.9
1996H1 2.8 2.2 0.3 2.0 1.6 3.9 3.4 (NA) (NA) 2.9 H2 3.1 0.9 -0.5 0.5 0.0 1.7 1.5 (NA) (NA) 6.0
1997H1 2.6 0.9 1.6 0.3 -0.2 0.9 0.3 (NA) (NA) 5.4 H2 2.1 0.5 1.7 0.1 -1.8 -1.8 1.9 (NA) (NA) 5.6
1998H1 1.5 -0.1 0.4 -0.6 -2.8 -2.7 3.2 (NA) (NA) 9.4 H2 1.6 -0.5 -0.5 -0.7 -5.9 -1.7 4.9 (NA) (NA) 5.1
1999H1 1.9 0.4 1.5 -0.5 -8.9 -0.6 3.8 -0.1 3.7 7.7 H2 2.5 1.6 3.4 0.2 -2.9 0.1 0.7 2.2 7.2 7.5
2000H1 3.3 1.9 1.9 1.0 -1.4 3.3 2.1 1.8 4.6 1.3 H2 3.5 1.7 0.4 1.4 -2.2 5.9 5.3 0.1 -0.8 1.7
2001H1 3.4 1.3 1.7 0.8 -4.6 4.9 4.3 -1.0 -3.5 3.6 H2 2.2 1.1 4.0 0.4 -0.3 0.9 (2/) -1.5 0.2 3.3
2002H1 1.3 1.1 2.4 1.0 6.5 -2.4 (2/) -2.2 3.3 4.0 H2 1.9 1.0 0.5 1.5 -3.1 -1.7 (2/) -1.9 2.7 4.9
2003H1 2.5 1.7 0.8 2.3 -6.6 2.0 (2/) -0.6 3.9 2.6 H2 2.0 2.9 2.6 3.2 -1.3 4.5 (2/) 2.3 4.7 0.9
2004H1 2.3 3.3 3.3 4.1 3.4 2.9 (2/) 3.3 2.2 0.8 H2 3.0 3.3 2.8 4.6 2.1 3.9 (2/) 0.5 -0.2 2.3
2005H1 3.0 3.1 2.9 4.0 2.2 4.4 (2/) -4.0 2.0 2.9 H2 3.8 4.5 3.4 7.2 0.1 5.7 (2/) -4.9 -0.7 2.6
2006H1 3.8 5.8 3.7 8.5 -0.8 7.1 (2/) 2.4 -1.3 3.4 H2 2.6 5.8 5.2 8.3 4.7 3.8 (2/) 4.4 0.8 3.5
2007H1 2.5 5.0 5.9 7.7 -1.4 1.4 (2/) 1.1 -1.2 4.3 H2 3.1 4.8 5.1 6.7 0.9 1.5 (2/) 1.8 1.2 5.0
2008H1 4.2 4.9 4.7 5.6 3.2 5.4 (2/) 3.5 2.0 5.1 H2 3.4 3.6 6.7 3.1 -1.0 3.3 3.0 1.8 3.5 5.2
2009H1 -0.6 0.3 5.8 0.8 8.0 -11.0 1.5 0.0 5.0 7.5 H2 -0.1 0.7 1.4 0.0 6.3 -1.7 0.8 -0.1 4.7 8.7
2010H1 2.1 2.5 -0.1 0.9 1.9 11.5 -0.3 0.9 4.1 4.7 H2 1.2 1.7 0.5 0.9 4.5 2.9 -0.6 3.4 5.1 5.5
2011H1 2.8 3.5 2.6 2.9 2.4 6.8 0.2 3.7 3.6 7.0 H2 3.5 4.0 4.4 4.0 1.0 7.0 2.3 1.9 2.3 1.8
2012H1 2.3 2.8 4.5 2.3 2.4 2.1 3.7 2.6 4.1 1.1 H2 1.8 2.0 4.2 1.5 2.9 -0.3 2.6 3.7 3.5 2.0
2013H1 1.5 1.8 3.9 2.0 -2.3 -0.2 2.8 2.6 1.8 1.4 H2 1.4 1.7 2.9 1.3 -1.7 1.8 3.6 2.4 1.3 1.7
2014H1 1.7 1.1 1.0 0.9 -5.9 2.1 1.4 2.5 2.7 0.8 H2 1.5 1.8 3.0 1.8 -7.3 0.7 2.4 2.2 3.1 4.0
2015H1 -0.1 0.7 4.2 1.0 -2.1 -8.6 4.8 0.9 3.1 5.3 H2 0.3 1.3 4.4 0.9 -2.0 -8.0 10.6 2.8 3.0 3.8
2016H1 1.1 2.4 3.3 2.4 0.8 -3.0 9.4 3.4 2.5 2.1 H2 1.5 1.5 0.5 3.0 4.5 -1.7 2.2 1.6 0.1 0.5
2017H1 2.2 2.5 1.0 4.1 5.8 2.9 1.5 1.0 -3.6 1.3 H2 2.0 2.5 2.9 3.6 1.5 2.8 2.0 0.5 -3.6 0.5
Data on U.S. CPI are released monthly and Honolulu CPI, twice a year in February and August for the half (H) year previous through August 2015. Beginning with the 2nd half and annual average for 2015 data were released in January and will be in January and July henceforth. NA Not available. 1/ New indexes as of January 1998. Base period is December 1997. The former "Entertainment" index has been discontinued. 2/ No data were available or data did not meet U.S. Bureau of Labor Statistics' publication criteria. Source: U.S. Bureau of Labor Statistics, Consumer Price Index-All Urban Consumers (Current Series) <http://data.bls.gov/cgi-bin/dsrv> accessed January 12, 2018, and BLS Honolulu CPI News Releases and <http://www.bls.gov/ro9/cpihono.htm> accessed January 12, 2018.
QSER 2018 Quarter 2, Executive Summary Page 17 of 28 http://dbedt.hawaii.gov/economic/qser/
C. TAX REVENUES
The State general fund tax revenues increased in the first quarter of 2018 compared to the same quarter of 2017.1 The GET increased the most in the quarter in dollar terms, followed by the Transient Accommodations Tax (TAT), and the Net Corporate Income Tax. The Net Individual Income Tax decreased in the quarter.
In the first quarter of 2018, total tax
collections distributed to the State general fund totaled $1,705.8 million, an increase of $130.2 million or 8.3 percent over the same quarter of 2017 (Tables C-1 and C-2). In 2017, State general fund tax revenues were up $270.1 million or 4.3 percent over the previous year.
During the first quarter of 2018, GET revenues (excluding the Honolulu County Surcharge) totaled $959.1 million, an increase of $127.2 million or 15.3 percent over the same quarter of 2017 (Table C-3). In 2017, GET revenues increased $144.1 million or 4.5 percent from the previous year.
Compared to the first quarter of 2017, Net Individual Income Tax revenues decreased $43.0 million or 7.7 percent to $513.4 million in the first quarter of 2018 (Table C-4). In the first quarter of 2018, Declaration of Estimated Taxes decreased $4.3 million or 2.4 percent (Table
1 When interpreting tax figures in conjunction with other quarterly data in this report, it should be kept in mind that the tax data represent collections during the quarter. The transactions on which the taxes were paid did not necessarily take place during the quarter.
C-5), Payments with Returns increased $2.5 million or 10.0 percent (Table C-6), Revenues from Withholding Tax on Wages decreased $57.4 million or 10.9 percent (Table C-7), and Refunds decreased $16.1 million or 9.4 percent (Table C-8). In 2017, Net Individual Income Tax collections increased $167.7 million or 7.9 percent from the previous year.
Net Corporate Income Tax revenues, which tend to be volatile in nature, increased from negative $31.9 million in the first quarter of 2017 to positive $14.6 million in the first quarter of 2018 (Table C-9). In the first quarter of 2018, the Declaration of Estimated Taxes decreased $11.2 million or 33.6 percent (Table C-10), the Payment with Returns decreased from $3.8 million to -0.4 million (Table C-11), and the Refunds decreased $61.9 million or 89.6 percent (Table C-12), compared with the same quarter of 2017. In 2017, Net Corporate Income Tax revenues decreased $47.6 million or 53.0 percent from the previous year.
In the first quarter of 2018, Transient Accommodations Tax (TAT) revenues increased $16.7 million or 12.0 percent compared to the same quarter of 2017 (Table C-13). In 2017, TAT revenues increased $20.3 million or 4.2 percent from the previous year.
QSER 2018 Quarter 2, Executive Summary Page 18 of 28 http://dbedt.hawaii.gov/economic/qser/
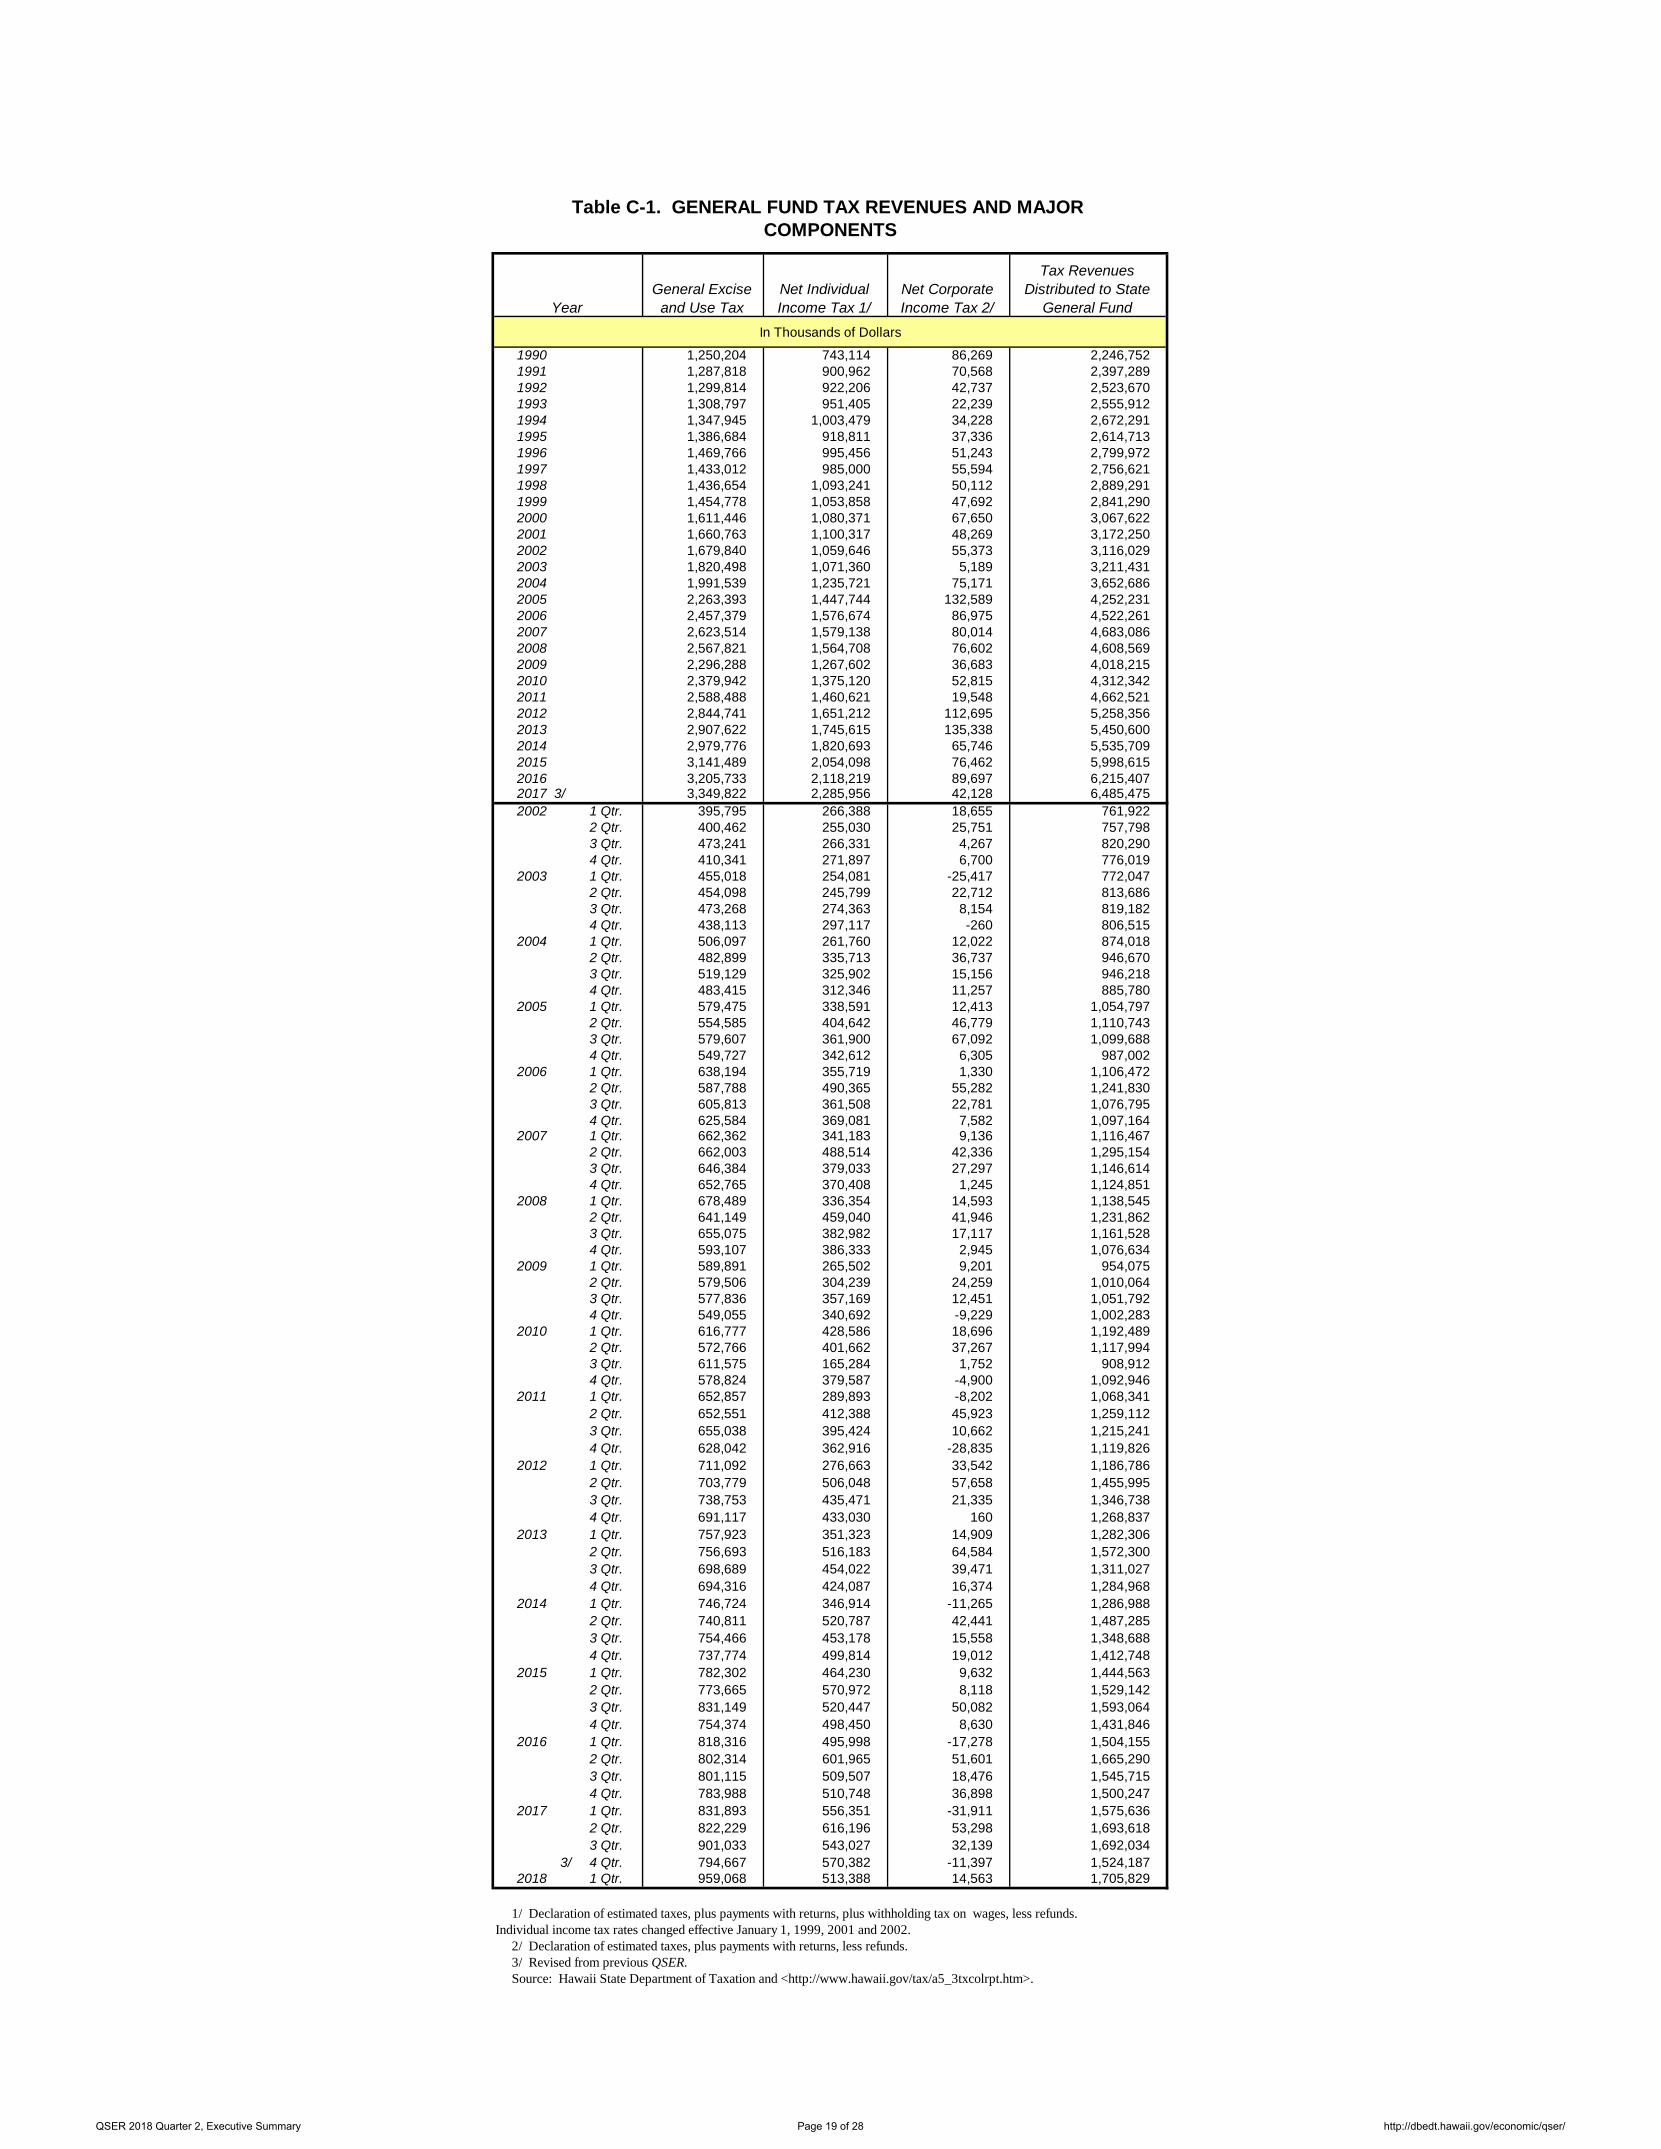
Table C-1. GENERAL FUND TAX REVENUES AND MAJOR COMPONENTS
YearGeneral Excise
and Use TaxNet IndividualIncome Tax 1/
Net CorporateIncome Tax 2/
Tax Revenues Distributed to State
General FundIn Thousands of Dollars
1990 1,250,204 743,114 86,269 2,246,752 1991 1,287,818 900,962 70,568 2,397,289 1992 1,299,814 922,206 42,737 2,523,670 1993 1,308,797 951,405 22,239 2,555,912 1994 1,347,945 1,003,479 34,228 2,672,291 1995 1,386,684 918,811 37,336 2,614,713 1996 1,469,766 995,456 51,243 2,799,972 1997 1,433,012 985,000 55,594 2,756,621 1998 1,436,654 1,093,241 50,112 2,889,291 1999 1,454,778 1,053,858 47,692 2,841,290 2000 1,611,446 1,080,371 67,650 3,067,622 2001 1,660,763 1,100,317 48,269 3,172,250 2002 1,679,840 1,059,646 55,373 3,116,029 2003 1,820,498 1,071,360 5,189 3,211,431 2004 1,991,539 1,235,721 75,171 3,652,686 2005 2,263,393 1,447,744 132,589 4,252,231 2006 2,457,379 1,576,674 86,975 4,522,261 2007 2,623,514 1,579,138 80,014 4,683,086 2008 2,567,821 1,564,708 76,602 4,608,569 2009 2,296,288 1,267,602 36,683 4,018,215 2010 2,379,942 1,375,120 52,815 4,312,342 2011 2,588,488 1,460,621 19,548 4,662,521 2012 2,844,741 1,651,212 112,695 5,258,356 2013 2,907,622 1,745,615 135,338 5,450,600 2014 2,979,776 1,820,693 65,746 5,535,709 2015 3,141,489 2,054,098 76,462 5,998,615 2016 3,205,733 2,118,219 89,697 6,215,407 2017 3/ 3,349,822 2,285,956 42,128 6,485,475 2002 1 Qtr. 395,795 266,388 18,655 761,922
2 Qtr. 400,462 255,030 25,751 757,798 3 Qtr. 473,241 266,331 4,267 820,290 4 Qtr. 410,341 271,897 6,700 776,019
2003 1 Qtr. 455,018 254,081 -25,417 772,047 2 Qtr. 454,098 245,799 22,712 813,686 3 Qtr. 473,268 274,363 8,154 819,182 4 Qtr. 438,113 297,117 -260 806,515
2004 1 Qtr. 506,097 261,760 12,022 874,018 2 Qtr. 482,899 335,713 36,737 946,670 3 Qtr. 519,129 325,902 15,156 946,218 4 Qtr. 483,415 312,346 11,257 885,780
2005 1 Qtr. 579,475 338,591 12,413 1,054,797 2 Qtr. 554,585 404,642 46,779 1,110,743 3 Qtr. 579,607 361,900 67,092 1,099,688 4 Qtr. 549,727 342,612 6,305 987,002
2006 1 Qtr. 638,194 355,719 1,330 1,106,472 2 Qtr. 587,788 490,365 55,282 1,241,830 3 Qtr. 605,813 361,508 22,781 1,076,795 4 Qtr. 625,584 369,081 7,582 1,097,164
2007 1 Qtr. 662,362 341,183 9,136 1,116,467 2 Qtr. 662,003 488,514 42,336 1,295,154 3 Qtr. 646,384 379,033 27,297 1,146,614 4 Qtr. 652,765 370,408 1,245 1,124,851
2008 1 Qtr. 678,489 336,354 14,593 1,138,545 2 Qtr. 641,149 459,040 41,946 1,231,862 3 Qtr. 655,075 382,982 17,117 1,161,528 4 Qtr. 593,107 386,333 2,945 1,076,634
2009 1 Qtr. 589,891 265,502 9,201 954,075 2 Qtr. 579,506 304,239 24,259 1,010,064 3 Qtr. 577,836 357,169 12,451 1,051,792 4 Qtr. 549,055 340,692 -9,229 1,002,283
2010 1 Qtr. 616,777 428,586 18,696 1,192,489 2 Qtr. 572,766 401,662 37,267 1,117,994 3 Qtr. 611,575 165,284 1,752 908,912 4 Qtr. 578,824 379,587 -4,900 1,092,946
2011 1 Qtr. 652,857 289,893 -8,202 1,068,341 2 Qtr. 652,551 412,388 45,923 1,259,112 3 Qtr. 655,038 395,424 10,662 1,215,241 4 Qtr. 628,042 362,916 -28,835 1,119,826
2012 1 Qtr. 711,092 276,663 33,542 1,186,786 2 Qtr. 703,779 506,048 57,658 1,455,995 3 Qtr. 738,753 435,471 21,335 1,346,738 4 Qtr. 691,117 433,030 160 1,268,837
2013 1 Qtr. 757,923 351,323 14,909 1,282,306 2 Qtr. 756,693 516,183 64,584 1,572,300 3 Qtr. 698,689 454,022 39,471 1,311,027 4 Qtr. 694,316 424,087 16,374 1,284,968
2014 1 Qtr. 746,724 346,914 -11,265 1,286,988 2 Qtr. 740,811 520,787 42,441 1,487,285 3 Qtr. 754,466 453,178 15,558 1,348,688 4 Qtr. 737,774 499,814 19,012 1,412,748
2015 1 Qtr. 782,302 464,230 9,632 1,444,563 2 Qtr. 773,665 570,972 8,118 1,529,142 3 Qtr. 831,149 520,447 50,082 1,593,064 4 Qtr. 754,374 498,450 8,630 1,431,846
2016 1 Qtr. 818,316 495,998 -17,278 1,504,155 2 Qtr. 802,314 601,965 51,601 1,665,290 3 Qtr. 801,115 509,507 18,476 1,545,715 4 Qtr. 783,988 510,748 36,898 1,500,247
2017 1 Qtr. 831,893 556,351 -31,911 1,575,636 2 Qtr. 822,229 616,196 53,298 1,693,618 3 Qtr. 901,033 543,027 32,139 1,692,034
3/ 4 Qtr. 794,667 570,382 -11,397 1,524,187 2018 1 Qtr. 959,068 513,388 14,563 1,705,829
1/ Declaration of estimated taxes, plus payments with returns, plus withholding tax on wages, less refunds. Individual income tax rates changed effective January 1, 1999, 2001 and 2002. 2/ Declaration of estimated taxes, plus payments with returns, less refunds. 3/ Revised from previous QSER. Source: Hawaii State Department of Taxation and <http://www.hawaii.gov/tax/a5_3txcolrpt.htm>.
QSER 2018 Quarter 2, Executive Summary Page 19 of 28 http://dbedt.hawaii.gov/economic/qser/
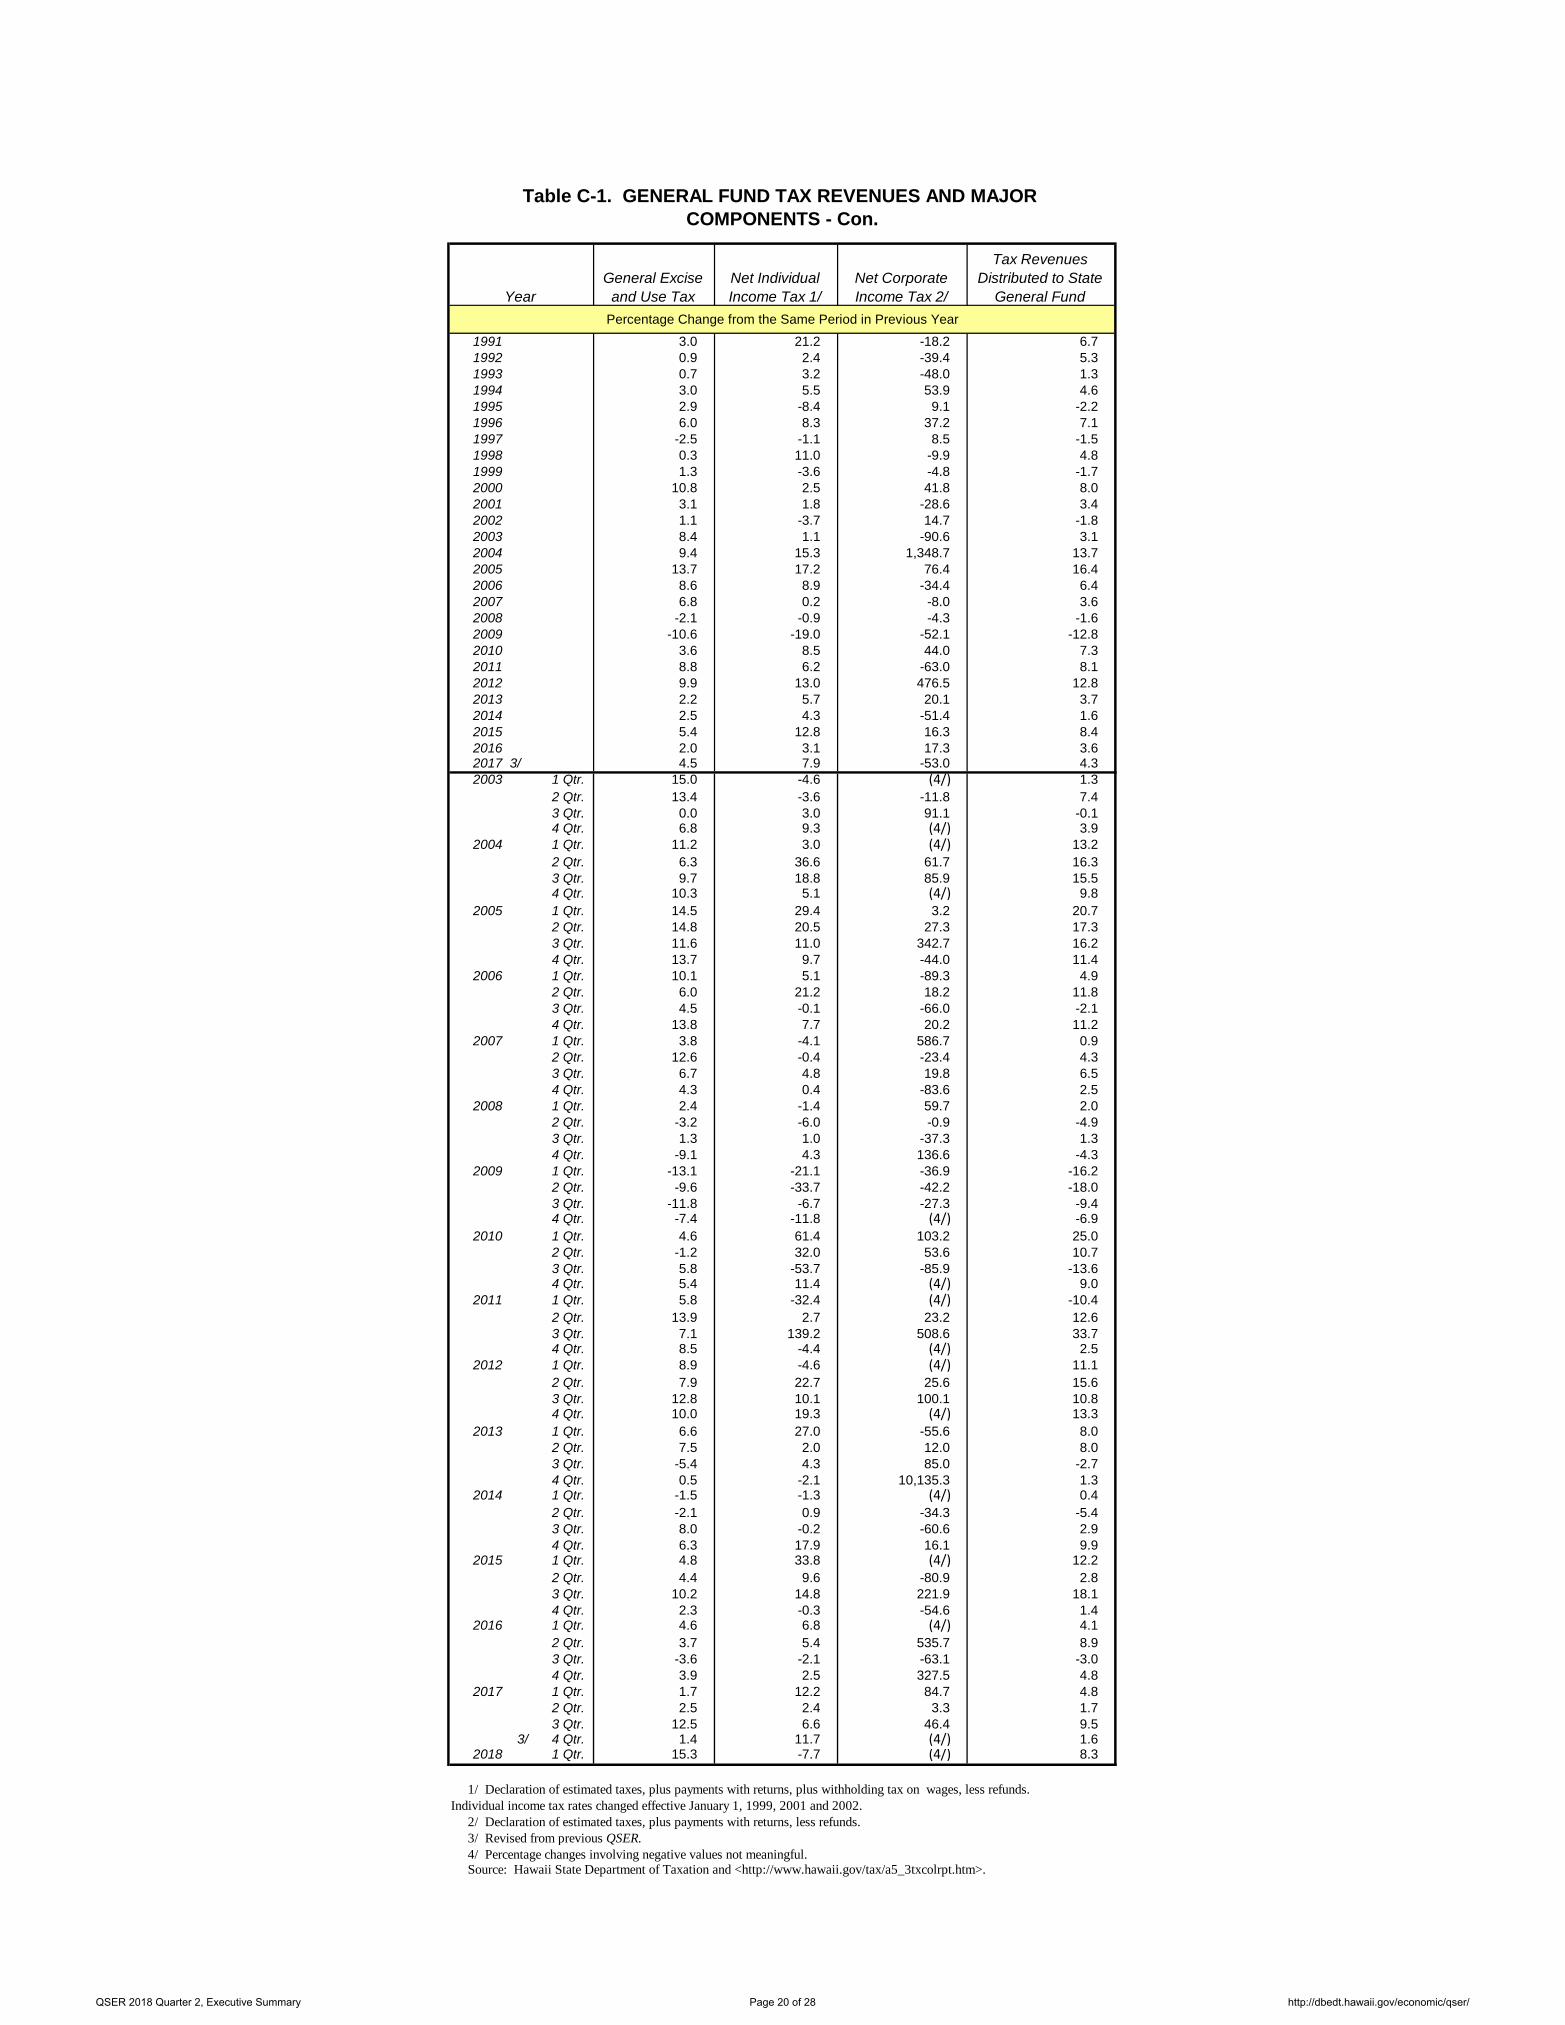
Table C-1. GENERAL FUND TAX REVENUES AND MAJOR COMPONENTS - Con.
YearGeneral Excise
and Use TaxNet IndividualIncome Tax 1/
Net CorporateIncome Tax 2/
Tax Revenues Distributed to State
General FundPercentage Change from the Same Period in Previous Year
1991 3.0 21.2 -18.2 6.7 1992 0.9 2.4 -39.4 5.3 1993 0.7 3.2 -48.0 1.3 1994 3.0 5.5 53.9 4.6 1995 2.9 -8.4 9.1 -2.2 1996 6.0 8.3 37.2 7.1 1997 -2.5 -1.1 8.5 -1.5 1998 0.3 11.0 -9.9 4.8 1999 1.3 -3.6 -4.8 -1.7 2000 10.8 2.5 41.8 8.0 2001 3.1 1.8 -28.6 3.4 2002 1.1 -3.7 14.7 -1.8 2003 8.4 1.1 -90.6 3.1 2004 9.4 15.3 1,348.7 13.7 2005 13.7 17.2 76.4 16.4 2006 8.6 8.9 -34.4 6.4 2007 6.8 0.2 -8.0 3.6 2008 -2.1 -0.9 -4.3 -1.6 2009 -10.6 -19.0 -52.1 -12.8 2010 3.6 8.5 44.0 7.3 2011 8.8 6.2 -63.0 8.1 2012 9.9 13.0 476.5 12.8 2013 2.2 5.7 20.1 3.7 2014 2.5 4.3 -51.4 1.6 2015 5.4 12.8 16.3 8.4 2016 2.0 3.1 17.3 3.6 2017 3/ 4.5 7.9 -53.0 4.3 2003 1 Qtr. 15.0 -4.6 (4/) 1.3
2 Qtr. 13.4 -3.6 -11.8 7.4 3 Qtr. 0.0 3.0 91.1 -0.1 4 Qtr. 6.8 9.3 (4/) 3.9
2004 1 Qtr. 11.2 3.0 (4/) 13.2 2 Qtr. 6.3 36.6 61.7 16.3 3 Qtr. 9.7 18.8 85.9 15.5 4 Qtr. 10.3 5.1 (4/) 9.8
2005 1 Qtr. 14.5 29.4 3.2 20.7 2 Qtr. 14.8 20.5 27.3 17.3 3 Qtr. 11.6 11.0 342.7 16.2 4 Qtr. 13.7 9.7 -44.0 11.4
2006 1 Qtr. 10.1 5.1 -89.3 4.9 2 Qtr. 6.0 21.2 18.2 11.8 3 Qtr. 4.5 -0.1 -66.0 -2.1 4 Qtr. 13.8 7.7 20.2 11.2
2007 1 Qtr. 3.8 -4.1 586.7 0.9 2 Qtr. 12.6 -0.4 -23.4 4.3 3 Qtr. 6.7 4.8 19.8 6.5 4 Qtr. 4.3 0.4 -83.6 2.5
2008 1 Qtr. 2.4 -1.4 59.7 2.0 2 Qtr. -3.2 -6.0 -0.9 -4.9 3 Qtr. 1.3 1.0 -37.3 1.3 4 Qtr. -9.1 4.3 136.6 -4.3
2009 1 Qtr. -13.1 -21.1 -36.9 -16.2 2 Qtr. -9.6 -33.7 -42.2 -18.0 3 Qtr. -11.8 -6.7 -27.3 -9.4 4 Qtr. -7.4 -11.8 (4/) -6.9
2010 1 Qtr. 4.6 61.4 103.2 25.0 2 Qtr. -1.2 32.0 53.6 10.7 3 Qtr. 5.8 -53.7 -85.9 -13.6 4 Qtr. 5.4 11.4 (4/) 9.0
2011 1 Qtr. 5.8 -32.4 (4/) -10.4 2 Qtr. 13.9 2.7 23.2 12.6 3 Qtr. 7.1 139.2 508.6 33.7 4 Qtr. 8.5 -4.4 (4/) 2.5
2012 1 Qtr. 8.9 -4.6 (4/) 11.1 2 Qtr. 7.9 22.7 25.6 15.6 3 Qtr. 12.8 10.1 100.1 10.8 4 Qtr. 10.0 19.3 (4/) 13.3
2013 1 Qtr. 6.6 27.0 -55.6 8.0 2 Qtr. 7.5 2.0 12.0 8.0 3 Qtr. -5.4 4.3 85.0 -2.7 4 Qtr. 0.5 -2.1 10,135.3 1.3
2014 1 Qtr. -1.5 -1.3 (4/) 0.4 2 Qtr. -2.1 0.9 -34.3 -5.4 3 Qtr. 8.0 -0.2 -60.6 2.9 4 Qtr. 6.3 17.9 16.1 9.9
2015 1 Qtr. 4.8 33.8 (4/) 12.2 2 Qtr. 4.4 9.6 -80.9 2.8 3 Qtr. 10.2 14.8 221.9 18.1 4 Qtr. 2.3 -0.3 -54.6 1.4
2016 1 Qtr. 4.6 6.8 (4/) 4.1 2 Qtr. 3.7 5.4 535.7 8.9 3 Qtr. -3.6 -2.1 -63.1 -3.0 4 Qtr. 3.9 2.5 327.5 4.8
2017 1 Qtr. 1.7 12.2 84.7 4.8 2 Qtr. 2.5 2.4 3.3 1.7 3 Qtr. 12.5 6.6 46.4 9.5
3/ 4 Qtr. 1.4 11.7 (4/) 1.6 2018 1 Qtr. 15.3 -7.7 (4/) 8.3
1/ Declaration of estimated taxes, plus payments with returns, plus withholding tax on wages, less refunds. Individual income tax rates changed effective January 1, 1999, 2001 and 2002. 2/ Declaration of estimated taxes, plus payments with returns, less refunds. 3/ Revised from previous QSER. 4/ Percentage changes involving negative values not meaningful. Source: Hawaii State Department of Taxation and <http://www.hawaii.gov/tax/a5_3txcolrpt.htm>.
QSER 2018 Quarter 2, Executive Summary Page 20 of 28 http://dbedt.hawaii.gov/economic/qser/
D. TOURISM
Visitor arrivals continue to be strong, with both domestic and international visitor arrivals increasing in the first quarter of 2018. Due to shorter lengths of stay, the daily visitor census increased less than the increase of visitor arrivals in the quarter. Since visitors spent more on a daily basis, total visitor spending increased more than the growth of the average total daily visitor census in the quarter. With the exception of the fourth quarter of 2013, visitor arrivals have increased since the third quarter of 2009.
The total number of visitor arrivals by air increased
214,708 or 9.7 percent in the first quarter of 2018, compared to the same quarter of 2017 (Tables D-1 and D-2). The total average daily census was up 17,906 or 7.6 percent in the quarter. In 2017, total visitor arrivals by air increased 434,959 or 4.9 percent, while the average daily census increased 10,850 or 5.0 percent from the previous year.
In the first quarter of 2018, total visitor arrivals on
domestic flights increased 175,612 or 12.1 percent compared to the same quarter of 2017 (Table D-3). In 2017, domestic arrivals were up 270,246 or 4.5 percent from the previous year.
Arrivals on international flights increased 39,096 or
5.1 percent in the first quarter of 2018 compared to the first quarter of 2017 (Table D-4). In 2017, international arrivals were up 164,713 or 5.8 percent from the same period in the previous year.
In terms of major market areas, from the first
quarter of 2017 to the same period of 2018, arrivals from the U.S. West increased 114,030 or 13.4 percent (Table D-5), arrivals from the U.S. East increased 49,607 or 9.6 percent (Table D-6), and arrivals from Japan decreased 1,037 or 0.3 percent (Table D-7). In 2017, arrivals from the U.S. West were up 179,059 or 4.9 percent; arrivals from the U.S. East were up 105,883 or 5.6 percent; and Japanese arrivals were up 80,630 or 5.4 percent from the previous year.
In the first quarter of 2018, the length of stay per
visitor decreased. Due to the shorter length of stay, the
average total daily visitor census increased less than the growth of visitor arrivals in the quarter. The total average daily visitor census was up 7.6 percent or 17,906 visitors per day in the first quarter of 2018, over the same quarter of 2017 (Table D-8). The domestic average daily census increased 9.3 percent or 15,186 visitors per day (Table D-9), while the international average daily census increased 3.8 percent or 2,720 visitors per day (Table D-10). In 2017, the domestic average daily census increased 6,322 or 4.0 percent; and the international average daily census increased 4,528 or 7.6 percent from the previous year.
Nominal visitor expenditures by air totaled
$4,811.1 million in the first quarter of 2018, up 10.1 percent or $443.2 million from the same quarter of 2017 (Table D-11). In 2017, visitor expenditures increased $980.7 million or 6.2 percent from the previous year.
Total airline capacity, as measured by the number
of available seats flown to Hawaii, increased 10.5 percent or 314,141 seats (Table D-12) in the first quarter of 2018, domestic seats increased 13.9 percent or 277,584 seats (Table D-13); international seats increased 3.7 percent or 36,557 seats (Table D-14), compared to the same quarter of 2017. In 2017, the number of total available seats increased 1.8 percent or 215,063 seats from the previous year.
In the first quarter of 2018, the statewide hotel
occupancy rate averaged 82.9 percent, 1.5 percentage point higher than the same quarter of 2017 (Table D-15). In 2017, the statewide hotel occupancy rate averaged 80.0 percent, 1.0 percentage point higher than the previous year.
Readers interested in visitor statistics on a monthly
basis can find them on the DBEDT website: http://dbedt.hawaii.gov/visitor/ and those interested in daily passenger arrival data at: http://dbedt.hawaii.gov/visitor/daily-passenger-counts/.
QSER 2018 Quarter 2, Executive Summary Page 21 of 28 http://dbedt.hawaii.gov/economic/qser/
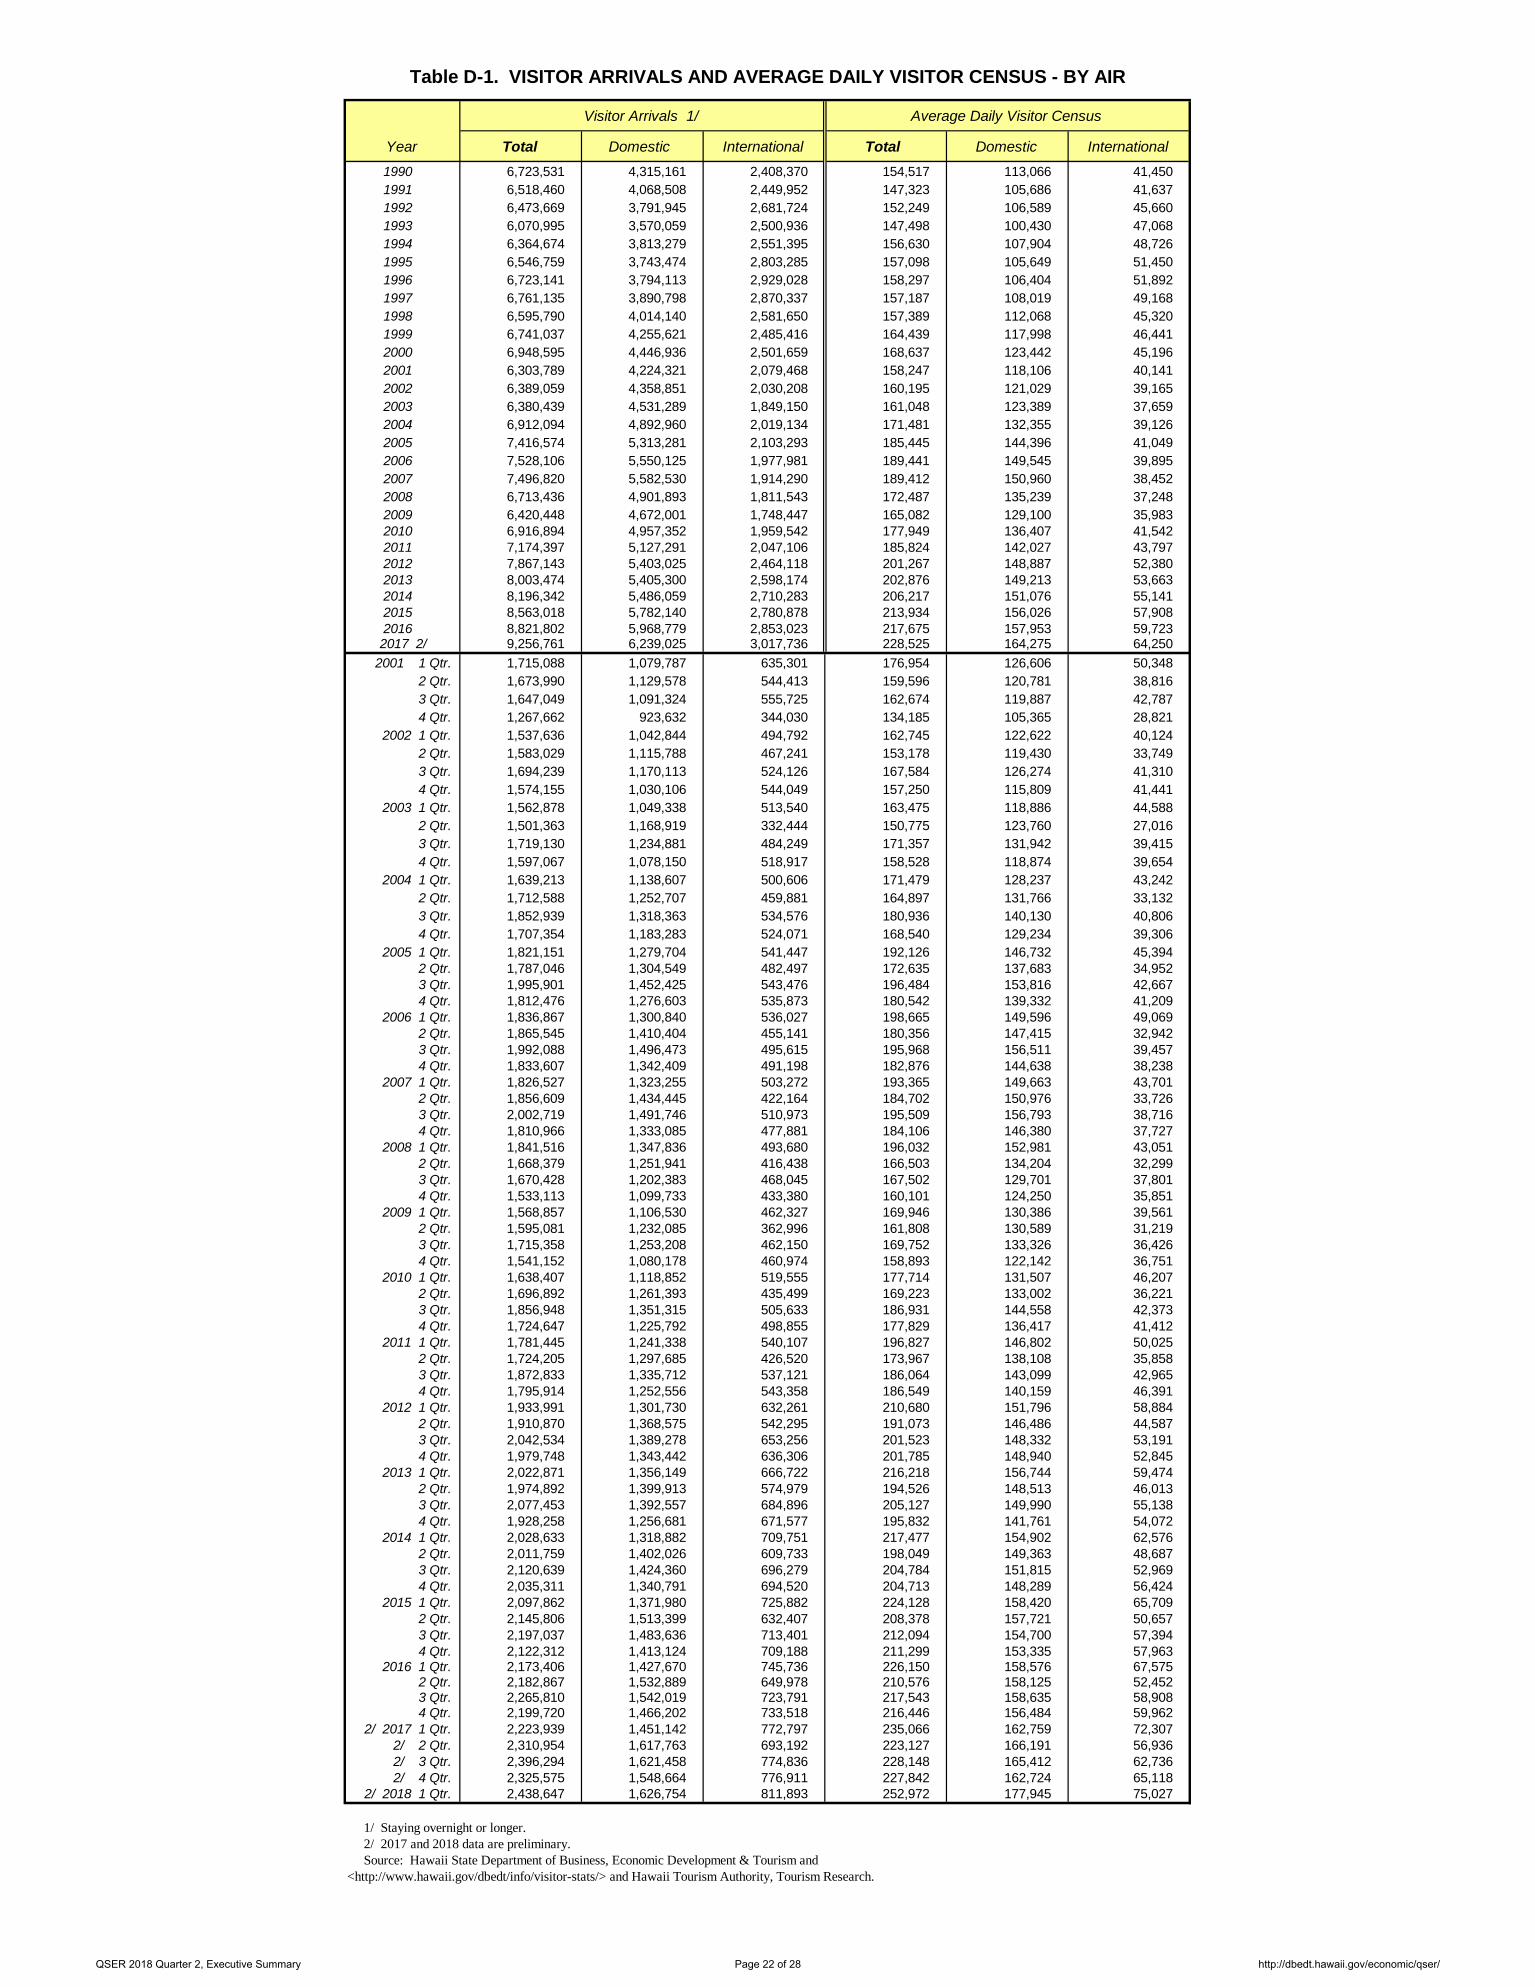
Table D-1. VISITOR ARRIVALS AND AVERAGE DAILY VISITOR CENSUS - BY AIR
Visitor Arrivals 1/ Average Daily Visitor Census
Year Total Domestic International Total Domestic International 1990 6,723,531 4,315,161 2,408,370 154,517 113,066 41,450 1991 6,518,460 4,068,508 2,449,952 147,323 105,686 41,637 1992 6,473,669 3,791,945 2,681,724 152,249 106,589 45,660 1993 6,070,995 3,570,059 2,500,936 147,498 100,430 47,068 1994 6,364,674 3,813,279 2,551,395 156,630 107,904 48,726 1995 6,546,759 3,743,474 2,803,285 157,098 105,649 51,450 1996 6,723,141 3,794,113 2,929,028 158,297 106,404 51,892 1997 6,761,135 3,890,798 2,870,337 157,187 108,019 49,168 1998 6,595,790 4,014,140 2,581,650 157,389 112,068 45,320 1999 6,741,037 4,255,621 2,485,416 164,439 117,998 46,441 2000 6,948,595 4,446,936 2,501,659 168,637 123,442 45,196 2001 6,303,789 4,224,321 2,079,468 158,247 118,106 40,141 2002 6,389,059 4,358,851 2,030,208 160,195 121,029 39,165 2003 6,380,439 4,531,289 1,849,150 161,048 123,389 37,659 2004 6,912,094 4,892,960 2,019,134 171,481 132,355 39,126 2005 7,416,574 5,313,281 2,103,293 185,445 144,396 41,049 2006 7,528,106 5,550,125 1,977,981 189,441 149,545 39,895 2007 7,496,820 5,582,530 1,914,290 189,412 150,960 38,452 2008 6,713,436 4,901,893 1,811,543 172,487 135,239 37,248 2009 6,420,448 4,672,001 1,748,447 165,082 129,100 35,983 2010 6,916,894 4,957,352 1,959,542 177,949 136,407 41,542 2011 7,174,397 5,127,291 2,047,106 185,824 142,027 43,797 2012 7,867,143 5,403,025 2,464,118 201,267 148,887 52,380 2013 8,003,474 5,405,300 2,598,174 202,876 149,213 53,663 2014 8,196,342 5,486,059 2,710,283 206,217 151,076 55,141 2015 8,563,018 5,782,140 2,780,878 213,934 156,026 57,908 2016 8,821,802 5,968,779 2,853,023 217,675 157,953 59,723 2017 2/ 9,256,761 6,239,025 3,017,736 228,525 164,275 64,250
2001 1 Qtr. 1,715,088 1,079,787 635,301 176,954 126,606 50,348 2 Qtr. 1,673,990 1,129,578 544,413 159,596 120,781 38,816 3 Qtr. 1,647,049 1,091,324 555,725 162,674 119,887 42,787 4 Qtr. 1,267,662 923,632 344,030 134,185 105,365 28,821
2002 1 Qtr. 1,537,636 1,042,844 494,792 162,745 122,622 40,124 2 Qtr. 1,583,029 1,115,788 467,241 153,178 119,430 33,749 3 Qtr. 1,694,239 1,170,113 524,126 167,584 126,274 41,310 4 Qtr. 1,574,155 1,030,106 544,049 157,250 115,809 41,441
2003 1 Qtr. 1,562,878 1,049,338 513,540 163,475 118,886 44,588 2 Qtr. 1,501,363 1,168,919 332,444 150,775 123,760 27,016 3 Qtr. 1,719,130 1,234,881 484,249 171,357 131,942 39,415 4 Qtr. 1,597,067 1,078,150 518,917 158,528 118,874 39,654
2004 1 Qtr. 1,639,213 1,138,607 500,606 171,479 128,237 43,242 2 Qtr. 1,712,588 1,252,707 459,881 164,897 131,766 33,132 3 Qtr. 1,852,939 1,318,363 534,576 180,936 140,130 40,806 4 Qtr. 1,707,354 1,183,283 524,071 168,540 129,234 39,306
2005 1 Qtr. 1,821,151 1,279,704 541,447 192,126 146,732 45,394 2 Qtr. 1,787,046 1,304,549 482,497 172,635 137,683 34,952 3 Qtr. 1,995,901 1,452,425 543,476 196,484 153,816 42,667 4 Qtr. 1,812,476 1,276,603 535,873 180,542 139,332 41,209
2006 1 Qtr. 1,836,867 1,300,840 536,027 198,665 149,596 49,069 2 Qtr. 1,865,545 1,410,404 455,141 180,356 147,415 32,942 3 Qtr. 1,992,088 1,496,473 495,615 195,968 156,511 39,457 4 Qtr. 1,833,607 1,342,409 491,198 182,876 144,638 38,238
2007 1 Qtr. 1,826,527 1,323,255 503,272 193,365 149,663 43,701 2 Qtr. 1,856,609 1,434,445 422,164 184,702 150,976 33,726 3 Qtr. 2,002,719 1,491,746 510,973 195,509 156,793 38,716 4 Qtr. 1,810,966 1,333,085 477,881 184,106 146,380 37,727
2008 1 Qtr. 1,841,516 1,347,836 493,680 196,032 152,981 43,051 2 Qtr. 1,668,379 1,251,941 416,438 166,503 134,204 32,299 3 Qtr. 1,670,428 1,202,383 468,045 167,502 129,701 37,801 4 Qtr. 1,533,113 1,099,733 433,380 160,101 124,250 35,851
2009 1 Qtr. 1,568,857 1,106,530 462,327 169,946 130,386 39,561 2 Qtr. 1,595,081 1,232,085 362,996 161,808 130,589 31,219 3 Qtr. 1,715,358 1,253,208 462,150 169,752 133,326 36,426 4 Qtr. 1,541,152 1,080,178 460,974 158,893 122,142 36,751
2010 1 Qtr. 1,638,407 1,118,852 519,555 177,714 131,507 46,207 2 Qtr. 1,696,892 1,261,393 435,499 169,223 133,002 36,221 3 Qtr. 1,856,948 1,351,315 505,633 186,931 144,558 42,373 4 Qtr. 1,724,647 1,225,792 498,855 177,829 136,417 41,412
2011 1 Qtr. 1,781,445 1,241,338 540,107 196,827 146,802 50,025 2 Qtr. 1,724,205 1,297,685 426,520 173,967 138,108 35,858 3 Qtr. 1,872,833 1,335,712 537,121 186,064 143,099 42,965 4 Qtr. 1,795,914 1,252,556 543,358 186,549 140,159 46,391
2012 1 Qtr. 1,933,991 1,301,730 632,261 210,680 151,796 58,884 2 Qtr. 1,910,870 1,368,575 542,295 191,073 146,486 44,587 3 Qtr. 2,042,534 1,389,278 653,256 201,523 148,332 53,191 4 Qtr. 1,979,748 1,343,442 636,306 201,785 148,940 52,845
2013 1 Qtr. 2,022,871 1,356,149 666,722 216,218 156,744 59,474 2 Qtr. 1,974,892 1,399,913 574,979 194,526 148,513 46,013 3 Qtr. 2,077,453 1,392,557 684,896 205,127 149,990 55,138 4 Qtr. 1,928,258 1,256,681 671,577 195,832 141,761 54,072
2014 1 Qtr. 2,028,633 1,318,882 709,751 217,477 154,902 62,576 2 Qtr. 2,011,759 1,402,026 609,733 198,049 149,363 48,687 3 Qtr. 2,120,639 1,424,360 696,279 204,784 151,815 52,969 4 Qtr. 2,035,311 1,340,791 694,520 204,713 148,289 56,424
2015 1 Qtr. 2,097,862 1,371,980 725,882 224,128 158,420 65,709 2 Qtr. 2,145,806 1,513,399 632,407 208,378 157,721 50,657 3 Qtr. 2,197,037 1,483,636 713,401 212,094 154,700 57,394 4 Qtr. 2,122,312 1,413,124 709,188 211,299 153,335 57,963
2016 1 Qtr. 2,173,406 1,427,670 745,736 226,150 158,576 67,575 2 Qtr. 2,182,867 1,532,889 649,978 210,576 158,125 52,452 3 Qtr. 2,265,810 1,542,019 723,791 217,543 158,635 58,908 4 Qtr. 2,199,720 1,466,202 733,518 216,446 156,484 59,962
2/ 2017 1 Qtr. 2,223,939 1,451,142 772,797 235,066 162,759 72,307 2/ 2 Qtr. 2,310,954 1,617,763 693,192 223,127 166,191 56,936 2/ 3 Qtr. 2,396,294 1,621,458 774,836 228,148 165,412 62,736 2/ 4 Qtr. 2,325,575 1,548,664 776,911 227,842 162,724 65,118
2/ 2018 1 Qtr. 2,438,647 1,626,754 811,893 252,972 177,945 75,027
1/ Staying overnight or longer. 2/ 2017 and 2018 data are preliminary. Source: Hawaii State Department of Business, Economic Development & Tourism and <http://www.hawaii.gov/dbedt/info/visitor-stats/> and Hawaii Tourism Authority, Tourism Research.
QSER 2018 Quarter 2, Executive Summary Page 22 of 28 http://dbedt.hawaii.gov/economic/qser/
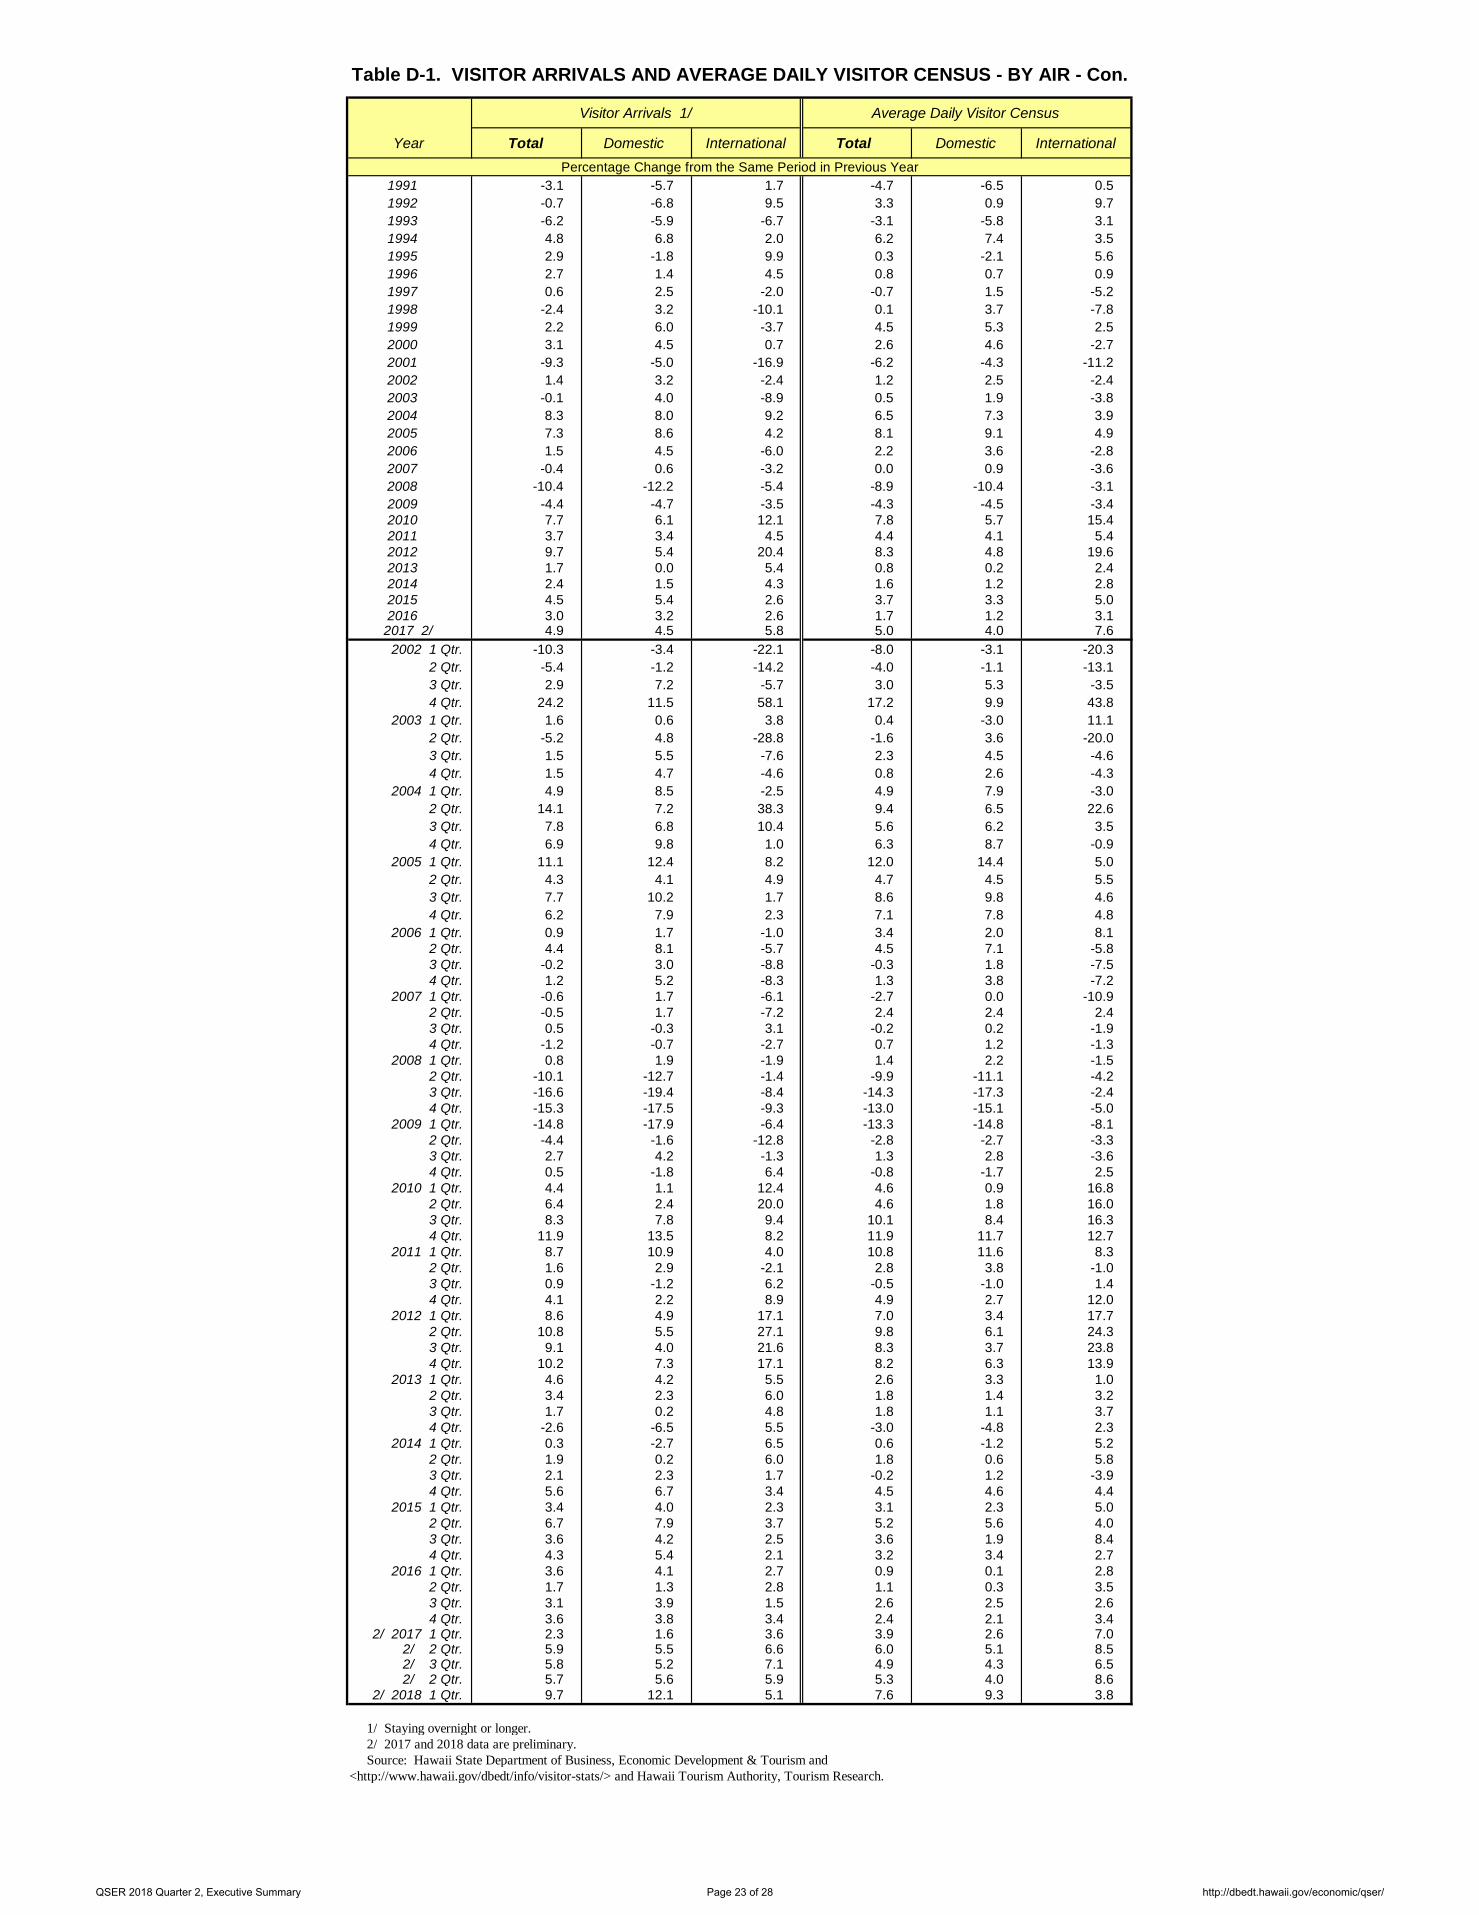
Table D-1. VISITOR ARRIVALS AND AVERAGE DAILY VISITOR CENSUS - BY AIR - Con.
Visitor Arrivals 1/ Average Daily Visitor Census
Year Total Domestic International Total Domestic InternationalPercentage Change from the Same Period in Previous Year
1991 -3.1 -5.7 1.7 -4.7 -6.5 0.5 1992 -0.7 -6.8 9.5 3.3 0.9 9.7 1993 -6.2 -5.9 -6.7 -3.1 -5.8 3.1 1994 4.8 6.8 2.0 6.2 7.4 3.5 1995 2.9 -1.8 9.9 0.3 -2.1 5.6 1996 2.7 1.4 4.5 0.8 0.7 0.9 1997 0.6 2.5 -2.0 -0.7 1.5 -5.2 1998 -2.4 3.2 -10.1 0.1 3.7 -7.8 1999 2.2 6.0 -3.7 4.5 5.3 2.5 2000 3.1 4.5 0.7 2.6 4.6 -2.7 2001 -9.3 -5.0 -16.9 -6.2 -4.3 -11.2 2002 1.4 3.2 -2.4 1.2 2.5 -2.4 2003 -0.1 4.0 -8.9 0.5 1.9 -3.8 2004 8.3 8.0 9.2 6.5 7.3 3.9 2005 7.3 8.6 4.2 8.1 9.1 4.9 2006 1.5 4.5 -6.0 2.2 3.6 -2.8 2007 -0.4 0.6 -3.2 0.0 0.9 -3.6 2008 -10.4 -12.2 -5.4 -8.9 -10.4 -3.1 2009 -4.4 -4.7 -3.5 -4.3 -4.5 -3.4 2010 7.7 6.1 12.1 7.8 5.7 15.4 2011 3.7 3.4 4.5 4.4 4.1 5.4 2012 9.7 5.4 20.4 8.3 4.8 19.6 2013 1.7 0.0 5.4 0.8 0.2 2.4 2014 2.4 1.5 4.3 1.6 1.2 2.8 2015 4.5 5.4 2.6 3.7 3.3 5.0 2016 3.0 3.2 2.6 1.7 1.2 3.1 2017 2/ 4.9 4.5 5.8 5.0 4.0 7.6
2002 1 Qtr. -10.3 -3.4 -22.1 -8.0 -3.1 -20.3 2 Qtr. -5.4 -1.2 -14.2 -4.0 -1.1 -13.1 3 Qtr. 2.9 7.2 -5.7 3.0 5.3 -3.5 4 Qtr. 24.2 11.5 58.1 17.2 9.9 43.8
2003 1 Qtr. 1.6 0.6 3.8 0.4 -3.0 11.1 2 Qtr. -5.2 4.8 -28.8 -1.6 3.6 -20.0 3 Qtr. 1.5 5.5 -7.6 2.3 4.5 -4.6 4 Qtr. 1.5 4.7 -4.6 0.8 2.6 -4.3
2004 1 Qtr. 4.9 8.5 -2.5 4.9 7.9 -3.0 2 Qtr. 14.1 7.2 38.3 9.4 6.5 22.6 3 Qtr. 7.8 6.8 10.4 5.6 6.2 3.5 4 Qtr. 6.9 9.8 1.0 6.3 8.7 -0.9
2005 1 Qtr. 11.1 12.4 8.2 12.0 14.4 5.0 2 Qtr. 4.3 4.1 4.9 4.7 4.5 5.5 3 Qtr. 7.7 10.2 1.7 8.6 9.8 4.6 4 Qtr. 6.2 7.9 2.3 7.1 7.8 4.8
2006 1 Qtr. 0.9 1.7 -1.0 3.4 2.0 8.1 2 Qtr. 4.4 8.1 -5.7 4.5 7.1 -5.8 3 Qtr. -0.2 3.0 -8.8 -0.3 1.8 -7.5 4 Qtr. 1.2 5.2 -8.3 1.3 3.8 -7.2
2007 1 Qtr. -0.6 1.7 -6.1 -2.7 0.0 -10.9 2 Qtr. -0.5 1.7 -7.2 2.4 2.4 2.4 3 Qtr. 0.5 -0.3 3.1 -0.2 0.2 -1.9 4 Qtr. -1.2 -0.7 -2.7 0.7 1.2 -1.3
2008 1 Qtr. 0.8 1.9 -1.9 1.4 2.2 -1.5 2 Qtr. -10.1 -12.7 -1.4 -9.9 -11.1 -4.2 3 Qtr. -16.6 -19.4 -8.4 -14.3 -17.3 -2.4 4 Qtr. -15.3 -17.5 -9.3 -13.0 -15.1 -5.0
2009 1 Qtr. -14.8 -17.9 -6.4 -13.3 -14.8 -8.1 2 Qtr. -4.4 -1.6 -12.8 -2.8 -2.7 -3.3 3 Qtr. 2.7 4.2 -1.3 1.3 2.8 -3.6 4 Qtr. 0.5 -1.8 6.4 -0.8 -1.7 2.5
2010 1 Qtr. 4.4 1.1 12.4 4.6 0.9 16.8 2 Qtr. 6.4 2.4 20.0 4.6 1.8 16.0 3 Qtr. 8.3 7.8 9.4 10.1 8.4 16.3 4 Qtr. 11.9 13.5 8.2 11.9 11.7 12.7
2011 1 Qtr. 8.7 10.9 4.0 10.8 11.6 8.3 2 Qtr. 1.6 2.9 -2.1 2.8 3.8 -1.0 3 Qtr. 0.9 -1.2 6.2 -0.5 -1.0 1.4 4 Qtr. 4.1 2.2 8.9 4.9 2.7 12.0
2012 1 Qtr. 8.6 4.9 17.1 7.0 3.4 17.7 2 Qtr. 10.8 5.5 27.1 9.8 6.1 24.3 3 Qtr. 9.1 4.0 21.6 8.3 3.7 23.8 4 Qtr. 10.2 7.3 17.1 8.2 6.3 13.9
2013 1 Qtr. 4.6 4.2 5.5 2.6 3.3 1.0 2 Qtr. 3.4 2.3 6.0 1.8 1.4 3.2 3 Qtr. 1.7 0.2 4.8 1.8 1.1 3.7 4 Qtr. -2.6 -6.5 5.5 -3.0 -4.8 2.3
2014 1 Qtr. 0.3 -2.7 6.5 0.6 -1.2 5.2 2 Qtr. 1.9 0.2 6.0 1.8 0.6 5.8 3 Qtr. 2.1 2.3 1.7 -0.2 1.2 -3.9 4 Qtr. 5.6 6.7 3.4 4.5 4.6 4.4
2015 1 Qtr. 3.4 4.0 2.3 3.1 2.3 5.0 2 Qtr. 6.7 7.9 3.7 5.2 5.6 4.0 3 Qtr. 3.6 4.2 2.5 3.6 1.9 8.4 4 Qtr. 4.3 5.4 2.1 3.2 3.4 2.7
2016 1 Qtr. 3.6 4.1 2.7 0.9 0.1 2.8 2 Qtr. 1.7 1.3 2.8 1.1 0.3 3.5 3 Qtr. 3.1 3.9 1.5 2.6 2.5 2.6 4 Qtr. 3.6 3.8 3.4 2.4 2.1 3.4
2/ 2017 1 Qtr. 2.3 1.6 3.6 3.9 2.6 7.0 2/ 2 Qtr. 5.9 5.5 6.6 6.0 5.1 8.5 2/ 3 Qtr. 5.8 5.2 7.1 4.9 4.3 6.5 2/ 2 Qtr. 5.7 5.6 5.9 5.3 4.0 8.6
2/ 2018 1 Qtr. 9.7 12.1 5.1 7.6 9.3 3.8
1/ Staying overnight or longer. 2/ 2017 and 2018 data are preliminary. Source: Hawaii State Department of Business, Economic Development & Tourism and <http://www.hawaii.gov/dbedt/info/visitor-stats/> and Hawaii Tourism Authority, Tourism Research.
QSER 2018 Quarter 2, Executive Summary Page 23 of 28 http://dbedt.hawaii.gov/economic/qser/
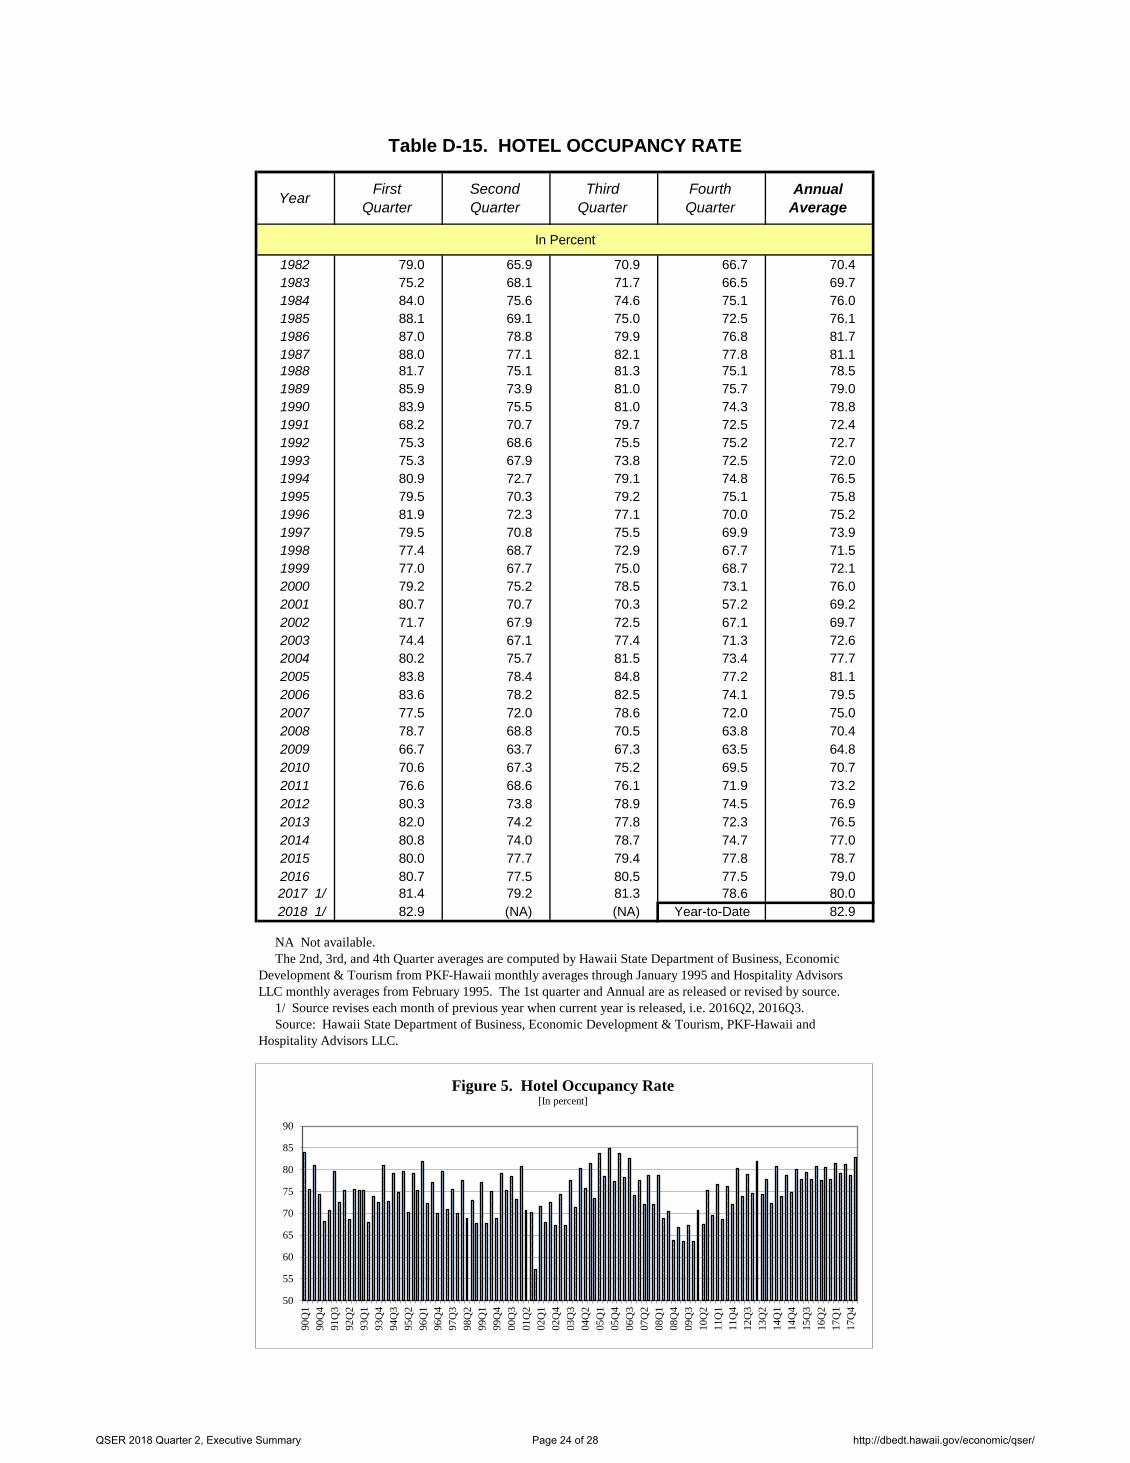
Table D-15. HOTEL OCCUPANCY RATE
Year FirstQuarter
SecondQuarter
ThirdQuarter
FourthQuarter
AnnualAverage
In Percent
1982 79.0 65.9 70.9 66.7 70.4 1983 75.2 68.1 71.7 66.5 69.7 1984 84.0 75.6 74.6 75.1 76.0 1985 88.1 69.1 75.0 72.5 76.1 1986 87.0 78.8 79.9 76.8 81.7 1987 88.0 77.1 82.1 77.8 81.1 1988 81.7 75.1 81.3 75.1 78.5 1989 85.9 73.9 81.0 75.7 79.0 1990 83.9 75.5 81.0 74.3 78.8 1991 68.2 70.7 79.7 72.5 72.4 1992 75.3 68.6 75.5 75.2 72.7 1993 75.3 67.9 73.8 72.5 72.0 1994 80.9 72.7 79.1 74.8 76.5 1995 79.5 70.3 79.2 75.1 75.8 1996 81.9 72.3 77.1 70.0 75.2 1997 79.5 70.8 75.5 69.9 73.9 1998 77.4 68.7 72.9 67.7 71.5 1999 77.0 67.7 75.0 68.7 72.1 2000 79.2 75.2 78.5 73.1 76.0 2001 80.7 70.7 70.3 57.2 69.2 2002 71.7 67.9 72.5 67.1 69.7 2003 74.4 67.1 77.4 71.3 72.6 2004 80.2 75.7 81.5 73.4 77.7 2005 83.8 78.4 84.8 77.2 81.1 2006 83.6 78.2 82.5 74.1 79.5 2007 77.5 72.0 78.6 72.0 75.0 2008 78.7 68.8 70.5 63.8 70.4 2009 66.7 63.7 67.3 63.5 64.8 2010 70.6 67.3 75.2 69.5 70.7 2011 76.6 68.6 76.1 71.9 73.2 2012 80.3 73.8 78.9 74.5 76.9 2013 82.0 74.2 77.8 72.3 76.5 2014 80.8 74.0 78.7 74.7 77.0 2015 80.0 77.7 79.4 77.8 78.7 2016 80.7 77.5 80.5 77.5 79.0 2017 1/ 81.4 79.2 81.3 78.6 80.0 2018 1/ 82.9 (NA) (NA) Year-to-Date 82.9
NA Not available. The 2nd, 3rd, and 4th Quarter averages are computed by Hawaii State Department of Business, Economic Development & Tourism from PKF-Hawaii monthly averages through January 1995 and Hospitality Advisors LLC monthly averages from February 1995. The 1st quarter and Annual are as released or revised by source. 1/ Source revises each month of previous year when current year is released, i.e. 2016Q2, 2016Q3. Source: Hawaii State Department of Business, Economic Development & Tourism, PKF-Hawaii and Hospitality Advisors LLC.
50
55
60
65
70
75
80
85
90
90Q
1
90Q
4
91Q
3
92Q
2
93Q
1
93Q
4
94Q
3
95Q
2
96Q
1
96Q
4
97Q
3
98Q
2
99Q
1
99Q
4
00Q
3
01Q
2
02Q
1
02Q
4
03Q
3
04Q
2
05Q
1
05Q
4
06Q
3
07Q
2
08Q
1
08Q
4
09Q
3
10Q
2
11Q
1
11Q
4
12Q
3
13Q
2
14Q
1
14Q
4
15Q
3
16Q
2
17Q
1
17Q
4
Figure 5. Hotel Occupancy Rate[In percent]
QSER 2018 Quarter 2, Executive Summary Page 24 of 28 http://dbedt.hawaii.gov/economic/qser/
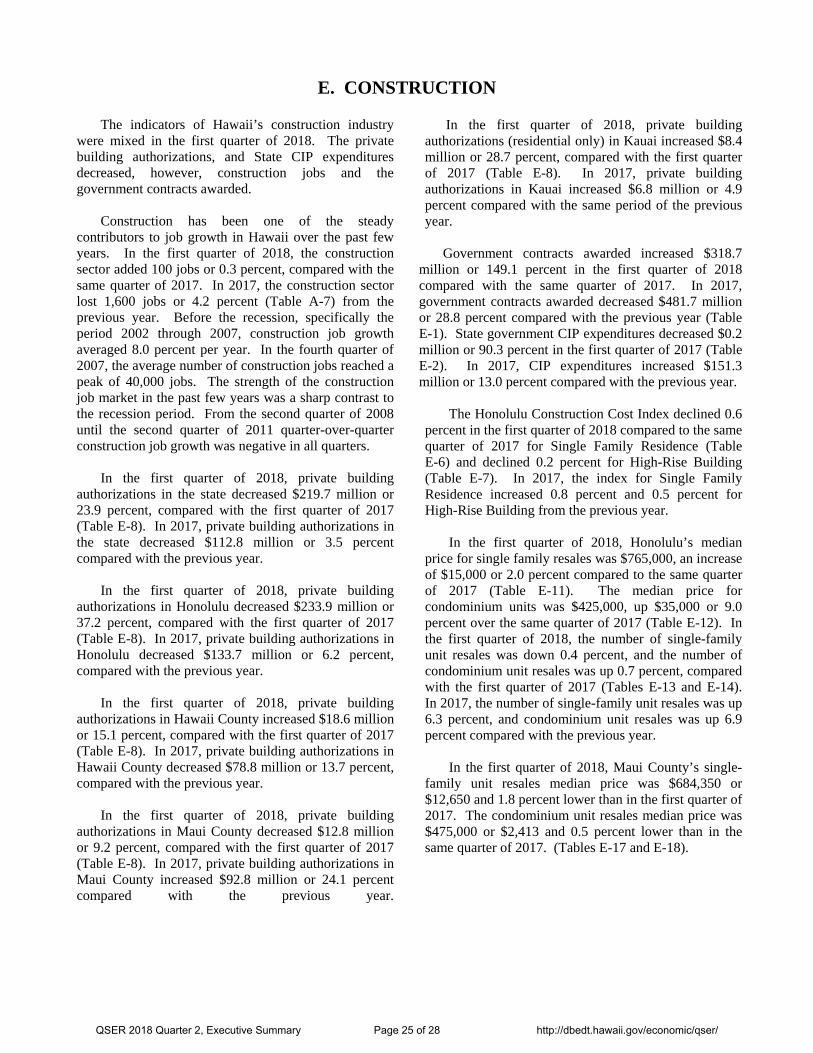
E. CONSTRUCTION
The indicators of Hawaii’s construction industry were mixed in the first quarter of 2018. The private building authorizations, and State CIP expenditures decreased, however, construction jobs and the government contracts awarded.
Construction has been one of the steady contributors to job growth in Hawaii over the past few years. In the first quarter of 2018, the construction sector added 100 jobs or 0.3 percent, compared with the same quarter of 2017. In 2017, the construction sector lost 1,600 jobs or 4.2 percent (Table A-7) from the previous year. Before the recession, specifically the period 2002 through 2007, construction job growth averaged 8.0 percent per year. In the fourth quarter of 2007, the average number of construction jobs reached a peak of 40,000 jobs. The strength of the construction job market in the past few years was a sharp contrast to the recession period. From the second quarter of 2008 until the second quarter of 2011 quarter-over-quarter construction job growth was negative in all quarters.
In the first quarter of 2018, private building authorizations in the state decreased $219.7 million or 23.9 percent, compared with the first quarter of 2017 (Table E-8). In 2017, private building authorizations in the state decreased $112.8 million or 3.5 percent compared with the previous year.
In the first quarter of 2018, private building
authorizations in Honolulu decreased $233.9 million or 37.2 percent, compared with the first quarter of 2017 (Table E-8). In 2017, private building authorizations in Honolulu decreased $133.7 million or 6.2 percent, compared with the previous year.
In the first quarter of 2018, private building
authorizations in Hawaii County increased $18.6 million or 15.1 percent, compared with the first quarter of 2017 (Table E-8). In 2017, private building authorizations in Hawaii County decreased $78.8 million or 13.7 percent, compared with the previous year.
In the first quarter of 2018, private building
authorizations in Maui County decreased $12.8 million or 9.2 percent, compared with the first quarter of 2017 (Table E-8). In 2017, private building authorizations in Maui County increased $92.8 million or 24.1 percent compared with the previous year.
In the first quarter of 2018, private building authorizations (residential only) in Kauai increased $8.4 million or 28.7 percent, compared with the first quarter of 2017 (Table E-8). In 2017, private building authorizations in Kauai increased $6.8 million or 4.9 percent compared with the same period of the previous year.
Government contracts awarded increased $318.7
million or 149.1 percent in the first quarter of 2018 compared with the same quarter of 2017. In 2017, government contracts awarded decreased $481.7 million or 28.8 percent compared with the previous year (Table E-1). State government CIP expenditures decreased $0.2 million or 90.3 percent in the first quarter of 2017 (Table E-2). In 2017, CIP expenditures increased $151.3 million or 13.0 percent compared with the previous year.
The Honolulu Construction Cost Index declined 0.6 percent in the first quarter of 2018 compared to the same quarter of 2017 for Single Family Residence (Table E-6) and declined 0.2 percent for High-Rise Building (Table E-7). In 2017, the index for Single Family Residence increased 0.8 percent and 0.5 percent for High-Rise Building from the previous year.
In the first quarter of 2018, Honolulu’s median price for single family resales was $765,000, an increase of $15,000 or 2.0 percent compared to the same quarter of 2017 (Table E-11). The median price for condominium units was $425,000, up $35,000 or 9.0 percent over the same quarter of 2017 (Table E-12). In the first quarter of 2018, the number of single-family unit resales was down 0.4 percent, and the number of condominium unit resales was up 0.7 percent, compared with the first quarter of 2017 (Tables E-13 and E-14). In 2017, the number of single-family unit resales was up 6.3 percent, and condominium unit resales was up 6.9 percent compared with the previous year.
In the first quarter of 2018, Maui County’s single-
family unit resales median price was $684,350 or $12,650 and 1.8 percent lower than in the first quarter of 2017. The condominium unit resales median price was $475,000 or $2,413 and 0.5 percent lower than in the same quarter of 2017. (Tables E-17 and E-18).
QSER 2018 Quarter 2, Executive Summary Page 25 of 28 http://dbedt.hawaii.gov/economic/qser/
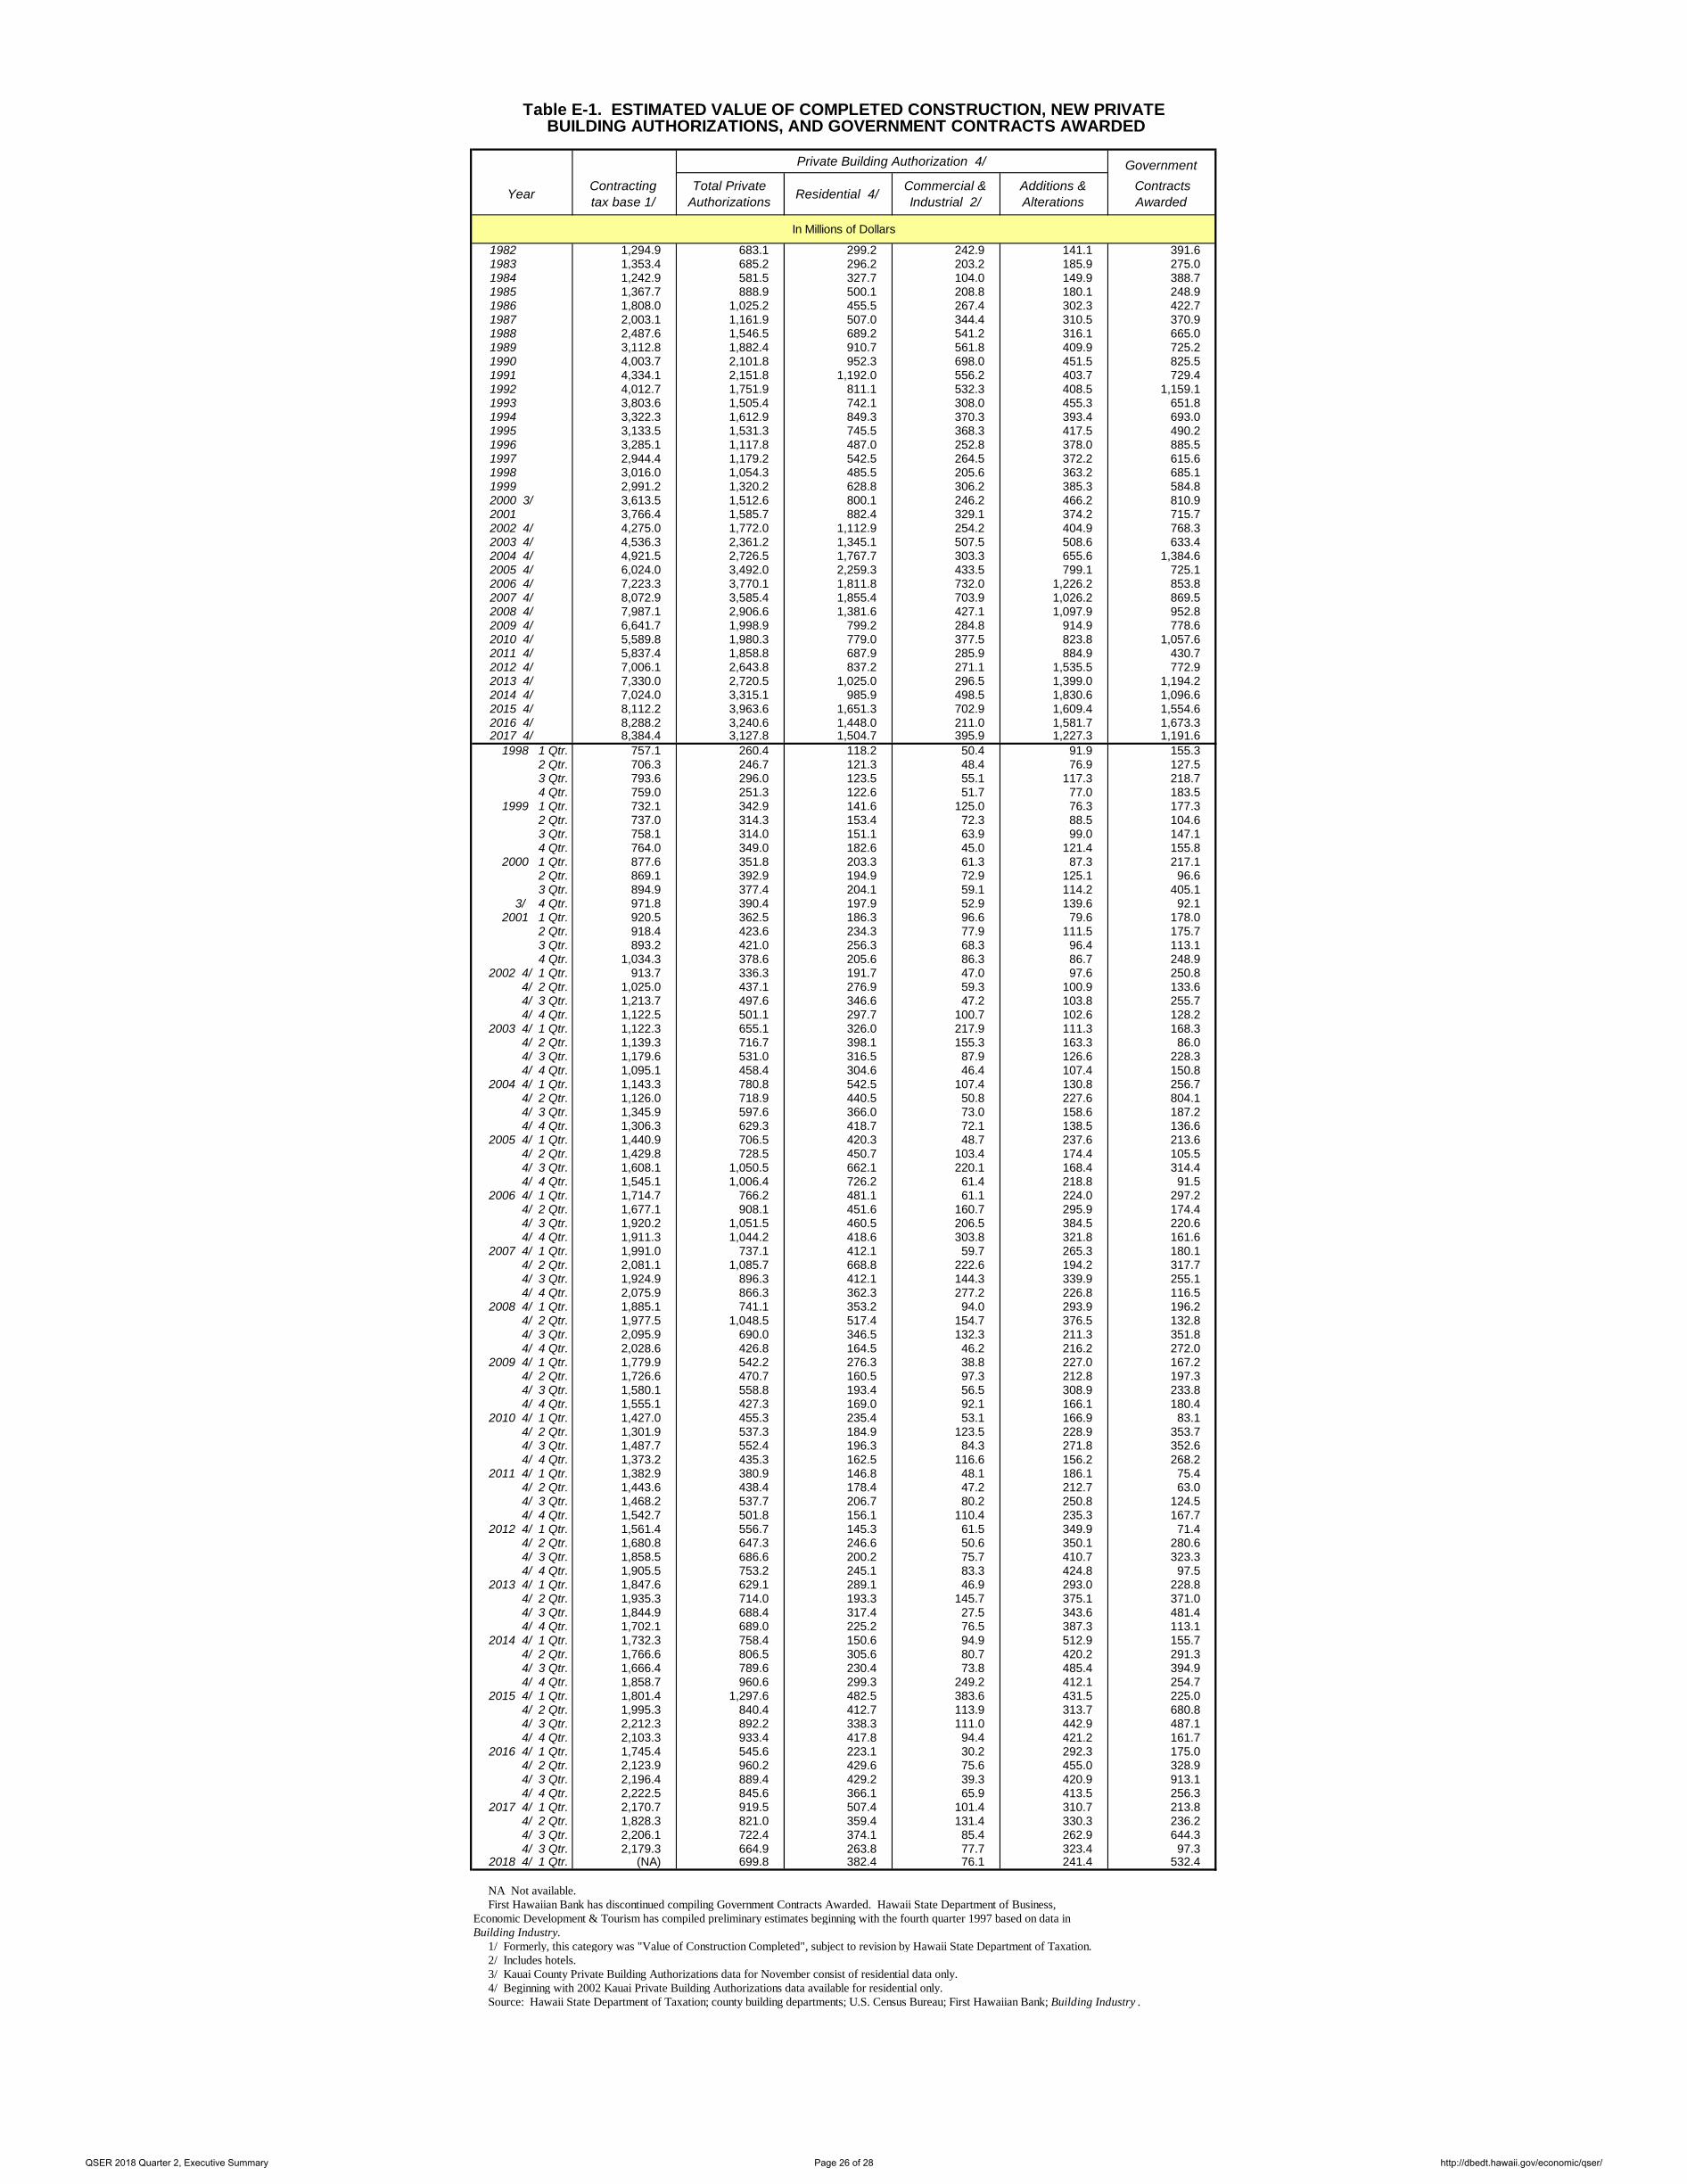
Table E-1. ESTIMATED VALUE OF COMPLETED CONSTRUCTION, NEW PRIVATE BUILDING AUTHORIZATIONS, AND GOVERNMENT CONTRACTS AWARDED
Private Building Authorization 4/ Government
Year Contracting tax base 1/
Total Private Authorizations Residential 4/ Commercial &
Industrial 2/Additions & Alterations
Contracts Awarded
In Millions of Dollars
1982 1,294.9 683.1 299.2 242.9 141.1 391.6 1983 1,353.4 685.2 296.2 203.2 185.9 275.0 1984 1,242.9 581.5 327.7 104.0 149.9 388.7 1985 1,367.7 888.9 500.1 208.8 180.1 248.9 1986 1,808.0 1,025.2 455.5 267.4 302.3 422.7 1987 2,003.1 1,161.9 507.0 344.4 310.5 370.9 1988 2,487.6 1,546.5 689.2 541.2 316.1 665.0 1989 3,112.8 1,882.4 910.7 561.8 409.9 725.2 1990 4,003.7 2,101.8 952.3 698.0 451.5 825.5 1991 4,334.1 2,151.8 1,192.0 556.2 403.7 729.4 1992 4,012.7 1,751.9 811.1 532.3 408.5 1,159.1 1993 3,803.6 1,505.4 742.1 308.0 455.3 651.8 1994 3,322.3 1,612.9 849.3 370.3 393.4 693.0 1995 3,133.5 1,531.3 745.5 368.3 417.5 490.2 1996 3,285.1 1,117.8 487.0 252.8 378.0 885.5 1997 2,944.4 1,179.2 542.5 264.5 372.2 615.6 1998 3,016.0 1,054.3 485.5 205.6 363.2 685.1 1999 2,991.2 1,320.2 628.8 306.2 385.3 584.8 2000 3/ 3,613.5 1,512.6 800.1 246.2 466.2 810.9 2001 3,766.4 1,585.7 882.4 329.1 374.2 715.7 2002 4/ 4,275.0 1,772.0 1,112.9 254.2 404.9 768.3 2003 4/ 4,536.3 2,361.2 1,345.1 507.5 508.6 633.4 2004 4/ 4,921.5 2,726.5 1,767.7 303.3 655.6 1,384.6 2005 4/ 6,024.0 3,492.0 2,259.3 433.5 799.1 725.1 2006 4/ 7,223.3 3,770.1 1,811.8 732.0 1,226.2 853.8 2007 4/ 8,072.9 3,585.4 1,855.4 703.9 1,026.2 869.5 2008 4/ 7,987.1 2,906.6 1,381.6 427.1 1,097.9 952.8 2009 4/ 6,641.7 1,998.9 799.2 284.8 914.9 778.6 2010 4/ 5,589.8 1,980.3 779.0 377.5 823.8 1,057.6 2011 4/ 5,837.4 1,858.8 687.9 285.9 884.9 430.7 2012 4/ 7,006.1 2,643.8 837.2 271.1 1,535.5 772.9 2013 4/ 7,330.0 2,720.5 1,025.0 296.5 1,399.0 1,194.2 2014 4/ 7,024.0 3,315.1 985.9 498.5 1,830.6 1,096.6 2015 4/ 8,112.2 3,963.6 1,651.3 702.9 1,609.4 1,554.6 2016 4/ 8,288.2 3,240.6 1,448.0 211.0 1,581.7 1,673.3 2017 4/ 8,384.4 3,127.8 1,504.7 395.9 1,227.3 1,191.6
1998 1 Qtr. 757.1 260.4 118.2 50.4 91.9 155.3 2 Qtr. 706.3 246.7 121.3 48.4 76.9 127.5 3 Qtr. 793.6 296.0 123.5 55.1 117.3 218.7 4 Qtr. 759.0 251.3 122.6 51.7 77.0 183.5
1999 1 Qtr. 732.1 342.9 141.6 125.0 76.3 177.3 2 Qtr. 737.0 314.3 153.4 72.3 88.5 104.6 3 Qtr. 758.1 314.0 151.1 63.9 99.0 147.1 4 Qtr. 764.0 349.0 182.6 45.0 121.4 155.8
2000 1 Qtr. 877.6 351.8 203.3 61.3 87.3 217.1 2 Qtr. 869.1 392.9 194.9 72.9 125.1 96.6 3 Qtr. 894.9 377.4 204.1 59.1 114.2 405.1 3/ 4 Qtr. 971.8 390.4 197.9 52.9 139.6 92.1
2001 1 Qtr. 920.5 362.5 186.3 96.6 79.6 178.0 2 Qtr. 918.4 423.6 234.3 77.9 111.5 175.7 3 Qtr. 893.2 421.0 256.3 68.3 96.4 113.1 4 Qtr. 1,034.3 378.6 205.6 86.3 86.7 248.9
2002 4/ 1 Qtr. 913.7 336.3 191.7 47.0 97.6 250.8 4/ 2 Qtr. 1,025.0 437.1 276.9 59.3 100.9 133.6 4/ 3 Qtr. 1,213.7 497.6 346.6 47.2 103.8 255.7 4/ 4 Qtr. 1,122.5 501.1 297.7 100.7 102.6 128.2
2003 4/ 1 Qtr. 1,122.3 655.1 326.0 217.9 111.3 168.3 4/ 2 Qtr. 1,139.3 716.7 398.1 155.3 163.3 86.0 4/ 3 Qtr. 1,179.6 531.0 316.5 87.9 126.6 228.3 4/ 4 Qtr. 1,095.1 458.4 304.6 46.4 107.4 150.8
2004 4/ 1 Qtr. 1,143.3 780.8 542.5 107.4 130.8 256.7 4/ 2 Qtr. 1,126.0 718.9 440.5 50.8 227.6 804.1 4/ 3 Qtr. 1,345.9 597.6 366.0 73.0 158.6 187.2 4/ 4 Qtr. 1,306.3 629.3 418.7 72.1 138.5 136.6
2005 4/ 1 Qtr. 1,440.9 706.5 420.3 48.7 237.6 213.6 4/ 2 Qtr. 1,429.8 728.5 450.7 103.4 174.4 105.5 4/ 3 Qtr. 1,608.1 1,050.5 662.1 220.1 168.4 314.4 4/ 4 Qtr. 1,545.1 1,006.4 726.2 61.4 218.8 91.5
2006 4/ 1 Qtr. 1,714.7 766.2 481.1 61.1 224.0 297.2 4/ 2 Qtr. 1,677.1 908.1 451.6 160.7 295.9 174.4 4/ 3 Qtr. 1,920.2 1,051.5 460.5 206.5 384.5 220.6 4/ 4 Qtr. 1,911.3 1,044.2 418.6 303.8 321.8 161.6
2007 4/ 1 Qtr. 1,991.0 737.1 412.1 59.7 265.3 180.1 4/ 2 Qtr. 2,081.1 1,085.7 668.8 222.6 194.2 317.7 4/ 3 Qtr. 1,924.9 896.3 412.1 144.3 339.9 255.1 4/ 4 Qtr. 2,075.9 866.3 362.3 277.2 226.8 116.5
2008 4/ 1 Qtr. 1,885.1 741.1 353.2 94.0 293.9 196.2 4/ 2 Qtr. 1,977.5 1,048.5 517.4 154.7 376.5 132.8 4/ 3 Qtr. 2,095.9 690.0 346.5 132.3 211.3 351.8 4/ 4 Qtr. 2,028.6 426.8 164.5 46.2 216.2 272.0
2009 4/ 1 Qtr. 1,779.9 542.2 276.3 38.8 227.0 167.2 4/ 2 Qtr. 1,726.6 470.7 160.5 97.3 212.8 197.3 4/ 3 Qtr. 1,580.1 558.8 193.4 56.5 308.9 233.8 4/ 4 Qtr. 1,555.1 427.3 169.0 92.1 166.1 180.4
2010 4/ 1 Qtr. 1,427.0 455.3 235.4 53.1 166.9 83.1 4/ 2 Qtr. 1,301.9 537.3 184.9 123.5 228.9 353.7 4/ 3 Qtr. 1,487.7 552.4 196.3 84.3 271.8 352.6 4/ 4 Qtr. 1,373.2 435.3 162.5 116.6 156.2 268.2
2011 4/ 1 Qtr. 1,382.9 380.9 146.8 48.1 186.1 75.4 4/ 2 Qtr. 1,443.6 438.4 178.4 47.2 212.7 63.0 4/ 3 Qtr. 1,468.2 537.7 206.7 80.2 250.8 124.5 4/ 4 Qtr. 1,542.7 501.8 156.1 110.4 235.3 167.7
2012 4/ 1 Qtr. 1,561.4 556.7 145.3 61.5 349.9 71.4 4/ 2 Qtr. 1,680.8 647.3 246.6 50.6 350.1 280.6 4/ 3 Qtr. 1,858.5 686.6 200.2 75.7 410.7 323.3 4/ 4 Qtr. 1,905.5 753.2 245.1 83.3 424.8 97.5
2013 4/ 1 Qtr. 1,847.6 629.1 289.1 46.9 293.0 228.8 4/ 2 Qtr. 1,935.3 714.0 193.3 145.7 375.1 371.0 4/ 3 Qtr. 1,844.9 688.4 317.4 27.5 343.6 481.4 4/ 4 Qtr. 1,702.1 689.0 225.2 76.5 387.3 113.1
2014 4/ 1 Qtr. 1,732.3 758.4 150.6 94.9 512.9 155.7 4/ 2 Qtr. 1,766.6 806.5 305.6 80.7 420.2 291.3 4/ 3 Qtr. 1,666.4 789.6 230.4 73.8 485.4 394.9 4/ 4 Qtr. 1,858.7 960.6 299.3 249.2 412.1 254.7
2015 4/ 1 Qtr. 1,801.4 1,297.6 482.5 383.6 431.5 225.0 4/ 2 Qtr. 1,995.3 840.4 412.7 113.9 313.7 680.8 4/ 3 Qtr. 2,212.3 892.2 338.3 111.0 442.9 487.1 4/ 4 Qtr. 2,103.3 933.4 417.8 94.4 421.2 161.7
2016 4/ 1 Qtr. 1,745.4 545.6 223.1 30.2 292.3 175.0 4/ 2 Qtr. 2,123.9 960.2 429.6 75.6 455.0 328.9 4/ 3 Qtr. 2,196.4 889.4 429.2 39.3 420.9 913.1 4/ 4 Qtr. 2,222.5 845.6 366.1 65.9 413.5 256.3
2017 4/ 1 Qtr. 2,170.7 919.5 507.4 101.4 310.7 213.8 4/ 2 Qtr. 1,828.3 821.0 359.4 131.4 330.3 236.2 4/ 3 Qtr. 2,206.1 722.4 374.1 85.4 262.9 644.3 4/ 3 Qtr. 2,179.3 664.9 263.8 77.7 323.4 97.3
2018 4/ 1 Qtr. (NA) 699.8 382.4 76.1 241.4 532.4
NA Not available. First Hawaiian Bank has discontinued compiling Government Contracts Awarded. Hawaii State Department of Business, Economic Development & Tourism has compiled preliminary estimates beginning with the fourth quarter 1997 based on data inBuilding Industry. 1/ Formerly, this category was "Value of Construction Completed", subject to revision by Hawaii State Department of Taxation. 2/ Includes hotels. 3/ Kauai County Private Building Authorizations data for November consist of residential data only. 4/ Beginning with 2002 Kauai Private Building Authorizations data available for residential only. Source: Hawaii State Department of Taxation; county building departments; U.S. Census Bureau; First Hawaiian Bank; Building Industry .
QSER 2018 Quarter 2, Executive Summary Page 26 of 28 http://dbedt.hawaii.gov/economic/qser/
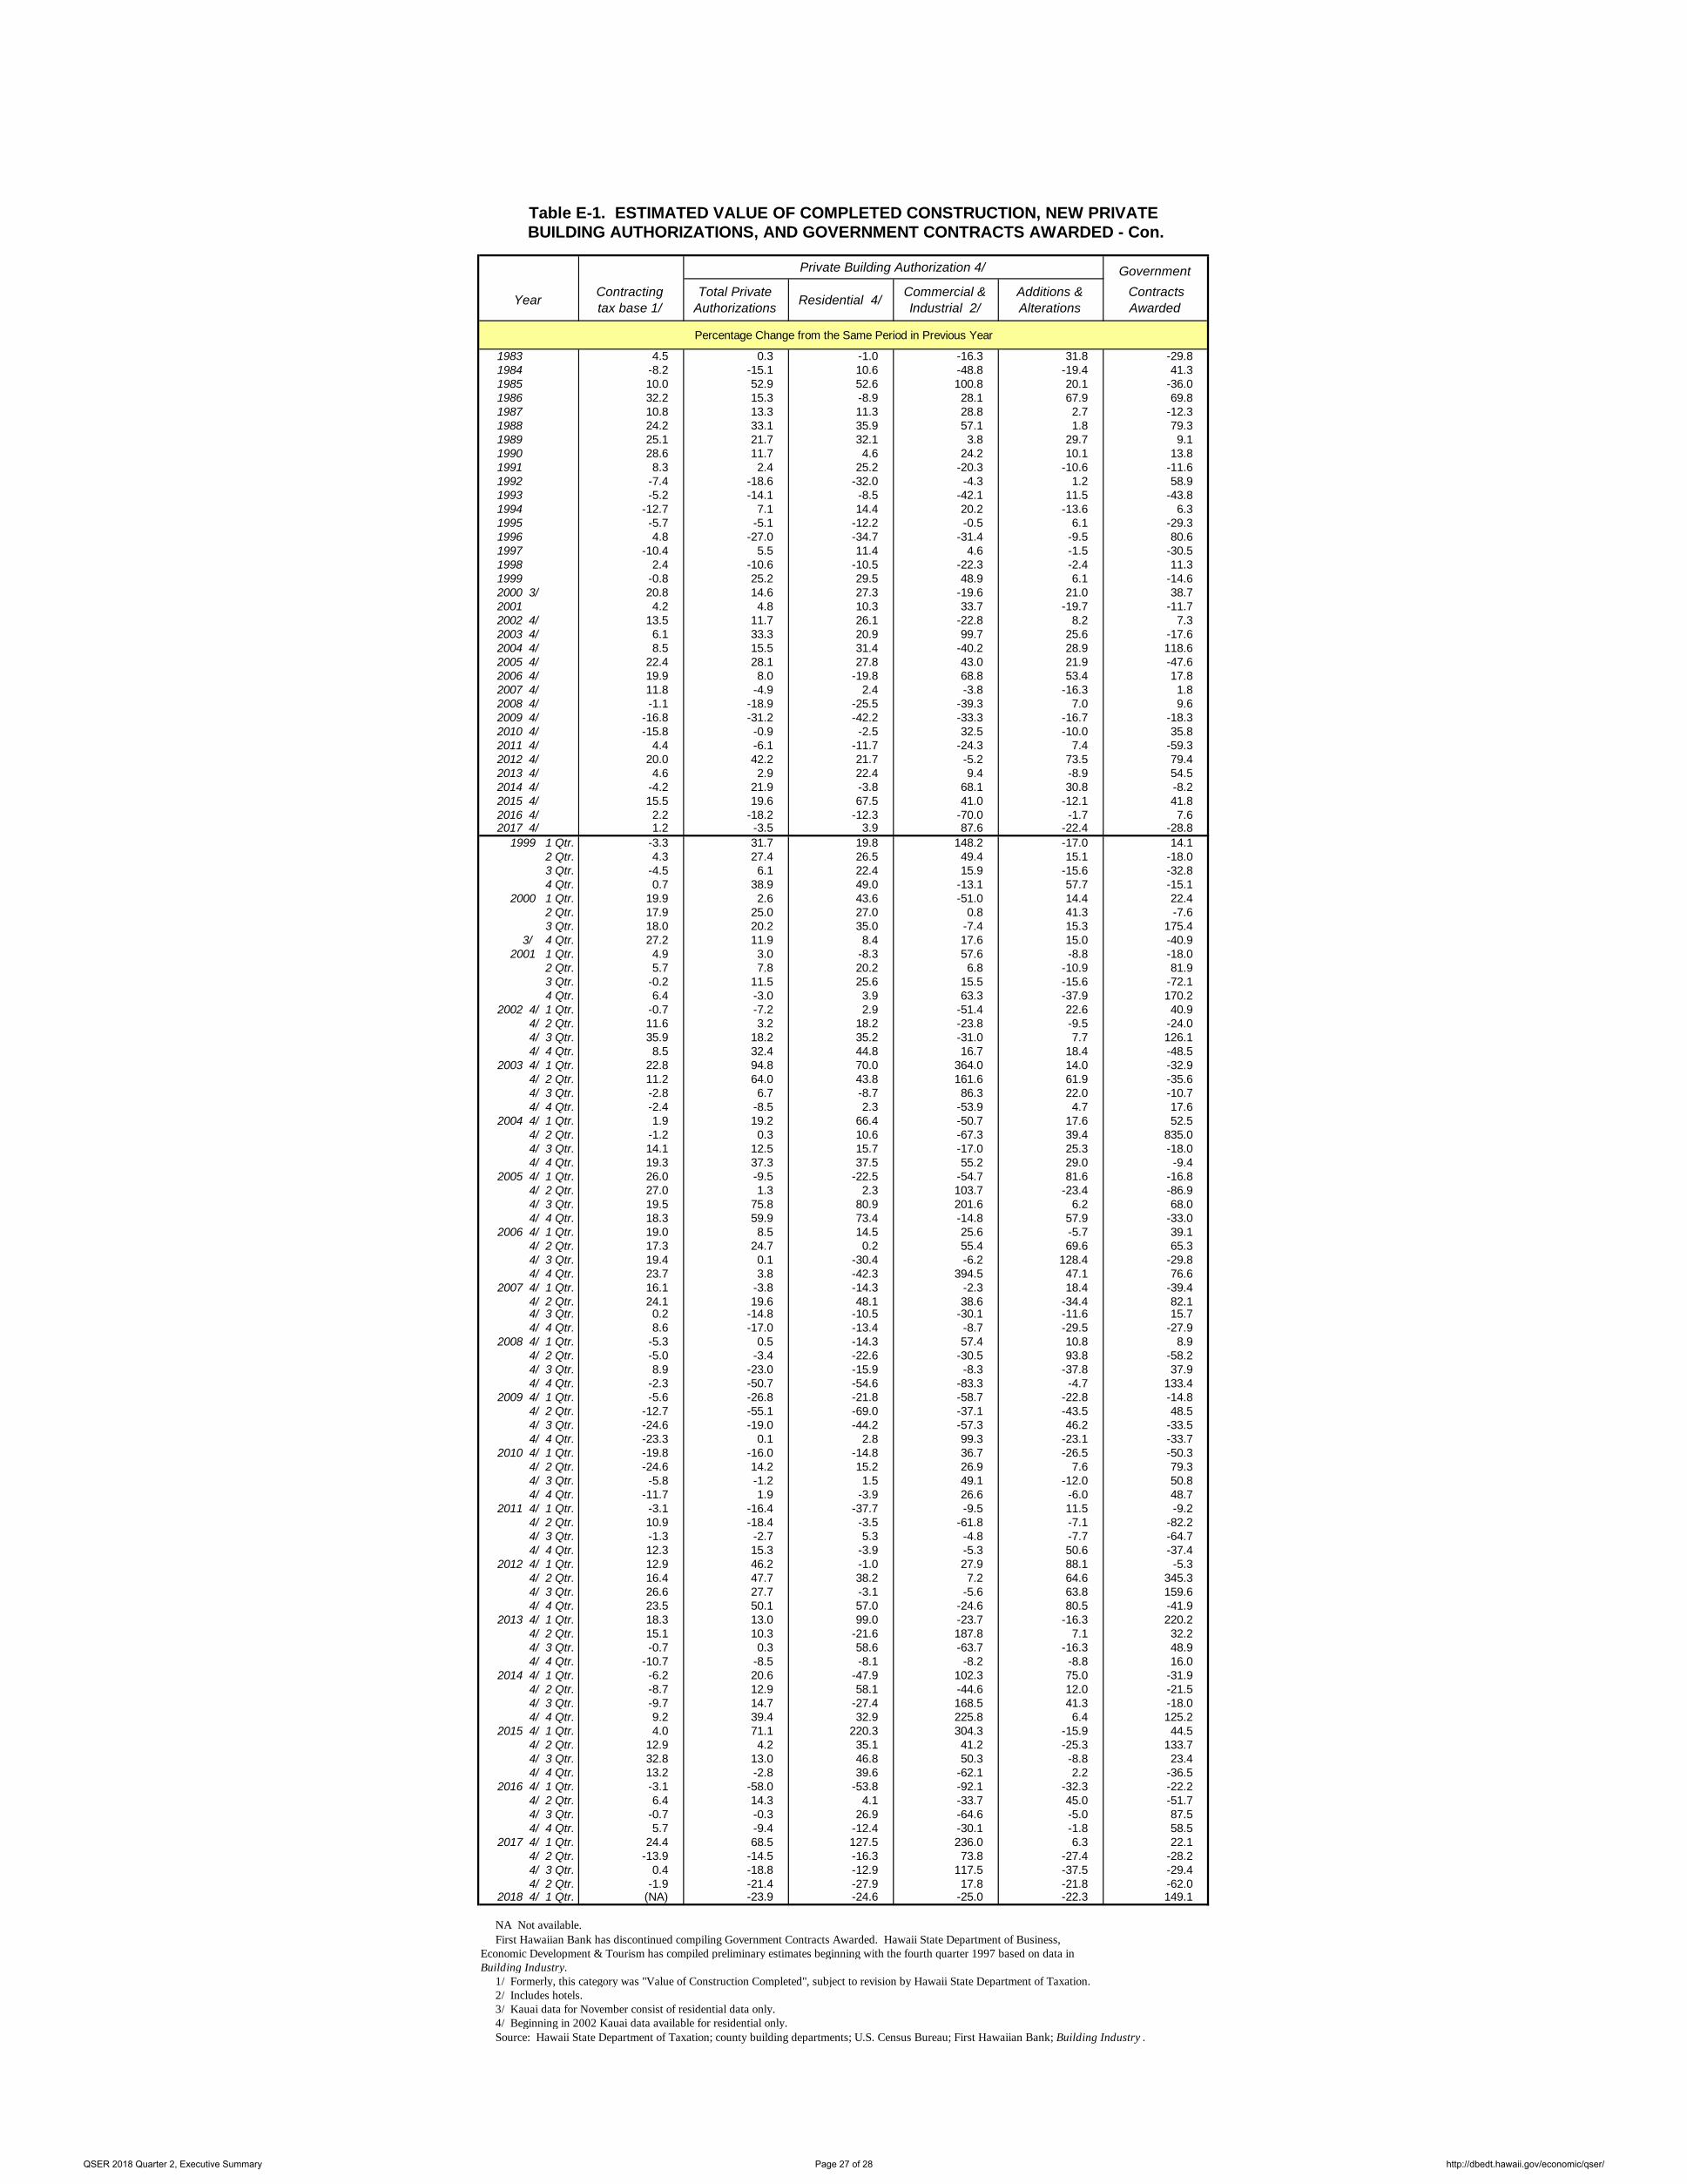
Table E-1. ESTIMATED VALUE OF COMPLETED CONSTRUCTION, NEW PRIVATE BUILDING AUTHORIZATIONS, AND GOVERNMENT CONTRACTS AWARDED - Con.
Private Building Authorization 4/ Government
Year Contracting tax base 1/
Total Private Authorizations Residential 4/ Commercial &
Industrial 2/Additions & Alterations
Contracts Awarded
Percentage Change from the Same Period in Previous Year
1983 4.5 0.3 -1.0 -16.3 31.8 -29.8 1984 -8.2 -15.1 10.6 -48.8 -19.4 41.3 1985 10.0 52.9 52.6 100.8 20.1 -36.0 1986 32.2 15.3 -8.9 28.1 67.9 69.8 1987 10.8 13.3 11.3 28.8 2.7 -12.3 1988 24.2 33.1 35.9 57.1 1.8 79.3 1989 25.1 21.7 32.1 3.8 29.7 9.1 1990 28.6 11.7 4.6 24.2 10.1 13.8 1991 8.3 2.4 25.2 -20.3 -10.6 -11.6 1992 -7.4 -18.6 -32.0 -4.3 1.2 58.9 1993 -5.2 -14.1 -8.5 -42.1 11.5 -43.8 1994 -12.7 7.1 14.4 20.2 -13.6 6.3 1995 -5.7 -5.1 -12.2 -0.5 6.1 -29.3 1996 4.8 -27.0 -34.7 -31.4 -9.5 80.6 1997 -10.4 5.5 11.4 4.6 -1.5 -30.5 1998 2.4 -10.6 -10.5 -22.3 -2.4 11.3 1999 -0.8 25.2 29.5 48.9 6.1 -14.6 2000 3/ 20.8 14.6 27.3 -19.6 21.0 38.7 2001 4.2 4.8 10.3 33.7 -19.7 -11.7 2002 4/ 13.5 11.7 26.1 -22.8 8.2 7.3 2003 4/ 6.1 33.3 20.9 99.7 25.6 -17.6 2004 4/ 8.5 15.5 31.4 -40.2 28.9 118.6 2005 4/ 22.4 28.1 27.8 43.0 21.9 -47.6 2006 4/ 19.9 8.0 -19.8 68.8 53.4 17.8 2007 4/ 11.8 -4.9 2.4 -3.8 -16.3 1.8 2008 4/ -1.1 -18.9 -25.5 -39.3 7.0 9.6 2009 4/ -16.8 -31.2 -42.2 -33.3 -16.7 -18.3 2010 4/ -15.8 -0.9 -2.5 32.5 -10.0 35.8 2011 4/ 4.4 -6.1 -11.7 -24.3 7.4 -59.3 2012 4/ 20.0 42.2 21.7 -5.2 73.5 79.4 2013 4/ 4.6 2.9 22.4 9.4 -8.9 54.5 2014 4/ -4.2 21.9 -3.8 68.1 30.8 -8.2 2015 4/ 15.5 19.6 67.5 41.0 -12.1 41.8 2016 4/ 2.2 -18.2 -12.3 -70.0 -1.7 7.6 2017 4/ 1.2 -3.5 3.9 87.6 -22.4 -28.8
1999 1 Qtr. -3.3 31.7 19.8 148.2 -17.0 14.1 2 Qtr. 4.3 27.4 26.5 49.4 15.1 -18.0 3 Qtr. -4.5 6.1 22.4 15.9 -15.6 -32.8 4 Qtr. 0.7 38.9 49.0 -13.1 57.7 -15.1 2000 1 Qtr. 19.9 2.6 43.6 -51.0 14.4 22.4 2 Qtr. 17.9 25.0 27.0 0.8 41.3 -7.6 3 Qtr. 18.0 20.2 35.0 -7.4 15.3 175.4 3/ 4 Qtr. 27.2 11.9 8.4 17.6 15.0 -40.9 2001 1 Qtr. 4.9 3.0 -8.3 57.6 -8.8 -18.0 2 Qtr. 5.7 7.8 20.2 6.8 -10.9 81.9 3 Qtr. -0.2 11.5 25.6 15.5 -15.6 -72.1 4 Qtr. 6.4 -3.0 3.9 63.3 -37.9 170.2
2002 4/ 1 Qtr. -0.7 -7.2 2.9 -51.4 22.6 40.9 4/ 2 Qtr. 11.6 3.2 18.2 -23.8 -9.5 -24.0 4/ 3 Qtr. 35.9 18.2 35.2 -31.0 7.7 126.1 4/ 4 Qtr. 8.5 32.4 44.8 16.7 18.4 -48.5
2003 4/ 1 Qtr. 22.8 94.8 70.0 364.0 14.0 -32.9 4/ 2 Qtr. 11.2 64.0 43.8 161.6 61.9 -35.6 4/ 3 Qtr. -2.8 6.7 -8.7 86.3 22.0 -10.7 4/ 4 Qtr. -2.4 -8.5 2.3 -53.9 4.7 17.6
2004 4/ 1 Qtr. 1.9 19.2 66.4 -50.7 17.6 52.5 4/ 2 Qtr. -1.2 0.3 10.6 -67.3 39.4 835.0 4/ 3 Qtr. 14.1 12.5 15.7 -17.0 25.3 -18.0 4/ 4 Qtr. 19.3 37.3 37.5 55.2 29.0 -9.4
2005 4/ 1 Qtr. 26.0 -9.5 -22.5 -54.7 81.6 -16.8 4/ 2 Qtr. 27.0 1.3 2.3 103.7 -23.4 -86.9 4/ 3 Qtr. 19.5 75.8 80.9 201.6 6.2 68.0 4/ 4 Qtr. 18.3 59.9 73.4 -14.8 57.9 -33.0
2006 4/ 1 Qtr. 19.0 8.5 14.5 25.6 -5.7 39.1 4/ 2 Qtr. 17.3 24.7 0.2 55.4 69.6 65.3 4/ 3 Qtr. 19.4 0.1 -30.4 -6.2 128.4 -29.8 4/ 4 Qtr. 23.7 3.8 -42.3 394.5 47.1 76.6
2007 4/ 1 Qtr. 16.1 -3.8 -14.3 -2.3 18.4 -39.4 4/ 2 Qtr. 24.1 19.6 48.1 38.6 -34.4 82.1 4/ 3 Qtr. 0.2 -14.8 -10.5 -30.1 -11.6 15.7 4/ 4 Qtr. 8.6 -17.0 -13.4 -8.7 -29.5 -27.9
2008 4/ 1 Qtr. -5.3 0.5 -14.3 57.4 10.8 8.9 4/ 2 Qtr. -5.0 -3.4 -22.6 -30.5 93.8 -58.2 4/ 3 Qtr. 8.9 -23.0 -15.9 -8.3 -37.8 37.9 4/ 4 Qtr. -2.3 -50.7 -54.6 -83.3 -4.7 133.4
2009 4/ 1 Qtr. -5.6 -26.8 -21.8 -58.7 -22.8 -14.8 4/ 2 Qtr. -12.7 -55.1 -69.0 -37.1 -43.5 48.5 4/ 3 Qtr. -24.6 -19.0 -44.2 -57.3 46.2 -33.5 4/ 4 Qtr. -23.3 0.1 2.8 99.3 -23.1 -33.7
2010 4/ 1 Qtr. -19.8 -16.0 -14.8 36.7 -26.5 -50.3 4/ 2 Qtr. -24.6 14.2 15.2 26.9 7.6 79.3 4/ 3 Qtr. -5.8 -1.2 1.5 49.1 -12.0 50.8 4/ 4 Qtr. -11.7 1.9 -3.9 26.6 -6.0 48.7
2011 4/ 1 Qtr. -3.1 -16.4 -37.7 -9.5 11.5 -9.2 4/ 2 Qtr. 10.9 -18.4 -3.5 -61.8 -7.1 -82.2 4/ 3 Qtr. -1.3 -2.7 5.3 -4.8 -7.7 -64.7 4/ 4 Qtr. 12.3 15.3 -3.9 -5.3 50.6 -37.4
2012 4/ 1 Qtr. 12.9 46.2 -1.0 27.9 88.1 -5.3 4/ 2 Qtr. 16.4 47.7 38.2 7.2 64.6 345.3 4/ 3 Qtr. 26.6 27.7 -3.1 -5.6 63.8 159.6 4/ 4 Qtr. 23.5 50.1 57.0 -24.6 80.5 -41.9
2013 4/ 1 Qtr. 18.3 13.0 99.0 -23.7 -16.3 220.2 4/ 2 Qtr. 15.1 10.3 -21.6 187.8 7.1 32.2 4/ 3 Qtr. -0.7 0.3 58.6 -63.7 -16.3 48.9 4/ 4 Qtr. -10.7 -8.5 -8.1 -8.2 -8.8 16.0
2014 4/ 1 Qtr. -6.2 20.6 -47.9 102.3 75.0 -31.9 4/ 2 Qtr. -8.7 12.9 58.1 -44.6 12.0 -21.5 4/ 3 Qtr. -9.7 14.7 -27.4 168.5 41.3 -18.0 4/ 4 Qtr. 9.2 39.4 32.9 225.8 6.4 125.2
2015 4/ 1 Qtr. 4.0 71.1 220.3 304.3 -15.9 44.5 4/ 2 Qtr. 12.9 4.2 35.1 41.2 -25.3 133.7 4/ 3 Qtr. 32.8 13.0 46.8 50.3 -8.8 23.4 4/ 4 Qtr. 13.2 -2.8 39.6 -62.1 2.2 -36.5
2016 4/ 1 Qtr. -3.1 -58.0 -53.8 -92.1 -32.3 -22.2 4/ 2 Qtr. 6.4 14.3 4.1 -33.7 45.0 -51.7
4/ 3 Qtr. -0.7 -0.3 26.9 -64.6 -5.0 87.5 4/ 4 Qtr. 5.7 -9.4 -12.4 -30.1 -1.8 58.5
2017 4/ 1 Qtr. 24.4 68.5 127.5 236.0 6.3 22.1 4/ 2 Qtr. -13.9 -14.5 -16.3 73.8 -27.4 -28.2
4/ 3 Qtr. 0.4 -18.8 -12.9 117.5 -37.5 -29.4 4/ 2 Qtr. -1.9 -21.4 -27.9 17.8 -21.8 -62.0
2018 4/ 1 Qtr. (NA) -23.9 -24.6 -25.0 -22.3 149.1
NA Not available. First Hawaiian Bank has discontinued compiling Government Contracts Awarded. Hawaii State Department of Business, Economic Development & Tourism has compiled preliminary estimates beginning with the fourth quarter 1997 based on data in Building Industry. 1/ Formerly, this category was "Value of Construction Completed", subject to revision by Hawaii State Department of Taxation. 2/ Includes hotels. 3/ Kauai data for November consist of residential data only. 4/ Beginning in 2002 Kauai data available for residential only. Source: Hawaii State Department of Taxation; county building departments; U.S. Census Bureau; First Hawaiian Bank; Building Industry .
QSER 2018 Quarter 2, Executive Summary Page 27 of 28 http://dbedt.hawaii.gov/economic/qser/
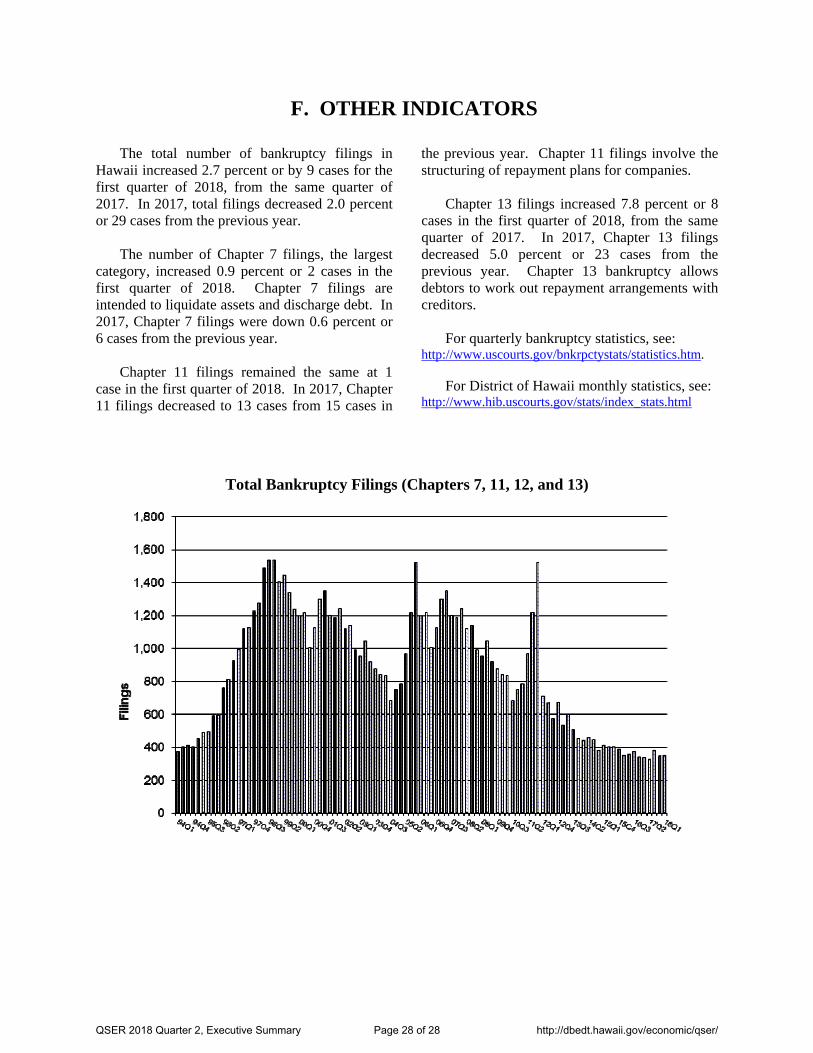
F. OTHER INDICATORS
The total number of bankruptcy filings in Hawaii increased 2.7 percent or by 9 cases for the first quarter of 2018, from the same quarter of 2017. In 2017, total filings decreased 2.0 percent or 29 cases from the previous year.
The number of Chapter 7 filings, the largest
category, increased 0.9 percent or 2 cases in the first quarter of 2018. Chapter 7 filings are intended to liquidate assets and discharge debt. In 2017, Chapter 7 filings were down 0.6 percent or 6 cases from the previous year.
Chapter 11 filings remained the same at 1 case in the first quarter of 2018. In 2017, Chapter 11 filings decreased to 13 cases from 15 cases in
the previous year. Chapter 11 filings involve the structuring of repayment plans for companies.
Chapter 13 filings increased 7.8 percent or 8
cases in the first quarter of 2018, from the same quarter of 2017. In 2017, Chapter 13 filings decreased 5.0 percent or 23 cases from the previous year. Chapter 13 bankruptcy allows debtors to work out repayment arrangements with creditors.
For quarterly bankruptcy statistics, see: http://www.uscourts.gov/bnkrpctystats/statistics.htm.
For District of Hawaii monthly statistics, see:
http://www.hib.uscourts.gov/stats/index_stats.html
Total Bankruptcy Filings (Chapters 7, 11, 12, and 13)
QSER 2018 Quarter 2, Executive Summary Page 28 of 28 http://dbedt.hawaii.gov/economic/qser/