Embed Size (px)
Citation preview
Quarterly Statement
1st Quarter
2021
Quarterly Statement as of March 31, 2021 Developments within the Group and R&D 2
Quartalsmitteilung zum 31. März 2020 Inhaltsverzeichnis
TABLE OF CONTENTS
3 Merck – In brief
4 Developments within the Group and R&D 13 Course of Business and Economic Position
13 Merck20 Healthcare24 Life Science27 Electronics30 Corporate and Other
31 Report on Expected Developments
36 Supplemental Financial Information37 Consolidated Income Statement38 Statement of Comprehensive Income39 Consolidated Balance Sheet40 Consolidated Cash Flow Statement41 Consolidated Statement of Changes in Net Equity43 Information by Business Sector46 Significant events during the reporting period47 Subsequent events48 Effects of disclosure changes
49 Financial Calendar
This document is a quarterly statement pursuant to section 53 of the Exchange Rules for the Frankfurt Stock Exchange.
This quarterly statement contains certain financial indicators such as operating result (EBIT), EBITDA, EBITDA pre, net financial debt and earnings per share pre, which are not defined by International Financial Reporting Standards (IFRS). These financial indicators should not be taken into account in order to assess the performance of Merck in isolation or used as an alternative to the financial indicators presented in the consolidated financial statements and determined in accordance with IFRS.
The figures presented in this quarterly statement have been rounded. This may lead to individual values not adding up to the totals presented.
The Annual Report for 2020 has been optimized for mobile devices and is available on the Web at merckgroup.com/en/annualreport/2020/.
Quarterly Statement as of March 31, 2021 Developments within the Group and R&D 3
2021
2021
2020
2020
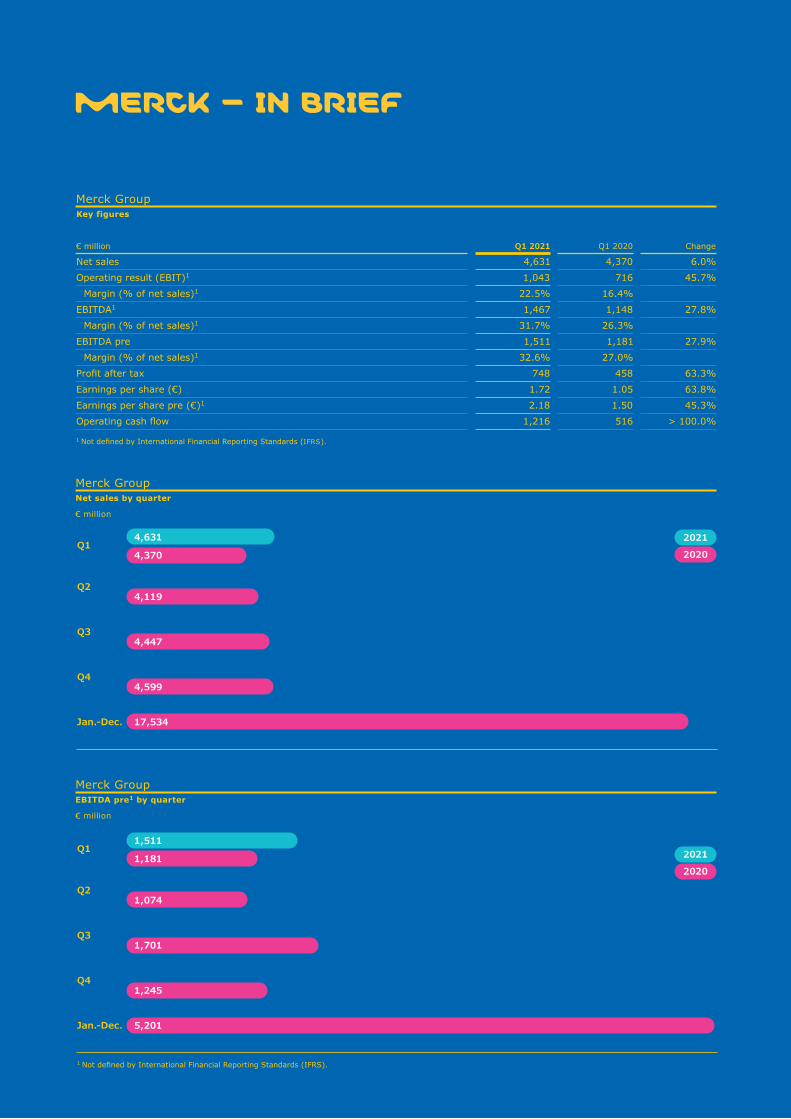
Merck Group Key figures
€ million Q1 2021 Q1 2020 Change
Net sales 4,631 4,370 6.0%
Operating result (EBIT)1 1,043 716 45.7%
Margin (% of net sales)1 22.5% 16.4%
EBITDA1 1,467 1,148 27.8%
Margin (% of net sales)1 31.7% 26.3%
EBITDA pre 1,511 1,181 27.9%
Margin (% of net sales)1 32.6% 27.0%
Profit after tax 748 458 63.3%
Earnings per share (€) 1.72 1.05 63.8%
Earnings per share pre (€)1 2.18 1.50 45.3%
Operating cash flow 1,216 516 > 100.0%
1 Not defined by International Financial Reporting Standards (IFRS).
MERCK – IN BRIEF
Q1
Q1
Q2
Q2
Q3
Q3
Q4
Q4
Jan.-Dec.
Jan.-Dec.
4,631
1,511
Merck Group Net sales by quarter
€ million
Merck Group EBITDA pre1 by quarter
€ million
4,370
1,181
4,119
1,074
4,447
1,701
4,599
1,245
17,534
5,201
1 Not defined by International Financial Reporting Standards (IFRS).
Quarterly Statement as of March 31, 2021 Developments within the Group and R&D 4
Developments within the Group and R&DGroupWe are a vibrant science and technology company. Science is at the heart of everything we do. It drives the discoveries we make and the technologies we create. Our work makes a positive difference to millions of people’s lives every day. In Healthcare, we discover unique ways to treat the most challenging diseases such as multiple sclerosis and cancer. Our Life Science experts empower scientists by developing tools and solutions that help deliver breakthroughs more quickly. And in Electronics, we develop science that sits inside technolo-gies and changes the way we access and display information. Everything we do is fueled by a belief in science and technology as a force for good. A belief that has driven our work since 1668 and will continue to inspire us to find more joyful and sustainable ways to live. We are curious minds dedicated to human progress. We operate globally under our corporate brand. The only exceptions are Canada and the United States. In these countries, we operate as EMD Serono in the Biopharma business, as MilliporeSigma in the Life Science business and as EMD Electronics in the high-tech materials business. We had 57,850 employees worldwide on March 31, 2021, compared with 57,451 employees on March 31, 2020.
This section of the present quarterly statement summarizes the highlights of the first quarter of 2021 at Merck KGaA, Darmstadt, Germany, including those in research in development. A detailed description of the Group and its business sectors can be found in our Annual Report for 2020.
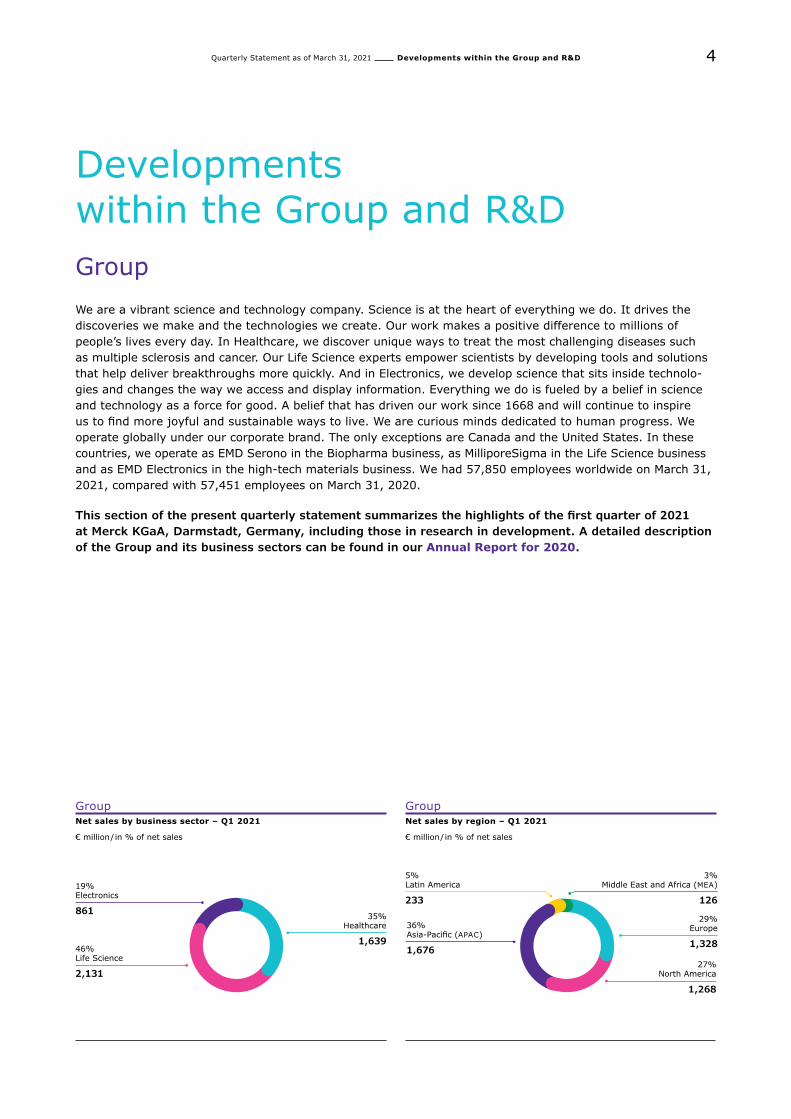
GroupNet sales by business sector – Q1 2021
€ million/in % of net sales
46% Life Science
2,131
19% Electronics
861 35% Healthcare
1,639
GroupNet sales by region – Q1 2021
€ million/in % of net sales
3% Middle East and Africa (MEA)
126
36% Asia-Pacific (APAC)
1,676
5% Latin America
233
29% Europe
1,328
27% North America
1,268
Quarterly Statement as of March 31, 2021 Developments within the Group and R&D 5
Healthcare
• We are here for people at every step, helping to create, improve and prolong life. Patients are at the center of our work and with every advance, we are improving lives. This single ambition drives every-thing we do.
• Since the start of the Covid-19 pandemic more than a year ago, we have been continuously making every effort to proactively handle the situation and minimize the impact of the pandemic on the supply of our medicines locally and globally through three main levers: the thorough implementation of our business continuity plans across our network, the active management of our stocks and the assessment of alternative transportation routes to reach our customers and patients.
Oncology and Immuno-Oncology
• On January 20, we announced an update on the Phase III INTR@PID Lung 037 study evaluating the potential first-in-class investigational bifunctional immunotherapy bintrafusp alfa in the first-line treat-ment of patients with stage IV non-small cell lung cancer (NSCLC) who have high expression of PD-L1. While reviewing the totality of data from the ongoing clinical trial, the Independent Data Monitoring Committee recommended the discontinuation of the clinical trial. Based on this recommendation, Merck made the decision to discontinue the clinical trial, as the study is unlikely to meet the co-primary end-point, specifically progression-free survival. Bintrafusp alfa is being developed through a strategic alliance with GlaxoSmithKline.
• On January 25, we and our alliance partner Pfizer Inc. announced that the European Commission had approved Bavencio® (avelumab) as monotherapy for the first-line maintenance treatment of adult patients with locally advanced or metastatic urothelial carcinoma who are progression-free following platinum-based chemotherapy. This new indication of Bavencio® was also approved in Japan on February 24, making Bavencio® available in this setting in three major markets – the United States, Europe and Japan.
• On February 3, we announced approval of Tepmetko® (tepotinib) by the U.S. Food and Drug Administra-tion (FDA). Tepmetko® is the first and only once-daily oral MET inhibitor for the treatment of adult patients with metastatic NSCLC harboring METex14 skipping alterations. In the VISION study, the largest clinical study to date of patients with this form of NSCLC, Tepmetko® demonstrated consistent and durable responses in both treatment-naïve and previously treated patients harboring METex14 skipping alterations. Specifically, Tepmetko® demonstrated an overall response rate of 43 % in treatment-naïve
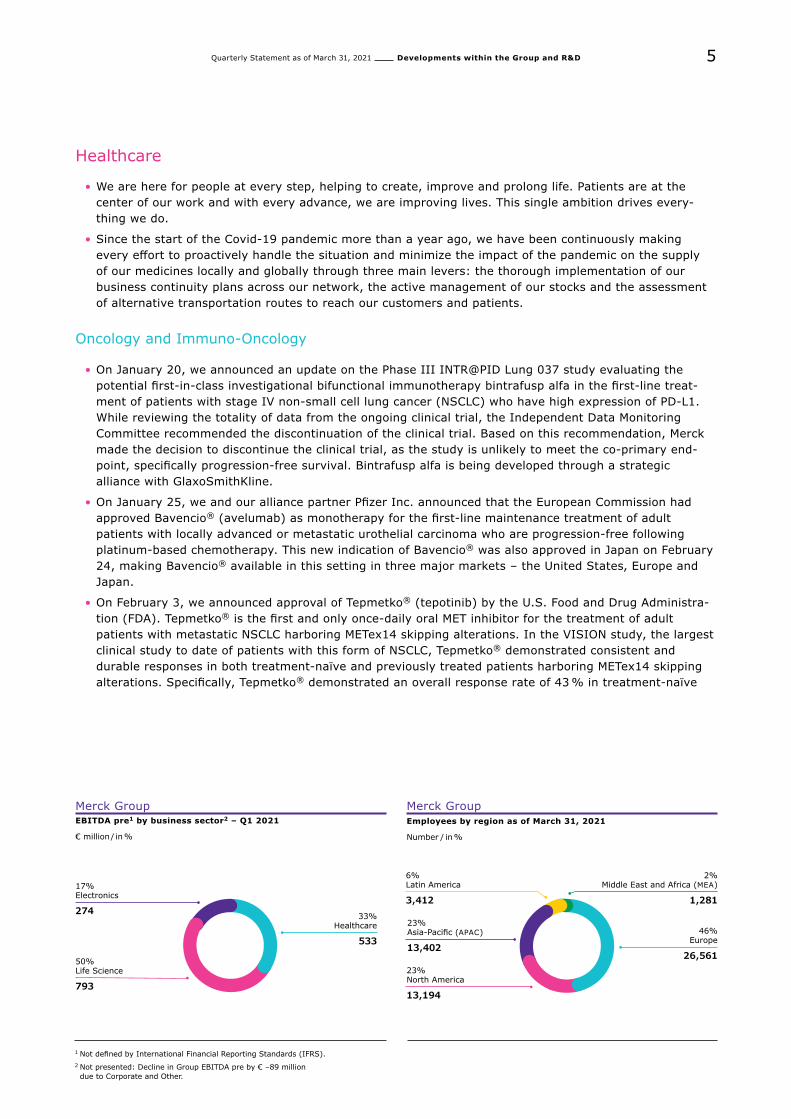
Merck GroupEBITDA pre1 by business sector2 – Q1 2021
€ million / in %
50% Life Science
793
17% Electronics
274 33% Healthcare
533
Merck GroupEmployees by region as of March 31, 2021
Number / in %
2% Middle East and Africa (MEA)
1,281
23% Asia-Pacific (APAC)
13,402
23% North America
13,194
6% Latin America
3,412
46% Europe
26,561
1 Not defined by International Financial Reporting Standards (IFRS).2 Not presented: Decline in Group EBITDA pre by € –89 million due to Corporate and Other.
Quarterly Statement as of March 31, 2021 Developments within the Group and R&D 6
patients (n=69) and 43 % (95 % CI, 33-55) in previously treated patients (n=83). Median duration of response was 10.8 months and 11.1 months among treatment-naïve and previously treated patients, respectively. The FDA completed its accelerated review of Tepmetko® under its Real-Time Oncology Review pilot program after previously granting the medicine Breakthrough Therapy Designation.
• On March 1, we announced a worldwide in-licensing agreement with Debiopharm, Lausanne, Switzerland, for the development and commercialization of xevinapant (Debio 1143), a potent oral IAP (inhibitor of apoptosis proteins) antagonist. Merck will co-fund the ongoing Phase III registrational TrilynX study, evaluating xevinapant for previously untreated high-risk locally advanced squamous cell carcinoma of the head and neck (LA SCCHN), in combination with platinum-based chemotherapy and standard fraction-ation intensity-modulated radiotherapy. Merck will also initiate a second global Phase III study in LA SCCHN patients who are unable to tolerate high-dose cisplatin in combination with radiotherapy. Under the terms of the licensing agreement, Merck gains exclusive rights to develop and commercialize xevina-pant worldwide. The agreement also includes development rights for preclinical follow-on compounds to xevinapant. Debiopharm will receive € 188 million in upfront payments and up to € 710 million in regula-tory and commercial milestones, as well as royalty payments.
• On March 16, we announced topline data from the Phase II INTR@PID BTC 047 study evaluating bintra-fusp alfa as a monotherapy in the second-line treatment of patients with locally advanced or metastatic biliary tract cancer (BTC) who have failed or are intolerant of first-line platinum-based chemotherapy. Bintrafusp alfa demonstrated single-agent efficacy and durability with a manageable safety profile after more than nine months of follow-up. Though single-agent activity was observed, the study did not meet the pre-defined threshold that would have enabled regulatory filing for BTC in the second-line setting. A Phase II/III randomized, placebo-controlled study of bintrafusp alfa in combination with chemotherapy in the first-line BTC setting is ongoing.
Neurology and Immunology
• We have a long-standing track record in neurology and immunology, including more than two decades of experience in multiple sclerosis (MS), and are committed to helping people living with neuroinflammatory diseases by focusing on finding solutions addressing unmet medical needs. Our current MS portfolio includes two products for the treatment of relapsing MS (RMS) – Rebif® (interferon beta-1a) and Mavenclad® (cladribine tablets). Rebif® has been a standard of care in MS treatment for more than 20 years with data supported by more than 1.6 million patient-years of therapy since approval. In March, French health authorities granted marketing authorization and reimbursement for Mavenclad®, making it available for people living with MS in France. Therefore, Mavenclad® has now been approved in a total of more than 80 countries worldwide, including in the EU, the United Kingdom, Canada, Australia, and the United States.
• On February 25, we announced the presentation of a new analysis from the MAGNIFY-MS study on Mavenclad® in patients with RMS at the Americas Committee for Treatment and Research in Multiple Sclerosis (ACTRIMS) Forum 2021, indicating that RMS patients receiving Mavenclad® are able to mount a protective antibody response to common vaccines. The MAGNIFY-MS retrospective analysis demon-strated that patients develop protective antibody levels for at least six months following seasonal influ-enza and varicella zoster vaccines, irrespective of vaccine timing relative to Mavenclad® dosing.
Quarterly Statement as of March 31, 2021 Developments within the Group and R&D 7
Fertility
• To date, an estimated 4 million babies have been born with the help of our Fertility portfolio.
• The Pergoveris® pen is the first product with a combination of recombinant follicle-stimulating hormone (FSH) and recombinant luteinizing hormone (LH) in a ready-to-use liquid version, eliminating the need for mixing. It thus provides an improved and convenient treatment option for women with severe defi-ciency of both FSH and LH. Launches around the globe will continue in order to provide patients with access to this therapeutic. The Pergoveris® pen was successfully launched in the United Kingdom in the first quarter of 2021 and is now available in 40 countries.
• Throughout the Covid-19 pandemic, we have helped patients advance their treatment at home with the release of our Gonal-f® (follitropin alfa) 150 IU pen.
Cardiovascular, Metabolism and Endocrinology
• Our new formulation of Euthyrox® (levothyroxine) for the treatment of hypothyroidism received further regulatory approvals in the first quarter, resulting in a total of 71 countries in which it has been approved.
• Glucophage®, containing the active ingredient metformin, is now approved in 65 countries for prediabetes when lifestyle intervention is not enough to control the condition. With the successful submission and launch of Glucophage® XR 850, a new dose strength is available within the Glucophage® product range specifically dedicated for the treatment of prediabetes. It was approved in El Salvador and the Dominican Republic in the first quarter of 2021.
• On February 1, Contrave® was approved in Ecuador by the national regulatory authority ARCSA. With this approval, Ecuador becomes the fourth country to receive approval in Latin America following Peru, Chile and Mexico. Contrave® is indicated for weight management in adults with a body mass index (BMI) of 30 or greater, which is considered as obesity; or those with a BMI of 27 or greater, which is considered as overweight.
• Concor® AM, our drug to treat hypertension, is now available in 57 countries.
• In the first quarter of 2021, the number of new patients using the Easypod® electromechanical injection device for treatment with Saizen® (somatropin) continued to grow, bringing the total number of patients enrolled on Easypod® Connect to 27,648. Saizen® is our main endocrinology product and is indicated for the treatment of growth hormone deficiency in children and adults.
• We continued the rollout of Aluetta®, our new pen for the injection of Saizen®, taking the total number of countries where it is currently available to 23.
• As the digital revolution is transforming both the overall healthcare environment and customer needs, we are continuously expanding beyond traditional methods of customer outreach and working to advance personalized care. To this end, in the first quarter of 2021 we launched an external website called the Cardiometabolic Information Center which presents our expertise in cardiovascular diseases, diabetes and thyroid disorders. Through different gateways, patients and healthcare professionals can access useful information about cardiometabolic disorders, driving digital customer engagement and patient information.
Quarterly Statement as of March 31, 2021 Developments within the Group and R&D 8
Life Science
• We provide infinite solutions to solve the toughest problems in life science in collaboration with the global scientific community. Our high-quality products, technology and expertise empower scientists and engineers at every stage, helping deliver breakthrough therapies faster to accelerate access to better health. In terms of sales, our Life Science business sector has achieved a top-three ranking in the global life science industry. Our work is redefining the industry as we know it, because we believe science should know no bounds.
• In the first quarter of 2021, we continued to focus on meeting customer needs by launching more than 4,100 products across the Research Solutions, Process Solutions and Applied Solutions business units, including those launched through our ‟faucet program” for antibodies, reference materials, chemicals, and nanomaterials.
• In February, we were named as the Sustainable Business & Enterprise Roundtable Outstanding Corporate Leader of 2020. The award recognizes Merck’s new sustainability strategy, which integrates sustainability as an essential component of the company’s corporate strategy and includes a goal to reach specific climate neutrality scopes by 2040.
• Furthermore, we announced seven expanded partnerships with leading nonprofit organizations across the world to build on our commitment to accelerate scientific research and science education. These long-term, multi-dimensional partnerships are designed to increase educational and research equity, including access to science education for more than 500,000 students in underserved communities, globally. The announcement included partnerships with BioSTL, Seeding Labs, Chemistry on the Go, Discovery World, Girlstart, Technorama and Knowledge is Power Program St. Louis.
• Also in February, we launched an enhanced Design for Sustainability framework, offering a unique approach to holistically integrate sustainability into products, systems and services. The important strategic initiative offers customers data-driven insights for greener solutions. With this launch, we lead the life science industry in ensuring that sustainability is at the forefront of each stage of the product life cycle, supporting our commitment to integrate sustainability into all value chains by 2030.
• In March, we signed a 12-year, off-site, virtual power purchase agreement with Enel Green Power for the construction of a future wind and storage project in Texas, United States. As part of our ongoing commit-ment to renewable energy, we are an anchor buyer within the Net Zero Consortium for Buyers, which is among the largest aggregation deals in the world. The agreement will deliver Renewable Energy Certifi-cates to match 65 % of our company’s U.S. electricity consumption or 100 % of the Life Science business sector‘s U.S. electricity consumption.
• Moreover, we joined Massachusetts Institute of Technology’s (MIT) Center for Collective Intelligence and Community Biotechnology Initiative at the MIT Media Lab in releasing a comprehensive report on pan-demic response solutions. Developed by 180 leading experts convened using MIT CCI’s collective intelli-gence platform and methodology, the report synthesizes data-driven insights generated from this expert group during a three-week curated exercise aimed at proposing solutions to accelerate recovery from Covid-19 and prepare for future disease outbreaks.
Quarterly Statement as of March 31, 2021 Developments within the Group and R&D 9
Process Solutions
• In January, we announced the acquisition of AmpTec GmbH, a leading Hamburg, Germany-based, mRNA contract development and manufacturing organization (CDMO), to strengthen our capabilities to develop and manufacture mRNA for customer use in vaccines, treatments and diagnostics applicable in Covid-19 and many other diseases. By combining AmpTec’s PCR-based mRNA technology with our more than 20 years of expertise in lipid manufacturing for the formulation of mRNA therapeutics, we will provide a differentiated and integrated offering across the mRNA value chain.
• In February, we announced further expansion of our strategic partnership with BioNTech to accelerate supply of urgently-need lipids used for the production of the Pfizer-BioNTech vaccine (BNT162b2). We are one of a few companies in the world currently able to produce custom lipids in significant quantities according to the highest quality requirements needed for vaccine production. Intensifying the existing collaboration and expanding our already high lipid production capacity, we, together with BioNTech, will define exact requirements for timely execution of the joint efforts.
• Also in February, we announced an agreement with Alteogen, Inc., of South Korea, to provide late-stage CDMO services through our BioReliance® End-to-End Solutions to develop and produce recombinant biologics used in the development and clinical evaluation of next-generation therapeutics from monoclo-nal antibody drugs. The agreement includes late-stage development, scale-up and Good Manufacturing Practice manufacturing of novel biologics supporting therapeutic antibody formulation. It will leverage our global CDMO network in three regions.
• In March, we accelerated our European expansion plans to add a single-use assembly production unit at our site in Molsheim, France. With the € 25 million investment, we are responding to the unprecedented global demand of this key technology, which is used for the production of Covid-19 vaccines and other lifesaving therapies. The new unit will produce Mobius® single-use assemblies, a key offering in our Mobius® MyWay program, and is planned to be operational by the end of 2021.
Research Solutions
• In March, we announced a strategic partnership with the Faculty of Mathematics and Natural Sciences, University of Indonesia, to establish our first Collaboration Laboratory with the university to advance life science research and innovation development in Indonesia. The collaboration is expected to provide IDR 3 billion worth of advanced laboratory tools, equipment and expertise. By offering broad access to scientists in both academia and industry, the partnership aims to accelerate local innovation.
• Moreover, we were named 2021 Charitable Supplier of the Year and Protein Supplier of the Year 2021 by the CiteAb Awards. These awards, from a leading life science data provider, celebrate the top suppliers and individuals in the research reagent sector worldwide, helping researchers and their suppliers make more informed decisions.
Applied Solutions
• In January, we launched the new Milli-Q® EQ 7000 Type 1 water purification system to expand our benchtop ultrapure water system portfolio. The new Milli-Q® EQ 7000 system produces consistent ultrapure water quality that can be easily customized to experimental requirements, strengthening our Milli-Q® ultrapure water offering that provides reliable, high-quality sources of purified water for all scientists’ needs.
Quarterly Statement as of March 31, 2021 Developments within the Group and R&D 10
Electronics
• We are the company behind the companies, advancing digital living. Our primary focus is on the elec-tronics market. Our materials and solutions change how we generate, access, store, process, and display information. In addition, our highly specialized Surface Solutions business makes life more colorful.
• Together with our customers, we are creating the infrastructure that modern society requires for a data-driven world. Based on strong growth trends such as 5G and Big Data, and new applications such as autonomous driving and the Internet of Things (IoT), we are setting the course for future growth.
• The Electronics business sector comprises three business units: Semiconductor Solutions, Display Solu-tions and Surface Solutions. Comparing Electronics with a smartphone, Display Solutions represents the user interface, Semiconductor Solutions the intelligence, and Surface Solutions the aesthetics. We offer innovative solutions, especially for the electronics industry – for semiconductors and displays, and surfaces of every kind.
• We are well on track with the execution of our five-year Bright Future transformation program announced in 2018. After completing the acquisitions of Versum Materials and Intermolecular, we achieved a further major milestone in transforming Electronics into a strong solutions provider and a leading player in the electronic materials market. Effective March 4, 2021, we changed the name of the business sector from Performance Materials to Electronics. The new name is the visible result of the strategic realignment conducted over the past several years underscoring our strategic focus on the electronics industry.
Semiconductor Solutions
• Semiconductor Solutions is at the heart of Electronics and enables transformation in communications, mobility and healthcare. As almost every electronic device uses one of our products, we are advancing virtually every aspect of digital living. We are developing solutions for smaller, faster and more powerful devices. Semiconductor Solutions is the largest business unit in terms of sales within Electronics and offers materials, delivery systems and services for the semiconductor industry.
• The Delivery Systems & Services (DS&S) business enables the safe and responsible handling of gases and liquid chemicals for electronic manufacturers. DS&S develops and deploys safe and reliable delivery equipment to ensure our materials are handled with the highest quality and safety standards for our customers.
• Semiconductor Materials supplies products for every major production step in wafer processing, including doping, lithography, patterning, deposition, planarization, etching, and cleaning. Specialty cleans, photoresists, and conductive pastes for semiconductor packaging round off the portfolio. Our business fields are Thin-Film Solutions, Specialty Gases, Planarization, Patterning Solutions as well as our material innovation accelerator Intermolecular.
• Intermolecular is our Silicon Valley science hub and center for complex material solutions in Electronics, located in San Jose, California. We explore, test and develop combinations of advanced materials for next-generation electronics. Compared to conventional methods, our approach provides significant time savings in the material development process, faster learning cycles, and detailed findings on new mate-rial combinations to provide a unique service for customers.
• Our Thin Film Solutions business is actively developing new organosilanes for conformal, high-perfor-mance Atomic Layer Deposition (ALD) to obtain films with desirable electrical and physical properties. Materials with low-dielectric constants are highly desirable for electronic applications. We continue to develop our Plasma-enhanced Chemical Vapor Deposition (PECVD) products for low-dielectric constant applications. We are already qualified at several customers and continue to develop new materials for leading edge nodes in 5nm, 3nm and beyond. Newly engineered container delivery systems enable these materials for our customers. To support the industry’s need for faster and better processors, servers, and data storage density, we are working on new spin-on dielectric formulations with improved dielectric characteristics.
Quarterly Statement as of March 31, 2021 Developments within the Group and R&D 11
• Our new etch gas technology program in our Specialty Gases business is developing new chemistries to enable more than 100-layer, single-stack etching for advanced memory devices such as V-NAND (vertical Flash memory). We continue to see new Process of Record (POR) wins across our existing portfolio into leading-edge nodes and new product introductions.
• Our Planarization business is driving new product development across both slurry and cleans products to support the high demand for new materials in memory and logic. Our new R&D center in Korea is actively engaged with key customers and has completed several sample demonstrations. We are also working closely with customers in Taiwan and the United States to drive new product introductions, leveraging a data analytics approach to respond to inquiries quickly.
• Our Patterning business has increased engagements with leading memory and logic customers to sup-port lithography and cleaning needs for advanced leading-edge nodes. We continue to make progress in developing smart patterning solutions such as Directed Self Assembly (DSA) and Extreme Ultraviolet (EUV) materials. Our advanced Surface Preparation & Cleans products are enabling new device integra-tion paths in logic and 3D NAND. Continued innovations in thick-film photoresists and related cleaning products support advances in heterogeneous integration — the future of the semiconductor industry.
Display Solutions
• Our Display Solutions business unit consists of the Liquid Crystals (LC), Organic Light-Emitting Diodes (OLED), Photoresists, and Liquid Crystal Windows businesses, among others. We support our display customers in developing novel display technologies and product concepts for applications, while also addressing new requirements that have emerged from the Covid-19 pandemic. With the proliferation of multiple applications and display trends, the display industry’s technological requirements are signifi-cantly expanding. We are in a leading position to develop required new display materials and technology concepts to contribute to the diverse display landscape. We are active in the development of a broad range of display materials, including Liquid Crystals, organic light-emitting diodes, Quantum Dots Pixel Color Converters (QDPCC), and Display Patterning Materials (DPM).
• Our R&D and Supply teams continuously secure qualification of our LC, OLED and DPM materials in new devices.
• In Liquid Crystals we continue to see very dynamic market developments. Covid-19 has accelerated the market shift towards China and increased competition. We maintained our position as the technology leader, and with our XtraBright™ products winning new projects for large-area displays as well as high-resolution mobile devices.
• Our OLED and photoresist materials are used in multiple free-form display products. Our low-tempera-ture processable positive tone photoresists are widely used to pattern on-cell touch sensors. These sensors enable a thinner display structure, which is crucial for foldable devices.
• After having finalized lighthouse projects such as the Niemeyer Sphere in Leipzig, Germany in 2020, we launched our eyrise® i350 invisible privacy glazing in March 2021. Transparent dynamic liquid crystal glass partitions can be switched on demand to create private spaces in public and commercial venues.
• In March, we also announced the commercial launch of licriOn™, a liquid crystal-based solution for electronically beam-steered smart antennas. These antennas can easily connect with stationary and moving satellites. The energy and cost efficiency of the liquid crystal-based solution helps achieve extensive connectivity access, even in remote areas where fast Internet connections are unavailable or unaffordable today.
Quarterly Statement as of March 31, 2021 Developments within the Group and R&D 12
Surface Solutions
• The core markets for Surface Solutions are automotive coatings, cosmetics, and, to a smaller extent, industrials. We are serving these markets with functional and decorative solutions. Our focus is on expanding our portfolio through innovation in all areas and proactive solution development in close cooperation with our customers. We provide our customers with solutions that help them to create innovative surfaces of all kinds.
• Our materials make more beautiful, more resistant, and more effective products possible. Our pearlescent pigments allow striking automotive coatings, fascinating cosmetics, extraordinary packaging, and inno-vative product design. With a broad portfolio of active ingredients, we enable cosmetics manufacturers to enrich their skin care products with moisturizing, protecting, or anti-aging effects. Moreover, with our functional solutions we serve a large number of innovative applications, from dirt-repellent and easy-care surfaces to laser markings of plastic parts and cables.
• The global automotive market has recovered since the second half of 2020, which has had a positive impact on the Surface Solutions business. The upswing in the automotive market has mainly been seen in strong sales of the Xirallic® product series as well as the positive development of the silica-based effect pigment Colorstream® Lava Red.
• In addition, an upwards trend in most Industrials markets, e.g. Plastics, Printing and Electronics, contrib-uted to the performance of the Surface Solutions business in the first quarter of 2021, strongly driven by decorative pigments, functional laser pigments as well as specialty chemicals.
• As a result of the Covid-19 pandemic, the Surface Solutions Cosmetics business has leveraged its portfolio to capture new business opportunities. For example, skin care and well-being categories are key drivers for the Cosmetics business of Surface Solutions. In February, we launched a social media campaign to further position and push the entire portfolio of cosmetic ingredients for skin care applica-tions. In addition, the business unit provides appealing and ready-to-use solutions featuring specific active ingredients, effect pigments and functional fillers to protect skin from increasing exposure to blue light across all age groups, not only as a consequence of Covid-19.
Quarterly Statement as of March 31, 2021 Course of Business and Economic Position Merck 13
Course of Business and Economic Position Merck
Overview – Q1 2021
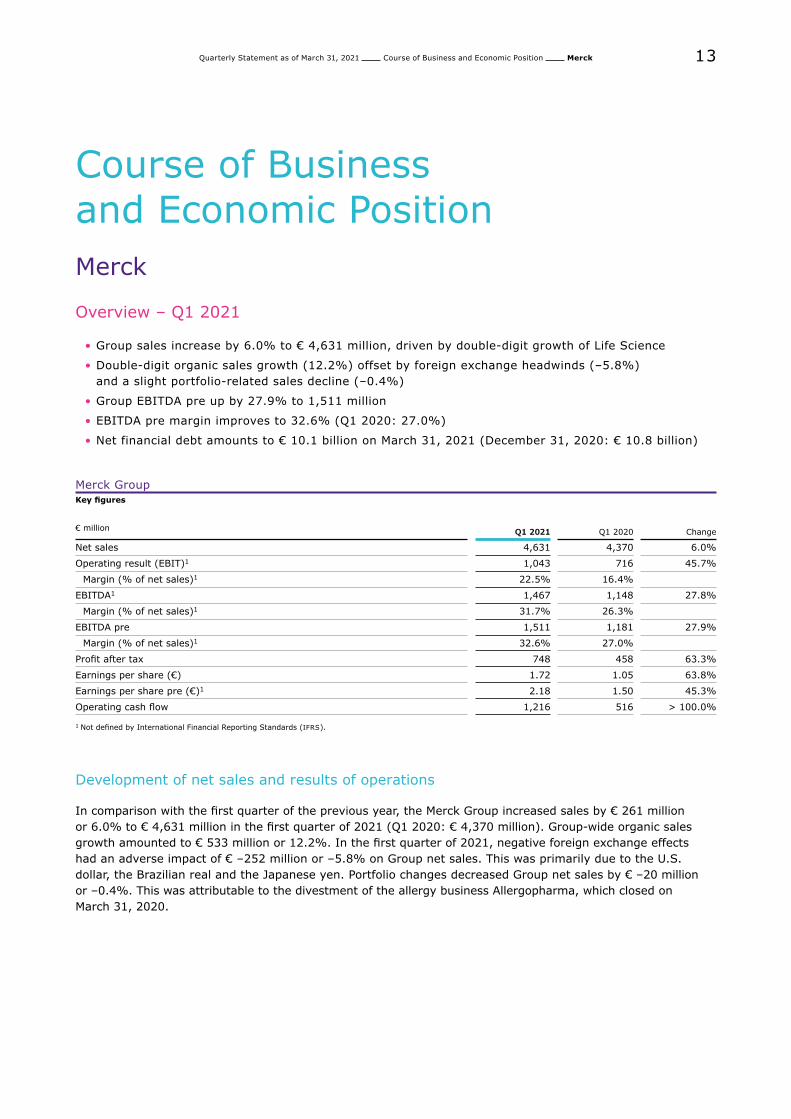
• Group sales increase by 6.0% to € 4,631 million, driven by double-digit growth of Life Science
• Double-digit organic sales growth (12.2%) offset by foreign exchange headwinds (–5.8%) and a slight portfolio-related sales decline (–0.4%)
• Group EBITDA pre up by 27.9% to 1,511 million
• EBITDA pre margin improves to 32.6% (Q1 2020: 27.0%)
• Net financial debt amounts to € 10.1 billion on March 31, 2021 (December 31, 2020: € 10.8 billion)
Merck GroupKey figures
€ million Q1 2021 Q1 2020 Change
Net sales 4,631 4,370 6.0%
Operating result (EBIT)1 1,043 716 45.7%
Margin (% of net sales)1 22.5% 16.4%
EBITDA1 1,467 1,148 27.8%
Margin (% of net sales)1 31.7% 26.3%
EBITDA pre 1,511 1,181 27.9%
Margin (% of net sales)1 32.6% 27.0%
Profit after tax 748 458 63.3%
Earnings per share (€) 1.72 1.05 63.8%
Earnings per share pre (€)1 2.18 1.50 45.3%
Operating cash flow 1,216 516 > 100.0%
1 Not defined by International Financial Reporting Standards (IFRS).
Development of net sales and results of operations
In comparison with the first quarter of the previous year, the Merck Group increased sales by € 261 million or 6.0% to € 4,631 million in the first quarter of 2021 (Q1 2020: € 4,370 million). Group-wide organic sales growth amounted to € 533 million or 12.2%. In the first quarter of 2021, negative foreign exchange effects had an adverse impact of € –252 million or –5.8% on Group net sales. This was primarily due to the U.S. dollar, the Brazilian real and the Japanese yen. Portfolio changes decreased Group net sales by € –20 million or –0.4%. This was attributable to the divestment of the allergy business Allergopharma, which closed on March 31, 2020.
Quarterly Statement as of March 31, 2021 Course of Business and Economic Position Merck 14
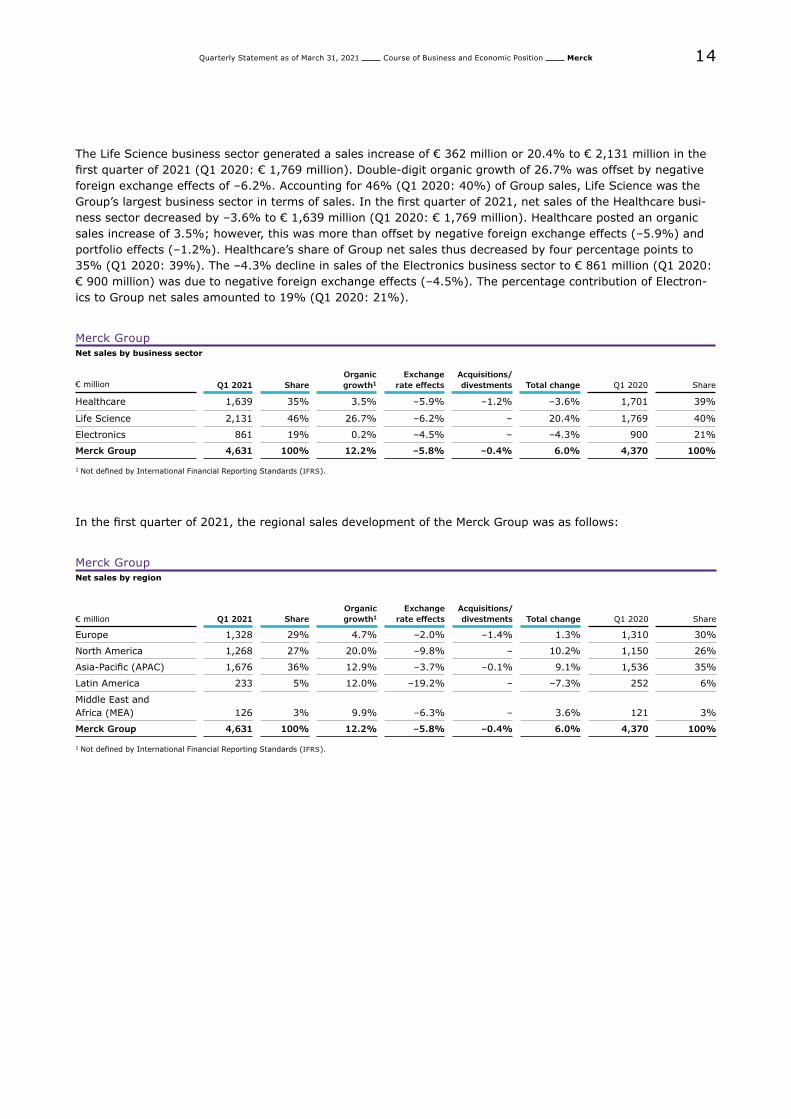
The Life Science business sector generated a sales increase of € 362 million or 20.4% to € 2,131 million in the first quarter of 2021 (Q1 2020: € 1,769 million). Double-digit organic growth of 26.7% was offset by negative foreign exchange effects of –6.2%. Accounting for 46% (Q1 2020: 40%) of Group sales, Life Science was the Group’s largest business sector in terms of sales. In the first quarter of 2021, net sales of the Healthcare busi-ness sector decreased by –3.6% to € 1,639 million (Q1 2020: € 1,769 million). Healthcare posted an organic sales increase of 3.5%; however, this was more than offset by negative foreign exchange effects (–5.9%) and portfolio effects (–1.2%). Healthcare’s share of Group net sales thus decreased by four percentage points to 35% (Q1 2020: 39%). The –4.3% decline in sales of the Electronics business sector to € 861 million (Q1 2020: € 900 million) was due to negative foreign exchange effects (–4.5%). The percentage contribution of Electron-ics to Group net sales amounted to 19% (Q1 2020: 21%).
Merck GroupNet sales by business sector
€ million Q1 2021 ShareOrganic growth1
Exchange rate effects
Acquisitions/divestments Total change Q1 2020 Share
Healthcare 1,639 35% 3.5% –5.9% –1.2% –3.6% 1,701 39%
Life Science 2,131 46% 26.7% –6.2% – 20.4% 1,769 40%
Electronics 861 19% 0.2% –4.5% – –4.3% 900 21%
Merck Group 4,631 100% 12.2% –5.8% –0.4% 6.0% 4,370 100%
1 Not defined by International Financial Reporting Standards (IFRS).
In the first quarter of 2021, the regional sales development of the Merck Group was as follows:
Merck GroupNet sales by region
€ million Q1 2021 ShareOrganic growth1
Exchange rate effects
Acquisitions/divestments Total change Q1 2020 Share
Europe 1,328 29% 4.7% –2.0% –1.4% 1.3% 1,310 30%
North America 1,268 27% 20.0% –9.8% – 10.2% 1,150 26%
Asia-Pacific (APAC) 1,676 36% 12.9% –3.7% –0.1% 9.1% 1,536 35%
Latin America 233 5% 12.0% –19.2% – –7.3% 252 6%
Middle East and Africa (MEA) 126 3% 9.9% –6.3% – 3.6% 121 3%
Merck Group 4,631 100% 12.2% –5.8% –0.4% 6.0% 4,370 100%
1 Not defined by International Financial Reporting Standards (IFRS).
Quarterly Statement as of March 31, 2021 Course of Business and Economic Position Merck 15
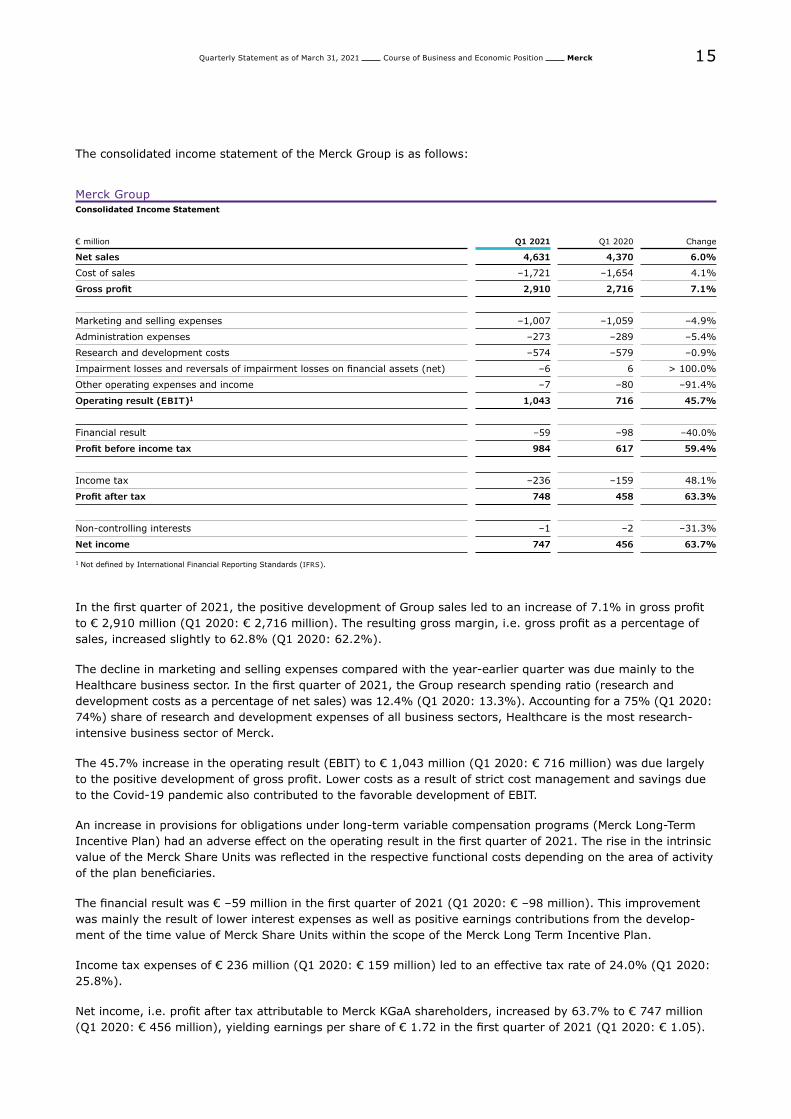
The consolidated income statement of the Merck Group is as follows:
Merck Group Consolidated Income Statement
€ million Q1 2021 Q1 2020 Change
Net sales 4,631 4,370 6.0%
Cost of sales –1,721 –1,654 4.1%
Gross profit 2,910 2,716 7.1%
Marketing and selling expenses –1,007 –1,059 –4.9%
Administration expenses –273 –289 –5.4%
Research and development costs –574 –579 –0.9%
Impairment losses and reversals of impairment losses on financial assets (net) –6 6 > 100.0%
Other operating expenses and income –7 –80 –91.4%
Operating result (EBIT)1 1,043 716 45.7%
Financial result –59 –98 –40.0%
Profit before income tax 984 617 59.4%
Income tax –236 –159 48.1%
Profit after tax 748 458 63.3%
Non-controlling interests –1 –2 –31.3%
Net income 747 456 63.7%
1 Not defined by International Financial Reporting Standards (IFRS).
In the first quarter of 2021, the positive development of Group sales led to an increase of 7.1% in gross profit to € 2,910 million (Q1 2020: € 2,716 million). The resulting gross margin, i.e. gross profit as a percentage of sales, increased slightly to 62.8% (Q1 2020: 62.2%).
The decline in marketing and selling expenses compared with the year-earlier quarter was due mainly to the Healthcare business sector. In the first quarter of 2021, the Group research spending ratio (research and development costs as a percentage of net sales) was 12.4% (Q1 2020: 13.3%). Accounting for a 75% (Q1 2020: 74%) share of research and development expenses of all business sectors, Healthcare is the most research- intensive business sector of Merck.
The 45.7% increase in the operating result (EBIT) to € 1,043 million (Q1 2020: € 716 million) was due largely to the positive development of gross profit. Lower costs as a result of strict cost management and savings due to the Covid-19 pandemic also contributed to the favorable development of EBIT.
An increase in provisions for obligations under long-term variable compensation programs (Merck Long-Term Incentive Plan) had an adverse effect on the operating result in the first quarter of 2021. The rise in the intrinsic value of the Merck Share Units was reflected in the respective functional costs depending on the area of activity of the plan beneficiaries.
The financial result was € –59 million in the first quarter of 2021 (Q1 2020: € –98 million). This improvement was mainly the result of lower interest expenses as well as positive earnings contributions from the develop-ment of the time value of Merck Share Units within the scope of the Merck Long Term Incentive Plan.
Income tax expenses of € 236 million (Q1 2020: € 159 million) led to an effective tax rate of 24.0% (Q1 2020: 25.8%).
Net income, i.e. profit after tax attributable to Merck KGaA shareholders, increased by 63.7% to € 747 million (Q1 2020: € 456 million), yielding earnings per share of € 1.72 in the first quarter of 2021 (Q1 2020: € 1.05).
Quarterly Statement as of March 31, 2021 Course of Business and Economic Position Merck 16
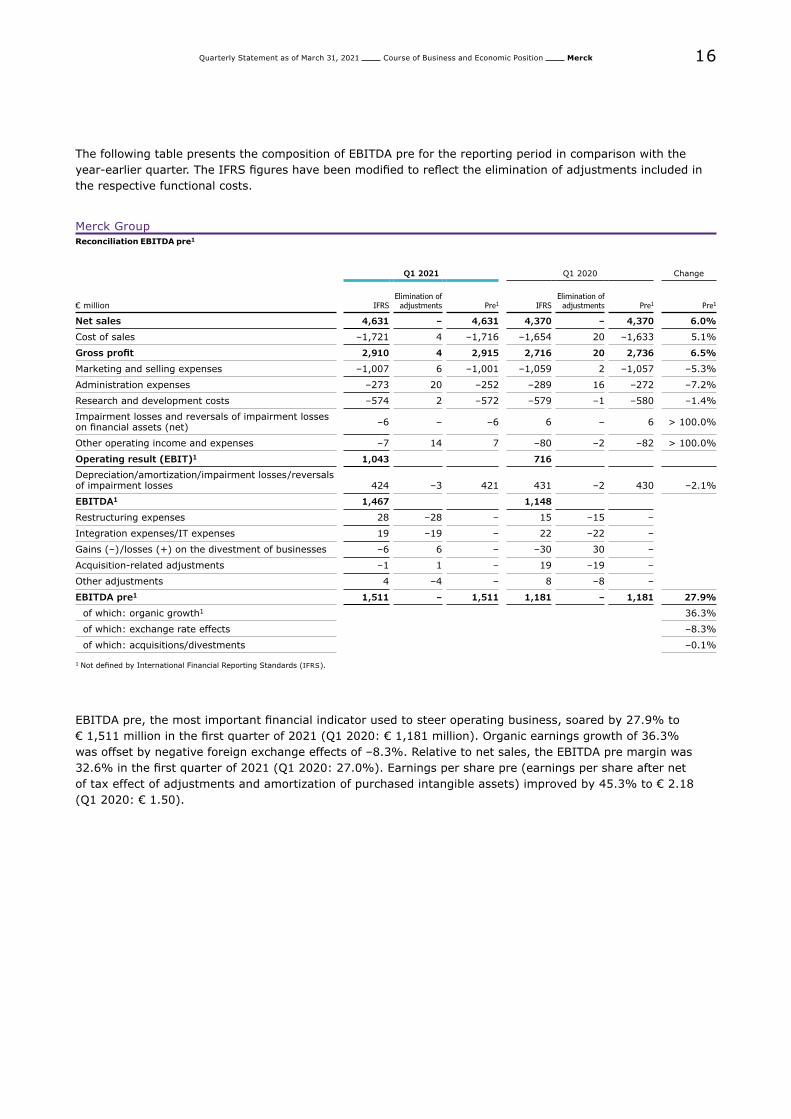
The following table presents the composition of EBITDA pre for the reporting period in comparison with the year-earlier quarter. The IFRS figures have been modified to reflect the elimination of adjustments included in the respective functional costs.
Merck GroupReconciliation EBITDA pre1
Q1 2021 Q1 2020 Change
€ million IFRSElimination of
adjustments Pre1 IFRSElimination of
adjustments Pre1 Pre1
Net sales 4,631 – 4,631 4,370 – 4,370 6.0%
Cost of sales –1,721 4 –1,716 –1,654 20 –1,633 5.1%
Gross profit 2,910 4 2,915 2,716 20 2,736 6.5%
Marketing and selling expenses –1,007 6 –1,001 –1,059 2 –1,057 –5.3%
Administration expenses –273 20 –252 –289 16 –272 –7.2%
Research and development costs –574 2 –572 –579 –1 –580 –1.4%
Impairment losses and reversals of impairment losses on financial assets (net) –6 – –6 6 – 6 > 100.0%
Other operating income and expenses –7 14 7 –80 –2 –82 > 100.0%
Operating result (EBIT)1 1,043 716
Depreciation/amortization/impairment losses/reversals of impairment losses 424 –3 421 431 –2 430 –2.1%
EBITDA1 1,467 1,148
Restructuring expenses 28 –28 – 15 –15 –
Integration expenses/IT expenses 19 –19 – 22 –22 –
Gains (–)/losses (+) on the divestment of businesses –6 6 – –30 30 –
Acquisition-related adjustments –1 1 – 19 –19 –
Other adjustments 4 –4 – 8 –8 –
EBITDA pre1 1,511 – 1,511 1,181 – 1,181 27.9%
of which: organic growth1 36.3%
of which: exchange rate effects –8.3%
of which: acquisitions/divestments –0.1%
1 Not defined by International Financial Reporting Standards (IFRS).
EBITDA pre, the most important financial indicator used to steer operating business, soared by 27.9% to € 1,511 million in the first quarter of 2021 (Q1 2020: € 1,181 million). Organic earnings growth of 36.3% was offset by negative foreign exchange effects of –8.3%. Relative to net sales, the EBITDA pre margin was 32.6% in the first quarter of 2021 (Q1 2020: 27.0%). Earnings per share pre (earnings per share after net of tax effect of adjustments and amortization of purchased intangible assets) improved by 45.3% to € 2.18 (Q1 2020: € 1.50).
Quarterly Statement as of March 31, 2021 Course of Business and Economic Position Merck 17
Net assets and financial position
Merck GroupBalance sheet structure
March 31, 2021
Dec. 31, 2020
Change
€ million in % € million in % € million in %
Non-current assets 33,273 75.8% 32,516 77.8% 757 2.3%
thereof:
Goodwill 16,541 15,959 582
Other intangible assets 7,765 7,653 111
Property, plant and equipment 6,552 6,421 131
Other non-current assets 2,416 2,483 –67
Current assets 10,617 24.2% 9,280 22.2% 1,337 14.4%
thereof:
Inventories 3,462 3,294 169
Trade and other current receivables 3,654 3,221 433
Other current financial assets 60 125 –64
Other current assets 1,203 1,286 –83
Cash and cash equivalents 2,238 1,355 882
Total assets 43,891 100.0% 41,796 100.0% 2,094 5.0%
Equity 18,983 43.2% 17,017 40.7% 1,966 11.6%
Non-current liabilities 14,255 32.5% 15,548 37.2% –1,293 –8.3%
thereof:
Non-current provisions for employee benefits 3,395 3,880 –484
Other non-current provisions 275 281 –6
Non-current financial debt 9,001 9,785 –784
Other non-current liabilities 1,585 1,603 –19
Current liabilities 10,652 24.3% 9,231 22.1% 1,421 15.4%
thereof:
Current provisions 537 613 –76
Current financial debt 3,347 2,357 989
Trade and other current payables/refund liabilities 2,711 2,434 278
Other current liabilities 4,057 3,828 230
Total equity and liabilities 43,891 100.0% 41,796 100.0% 2,094 5.0%
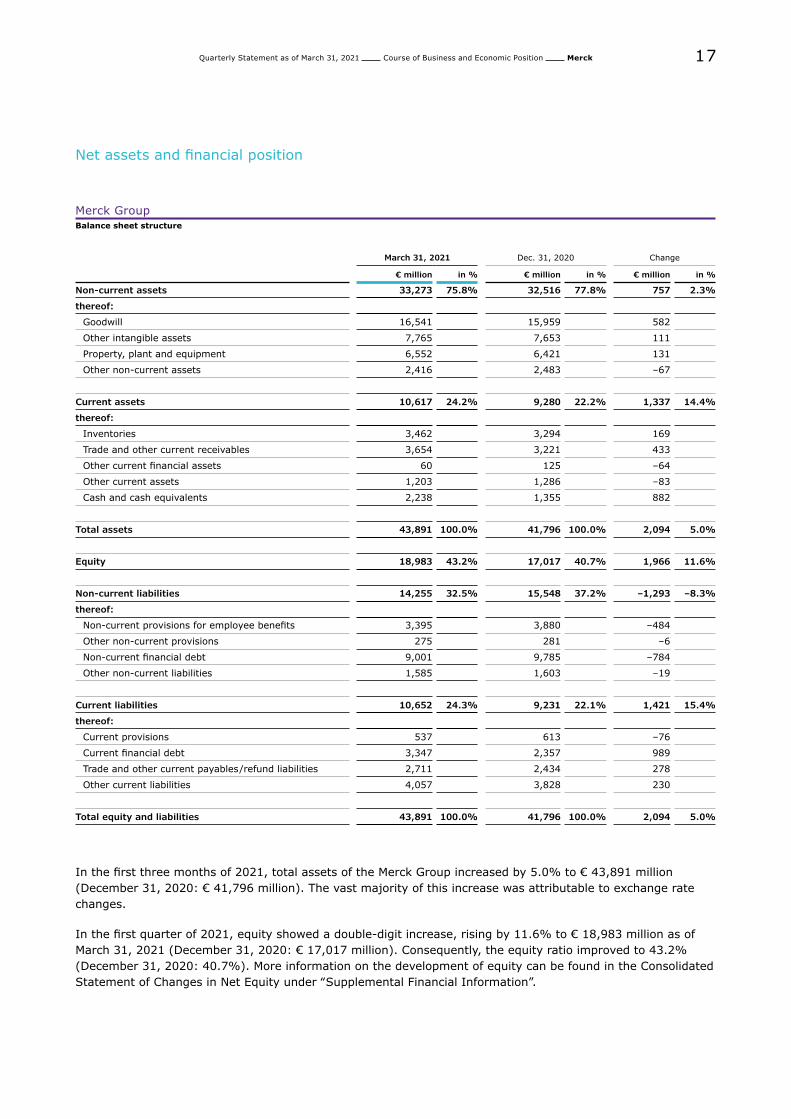
In the first three months of 2021, total assets of the Merck Group increased by 5.0% to € 43,891 million (December 31, 2020: € 41,796 million). The vast majority of this increase was attributable to exchange rate changes.
In the first quarter of 2021, equity showed a double-digit increase, rising by 11.6% to € 18,983 million as of March 31, 2021 (December 31, 2020: € 17,017 million). Consequently, the equity ratio improved to 43.2% (December 31, 2020: 40.7%). More information on the development of equity can be found in the Consolidated Statement of Changes in Net Equity under ‟Supplemental Financial Information”.
Quarterly Statement as of March 31, 2021 Course of Business and Economic Position Merck 18
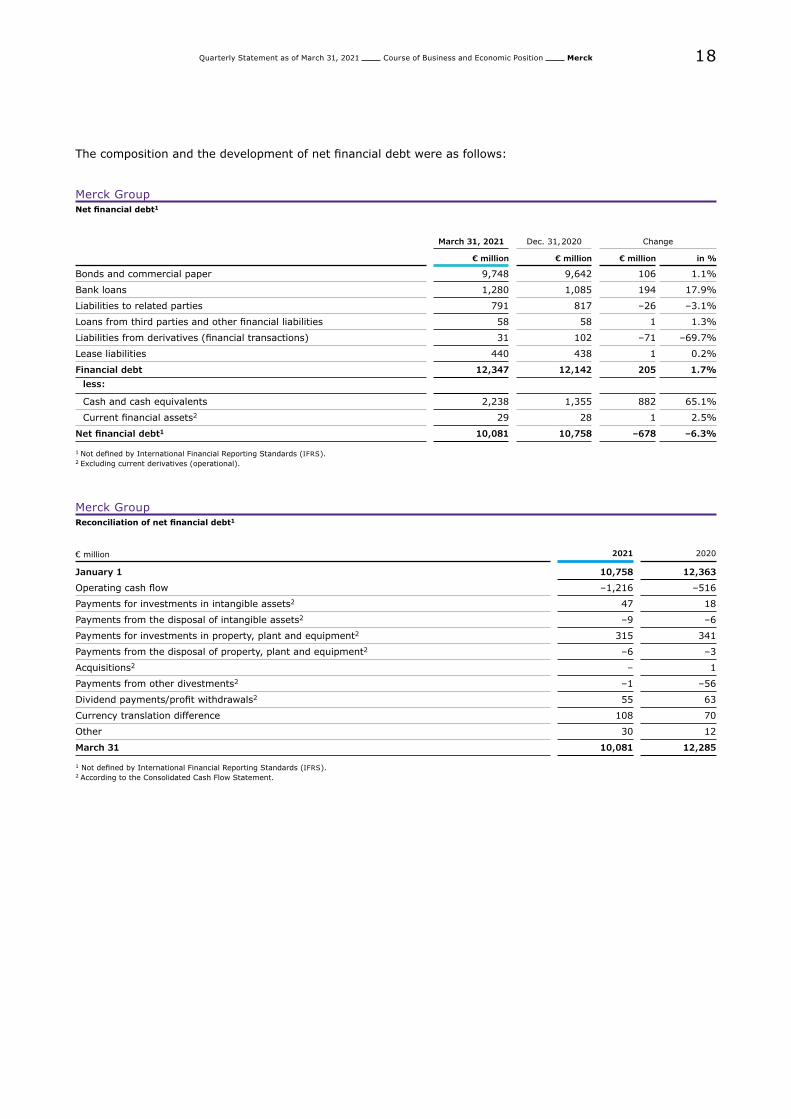
The composition and the development of net financial debt were as follows:
Merck GroupNet financial debt1
March 31, 2021 Dec. 31, 2020
Change
€ million € million € million in %
Bonds and commercial paper 9,748 9,642 106 1.1%
Bank loans 1,280 1,085 194 17.9%
Liabilities to related parties 791 817 –26 –3.1%
Loans from third parties and other financial liabilities 58 58 1 1.3%
Liabilities from derivatives (financial transactions) 31 102 –71 –69.7%
Lease liabilities 440 438 1 0.2%
Financial debt 12,347 12,142 205 1.7%less:
Cash and cash equivalents 2,238 1,355 882 65.1%
Current financial assets2 29 28 1 2.5%
Net financial debt1 10,081 10,758 –678 –6.3%
1 Not defined by International Financial Reporting Standards (IFRS).2 Excluding current derivatives (operational).
Merck GroupReconciliation of net financial debt1
€ million 2021 2020
January 1 10,758 12,363
Operating cash flow –1,216 –516
Payments for investments in intangible assets2 47 18
Payments from the disposal of intangible assets2 –9 –6
Payments for investments in property, plant and equipment2 315 341
Payments from the disposal of property, plant and equipment2 –6 –3
Acquisitions2 – 1
Payments from other divestments2 –1 –56
Dividend payments/profit withdrawals2 55 63
Currency translation difference 108 70
Other 30 12
March 31 10,081 12,285
1 Not defined by International Financial Reporting Standards (IFRS).2 According to the Consolidated Cash Flow Statement.
Quarterly Statement as of March 31, 2021 Course of Business and Economic Position Merck 19
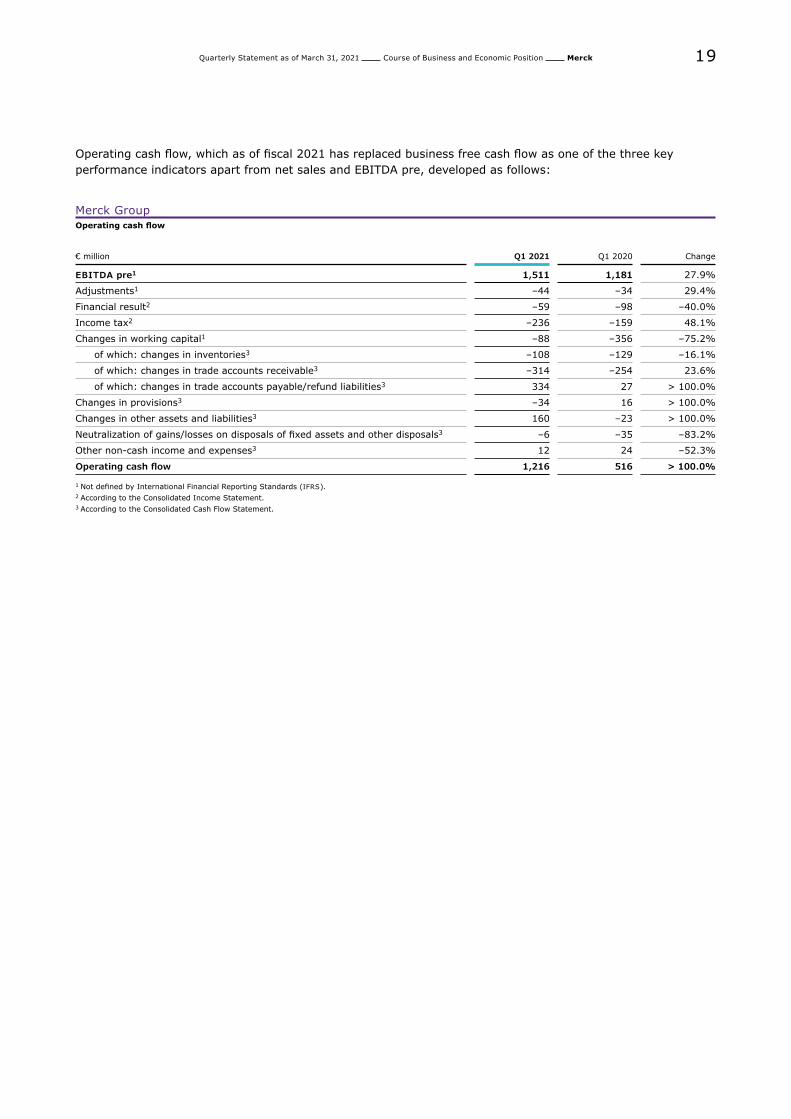
Operating cash flow, which as of fiscal 2021 has replaced business free cash flow as one of the three key performance indicators apart from net sales and EBITDA pre, developed as follows:
Merck GroupOperating cash flow
€ million Q1 2021 Q1 2020 Change
EBITDA pre1 1,511 1,181 27.9%
Adjustments1 –44 –34 29.4%
Financial result2 –59 –98 –40.0%
Income tax2 –236 –159 48.1%
Changes in working capital1 –88 –356 –75.2%
of which: changes in inventories3 –108 –129 –16.1%
of which: changes in trade accounts receivable3 –314 –254 23.6%
of which: changes in trade accounts payable/refund liabilities3 334 27 > 100.0%
Changes in provisions3 –34 16 > 100.0%
Changes in other assets and liabilities3 160 –23 > 100.0%
Neutralization of gains/losses on disposals of fixed assets and other disposals3 –6 –35 –83.2%
Other non-cash income and expenses3 12 24 –52.3%
Operating cash flow 1,216 516 > 100.0%
1 Not defined by International Financial Reporting Standards (IFRS).2 According to the Consolidated Income Statement.3 According to the Consolidated Cash Flow Statement.
Quarterly Statement as of March 31, 2021 Course of Business and Economic Position Healthcare 20
Healthcare
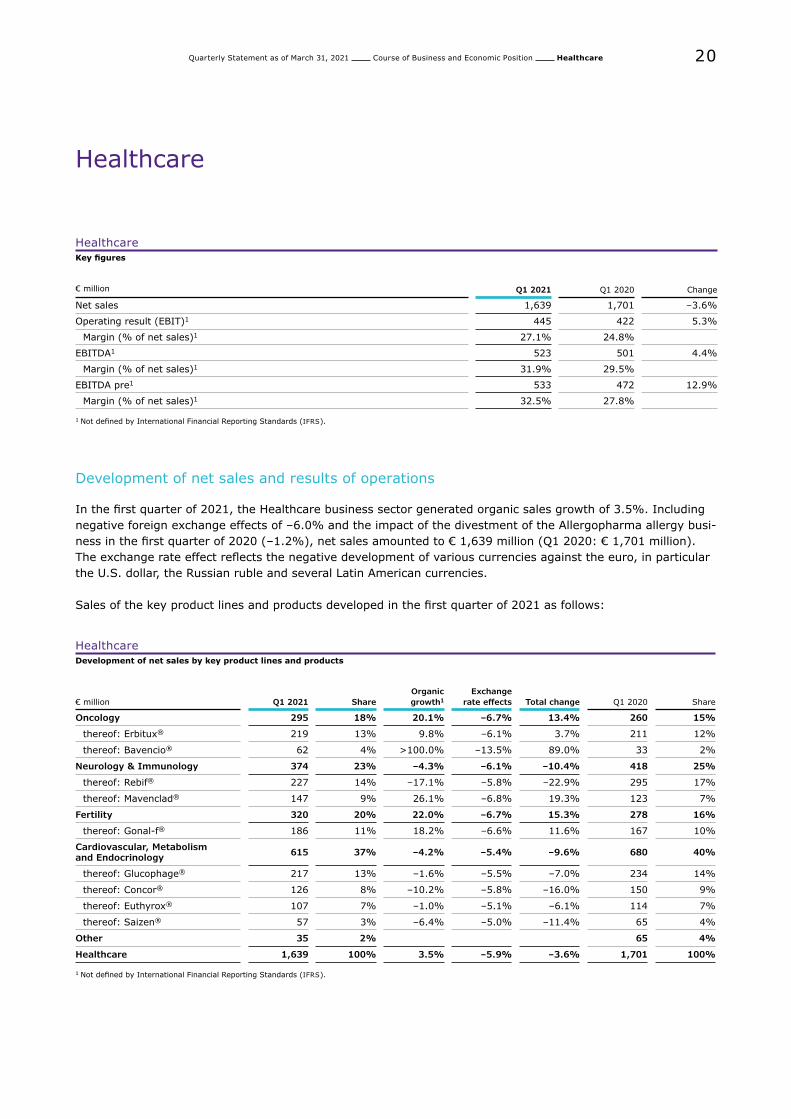
HealthcareKey figures
€ million Q1 2021 Q1 2020 Change
Net sales 1,639 1,701 –3.6%
Operating result (EBIT)1 445 422 5.3%
Margin (% of net sales)1 27.1% 24.8%
EBITDA1 523 501 4.4%
Margin (% of net sales)1 31.9% 29.5%
EBITDA pre1 533 472 12.9%
Margin (% of net sales)1 32.5% 27.8%
1 Not defined by International Financial Reporting Standards (IFRS).
Development of net sales and results of operations
In the first quarter of 2021, the Healthcare business sector generated organic sales growth of 3.5%. Including negative foreign exchange effects of –6.0% and the impact of the divestment of the Allergopharma allergy busi-ness in the first quarter of 2020 (–1.2%), net sales amounted to € 1,639 million (Q1 2020: € 1,701 million). The exchange rate effect reflects the negative development of various currencies against the euro, in particular the U.S. dollar, the Russian ruble and several Latin American currencies.
Sales of the key product lines and products developed in the first quarter of 2021 as follows:
HealthcareDevelopment of net sales by key product lines and products
€ million Q1 2021 ShareOrganic growth1
Exchange rate effects Total change Q1 2020 Share
Oncology 295 18% 20.1% –6.7% 13.4% 260 15%
thereof: Erbitux® 219 13% 9.8% –6.1% 3.7% 211 12%
thereof: Bavencio® 62 4% >100.0% –13.5% 89.0% 33 2%
Neurology & Immunology 374 23% –4.3% –6.1% –10.4% 418 25%
thereof: Rebif® 227 14% –17.1% –5.8% –22.9% 295 17%
thereof: Mavenclad® 147 9% 26.1% –6.8% 19.3% 123 7%
Fertility 320 20% 22.0% –6.7% 15.3% 278 16%
thereof: Gonal-f® 186 11% 18.2% –6.6% 11.6% 167 10%
Cardiovascular, Metabolism and Endocrinology 615 37% –4.2% –5.4% –9.6% 680 40%
thereof: Glucophage® 217 13% –1.6% –5.5% –7.0% 234 14%
thereof: Concor® 126 8% –10.2% –5.8% –16.0% 150 9%
thereof: Euthyrox® 107 7% –1.0% –5.1% –6.1% 114 7%
thereof: Saizen® 57 3% –6.4% –5.0% –11.4% 65 4%
Other 35 2% 65 4%
Healthcare 1,639 100% 3.5% –5.9% –3.6% 1,701 100%
1 Not defined by International Financial Reporting Standards (IFRS).
Quarterly Statement as of March 31, 2021 Course of Business and Economic Position Healthcare 21
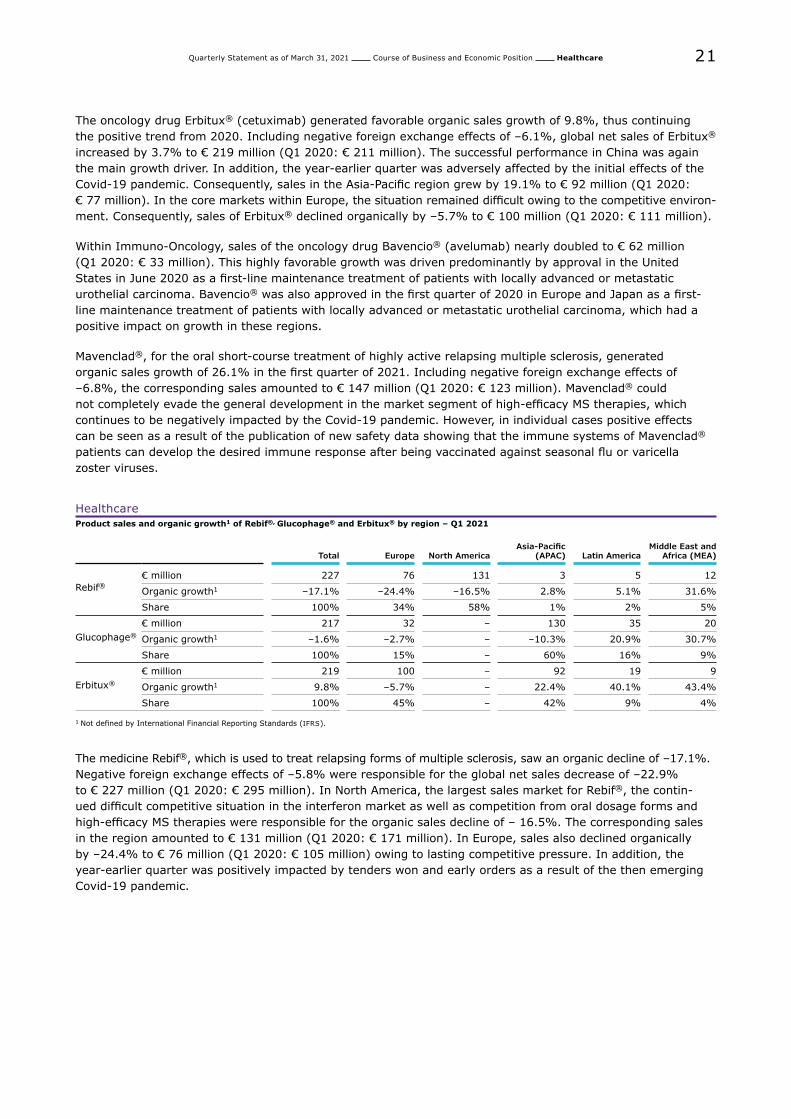
The oncology drug Erbitux® (cetuximab) generated favorable organic sales growth of 9.8%, thus continuing the positive trend from 2020. Including negative foreign exchange effects of –6.1%, global net sales of Erbitux® increased by 3.7% to € 219 million (Q1 2020: € 211 million). The successful performance in China was again the main growth driver. In addition, the year-earlier quarter was adversely affected by the initial effects of the Covid-19 pandemic. Consequently, sales in the Asia-Pacific region grew by 19.1% to € 92 million (Q1 2020: € 77 million). In the core markets within Europe, the situation remained difficult owing to the competitive environ-ment. Consequently, sales of Erbitux® declined organically by –5.7% to € 100 million (Q1 2020: € 111 million).
Within Immuno-Oncology, sales of the oncology drug Bavencio® (avelumab) nearly doubled to € 62 million (Q1 2020: € 33 million). This highly favorable growth was driven predominantly by approval in the United States in June 2020 as a first-line maintenance treatment of patients with locally advanced or metastatic urothelial carcinoma. Bavencio® was also approved in the first quarter of 2020 in Europe and Japan as a first-line maintenance treatment of patients with locally advanced or metastatic urothelial carcinoma, which had a positive impact on growth in these regions.
Mavenclad®, for the oral short-course treatment of highly active relapsing multiple sclerosis, generated organic sales growth of 26.1% in the first quarter of 2021. Including negative foreign exchange effects of –6.8%, the corresponding sales amounted to € 147 million (Q1 2020: € 123 million). Mavenclad® could not completely evade the general development in the market segment of high-efficacy MS therapies, which continues to be negatively impacted by the Covid-19 pandemic. However, in individual cases positive effects can be seen as a result of the publication of new safety data showing that the immune systems of Mavenclad® patients can develop the desired immune response after being vaccinated against seasonal flu or varicella zoster viruses.
HealthcareProduct sales and organic growth1 of Rebif®, Glucophage® and Erbitux® by region – Q1 2021
Total Europe North AmericaAsia-Pacific
(APAC) Latin AmericaMiddle East and
Africa (MEA)
Rebif®€ million 227 76 131 3 5 12
Organic growth1 –17.1% –24.4% –16.5% 2.8% 5.1% 31.6%
Share 100% 34% 58% 1% 2% 5%
Glucophage®
€ million 217 32 – 130 35 20
Organic growth1 –1.6% –2.7% – –10.3% 20.9% 30.7%
Share 100% 15% – 60% 16% 9%
Erbitux®
€ million 219 100 – 92 19 9
Organic growth1 9.8% –5.7% – 22.4% 40.1% 43.4%
Share 100% 45% – 42% 9% 4%
1 Not defined by International Financial Reporting Standards (IFRS).
The medicine Rebif®, which is used to treat relapsing forms of multiple sclerosis, saw an organic decline of –17.1%. Negative foreign exchange effects of –5.8% were responsible for the global net sales decrease of –22.9% to € 227 million (Q1 2020: € 295 million). In North America, the largest sales market for Rebif®, the contin-ued difficult competitive situation in the interferon market as well as competition from oral dosage forms and high-efficacy MS therapies were responsible for the organic sales decline of – 16.5%. The corresponding sales in the region amounted to € 131 million (Q1 2020: € 171 million). In Europe, sales also declined organically by –24.4% to € 76 million (Q1 2020: € 105 million) owing to lasting competitive pressure. In addition, the year-earlier quarter was positively impacted by tenders won and early orders as a result of the then emerging Covid-19 pandemic.
Quarterly Statement as of March 31, 2021 Course of Business and Economic Position Healthcare 22
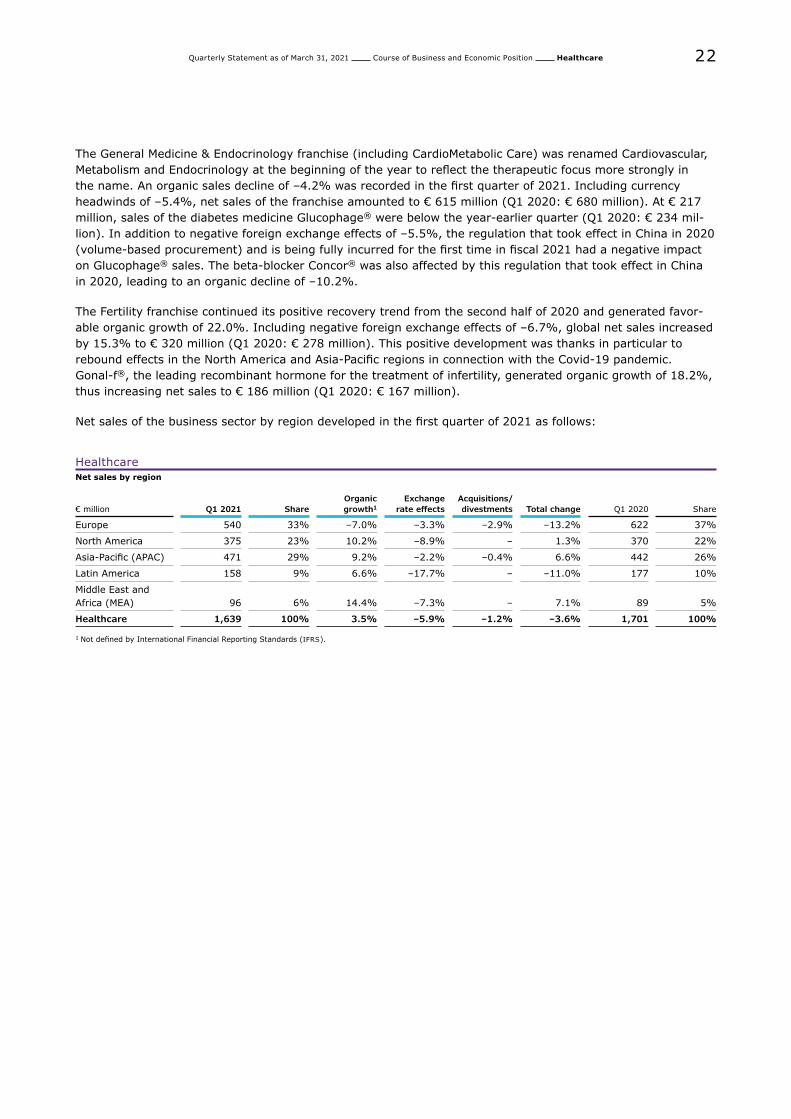
The General Medicine & Endocrinology franchise (including CardioMetabolic Care) was renamed Cardio vascular, Metabolism and Endocrinology at the beginning of the year to reflect the therapeutic focus more strongly in the name. An organic sales decline of –4.2% was recorded in the first quarter of 2021. Including currency headwinds of –5.4%, net sales of the franchise amounted to € 615 million (Q1 2020: € 680 million). At € 217 million, sales of the diabetes medicine Glucophage® were below the year-earlier quarter (Q1 2020: € 234 mil-lion). In addition to negative foreign exchange effects of –5.5%, the regulation that took effect in China in 2020 (volume-based procurement) and is being fully incurred for the first time in fiscal 2021 had a negative impact on Glucophage® sales. The beta-blocker Concor® was also affected by this regulation that took effect in China in 2020, leading to an organic decline of –10.2%.
The Fertility franchise continued its positive recovery trend from the second half of 2020 and generated favor-able organic growth of 22.0%. Including negative foreign exchange effects of –6.7%, global net sales increased by 15.3% to € 320 million (Q1 2020: € 278 million). This positive development was thanks in particular to rebound effects in the North America and Asia-Pacific regions in connection with the Covid-19 pandemic. Gonal-f®, the leading recombinant hormone for the treatment of infertility, generated organic growth of 18.2%, thus increasing net sales to € 186 million (Q1 2020: € 167 million).
Net sales of the business sector by region developed in the first quarter of 2021 as follows:
Healthcare Net sales by region
€ million Q1 2021 ShareOrganic growth1
Exchange rate effects
Acquisitions/divestments Total change Q1 2020 Share
Europe 540 33% –7.0% –3.3% –2.9% –13.2% 622 37%
North America 375 23% 10.2% –8.9% – 1.3% 370 22%
Asia-Pacific (APAC) 471 29% 9.2% –2.2% –0.4% 6.6% 442 26%
Latin America 158 9% 6.6% –17.7% – –11.0% 177 10%
Middle East and Africa (MEA) 96 6% 14.4% –7.3% – 7.1% 89 5%
Healthcare 1,639 100% 3.5% –5.9% –1.2% –3.6% 1,701 100%
1 Not defined by International Financial Reporting Standards (IFRS).
Quarterly Statement as of March 31, 2021 Course of Business and Economic Position Healthcare 23
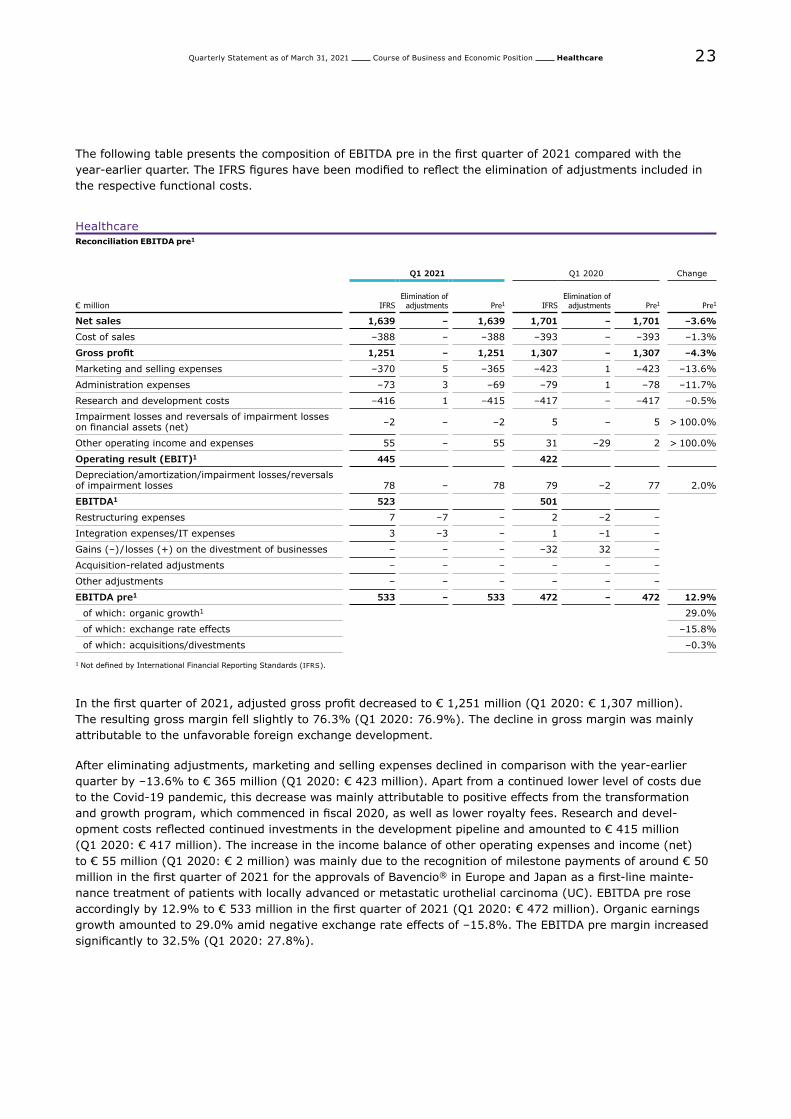
The following table presents the composition of EBITDA pre in the first quarter of 2021 compared with the year-earlier quarter. The IFRS figures have been modified to reflect the elimination of adjustments included in the respective functional costs.
HealthcareReconciliation EBITDA pre1
Q1 2021 Q1 2020 Change
€ million IFRSElimination of
adjustments Pre1 IFRSElimination of
adjustments Pre1 Pre1
Net sales 1,639 – 1,639 1,701 – 1,701 –3.6%
Cost of sales –388 – –388 –393 – –393 –1.3%
Gross profit 1,251 – 1,251 1,307 – 1,307 –4.3%
Marketing and selling expenses –370 5 –365 –423 1 –423 –13.6%
Administration expenses –73 3 –69 –79 1 –78 –11.7%
Research and development costs –416 1 –415 –417 – –417 –0.5%
Impairment losses and reversals of impairment losses on financial assets (net) –2 – –2 5 – 5 > 100.0%
Other operating income and expenses 55 – 55 31 –29 2 > 100.0%
Operating result (EBIT)1 445 422
Depreciation/amortization/impairment losses/reversals of impairment losses 78 – 78 79 –2 77 2.0%
EBITDA1 523 501
Restructuring expenses 7 –7 – 2 –2 –
Integration expenses/IT expenses 3 –3 – 1 –1 –
Gains (–)/losses (+) on the divestment of businesses – – – –32 32 –
Acquisition-related adjustments – – – – – –
Other adjustments – – – – – –
EBITDA pre1 533 – 533 472 – 472 12.9%
of which: organic growth1 29.0%
of which: exchange rate effects –15.8%
of which: acquisitions/divestments –0.3%
1 Not defined by International Financial Reporting Standards (IFRS).
In the first quarter of 2021, adjusted gross profit decreased to € 1,251 million (Q1 2020: € 1,307 million). The resulting gross margin fell slightly to 76.3% (Q1 2020: 76.9%). The decline in gross margin was mainly attributable to the unfavorable foreign exchange development.
After eliminating adjustments, marketing and selling expenses declined in comparison with the year-earlier quarter by –13.6% to € 365 million (Q1 2020: € 423 million). Apart from a continued lower level of costs due to the Covid-19 pandemic, this decrease was mainly attributable to positive effects from the transformation and growth program, which commenced in fiscal 2020, as well as lower royalty fees. Research and devel-opment costs reflected continued investments in the development pipeline and amounted to € 415 million (Q1 2020: € 417 million). The increase in the income balance of other operating expenses and income (net)to € 55 million (Q1 2020: € 2 million) was mainly due to the recognition of milestone payments of around € 50 million in the first quarter of 2021 for the approvals of Bavencio® in Europe and Japan as a first-line mainte-nance treatment of patients with locally advanced or metastatic urothelial carcinoma (UC). EBITDA pre rose accordingly by 12.9% to € 533 million in the first quarter of 2021 (Q1 2020: € 472 million). Organic earnings growth amounted to 29.0% amid negative exchange rate effects of –15.8%. The EBITDA pre margin increased significantly to 32.5% (Q1 2020: 27.8%).
Quarterly Statement as of March 31, 2021 Course of Business and Economic Position ife Science 24
Life Science
Life ScienceKey figures
€ million Q1 2021 Q1 2020 Change
Net sales 2,131 1,769 20.4%
Operating result (EBIT)1 593 345 71.8%
Margin (% of net sales)1 27.8% 19.5%
EBITDA1 779 541 43.9%
Margin (% of net sales)1 36.6% 30.6%
EBITDA pre1 793 553 43.5%
Margin (% of net sales)1 37.2% 31.2%
1 Not defined by International Financial Reporting Standards (IFRS).
Development of sales and results of operations
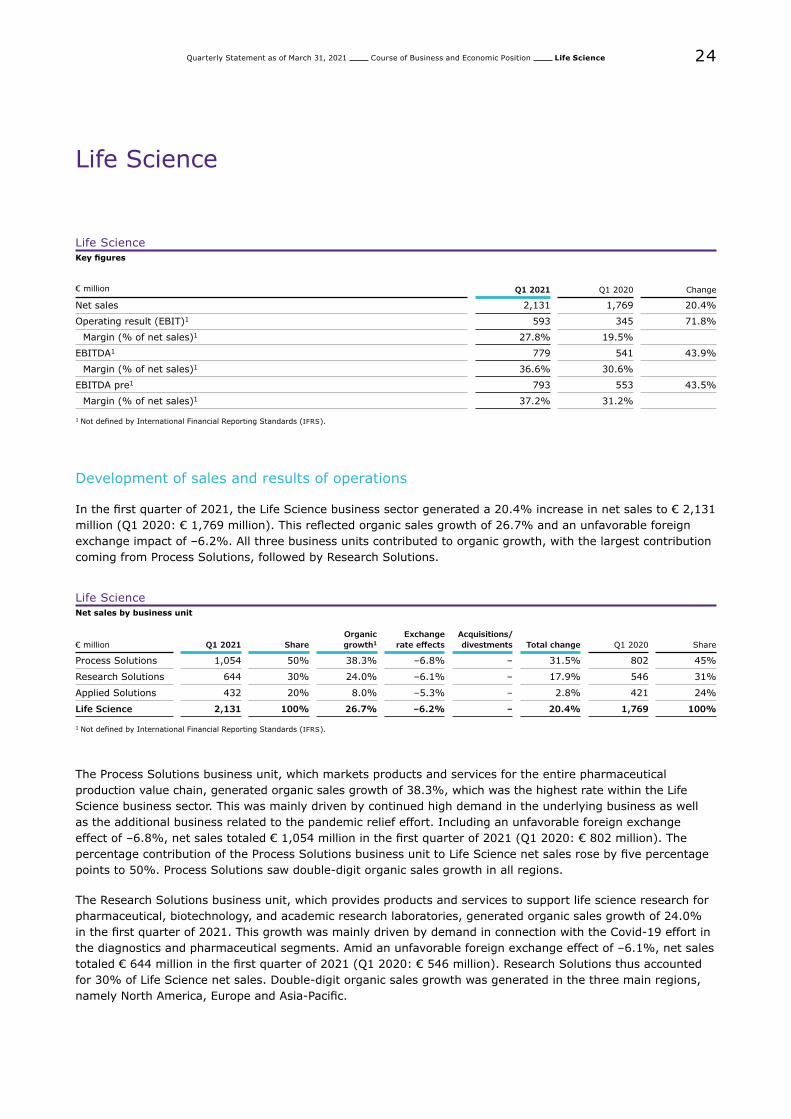
In the first quarter of 2021, the Life Science business sector generated a 20.4% increase in net sales to € 2,131 million (Q1 2020: € 1,769 million). This reflected organic sales growth of 26.7% and an unfavorable foreign exchange impact of –6.2%. All three business units contributed to organic growth, with the largest contribution coming from Process Solutions, followed by Research Solutions.
Life ScienceNet sales by business unit
€ million Q1 2021 ShareOrganic growth1
Exchange rate effects
Acquisitions/divestments Total change Q1 2020 Share
Process Solutions 1,054 50% 38.3% –6.8% – 31.5% 802 45%
Research Solutions 644 30% 24.0% –6.1% – 17.9% 546 31%
Applied Solutions 432 20% 8.0% –5.3% – 2.8% 421 24%
Life Science 2,131 100% 26.7% –6.2% – 20.4% 1,769 100%
1 Not defined by International Financial Reporting Standards (IFRS).
The Process Solutions business unit, which markets products and services for the entire pharmaceutical production value chain, generated organic sales growth of 38.3%, which was the highest rate within the Life Science business sector. This was mainly driven by continued high demand in the underlying business as well as the additional business related to the pandemic relief effort. Including an unfavorable foreign exchange effect of –6.8%, net sales totaled € 1,054 million in the first quarter of 2021 (Q1 2020: € 802 million). The percentage contribution of the Process Solutions business unit to Life Science net sales rose by five percentage points to 50%. Process Solutions saw double-digit organic sales growth in all regions.
The Research Solutions business unit, which provides products and services to support life science research for pharmaceutical, biotechnology, and academic research laboratories, generated organic sales growth of 24.0% in the first quarter of 2021. This growth was mainly driven by demand in connection with the Covid-19 effort in the diagnostics and pharmaceutical segments. Amid an unfavorable foreign exchange effect of –6.1%, net sales totaled € 644 million in the first quarter of 2021 (Q1 2020: € 546 million). Research Solutions thus accounted for 30% of Life Science net sales. Double-digit organic sales growth was generated in the three main regions, namely North America, Europe and Asia-Pacific.
Quarterly Statement as of March 31, 2021 Course of Business and Economic Position ife Science 25
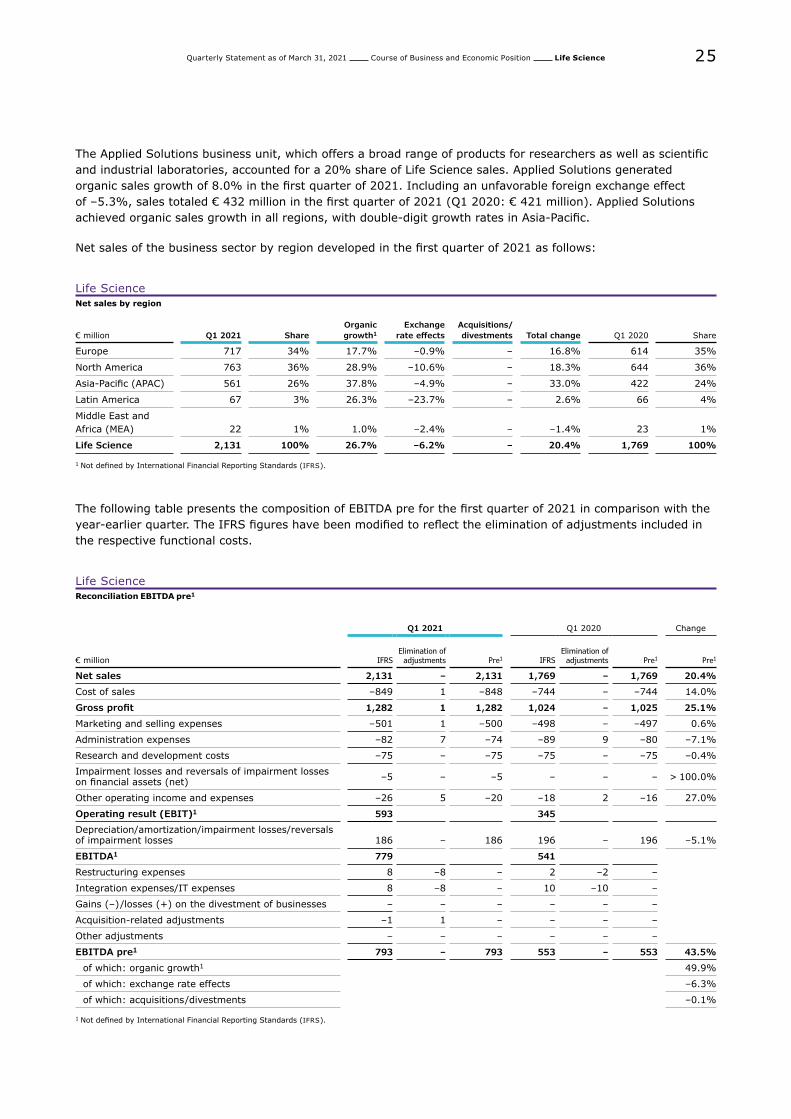
The Applied Solutions business unit, which offers a broad range of products for researchers as well as scientific and industrial laboratories, accounted for a 20% share of Life Science sales. Applied Solutions generated organic sales growth of 8.0% in the first quarter of 2021. Including an unfavorable foreign exchange effect of –5.3%, sales totaled € 432 million in the first quarter of 2021 (Q1 2020: € 421 million). Applied Solutions achieved organic sales growth in all regions, with double-digit growth rates in Asia-Pacific.
Net sales of the business sector by region developed in the first quarter of 2021 as follows:
Life ScienceNet sales by region
€ million Q1 2021 ShareOrganic growth1
Exchange rate effects
Acquisitions/divestments Total change Q1 2020 Share
Europe 717 34% 17.7% –0.9% – 16.8% 614 35%
North America 763 36% 28.9% –10.6% – 18.3% 644 36%
Asia-Pacific (APAC) 561 26% 37.8% –4.9% – 33.0% 422 24%
Latin America 67 3% 26.3% –23.7% – 2.6% 66 4%
Middle East and Africa (MEA) 22 1% 1.0% –2.4% – –1.4% 23 1%
Life Science 2,131 100% 26.7% –6.2% – 20.4% 1,769 100%
1 Not defined by International Financial Reporting Standards (IFRS).
The following table presents the composition of EBITDA pre for the first quarter of 2021 in comparison with the year-earlier quarter. The IFRS figures have been modified to reflect the elimination of adjustments included in the respective functional costs.
Life ScienceReconciliation EBITDA pre1
Q1 2021 Q1 2020 Change
€ million IFRSElimination of
adjustments Pre1 IFRSElimination of
adjustments Pre1 Pre1
Net sales 2,131 – 2,131 1,769 – 1,769 20.4%
Cost of sales –849 1 –848 –744 – –744 14.0%
Gross profit 1,282 1 1,282 1,024 – 1,025 25.1%
Marketing and selling expenses –501 1 –500 –498 – –497 0.6%
Administration expenses –82 7 –74 –89 9 –80 –7.1%
Research and development costs –75 – –75 –75 – –75 –0.4%
Impairment losses and reversals of impairment losses on financial assets (net) –5 – –5 – – – > 100.0%
Other operating income and expenses –26 5 –20 –18 2 –16 27.0%
Operating result (EBIT)1 593 345
Depreciation/amortization/impairment losses/reversals of impairment losses 186 – 186 196 – 196 –5.1%
EBITDA1 779 541
Restructuring expenses 8 –8 – 2 –2 –
Integration expenses/IT expenses 8 –8 – 10 –10 –
Gains (–)/losses (+) on the divestment of businesses – – – – – –
Acquisition-related adjustments –1 1 – – – –
Other adjustments – – – – – –
EBITDA pre1 793 – 793 553 – 553 43.5%
of which: organic growth1 49.9%
of which: exchange rate effects –6.3%
of which: acquisitions/divestments –0.1%
1 Not defined by International Financial Reporting Standards (IFRS).
Quarterly Statement as of March 31, 2021 Course of Business and Economic Position ife Science 26
Adjusted gross profit increased by 25.1% to € 1,282 million (Q1 2020: € 1,025 million). The increase was mainly driven by strong sales growth in the Process Solutions business unit followed by Research Solutions. The gross margin of Life Science, i.e. gross profit as percentage of net sales, improved to 60.2% (Q1 2020: 57.9%). Marketing and selling expenses slightly increased by 0.6% to € 500 million (Q1 2020: € 497 million), with higher logistics costs as the main driver. Administration expenses decreased by –7.1% to € 74 million (Q1 2020: € 80 million) and research and development costs remained flat at € 75 million (Q1 2020: € 75 mil-lion). After eliminating adjustments, amortization, and depreciation, EBITDA pre rose by 43.5% to € 793 million (Q1 2020: € 553 million) reflecting the strong performance of the Life Science business sector. Organically, EBITDA pre grew by as much as 49.9% in the first quarter of 2021. The EBITDA pre margin, i.e. EBITDA pre as a percentage of net sales, improved by 6 percentage points to 37.2% (Q1 2020: 31.2%).
Quarterly Statement as of March 31, 2021 Course of Business and Economic Position Electronics 27
Electronics
ElectronicsKey figures
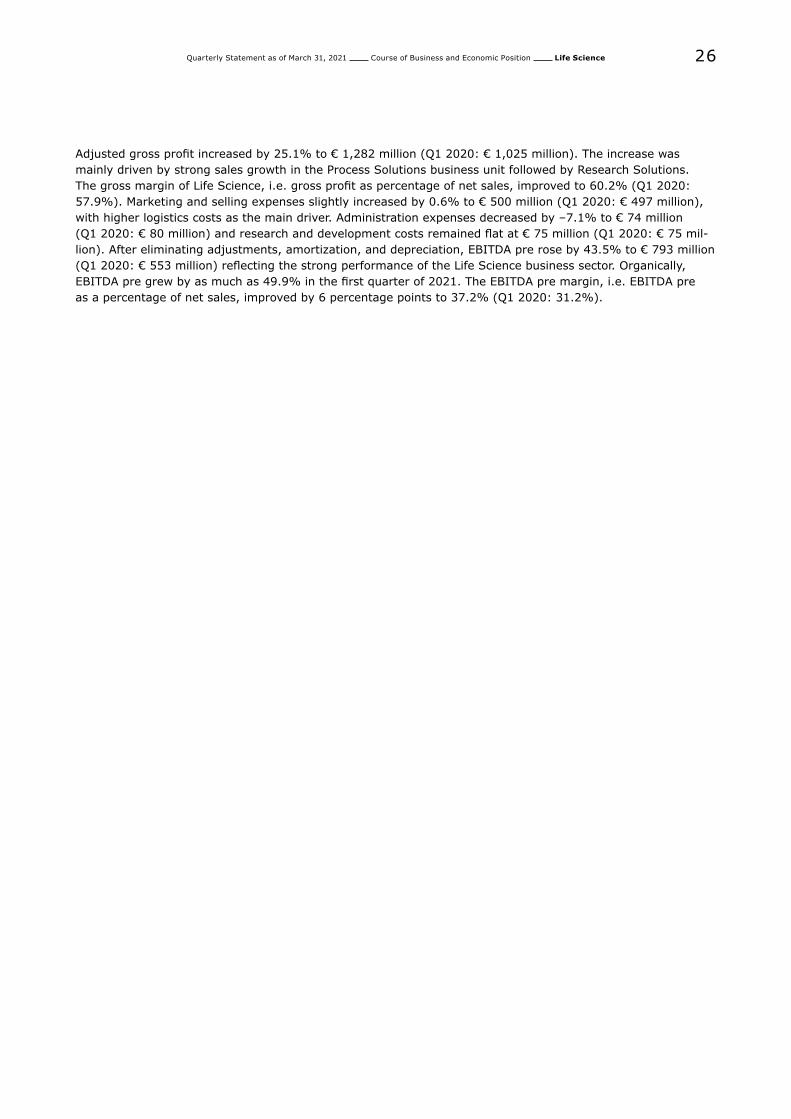
€ million Q1 2021 Q1 2020 Change
Net sales 861 900 –4.3%
Operating result (EBIT)1 126 116 8.1%
Margin (% of net sales)1 14.6% 12.9%
EBITDA1 260 251 3.6%
Margin (% of net sales)1 30.2% 27.9%
EBITDA pre1 274 286 –4.1%
Margin (% of net sales)1 31.8% 31.7%
1 Not defined by International Financial Reporting Standards (IFRS).
Development of net sales and results of operations
In the first quarter of 2021, Electronics generated organic sales growth of 0.2% over the year-earlier period. Increasing demand in Semiconductor Solutions and Surface Solutions was mostly offset by unfavorable pricing impacts due to continued competition in the Liquid Crystals business of Display Solutions. Adverse foreign exchange effects of –4.5% overshadowed organic growth, causing net sales of the Electronics business sector to decrease by –4.3% to € 861 million (Q1 2020: € 900 million).
ElectronicsNet sales by business unit
€ million Q1 2021 ShareOrganic growth1
Exchange rate effects
Acquisitions/divestments Total change Q1 20202 Share
Semiconductor Solutions 476 55% 3.7% –5.3% – –1.6% 483 54%
Display Solutions 275 32% –7.1% –3.2% – –10.3% 306 34%
Surface Solutions 111 13% 4.6% –4.7% – –0.1% 111 12%
Other – 0% 13.1% –1.5% – 11.6% – 0%
Electronics 861 100% 0.2% –4.5% – –4.3% 900 100%
1 Not defined by International Financial Reporting Standards (IFRS).2 Previous year’s figures have been adjusted owing to an internal realignment.
The Semiconductor Solutions business unit comprises two businesses, namely Semiconductor Materials and Delivery Systems & Services, and accounted for 55% of net sales of the Electronics business sector in the first quarter of 2021. Semiconductor Materials focuses on the development and commercialization of material-based solutions for the semiconductor industry, while Delivery Systems & Services focuses on developing, selling and operating delivery systems for semiconductor manufacturers. Semiconductor Solutions grew organically by 3.7% in the first quarter of 2021 thanks to strong demand across most business lines. The organic sales growth of Semiconductor Solutions was somewhat muted compared with the year-earlier quarter as running project orders and larger shipments in the Delivery Systems & Services business will lead to sales contributions only in later quarters. Foreign exchange had an unfavorable impact of –5.3%, leading to an overall decline in net sales of Semiconductor Solutions by –1.6% to € 476 million compared with the previous year (Q1 2020: € 483 million).
Quarterly Statement as of March 31, 2021 Course of Business and Economic Position Electronics 28
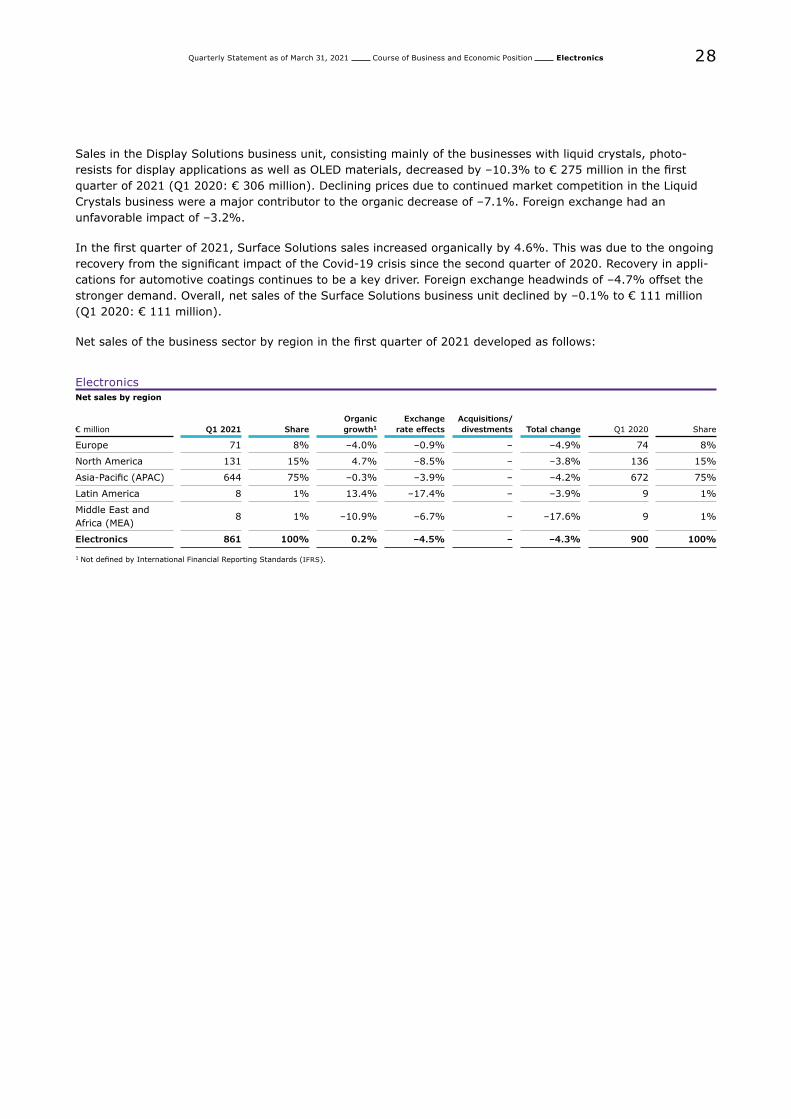
Sales in the Display Solutions business unit, consisting mainly of the businesses with liquid crystals, photo-resists for display applications as well as OLED materials, decreased by –10.3% to € 275 million in the first quarter of 2021 (Q1 2020: € 306 million). Declining prices due to continued market competition in the Liquid Crystals business were a major contributor to the organic decrease of –7.1%. Foreign exchange had an unfavorable impact of –3.2%.
In the first quarter of 2021, Surface Solutions sales increased organically by 4.6%. This was due to the ongoing recovery from the significant impact of the Covid-19 crisis since the second quarter of 2020. Recovery in appli-cations for automotive coatings continues to be a key driver. Foreign exchange headwinds of –4.7% offset the stronger demand. Overall, net sales of the Surface Solutions business unit declined by –0.1% to € 111 million (Q1 2020: € 111 million).
Net sales of the business sector by region in the first quarter of 2021 developed as follows:
ElectronicsNet sales by region
€ million Q1 2021 ShareOrganic growth1
Exchange rate effects
Acquisitions/divestments Total change Q1 2020 Share
Europe 71 8% –4.0% –0.9% – –4.9% 74 8%
North America 131 15% 4.7% –8.5% – –3.8% 136 15%
Asia-Pacific (APAC) 644 75% –0.3% –3.9% – –4.2% 672 75%
Latin America 8 1% 13.4% –17.4% – –3.9% 9 1%
Middle East and Africa (MEA)
8 1% –10.9% –6.7% – –17.6% 9 1%
Electronics 861 100% 0.2% –4.5% – –4.3% 900 100%
1 Not defined by International Financial Reporting Standards (IFRS).
Quarterly Statement as of March 31, 2021 Course of Business and Economic Position Electronics 29
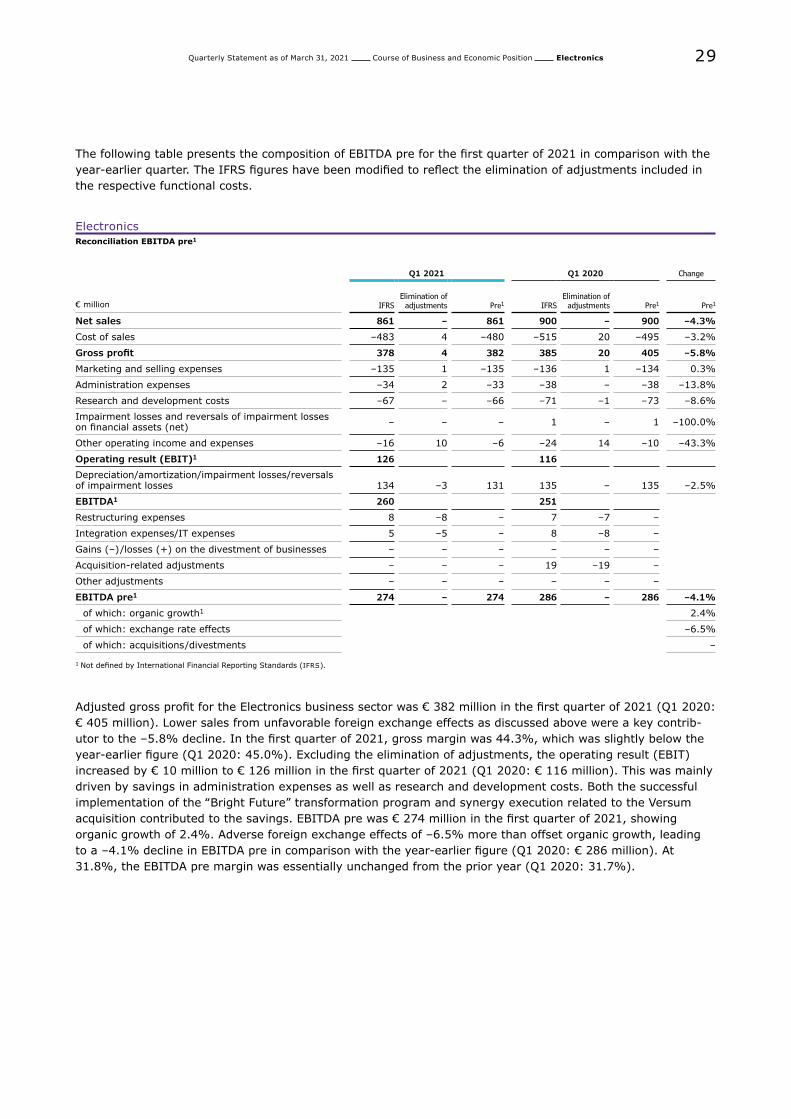
The following table presents the composition of EBITDA pre for the first quarter of 2021 in comparison with the year-earlier quarter. The IFRS figures have been modified to reflect the elimination of adjustments included in the respective functional costs.
ElectronicsReconciliation EBITDA pre1
Q1 2021 Q1 2020 Change
€ million IFRSElimination of
adjustments Pre1 IFRSElimination of
adjustments Pre1 Pre1
Net sales 861 – 861 900 – 900 –4.3%
Cost of sales –483 4 –480 –515 20 –495 –3.2%
Gross profit 378 4 382 385 20 405 –5.8%
Marketing and selling expenses –135 1 –135 –136 1 –134 0.3%
Administration expenses –34 2 –33 –38 – –38 –13.8%
Research and development costs –67 – –66 –71 –1 –73 –8.6%
Impairment losses and reversals of impairment losses on financial assets (net) – – – 1 – 1 –100.0%
Other operating income and expenses –16 10 –6 –24 14 –10 –43.3%
Operating result (EBIT)1 126 116
Depreciation/amortization/impairment losses/reversals of impairment losses 134 –3 131 135 – 135 –2.5%
EBITDA1 260 251
Restructuring expenses 8 –8 – 7 –7 –
Integration expenses/IT expenses 5 –5 – 8 –8 –
Gains (–)/losses (+) on the divestment of businesses – – – – – –
Acquisition-related adjustments – – – 19 –19 –
Other adjustments – – – – – –
EBITDA pre1 274 – 274 286 – 286 –4.1%
of which: organic growth1 2.4%
of which: exchange rate effects –6.5%
of which: acquisitions/divestments –
1 Not defined by International Financial Reporting Standards (IFRS).
Adjusted gross profit for the Electronics business sector was € 382 million in the first quarter of 2021 (Q1 2020: € 405 million). Lower sales from unfavorable foreign exchange effects as discussed above were a key contrib-utor to the –5.8% decline. In the first quarter of 2021, gross margin was 44.3%, which was slightly below the year-earlier figure (Q1 2020: 45.0%). Excluding the elimination of adjustments, the operating result (EBIT) increased by € 10 million to € 126 million in the first quarter of 2021 (Q1 2020: € 116 million). This was mainly driven by savings in administration expenses as well as research and development costs. Both the successful implementation of the ‟Bright Future” transformation program and synergy execution related to the Versum acquisition contributed to the savings. EBITDA pre was € 274 million in the first quarter of 2021, showing organic growth of 2.4%. Adverse foreign exchange effects of –6.5% more than offset organic growth, leading to a –4.1% decline in EBITDA pre in comparison with the year-earlier figure (Q1 2020: € 286 million). At 31.8%, the EBITDA pre margin was essentially unchanged from the prior year (Q1 2020: 31.7%).
Quarterly Statement as of March 31, 2021 Course of Business and Economic Position Corporate and Other 30
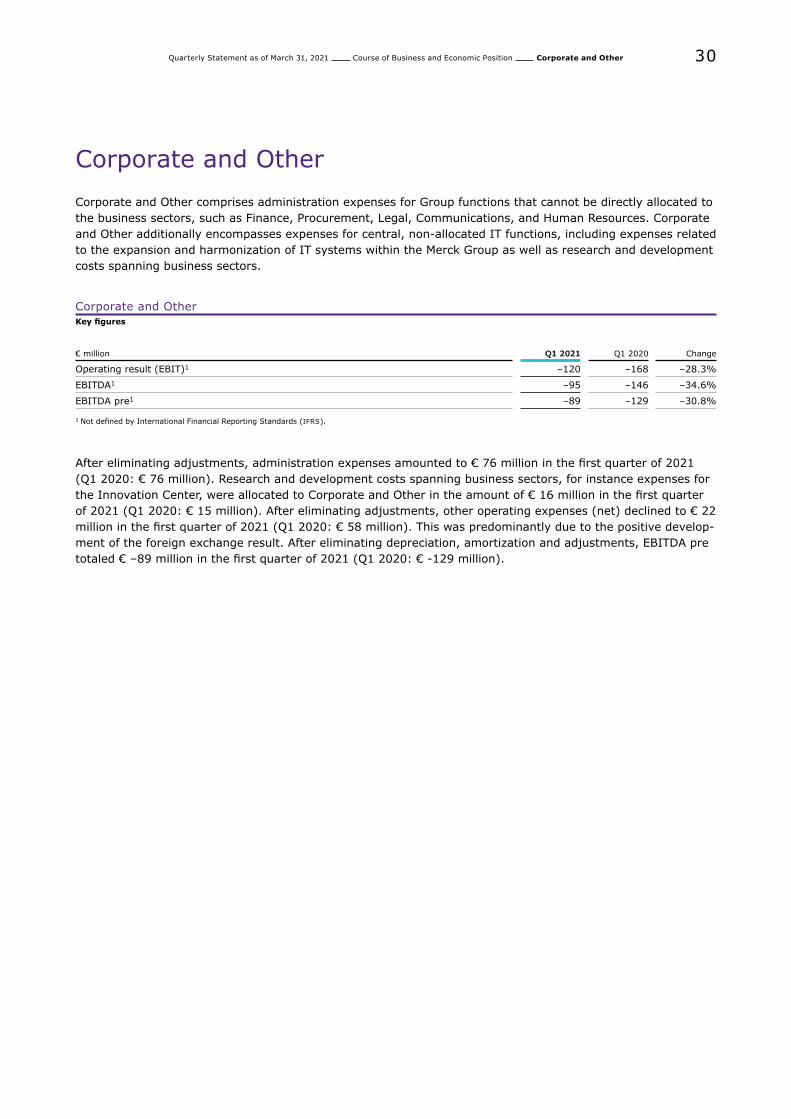
Corporate and Other Corporate and Other comprises administration expenses for Group functions that cannot be directly allocated to the business sectors, such as Finance, Procurement, Legal, Communications, and Human Resources. Corporate and Other additionally encompasses expenses for central, non-allocated IT functions, including expenses related to the expansion and harmonization of IT systems within the Merck Group as well as research and development costs spanning business sectors.
Corporate and OtherKey figures
€ million Q1 2021 Q1 2020 Change
Operating result (EBIT)1 –120 –168 –28.3%
EBITDA1 –95 –146 –34.6%
EBITDA pre1 –89 –129 –30.8%
1 Not defined by International Financial Reporting Standards (IFRS).
After eliminating adjustments, administration expenses amounted to € 76 million in the first quarter of 2021 (Q1 2020: € 76 million). Research and development costs spanning business sectors, for instance expenses for the Innovation Center, were allocated to Corporate and Other in the amount of € 16 million in the first quarter of 2021 (Q1 2020: € 15 million). After eliminating adjustments, other operating expenses (net) declined to € 22 million in the first quarter of 2021 (Q1 2020: € 58 million). This was predominantly due to the positive develop-ment of the foreign exchange result. After eliminating depreciation, amortization and adjustments, EBITDA pre totaled € –89 million in the first quarter of 2021 (Q1 2020: € -129 million).
Quarterly Statement as of March 31, 2021 Report on Expected Developments 31
Report on Expected Developments
Merck Group
With the publication of the results of fiscal 2020, we provided a forecast of the development of net sales and EBITDA pre for the Merck Group and the individual business sectors Healthcare, Life Science and Electronics as well as an estimation of Group operating cash flow in 2021. With the completion of the first quarter of 2021, we further specify this forecast.
The divestment of the allergy business Allergopharma to Dermapharm Beteiligungs GmbH (‟Dermapharm”) closed on March 31, 2020. The business in Europe was transferred to Dermapharm on March 31, 2020. The transfer of the Allergopharma business in China closed on August 31, 2020. Accordingly, in 2021 we report a portfolio effect from this transaction, yet this will not be material.
Moreover, on December 22, 2020, Merck fully acquired AmpTec GmbH, Hamburg, Germany, a leading contract development and manufacturing organization for mRNA, which is used in vaccines, medicines and diagnostics in connection with Covid-19 and numerous other diseases. Owing to the size of the acquired business, we do not expect a significant portfolio effect.
In the United States, Merck was involved in patent litigation with Biogen Inc., USA. Biogen sued Merck for having allegedly infringed a patent in connection with Rebif®. On September 28, 2020, the U.S. Court of Appeals for the Federal Circuit set aside the first-instance decision and declared Biogen’s patent invalid. Therefore, a provision amounting to € 365 million for this patent litigation was reversed. The income from the reversal of the provision led to a corresponding increase in EBITDA pre in fiscal 2020. The following forecast, especially the information on the organic growth rates for EBITDA pre of the Merck Group and the Healthcare business sector, is based on a year-earlier figure that has been adjusted for the income from the reversal of a provision.
As regards the Covid-19 pandemic and the negative effects thereof, we assume that the business recovery that started in the second half of 2020 will continue in fiscal 2021. At present, we do not assume that further disease waves will have a negative effect comparable to that seen in the first half of 2020, especially on the Healthcare and Electronics business sectors. For Life Science, we continue to expect significantly positive con-tributions owing to the Covid-19 pandemic, particularly in the Process Solutions business unit. The increasing availability of Covid-19 vaccines and the associated immunization of the population will contribute to a further stabilization of the societal and economic situation. Nevertheless, the present forecast is subject to a higher degree of estimation uncertainty than was the case in previous years.
With regard to exchange rate developments, we continue to expect a volatile environment due to political and macroeconomic developments. In the first three months of 2021, the euro-U.S. dollar exchange rate was within the range of 1.17 to 1.22 that we had previously expected for the full year 2021, albeit at the upper end of the corridor. In the first three months, individual growth market currencies developed slightly positively compared with the assumptions made in the previous forecast. Overall, we therefore expect that the negative impact of these developments on both net sales and EBITDA pre will be somewhat milder than assumed in the Annual Report. Nevertheless, we still see negative foreign exchange effects in comparison with the previ-ous year. In this context, we assume that in particular, the euro-U.S. dollar exchange rate will impact foreign exchange effects, especially in the first half of 2021. Foreign exchange developments in individual growth markets will continue to contribute to the overall negative exchange rate impact. The expected negative for-eign exchange effects on EBITDA pre will be partly mitigated by currency hedging, although we do not hedge all growth market currencies. This forecast for 2021 is based on a euro-U.S. dollar exchange rate in a corridor of 1.19 to 1.23.
Quarterly Statement as of March 31, 2021 Report on Expected Developments 32
Net sales
Following a strong first quarter of 2021, we are raising the forecast for net sales of the Merck Group. For 2021, we expect organic growth of 10% to 12% (previously strong organic growth) to which all business sectors, yet first and foremost Life Science, will contribute. We expect negative foreign exchange effects between –2% and –4%. Overall, we forecast net sales in a range of between € 18.5 billion and € 19.5 billion (2020: € 17.53 billion).
EBITDA pre
EBITDA pre is our key financial indicator to steer operating business. For fiscal 2021, we are raising our forecast and now expect an organic increase in EBITDA pre of between 16% and 20% (previously organic growth in the high single-digit to low teens percentage range). This is based on an EBITDA pre of € 4.84 billion in 2020, adjusted for the reversal of the Biogen provision. All three business sectors will contribute to this development, especially Life Science. The forecast foreign exchange development is likely to adversely affect Group EBITDA pre by between –2% and –4% in fiscal 2021; it is expected to be seen mainly in the Health-care and Electronics business sectors. Consequently, EBITDA pre is expected to be between € 5.4 billion and € 5.8 billion.
Operating cash flow
As of fiscal 2021, operating cash flow will represent one of our key performance indicators at Group level and thus replace business free cash flow (BFCF) as a steering parameter. As regards the composition of operating cash flow, we make reference to the consolidated cash flow statement. In general, the forecast for operating cash flow is subject to a higher fluctuation corridor than the forecast for net sales, EBITDA pre and the pre-vious steering parameter BFCF. We provide an estimate of the development of operating cash flow at Group level.
The expected strong development of operating business in fiscal 2021 will be the main driver of operating cash flow. However, the operating cash flow reference figure used in fiscal 2020 (€ 3.48 billion) included the increasing receipt of payments from customers in the fourth quarter of 2020. Since we do not expect a com-parable effect in fiscal 2021, this will have a negative impact on the forecast development for this steering parameter in 2021. We continue to expect payouts for the ongoing transformation programs on a larger scale in 2021. Among other things, this relates to the transformation and growth program that was launched in the Healthcare business sector in 2020. Negative foreign exchange effects will also adversely impact operat-ing cash flow. Against this backdrop, for 2021 we expect operating cash flow of € 3.6 billion to € 4.2 billion (previously a slight increase).
Quarterly Statement as of March 31, 2021 Report on Expected Developments 33
Healthcare
Following significant negative effects from the Covid-19 pandemic that impacted the Healthcare business sector in fiscal 2020, we now expect to see organic growth of net sales in 2021 of 7% to 10% (previously strong organic growth). This will be driven mainly by Mavenclad® and Bavencio®, for which we expect to see further significant sales increases. For the core business, we forecast a roughly stable development overall. This reflects the continued competitive pressure and the associated decline in sales of Rebif®. Although the negative impacts of the volume-based procurement regulations that took effect in China in 2020 will now be incurred in full in 2021, we forecast a roughly stable organic development for our products in the Cardio-vascular, Metabolism and Endocrinology franchise. We assume that Cardiovascular, Metabolism and Endocri-nology will resume its growth course as of 2022. The development of the Fertility franchise will have a positive effect. At present we do not assume any significant negative effects of the Covid-19 pandemic on Healthcare sales. We expect a negative foreign exchange effect of between –2% and –4%. Overall, we forecast net sales of € 6.85 billion to € 7.2 billion (2020: € 6.64 billion).
For 2021, we expect EBITDA pre for the Healthcare business sector of € 2.0 billion to € 2.1 billion (2020: € 1.90 billion, excluding the reversal of the provision from the patent litigation with Biogen). For this key performance indicator, we forecast organic growth of 12% to 15% (previously strong organic growth). The negative earnings effects resulting from the expected decline in Rebif® sales should be more than offset particularly by significant earnings contributions from Mavenclad®. In addition, we will continue our rigorous cost management efforts and continuous prioritization of our development pipeline. We therefore expect the share of both marketing and selling expenses as well as research and development costs to decline as a percentage of sales. Research and development costs will remain heavily dependent on the development of clinical data as well as further expected study results. We forecast the upfront cash payment in the context of the global strategic alliance with GlaxoSmithKline plc for the joint development and marketing of bintrafusp alfa to have a positive earnings effect in the higher double-digit euro millions, which will be recognized in other operating income. The precise amount depends on the cost evolution. Development milestones will no longer occur in fiscal 2021 subsequent to the discontinuation of the INTR@PID Lung 037 trial, which was announced at the beginning of the year. The forecast reflects income expected from active portfolio management in a low to mid double-digit million range, income from two already received milestone payments within the scope of our strategic alliance with Pfizer to develop and commercialize Bavencio® as well as research and develop-ment costs from the in-licensing of xevinapant. By contrast, we expect foreign exchange to have a significant adverse impact on EBITDA pre of between –5% and –7%.
Life Science
Following a strong first quarter, we are raising our forecast for net sales of the Life Science business sector. For fiscal 2021, we now expect organic growth of 15% to 18% (previously growth in the lower teens percent-age range). The Process Solutions business unit will clearly remain the strongest driver of growth and will be accelerated by further significantly positive Covid-19 effects. The development of the core business will also be stronger than initially expected. The Applied Solutions and Research Solutions business units will con-tribute positively to the overall development of Life Science as well. The dynamic growth in our Life Science business is currently subject to higher volatility due to the varying development across product groups and customer segments. Increased research and development activity as well as higher production volumes among pharmaceutical companies, especially in the biopharmaceutical segment, are the key drivers of growth in the core business. Amid the Covid-19 pandemic, our growth is being complemented by increased production of
Quarterly Statement as of March 31, 2021 Report on Expected Developments 34
vaccines, medicines and diagnostics, for which we manufacture the required input materials. The expansion of our production capacities will enable us to meet a higher level of demand. We expect a negative foreign exchange effect of –2% to –5%. Consequently, we project net sales of between € 8.2 billion and € 8.7 billion (2020: € 7.51 billion).
We have increased the forecast for EBITDA pre of the Life Science business sector and now expect to gener-ate EBITDA pre of € 2.85 billion to € 3.0 billion in fiscal 2021 (2020: € 2.41 billion). This is likely to reflect organic growth of 22% to 26% over 2020 (previously growth in the low teens percentage range). The per-sistently dynamic demand trend and clearly positive Covid-19 effects will contribute to organic earnings growth. EBITDA pre will reflect both a favorable product mix driven mainly by Covid-19 as well as positive scale effects, as seen particularly clearly in an unusually strong first quarter. However, higher freight costs caused by the Covid-19 pandemic will have an opposing effect. In the further course of 2021, we expect that costs incurred will increase in line with sales growth and that the product mix will normalize. Based on our estimates, the foreign exchange impact on earnings in fiscal 2021 should be between –1% and –3%.
Electronics
Following the successful realignment of our portfolio, we expect net sales of the Electronics business sector to grow organically by 5% to 7% in fiscal 2021, which should translate into sales of € 3.4 billion to € 3.55 billion (2020: € 3.38 billion (previously solid organic growth). For Semiconductor Solutions, we continue to expect a strong growth dynamic, which will exceed market growth in the medium term. The business unit will thus become the main driver of performance in Electronics. Within Semiconductor Solutions, we have increased our forecast for our semiconductor materials business. The effect of the decline in the Delivery Systems & Services business due to a project delay will be mitigated. As expected, the project business will be subject to strong fluctuations in the course of the year. Following a recovery from the effects of the Covid-19 pandemic in 2020, we expect that the organic performance of our Surface Solutions business will be positive in fiscal 2021. Our Liquid Crystals business will decline further and still face continued price erosion due to price pressure com-mon in this industry. We forecast a foreign exchange effect of –1% to –4%.
We are raising the EBITDA pre forecast for our Electronics business sector and predict for 2021 an organic increase in a corridor of 9% to 12% (previously a solid to strong organic increase). In this context, we assume that the anticipated growth of Semiconductor Solutions as well as active cost management will more than offset the price decline in Liquid Crystals. This forecast includes the planned realization of synergies totaling around € 83 million from the integration of Versum Materials. We assume that the expected foreign exchange develop-ment will have a negative effect of between –3% and –5% on EBITDA pre. Overall, we forecast EBITDA pre in a range of between € 1.05 billion and € 1.13 billion (2020: € 1.02 billion).
Quarterly Statement as of March 31, 2021 Report on Expected Developments 35
Corporate and Other
We forecast EBITDA pre of Corporate and Other for fiscal 2021 in a corridor of € –440 million to € –490 million (2020: € –495 million). We are thus planning a lower cost level in comparison with 2020. This is mainly due to the positive effects expected from foreign currency hedging, which will partly offset negative foreign exchange effects in the business sectors.
In summary, the forecast for fiscal 2021 is as follows:
Forecast for the Merck Group Forecast for FY 2021
€ million Net sales EBITDA pre Operating cash flow
Merck Group ~18,500 to 19,500• Organic increase of +10% to +12%• Exchange rate effect –2% to –4%
~ 5,400 to 5,8001
• Organic increase of +16% to +20%• Exchange rate effect –2% to –4%
~3,600 to 4,200
Healthcare ~6,850 to 7,200• Organic increase of +7% to +10%• Exchange rate effect –2% to –4%
~ 2,000 to 2,1001
• Organic increase of +12% to +15%• Exchange rate effect –5% to –7%
n/a
Life Science ~8,200 to 8,700• Organic increase of +15% to +18%• Exchange rate effect –2% to –5%
~2,850 to 3,000• Organic increase of +22% to +26%• Exchange rate effect –1% to –3%
n/a
Electronics ~3,400 to 3,550• Organic increase of +5% to +7%• Exchange rate effect –1% to –4%
~1,050 to 1,130• Organic increase of +9% to +12%• Exchange rate effect –3% to –5%
n/a
Corporate and Other – ~–440 to –490 n/a
1 EBITDA pre of fiscal 2020 included income from the reversal of a provision for patent litigation amounting to € 365 million. Including this amount in 2020, we expect organic growth of between 9% and 12% for the Group and an organic decline of –4% to –6% for Healthcare.
EPS pre € 7.50 to € 8.20, based on an adjusted underlying tax rate of 23%
Full-year FX assumption for 2021: € 1 = US$ 1.19 to US$ 1.23

Supplemental Financial Information
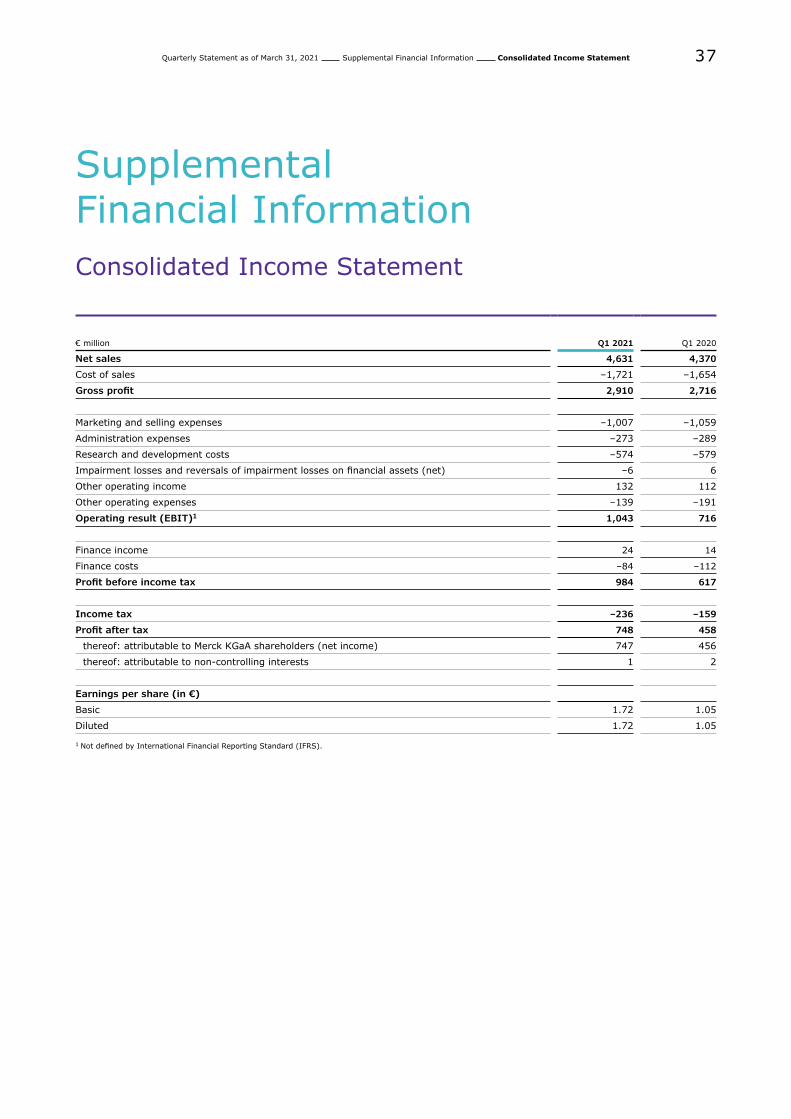
Quarterly Statement as of March 31, 2021 Supplemental Financial Information Consolidated Income Statement 37
Supplemental Financial InformationConsolidated Income Statement
€ million Q1 2021 Q1 2020
Net sales 4,631 4,370
Cost of sales –1,721 –1,654
Gross profit 2,910 2,716
Marketing and selling expenses –1,007 –1,059
Administration expenses –273 –289
Research and development costs –574 –579
Impairment losses and reversals of impairment losses on financial assets (net) –6 6
Other operating income 132 112
Other operating expenses –139 –191
Operating result (EBIT)1 1,043 716
Finance income 24 14
Finance costs –84 –112
Profit before income tax 984 617
Income tax –236 –159
Profit after tax 748 458
thereof: attributable to Merck KGaA shareholders (net income) 747 456
thereof: attributable to non-controlling interests 1 2
Earnings per share (in €)
Basic 1.72 1.05
Diluted 1.72 1.05
1 Not defined by International Financial Reporting Standard (IFRS).
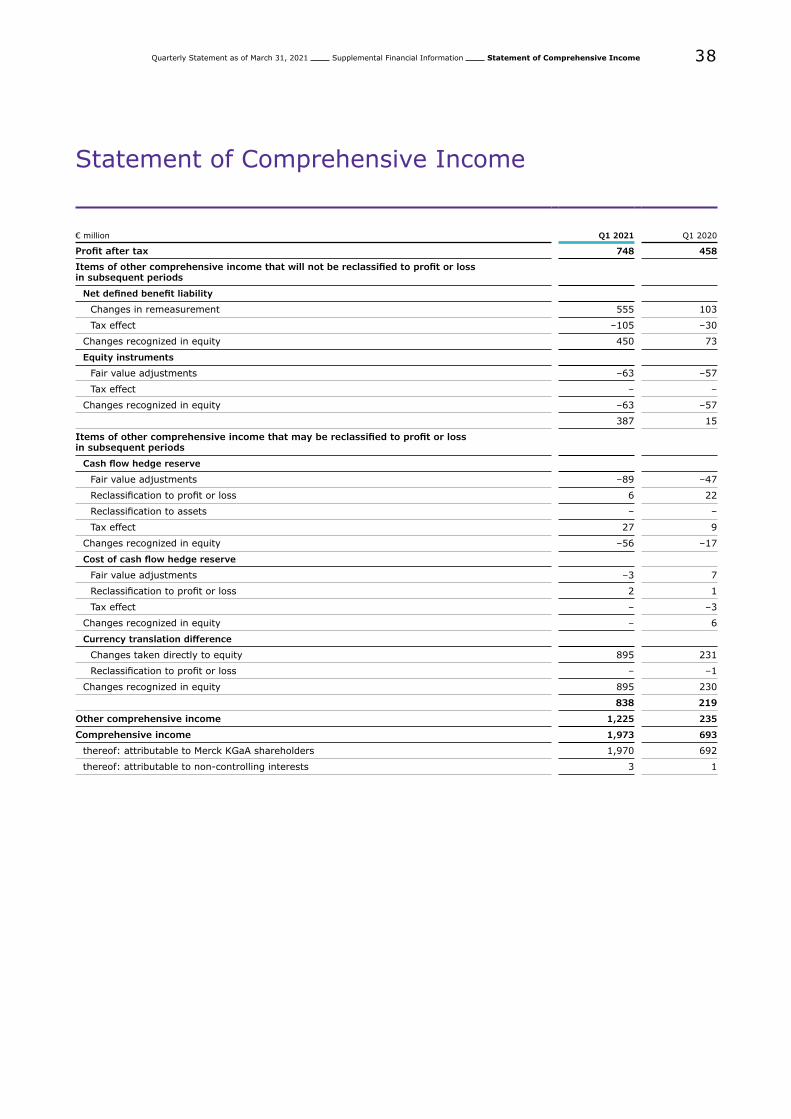
Quarterly Statement as of March 31, 2021 Supplemental Financial Information Statement of Comprehensive Income 38
Statement of Comprehensive Income
€ million Q1 2021 Q1 2020
Profit after tax 748 458
Items of other comprehensive income that will not be reclassified to profit or loss in subsequent periods
Net defined benefit liability
Changes in remeasurement 555 103
Tax effect –105 –30
Changes recognized in equity 450 73
Equity instruments
Fair value adjustments –63 –57
Tax effect – –
Changes recognized in equity –63 –57
387 15
Items of other comprehensive income that may be reclassified to profit or loss in subsequent periods
Cash flow hedge reserve
Fair value adjustments –89 –47
Reclassification to profit or loss 6 22
Reclassification to assets – –
Tax effect 27 9
Changes recognized in equity –56 –17
Cost of cash flow hedge reserve
Fair value adjustments –3 7
Reclassification to profit or loss 2 1
Tax effect – –3
Changes recognized in equity – 6
Currency translation difference
Changes taken directly to equity 895 231
Reclassification to profit or loss – –1
Changes recognized in equity 895 230
838 219
Other comprehensive income 1,225 235
Comprehensive income 1,973 693
thereof: attributable to Merck KGaA shareholders 1,970 692
thereof: attributable to non-controlling interests 3 1
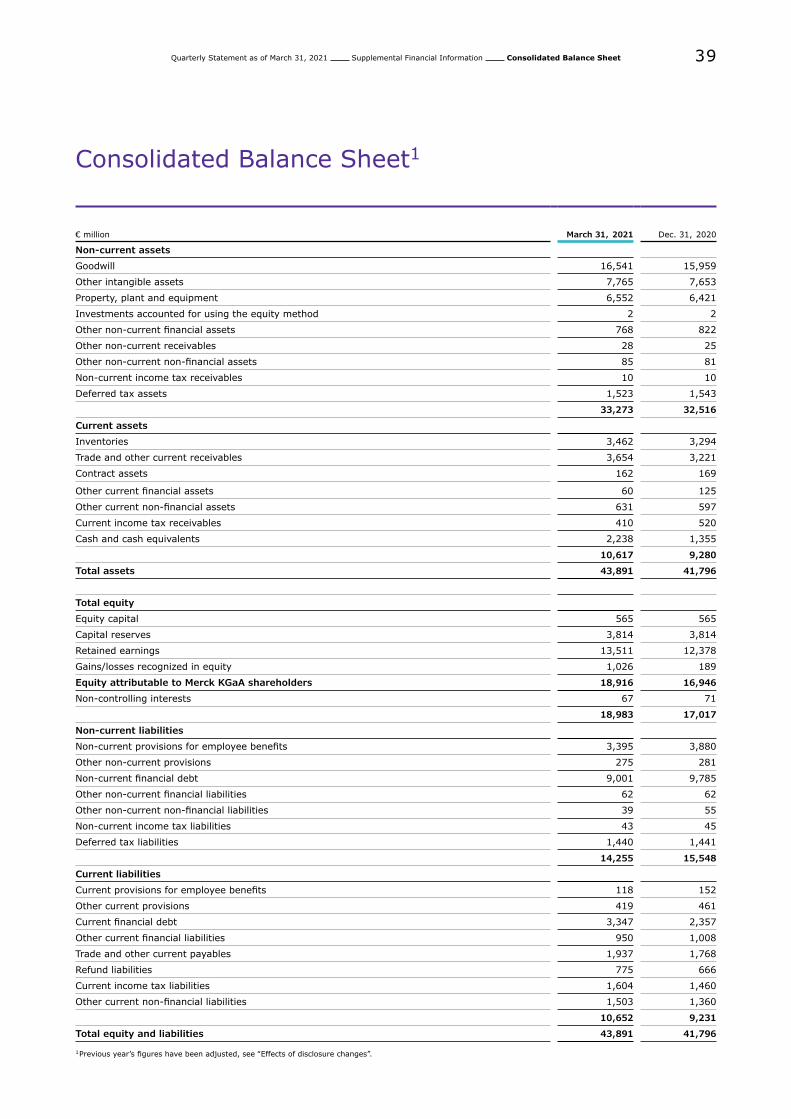
Quarterly Statement as of March 31, 2021 Supplemental Financial Information Consolidated Balance Sheet 39
Consolidated Balance Sheet1
€ million March 31, 2021 Dec. 31, 2020
Non-current assets
Goodwill 16,541 15,959
Other intangible assets 7,765 7,653
Property, plant and equipment 6,552 6,421
Investments accounted for using the equity method 2 2
Other non-current financial assets 768 822
Other non-current receivables 28 25
Other non-current non-financial assets 85 81
Non-current income tax receivables 10 10
Deferred tax assets 1,523 1,543
33,273 32,516
Current assets
Inventories 3,462 3,294
Trade and other current receivables 3,654 3,221
Contract assets 162 169
Other current financial assets 60 125
Other current non-financial assets 631 597
Current income tax receivables 410 520
Cash and cash equivalents 2,238 1,355
10,617 9,280
Total assets 43,891 41,796
Total equity
Equity capital 565 565
Capital reserves 3,814 3,814
Retained earnings 13,511 12,378
Gains/losses recognized in equity 1,026 189
Equity attributable to Merck KGaA shareholders 18,916 16,946
Non-controlling interests 67 71
18,983 17,017
Non-current liabilities
Non-current provisions for employee benefits 3,395 3,880
Other non-current provisions 275 281
Non-current financial debt 9,001 9,785
Other non-current financial liabilities 62 62
Other non-current non-financial liabilities 39 55
Non-current income tax liabilities 43 45
Deferred tax liabilities 1,440 1,441
14,255 15,548
Current liabilities
Current provisions for employee benefits 118 152
Other current provisions 419 461
Current financial debt 3,347 2,357
Other current financial liabilities 950 1,008
Trade and other current payables 1,937 1,768
Refund liabilities 775 666
Current income tax liabilities 1,604 1,460
Other current non-financial liabilities 1,503 1,360
10,652 9,231
Total equity and liabilities 43,891 41,796
1 Previous year’s figures have been adjusted, see ‟Effects of disclosure changes”.
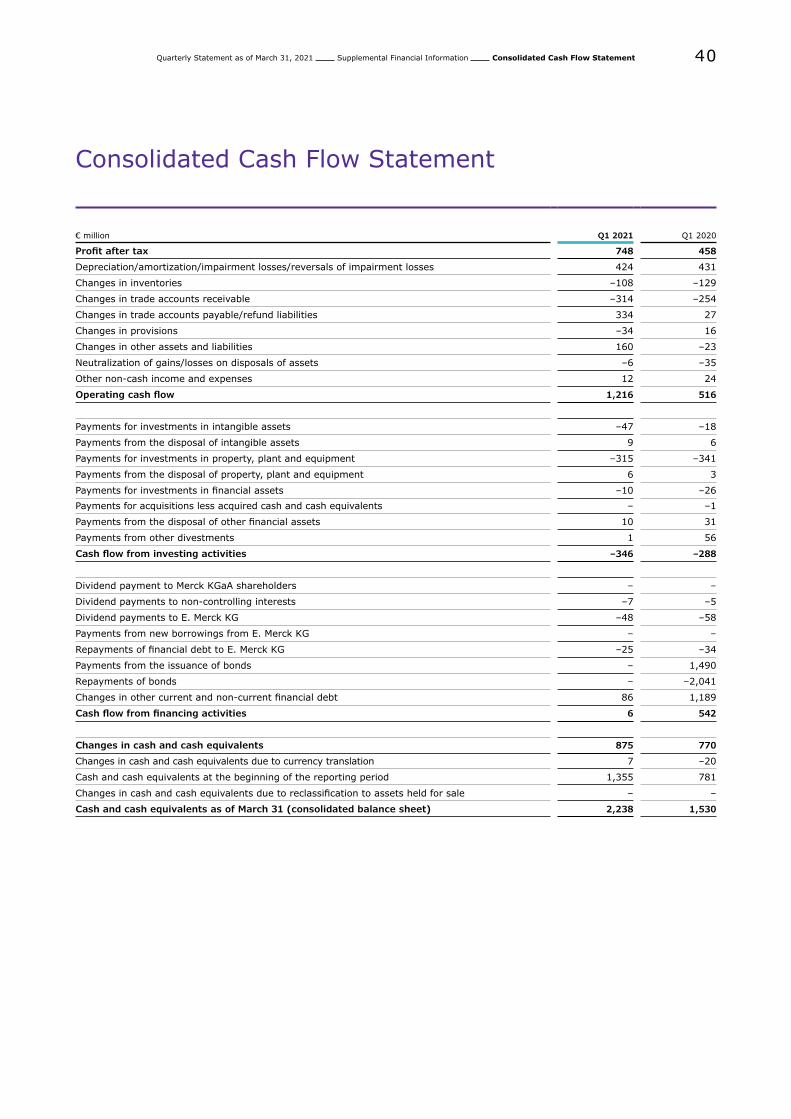
Quarterly Statement as of March 31, 2021 Supplemental Financial Information Consolidated Cash Flow Statement 40
Consolidated Cash Flow Statement
€ million Q1 2021 Q1 2020
Profit after tax 748 458
Depreciation/amortization/impairment losses/reversals of impairment losses 424 431
Changes in inventories –108 –129
Changes in trade accounts receivable –314 –254
Changes in trade accounts payable/refund liabilities 334 27
Changes in provisions –34 16
Changes in other assets and liabilities 160 –23
Neutralization of gains/losses on disposals of assets –6 –35
Other non-cash income and expenses 12 24
Operating cash flow 1,216 516
Payments for investments in intangible assets –47 –18
Payments from the disposal of intangible assets 9 6
Payments for investments in property, plant and equipment –315 –341
Payments from the disposal of property, plant and equipment 6 3
Payments for investments in financial assets –10 –26
Payments for acquisitions less acquired cash and cash equivalents – –1
Payments from the disposal of other financial assets 10 31
Payments from other divestments 1 56
Cash flow from investing activities –346 –288
Dividend payment to Merck KGaA shareholders – –
Dividend payments to non-controlling interests –7 –5
Dividend payments to E. Merck KG –48 –58
Payments from new borrowings from E. Merck KG – –
Repayments of financial debt to E. Merck KG –25 –34
Payments from the issuance of bonds – 1,490
Repayments of bonds – –2,041
Changes in other current and non-current financial debt 86 1,189
Cash flow from financing activities 6 542
Changes in cash and cash equivalents 875 770
Changes in cash and cash equivalents due to currency translation 7 –20
Cash and cash equivalents at the beginning of the reporting period 1,355 781
Changes in cash and cash equivalents due to reclassification to assets held for sale – –
Cash and cash equivalents as of March 31 (consolidated balance sheet) 2,238 1,530
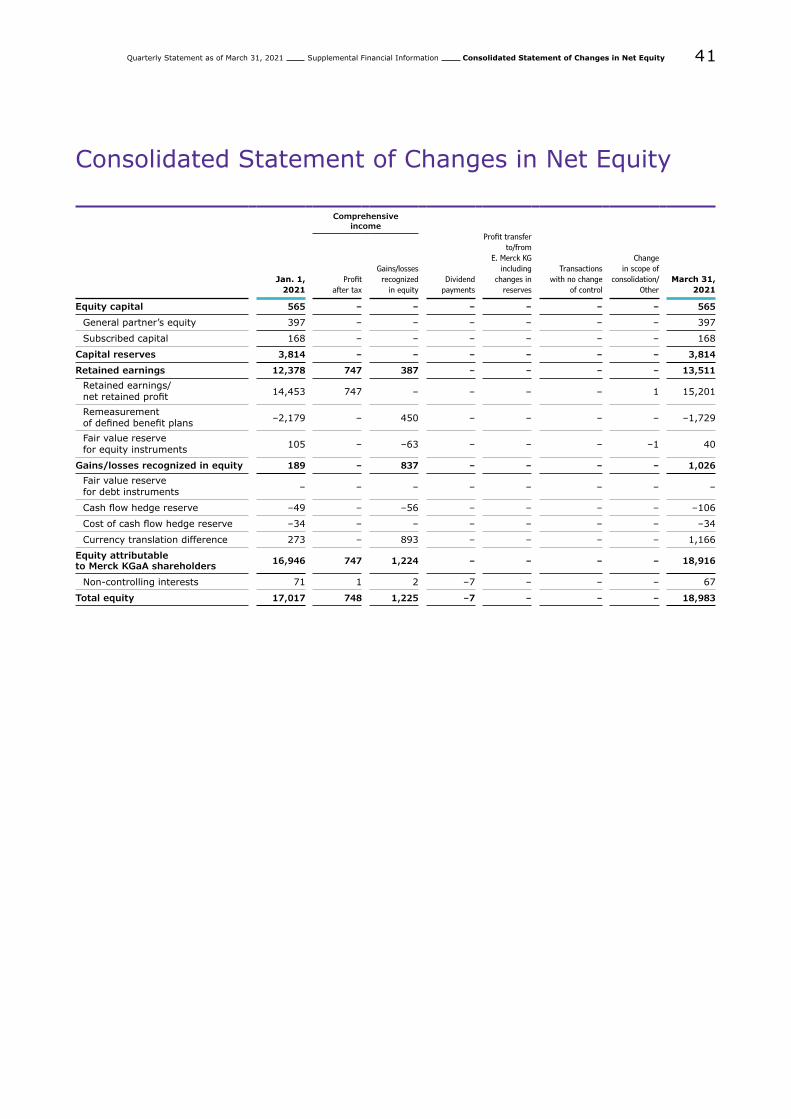
Quarterly Statement as of March 31, 2021 Supplemental Financial Information Consolidated Statement of Changes in Net Equity 41
Consolidated Statement of Changes in Net Equity
Comprehensiveincome
Jan. 1,2021
Profitafter tax
Gains/lossesrecognized
in equityDividend
payments
Profit transfer to/from
E. Merck KG including
changes in reserves
Transactionswith no change
of control
Changein scope of
consolidation/Other
March 31,2021
Equity capital 565 – – – – – – 565
General partner’s equity 397 – – – – – – 397
Subscribed capital 168 – – – – – – 168
Capital reserves 3,814 – – – – – – 3,814
Retained earnings 12,378 747 387 – – – – 13,511
Retained earnings/ net retained profit 14,453 747 – – – – 1 15,201
Remeasurement of defined benefit plans –2,179 – 450 – – – – –1,729
Fair value reserve for equity instruments 105 – –63 – – – –1 40
Gains/losses recognized in equity 189 – 837 – – – – 1,026
Fair value reserve for debt instruments – – – – – – – –
Cash flow hedge reserve –49 – –56 – – – – –106
Cost of cash flow hedge reserve –34 – – – – – – –34
Currency translation difference 273 – 893 – – – – 1,166
Equity attributable to Merck KGaA shareholders 16,946 747 1,224 – – – – 18,916
Non-controlling interests 71 1 2 –7 – – – 67
Total equity 17,017 748 1,225 –7 – – – 18,983
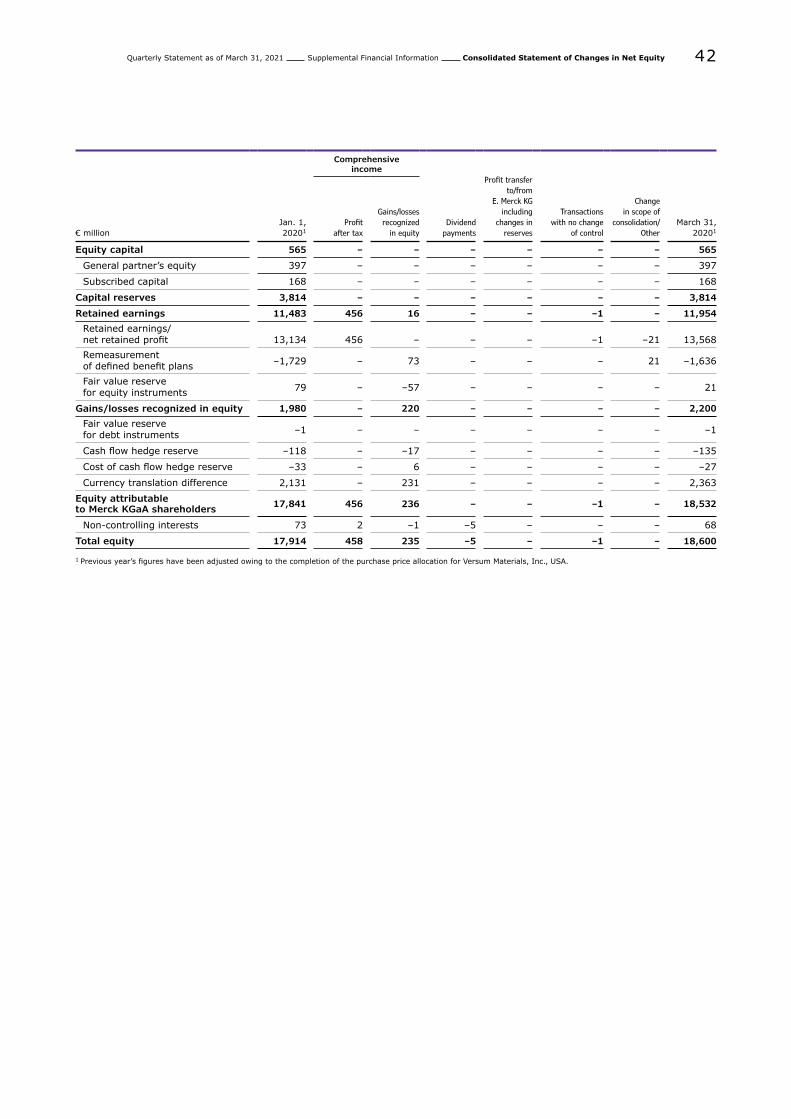
Quarterly Statement as of March 31, 2021 Supplemental Financial Information Consolidated Statement of Changes in Net Equity 42
Comprehensiveincome
€ million
Jan. 1,20201
Profitafter tax
Gains/lossesrecognized
in equityDividend
payments
Profit transfer to/from
E. Merck KG including
changes in reserves
Transactionswith no change
of control
Changein scope of
consolidation/Other
March 31,20201
Equity capital 565 – – – – – – 565
General partner’s equity 397 – – – – – – 397
Subscribed capital 168 – – – – – – 168
Capital reserves 3,814 – – – – – – 3,814
Retained earnings 11,483 456 16 – – –1 – 11,954
Retained earnings/ net retained profit 13,134 456 – – – –1 –21 13,568Remeasurement of defined benefit plans –1,729 – 73 – – – 21 –1,636
Fair value reserve for equity instruments 79 – –57 – – – – 21
Gains/losses recognized in equity 1,980 – 220 – – – – 2,200
Fair value reserve for debt instruments –1 – – – – – – –1
Cash flow hedge reserve –118 – –17 – – – – –135
Cost of cash flow hedge reserve –33 – 6 – – – – –27
Currency translation difference 2,131 – 231 – – – – 2,363
Equity attributable to Merck KGaA shareholders 17,841 456 236 – – –1 – 18,532
Non-controlling interests 73 2 –1 –5 – – – 68
Total equity 17,914 458 235 –5 – –1 – 18,600
1 Previous year’s figures have been adjusted owing to the completion of the purchase price allocation for Versum Materials, Inc., USA.
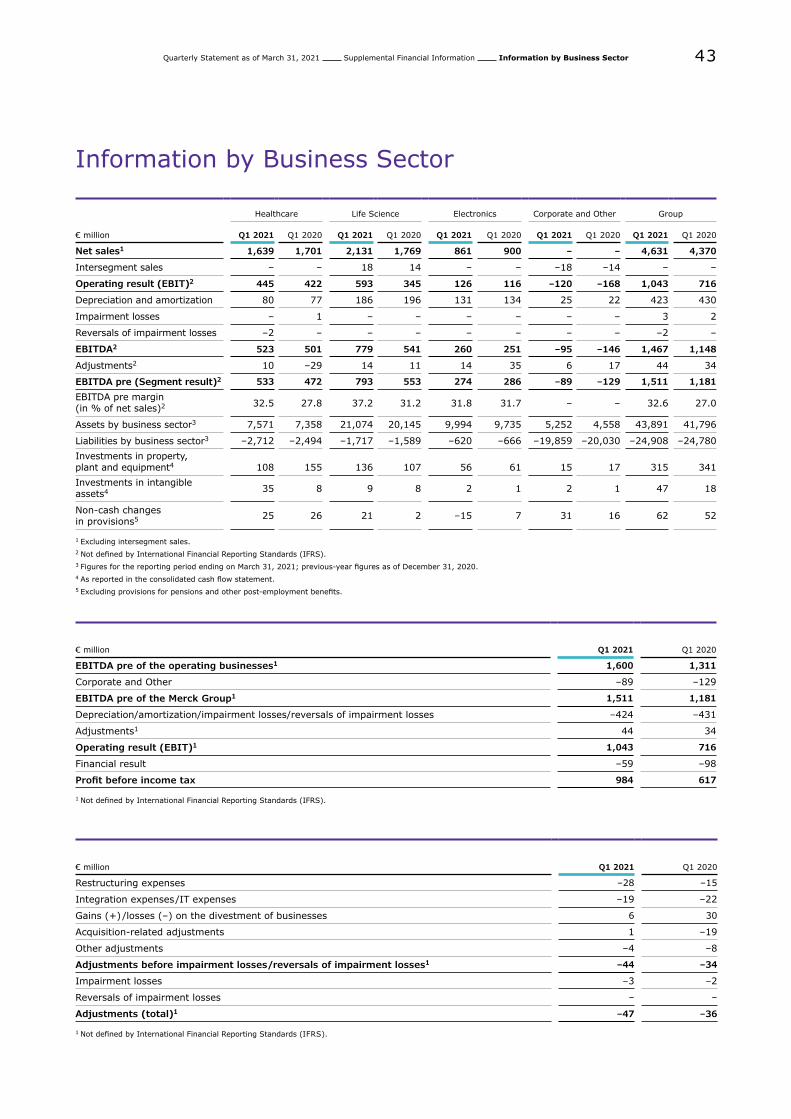
Quarterly Statement as of March 31, 2021 Supplemental Financial Information Information by Business Sector 43
Information by Business Sector
€ million
Healthcare Life Science Electronics Corporate and Other Group
Q1 2021 Q1 2020 Q1 2021 Q1 2020 Q1 2021 Q1 2020 Q1 2021 Q1 2020 Q1 2021 Q1 2020
Net sales1 1,639 1,701 2,131 1,769 861 900 – – 4,631 4,370
Intersegment sales – – 18 14 – – –18 –14 – –
Operating result (EBIT)2 445 422 593 345 126 116 –120 –168 1,043 716
Depreciation and amortization 80 77 186 196 131 134 25 22 423 430
Impairment losses – 1 – – – – – – 3 2
Reversals of impairment losses –2 – – – – – – – –2 –
EBITDA2 523 501 779 541 260 251 –95 –146 1,467 1,148
Adjustments2 10 –29 14 11 14 35 6 17 44 34
EBITDA pre (Segment result)2 533 472 793 553 274 286 –89 –129 1,511 1,181
EBITDA pre margin (in % of net sales)2 32.5 27.8 37.2 31.2 31.8 31.7 – – 32.6 27.0
Assets by business sector3 7,571 7,358 21,074 20,145 9,994 9,735 5,252 4,558 43,891 41,796
Liabilities by business sector3 –2,712 –2,494 –1,717 –1,589 –620 –666 –19,859 –20,030 –24,908 –24,780
Investments in property, plant and equipment4 108 155 136 107 56 61 15 17 315 341Investments in intangible assets4 35 8 9 8 2 1 2 1 47 18
Non-cash changes in provisions5 25 26 21 2 –15 7 31 16 62 52
1 Excluding intersegment sales.2 Not defined by International Financial Reporting Standards (IFRS).3 Figures for the reporting period ending on March 31, 2021; previous-year figures as of December 31, 2020.4 As reported in the consolidated cash flow statement.5 Excluding provisions for pensions and other post-employment benefits.
€ million Q1 2021 Q1 2020
EBITDA pre of the operating businesses1 1,600 1,311
Corporate and Other –89 –129
EBITDA pre of the Merck Group1 1,511 1,181
Depreciation/amortization/impairment losses/reversals of impairment losses –424 –431
Adjustments1 44 34
Operating result (EBIT)1 1,043 716
Financial result –59 –98
Profit before income tax 984 617
1 Not defined by International Financial Reporting Standards (IFRS).
€ million Q1 2021 Q1 2020
Restructuring expenses –28 –15
Integration expenses/IT expenses –19 –22
Gains (+) /losses (–) on the divestment of businesses 6 30
Acquisition-related adjustments 1 –19
Other adjustments –4 –8
Adjustments before impairment losses/reversals of impairment losses1 –44 –34
Impairment losses –3 –2
Reversals of impairment losses – –
Adjustments (total)1 –47 –36
1 Not defined by International Financial Reporting Standards (IFRS).
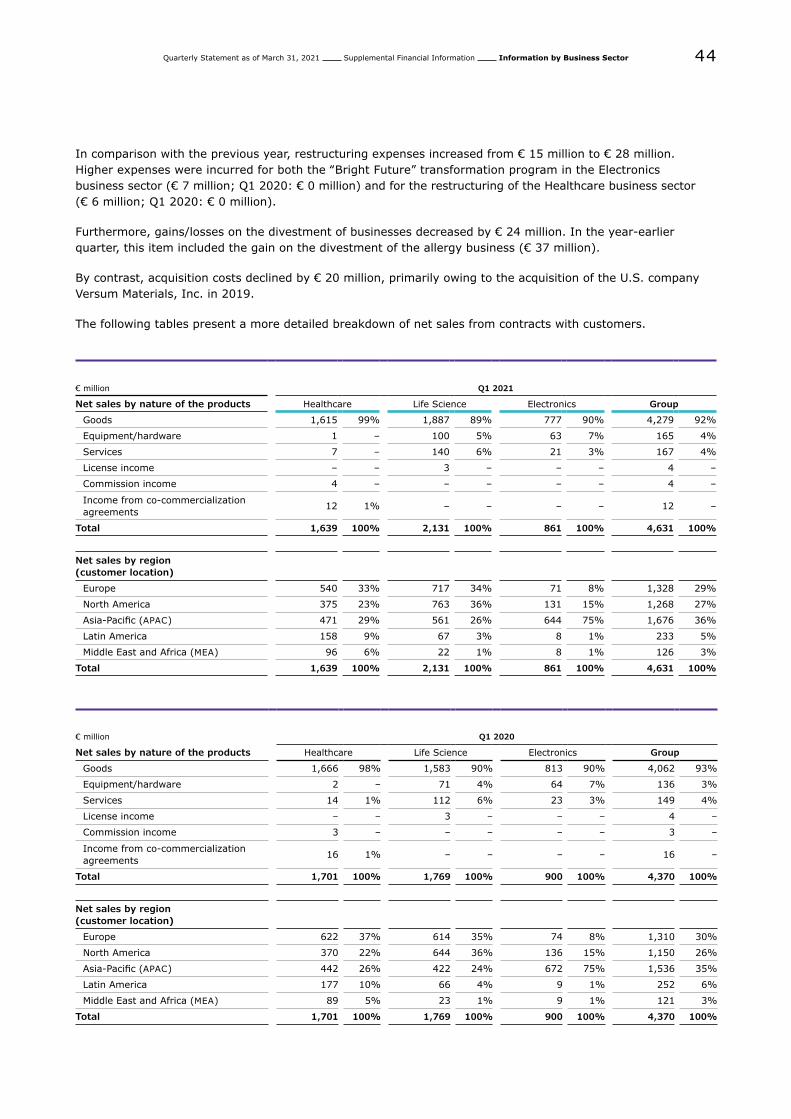
Quarterly Statement as of March 31, 2021 Supplemental Financial Information Information by Business Sector 44
In comparison with the previous year, restructuring expenses increased from € 15 million to € 28 million. Higher expenses were incurred for both the ‟Bright Future” transformation program in the Electronics business sector (€ 7 million; Q1 2020: € 0 million) and for the restructuring of the Healthcare business sector (€ 6 million; Q1 2020: € 0 million).
Furthermore, gains/losses on the divestment of businesses decreased by € 24 million. In the year-earlier quarter, this item included the gain on the divestment of the allergy business (€ 37 million).
By contrast, acquisition costs declined by € 20 million, primarily owing to the acquisition of the U.S. company Versum Materials, Inc. in 2019.
The following tables present a more detailed breakdown of net sales from contracts with customers.
€ million Q1 2021
Net sales by nature of the products Healthcare Life Science Electronics Group
Goods 1,615 99% 1,887 89% 777 90% 4,279 92%
Equipment/hardware 1 – 100 5% 63 7% 165 4%
Services 7 – 140 6% 21 3% 167 4%
License income – – 3 – – – 4 –
Commission income 4 – – – – – 4 –
Income from co-commercialization agreements
12 1% – – – – 12 –
Total 1,639 100% 2,131 100% 861 100% 4,631 100%
Net sales by region (customer location)
Europe 540 33% 717 34% 71 8% 1,328 29%
North America 375 23% 763 36% 131 15% 1,268 27%
Asia-Pacific (APAC) 471 29% 561 26% 644 75% 1,676 36%
Latin America 158 9% 67 3% 8 1% 233 5%
Middle East and Africa (MEA) 96 6% 22 1% 8 1% 126 3%
Total 1,639 100% 2,131 100% 861 100% 4,631 100%
€ million Q1 2020
Net sales by nature of the products Healthcare Life Science Electronics Group
Goods 1,666 98% 1,583 90% 813 90% 4,062 93%
Equipment/hardware 2 – 71 4% 64 7% 136 3%
Services 14 1% 112 6% 23 3% 149 4%
License income – – 3 – – – 4 –
Commission income 3 – – – – – 3 –
Income from co-commercialization agreements
16 1% – – – – 16 –
Total 1,701 100% 1,769 100% 900 100% 4,370 100%
Net sales by region (customer location)
Europe 622 37% 614 35% 74 8% 1,310 30%
North America 370 22% 644 36% 136 15% 1,150 26%
Asia-Pacific (APAC) 442 26% 422 24% 672 75% 1,536 35%
Latin America 177 10% 66 4% 9 1% 252 6%
Middle East and Africa (MEA) 89 5% 23 1% 9 1% 121 3%
Total 1,701 100% 1,769 100% 900 100% 4,370 100%
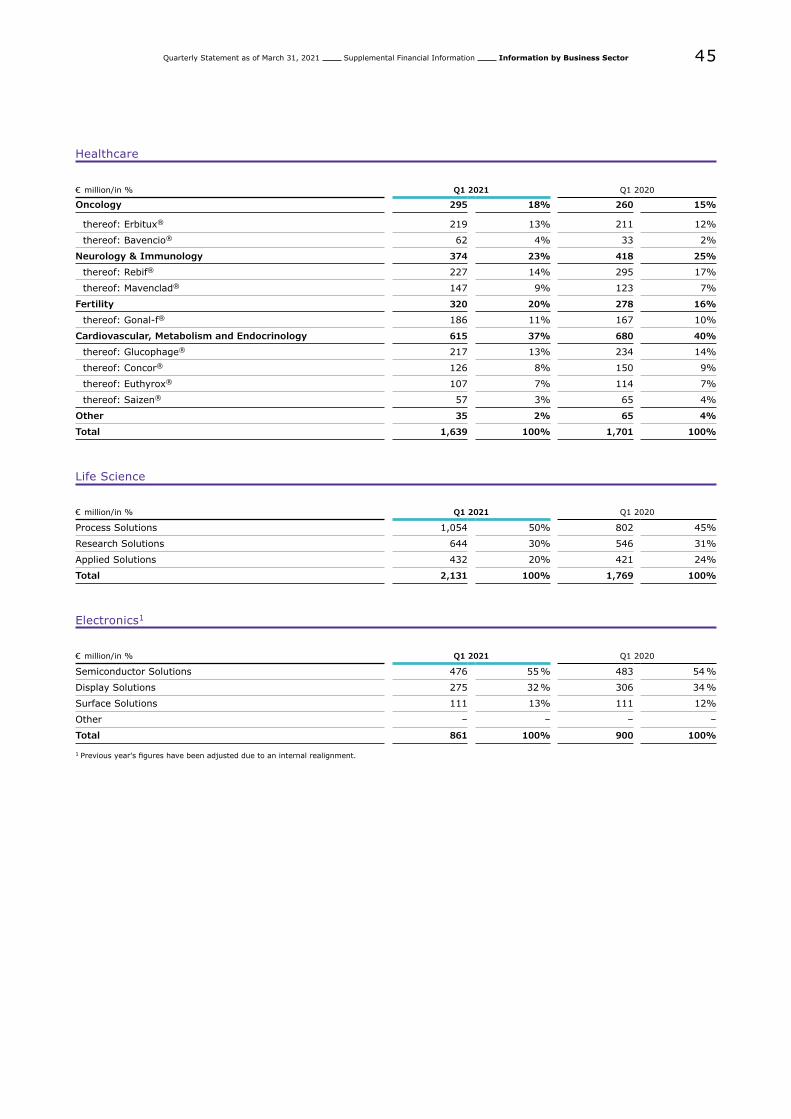
Quarterly Statement as of March 31, 2021 Supplemental Financial Information Information by Business Sector 45
Healthcare
€ million/in % Q1 2021 Q1 2020
Oncology 295 18% 260 15%
thereof: Erbitux® 219 13% 211 12%
thereof: Bavencio® 62 4% 33 2%
Neurology & Immunology 374 23% 418 25%
thereof: Rebif® 227 14% 295 17%
thereof: Mavenclad® 147 9% 123 7%
Fertility 320 20% 278 16%
thereof: Gonal-f® 186 11% 167 10%
Cardiovascular, Metabolism and Endocrinology 615 37% 680 40%
thereof: Glucophage® 217 13% 234 14%
thereof: Concor® 126 8% 150 9%
thereof: Euthyrox® 107 7% 114 7%
thereof: Saizen® 57 3% 65 4%
Other 35 2% 65 4%
Total 1,639 100% 1,701 100%
Life Science
€ million/in % Q1 2021 Q1 2020
Process Solutions 1,054 50% 802 45%
Research Solutions 644 30% 546 31%
Applied Solutions 432 20% 421 24%
Total 2,131 100% 1,769 100%
Electronics1
€ million/in % Q1 2021 Q1 2020
Semiconductor Solutions 476 55 % 483 54 %
Display Solutions 275 32 % 306 34 %
Surface Solutions 111 13% 111 12%
Other – – – –
Total 861 100% 900 100%
1 Previous year's figures have been adjusted due to an internal realignment.
Quarterly Statement as of March 31, 2021 Supplemental Financial Information Significant events during the reporting period 46
Significant events during the reporting period
End of patent law disputes in the Electronics business sector
In the Electronics business sector, Merck was involved in a legal dispute with JNC Corporation, Japan (JNC). JNC claimed that, by manufacturing and marketing certain liquid crystal mixtures, Merck had infringed JNC patents in China, Taiwan and Korea. Merck maintained that these patents were invalid owing to relevant prior art. The most recent patent infringement action on the part of JNC that was still pending and the patent nullity action on the part of Merck in Korea were resolved in an agreement by both parties in March of fiscal 2021. Based on the agreement, Merck is not required to make any payments to JNC. The provision, amounting to a low double-digit million euro figure, was thus reversed at the end of the first quarter of fiscal 2021.
In-licensing agreement with Debiopharm for an active ingredient candidate to treat head and neck tumors
On March 1, 2021, Merck announced the conclusion of an in-licensing agreement with Debiopharm International SA, Switzerland, (Debiopharm) on exclusive development and global commercialization rights for the active ingredient candidate xevinapant (Debio 1143). The agreement also includes development rights for preclinical follow-on compounds to xevinapant. Xevinapant is currently being investigated in the Phase III study for previously untreated high-risk locally advanced squamous cell carcinoma of the head and neck in combination with platinum-based chemotherapy and standard fractionation intensity-modulated radiotherapy. Merck also will initiate a second global Phase III study to evaluate xevinapant in patients with high-risk locally advanced squamous cell carcinoma of the head and neck who are unable to tolerate high-dose cisplatin in combination with radiotherapy.
As part of the agreement, Debiopharm will receive € 188 million in upfront payments and up to € 710 million in regulatory and commercial milestones, as well as royalty payments. The transaction had not yet closed on March 31, 2021 due to outstanding conditions. The closing took place in April 2021. Consequently, the transaction had no impact on the financial figures of March 31, 2021.

Quarterly Statement as of March 31, 2021 Supplemental Financial Information Subsequent events 47
Subsequent eventsEffective May 1, 2021, Belén Garijo became Chair of the Executive Board and CEO of Merck, succeeding Stefan Oschmann. Moreover, on April 1, 2021, Matthias Heinzel joined the Executive Board and was appointed CEO of the Life Science business sector.
Subsequent to the balance sheet date, no further events of special importance occurred that could have a material impact on the net assets, financial position or results of operations.
Quarterly Statement as of March 31, 2021 Supplemental Financial Information Effects of disclosure changes 48
Effects of disclosure changes
Change in balance sheet disclosure of long-term income tax receivables and income tax liabilities
To increase comparability, with effect from January 1, 2021, Merck adapted the disclosure of long-term income tax receivables and income tax liabilities.
Long-term assets were expanded to include the balance sheet item ‟long-term income tax receivables”. In connection with this reclassification, other long-term non-financial assets were reduced correspondingly by € 10 million.
Long-term liabilities were expanded to include the balance sheet item ‟long-term income tax liabilities”. In connection with this reclassification, other long-term non-financial liabilities were reduced correspondingly by € 45 million.
Darmstadt, May 7, 2021
Belén Garijo
Kai Beckmann Peter Guenter
Matthias Heinzel Marcus Kuhnert

FINANCIAL CALENDAR 2021 · 2022
August
5 Half-yearly Financial Report
2021
March
3 Annual Press Conference2022
November
11 Quarterly Statement Q32021
April
22 Annual General Meeting2022

Published on May 12, 2021by Merck KGaA, Group CommunicationsFrankfurter Str. 250, 64293 Darmstadt, GermanyTelephone: + 49 6151 72– 0Internet: www.merckgroup.com
TYPESETTING & LAYOUTtypowerkstatt Dieter Thomas Schwarz, Weiterstadt