Embed Size (px)
Citation preview
Quarterly reporton the Spanisheconomy
1. Overview
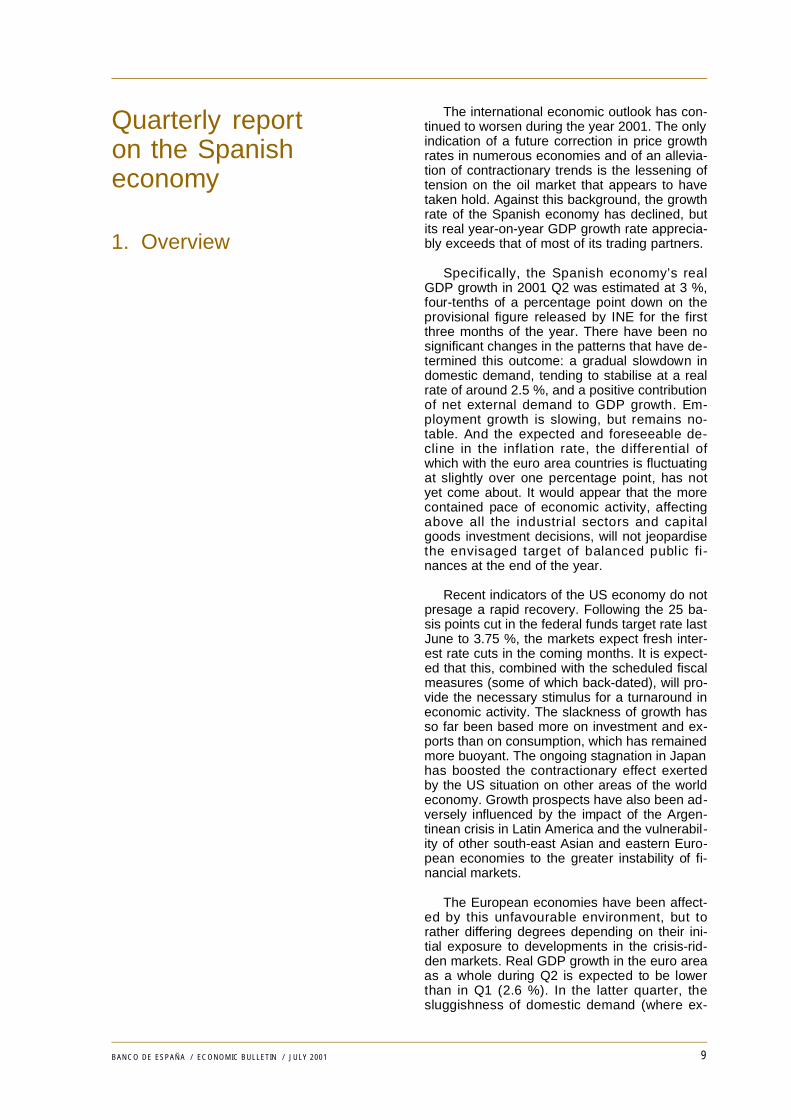
The international economic outlook has con-tinued to worsen during the year 2001. The onlyindication of a future correction in price growthrates in numerous economies and of an allevia-tion of contractionary trends is the lessening oftension on the oil market that appears to havetaken hold. Against this background, the growthrate of the Spanish economy has declined, butits real year-on-year GDP growth rate apprecia-bly exceeds that of most of its trading partners.
Specifically, the Spanish economy’s realGDP growth in 2001 Q2 was estimated at 3 %,four-tenths of a percentage point down on theprovisional figure released by INE for the firstthree months of the year. There have been nosignificant changes in the patterns that have de-termined this outcome: a gradual slowdown indomestic demand, tending to stabilise at a realrate of around 2.5 %, and a positive contributionof net external demand to GDP growth. Em-ployment growth is slowing, but remains no-table. And the expected and foreseeable de-cline in the inflation rate, the differential ofwhich with the euro area countries is fluctuatingat slightly over one percentage point, has notyet come about. It would appear that the morecontained pace of economic activity, affectingabove all the industrial sectors and capitalgoods investment decisions, will not jeopardisethe envisaged target of balanced public fi-nances at the end of the year.
Recent indicators of the US economy do notpresage a rapid recovery. Following the 25 ba-sis points cut in the federal funds target rate lastJune to 3.75 %, the markets expect fresh inter-est rate cuts in the coming months. It is expect-ed that this, combined with the scheduled fiscalmeasures (some of which back-dated), will pro-vide the necessary stimulus for a turnaround ineconomic activity. The slackness of growth hasso far been based more on investment and ex-ports than on consumption, which has remainedmore buoyant. The ongoing stagnation in Japanhas boosted the contractionary effect exertedby the US situation on other areas of the worldeconomy. Growth prospects have also been ad-versely influenced by the impact of the Argen-tinean crisis in Latin America and the vulnerabil-ity of other south-east Asian and eastern Euro-pean economies to the greater instability of fi-nancial markets.
The European economies have been affect-ed by this unfavourable environment, but torather differing degrees depending on their ini-tial exposure to developments in the crisis-rid-den markets. Real GDP growth in the euro areaas a whole during Q2 is expected to be lowerthan in Q1 (2.6 %). In the latter quarter, thesluggishness of domestic demand (where ex-
9BANCO DE ESPAÑA / ECONOMIC BULLETIN / JULY 2001
ceptional factors such as the heavy decline inthe construction industry in Germany came intoplay) was offset in part by the improved contri-bution of the net external balance, and by theslowdown in imports in particular. The latestavailable indicators show private consumption,the variable that is proving most reluctant toslow, to be somewhat more depressed.
The European Central Bank has been care-fully analysing the conditions in which the euroarea economies are moving, paying particularattention to expectations about the futurecourse of inflation and its determinants. On thebasis of this analysis, the ECB cut its official in-terest rates last May by 25 basis points, takingthe main refinancing rate to 4.5 %. The latestdata on the monetary aggregates show a rise inthe growth rate of M3, while private sector cred-it, despite slowing, is running at a relatively highgrowth rate of 8.4 %. The exchange rate of theeuro was once again prone to bouts of weak-ness, at a time in which uncertainty over devel-opments on financial markets is strengtheningthe role of the dollar as a safe-haven currency.Nonetheless, in recent weeks the euro haspicked up.
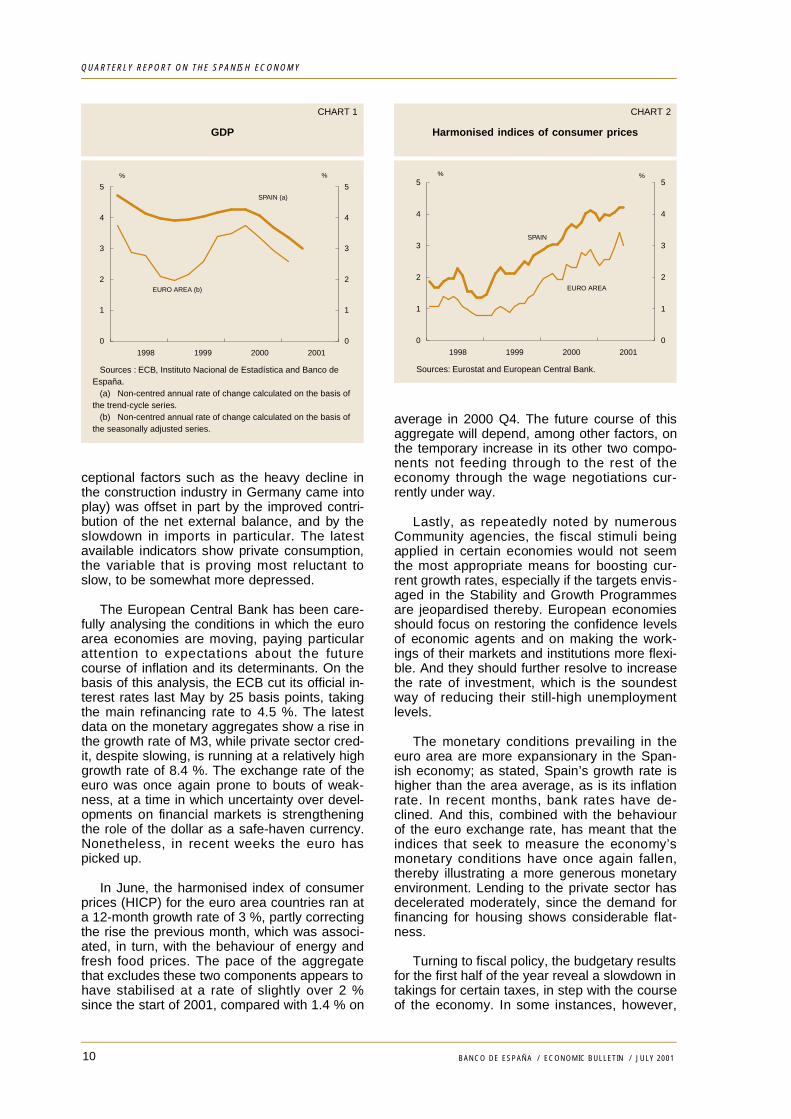
In June, the harmonised index of consumerprices (HICP) for the euro area countries ran ata 12-month growth rate of 3 %, partly correctingthe rise the previous month, which was associ-ated, in turn, with the behaviour of energy andfresh food prices. The pace of the aggregatethat excludes these two components appears tohave stabilised at a rate of slightly over 2 %since the start of 2001, compared with 1.4 % on
average in 2000 Q4. The future course of thisaggregate will depend, among other factors, onthe temporary increase in its other two compo-nents not feeding through to the rest of theeconomy through the wage negotiations cur-rently under way.
Lastly, as repeatedly noted by numerousCommunity agencies, the fiscal stimuli beingapplied in certain economies would not seemthe most appropriate means for boosting cur-rent growth rates, especially if the targets envis-aged in the Stability and Growth Programmesare jeopardised thereby. European economiesshould focus on restoring the confidence levelsof economic agents and on making the work-ings of their markets and institutions more flexi-ble. And they should further resolve to increasethe rate of investment, which is the soundestway of reducing their still-high unemploymentlevels.
The monetary conditions prevailing in theeuro area are more expansionary in the Span-ish economy; as stated, Spain’s growth rate ishigher than the area average, as is its inflationrate. In recent months, bank rates have de-clined. And this, combined with the behaviourof the euro exchange rate, has meant that theindices that seek to measure the economy’smonetary conditions have once again fallen,thereby illustrating a more generous monetaryenvironment. Lending to the private sector hasdecelerated moderately, since the demand forfinancing for housing shows considerable flat-n e s s .
Turning to fiscal policy, the budgetary resultsfor the first half of the year reveal a slowdown intakings for certain taxes, in step with the courseof the economy. In some instances, however,
10
CHART 1
GDP
CHART 2
Harmonised indices of consumer prices
Sources : ECB, Instituto Nacional de Estadística and Banco de España. (a) Non-centred annual rate of change calculated on the basis of the trend-cycle series. (b) Non-centred annual rate of change calculated on the basis of the seasonally adjusted series.
0
1
2
3
4
5
1998 1999 2000 2001
0
1
2
3
4
5% %
SPAIN (a)
EURO AREA (b)
0
1
2
3
4
5
1998 1999 2000 2001
0
1
2
3
4
5% %
SPAIN
EURO AREA
Sources: Eurostat and European Central Bank.
QUARTERLY REPORT ON THE SPANISH ECONOMY
BANCO DE ESPAÑA / ECONOMIC BULLETIN / JULY 2001
they are the outcome of specific factors whichwill be corrected in the coming months. Such isthe case of the bringing forward of personal in-come tax refunds for excess tax paid in the year2000. Expenditure is broadly running to plan,and budgetary forecasts are expected to be metat the end of the year, assisted by the mostfavourable results in the social security ac-counts.
Against the international background andwithin the framework established by macroeco-nomic policies, the Spanish economy has sus-tained a high though diminishing real growthrate during the first half of the current year ledessentially by exports and investment in theconstruction sector. The slowdown in consumerspending has moderated and, in relative terms,has held at a more sustained pace, while in-vestment in capital goods has been the compo-nent most marked by the change in expecta-tions.
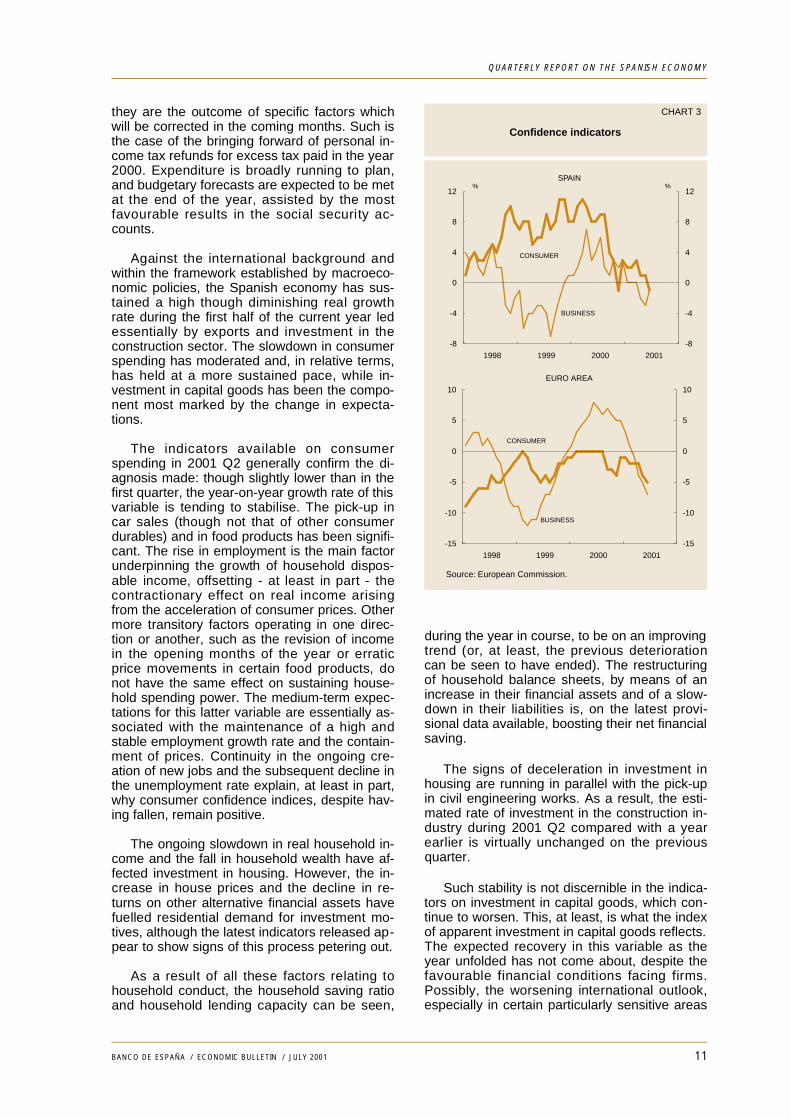
The indicators available on consumerspending in 2001 Q2 generally confirm the di-agnosis made: though slightly lower than in thefirst quarter, the year-on-year growth rate of thisvariable is tending to stabilise. The pick-up incar sales (though not that of other consumerdurables) and in food products has been signifi-cant. The rise in employment is the main factorunderpinning the growth of household dispos-able income, offsetting - at least in part - thecontractionary effect on real income arisingfrom the acceleration of consumer prices. Othermore transitory factors operating in one direc-tion or another, such as the revision of incomein the opening months of the year or erraticprice movements in certain food products, donot have the same effect on sustaining house-hold spending power. The medium-term expec-tations for this latter variable are essentially as-sociated with the maintenance of a high andstable employment growth rate and the contain-ment of prices. Continuity in the ongoing cre-ation of new jobs and the subsequent decline inthe unemployment rate explain, at least in part,why consumer confidence indices, despite hav-ing fallen, remain positive.
The ongoing slowdown in real household in-come and the fall in household wealth have af-fected investment in housing. However, the in-crease in house prices and the decline in re-turns on other alternative financial assets havefuelled residential demand for investment mo-tives, although the latest indicators released ap-pear to show signs of this process petering out.
As a result of all these factors relating tohousehold conduct, the household saving ratioand household lending capacity can be seen,
during the year in course, to be on an improvingtrend (or, at least, the previous deteriorationcan be seen to have ended). The restructuringof household balance sheets, by means of anincrease in their financial assets and of a slow-down in their liabilities is, on the latest provi-sional data available, boosting their net financialsaving.
The signs of deceleration in investment inhousing are running in parallel with the pick-upin civil engineering works. As a result, the esti-mated rate of investment in the construction in-dustry during 2001 Q2 compared with a yearearlier is virtually unchanged on the previousquarter.
Such stability is not discernible in the indica-tors on investment in capital goods, which con-tinue to worsen. This, at least, is what the indexof apparent investment in capital goods reflects.The expected recovery in this variable as theyear unfolded has not come about, despite thefavourable financial conditions facing firms.Possibly, the worsening international outlook,especially in certain particularly sensitive areas
CHART 3
Confidence indicators
-8
-4
0
4
8
12
1998 1999 2000 2001
-8
-4
0
4
8
12
SPAIN% %
CONSUMER
BUSINESS
Source: European Commission.
-15
-10
-5
0
5
10
1998 1999 2000 2001
-15
-10
-5
0
5
10EURO AREA
BUSINESS
CONSUMER
QUARTERLY REPORT ON THE SPANISH ECONOMY
BANCO DE ESPAÑA / ECONOMIC BULLETIN / JULY 2001 11
for Spanish companies, has put the start of thisprocess on hold.
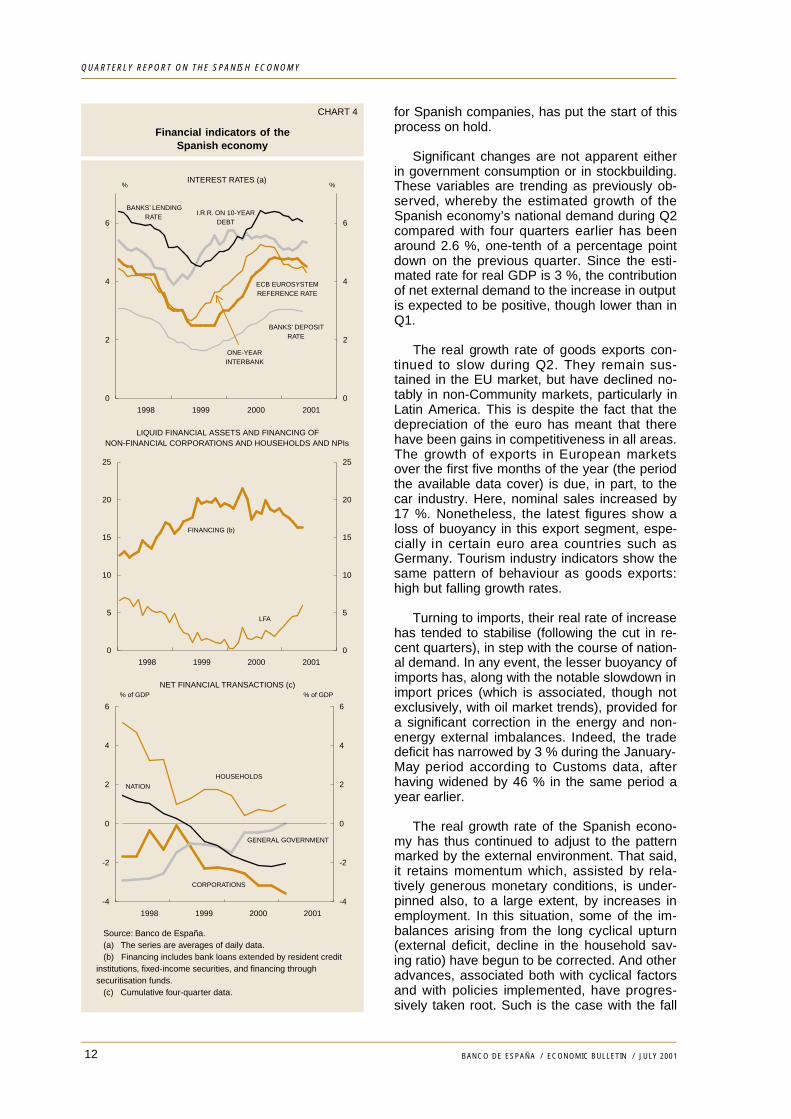
Significant changes are not apparent eitherin government consumption or in stockbuilding.These variables are trending as previously ob-served, whereby the estimated growth of theSpanish economy’s national demand during Q2compared with four quarters earlier has beenaround 2.6 %, one-tenth of a percentage pointdown on the previous quarter. Since the esti-mated rate for real GDP is 3 %, the contributionof net external demand to the increase in outputis expected to be positive, though lower than inQ1.
The real growth rate of goods exports con-tinued to slow during Q2. They remain sus-tained in the EU market, but have declined no-tably in non-Community markets, particularly inLatin America. This is despite the fact that thedepreciation of the euro has meant that therehave been gains in competitiveness in all areas.The growth of exports in European marketsover the first five months of the year (the periodthe available data cover) is due, in part, to thecar industry. Here, nominal sales increased by17 %. Nonetheless, the latest figures show aloss of buoyancy in this export segment, espe-cially in certain euro area countries such asGermany. Tourism industry indicators show thesame pattern of behaviour as goods exports:high but falling growth rates.
Turning to imports, their real rate of increasehas tended to stabilise (following the cut in re-cent quarters), in step with the course of nation-al demand. In any event, the lesser buoyancy ofimports has, along with the notable slowdown inimport prices (which is associated, though notexclusively, with oil market trends), provided fora significant correction in the energy and non-energy external imbalances. Indeed, the tradedeficit has narrowed by 3 % during the January-May period according to Customs data, afterhaving widened by 46 % in the same period ayear earlier.
The real growth rate of the Spanish econo-my has thus continued to adjust to the patternmarked by the external environment. That said,it retains momentum which, assisted by rela-tively generous monetary conditions, is under-pinned also, to a large extent, by increases inemployment. In this situation, some of the im-balances arising from the long cyclical upturn(external deficit, decline in the household sav-ing ratio) have begun to be corrected. And otheradvances, associated both with cyclical factorsand with policies implemented, have progres-sively taken root. Such is the case with the fall
12
CHART 4
Financial indicators of theSpanish economy
0
2
4
6
1998 1999 2000 2001
0
2
4
6
INTEREST RATES (a)%
ECB EUROSYSTEMREFERENCE RATE
ONE-YEAR INTERBANK
I.R.R. ON 10-YEARDEBT
BANKS’ LENDINGRATE
%
BANKS’ DEPOSITRATE
0
5
10
15
20
25
1998 1999 2000 2001
0
5
10
15
20
25
LIQUID FINANCIAL ASSETS AND FINANCING OFNON-FINANCIAL CORPORATIONS AND HOUSEHOLDS AND NPIs
FINANCING (b)
LFA
Source: Banco de España. (a) The series are averages of daily data. (b) Financing includes bank loans extended by resident credit institutions, fixed-income securities, and financing through securitisation funds. (c) Cumulative four-quarter data.
-4
-2
0
2
4
6
1998 1999 2000 2001
-4
-2
0
2
4
6
NET FINANCIAL TRANSACTIONS (c)% of GDP
NATION
% of GDP
HOUSEHOLDS
CORPORATIONS
GENERAL GOVERNMENT
QUARTERLY REPORT ON THE SPANISH ECONOMY
BANCO DE ESPAÑA / ECONOMIC BULLETIN / JULY 2001
in the unemployment rate and the headwaymade towards sound public finances.
The inflation rate, approximated by the be-haviour of the consumer price index (CPI) or bythe harmonised index of consumer prices(HICP), shows greater reluctance to slow, how-ever. This is partly because pressures on oilmarkets have persisted for longer than expect-ed and because of the rise in certain foodprices. Yet this inertia is also due to the storingup of inflationary pressures in certain productivesectors over recent years as a result of persis-tently high demand growth rates and the imper-fections of certain markets. Indeed, the lessvariable CPI components, namely services andnon-energy industrial goods, are maintaininghigh growth rates and persistent differentialswith the euro area countries. Temporary priceincreases have already begun to be strippedout (energy products are a case in point), butthis process must spread to the other CPI com-ponents so that the Spanish economy may re-sume a path of stability.
In this connection, a containment of labourcost growth dynamics and an improvement inthe efficiency of certain markets, where thegrowth of business margins is considerable,must be brought about. Wage increases duringthe current year are running high as a result ofthe combination of inflation-adjustment clauses
and wage bargaining where past - temporary -price increases are being built in. This curtailsthe dynamics of wage restraint that have char-acterised the recent upturn in the Spanisheconomy and that have been a key factor in therise in job creation capacity in recent years.
This process has proven most unevenacross the various productive branches, sincethe least competitive industries may passthrough labour cost increases to prices, retain-ing or even widening their operating margins.By contrast, the sectors most exposed to com-petition cannot do this, since the resulting loss-es in competitiveness would ultimately cancelout their growth capacity. In fact, the increase inbusiness surpluses in the economy as a whole,according to the latest available figures, areconcentrated essentially in the construction andenergy industries and in certain servicesbranches, but not in many industrial activities.
The desirability of improving the workings ofmarkets and containing the growth of labourcosts is thus based on the need to retain a pat-tern of job creation conducive to growth and in-vestment in the most dynamic and efficient in-dustries. Through gains in competitiveness, thiswill further enable the Spanish economy to con-tinue its process of real convergence, even un-der the less favourable conditions of the currentinternational environment.
13BANCO DE ESPAÑA / ECONOMIC BULLETIN / JULY 2001
QUARTERLY REPORT ON THE SPANISH ECONOMY
2. The externalenvironment of the euroarea
The latest information on the external envi-ronment of the euro area shows, for 2001 Q2, areduction in the growth of the world economy.This is concurrent with the slowdown in theUnited States, deepening economic stagnationin Japan and a sharp decline in the growth ofmany emerging economies (especially in south-east Asia and, to a lesser extent, in Latin Amer-ica). Growth forecasts for 2001 have thus beenscaled back across the board and, although un-certainty over these forecasts remains high,there appear to be more downside than upsiderisks.
Inflation moderated slightly in most coun-tries, helped by the recent stabilisation of ener-gy prices. In the United States, the Federal Re-serve made three further official interest ratecuts during Q2 (making a total of six since thestart of the year), lowering the federal fundsrate to 3.75 %. In Japan, monetary policy hasbeen made more expansionary following thechange in strategy in March towards a bank re-serves target.
The revised US National Accounts data forQ1 showed annual ised quarterly growth of0.3 % for GDP. They also evidenced a less un-favourable performance by domestic demandthan initially expected, thanks to the resilienceof private consumption (whose quarterly growthwas revised upwards by one-tenth of a point to0.8 %). Private investment (especially that inthe capital goods and new technologies sec-tors) and exports evidenced the greatest weak-ness. The Q2 indicators generally show the per-sistence of sluggish economic activity, althoughthere are differing signals. Despite the factindustrial output posted fresh falls in Q2 com-pared with a year earlier, the NAPM index im-proved slightly in relation to the previous quar-ter. Private consumption remained fairly firm,judging by the positive year-on-year figures forretail sales throughout the quarter, the reduc-tion in the personal savings ratio as a percent-age of disposable income in the period to Mayand the improvement in the consumer confi-dence indicator in May and June. However, thelabour market continued to worsen, as seen inthe quarter-on-quarter fall in non-farm employ-ment and the rise in the unemployment rate to4.5 % in June. Investment demand improvedslightly in May, although it continued to run at avery negative rate in year-on-year terms.Across the various industries, orders continuedto be cut heavily in the new technologies sec-tors, as did earnings expectations, while con-struction industry indicators exhibited a positivetrend in April and May.
Inflation, despite the increase in the overallindex, gave relatively less cause for concern if
14 BANCO DE ESPAÑA / ECONOMIC BULLETIN / JULY 2001
QUARTERLY REPORT ON THE SPANISH ECONOMY
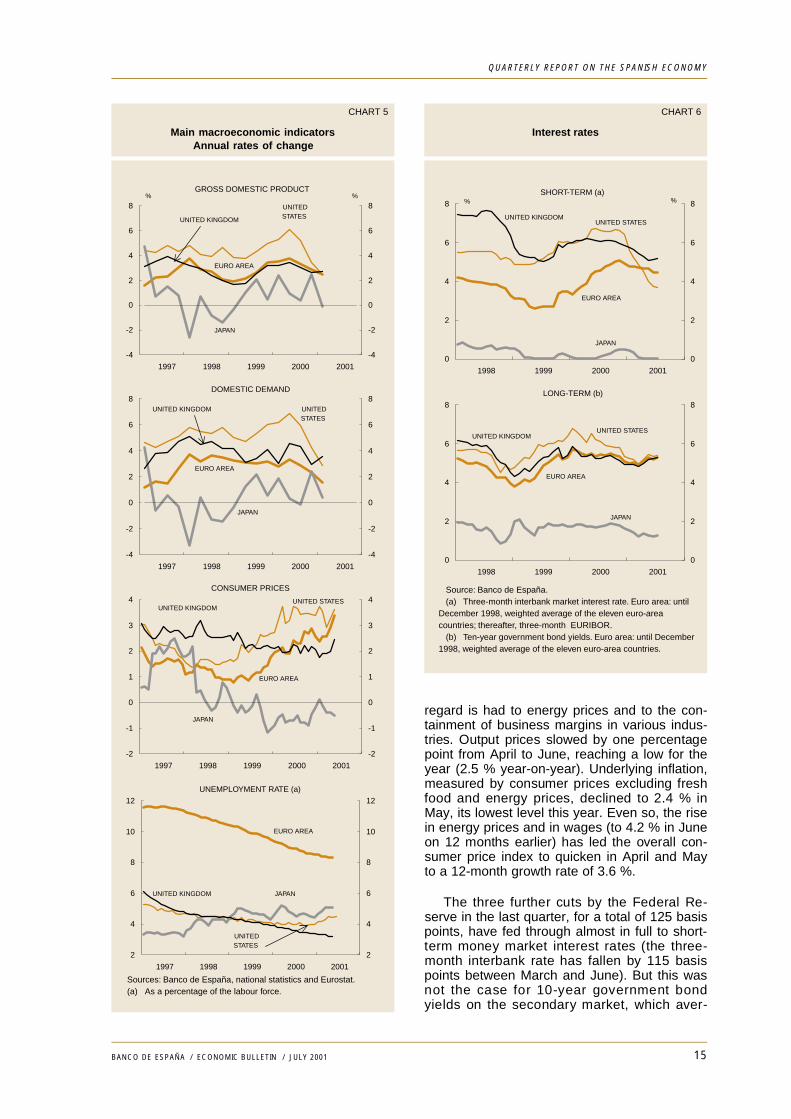
regard is had to energy prices and to the con-tainment of business margins in various indus-tries. Output prices slowed by one percentagepoint from April to June, reaching a low for theyear (2.5 % year-on-year). Underlying inflation,measured by consumer prices excluding freshfood and energy prices, declined to 2.4 % inMay, its lowest level this year. Even so, the risein energy prices and in wages (to 4.2 % in Juneon 12 months earlier) has led the overall con-sumer price index to quicken in April and Mayto a 12-month growth rate of 3.6 %.
The three further cuts by the Federal Re-serve in the last quarter, for a total of 125 basispoints, have fed through almost in full to short-term money market interest rates (the three-month interbank rate has fallen by 115 basispoints between March and June). But this wasnot the case for 10-year government bondyields on the secondary market, which aver-
15BANCO DE ESPAÑA / ECONOMIC BULLETIN / JULY 2001
QUARTERLY REPORT ON THE SPANISH ECONOMY
CHART 5
Main macroeconomic indicatorsAnnual rates of change
CHART 6
Interest rates
Sources: Banco de España, national statistics and Eurostat. (a) As a percentage of the labour force.
-2
-1
0
1
2
3
4
1997 1998 1999 2000 2001
-2
-1
0
1
2
3
4CONSUMER PRICES
EURO AREA
UNITED STATES
JAPAN
UNITED KINGDOM
2
4
6
8
10
12
1997 1998 1999 2000 2001
2
4
6
8
10
12UNEMPLOYMENT RATE (a)
EURO AREA
UNITED STATES
JAPANUNITED KINGDOM
-4
-2
0
2
4
6
8
1997 1998 1999 2000 2001
-4
-2
0
2
4
6
8UNITED KINGDOM UNITED
STATES
EURO AREA
JAPAN
DOMESTIC DEMAND
-4
-2
0
2
4
6
8
1997 1998 1999 2000 2001
-4
-2
0
2
4
6
8UNITED STATES
JAPAN
EURO AREA
UNITED KINGDOM
%%GROSS DOMESTIC PRODUCT
0
2
4
6
8
1998 1999 2000 2001
0
2
4
6
8
UNITED STATES
EURO AREA
JAPAN
UNITED KINGDOM
LONG-TERM (b)
0
2
4
6
8
1998 1999 2000 2001
0
2
4
6
8SHORT-TERM (a)
EURO AREA
UNITED STATES
JAPAN
UNITED KINGDOM
% %
Source: Banco de España. (a) Three-month interbank market interest rate. Euro area: until December 1998, weighted average of the eleven euro-area countries; thereafter, three-month EURIBOR. (b) Ten-year government bond yields. Euro area: until December 1998, weighted average of the eleven euro-area countries.
aged 5.3 % in Q2 and rose to 5.4 % in the firstfortnight of July. The equity markets respondedpositively to the cuts at first, but they havetrended more negatively recently. The DowJones index rose between March and May, butfell once more in June and held virtually stablein the first half of July. The Nasdaq index,though more volatile, followed a similar course.
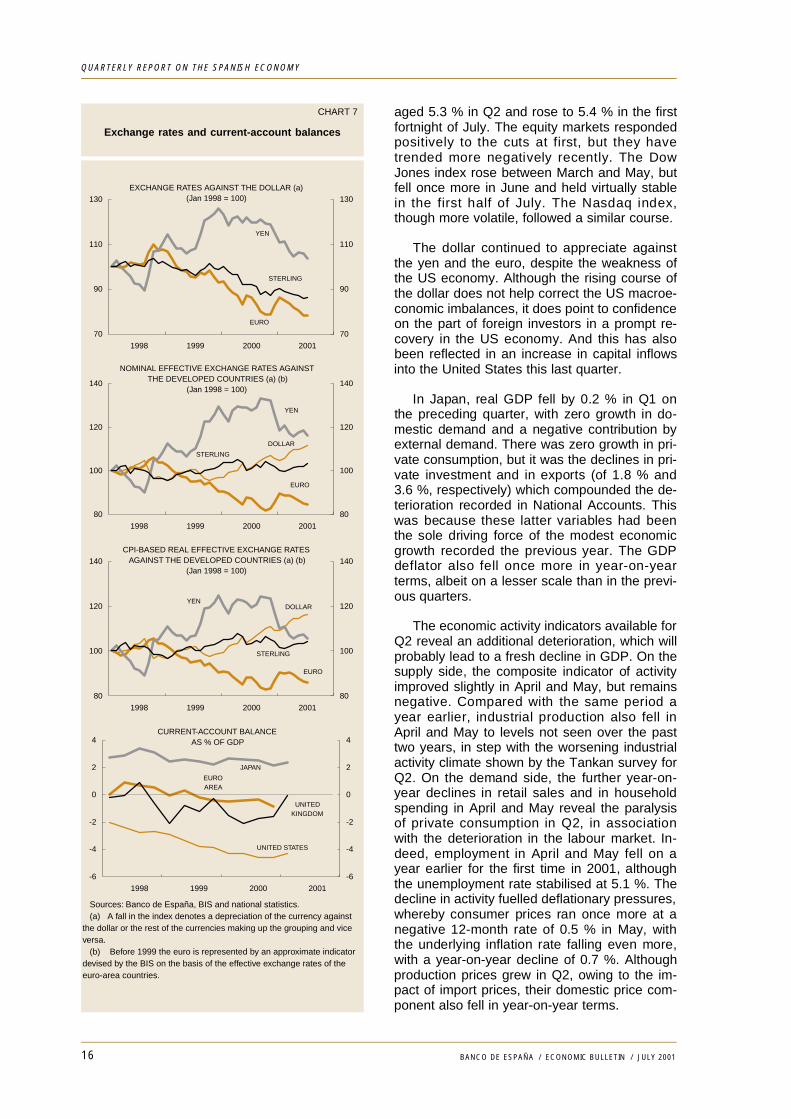
The dollar continued to appreciate againstthe yen and the euro, despite the weakness ofthe US economy. Although the rising course ofthe dollar does not help correct the US macroe-conomic imbalances, it does point to confidenceon the part of foreign investors in a prompt re-covery in the US economy. And this has alsobeen reflected in an increase in capital inflowsinto the United States this last quarter.
In Japan, real GDP fell by 0.2 % in Q1 onthe preceding quarter, with zero growth in do-mestic demand and a negative contribution byexternal demand. There was zero growth in pri-vate consumption, but it was the declines in pri-vate investment and in exports (of 1.8 % and3.6 %, respectively) which compounded the de-terioration recorded in National Accounts. Thiswas because these latter variables had beenthe sole driving force of the modest economicgrowth recorded the previous year. The GDPdeflator also fell once more in year-on-yearterms, albeit on a lesser scale than in the previ-ous quarters.
The economic activity indicators available forQ2 reveal an additional deterioration, which willprobably lead to a fresh decline in GDP. On thesupply side, the composite indicator of activityimproved slightly in April and May, but remainsnegative. Compared with the same period ayear earlier, industrial production also fell inApril and May to levels not seen over the pasttwo years, in step with the worsening industrialactivity climate shown by the Tankan survey forQ2. On the demand side, the further year-on-year declines in retail sales and in householdspending in April and May reveal the paralysisof private consumption in Q2, in associationwith the deterioration in the labour market. In-deed, employment in April and May fell on ayear earlier for the first time in 2001, althoughthe unemployment rate stabilised at 5.1 %. Thedecline in activity fuelled deflationary pressures,whereby consumer prices ran once more at anegative 12-month rate of 0.5 % in May, withthe underlying inflation rate falling even more,with a year-on-year decline of 0.7 %. Althoughproduction prices grew in Q2, owing to the im-pact of import prices, their domestic price com-ponent also fell in year-on-year terms.
16 BANCO DE ESPAÑA / ECONOMIC BULLETIN / JULY 2001
QUARTERLY REPORT ON THE SPANISH ECONOMY
CHART 7
Exchange rates and current-account balances
80
100
120
140
1998 1999 2000 2001
80
100
120
140
NOMINAL EFFECTIVE EXCHANGE RATES AGAINSTTHE DEVELOPED COUNTRIES (a) (b)
(Jan 1998 = 100)
DOLLAR
EURO
STERLING
YEN
70
90
110
130
1998 1999 2000 2001
70
90
110
130
YEN
EURO
STERLING
EXCHANGE RATES AGAINST THE DOLLAR (a)(Jan 1998 = 100)
80
100
120
140
1998 1999 2000 2001
80
100
120
140CPI-BASED REAL EFFECTIVE EXCHANGE RATES
AGAINST THE DEVELOPED COUNTRIES (a) (b)(Jan 1998 = 100)
DOLLAR
EURO
YEN
STERLING
-6
-4
-2
0
2
4
1998 1999 2000 2001
-6
-4
-2
0
2
4CURRENT-ACCOUNT BALANCE
AS % OF GDP
UNITED KINGDOM
JAPAN
UNITED STATES
EURO AREA
Sources: Banco de España, BIS and national statistics. (a) A fall in the index denotes a depreciation of the currency against the dollar or the rest of the currencies making up the grouping and vice versa. (b) Before 1999 the euro is represented by an approximate indicator devised by the BIS on the basis of the effective exchange rates of the euro-area countries.
Despite the falling trend of the yen againstthe dollar (which was interrupted only in Mayand which stepped up in the first half of July,taking the Japanese currency to an annual low),exports continued to fall due to the weakness offoreign demand. In the period to May this year,the trade and current-account surpluses werecut substantially.
Turning to monetary policy, the strategy initi-ated in March by the Bank of Japan to expandthe monetary base held short-term market inter-est rates at levels very close to zero and slightlyraised the year-on-year growth of the moneysupply (to 3.1 % in June, from 2.6 % in March).But it has not managed to extricate Japan fromdeflation, which was its implicit aim, and 10-year bond yields on the secondary market havenot picked up, having stabilised rather at 1.3 %.And nor has a bigger fall in private sector creditbeen averted (down 2.7 % in May on 12 monthsearlier). The equity market saw a rise in theNikkei index of 11 % in April, following the intro-duction of the new quantitative monetary policy.But it moved once more onto a clearly decliningtrend from May as the deterioration in the eco-nomic situation was confirmed.
In the EU countries not belonging to the euroarea, the United Kingdom saw an appreciableslowdown in economic activity during 2001 Q2,following growth of 2.7 % in Q1. Manufacturingoutput in particular declined in both April andMay on a year earlier. Since June, the slow-down in activity has spread to services, judgingby the reduction in the year-on-year growth ofretail sales and orders in this industry. The un-employment rate stabilised at 3.2 % in April andMay. In these two months inflation quickened,with the 12-month growth rate of the index mea-suring consumer prices rising to 2.4 % in May(from 1.9 % in March). This contributed to theBank of England not cutting rates, despite theeconomic slowdown. Market interest rates heldvirtually stable in the short term, while 10-yearbond yields on the secondary market rose mod-erately. The equity market has been on a fallingtrend since April.
The south-east Asian economies, exceptChina, proved particularly vulnerable to theslowdown in the growth of their external de-mand as from the beginning of the year (espe-
cially in the high technology industries, in whichmany of these countries have specialised), andthe process accelerated substantially duringQ2. Following the progressive decline in the ex-ports of most of these countries, and despitethe practically across-the-board depreciation oftheir currencies against the dollar, the pace ofactivity in the region diminished continuously.That has given rise to a marked and gener-alised downward revision of their growth fore-casts for the current year. Conversely, econom-ic growth in China during the first half of theyear (despite moderating exports) ran at almost8 % year-on-year, a similar rate to that recordedin the second half of last year. Against thisbackground, most of the countries in the regiontended to adopt looser monetary and -especial-ly- fiscal policies to counter slowing growth.
The slowdown in economic activity in LatinAmerica brought about slightly negative GDPgrowth in quarter-on-quarter terms in the areaas a whole. And judging by the data availablefor virtually all the economies in the area, thistrend appeared to accelerate in Q2. A key de-velopment is the exacerbation of the financialcrisis in Argentina following three years of re-cession. The Argentine public finances haveworsened substantially and there has beengrowing external fragility during the course ofQ2. The effects of this financial turbulence havespread discernibly to a good number of SouthAmerican economies, despite their differingoverall and financial circumstances. Brazil hasbeen most affected by the Argentine crisis, andits currency has depreciated sharply (21 %against the dollar so far this year to end-July).The response of the Brazilian authorities was toraise interest rates and step up intervention onthe foreign exchange markets. Chile, too, de-spite the prior soundness of its macroeconomicmagnitudes, is in an increasingly weak position,though it retains considerable scope for eco-nomic policy action in the short run. Finally,Mexico exhibited a marked dichotomy betweenthe current weakness of its domestic economicactivity (more affected than the above-men-tioned economies by the US slowdown) and thebuoyancy of its foreign investment inflows in re-cent months. Such inflows, unlike in most of thearea’s economies, have caused its currency toappreciate in the year to date.
17BANCO DE ESPAÑA / ECONOMIC BULLETIN / JULY 2001
QUARTERLY REPORT ON THE SPANISH ECONOMY
3. The euro area and themonetary policy of theEuropean Central Bank
The latest data on economic developmentsin the euro area point to a slight reduction in thepace of GDP in 2001 Q2, thereby prolongingthe trend observed in the preceding quarters.The slowdown in activity has essentially comeabout due to the weakness of external demandand to the adverse real effects of two concur-rent supply shocks, namely the rise in oil pricesand the crisis in the food industry. The inflation-ary situation has been affected by these shocksand by the sizeable cumulative depreciation ofthe euro. Against this background, the ECB hasmaintained a cautious stance, based on a thor-ough evaluation of the real and monetary situa-tion and, in particular, of the economy’s infla-tionary outlook. The evaluation of these factorsled it to cut official interest rates moderately inmid-May by 25 basis points to 4.5 %.
3.1. Economic developments
According to the second National Accountsestimate, euro area GDP posted quarter-on-quarter growth of 0.6 % in 2001 Q1, a similarrate to the previous quarter. Taking a slightlylonger view, the rate of expansion of economicactivity can be seen to have lost steam; afterhaving averaged growth of around 3.5 % duringthe first half of 2000 on a year earlier, the ratedropped to 2.6 % in 2001 Q1, a similar figure tothat recorded in mid-1999 (see Chart 8).
Underlying the stability of the quarterlygrowth rate of GDP is, however, a significantslowdown in final demand. This derives bothfrom the sluggishness of domestic demand andfrom exports, meaning the main driving force ofGDP growth is the notable containment of im-ports. The loss of momentum of final demandhas come about due to the erosion of real in-come caused by price increases and the slack-ness of foreign demand. And neither the contin-uing relative generosity of monetary and finan-cial conditions (which will be analysed ingreater detail in the following section) nor theexpansionary effects of the fiscal reforms ap-plied in certain countries have been able tocounter these factors. In Q1 this year privateconsumption grew by 0.4 %, one percentagepoint up on the previous quarter but less vigor-ous than in the first half of the year 2000. Gov-ernment consumption remained the most buoy-ant domestic demand component, though it wasless robust in Q1, having followed a slightlyslowing course since the second half of 2000.Gross fixed capital formation shrank notably (byalmost half a percentage point compared withthe previous quarter) due largely to the slack-ness of demand and to the favourable perfor-mance of construction investment in Germany(see Box 1). Finally, the marked 1.2 % decline
18 BANCO DE ESPAÑA / ECONOMIC BULLETIN / JULY 2001
QUARTERLY REPORT ON THE SPANISH ECONOMY
19BANCO DE ESPAÑA / ECONOMIC BULLETIN / JULY 2001
QUARTERLY REPORT ON THE SPANISH ECONOMY
BOX 1
Economic growth and investment in construction in the euro are
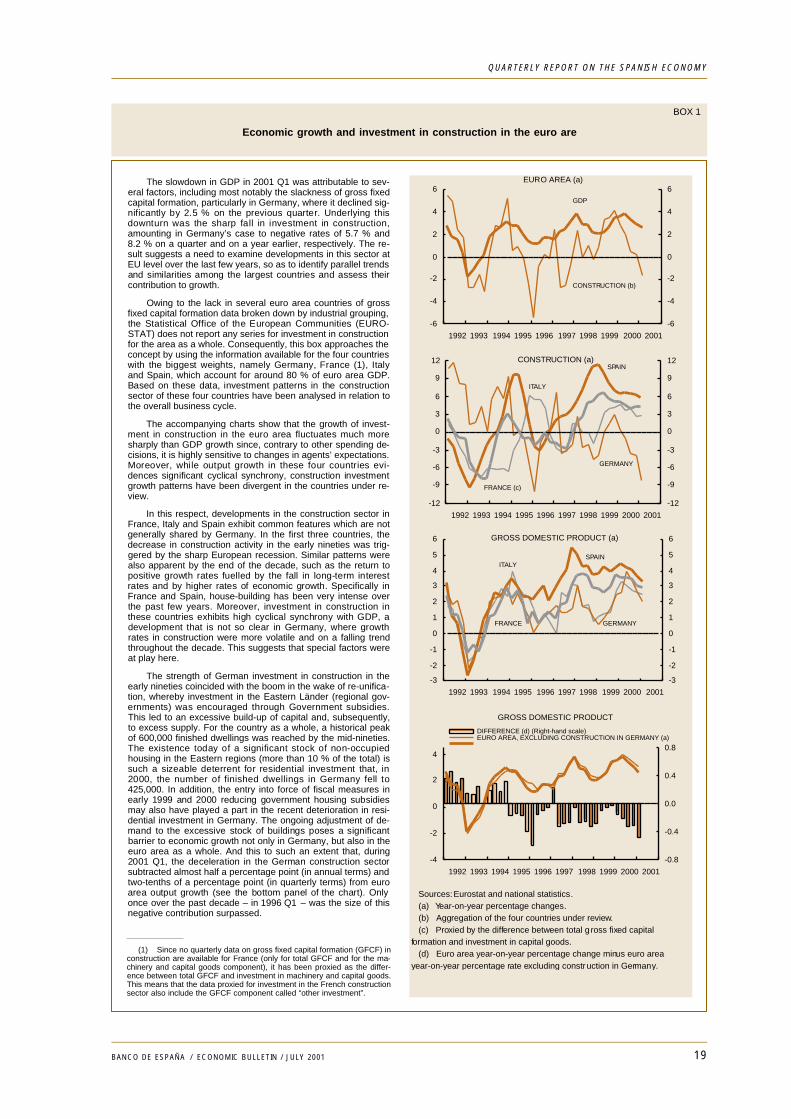
The slowdown in GDP in 2001 Q1 was attributable to sev-eral factors, including most notably the slackness of gross fixedcapital formation, particularly in Germany, where it declined sig-nificantly by 2.5 % on the previous quarter. Underlying thisdownturn was the sharp fall in investment in construction,amounting in Germany’s case to negative rates of 5.7 % and8.2 % on a quarter and on a year earlier, respectively. The re-sult suggests a need to examine developments in this sector atEU level over the last few years, so as to identify parallel trendsand similarities among the largest countries and assess theircontribution to growth.
Owing to the lack in several euro area countries of grossfixed capital formation data broken down by industrial grouping,the Statistical Office of the European Communities (EURO-STAT) does not report any series for investment in constructionfor the area as a whole. Consequently, this box approaches theconcept by using the information available for the four countrieswith the biggest weights, namely Germany, France (1), Italyand Spain, which account for around 80 % of euro area GDP.Based on these data, investment patterns in the constructionsector of these four countries have been analysed in relation tothe overall business cycle.
The accompanying charts show that the growth of invest-ment in construction in the euro area fluctuates much moresharply than GDP growth since, contrary to other spending de-cisions, it is highly sensitive to changes in agents’ expectations.Moreover, while output growth in these four countries evi-dences significant cyclical synchrony, construction investmentgrowth patterns have been divergent in the countries under re-view.
In this respect, developments in the construction sector inFrance, Italy and Spain exhibit common features which are notgenerally shared by Germany. In the first three countries, thedecrease in construction activity in the early nineties was trig-gered by the sharp European recession. Similar patterns werealso apparent by the end of the decade, such as the return topositive growth rates fuelled by the fall in long-term interestrates and by higher rates of economic growth. Specifically inFrance and Spain, house-building has been very intense overthe past few years. Moreover, investment in construction inthese countries exhibits high cyclical synchrony with GDP, adevelopment that is not so clear in Germany, where growthrates in construction were more volatile and on a falling trendthroughout the decade. This suggests that special factors wereat play here.
The strength of German investment in construction in theearly nineties coincided with the boom in the wake of re-unifica-tion, whereby investment in the Eastern Länder (regional gov-ernments) was encouraged through Government subsidies.This led to an excessive build-up of capital and, subsequently,to excess supply. For the country as a whole, a historical peakof 600,000 finished dwellings was reached by the mid-nineties.The existence today of a significant stock of non-occupiedhousing in the Eastern regions (more than 10 % of the total) issuch a sizeable deterrent for residential investment that, in2000, the number of finished dwellings in Germany fell to425,000. In addition, the entry into force of fiscal measures inearly 1999 and 2000 reducing government housing subsidiesmay also have played a part in the recent deterioration in resi-dential investment in Germany. The ongoing adjustment of de-mand to the excessive stock of buildings poses a significantbarrier to economic growth not only in Germany, but also in theeuro area as a whole. And this to such an extent that, during2001 Q1, the deceleration in the German construction sectorsubtracted almost half a percentage point (in annual terms) andtwo-tenths of a percentage point (in quarterly terms) from euroarea output growth (see the bottom panel of the chart). Onlyonce over the past decade – in 1996 Q1 – was the size of thisnegative contribution surpassed.
-6
-4
-2
0
2
4
6
1992 1993 1994 1995 1996 1997 1998 1999 2000 2001
-6
-4
-2
0
2
4
6EURO AREA (a)
CONSTRUCTION (b)
GDP
Sources: Eurostat and national statistics. (a) Year-on-year percentage changes. (b) Aggregation of the four countries under review. (c) Proxied by the difference between total g ross fixed capitalformation and investment in capital goods. (d) Euro area year-on-year percentage change minus euro areayear-on-year percentage rate excluding construction in Germany.
-12
-9
-6
-3
0
3
6
9
12
1992 1993 1994 1995 1996 1997 1998 1999 2000 2001
-12
-9
-6
-3
0
3
6
9
12
ITALY
CONSTRUCTION (a)
GERMANY
SPAIN
FRANCE (c)
-4
-2
0
2
4
1992 1993 1994 1995 1996 1997 1998 1999 2000 2001
-0.8
-0.4
0.0
0.4
0.8
DIFFERENCE (d) (Right-hand scale) EURO AREA, EXCLUDING CONSTRUCTION IN GERMANY (a)
GROSS DOMESTIC PRODUCT
-3
-2
-1
0
1
2
3
4
5
6
1992 1993 1994 1995 1996 1997 1998 1999 2000 2001
-3
-2
-1
0
1
2
3
4
5
6
ITALY
GROSS DOMESTIC PRODUCT (a)
GERMANY
SPAIN
FRANCE
(1) Since no quarterly data on gross fixed capital formation (GFCF) inconstruction are available for France (only for total GFCF and for the ma-chinery and capital goods component), it has been proxied as the differ-ence between total GFCF and investment in machinery and capital goods.This means that the data proxied for investment in the French constructionsector also include the GFCF component called “other investment”.
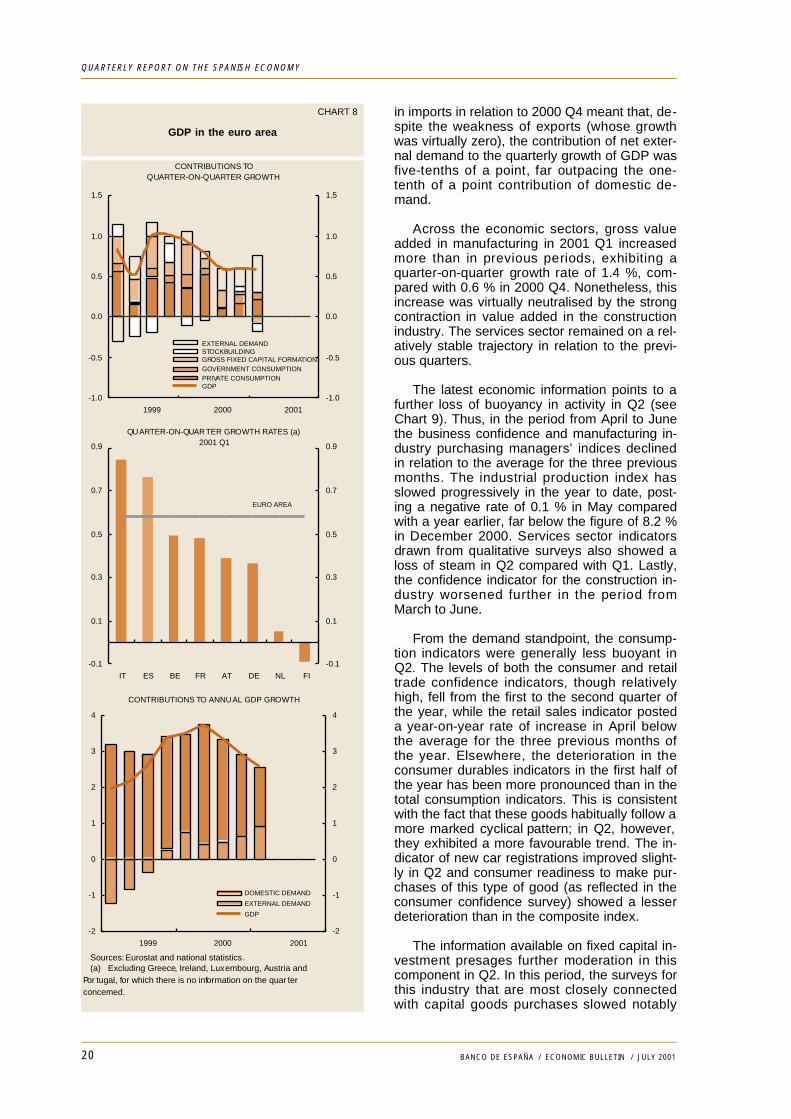
in imports in relation to 2000 Q4 meant that, de-spite the weakness of exports (whose growthwas virtually zero), the contribution of net exter-nal demand to the quarterly growth of GDP wasfive-tenths of a point, far outpacing the one-tenth of a point contribution of domestic de-mand.
Across the economic sectors, gross valueadded in manufacturing in 2001 Q1 increasedmore than in previous periods, exhibiting aquarter-on-quarter growth rate of 1.4 %, com-pared with 0.6 % in 2000 Q4. Nonetheless, thisincrease was virtually neutralised by the strongcontraction in value added in the constructionindustry. The services sector remained on a rel-atively stable trajectory in relation to the previ-ous quarters.
The latest economic information points to afurther loss of buoyancy in activity in Q2 (seeChart 9). Thus, in the period from April to Junethe business confidence and manufacturing in-dustry purchasing managers’ indices declinedin relation to the average for the three previousmonths. The industrial production index hasslowed progressively in the year to date, post-ing a negative rate of 0.1 % in May comparedwith a year earlier, far below the figure of 8.2 %in December 2000. Services sector indicatorsdrawn from qualitative surveys also showed aloss of steam in Q2 compared with Q1. Lastly,the confidence indicator for the construction in-dustry worsened further in the period fromMarch to June.
From the demand standpoint, the consump-tion indicators were generally less buoyant inQ2. The levels of both the consumer and retailtrade confidence indicators, though relativelyhigh, fell from the first to the second quarter ofthe year, while the retail sales indicator posteda year-on-year rate of increase in April belowthe average for the three previous months ofthe year. Elsewhere, the deterioration in theconsumer durables indicators in the first half ofthe year has been more pronounced than in thetotal consumption indicators. This is consistentwith the fact that these goods habitually follow amore marked cyclical pattern; in Q2, however,they exhibited a more favourable trend. The in-dicator of new car registrations improved slight-ly in Q2 and consumer readiness to make pur-chases of this type of good (as reflected in theconsumer confidence survey) showed a lesserdeterioration than in the composite index.
The information available on fixed capital in-vestment presages further moderation in thiscomponent in Q2. In this period, the surveys forthis industry that are most closely connectedwith capital goods purchases slowed notably
20 BANCO DE ESPAÑA / ECONOMIC BULLETIN / JULY 2001
QUARTERLY REPORT ON THE SPANISH ECONOMY
CHART 8
GDP in the euro area
-0.1
0.1
0.3
0.5
0.7
0.9
IT ES BE FR AT DE NL FI
-0.1
0.1
0.3
0.5
0.7
0.9
QUARTER-ON-QUARTER GROWTH RATES (a)2001 Q1
EURO AREA
Sources: Eurostat and national statistics. (a) Excluding Greece, Ireland, Luxembourg, Austria andPor tugal, for which there is no information on the quar terconcerned.
-2
-1
0
1
2
3
4
1999 2000 2001
-2
-1
0
1
2
3
4
DOMESTIC DEMAND
EXTERNAL DEMAND
GDP
CONTRIBUTIONS TO ANNUAL GDP GROWTH
-1.0
-0.5
0.0
0.5
1.0
1.5
1999 2000 2001
-1.0
-0.5
0.0
0.5
1.0
1.5
EXTERNAL DEMAND STOCKBUILDING GROSS FIXED CAPITAL FORMATION. GOVERNMENT CONSUMPTION PRIVATE CONSUMPTION GDP
CONTRIBUTIONS TOQUARTER-ON-QUARTER GROWTH
21BANCO DE ESPAÑA / ECONOMIC BULLETIN / JULY 2001
QUARTERLY REPORT ON THE SPANISH ECONOMY
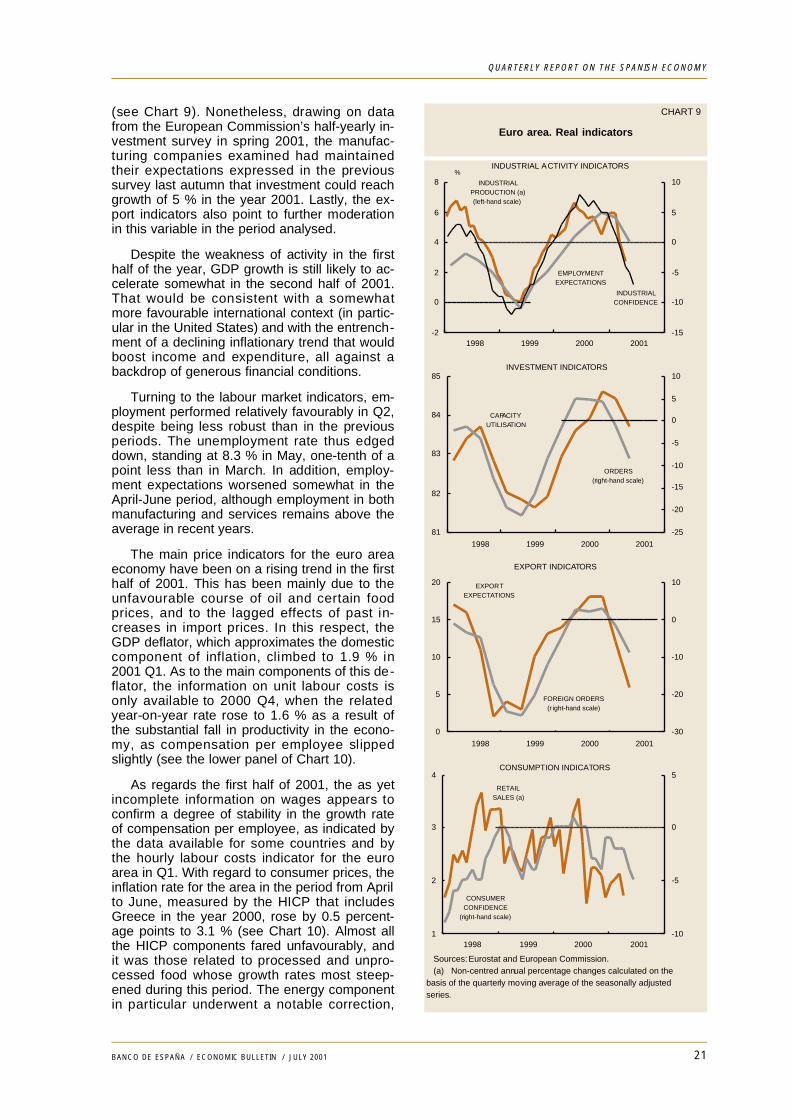
(see Chart 9). Nonetheless, drawing on datafrom the European Commission’s half-yearly in-vestment survey in spring 2001, the manufac-turing companies examined had maintainedtheir expectations expressed in the previoussurvey last autumn that investment could reachgrowth of 5 % in the year 2001. Lastly, the ex-port indicators also point to further moderationin this variable in the period analysed.
Despite the weakness of activity in the firsthalf of the year, GDP growth is still likely to ac-celerate somewhat in the second half of 2001.That would be consistent with a somewhatmore favourable international context (in partic-ular in the United States) and with the entrench-ment of a declining inflationary trend that wouldboost income and expenditure, all against abackdrop of generous financial conditions.
Turning to the labour market indicators, em-ployment performed relatively favourably in Q2,despite being less robust than in the previousperiods. The unemployment rate thus edgeddown, standing at 8.3 % in May, one-tenth of apoint less than in March. In addition, employ-ment expectations worsened somewhat in theApril-June period, although employment in bothmanufacturing and services remains above theaverage in recent years.
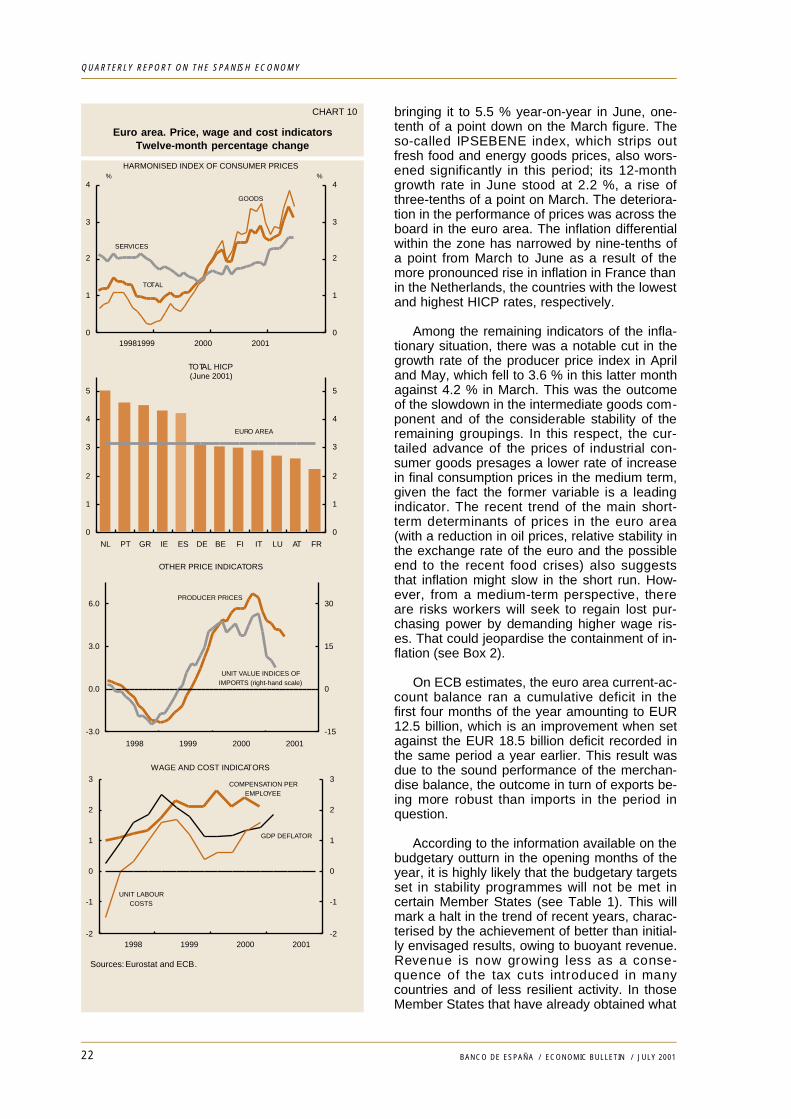
The main price indicators for the euro areaeconomy have been on a rising trend in the firsthalf of 2001. This has been mainly due to theunfavourable course of oil and certain foodprices, and to the lagged effects of past in-creases in import prices. In this respect, theGDP deflator, which approximates the domesticcomponent of inflation, climbed to 1.9 % in2001 Q1. As to the main components of this de-flator, the information on unit labour costs isonly available to 2000 Q4, when the relatedyear-on-year rate rose to 1.6 % as a result ofthe substantial fall in productivity in the econo-my, as compensation per employee slippedslightly (see the lower panel of Chart 10).
As regards the first half of 2001, the as yetincomplete information on wages appears toconfirm a degree of stability in the growth rateof compensation per employee, as indicated bythe data available for some countries and bythe hourly labour costs indicator for the euroarea in Q1. With regard to consumer prices, theinflation rate for the area in the period from Aprilto June, measured by the HICP that includesGreece in the year 2000, rose by 0.5 percent-age points to 3.1 % (see Chart 10). Almost allthe HICP components fared unfavourably, andit was those related to processed and unpro-cessed food whose growth rates most steep-ened during this period. The energy componentin particular underwent a notable correction,
CHART 9
Euro area. Real indicators
81
82
83
84
85
1998 1999 2000 2001
-25
-20
-15
-10
-5
0
5
10
CAPACITYUTILISATION
ORDERS(right-hand scale)
INVESTMENT INDICATORS
Sources: Eurostat and European Commission. (a) Non-centred annual percentage changes calculated on thebasis of the quarterly moving average of the seasonally adjustedseries.
0
5
10
15
20
1998 1999 2000 2001
-30
-20
-10
0
10
FOREIGN ORDERS(r ight-hand scale)
EXPORTEXPECTATIONS
EXPORT INDICATORS
1
2
3
4
1998 1999 2000 2001-10
-5
0
5
CONSUMERCONFIDENCE
(right-hand scale)
RETAILSALES (a)
CONSUMPTION INDICATORS
-2
0
2
4
6
8
1998 1999 2000 2001-15
-10
-5
0
5
10
INDUSTRIAL ACTIVITY INDICATORS
EMPLOYMENTEXPECTATIONS
INDUSTRIALPRODUCTION (a)(left-hand scale)
INDUSTRIALCONFIDENCE
%
22 BANCO DE ESPAÑA / ECONOMIC BULLETIN / JULY 2001
QUARTERLY REPORT ON THE SPANISH ECONOMY
bringing it to 5.5 % year-on-year in June, one-tenth of a point down on the March figure. Theso-called IPSEBENE index, which strips outfresh food and energy goods prices, also wors-ened significantly in this period; its 12-monthgrowth rate in June stood at 2.2 %, a rise ofthree-tenths of a point on March. The deteriora-tion in the performance of prices was across theboard in the euro area. The inflation differentialwithin the zone has narrowed by nine-tenths ofa point from March to June as a result of themore pronounced rise in inflation in France thanin the Netherlands, the countries with the lowestand highest HICP rates, respectively.
Among the remaining indicators of the infla-tionary situation, there was a notable cut in thegrowth rate of the producer price index in Apriland May, which fell to 3.6 % in this latter monthagainst 4.2 % in March. This was the outcomeof the slowdown in the intermediate goods com-ponent and of the considerable stability of theremaining groupings. In this respect, the cur-tailed advance of the prices of industrial con-sumer goods presages a lower rate of increasein final consumption prices in the medium term,given the fact the former variable is a leadingindicator. The recent trend of the main short-term determinants of prices in the euro area(with a reduction in oil prices, relative stability inthe exchange rate of the euro and the possibleend to the recent food crises) also suggeststhat inflation might slow in the short run. How-ever, from a medium-term perspective, thereare risks workers will seek to regain lost pur-chasing power by demanding higher wage ris-es. That could jeopardise the containment of in-flation (see Box 2).
On ECB estimates, the euro area current-ac-count balance ran a cumulative deficit in thefirst four months of the year amounting to EUR12.5 billion, which is an improvement when setagainst the EUR 18.5 billion deficit recorded inthe same period a year earlier. This result wasdue to the sound performance of the merchan-dise balance, the outcome in turn of exports be-ing more robust than imports in the period inquestion.
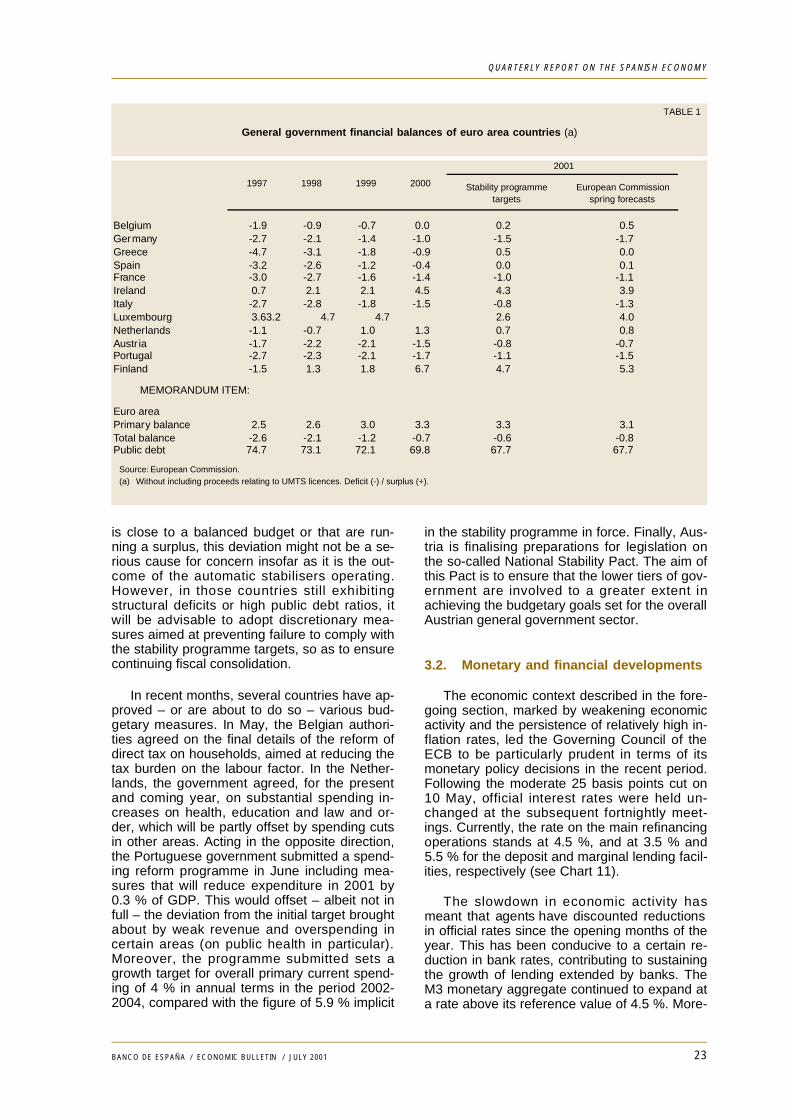
According to the information available on thebudgetary outturn in the opening months of theyear, it is highly likely that the budgetary targetsset in stability programmes will not be met incertain Member States (see Table 1). This willmark a halt in the trend of recent years, charac-terised by the achievement of better than initial-ly envisaged results, owing to buoyant revenue.Revenue is now growing less as a conse-quence of the tax cuts introduced in manycountries and of less resilient activity. In thoseMember States that have already obtained what
CHART 10
Euro area. Price, wage and cost indicatorsTwelve-month percentage change
Sources: Eurostat and ECB.
0
1
2
3
4
1998 1999 2000 20010
1
2
3
4
HARMONISED INDEX OF CONSUMER PRICES%
TOTAL
GOODS
SERVICES
%
0
1
2
3
4
5
NL PT GR IE ES DE BE FI IT LU AT FR
0
1
2
3
4
5
TOTAL HICP(June 2001)
EURO AREA
-3.0
0.0
3.0
6.0
1998 1999 2000 2001
-15
0
15
30
UNIT VALUE INDICES OFIMPORTS (right-hand scale)
OTHER PRICE INDICATORS
PRODUCER PRICES
-2
-1
0
1
2
3
1998 1999 2000 2001-2
-1
0
1
2
3
UNIT LABOURCOSTS
COMPENSATION PEREMPLOYEE
GDP DEFLATOR
WAGE AND COST INDICATORS
23BANCO DE ESPAÑA / ECONOMIC BULLETIN / JULY 2001
QUARTERLY REPORT ON THE SPANISH ECONOMY
is close to a balanced budget or that are run-ning a surplus, this deviation might not be a se-rious cause for concern insofar as it is the out-come of the automatic stabilisers operating.However, in those countries still exhibitingstructural deficits or high public debt ratios, itwill be advisable to adopt discretionary mea-sures aimed at preventing failure to comply withthe stability programme targets, so as to ensurecontinuing fiscal consolidation.
In recent months, several countries have ap-proved – or are about to do so – various bud-getary measures. In May, the Belgian authori-ties agreed on the final details of the reform ofdirect tax on households, aimed at reducing thetax burden on the labour factor. In the Nether-lands, the government agreed, for the presentand coming year, on substantial spending in-creases on health, education and law and or-der, which will be partly offset by spending cutsin other areas. Acting in the opposite direction,the Portuguese government submitted a spend-ing reform programme in June including mea-sures that will reduce expenditure in 2001 by0.3 % of GDP. This would offset – albeit not infull – the deviation from the initial target broughtabout by weak revenue and overspending incertain areas (on public health in particular).Moreover, the programme submitted sets agrowth target for overall primary current spend-ing of 4 % in annual terms in the period 2002-2004, compared with the figure of 5.9 % implicit
in the stability programme in force. Finally, Aus-tria is finalising preparations for legislation onthe so-called National Stability Pact. The aim ofthis Pact is to ensure that the lower tiers of gov-ernment are involved to a greater extent inachieving the budgetary goals set for the overallAustrian general government sector.
3.2. Monetary and financial developments
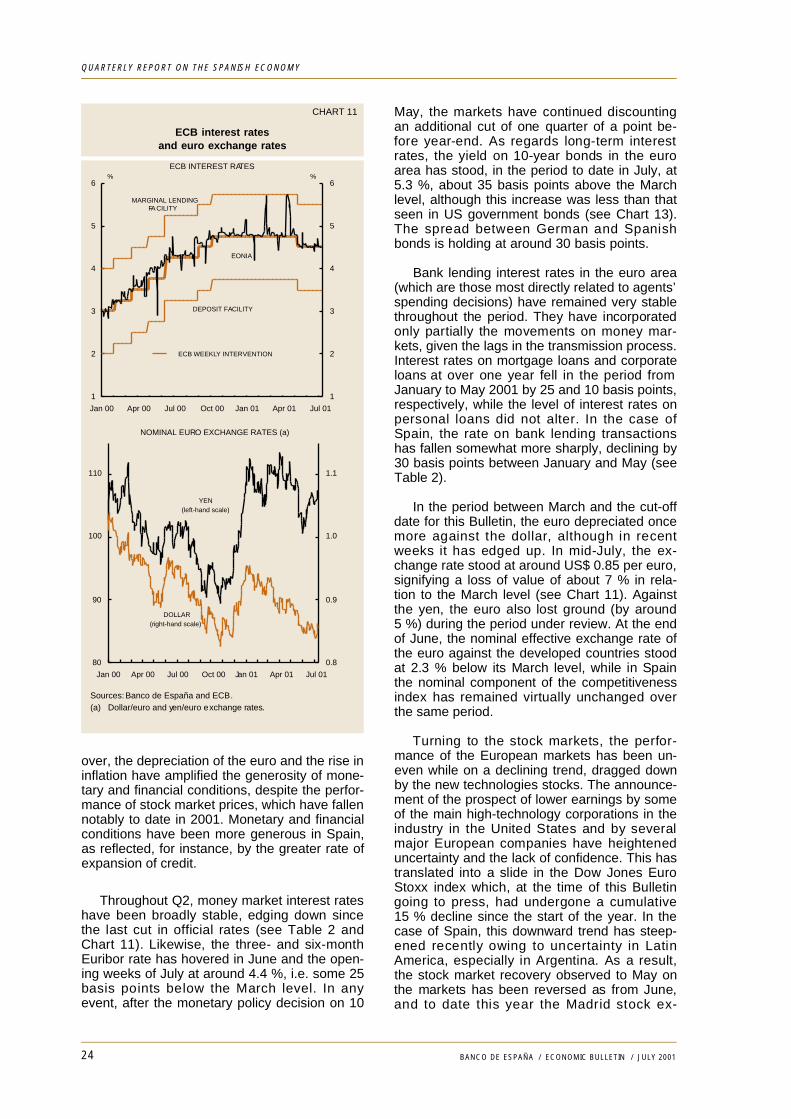
The economic context described in the fore-going section, marked by weakening economicactivity and the persistence of relatively high in-flation rates, led the Governing Council of theECB to be particularly prudent in terms of itsmonetary policy decisions in the recent period.Following the moderate 25 basis points cut on10 May, official interest rates were held un-changed at the subsequent fortnightly meet-ings. Currently, the rate on the main refinancingoperations stands at 4.5 %, and at 3.5 % and5.5 % for the deposit and marginal lending facil-ities, respectively (see Chart 11).
The slowdown in economic activity hasmeant that agents have discounted reductionsin official rates since the opening months of theyear. This has been conducive to a certain re-duction in bank rates, contributing to sustainingthe growth of lending extended by banks. TheM3 monetary aggregate continued to expand ata rate above its reference value of 4.5 %. More-
TABLE 1
General government financial balances of euro area countries (a)
Belgium -1.9 -0.9 -0.7 0.0 0.2 0.5Germany -2.7 -2.1 -1.4 -1.0 -1.5 -1.7Greece -4.7 -3.1 -1.8 -0.9 0.5 0.0Spain -3.2 -2.6 -1.2 -0.4 0.0 0.1France -3.0 -2.7 -1.6 -1.4 -1.0 -1.1Ireland 0.7 2.1 2.1 4.5 4.3 3.9Italy -2.7 -2.8 -1.8 -1.5 -0.8 -1.3Luxembourg 3.6 3.2 4.7 4.7 2.6 4.0Netherlands -1.1 -0.7 1.0 1.3 0.7 0.8Austr ia -1.7 -2.2 -2.1 -1.5 -0.8 -0.7Portugal -2.7 -2.3 -2.1 -1.7 -1.1 -1.5Finland -1.5 1.3 1.8 6.7 4.7 5.3
MEMORANDUM ITEM:
Euro areaPrimary balance 2.5 2.6 3.0 3.3 3.3 3.1Total balance -2.6 -2.1 -1.2 -0.7 -0.6 -0.8Public debt 74.7 73.1 72.1 69.8 67.7 67.7
2001
Stability programmetargets
European Commissionspring forecasts
1997 1998 1999 2000
Source: European Commission. (a) Without including proceeds relating to UMTS licences. Deficit (-) / surplus (+).
24 BANCO DE ESPAÑA / ECONOMIC BULLETIN / JULY 2001
QUARTERLY REPORT ON THE SPANISH ECONOMY
over, the depreciation of the euro and the rise ininflation have amplified the generosity of mone-tary and financial conditions, despite the perfor-mance of stock market prices, which have fallennotably to date in 2001. Monetary and financialconditions have been more generous in Spain,as reflected, for instance, by the greater rate ofexpansion of credit.
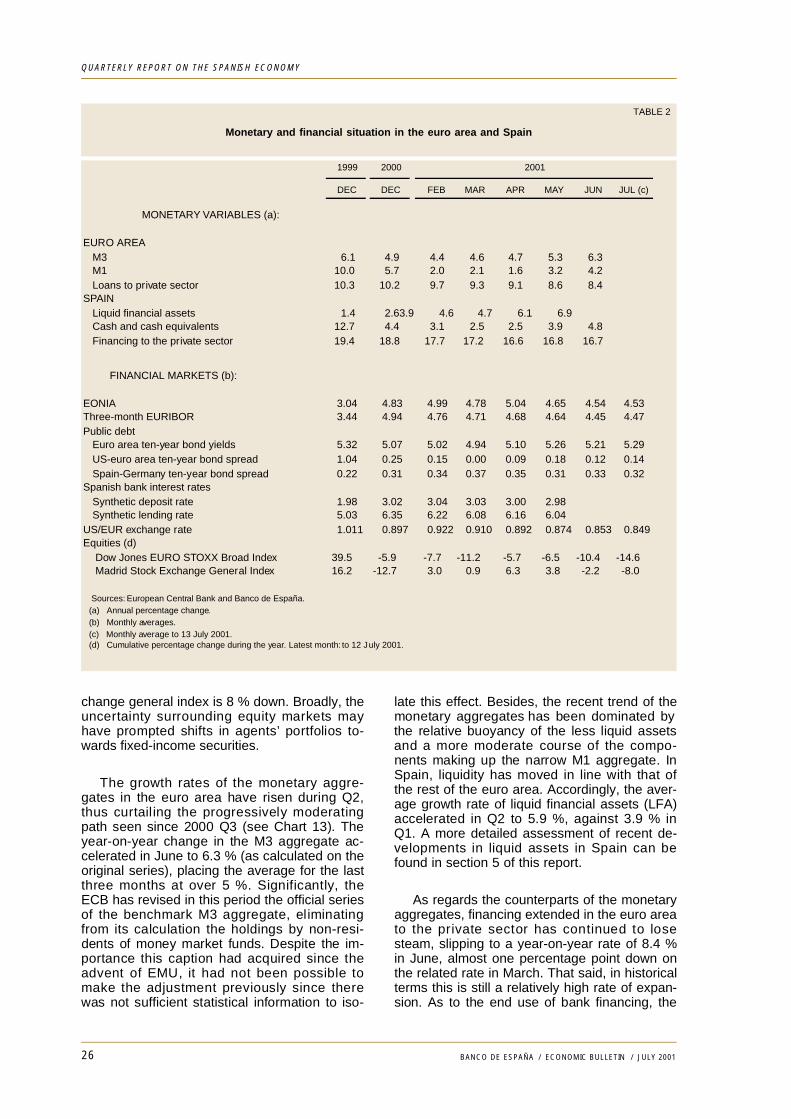
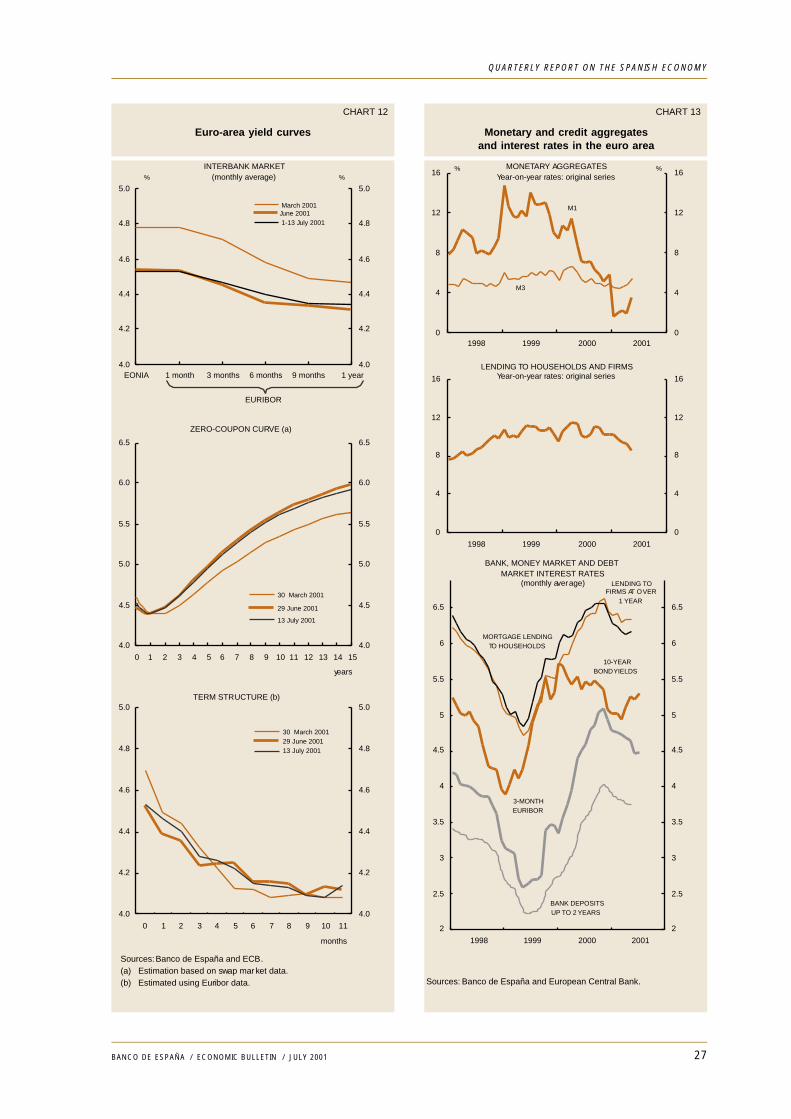
Throughout Q2, money market interest rateshave been broadly stable, edging down sincethe last cut in official rates (see Table 2 andChart 11). Likewise, the three- and six-monthEuribor rate has hovered in June and the open-ing weeks of July at around 4.4 %, i.e. some 25basis points below the March level. In anyevent, after the monetary policy decision on 10
May, the markets have continued discountingan additional cut of one quarter of a point be-fore year-end. As regards long-term interestrates, the yield on 10-year bonds in the euroarea has stood, in the period to date in July, at5.3 %, about 35 basis points above the Marchlevel, although this increase was less than thatseen in US government bonds (see Chart 13).The spread between German and Spanishbonds is holding at around 30 basis points.
Bank lending interest rates in the euro area(which are those most directly related to agents’spending decisions) have remained very stablethroughout the period. They have incorporatedonly partially the movements on money mar-kets, given the lags in the transmission process.Interest rates on mortgage loans and corporateloans at over one year fell in the period fromJanuary to May 2001 by 25 and 10 basis points,respectively, while the level of interest rates onpersonal loans did not alter. In the case ofSpain, the rate on bank lending transactionshas fallen somewhat more sharply, declining by30 basis points between January and May (seeTable 2).
In the period between March and the cut-offdate for this Bulletin, the euro depreciated oncemore against the dollar, although in recentweeks it has edged up. In mid-July, the ex-change rate stood at around US$ 0.85 per euro,signifying a loss of value of about 7 % in rela-tion to the March level (see Chart 11). Againstthe yen, the euro also lost ground (by around5 %) during the period under review. At the endof June, the nominal effective exchange rate ofthe euro against the developed countries stoodat 2.3 % below its March level, while in Spainthe nominal component of the competitivenessindex has remained virtually unchanged overthe same period.
Turning to the stock markets, the perfor-mance of the European markets has been un-even while on a declining trend, dragged downby the new technologies stocks. The announce-ment of the prospect of lower earnings by someof the main high-technology corporations in theindustry in the United States and by severalmajor European companies have heighteneduncertainty and the lack of confidence. This hastranslated into a slide in the Dow Jones EuroStoxx index which, at the time of this Bulletingoing to press, had undergone a cumulative15 % decline since the start of the year. In thecase of Spain, this downward trend has steep-ened recently owing to uncertainty in LatinAmerica, especially in Argentina. As a result,the stock market recovery observed to May onthe markets has been reversed as from June,and to date this year the Madrid stock ex-
CHART 11
ECB interest ratesand euro exchange rates
1
2
3
4
5
6
Jan 00 Apr 00 Jul 00 Oct 00 Jan 01 Apr 01 Jul 01
1
2
3
4
5
6
DEPOSIT FACILITY
MARGINAL LENDINGFACILITY
% %
ECB INTEREST RATES
EONIA
ECB WEEKLY INTERVENTION
Sources: Banco de España and ECB. (a) Dollar/euro and yen/euro exchange rates.
80
90
100
110
Jan 00 Apr 00 Jul 00 Oct 00 Jan 01 Apr 01 Jul 01
0.8
0.9
1.0
1.1
YEN(left-hand scale)
DOLLAR(right-hand scale)
NOMINAL EURO EXCHANGE RATES (a)
25BANCO DE ESPAÑA / ECONOMIC BULLETIN / JULY 2001
QUARTERLY REPORT ON THE SPANISH ECONOMY
BOX 2
Surveys and inflation expectations in the euro area
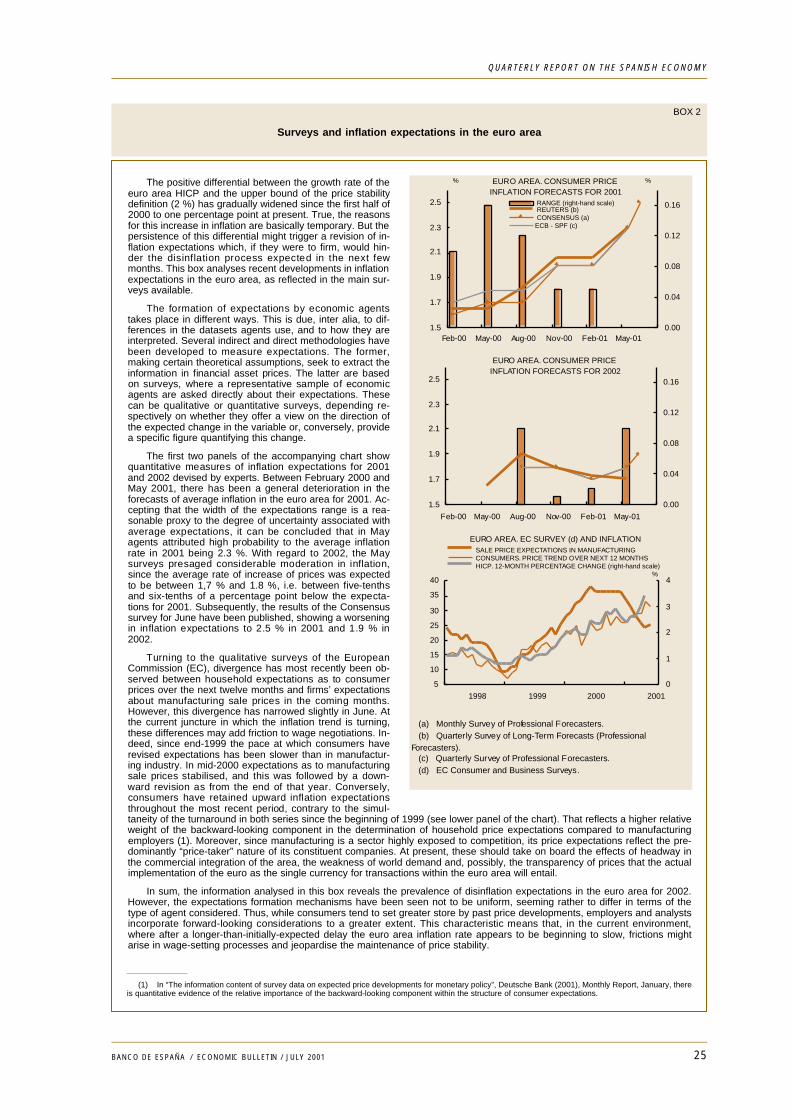
The positive differential between the growth rate of theeuro area HICP and the upper bound of the price stabilitydefinition (2 %) has gradually widened since the first half of2000 to one percentage point at present. True, the reasonsfor this increase in inflation are basically temporary. But thepersistence of this differential might trigger a revision of in-flation expectations which, if they were to firm, would hin-der the disinflation process expected in the next fewmonths. This box analyses recent developments in inflationexpectations in the euro area, as reflected in the main sur-veys available.
The formation of expectations by economic agentstakes place in different ways. This is due, inter alia, to dif-ferences in the datasets agents use, and to how they areinterpreted. Several indirect and direct methodologies havebeen developed to measure expectations. The former,making certain theoretical assumptions, seek to extract theinformation in financial asset prices. The latter are basedon surveys, where a representative sample of economicagents are asked directly about their expectations. Thesecan be qualitative or quantitative surveys, depending re-spectively on whether they offer a view on the direction ofthe expected change in the variable or, conversely, providea specific figure quantifying this change.
The first two panels of the accompanying chart showquantitative measures of inflation expectations for 2001and 2002 devised by experts. Between February 2000 andMay 2001, there has been a general deterioration in theforecasts of average inflation in the euro area for 2001. Ac-cepting that the width of the expectations range is a rea-sonable proxy to the degree of uncertainty associated withaverage expectations, it can be concluded that in Mayagents attributed high probability to the average inflationrate in 2001 being 2.3 %. With regard to 2002, the Maysurveys presaged considerable moderation in inflation,since the average rate of increase of prices was expectedto be between 1,7 % and 1.8 %, i.e. between five-tenthsand six-tenths of a percentage point below the expecta-tions for 2001. Subsequently, the results of the Consensussurvey for June have been published, showing a worseningin inflation expectations to 2.5 % in 2001 and 1.9 % in2002.
Turning to the qualitative surveys of the EuropeanCommission (EC), divergence has most recently been ob-served between household expectations as to consumerprices over the next twelve months and firms’ expectationsabout manufacturing sale prices in the coming months.However, this divergence has narrowed slightly in June. Atthe current juncture in which the inflation trend is turning,these differences may add friction to wage negotiations. In-deed, since end-1999 the pace at which consumers haverevised expectations has been slower than in manufactur-ing industry. In mid-2000 expectations as to manufacturingsale prices stabilised, and this was followed by a down-ward revision as from the end of that year. Conversely,consumers have retained upward inflation expectationsthroughout the most recent period, contrary to the simul-taneity of the turnaround in both series since the beginning of 1999 (see lower panel of the chart). That reflects a higher relativeweight of the backward-looking component in the determination of household price expectations compared to manufacturingemployers (1). Moreover, since manufacturing is a sector highly exposed to competition, its price expectations reflect the pre-dominantly “price-taker” nature of its constituent companies. At present, these should take on board the effects of headway inthe commercial integration of the area, the weakness of world demand and, possibly, the transparency of prices that the actualimplementation of the euro as the single currency for transactions within the euro area will entail.
In sum, the information analysed in this box reveals the prevalence of disinflation expectations in the euro area for 2002.However, the expectations formation mechanisms have been seen not to be uniform, seeming rather to differ in terms of thetype of agent considered. Thus, while consumers tend to set greater store by past price developments, employers and analystsincorporate forward-looking considerations to a greater extent. This characteristic means that, in the current environment,where after a longer-than-initially-expected delay the euro area inflation rate appears to be beginning to slow, frictions mightarise in wage-setting processes and jeopardise the maintenance of price stability.
1.5
1.7
1.9
2.1
2.3
2.5
Feb-00 May-00 Aug-00 Nov-00 Feb-01 May-010.00
0.04
0.08
0.12
0.16 RANGE (right-hand scale) REUTERS (b) CONSENSUS (a)ECB - SPF (c)
% %EURO AREA. CONSUMER PRICEINFLATION FORECASTS FOR 2001
(a) Monthly Survey of Professional Forecasters. (b) Quarterly Survey of Long-Term Forecasts (ProfessionalForecasters). (c) Quarterly Survey of Professional Forecasters. (d) EC Consumer and Business Surveys.
1.5
1.7
1.9
2.1
2.3
2.5
Feb-00 May-00 Aug-00 Nov-00 Feb-01 May-01
0.00
0.04
0.08
0.12
0.16
EURO AREA. CONSUMER PRICEINFLATION FORECASTS FOR 2002
5
10
15
20
25
30
35
40
1998 1999 2000 2001
0
1
2
3
4
SALE PRICE EXPECTATIONS IN MANUFACTURING CONSUMERS. PRICE TREND OVER NEXT 12 MONTHS HICP. 12-MONTH PERCENTAGE CHANGE (right-hand scale)
EURO AREA. EC SURVEY (d) AND INFLATION
%
(1) In “The information content of survey data on expected price developments for monetary policy”, Deutsche Bank (2001), Monthly Report, January, thereis quantitative evidence of the relative importance of the backward-looking component within the structure of consumer expectations.
26 BANCO DE ESPAÑA / ECONOMIC BULLETIN / JULY 2001
QUARTERLY REPORT ON THE SPANISH ECONOMY
change general index is 8 % down. Broadly, theuncertainty surrounding equity markets mayhave prompted shifts in agents’ portfolios to-wards fixed-income securities.
The growth rates of the monetary aggre-gates in the euro area have risen during Q2,thus curtailing the progressively moderatingpath seen since 2000 Q3 (see Chart 13). Theyear-on-year change in the M3 aggregate ac-celerated in June to 6.3 % (as calculated on theoriginal series), placing the average for the lastthree months at over 5 %. Significantly, theECB has revised in this period the official seriesof the benchmark M3 aggregate, eliminatingfrom its calculation the holdings by non-resi-dents of money market funds. Despite the im-portance this caption had acquired since theadvent of EMU, it had not been possible tomake the adjustment previously since therewas not sufficient statistical information to iso-
late this effect. Besides, the recent trend of themonetary aggregates has been dominated bythe relative buoyancy of the less liquid assetsand a more moderate course of the compo-nents making up the narrow M1 aggregate. InSpain, liquidity has moved in line with that ofthe rest of the euro area. Accordingly, the aver-age growth rate of liquid financial assets (LFA)accelerated in Q2 to 5.9 %, against 3.9 % inQ1. A more detailed assessment of recent de-velopments in liquid assets in Spain can befound in section 5 of this report.
As regards the counterparts of the monetaryaggregates, financing extended in the euro areato the private sector has continued to losesteam, slipping to a year-on-year rate of 8.4 %in June, almost one percentage point down onthe related rate in March. That said, in historicalterms this is still a relatively high rate of expan-sion. As to the end use of bank financing, the
TABLE 2
Monetary and financial situation in the euro area and Spain
1999 2000
DEC DEC FEB MAR APR MAY JUN JUL (c)
MONETARY VARIABLES (a):
EURO AREAM3 6.1 4.9 4.4 4.6 4.7 5.3 6.3M1 10.0 5.7 2.0 2.1 1.6 3.2 4.2Loans to private sector 10.3 10.2 9.7 9.3 9.1 8.6 8.4
SPAINLiquid financial assets 1.4 2.6 3.9 4.6 4.7 6.1 6.9Cash and cash equivalents 12.7 4.4 3.1 2.5 2.5 3.9 4.8Financing to the private sector 19.4 18.8 17.7 17.2 16.6 16.8 16.7
FINANCIAL MARKETS (b):
EONIA 3.04 4.83 4.99 4.78 5.04 4.65 4.54 4.53Three-month EURIBOR 3.44 4.94 4.76 4.71 4.68 4.64 4.45 4.47Public debt
Euro area ten-year bond yields 5.32 5.07 5.02 4.94 5.10 5.26 5.21 5.29US-euro area ten-year bond spread 1.04 0.25 0.15 0.00 0.09 0.18 0.12 0.14Spain-Germany ten-year bond spread 0.22 0.31 0.34 0.37 0.35 0.31 0.33 0.32
Spanish bank interest ratesSynthetic deposit rate 1.98 3.02 3.04 3.03 3.00 2.98Synthetic lending rate 5.03 6.35 6.22 6.08 6.16 6.04
US/EUR exchange rate 1.011 0.897 0.922 0.910 0.892 0.874 0.853 0.849Equities (d)
Dow Jones EURO STOXX Broad Index 39.5 -5.9 -7.7 -11.2 -5.7 -6.5 -10.4 -14.6 Madrid Stock Exchange General Index 16.2 -12.7 3.0 0.9 6.3 3.8 -2.2 -8.0
2001
Sources: European Central Bank and Banco de España. (a) Annual percentage change. (b) Monthly averages. (c) Monthly average to 13 July 2001. (d) Cumulative percentage change during the year. Latest month: to 12 July 2001.
27BANCO DE ESPAÑA / ECONOMIC BULLETIN / JULY 2001
QUARTERLY REPORT ON THE SPANISH ECONOMY
CHART 12
Euro-area yield curves
Sources: Banco de España and ECB. (a) Estimation based on swap market data. (b) Estimated using Euribor data.
4.0
4.5
5.0
5.5
6.0
6.5
0 1 2 3 4 5 6 7 8 9 10 11 12 13 14 15
4.0
4.5
5.0
5.5
6.0
6.5
30 March 2001
29 June 2001
13 July 2001
years
ZERO-COUPON CURVE (a)
4.0
4.2
4.4
4.6
4.8
5.0
EONIA 1 month 3 months 6 months 9 months 1 year4.0
4.2
4.4
4.6
4.8
5.0
March 2001June 2001 1-13 July 2001
INTERBANK MARKET(monthly average)
EURIBOR
% %
4.0
4.2
4.4
4.6
4.8
5.0
0 1 2 3 4 5 6 7 8 9 10 11
4.0
4.2
4.4
4.6
4.8
5.0
30 March 2001 29 June 2001 13 July 2001
TERM STRUCTURE (b)
months
CHART 13
Monetary and credit aggregatesand interest rates in the euro area
0
4
8
12
16
1998 1999 2000 20010
4
8
12
16
M1
MONETARY AGGREGATESYear-on-year rates: original series
M3
% %
Sources: Banco de España and European Central Bank.
0
4
8
12
16
1998 1999 2000 2001
0
4
8
12
16
LENDING TO HOUSEHOLDS AND FIRMSYear-on-year rates: original series
2
2.5
3
3.5
4
4.5
5
5.5
6
6.5
1998 1999 2000 2001
2
2.5
3
3.5
4
4.5
5
5.5
6
6.5
BANK, MONEY MARKET AND DEBTMARKET INTEREST RATES
(monthly average)
3-MONTHEURIBOR
MORTGAGE LENDINGTO HOUSEHOLDS
LENDING TOFIRMS AT OVER
1 YEAR
BANK DEPOSITSUP TO 2 YEARS
10-YEARBOND YIELDS
28 BANCO DE ESPAÑA / ECONOMIC BULLETIN / JULY 2001
QUARTERLY REPORT ON THE SPANISH ECONOMY
information available for Q1 indicates that it ishouseholds which have most contributed totempering lending, the consumer segment ofwhich has proven intense. In any event, itshould be recalled that there are sources of fi-nancing other than bank lending, such as cor-porate financing via fixed-income issues, whichis progressively acquiring considerable impor-
tance. In the case of Spain, the growth of fi-nancing to non-financial corporations andhouseholds and non-profit institutions is beingcontained to some degree, although the associ-ated rates of expansion are still high at 16 %year-on-year. Section 5 offers a more exhaus-tive evaluation of the financing of these eco-nomic sectors.
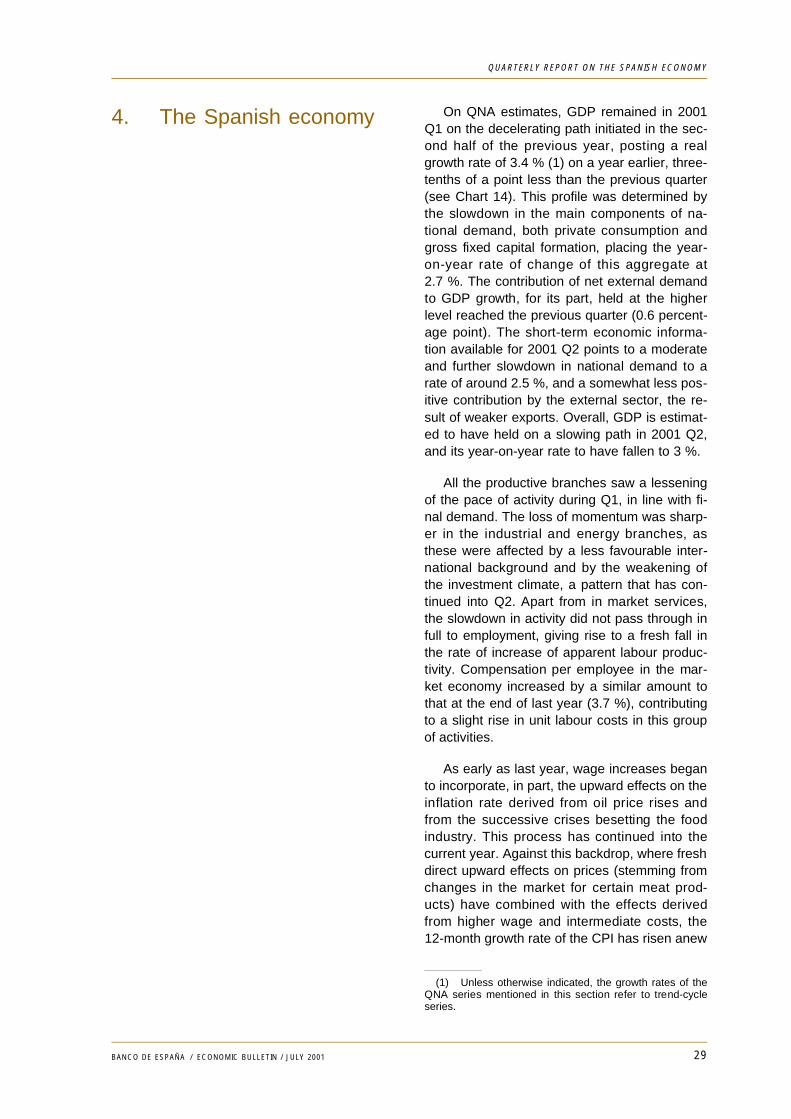
4. The Spanish economy On QNA estimates, GDP remained in 2001Q1 on the decelerating path initiated in the sec-ond half of the previous year, posting a realgrowth rate of 3.4 % (1) on a year earlier, three-tenths of a point less than the previous quarter(see Chart 14). This profile was determined bythe slowdown in the main components of na-tional demand, both private consumption andgross fixed capital formation, placing the year-on-year rate of change of this aggregate at2.7 %. The contribution of net external demandto GDP growth, for its part, held at the higherlevel reached the previous quarter (0.6 percent-age point). The short-term economic informa-tion available for 2001 Q2 points to a moderateand further slowdown in national demand to arate of around 2.5 %, and a somewhat less pos-itive contribution by the external sector, the re-sult of weaker exports. Overall, GDP is estimat-ed to have held on a slowing path in 2001 Q2,and its year-on-year rate to have fallen to 3 %.
All the productive branches saw a lesseningof the pace of activity during Q1, in line with fi-nal demand. The loss of momentum was sharp-er in the industrial and energy branches, asthese were affected by a less favourable inter-national background and by the weakening ofthe investment climate, a pattern that has con-tinued into Q2. Apart from in market services,the slowdown in activity did not pass through infull to employment, giving rise to a fresh fall inthe rate of increase of apparent labour produc-tivity. Compensation per employee in the mar-ket economy increased by a similar amount tothat at the end of last year (3.7 %), contributingto a slight rise in unit labour costs in this groupof activities.
As early as last year, wage increases beganto incorporate, in part, the upward effects on theinflation rate derived from oil price rises andfrom the successive crises besetting the foodindustry. This process has continued into thecurrent year. Against this backdrop, where freshdirect upward effects on prices (stemming fromchanges in the market for certain meat prod-ucts) have combined with the effects derivedfrom higher wage and intermediate costs, the12-month growth rate of the CPI has risen anew
29BANCO DE ESPAÑA / ECONOMIC BULLETIN / JULY 2001
QUARTERLY REPORT ON THE SPANISH ECONOMY
(1) Unless otherwise indicated, the growth rates of theQNA series mentioned in this section refer to trend-cycleseries.
to levels not seen since the mid-nineties. How-ever, given that some of these factors havebeen common to other Member States, the in-flation spread with the euro area has remainedat around one percentage point.
4.1. Demand
According to the latest QNA figures, house-hold final consumption slowed by five-tenths ofa point in 2001 Q1 to a rate of 2.3 % in realterms, thus contributing significantly to the less-er buoyancy of national demand in this period.This loss of momentum affected more intenselyspending on services and on durable goodsother than cars.
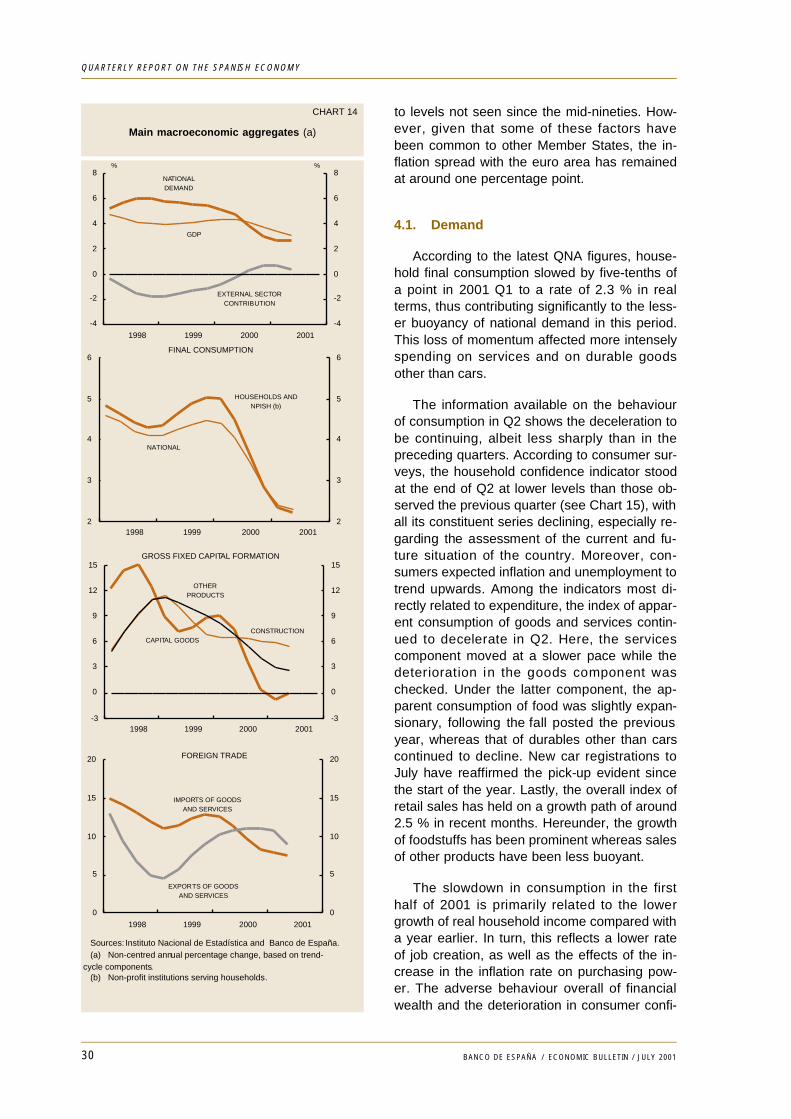
The information available on the behaviourof consumption in Q2 shows the deceleration tobe continuing, albeit less sharply than in thepreceding quarters. According to consumer sur-veys, the household confidence indicator stoodat the end of Q2 at lower levels than those ob-served the previous quarter (see Chart 15), withall its constituent series declining, especially re-garding the assessment of the current and fu-ture situation of the country. Moreover, con-sumers expected inflation and unemployment totrend upwards. Among the indicators most di-rectly related to expenditure, the index of appar-ent consumption of goods and services contin-ued to decelerate in Q2. Here, the servicescomponent moved at a slower pace while thedeterioration in the goods component waschecked. Under the latter component, the ap-parent consumption of food was slightly expan-sionary, following the fall posted the previousyear, whereas that of durables other than carscontinued to decline. New car registrations toJuly have reaffirmed the pick-up evident sincethe start of the year. Lastly, the overall index ofretail sales has held on a growth path of around2.5 % in recent months. Hereunder, the growthof foodstuffs has been prominent whereas salesof other products have been less buoyant.
The slowdown in consumption in the firsthalf of 2001 is primarily related to the lowergrowth of real household income compared witha year earlier. In turn, this reflects a lower rateof job creation, as well as the effects of the in-crease in the inflation rate on purchasing pow-er. The adverse behaviour overall of financialwealth and the deterioration in consumer confi-
30 BANCO DE ESPAÑA / ECONOMIC BULLETIN / JULY 2001
QUARTERLY REPORT ON THE SPANISH ECONOMY
CHART 14
Main macroeconomic aggregates (a)
-4
-2
0
2
4
6
8
1998 1999 2000 2001
-4
-2
0
2
4
6
8NATIONALDEMAND
%
EXTERNAL SECTORCONTRIBUTION
GDP
%
2
3
4
5
6
1998 1999 2000 20012
3
4
5
6
HOUSEHOLDS ANDNPISH (b)
FINAL CONSUMPTION
NATIONAL
-3
0
3
6
9
12
15
1998 1999 2000 2001-3
0
3
6
9
12
15
CONSTRUCTION
GROSS FIXED CAPITAL FORMATION
CAPITAL GOODS
OTHERPRODUCTS
0
5
10
15
20
1998 1999 2000 2001
0
5
10
15
20
EXPORTS OF GOODSAND SERVICES
FOREIGN TRADE
IMPORTS OF GOODSAND SERVICES
Sources: Instituto Nacional de Estadística and Banco de España. (a) Non-centred annual percentage change, based on trend-cycle components. (b) Non-profit institutions serving households.
dence (interrelated factors which drove thestrong expansion in consumption in the past)also help explain the lesser robustness ofspending. This latter variable would be growingat similar rates to real income, marking a turn-ing point in the squeeze on the saving ratio,which reached a low in the year 2000.
In 2001 Q1, general government final con-sumption spending grew by 2.6 % in real termscompared with a year earlier, one-tenth of apoint less than in the previous quarter. Theslowdown was more marked in nominal termsowing to the reduction in the growth rate ofcompensation per employee in this sector,which passed through to the deflator. The infor-mation available for Q2 points to the growth ofgeneral government final consumption spend-ing stabilising in step with employment develop-ments in this sector.
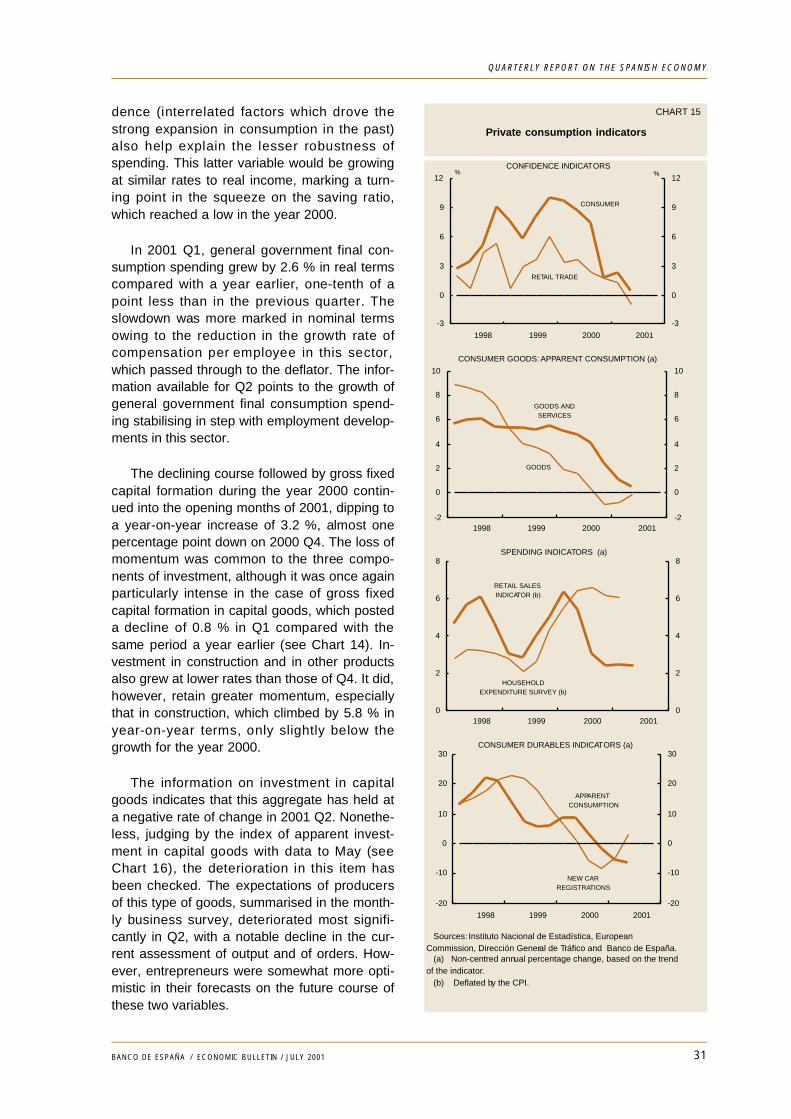
The declining course followed by gross fixedcapital formation during the year 2000 contin-ued into the opening months of 2001, dipping toa year-on-year increase of 3.2 %, almost onepercentage point down on 2000 Q4. The loss ofmomentum was common to the three compo-nents of investment, although it was once againparticularly intense in the case of gross fixedcapital formation in capital goods, which posteda decline of 0.8 % in Q1 compared with thesame period a year earlier (see Chart 14). In-vestment in construction and in other productsalso grew at lower rates than those of Q4. It did,however, retain greater momentum, especiallythat in construction, which climbed by 5.8 % inyear-on-year terms, only slightly below thegrowth for the year 2000.
The information on investment in capitalgoods indicates that this aggregate has held ata negative rate of change in 2001 Q2. Nonethe-less, judging by the index of apparent invest-ment in capital goods with data to May (seeChart 16), the deterioration in this item hasbeen checked. The expectations of producersof this type of goods, summarised in the month-ly business survey, deteriorated most signifi-cantly in Q2, with a notable decline in the cur-rent assessment of output and of orders. How-ever, entrepreneurs were somewhat more opti-mistic in their forecasts on the future course ofthese two variables.
31BANCO DE ESPAÑA / ECONOMIC BULLETIN / JULY 2001
QUARTERLY REPORT ON THE SPANISH ECONOMY
CHART 15
Private consumption indicators
-3
0
3
6
9
12
1998 1999 2000 2001
-3
0
3
6
9
12
CONFIDENCE INDICATORS
CONSUMER
RETAIL TRADE
%%
-2
0
2
4
6
8
10
1998 1999 2000 2001-2
0
2
4
6
8
10
CONSUMER GOODS: APPARENT CONSUMPTION (a)
GOODS ANDSERVICES
GOODS
0
2
4
6
8
1998 1999 2000 20010
2
4
6
8
HOUSEHOLDEXPENDITURE SURVEY (b)
SPENDING INDICATORS (a)
RETAIL SALESINDICATOR (b)
-20
-10
0
10
20
30
1998 1999 2000 2001
-20
-10
0
10
20
30
NEW CARREGISTRATIONS
CONSUMER DURABLES INDICATORS (a)
APPARENTCONSUMPTION
Sources: Instituto Nacional de Estadística, EuropeanCommission, Dirección General de Tráfico and Banco de España. (a) Non-centred annual percentage change, based on the trendof the indicator. (b) Deflated by the CPI.
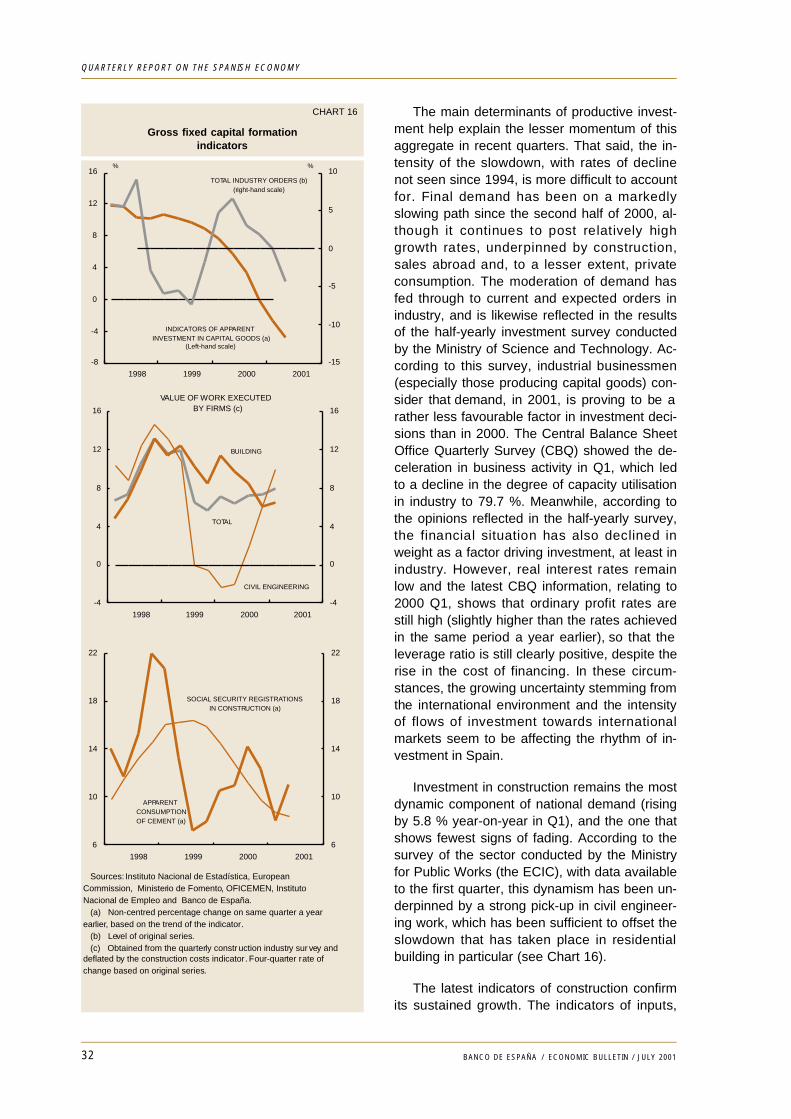
The main determinants of productive invest-ment help explain the lesser momentum of thisaggregate in recent quarters. That said, the in-tensity of the slowdown, with rates of declinenot seen since 1994, is more difficult to accountfor. Final demand has been on a markedlyslowing path since the second half of 2000, al-though it continues to post relatively highgrowth rates, underpinned by construction,sales abroad and, to a lesser extent, privateconsumption. The moderation of demand hasfed through to current and expected orders inindustry, and is likewise reflected in the resultsof the half-yearly investment survey conductedby the Ministry of Science and Technology. Ac-cording to this survey, industrial businessmen(especially those producing capital goods) con-sider that demand, in 2001, is proving to be arather less favourable factor in investment deci-sions than in 2000. The Central Balance SheetOffice Quarterly Survey (CBQ) showed the de-celeration in business activity in Q1, which ledto a decline in the degree of capacity utilisationin industry to 79.7 %. Meanwhile, according tothe opinions reflected in the half-yearly survey,the financial situation has also declined inweight as a factor driving investment, at least inindustry. However, real interest rates remainlow and the latest CBQ information, relating to2000 Q1, shows that ordinary profit rates arestill high (slightly higher than the rates achievedin the same period a year earlier), so that theleverage ratio is still clearly positive, despite therise in the cost of financing. In these circum-stances, the growing uncertainty stemming fromthe international environment and the intensityof flows of investment towards internationalmarkets seem to be affecting the rhythm of in-vestment in Spain.
Investment in construction remains the mostdynamic component of national demand (risingby 5.8 % year-on-year in Q1), and the one thatshows fewest signs of fading. According to thesurvey of the sector conducted by the Ministryfor Public Works (the ECIC), with data availableto the first quarter, this dynamism has been un-derpinned by a strong pick-up in civil engineer-ing work, which has been sufficient to offset theslowdown that has taken place in residentialbuilding in particular (see Chart 16).
The latest indicators of construction confirmits sustained growth. The indicators of inputs,
32 BANCO DE ESPAÑA / ECONOMIC BULLETIN / JULY 2001
QUARTERLY REPORT ON THE SPANISH ECONOMY
CHART 16
Gross fixed capital formationindicators
-8
-4
0
4
8
12
16
1998 1999 2000 2001
-15
-10
-5
0
5
10
INDICATORS OF APPARENTINVESTMENT IN CAPITAL GOODS (a)
(Left-hand scale)
TOTAL INDUSTRY ORDERS (b)(right-hand scale)
%%
-4
0
4
8
12
16
1998 1999 2000 2001
-4
0
4
8
12
16
TOTAL
CIVIL ENGINEERING
VALUE OF WORK EXECUTED BY FIRMS (c)
BUILDING
6
10
14
18
22
1998 1999 2000 2001
6
10
14
18
22
APPARENTCONSUMPTIONOF CEMENT (a)
SOCIAL SECURITY REGISTRATIONSIN CONSTRUCTION (a)
Sources: Instituto Nacional de Estadística, EuropeanCommission, Ministerio de Fomento, OFICEMEN, InstitutoNacional de Empleo and Banco de España. (a) Non-centred percentage change on same quarter a yearearlier, based on the trend of the indicator. (b) Level of original series. (c) Obtained from the quarterly constr uction industry sur vey anddeflated by the construction costs indicator. Four-quarter rate ofchange based on original series.
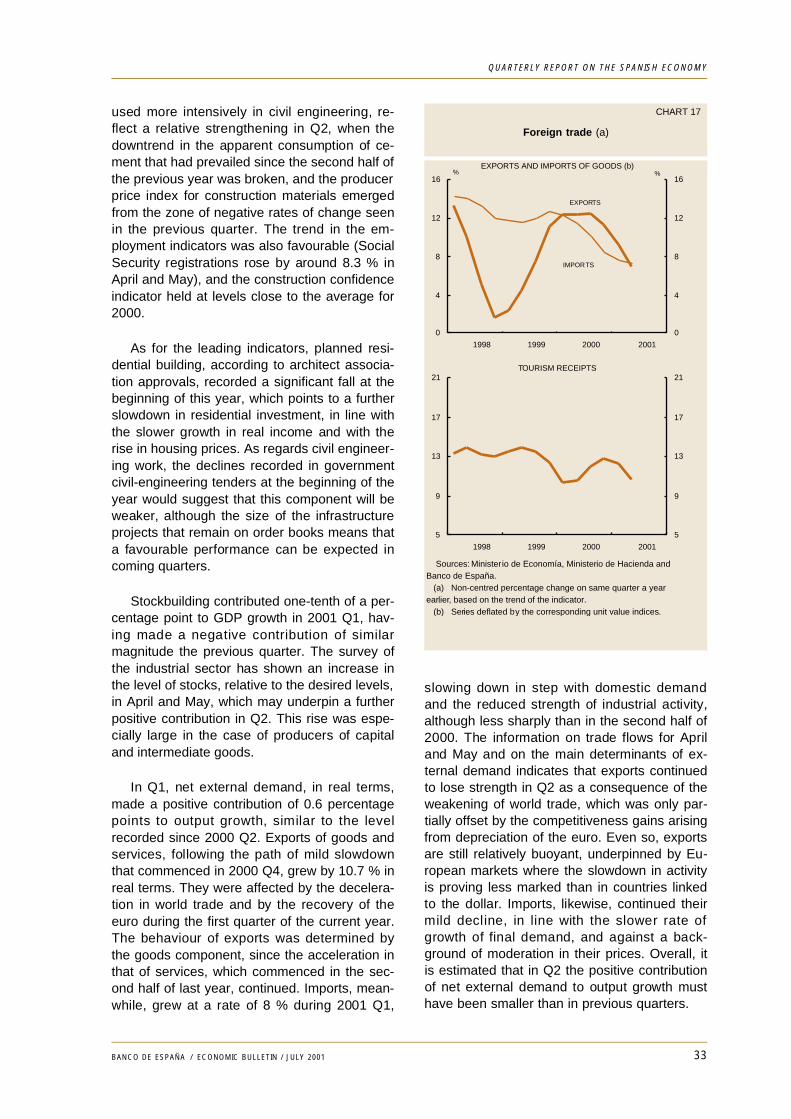
used more intensively in civil engineering, re-flect a relative strengthening in Q2, when thedowntrend in the apparent consumption of ce-ment that had prevailed since the second half ofthe previous year was broken, and the producerprice index for construction materials emergedfrom the zone of negative rates of change seenin the previous quarter. The trend in the em-ployment indicators was also favourable (SocialSecurity registrations rose by around 8.3 % inApril and May), and the construction confidenceindicator held at levels close to the average for2000.
As for the leading indicators, planned resi-dential building, according to architect associa-tion approvals, recorded a significant fall at thebeginning of this year, which points to a furtherslowdown in residential investment, in line withthe slower growth in real income and with therise in housing prices. As regards civil engineer-ing work, the declines recorded in governmentcivil-engineering tenders at the beginning of theyear would suggest that this component will beweaker, although the size of the infrastructureprojects that remain on order books means thata favourable performance can be expected incoming quarters.
Stockbuilding contributed one-tenth of a per-centage point to GDP growth in 2001 Q1, hav-ing made a negative contribution of similarmagnitude the previous quarter. The survey ofthe industrial sector has shown an increase inthe level of stocks, relative to the desired levels,in April and May, which may underpin a furtherpositive contribution in Q2. This rise was espe-cially large in the case of producers of capitaland intermediate goods.
In Q1, net external demand, in real terms,made a positive contribution of 0.6 percentagepoints to output growth, similar to the levelrecorded since 2000 Q2. Exports of goods andservices, following the path of mild slowdownthat commenced in 2000 Q4, grew by 10.7 % inreal terms. They were affected by the decelera-tion in world trade and by the recovery of theeuro during the first quarter of the current year.The behaviour of exports was determined bythe goods component, since the acceleration inthat of services, which commenced in the sec-ond half of last year, continued. Imports, mean-while, grew at a rate of 8 % during 2001 Q1,
slowing down in step with domestic demandand the reduced strength of industrial activity,although less sharply than in the second half of2000. The information on trade flows for Apriland May and on the main determinants of ex-ternal demand indicates that exports continuedto lose strength in Q2 as a consequence of theweakening of world trade, which was only par-tially offset by the competitiveness gains arisingfrom depreciation of the euro. Even so, exportsare still relatively buoyant, underpinned by Eu-ropean markets where the slowdown in activityis proving less marked than in countries linkedto the dollar. Imports, likewise, continued theirmild decline, in line with the slower rate ofgrowth of final demand, and against a back-ground of moderation in their prices. Overall, itis estimated that in Q2 the positive contributionof net external demand to output growth musthave been smaller than in previous quarters.
33BANCO DE ESPAÑA / ECONOMIC BULLETIN / JULY 2001
QUARTERLY REPORT ON THE SPANISH ECONOMY
CHART 17
Foreign trade (a)
0
4
8
12
16
1998 1999 2000 2001
0
4
8
12
16
EXPORTS AND IMPORTS OF GOODS (b)% %
EXPORTS
IMPORTS
5
9
13
17
21
1998 1999 2000 2001
5
9
13
17
21TOURISM RECEIPTS
Sources: Ministerio de Economía, Ministerio de Hacienda andBanco de España. (a) Non-centred percentage change on same quarter a yearearlier, based on the trend of the indicator. (b) Series deflated by the corresponding unit value indices.
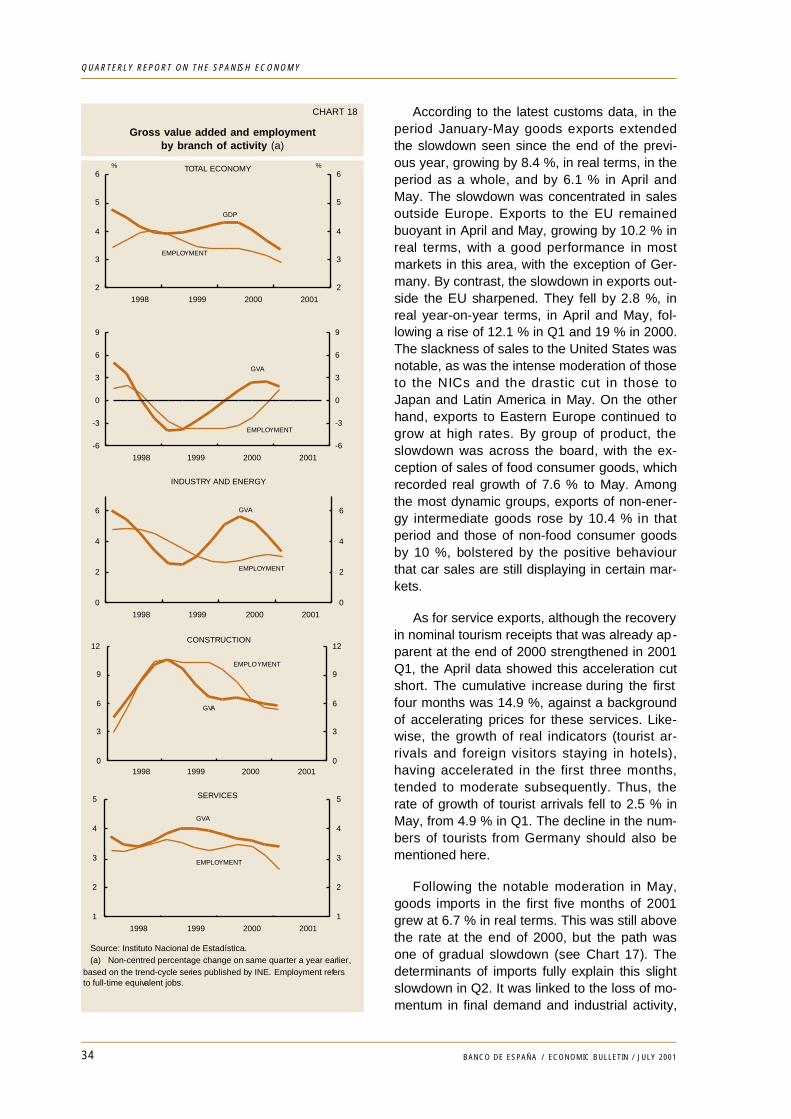
According to the latest customs data, in theperiod January-May goods exports extendedthe slowdown seen since the end of the previ-ous year, growing by 8.4 %, in real terms, in theperiod as a whole, and by 6.1 % in April andMay. The slowdown was concentrated in salesoutside Europe. Exports to the EU remainedbuoyant in April and May, growing by 10.2 % inreal terms, with a good performance in mostmarkets in this area, with the exception of Ger-many. By contrast, the slowdown in exports out-side the EU sharpened. They fell by 2.8 %, inreal year-on-year terms, in April and May, fol-lowing a rise of 12.1 % in Q1 and 19 % in 2000.The slackness of sales to the United States wasnotable, as was the intense moderation of thoseto the NICs and the drastic cut in those toJapan and Latin America in May. On the otherhand, exports to Eastern Europe continued togrow at high rates. By group of product, theslowdown was across the board, with the ex-ception of sales of food consumer goods, whichrecorded real growth of 7.6 % to May. Amongthe most dynamic groups, exports of non-ener-gy intermediate goods rose by 10.4 % in thatperiod and those of non-food consumer goodsby 10 %, bolstered by the positive behaviourthat car sales are still displaying in certain mar-kets.
As for service exports, although the recoveryin nominal tourism receipts that was already ap-parent at the end of 2000 strengthened in 2001Q1, the April data showed this acceleration cutshort. The cumulative increase during the firstfour months was 14.9 %, against a backgroundof accelerating prices for these services. Like-wise, the growth of real indicators (tourist ar-rivals and foreign visitors staying in hotels),having accelerated in the first three months,tended to moderate subsequently. Thus, therate of growth of tourist arrivals fell to 2.5 % inMay, from 4.9 % in Q1. The decline in the num-bers of tourists from Germany should also bementioned here.
Following the notable moderation in May,goods imports in the first five months of 2001grew at 6.7 % in real terms. This was still abovethe rate at the end of 2000, but the path wasone of gradual slowdown (see Chart 17). Thedeterminants of imports fully explain this slightslowdown in Q2. It was linked to the loss of mo-mentum in final demand and industrial activity,
34 BANCO DE ESPAÑA / ECONOMIC BULLETIN / JULY 2001
QUARTERLY REPORT ON THE SPANISH ECONOMY
CHART 18
Gross value added and employmentby branch of activity (a)
2
3
4
5
6
1998 1999 2000 2001
2
3
4
5
6TOTAL ECONOMY
GDP
%
EMPLOYMENT
%
-6
-3
0
3
6
9
1998 1999 2000 2001
-6
-3
0
3
6
9
GVA
EMPLOYMENT
0
2
4
6
1998 1999 2000 2001
0
2
4
6
EMPLOYMENT
INDUSTRY AND ENERGY
GVA
0
3
6
9
12
1998 1999 2000 20010
3
6
9
12
EMPLOYMENT
CONSTRUCTION
GVA
1
2
3
4
5
1998 1999 2000 2001
1
2
3
4
5
EMPLOYMENT
SERVICES
GVA
Source: Instituto Nacional de Estadística. (a) Non-centred percentage change on same quarter a year earlier,based on the trend-cycle series published by INE. Employment refersto full-time equivalent jobs.
and took place in spite of the deceleration of im-port prices.
By group of product, the strong growth inreal terms of purchases of food consumergoods stands out (27 % in the period January-May). This was affected by the low levelsrecorded in the same period last year, when allthe imports of tobacco during these monthswere recorded in July 2000. At the same time,the May figures showed a moderation of the no-table recovery that had been recorded until thenby purchases of non-energy intermediategoods, against a background of very moderategrowth in their prices. However, purchases ofnon-food consumer goods remained highlybuoyant in May. In the first five months of 2001they increased by 7.9 %, boosted by the trans-fer to January of certain purchases of transportequipment corresponding to December 2000.Imports of capital goods continued to display avery subdued tempo throughout this period,with a fall of 2.4 % in real terms. As for energypurchases, intermediate goods grew in realterms by 4.3 % in the first five months of theyear, with their rate of growth declining again inrelation to the previous year, despite the sharpreduction in the rate of growth of their prices.
Finally, the growth of services imports roseslightly in 2001 Q1 in real terms, to 10.3 %.However, as in the case of receipts, the pick-upin nominal tourism payments was cut short inApril. Even so, they rose by 22.4 % to thatmonth. Services other than tourism continued todisplay sustained growth, notable being thegrowth in payments relating to passenger trans-port services and that of those linked to finan-cial services, in line with the buoyancy of Span-ish investment abroad.
4.2. Output and employment
As mentioned at the beginning of this chap-ter, the rate of growth of GVA in 2001 Q1 fell inall productive branches (see Chart 18). In thecase of the primary sector, the growth rate fellto 1.7 %, year-on-year, cutting short the trend ofrecovery displayed by this activity in 2000. Theloss of vigour was concentrated in crop farming,while both livestock farming and fishing record-ed rates of decline in activity similar to those ofthe final months of the year 2000. Paradoxical-ly, the abundant rainfall (the factor responsible
for the recovery in the sector last year) was thecause of the reduced momentum of agriculturaloutput at the beginning of the year, as it pre-vented certain crops from developing normally,such as winter cereals, whose output is estimat-ed to have fallen by 20 %. Despite this, thereare other crops which will benefit from the highrainfall, so that in the year 2001 as a whole thissector can be expected to post a positive per-formance. That said, these favourableprospects depend on the performance of thelivestock industry, since any worsening of thehealth problems in pig-farming could offset therecovery from those previously affecting beefproduction.
The performance of industrial activity in thefirst few months of 2001 continued to be gov-erned by the loss of vigour in domestic demand(especially capital goods investment) and bythe deteriorating international environment. OnQNA data, in 2001 Q1 the rate of growth of ac-tivity in the industrial and energy branches fellby one percentage point, to 3.3 %. As in theprevious quarter, energy production recorded alarger deceleration, although it remained themost dynamic sector. Industry also slowed,continuing to do so in Q2, according to the lat-est information. The index of industrial produc-tion deteriorated further in April and May, wellinto the zone of negative rates of change, andthe industrial confidence indicator slipped in Q2,owing to the worse assessment by business-men of their order books and the undesired in-crease in stocks. At a less aggregated level, thedeceleration affected both mining and chemi-cals and, more markedly, metal processing,where problems have been discerned in rela-tion to the products with the highest technologi-cal content, such as electronic equipment andoffice machinery. Manufacturing output has, forits part, remained stuck at negative rates ofchange.
Construction continued to be the most dy-namic activity in Q1, with the exception of en-ergy, despite moderating further. On QNAdata, the year-on-year rate of growth of valueadded in construction was 5.7 %, 0.3 percent-age points less than in the previous quarter.As already mentioned when discussing invest-ment in construction, the information availablepoints to continuation of this moderate slow-down in Q2.
35BANCO DE ESPAÑA / ECONOMIC BULLETIN / JULY 2001
QUARTERLY REPORT ON THE SPANISH ECONOMY
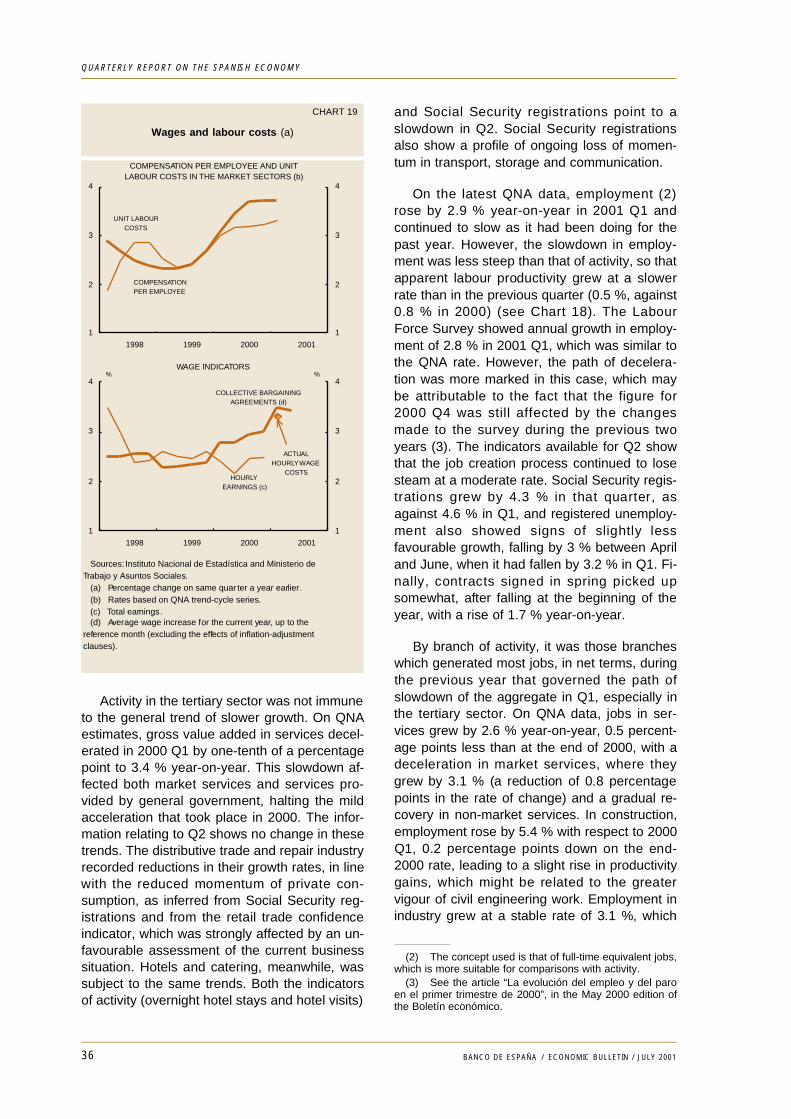
Activity in the tertiary sector was not immuneto the general trend of slower growth. On QNAestimates, gross value added in services decel-erated in 2000 Q1 by one-tenth of a percentagepoint to 3.4 % year-on-year. This slowdown af-fected both market services and services pro-vided by general government, halting the mildacceleration that took place in 2000. The infor-mation relating to Q2 shows no change in thesetrends. The distributive trade and repair industryrecorded reductions in their growth rates, in linewith the reduced momentum of private con-sumption, as inferred from Social Security reg-istrations and from the retail trade confidenceindicator, which was strongly affected by an un-favourable assessment of the current businesssituation. Hotels and catering, meanwhile, wassubject to the same trends. Both the indicatorsof activity (overnight hotel stays and hotel visits)
and Social Security registrations point to aslowdown in Q2. Social Security registrationsalso show a profile of ongoing loss of momen-tum in transport, storage and communication.
On the latest QNA data, employment (2)rose by 2.9 % year-on-year in 2001 Q1 andcontinued to slow as it had been doing for thepast year. However, the slowdown in employ-ment was less steep than that of activity, so thatapparent labour productivity grew at a slowerrate than in the previous quarter (0.5 %, against0.8 % in 2000) (see Chart 18). The LabourForce Survey showed annual growth in employ-ment of 2.8 % in 2001 Q1, which was similar tothe QNA rate. However, the path of decelera-tion was more marked in this case, which maybe attributable to the fact that the figure for2000 Q4 was still affected by the changesmade to the survey during the previous twoyears (3). The indicators available for Q2 showthat the job creation process continued to losesteam at a moderate rate. Social Security regis-trations grew by 4.3 % in that quarter, asagainst 4.6 % in Q1, and registered unemploy-ment also showed signs of slightly lessfavourable growth, falling by 3 % between Apriland June, when it had fallen by 3.2 % in Q1. Fi-nally, contracts signed in spring picked upsomewhat, after falling at the beginning of theyear, with a rise of 1.7 % year-on-year.
By branch of activity, it was those brancheswhich generated most jobs, in net terms, duringthe previous year that governed the path ofslowdown of the aggregate in Q1, especially inthe tertiary sector. On QNA data, jobs in ser-vices grew by 2.6 % year-on-year, 0.5 percent-age points less than at the end of 2000, with adeceleration in market services, where theygrew by 3.1 % (a reduction of 0.8 percentagepoints in the rate of change) and a gradual re-covery in non-market services. In construction,employment rose by 5.4 % with respect to 2000Q1, 0.2 percentage points down on the end-2000 rate, leading to a slight rise in productivitygains, which might be related to the greatervigour of civil engineering work. Employment inindustry grew at a stable rate of 3.1 %, which
36 BANCO DE ESPAÑA / ECONOMIC BULLETIN / JULY 2001
QUARTERLY REPORT ON THE SPANISH ECONOMY
CHART 19
Wages and labour costs (a)
Sources: Instituto Nacional de Estadística and Ministerio deTrabajo y Asuntos Sociales. (a) Percentage change on same quar ter a year earlier. (b) Rates based on QNA trend-cycle series. (c) Total earnings. (d) Average wage increase for the current year, up to thereference month (excluding the effects of inflation-adjustmentclauses).
1
2
3
4
1998 1999 2000 2001
1
2
3
4
WAGE INDICATORS% %
COLLECTIVE BARGAININGAGREEMENTS (d)
HOURLYEARNINGS (c)
ACTUALHOURLY WAGE
COSTS
1
2
3
4
1998 1999 2000 2001
1
2
3
4
COMPENSATION PER EMPLOYEE AND UNITLABOUR COSTS IN THE MARKET SECTORS (b)
UNIT LABOURCOSTS
COMPENSATIONPER EMPLOYEE
(2) The concept used is that of full-time equivalent jobs,which is more suitable for comparisons with activity.
(3) See the article “La evolución del empleo y del paroen el primer trimestre de 2000”, in the May 2000 edition ofthe Boletín económico.
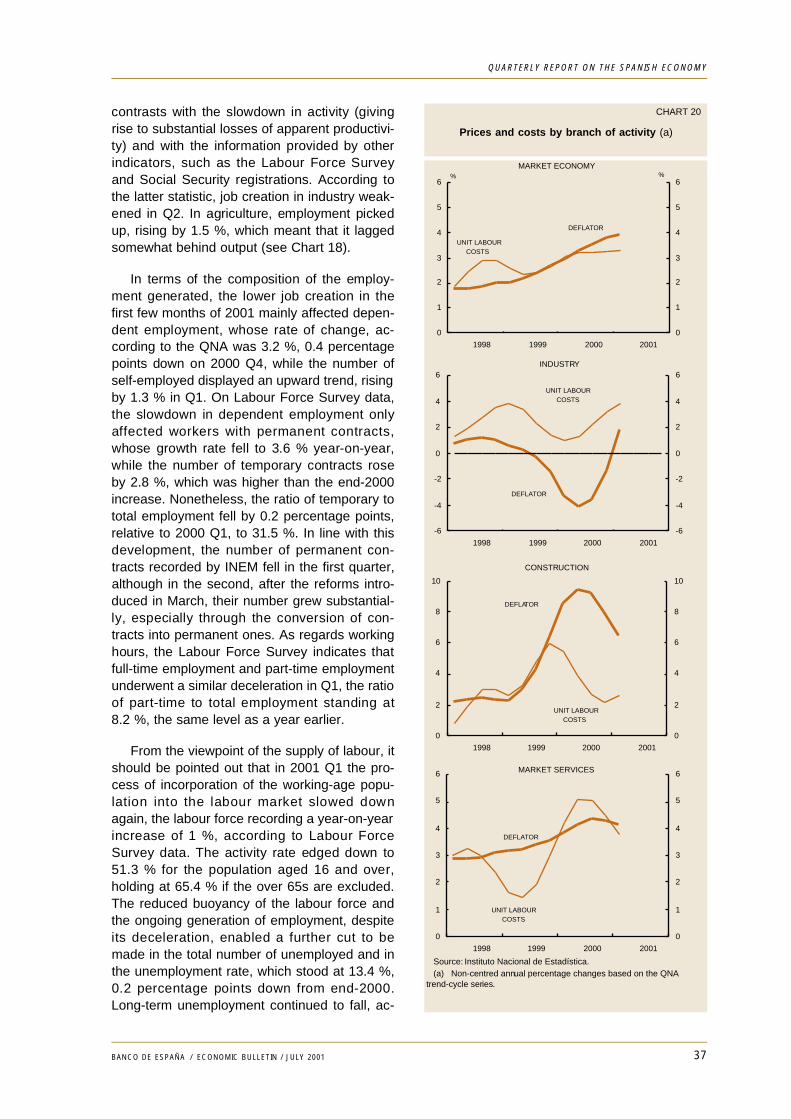
contrasts with the slowdown in activity (givingrise to substantial losses of apparent productivi-ty) and with the information provided by otherindicators, such as the Labour Force Surveyand Social Security registrations. According tothe latter statistic, job creation in industry weak-ened in Q2. In agriculture, employment pickedup, rising by 1.5 %, which meant that it laggedsomewhat behind output (see Chart 18).
In terms of the composition of the employ-ment generated, the lower job creation in thefirst few months of 2001 mainly affected depen-dent employment, whose rate of change, ac-cording to the QNA was 3.2 %, 0.4 percentagepoints down on 2000 Q4, while the number ofself-employed displayed an upward trend, risingby 1.3 % in Q1. On Labour Force Survey data,the slowdown in dependent employment onlyaffected workers with permanent contracts,whose growth rate fell to 3.6 % year-on-year,while the number of temporary contracts roseby 2.8 %, which was higher than the end-2000increase. Nonetheless, the ratio of temporary tototal employment fell by 0.2 percentage points,relative to 2000 Q1, to 31.5 %. In line with thisdevelopment, the number of permanent con-tracts recorded by INEM fell in the first quarter,although in the second, after the reforms intro-duced in March, their number grew substantial-ly, especially through the conversion of con-tracts into permanent ones. As regards workinghours, the Labour Force Survey indicates thatfull-time employment and part-time employmentunderwent a similar deceleration in Q1, the ratioof part-time to total employment standing at8.2 %, the same level as a year earlier.
From the viewpoint of the supply of labour, itshould be pointed out that in 2001 Q1 the pro-cess of incorporation of the working-age popu-lation into the labour market slowed downagain, the labour force recording a year-on-yearincrease of 1 %, according to Labour ForceSurvey data. The activity rate edged down to51.3 % for the population aged 16 and over,holding at 65.4 % if the over 65s are excluded.The reduced buoyancy of the labour force andthe ongoing generation of employment, despiteits deceleration, enabled a further cut to bemade in the total number of unemployed and inthe unemployment rate, which stood at 13.4 %,0.2 percentage points down from end-2000.Long-term unemployment continued to fall, ac-
37BANCO DE ESPAÑA / ECONOMIC BULLETIN / JULY 2001
QUARTERLY REPORT ON THE SPANISH ECONOMY
CHART 20
Prices and costs by branch of activity (a)
0
1
2
3
4
5
6
1998 1999 2000 2001
0
1
2
3
4
5
6
MARKET ECONOMY% %
UNIT LABOURCOSTS
DEFLATOR
Source: Instituto Nacional de Estadística. (a) Non-centred annual percentage changes based on the QNAtrend-cycle series.
-6
-4
-2
0
2
4
6
1998 1999 2000 2001
-6
-4
-2
0
2
4
6INDUSTRY
DEFLATOR
UNIT LABOURCOSTS
0
1
2
3
4
5
6
1998 1999 2000 2001
0
1
2
3
4
5
6MARKET SERVICES
DEFLATOR
UNIT LABOURCOSTS
0
2
4
6
8
10
1998 1999 2000 2001
0
2
4
6
8
10
CONSTRUCTION
DEFLATOR
UNIT LABOURCOSTS
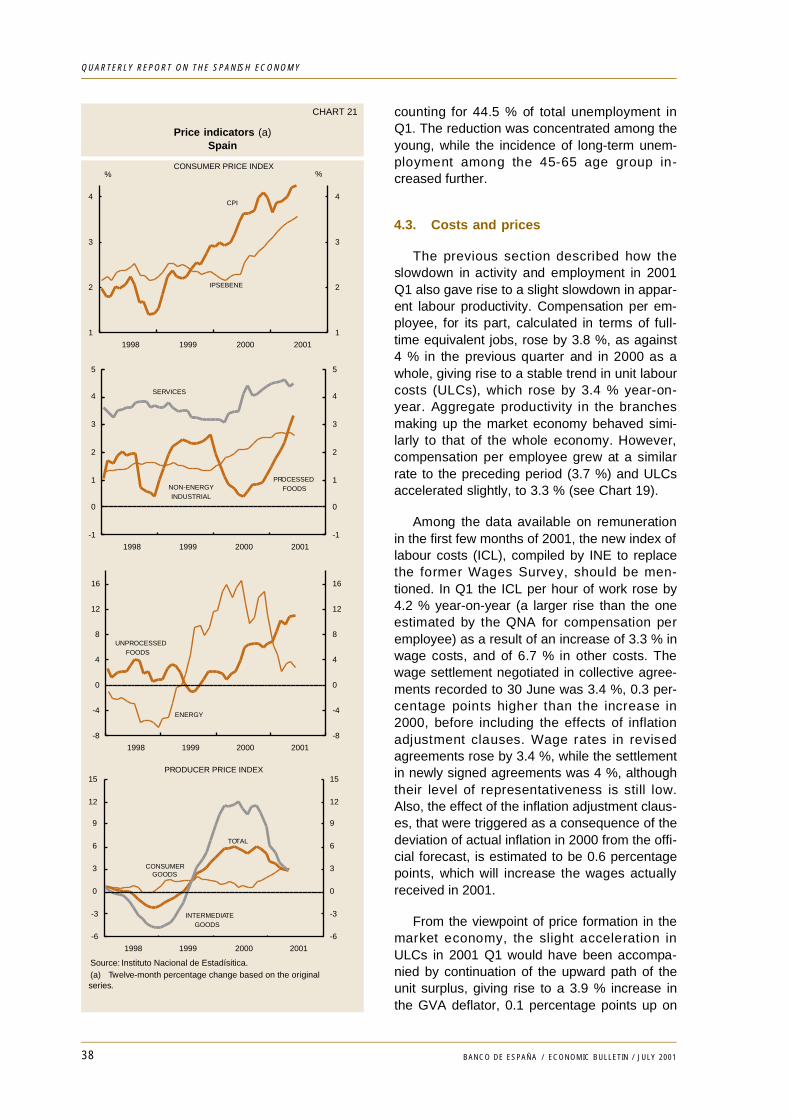
counting for 44.5 % of total unemployment inQ1. The reduction was concentrated among theyoung, while the incidence of long-term unem-ployment among the 45-65 age group in-creased further.
4.3. Costs and prices
The previous section described how theslowdown in activity and employment in 2001Q1 also gave rise to a slight slowdown in appar-ent labour productivity. Compensation per em-ployee, for its part, calculated in terms of full-time equivalent jobs, rose by 3.8 %, as against4 % in the previous quarter and in 2000 as awhole, giving rise to a stable trend in unit labourcosts (ULCs), which rose by 3.4 % year-on-year. Aggregate productivity in the branchesmaking up the market economy behaved simi-larly to that of the whole economy. However,compensation per employee grew at a similarrate to the preceding period (3.7 %) and ULCsaccelerated slightly, to 3.3 % (see Chart 19).
Among the data available on remunerationin the first few months of 2001, the new index oflabour costs (ICL), compiled by INE to replacethe former Wages Survey, should be men-tioned. In Q1 the ICL per hour of work rose by4.2 % year-on-year (a larger rise than the oneestimated by the QNA for compensation peremployee) as a result of an increase of 3.3 % inwage costs, and of 6.7 % in other costs. Thewage settlement negotiated in collective agree-ments recorded to 30 June was 3.4 %, 0.3 per-centage points higher than the increase in2000, before including the effects of inflationadjustment clauses. Wage rates in revisedagreements rose by 3.4 %, while the settlementin newly signed agreements was 4 %, althoughtheir level of representativeness is still low.Also, the effect of the inflation adjustment claus-es, that were triggered as a consequence of thedeviation of actual inflation in 2000 from the offi-cial forecast, is estimated to be 0.6 percentagepoints, which will increase the wages actuallyreceived in 2001.
From the viewpoint of price formation in themarket economy, the slight acceleration inULCs in 2001 Q1 would have been accompa-nied by continuation of the upward path of theunit surplus, giving rise to a 3.9 % increase inthe GVA deflator, 0.1 percentage points up on
38 BANCO DE ESPAÑA / ECONOMIC BULLETIN / JULY 2001
QUARTERLY REPORT ON THE SPANISH ECONOMY
CHART 21
Price indicators (a)Spain
-1
0
1
2
3
4
5
1998 1999 2000 2001
-1
0
1
2
3
4
5
PROCESSEDFOODSNON-ENERGY
INDUSTRIAL
SERVICES
1
2
3
4
1998 1999 2000 2001
1
2
3
4
%
IPSEBENE
CPI
%CONSUMER PRICE INDEX
Source: Instituto Nacional de Estadísitica. (a) Twelve-month percentage change based on the original
-8
-4
0
4
8
12
16
1998 1999 2000 2001
-8
-4
0
4
8
12
16
ENERGY
UNPROCESSEDFOODS
-6
-3
0
3
6
9
12
15
1998 1999 2000 2001
-6
-3
0
3
6
9
12
15PRODUCER PRICE INDEX
CONSUMER
TOTAL
INTERMEDIATE
GOODS
GOODS
series.
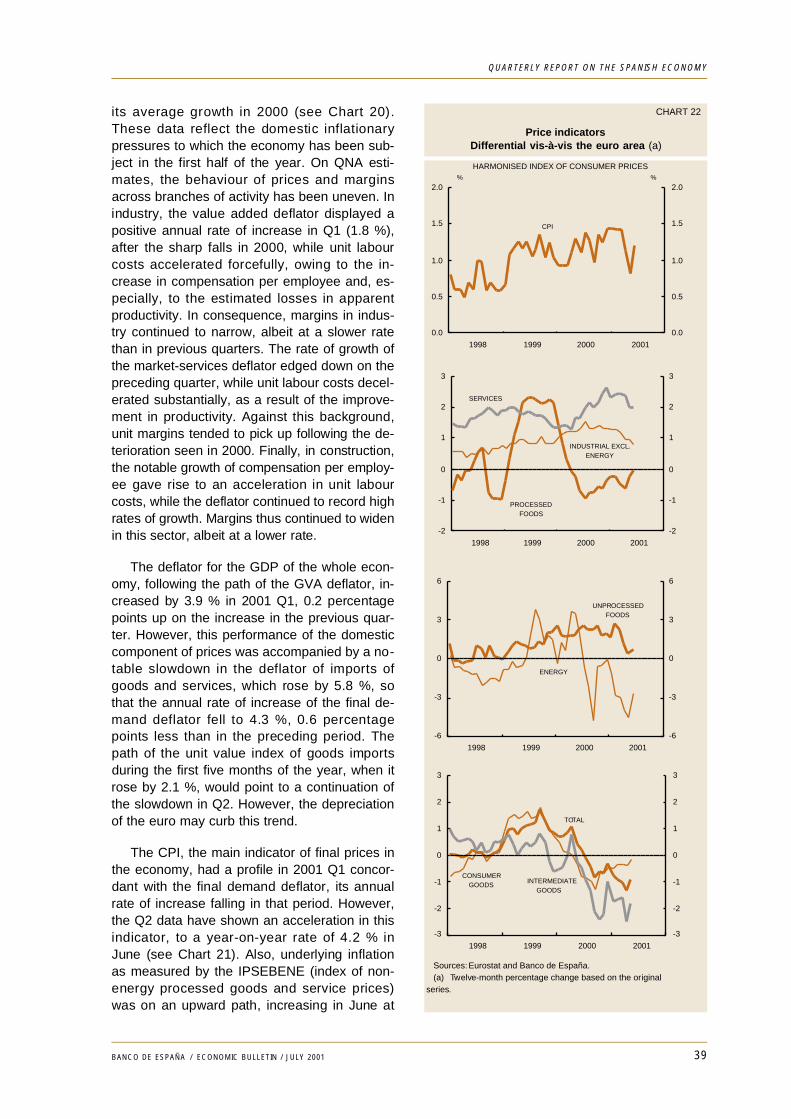
its average growth in 2000 (see Chart 20).These data reflect the domestic inflationarypressures to which the economy has been sub-ject in the first half of the year. On QNA esti-mates, the behaviour of prices and marginsacross branches of activity has been uneven. Inindustry, the value added deflator displayed apositive annual rate of increase in Q1 (1.8 %),after the sharp falls in 2000, while unit labourcosts accelerated forcefully, owing to the in-crease in compensation per employee and, es-pecially, to the estimated losses in apparentproductivity. In consequence, margins in indus-try continued to narrow, albeit at a slower ratethan in previous quarters. The rate of growth ofthe market-services deflator edged down on thepreceding quarter, while unit labour costs decel-erated substantially, as a result of the improve-ment in productivity. Against this background,unit margins tended to pick up following the de-terioration seen in 2000. Finally, in construction,the notable growth of compensation per employ-ee gave rise to an acceleration in unit labourcosts, while the deflator continued to record highrates of growth. Margins thus continued to widenin this sector, albeit at a lower rate.
The deflator for the GDP of the whole econ-omy, following the path of the GVA deflator, in-creased by 3.9 % in 2001 Q1, 0.2 percentagepoints up on the increase in the previous quar-ter. However, this performance of the domesticcomponent of prices was accompanied by a no-table slowdown in the deflator of imports ofgoods and services, which rose by 5.8 %, sothat the annual rate of increase of the final de-mand deflator fell to 4.3 %, 0.6 percentagepoints less than in the preceding period. Thepath of the unit value index of goods importsduring the first five months of the year, when itrose by 2.1 %, would point to a continuation ofthe slowdown in Q2. However, the depreciationof the euro may curb this trend.
The CPI, the main indicator of final prices inthe economy, had a profile in 2001 Q1 concor-dant with the final demand deflator, its annualrate of increase falling in that period. However,the Q2 data have shown an acceleration in thisindicator, to a year-on-year rate of 4.2 % inJune (see Chart 21). Also, underlying inflationas measured by the IPSEBENE (index of non-energy processed goods and service prices)was on an upward path, increasing in June at
39BANCO DE ESPAÑA / ECONOMIC BULLETIN / JULY 2001
QUARTERLY REPORT ON THE SPANISH ECONOMY
CHART 22
Price indicatorsDifferential vis-à-vis the euro area (a)
-2
-1
0
1
2
3
1998 1999 2000 2001
-2
-1
0
1
2
3
PROCESSEDFOODS
INDUSTRIAL EXCL.ENERGY
SERVICES
0.0
0.5
1.0
1.5
2.0
1998 1999 2000 2001
0.0
0.5
1.0
1.5
2.0
CPI
HARMONISED INDEX OF CONSUMER PRICES% %
-6
-3
0
3
6
1998 1999 2000 2001
-6
-3
0
3
6
UNPROCESSEDFOODS
ENERGY
-3
-2
-1
0
1
2
3
1998 1999 2000 2001
-3
-2
-1
0
1
2
3
CONSUMERGOODS
TOTAL
INTERMEDIATEGOODS
Sources: Eurostat and Banco de España. (a) Twelve-month percentage change based on the originalseries.
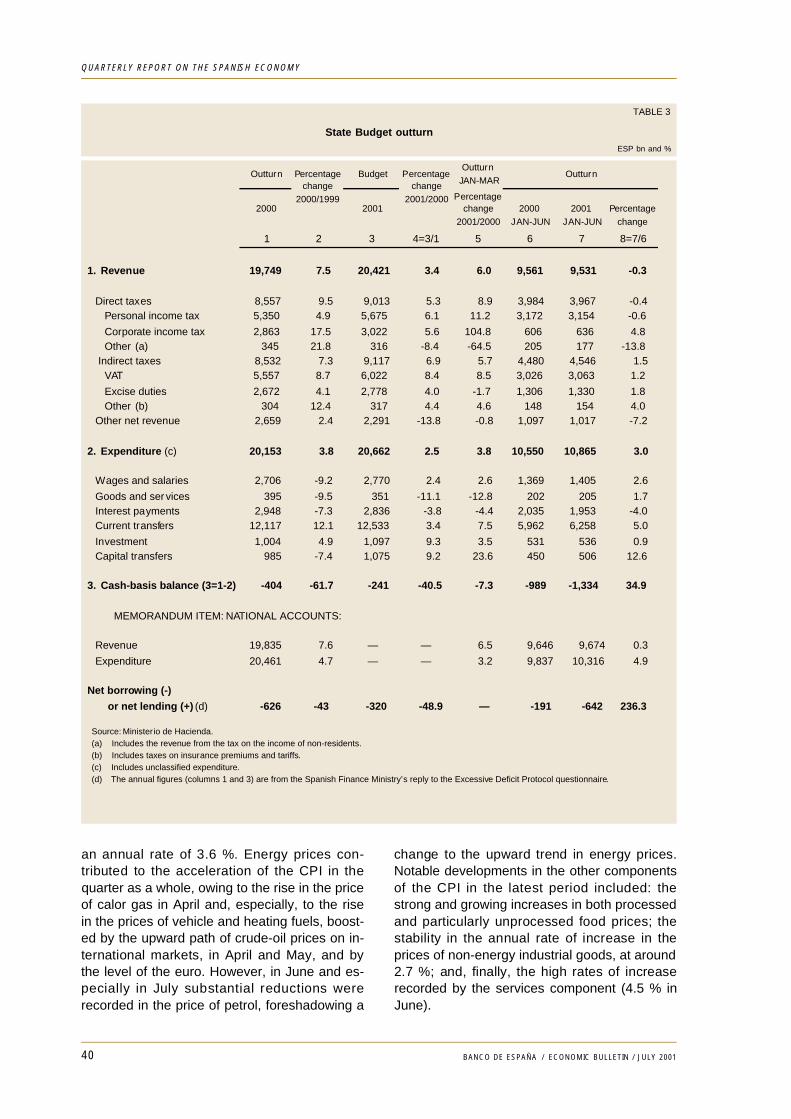
40 BANCO DE ESPAÑA / ECONOMIC BULLETIN / JULY 2001
QUARTERLY REPORT ON THE SPANISH ECONOMY
an annual rate of 3.6 %. Energy prices con-tributed to the acceleration of the CPI in thequarter as a whole, owing to the rise in the priceof calor gas in April and, especially, to the risein the prices of vehicle and heating fuels, boost-ed by the upward path of crude-oil prices on in-ternational markets, in April and May, and bythe level of the euro. However, in June and es-pecially in July substantial reductions wererecorded in the price of petrol, foreshadowing a
change to the upward trend in energy prices.Notable developments in the other componentsof the CPI in the latest period included: thestrong and growing increases in both processedand particularly unprocessed food prices; thestability in the annual rate of increase in theprices of non-energy industrial goods, at around2.7 %; and, finally, the high rates of increaserecorded by the services component (4.5 % inJune).
TABLE 3
State Budget outturnESP bn and %
Outturn BudgetOutturn
JAN-MAROutturn
Percentage2000 2001 change 2000 2001 Percentage
2001/2000 JAN-JUN JAN-JUN change
1 2 3 4=3/1 5 6 7 8=7/6
1. Revenue 19,749 7.5 20,421 3.4 6.0 9,561 9,531 -0.3
Direct taxes 8,557 9.5 9,013 5.3 8.9 3,984 3,967 -0.4Personal income tax 5,350 4.9 5,675 6.1 11.2 3,172 3,154 -0.6
Corporate income tax 2,863 17.5 3,022 5.6 104.8 606 636 4.8Other (a) 345 21.8 316 -8.4 -64.5 205 177 -13.8
Indirect taxes 8,532 7.3 9,117 6.9 5.7 4,480 4,546 1.5VAT 5,557 8.7 6,022 8.4 8.5 3,026 3,063 1.2
Excise duties 2,672 4.1 2,778 4.0 -1.7 1,306 1,330 1.8Other (b) 304 12.4 317 4.4 4.6 148 154 4.0
Other net revenue 2,659 2.4 2,291 -13.8 -0.8 1,097 1,017 -7.2
2. Expenditure (c) 20,153 3.8 20,662 2.5 3.8 10,550 10,865 3.0
Wages and salaries 2,706 -9.2 2,770 2.4 2.6 1,369 1,405 2.6
Goods and ser vices 395 -9.5 351 -11.1 -12.8 202 205 1.7Interest payments 2,948 -7.3 2,836 -3.8 -4.4 2,035 1,953 -4.0Current transfers 12,117 12.1 12,533 3.4 7.5 5,962 6,258 5.0
Investment 1,004 4.9 1,097 9.3 3.5 531 536 0.9Capital transfers 985 -7.4 1,075 9.2 23.6 450 506 12.6
3. Cash-basis balance (3=1-2) -404 -61.7 -241 -40.5 -7.3 -989 -1,334 34.9
MEMORANDUM ITEM: NATIONAL ACCOUNTS:
Revenue 19,835 7.6 — — 6.5 9,646 9,674 0.3
Expenditure 20,461 4.7 — — 3.2 9,837 10,316 4.9
Net borrowing (-)
or net lending (+) (d) -626 -43 -320 -48.9 — -191 -642 236.3
Percentagechange
2000/1999
Percentagechange
2001/2000
Source: Ministerio de Hacienda. (a) Includes the revenue from the tax on the income of non-residents. (b) Includes taxes on insurance premiums and tariffs. (c) Includes unclassified expenditure. (d) The annual figures (columns 1 and 3) are from the Spanish Finance Ministry’s reply to the Excessive Deficit Protocol questionnaire.
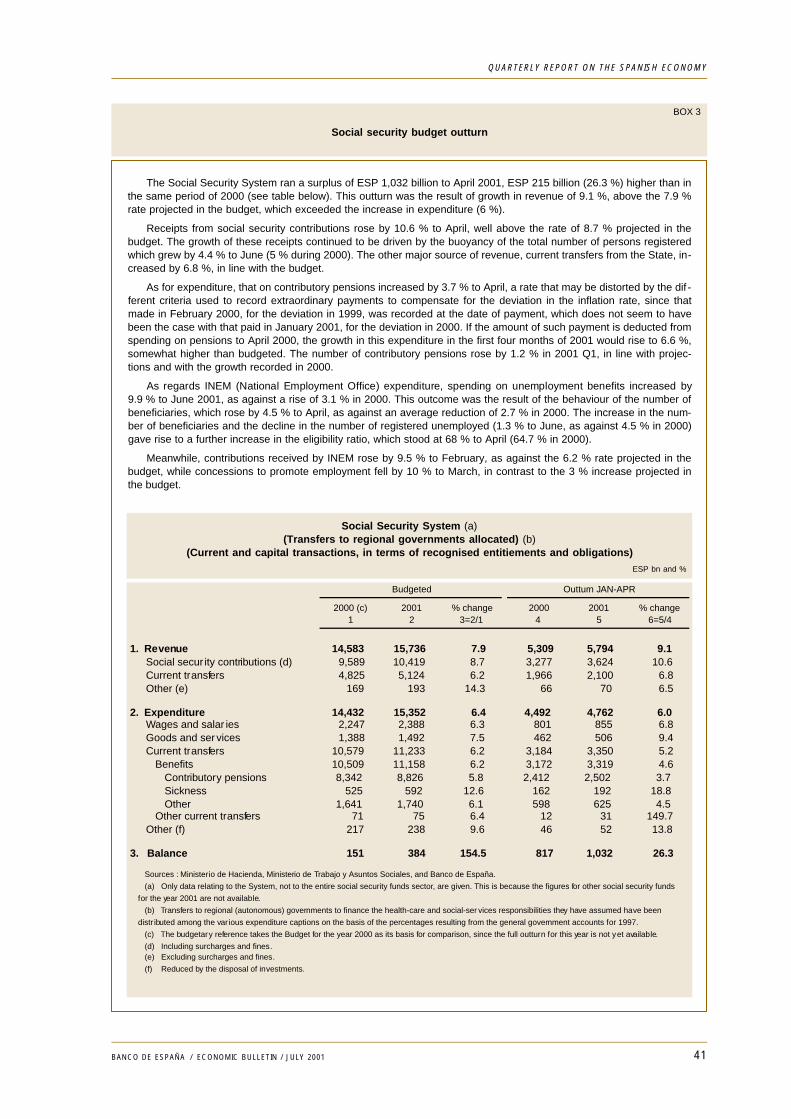
41BANCO DE ESPAÑA / ECONOMIC BULLETIN / JULY 2001
QUARTERLY REPORT ON THE SPANISH ECONOMY
BOX 3
Social security budget outturn
The Social Security System ran a surplus of ESP 1,032 billion to April 2001, ESP 215 billion (26.3 %) higher than inthe same period of 2000 (see table below). This outturn was the result of growth in revenue of 9.1 %, above the 7.9 %rate projected in the budget, which exceeded the increase in expenditure (6 %).
Receipts from social security contributions rose by 10.6 % to April, well above the rate of 8.7 % projected in thebudget. The growth of these receipts continued to be driven by the buoyancy of the total number of persons registeredwhich grew by 4.4 % to June (5 % during 2000). The other major source of revenue, current transfers from the State, in-creased by 6.8 %, in line with the budget.
As for expenditure, that on contributory pensions increased by 3.7 % to April, a rate that may be distorted by the dif -ferent criteria used to record extraordinary payments to compensate for the deviation in the inflation rate, since thatmade in February 2000, for the deviation in 1999, was recorded at the date of payment, which does not seem to havebeen the case with that paid in January 2001, for the deviation in 2000. If the amount of such payment is deducted fromspending on pensions to April 2000, the growth in this expenditure in the first four months of 2001 would rise to 6.6 %,somewhat higher than budgeted. The number of contributory pensions rose by 1.2 % in 2001 Q1, in line with projec-tions and with the growth recorded in 2000.
As regards INEM (National Employment Office) expenditure, spending on unemployment benefits increased by9.9 % to June 2001, as against a rise of 3.1 % in 2000. This outcome was the result of the behaviour of the number ofbeneficiaries, which rose by 4.5 % to April, as against an average reduction of 2.7 % in 2000. The increase in the num-ber of beneficiaries and the decline in the number of registered unemployed (1.3 % to June, as against 4.5 % in 2000)gave rise to a further increase in the eligibility ratio, which stood at 68 % to April (64.7 % in 2000).
Meanwhile, contributions received by INEM rose by 9.5 % to February, as against the 6.2 % rate projected in thebudget, while concessions to promote employment fell by 10 % to March, in contrast to the 3 % increase projected inthe budget.
Social Security System (a)(Transfers to regional governments allocated) (b)
(Current and capital transactions, in terms of recognised entitiements and obligations)ESP bn and %
2000 (c)1
20012
% change3=2/1
20004
20015
% change6=5/4
1. Revenue 14,583 15,736 7.9 5,309 5,794 9.1Social secur ity contributions (d) 9,589 10,419 8.7 3,277 3,624 10.6Current transfers 4,825 5,124 6.2 1,966 2,100 6.8Other (e) 169 193 14.3 66 70 6.5
2. Expenditure 14,432 15,352 6.4 4,492 4,762 6.0Wages and salar ies 2,247 2,388 6.3 801 855 6.8Goods and ser vices 1,388 1,492 7.5 462 506 9.4Current transfers 10,579 11,233 6.2 3,184 3,350 5.2
Benefits 10,509 11,158 6.2 3,172 3,319 4.6Contributory pensions 8,342 8,826 5.8 2,412 2,502 3.7Sickness 525 592 12.6 162 192 18.8Other 1,641 1,740 6.1 598 625 4.5
Other current transfers 71 75 6.4 12 31 149.7Other (f) 217 238 9.6 46 52 13.8
3. Balance 151 384 154.5 817 1,032 26.3
Budgeted Outturn JAN-APR
Sources : Ministerio de Hacienda, Ministerio de Trabajo y Asuntos Sociales, and Banco de España.
(a) Only data relating to the System, not to the entire social security funds sector, are given. This is because the figures for other social security funds
for the year 2001 are not available.
(b) Transfers to regional (autonomous) governments to finance the health-care and social-ser vices responsibilities they have assumed have been
distr ibuted among the var ious expenditure captions on the basis of the percentages resulting from the general government accounts for 1997.
(c) The budgetary reference takes the Budget for the year 2000 as its basis for comparison, since the full outturn for this year is not yet available.
(d) Including surcharges and fines. (e) Excluding surcharges and fines.
(f) Reduced by the disposal of investments.
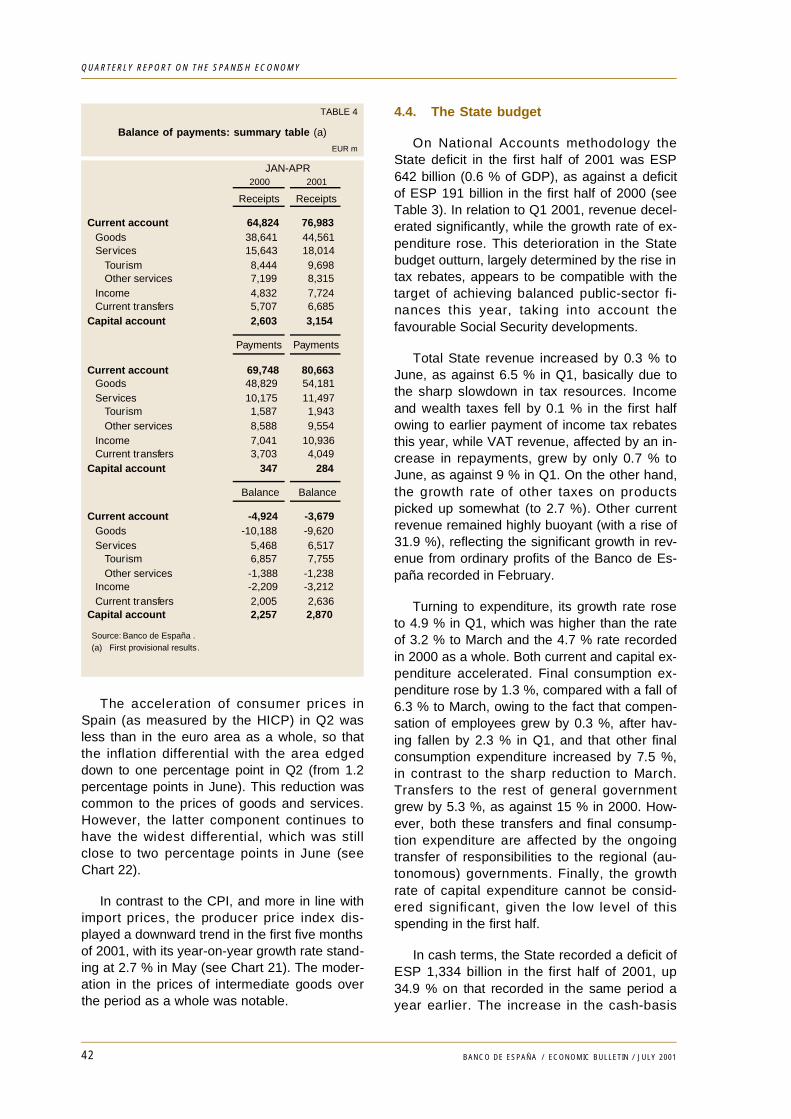
42 BANCO DE ESPAÑA / ECONOMIC BULLETIN / JULY 2001
QUARTERLY REPORT ON THE SPANISH ECONOMY
The acceleration of consumer prices inSpain (as measured by the HICP) in Q2 wasless than in the euro area as a whole, so thatthe inflation differential with the area edgeddown to one percentage point in Q2 (from 1.2percentage points in June). This reduction wascommon to the prices of goods and services.However, the latter component continues tohave the widest differential, which was stillclose to two percentage points in June (seeChart 22).
In contrast to the CPI, and more in line withimport prices, the producer price index dis-played a downward trend in the first five monthsof 2001, with its year-on-year growth rate stand-ing at 2.7 % in May (see Chart 21). The moder-ation in the prices of intermediate goods overthe period as a whole was notable.
4.4. The State budget
On National Accounts methodology theState deficit in the first half of 2001 was ESP642 billion (0.6 % of GDP), as against a deficitof ESP 191 billion in the first half of 2000 (seeTable 3). In relation to Q1 2001, revenue decel-erated significantly, while the growth rate of ex-penditure rose. This deterioration in the Statebudget outturn, largely determined by the rise intax rebates, appears to be compatible with thetarget of achieving balanced public-sector fi-nances this year, taking into account thefavourable Social Security developments.
Total State revenue increased by 0.3 % toJune, as against 6.5 % in Q1, basically due tothe sharp slowdown in tax resources. Incomeand wealth taxes fell by 0.1 % in the first halfowing to earlier payment of income tax rebatesthis year, while VAT revenue, affected by an in-crease in repayments, grew by only 0.7 % toJune, as against 9 % in Q1. On the other hand,the growth rate of other taxes on productspicked up somewhat (to 2.7 %). Other currentrevenue remained highly buoyant (with a rise of31.9 %), reflecting the significant growth in rev-enue from ordinary profits of the Banco de Es-paña recorded in February.
Turning to expenditure, its growth rate roseto 4.9 % in Q1, which was higher than the rateof 3.2 % to March and the 4.7 % rate recordedin 2000 as a whole. Both current and capital ex-penditure accelerated. Final consumption ex-penditure rose by 1.3 %, compared with a fall of6.3 % to March, owing to the fact that compen-sation of employees grew by 0.3 %, after hav-ing fallen by 2.3 % in Q1, and that other finalconsumption expenditure increased by 7.5 %,in contrast to the sharp reduction to March.Transfers to the rest of general governmentgrew by 5.3 %, as against 15 % in 2000. How-ever, both these transfers and final consump-tion expenditure are affected by the ongoingtransfer of responsibilities to the regional (au-tonomous) governments. Finally, the growthrate of capital expenditure cannot be consid-ered significant, given the low level of thisspending in the first half.
In cash terms, the State recorded a deficit ofESP 1,334 billion in the first half of 2001, up34.9 % on that recorded in the same period ayear earlier. The increase in the cash-basis
TABLE 4
Balance of payments: summary table (a)
EUR m
2000 2001
Receipts Receipts
Current account 64,824 76,983Goods 38,641 44,561Services 15,643 18,014
Tourism 8,444 9,698Other services 7,199 8,315
Income 4,832 7,724Current transfers 5,707 6,685
Capital account 2,603 3,154
Payments Payments
Current account 69,748 80,663Goods 48,829 54,181Services 10,175 11,497
Tourism 1,587 1,943Other services 8,588 9,554
Income 7,041 10,936Current transfers 3,703 4,049
Capital account 347 284
Balance Balance
Current account -4,924 -3,679Goods -10,188 -9,620Services 5,468 6,517
Tourism 6,857 7,755Other services -1,388 -1,238
Income -2,209 -3,212Current transfers 2,005 2,636
Capital account 2,257 2,870
JAN-APR
Source: Banco de España . (a) First provisional results.
43BANCO DE ESPAÑA / ECONOMIC BULLETIN / JULY 2001
QUARTERLY REPORT ON THE SPANISH ECONOMY
deficit in the first half was due to the decline of0.3 % in revenue, compared with the growthprojected in the budget, and to the 3 % increasein expenditure.
According to cash-basis information, duringthe period January-June, both direct and indi-rect taxes grew at lower rates than during 2000as a whole and than projected in the budget.Notable, in particular, was the decline in re-ceipts from personal income tax, as a conse-quence, as already mentioned above, of theearlier payment of rebates in 2001 in respect oftax paid in 2000. This temporary phenomenonaffecting personal income tax, together with themoderate increase in receipts from corporateincome tax and the sharp fall in receipts fromthe tax on the income of non-residents, meantthat revenue from direct taxes grew in the firsthalf of the year at well below the rate forecastfor the year as a whole.
As for indirect taxes, on cash-basis data,their growth rate to June is also well below thebudget projection. Most notable was the lowrate of growth of VAT (1.2 %), in contrast to the8.4 % rate projected in the budget and to the8.5 % rate recorded in Q1. As for the other indi-rect taxes, receipts from excise duties acceler-ated in Q2, although the growth rate to June(1.8 %) is still below that forecast for the yearas a whole (4 %).
Non-tax revenue recorded on a cash basisfell in the first half, owing to smaller transfers ofcapital, which mostly arise from transactionswith the European Union. However, as a conse-quence of the increase in profits received fromthe Banco de España, the fall in total non-taxresources in the first half was less than project-ed in the budget.
As for expenditure, its growth in Q2 slowedin relation to Q1, although the rate for the firsthalf continued to exceed the budget projection.This was a consequence of current expendi-ture, since all its components, other than inter-est payments, displayed higher-than-budgetedgrowth rates, with goods and services being es-pecially notable in this respect. By contrast, thegrowth rate of capital expenditure was belowbudget, due to the growth of investment, sincecapital transfers were higher than projected.
4.5. The Spanish balance of paymentsand capital account
In the period January to April 2001 the cur-rent and capital accounts of the balance of pay-ments ran an overall deficit of EUR 809 million,EUR 1,859 million less than in the same perioda year earlier. This improvement is explained bythe favourable trend in the current accountdeficit, which in the first four months was re-duced by EUR 1,245 relative to the same peri-od a year earlier, and by the good performanceon the capital account, where the surplus roseby EUR 613 million on the same period a yearearlier (see Table 4).
Between January and April, the trade deficitimproved by EUR 569 million in comparisonwith the same period of 2000. In terms of year-on-year rates, the deficit fell by 5.6 %, in con-trast to the average increase of 30.3 % lastyear. The behaviour of nominal flows of exportsand imports of merchandise, which grew by15.3 % and 11 %, respectively, was mainly de-termined by the improvement in the terms oftrade from the beginning of the year, stemmingfrom a moderation in the rate of increase ofboth energy and non-energy import prices.Moreover, as already mentioned in section 4.1,goods exports were also more buoyant than im-ports in real terms.
The surplus recorded on the services ac-count to April was EUR 6,517 million, asagainst EUR 5,468 million in the first fourmonths of 2000. This growth is explained by the13.1 % rise in the surplus on tourism and traveland by the 10.8 % reduction in the deficit onother services. Both receipts (14.9 %) and, es-pecially, payments (22.4 %) relating to tourismand travel were expansionary. However,tourism receipts, which had been more dynamicin 2001 Q1, began to slow in April in line withthe moderation in the tourist arrivals indicator.This moderation continued in May.
During the period January-April, the incomedeficit rose by EUR 1,003 million from the sameperiod a year earlier. Receipts continued to riseat a significant rate (59.8 %), reflecting thestrong investment abroad in recent years. Pay-ments also grew by 55.3 %, with notably highgrowth in the income paid by the private sector,in step with the recent buoyancy of foreign port-
folio investment, in the form of mutual fundsand bonds.
In the first four months of 2001, the transferssurplus amounted to EUR 2,636, a rise of EUR631 million on the same period of 2000. This in-crease was attributable both to flows from theEU to the private sector, under the EAGGF-Guarantee, and to flows to the public sector,under the European Social Fund. Finally, thecapital account surplus rose by EUR 613 millionrelative to the first four months of 2000. Thisgrowth, which in terms of year-on-year rateswas 27.2 %, is explained by the pick-up instructural funds from the EU, especially thoserelating to the ERDF, although transfers re-ceived from the EAGGF-Guidance also in-creased. Presumably the increase in current
and capital transfers is incorporating lags aris-ing in the previous year.
The nation’s lower net borrowing, reflectedby these data, is consistent with the progressmade in correcting the budget deficit and withthe slowdown in economic activity in recentquarters. This would explain the improvement inthe balance of the corporate sector, stemmingfrom the deceleration in private productive in-vestment. Also, the decline in household netlending is estimated to have been checked as aconsequence, on one hand, of the moderationin private consumption, which has enabled thedownward trend in the saving ratio to be turnedaround and, on the other, of the slowdown inresidential investment.
44 BANCO DE ESPAÑA / ECONOMIC BULLETIN / JULY 2001
QUARTERLY REPORT ON THE SPANISH ECONOMY
5. Financial flows in theSpanish economy
5.1. Financial flows in the economy as awhole
National Accounts and financial accountsdata for 2001 Q1 show a mild pick-up in the netfinancial saving of the nation, for the first time inthree years. The net balance of financial trans-actions of the Spanish economy with the rest ofthe world stood at –2 % of GDP at the end of2001 Q1 (in cumulative four-quarter terms),having reached –2.2 % of GDP at end-2000(see Table 5). This decline in the nation’s finan-cial requirements was attributable to the recov-ery in household financial saving and to the on-going decline in general-government net bor-rowing. By contrast, non-financial corporationsrecorded a further fall in their net financial trans-actions with other sectors and there was aslight decline in the credit balance on the finan-cial transactions of the sector of financial institu-tions. In any event, the rate of growth of creditobtained by households and non-financial cor-porations remained high, particularly credit forhouse purchases and to finance property activi-ties. According to the provisional informationavailable, in June 2001 the annual growth ofcredit from domestic institutions to the non-fi-nancial private sector was 14.5 %.
5.2. Financial flows of households andNPIs
The net financial saving of householdsshowed signs of recovery in 2001 Q1, standingat 1 % of GDP, in cumulative four quarter terms(see Table 5). This recovery is explained by thenotable decline in flows of financing during thefirst few months of the year and the more mod-erate reduction in the acquisition of financial as-sets. There are a number of circumstances tosuggest that this development involves achange in the trend of saving, which has beenfalling continuously since the mid-1990s. First,the slowdown in activity in recent quarters mayhave led to a downward revision in expectationsof future household income, thereby boostingsaving as a means of guaranteeing a specificlevel of future spending. Second, the loss in val-ue of financial wealth that took place in 2000must have helped to worsen such expectations,while requiring an increase in saving to offsetthe reduction in household net wealth.
In 2001 Q1, the acquisition of financial assetsrose relative to the previous quarter, basicallyowing to the growth of cash and cash equiva-lents (see Chart 23 and Table 6). Time depositsand fixed-income securities also contributed tothis acceleration. By contrast, the sharper fall inthe portfolio of shares and other equity (owing todisinvestment in equity and international mutual
45BANCO DE ESPAÑA / ECONOMIC BULLETIN / JULY 2001
QUARTERLY REPORT ON THE SPANISH ECONOMY
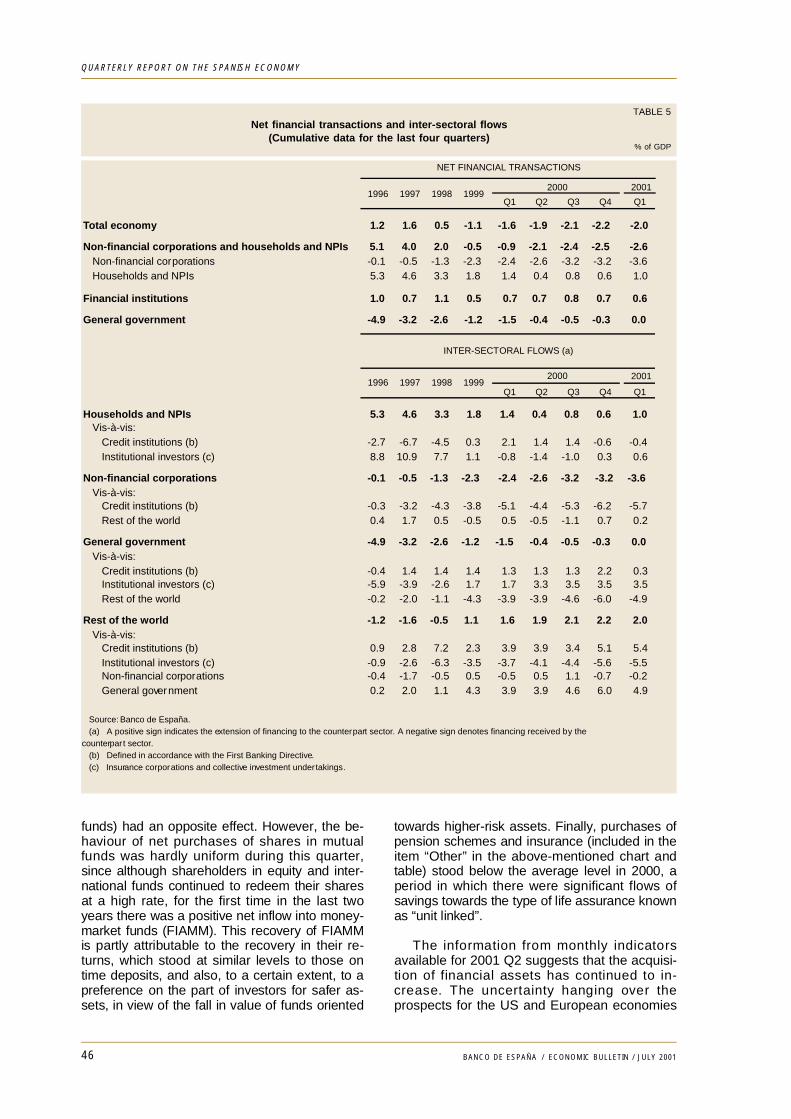
46 BANCO DE ESPAÑA / ECONOMIC BULLETIN / JULY 2001
QUARTERLY REPORT ON THE SPANISH ECONOMY
funds) had an opposite effect. However, the be-haviour of net purchases of shares in mutualfunds was hardly uniform during this quarter,since although shareholders in equity and inter-national funds continued to redeem their sharesat a high rate, for the first time in the last twoyears there was a positive net inflow into money-market funds (FIAMM). This recovery of FIAMMis partly attributable to the recovery in their re-turns, which stood at similar levels to those ontime deposits, and also, to a certain extent, to apreference on the part of investors for safer as-sets, in view of the fall in value of funds oriented
towards higher-risk assets. Finally, purchases ofpension schemes and insurance (included in theitem “Other” in the above-mentioned chart andtable) stood below the average level in 2000, aperiod in which there were significant flows ofsavings towards the type of life assurance knownas “unit linked”.
The information from monthly indicatorsavailable for 2001 Q2 suggests that the acquisi-tion of financial assets has continued to in-crease. The uncertainty hanging over theprospects for the US and European economies
TABLE 5Net financial transactions and inter-sectoral flows
(Cumulative data for the last four quarters)% of GDP
2001
Q1 Q2 Q3 Q4 Q1
Total economy 1.2 1.6 0.5 -1.1 -1.6 -1.9 -2.1 -2.2 -2.0
Non-financial corporations and households and NPIs 5.1 4.0 2.0 -0.5 -0.9 -2.1 -2.4 -2.5 -2.6Non-financial corporations -0.1 -0.5 -1.3 -2.3 -2.4 -2.6 -3.2 -3.2 -3.6Households and NPIs 5.3 4.6 3.3 1.8 1.4 0.4 0.8 0.6 1.0
Financial institutions 1.0 0.7 1.1 0.5 0.7 0.7 0.8 0.7 0.6
General government -4.9 -3.2 -2.6 -1.2 -1.5 -0.4 -0.5 -0.3 0.0
2001
Q1 Q2 Q3 Q4 Q1
Households and NPIs 5.3 4.6 3.3 1.8 1.4 0.4 0.8 0.6 1.0Vis-à-vis:
Credit institutions (b) -2.7 -6.7 -4.5 0.3 2.1 1.4 1.4 -0.6 -0.4Institutional investors (c) 8.8 10.9 7.7 1.1 -0.8 -1.4 -1.0 0.3 0.6
Non-financial corporations -0.1 -0.5 -1.3 -2.3 -2.4 -2.6 -3.2 -3.2 -3.6Vis-à-vis:
Credit institutions (b) -0.3 -3.2 -4.3 -3.8 -5.1 -4.4 -5.3 -6.2 -5.7Rest of the world 0.4 1.7 0.5 -0.5 0.5 -0.5 -1.1 0.7 0.2
General government -4.9 -3.2 -2.6 -1.2 -1.5 -0.4 -0.5 -0.3 0.0Vis-à-vis:
Credit institutions (b) -0.4 1.4 1.4 1.4 1.3 1.3 1.3 2.2 0.3Institutional investors (c) -5.9 -3.9 -2.6 1.7 1.7 3.3 3.5 3.5 3.5Rest of the world -0.2 -2.0 -1.1 -4.3 -3.9 -3.9 -4.6 -6.0 -4.9
Rest of the world -1.2 -1.6 -0.5 1.1 1.6 1.9 2.1 2.2 2.0Vis-à-vis:
Credit institutions (b) 0.9 2.8 7.2 2.3 3.9 3.9 3.4 5.1 5.4Institutional investors (c) -0.9 -2.6 -6.3 -3.5 -3.7 -4.1 -4.4 -5.6 -5.5Non-financial corporations -0.4 -1.7 -0.5 0.5 -0.5 0.5 1.1 -0.7 -0.2General government 0.2 2.0 1.1 4.3 3.9 3.9 4.6 6.0 4.9
1997 1998
NET FINANCIAL TRANSACTIONS
INTER-SECTORAL FLOWS (a)
2000
20001996 1997 1998 1999
1996 1999
Source: Banco de España. (a) A positive sign indicates the extension of financing to the counterpart sector. A negative sign denotes financing received by thecounterpart sector. (b) Defined in accordance with the First Banking Directive. (c) Insurance corporations and collective investment undertakings.
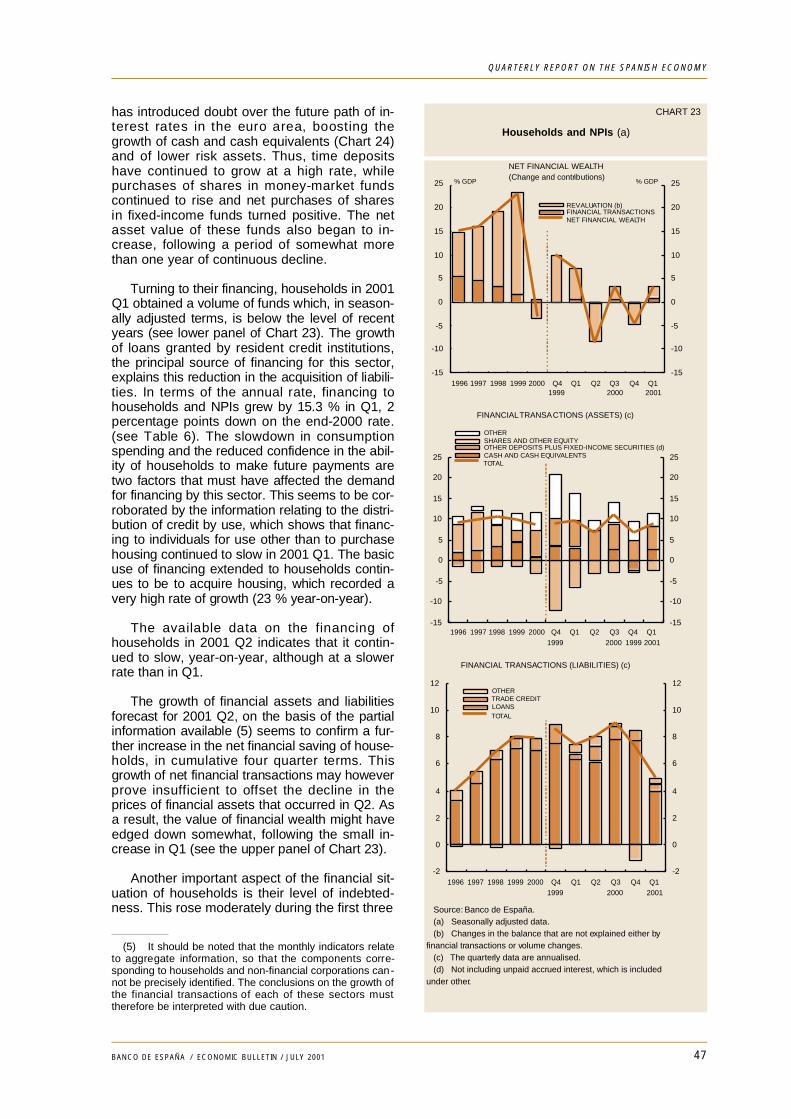
has introduced doubt over the future path of in-terest rates in the euro area, boosting thegrowth of cash and cash equivalents (Chart 24)and of lower risk assets. Thus, time depositshave continued to grow at a high rate, whilepurchases of shares in money-market fundscontinued to rise and net purchases of sharesin fixed-income funds turned positive. The netasset value of these funds also began to in-crease, following a period of somewhat morethan one year of continuous decline.
Turning to their financing, households in 2001Q1 obtained a volume of funds which, in season-ally adjusted terms, is below the level of recentyears (see lower panel of Chart 23). The growthof loans granted by resident credit institutions,the principal source of financing for this sector,explains this reduction in the acquisition of liabili-ties. In terms of the annual rate, financing tohouseholds and NPIs grew by 15.3 % in Q1, 2percentage points down on the end-2000 rate.(see Table 6). The slowdown in consumptionspending and the reduced confidence in the abil-ity of households to make future payments aretwo factors that must have affected the demandfor financing by this sector. This seems to be cor-roborated by the information relating to the distri-bution of credit by use, which shows that financ-ing to individuals for use other than to purchasehousing continued to slow in 2001 Q1. The basicuse of financing extended to households contin-ues to be to acquire housing, which recorded avery high rate of growth (23 % year-on-year).
The available data on the financing ofhouseholds in 2001 Q2 indicates that it contin-ued to slow, year-on-year, although at a slowerrate than in Q1.
The growth of financial assets and liabilitiesforecast for 2001 Q2, on the basis of the partialinformation available (5) seems to confirm a fur-ther increase in the net financial saving of house-holds, in cumulative four quarter terms. Thisgrowth of net financial transactions may howeverprove insufficient to offset the decline in theprices of financial assets that occurred in Q2. Asa result, the value of financial wealth might haveedged down somewhat, following the small in-crease in Q1 (see the upper panel of Chart 23).
Another important aspect of the financial sit-uation of households is their level of indebted-ness. This rose moderately during the first three
47BANCO DE ESPAÑA / ECONOMIC BULLETIN / JULY 2001
QUARTERLY REPORT ON THE SPANISH ECONOMY
CHART 23
Households and NPIs (a)
-15
-10
-5
0
5
10
15
20
25
1996 1997 1998 1999 2000 Q41999
Q1 Q2 Q32000
Q4 Q12001
-15
-10
-5
0
5
10
15
20
25
REVALUATION (b) FINANCIAL TRANSACTIONS NET FINANCIAL WEALTH
NET FINANCIAL WEALTH(Change and contributions)
% GDP % GDP
Source: Banco de España. (a) Seasonally adjusted data. (b) Changes in the balance that are not explained either byfinancial transactions or volume changes. (c) The quarterly data are annualised. (d) Not including unpaid accrued interest, which is includedunder other.
-15
-10
-5
0
5
10
15
20
25
1996 1997 1998 1999 2000 Q4
1999
Q1 Q2 Q3
2000
Q4
1999
Q1
2001
-15
-10
-5
0
5
10
15
20
25
OTHER SHARES AND OTHER EQUITY OTHER DEPOSITS PLUS FIXED-INCOME SECURITIES (d) CASH AND CASH EQUIVALENTS TOTAL
FINANCIAL TRANSACTIONS (ASSETS) (c)
-2
0
2
4
6
8
10
12
1996 1997 1998 1999 2000 Q4
1999
Q1 Q2 Q3
2000
Q4 Q1
2001
-2
0
2
4
6
8
10
12 OTHER TRADE CREDIT LOANS TOTAL
FINANCIAL TRANSACTIONS (LIABILITIES) (c)
(5) It should be noted that the monthly indicators relateto aggregate information, so that the components corre-sponding to households and non-financial corporations can-not be precisely identified. The conclusions on the growth ofthe financial transactions of each of these sectors musttherefore be interpreted with due caution.
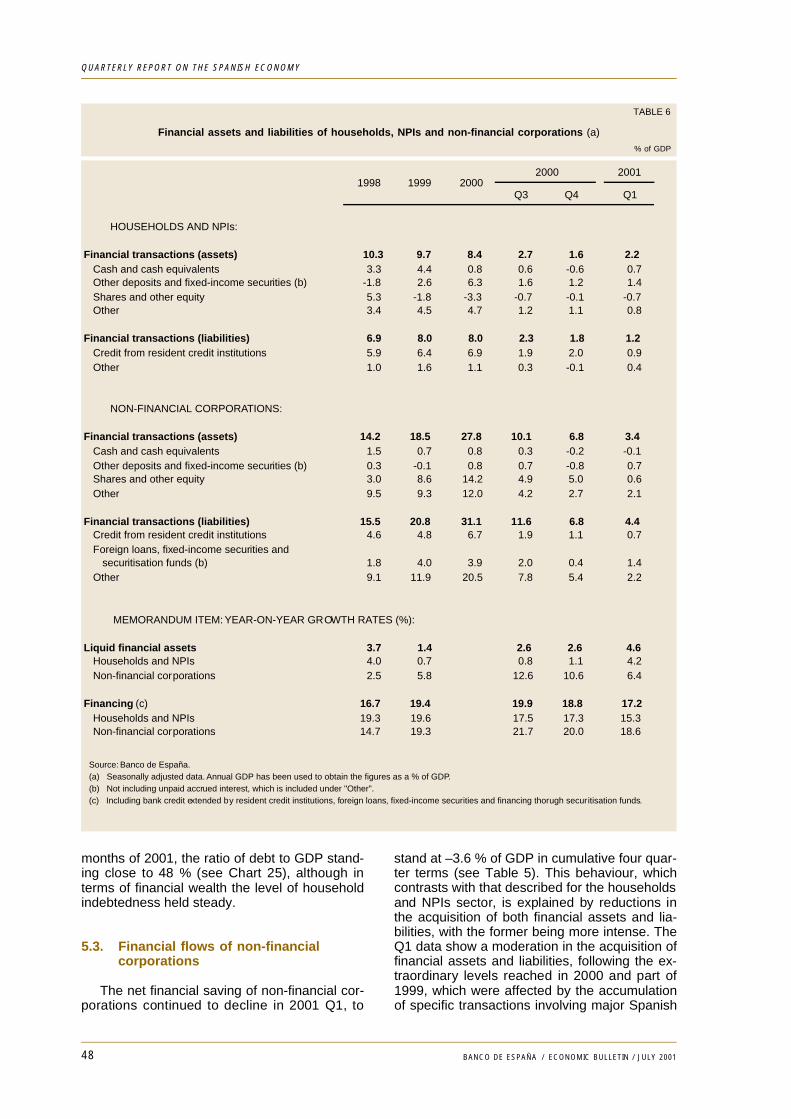
48 BANCO DE ESPAÑA / ECONOMIC BULLETIN / JULY 2001
QUARTERLY REPORT ON THE SPANISH ECONOMY
months of 2001, the ratio of debt to GDP stand-ing close to 48 % (see Chart 25), although interms of financial wealth the level of householdindebtedness held steady.
5.3. Financial flows of non-financialcorporations
The net financial saving of non-financial cor-porations continued to decline in 2001 Q1, to
stand at –3.6 % of GDP in cumulative four quar-ter terms (see Table 5). This behaviour, whichcontrasts with that described for the householdsand NPIs sector, is explained by reductions inthe acquisition of both financial assets and lia-bilities, with the former being more intense. TheQ1 data show a moderation in the acquisition offinancial assets and liabilities, following the ex-traordinary levels reached in 2000 and part of1999, which were affected by the accumulationof specific transactions involving major Spanish
TABLE 6
Financial assets and liabilities of households, NPIs and non-financial corporations (a)
% of GDP
2001
Q3 Q4 Q1
HOUSEHOLDS AND NPIs:
Financial transactions (assets) 10.3 9.7 8.4 2.7 1.6 2.2Cash and cash equivalents 3.3 4.4 0.8 0.6 -0.6 0.7Other deposits and fixed-income securities (b) -1.8 2.6 6.3 1.6 1.2 1.4Shares and other equity 5.3 -1.8 -3.3 -0.7 -0.1 -0.7Other 3.4 4.5 4.7 1.2 1.1 0.8
Financial transactions (liabilities) 6.9 8.0 8.0 2.3 1.8 1.2Credit from resident credit institutions 5.9 6.4 6.9 1.9 2.0 0.9Other 1.0 1.6 1.1 0.3 -0.1 0.4
NON-FINANCIAL CORPORATIONS:
Financial transactions (assets) 14.2 18.5 27.8 10.1 6.8 3.4Cash and cash equivalents 1.5 0.7 0.8 0.3 -0.2 -0.1Other deposits and fixed-income securities (b) 0.3 -0.1 0.8 0.7 -0.8 0.7Shares and other equity 3.0 8.6 14.2 4.9 5.0 0.6Other 9.5 9.3 12.0 4.2 2.7 2.1
Financial transactions (liabilities) 15.5 20.8 31.1 11.6 6.8 4.4Credit from resident credit institutions 4.6 4.8 6.7 1.9 1.1 0.7Foreign loans, fixed-income securities and
securitisation funds (b) 1.8 4.0 3.9 2.0 0.4 1.4Other 9.1 11.9 20.5 7.8 5.4 2.2
MEMORANDUM ITEM: YEAR-ON-YEAR GROWTH RATES (%):
Liquid financial assets 3.7 1.4 2.6 2.6 4.6Households and NPIs 4.0 0.7 0.8 1.1 4.2Non-financial corporations 2.5 5.8 12.6 10.6 6.4
Financing (c) 16.7 19.4 19.9 18.8 17.2Households and NPIs 19.3 19.6 17.5 17.3 15.3Non-financial corporations 14.7 19.3 21.7 20.0 18.6
1998 1999 20002000
Source: Banco de España. (a) Seasonally adjusted data. Annual GDP has been used to obtain the figures as a % of GDP. (b) Not including unpaid accrued interest, which is included under "Other". (c) Including bank credit extended by resident credit institutions, foreign loans, fixed-income securities and financing thorugh securitisation funds.
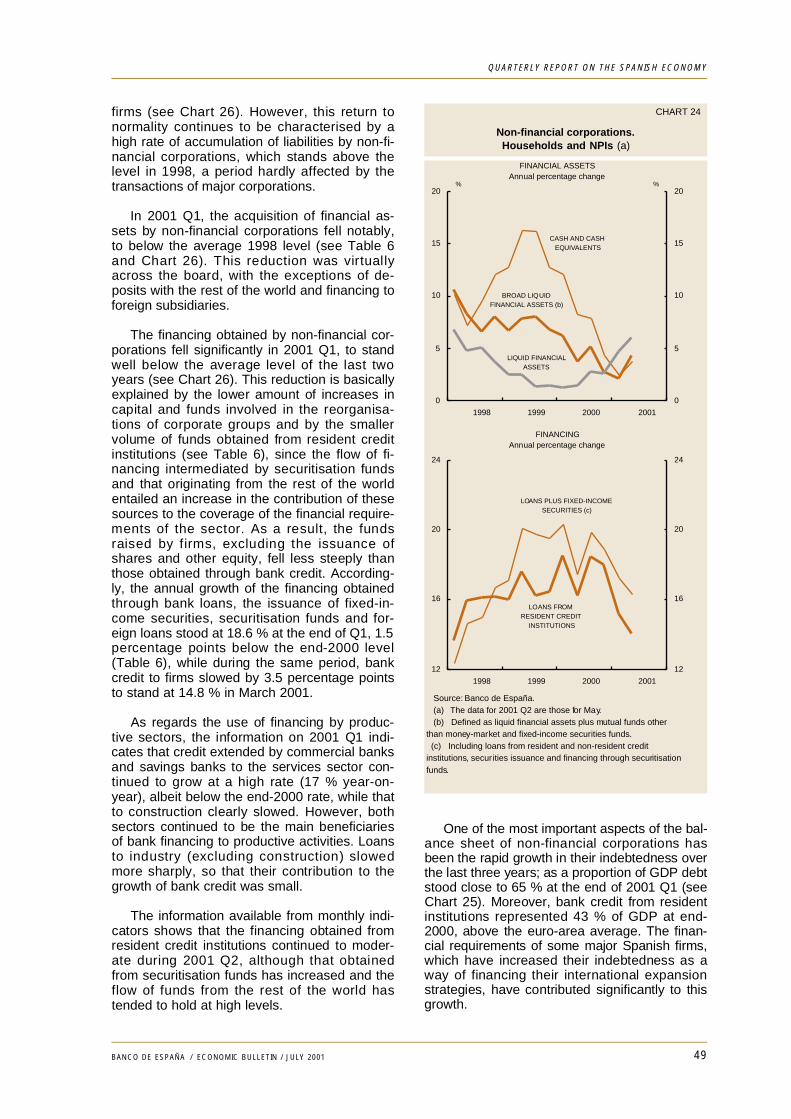
firms (see Chart 26). However, this return tonormality continues to be characterised by ahigh rate of accumulation of liabilities by non-fi-nancial corporations, which stands above thelevel in 1998, a period hardly affected by thetransactions of major corporations.
In 2001 Q1, the acquisition of financial as-sets by non-financial corporations fell notably,to below the average 1998 level (see Table 6and Chart 26). This reduction was virtuallyacross the board, with the exceptions of de-posits with the rest of the world and financing toforeign subsidiaries.
The financing obtained by non-financial cor-porations fell significantly in 2001 Q1, to standwell below the average level of the last twoyears (see Chart 26). This reduction is basicallyexplained by the lower amount of increases incapital and funds involved in the reorganisa-tions of corporate groups and by the smallervolume of funds obtained from resident creditinstitutions (see Table 6), since the flow of fi-nancing intermediated by securitisation fundsand that originating from the rest of the worldentailed an increase in the contribution of thesesources to the coverage of the financial require-ments of the sector. As a result, the fundsraised by firms, excluding the issuance ofshares and other equity, fell less steeply thanthose obtained through bank credit. According-ly, the annual growth of the financing obtainedthrough bank loans, the issuance of fixed-in-come securities, securitisation funds and for-eign loans stood at 18.6 % at the end of Q1, 1.5percentage points below the end-2000 level(Table 6), while during the same period, bankcredit to firms slowed by 3.5 percentage pointsto stand at 14.8 % in March 2001.
As regards the use of financing by produc-tive sectors, the information on 2001 Q1 indi-cates that credit extended by commercial banksand savings banks to the services sector con-tinued to grow at a high rate (17 % year-on-year), albeit below the end-2000 rate, while thatto construction clearly slowed. However, bothsectors continued to be the main beneficiariesof bank financing to productive activities. Loansto industry (excluding construction) slowedmore sharply, so that their contribution to thegrowth of bank credit was small.
The information available from monthly indi-cators shows that the financing obtained fromresident credit institutions continued to moder-ate during 2001 Q2, although that obtainedfrom securitisation funds has increased and theflow of funds from the rest of the world hastended to hold at high levels.
One of the most important aspects of the bal-ance sheet of non-financial corporations hasbeen the rapid growth in their indebtedness overthe last three years; as a proportion of GDP debtstood close to 65 % at the end of 2001 Q1 (seeChart 25). Moreover, bank credit from residentinstitutions represented 43 % of GDP at end-2000, above the euro-area average. The finan-cial requirements of some major Spanish firms,which have increased their indebtedness as away of financing their international expansionstrategies, have contributed significantly to thisg r o w t h .
49BANCO DE ESPAÑA / ECONOMIC BULLETIN / JULY 2001
QUARTERLY REPORT ON THE SPANISH ECONOMY
CHART 24
Non-financial corporations.Households and NPIs (a)
0
5
10
15
20
1998 1999 2000 2001
0
5
10
15
20
FINANCIAL ASSETSAnnual percentage change
%
BROAD LIQUIDFINANCIAL ASSETS (b)
CASH AND CASHEQUIVALENTS
LIQUID FINANCIALASSETS
%
12
16
20
24
1998 1999 2000 2001
12
16
20
24
FINANCINGAnnual percentage change
LOANS FROMRESIDENT CREDIT
INSTITUTIONS
LOANS PLUS FIXED-INCOMESECURITIES (c)
Source: Banco de España. (a) The data for 2001 Q2 are those for May. (b) Defined as liquid financial assets plus mutual funds otherthan money-market and fixed-income securities funds. (c) Including loans from resident and non-resident creditinstitutions, securities issuance and financing through securitisationfunds.
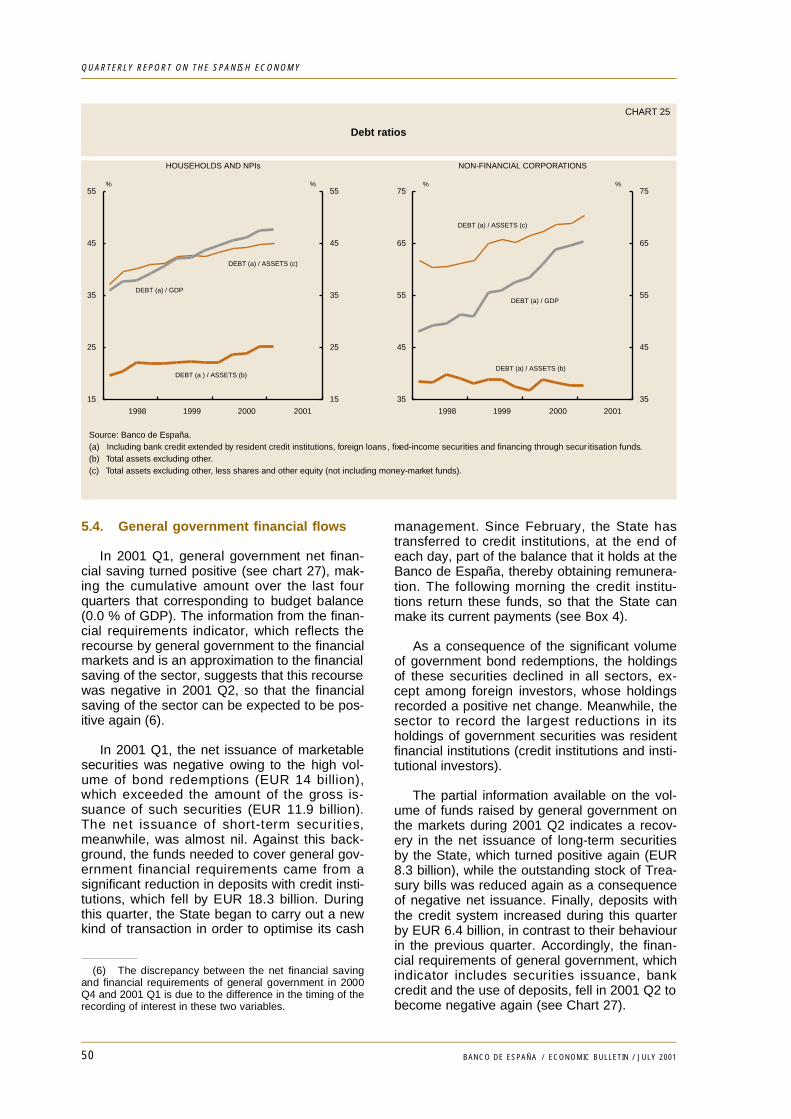
50 BANCO DE ESPAÑA / ECONOMIC BULLETIN / JULY 2001
QUARTERLY REPORT ON THE SPANISH ECONOMY
5.4. General government financial flows
In 2001 Q1, general government net finan-cial saving turned positive (see chart 27), mak-ing the cumulative amount over the last fourquarters that corresponding to budget balance(0.0 % of GDP). The information from the finan-cial requirements indicator, which reflects therecourse by general government to the financialmarkets and is an approximation to the financialsaving of the sector, suggests that this recoursewas negative in 2001 Q2, so that the financialsaving of the sector can be expected to be pos-itive again (6).
In 2001 Q1, the net issuance of marketablesecurities was negative owing to the high vol-ume of bond redemptions (EUR 14 billion),which exceeded the amount of the gross is-suance of such securities (EUR 11.9 billion).The net issuance of short-term securities,meanwhile, was almost nil. Against this back-ground, the funds needed to cover general gov-ernment financial requirements came from asignificant reduction in deposits with credit insti-tutions, which fell by EUR 18.3 billion. Duringthis quarter, the State began to carry out a newkind of transaction in order to optimise its cash
management. Since February, the State hastransferred to credit institutions, at the end ofeach day, part of the balance that it holds at theBanco de España, thereby obtaining remunera-tion. The following morning the credit institu-tions return these funds, so that the State canmake its current payments (see Box 4).
As a consequence of the significant volumeof government bond redemptions, the holdingsof these securities declined in all sectors, ex-cept among foreign investors, whose holdingsrecorded a positive net change. Meanwhile, thesector to record the largest reductions in itsholdings of government securities was residentfinancial institutions (credit institutions and insti-tutional investors).
The partial information available on the vol-ume of funds raised by general government onthe markets during 2001 Q2 indicates a recov-ery in the net issuance of long-term securitiesby the State, which turned positive again (EUR8.3 billion), while the outstanding stock of Trea-sury bills was reduced again as a consequenceof negative net issuance. Finally, deposits withthe credit system increased during this quarterby EUR 6.4 billion, in contrast to their behaviourin the previous quarter. Accordingly, the finan-cial requirements of general government, whichindicator includes securities issuance, bankcredit and the use of deposits, fell in 2001 Q2 tobecome negative again (see Chart 27).
CHART 25
Debt ratios
Source: Banco de España. (a) Including bank credit extended by resident credit institutions, foreign loans, fixed-income securities and financing through secur itisation funds. (b) Total assets excluding other. (c) Total assets excluding other, less shares and other equity (not including money-market funds).
15
25
35
45
55
1998 1999 2000 2001
15
25
35
45
55
HOUSEHOLDS AND NPIs
% %
DEBT (a) / ASSETS (c)
DEBT (a ) / ASSETS (b)
DEBT (a) / GDP
35
45
55
65
75
1998 1999 2000 2001
35
45
55
65
75
NON-FINANCIAL CORPORATIONS
%
DEBT (a) / ASSETS (b)
DEBT (a) / ASSETS (c)
DEBT (a) / GDP
%
( 6 ) The discrepancy between the net financial savingand financial requirements of general government in 2000Q4 and 2001 Q1 is due to the difference in the timing of therecording of interest in these two variables.
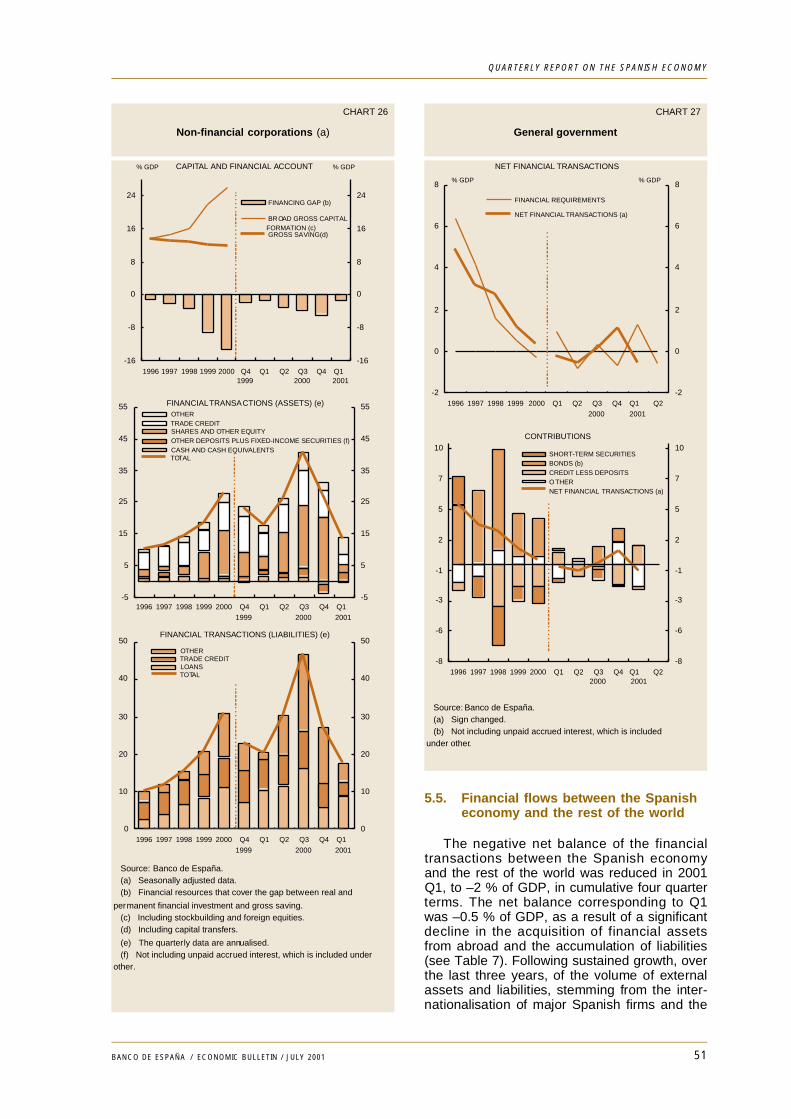
5.5. Financial flows between the Spanisheconomy and the rest of the world
The negative net balance of the financialtransactions between the Spanish economyand the rest of the world was reduced in 2001Q1, to –2 % of GDP, in cumulative four quarterterms. The net balance corresponding to Q1was –0.5 % of GDP, as a result of a significantdecline in the acquisition of financial assetsfrom abroad and the accumulation of liabilities(see Table 7). Following sustained growth, overthe last three years, of the volume of externalassets and liabilities, stemming from the inter-nationalisation of major Spanish firms and the
51BANCO DE ESPAÑA / ECONOMIC BULLETIN / JULY 2001
QUARTERLY REPORT ON THE SPANISH ECONOMY
CHART 26
Non-financial corporations (a)
Source: Banco de España. (a) Seasonally adjusted data. (b) Financial resources that cover the gap between real and
permanent financial investment and gross saving. (c) Including stockbuilding and foreign equities. (d) Including capital transfers.
(e) The quarterly data are annualised. (f) Not including unpaid accrued interest, which is included underother.
-5
5
15
25
35
45
55
1996 1997 1998 1999 2000 Q4
1999
Q1 Q2 Q3
2000
Q4 Q1
2001
-5
5
15
25
35
45
55 OTHER TRADE CREDIT SHARES AND OTHER EQUITY OTHER DEPOSITS PLUS FIXED-INCOME SECURITIES (f) CASH AND CASH EQUIVALENTS TOTAL
FINANCIAL TRANSACTIONS (ASSETS) (e)
0
10
20
30
40
50
1996 1997 1998 1999 2000 Q4
1999
Q1 Q2 Q3
2000
Q4 Q1
2001
0
10
20
30
40
50 OTHER TRADE CREDIT LOANS TOTAL
FINANCIAL TRANSACTIONS (LIABILITIES) (e)
-16
-8
0
8
16
24
1996 1997 1998 1999 2000 Q41999
Q1 Q2 Q32000
Q4 Q12001
-16
-8
0
8
16
24 FINANCING GAP (b)
BROAD GROSS CAPITALFORMATION (c) GROSS SAVING(d)
% GDP % GDPCAPITAL AND FINANCIAL ACCOUNT
CHART 27
General government
Source: Banco de España. (a) Sign changed. (b) Not including unpaid accrued interest, which is includedunder other.
-2
0
2
4
6
8
1996 1997 1998 1999 2000 Q1 Q2 Q3
2000
Q4 Q1
2001
Q2
-2
0
2
4
6
8
FINANCIAL REQUIREMENTS
NET FINANCIAL TRANSACTIONS (a)
NET FINANCIAL TRANSACTIONS
% GDP % GDP
-8
-6
-3
-1
2
5
7
10
1996 1997 1998 1999 2000 Q1 Q2 Q32000
Q4 Q12001
Q2
-8
-6
-3
-1
2
5
7
10 SHORT-TERM SECURITIES BONDS (b) CREDIT LESS DEPOSITS OTHER NET FINANCIAL TRANSACTIONS (a)
CONTRIBUTIONS
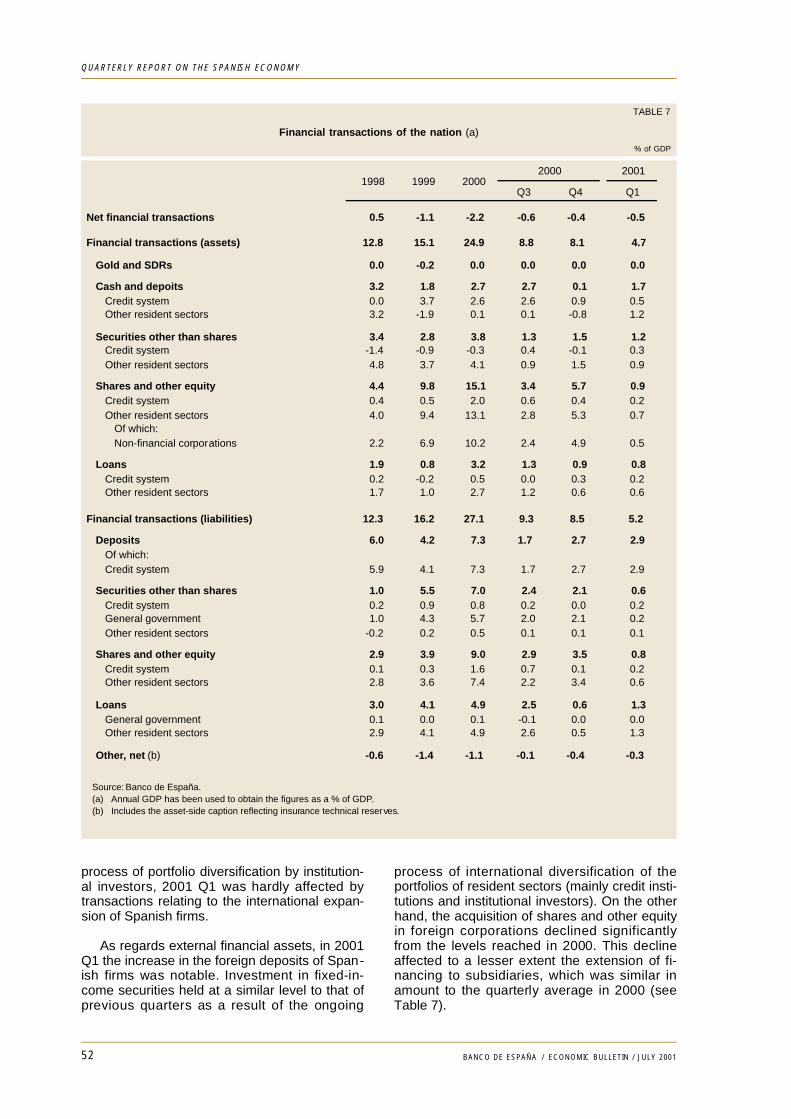
52 BANCO DE ESPAÑA / ECONOMIC BULLETIN / JULY 2001
QUARTERLY REPORT ON THE SPANISH ECONOMY
process of portfolio diversification by institution-al investors, 2001 Q1 was hardly affected bytransactions relating to the international expan-sion of Spanish firms.
As regards external financial assets, in 2001Q1 the increase in the foreign deposits of Span-ish firms was notable. Investment in fixed-in-come securities held at a similar level to that ofprevious quarters as a result of the ongoing
process of international diversification of theportfolios of resident sectors (mainly credit insti-tutions and institutional investors). On the otherhand, the acquisition of shares and other equityin foreign corporations declined significantlyfrom the levels reached in 2000. This declineaffected to a lesser extent the extension of fi-nancing to subsidiaries, which was similar inamount to the quarterly average in 2000 (seeTable 7).
TABLE 7
Financial transactions of the nation (a)
% of GDP
2001
Q3 Q4 Q1
Net financial transactions 0.5 -1.1 -2.2 -0.6 -0.4 -0.5
Financial transactions (assets) 12.8 15.1 24.9 8.8 8.1 4.7
Gold and SDRs 0.0 -0.2 0.0 0.0 0.0 0.0
Cash and depoits 3.2 1.8 2.7 2.7 0.1 1.7Credit system 0.0 3.7 2.6 2.6 0.9 0.5Other resident sectors 3.2 -1.9 0.1 0.1 -0.8 1.2
Securities other than shares 3.4 2.8 3.8 1.3 1.5 1.2Credit system -1.4 -0.9 -0.3 0.4 -0.1 0.3Other resident sectors 4.8 3.7 4.1 0.9 1.5 0.9
Shares and other equity 4.4 9.8 15.1 3.4 5.7 0.9Credit system 0.4 0.5 2.0 0.6 0.4 0.2Other resident sectors 4.0 9.4 13.1 2.8 5.3 0.7
Of which:Non-financial corporations 2.2 6.9 10.2 2.4 4.9 0.5
Loans 1.9 0.8 3.2 1.3 0.9 0.8Credit system 0.2 -0.2 0.5 0.0 0.3 0.2Other resident sectors 1.7 1.0 2.7 1.2 0.6 0.6
Financial transactions (liabilities) 12.3 16.2 27.1 9.3 8.5 5.2
Deposits 6.0 4.2 7.3 1.7 2.7 2.9Of which:Credit system 5.9 4.1 7.3 1.7 2.7 2.9
Securities other than shares 1.0 5.5 7.0 2.4 2.1 0.6Credit system 0.2 0.9 0.8 0.2 0.0 0.2General government 1.0 4.3 5.7 2.0 2.1 0.2Other resident sectors -0.2 0.2 0.5 0.1 0.1 0.1
Shares and other equity 2.9 3.9 9.0 2.9 3.5 0.8Credit system 0.1 0.3 1.6 0.7 0.1 0.2Other resident sectors 2.8 3.6 7.4 2.2 3.4 0.6
Loans 3.0 4.1 4.9 2.5 0.6 1.3General government 0.1 0.0 0.1 -0.1 0.0 0.0Other resident sectors 2.9 4.1 4.9 2.6 0.5 1.3
Other, net (b) -0.6 -1.4 -1.1 -0.1 -0.4 -0.3
1998 1999 20002000
Source: Banco de España. (a) Annual GDP has been used to obtain the figures as a % of GDP. (b) Includes the asset-side caption reflecting insurance technical reserves.
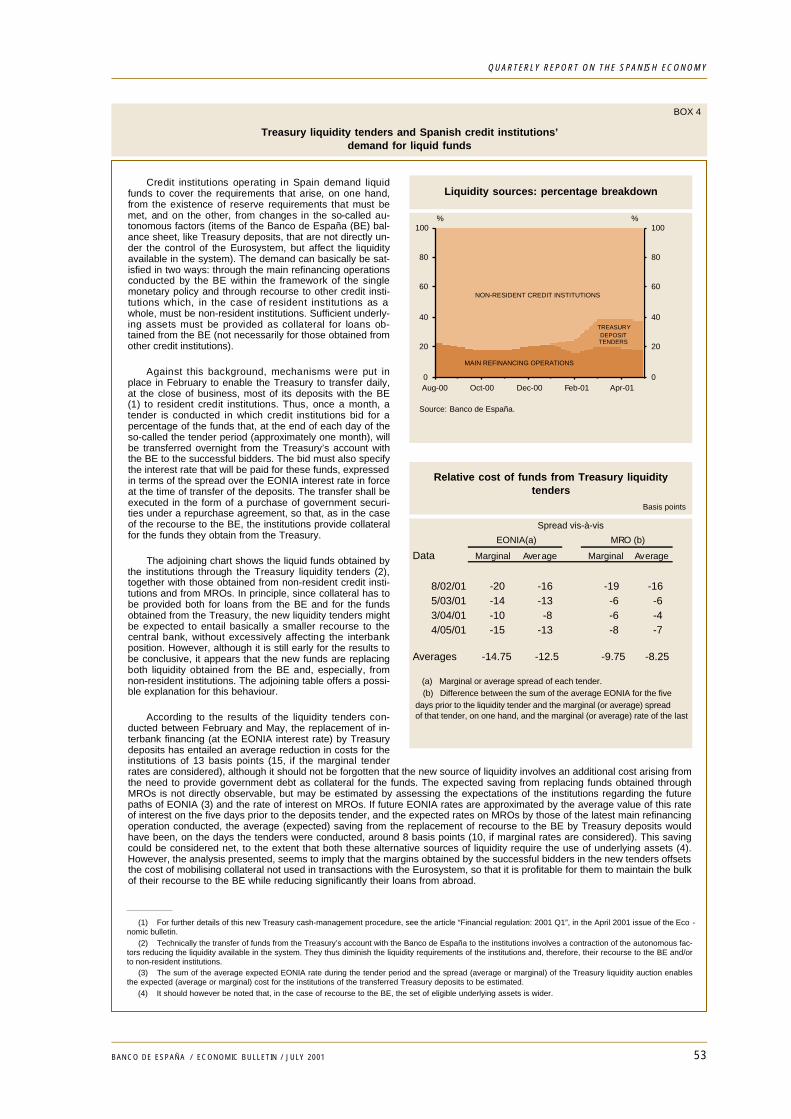
53BANCO DE ESPAÑA / ECONOMIC BULLETIN / JULY 2001
QUARTERLY REPORT ON THE SPANISH ECONOMY
BOX 4
Treasury liquidity tenders and Spanish credit institutions’demand for liquid funds
Credit institutions operating in Spain demand liquidfunds to cover the requirements that arise, on one hand,from the existence of reserve requirements that must bemet, and on the other, from changes in the so-called au-tonomous factors (items of the Banco de España (BE) bal-ance sheet, like Treasury deposits, that are not directly un-der the control of the Eurosystem, but affect the liquidityavailable in the system). The demand can basically be sat-isfied in two ways: through the main refinancing operationsconducted by the BE within the framework of the singlemonetary policy and through recourse to other credit insti-tutions which, in the case of resident institutions as awhole, must be non-resident institutions. Sufficient underly-ing assets must be provided as collateral for loans ob-tained from the BE (not necessarily for those obtained fromother credit institutions).
Against this background, mechanisms were put inplace in February to enable the Treasury to transfer daily,at the close of business, most of its deposits with the BE(1) to resident credit institutions. Thus, once a month, atender is conducted in which credit institutions bid for apercentage of the funds that, at the end of each day of theso-called the tender period (approximately one month), willbe transferred overnight from the Treasury’s account withthe BE to the successful bidders. The bid must also specifythe interest rate that will be paid for these funds, expressedin terms of the spread over the EONIA interest rate in forceat the time of transfer of the deposits. The transfer shall beexecuted in the form of a purchase of government securi-ties under a repurchase agreement, so that, as in the caseof the recourse to the BE, the institutions provide collateralfor the funds they obtain from the Treasury.
The adjoining chart shows the liquid funds obtained bythe institutions through the Treasury liquidity tenders (2),together with those obtained from non-resident credit insti-tutions and from MROs. In principle, since collateral has tobe provided both for loans from the BE and for the fundsobtained from the Treasury, the new liquidity tenders mightbe expected to entail basically a smaller recourse to thecentral bank, without excessively affecting the interbankposition. However, although it is still early for the results tobe conclusive, it appears that the new funds are replacingboth liquidity obtained from the BE and, especially, fromnon-resident institutions. The adjoining table offers a possi-ble explanation for this behaviour.
According to the results of the liquidity tenders con-ducted between February and May, the replacement of in-terbank financing (at the EONIA interest rate) by Treasurydeposits has entailed an average reduction in costs for theinstitutions of 13 basis points (15, if the marginal tenderrates are considered), although it should not be forgotten that the new source of liquidity involves an additional cost arising fromthe need to provide government debt as collateral for the funds. The expected saving from replacing funds obtained throughMROs is not directly observable, but may be estimated by assessing the expectations of the institutions regarding the futurepaths of EONIA (3) and the rate of interest on MROs. If future EONIA rates are approximated by the average value of this rateof interest on the five days prior to the deposits tender, and the expected rates on MROs by those of the latest main refinancingoperation conducted, the average (expected) saving from the replacement of recourse to the BE by Treasury deposits wouldhave been, on the days the tenders were conducted, around 8 basis points (10, if marginal rates are considered). This savingcould be considered net, to the extent that both these alternative sources of liquidity require the use of underlying assets (4).However, the analysis presented, seems to imply that the margins obtained by the successful bidders in the new tenders offsetsthe cost of mobilising collateral not used in transactions with the Eurosystem, so that it is profitable for them to maintain the bulkof their recourse to the BE while reducing significantly their loans from abroad.
Liquidity sources: percentage breakdown
0
20
40
60
80
100
Aug-00 Oct-00 Dec-00 Feb-01 Apr-010
20
40
60
80
100% %
MAIN REFINANCING OPERATIONS
TREASURYDEPOSITTENDERS
NON-RESIDENT CREDIT INSTITUTIONS
Source: Banco de España.
Relative cost of funds from Treasury liquiditytenders
Basis points
Data Marginal Average Marginal Average
8/02/01 -20 -16 -19 -165/03/01 -14 -13 -6 -63/04/01 -10 -8 -6 -44/05/01 -15 -13 -8 -7
Averages -14.75 -12.5 -9.75 -8.25
EONIA(a) MRO (b)
Spread vis-à-vis
(a) Marginal or average spread of each tender. (b) Difference between the sum of the average EONIA for the fivedays prior to the liquidity tender and the marginal (or average) spreadof that tender, on one hand, and the marginal (or average) rate of the last MR
(1) For further details of this new Treasury cash-management procedure, see the article “Financial regulation: 2001 Q1”, in the April 2001 issue of the Eco -nomic bulletin.
(2) Technically the transfer of funds from the Treasury’s account with the Banco de España to the institutions involves a contraction of the autonomous fac-tors reducing the liquidity available in the system. They thus diminish the liquidity requirements of the institutions and, therefore, their recourse to the BE and/orto non-resident institutions.
(3) The sum of the average expected EONIA rate during the tender period and the spread (average or marginal) of the Treasury liquidity auction enablesthe expected (average or marginal) cost for the institutions of the transferred Treasury deposits to be estimated.
(4) It should however be noted that, in the case of recourse to the BE, the set of eligible underlying assets is wider.
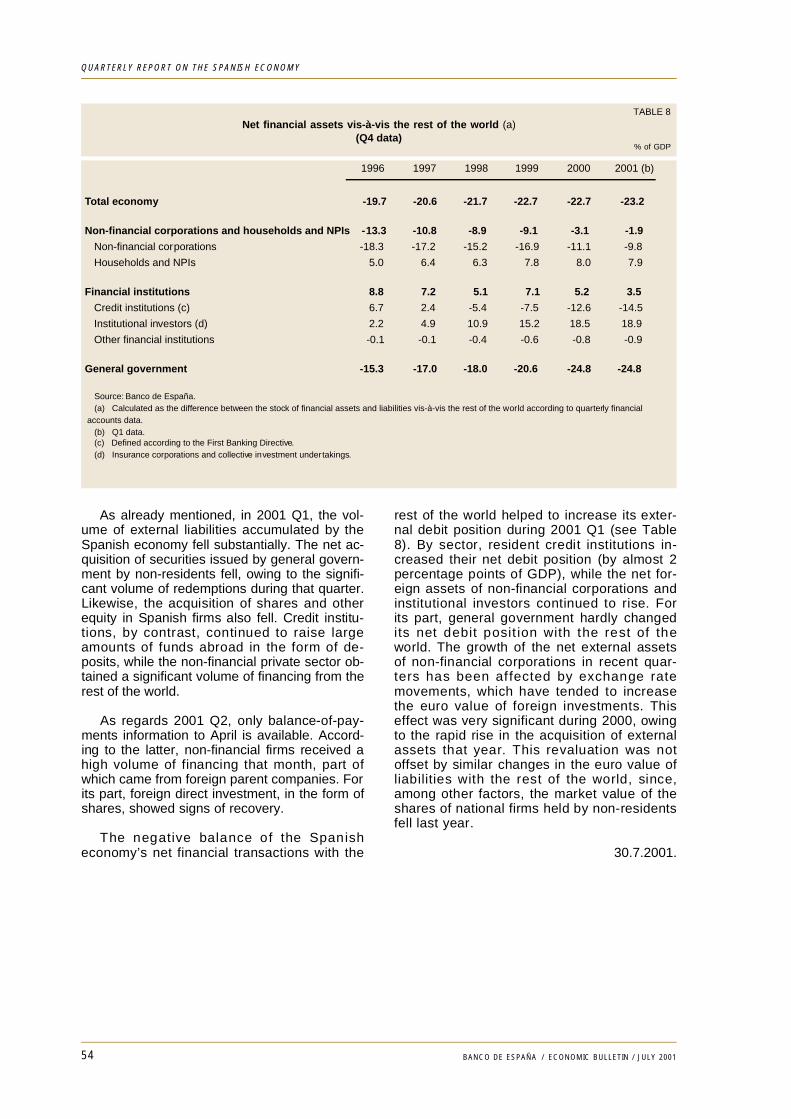
54 BANCO DE ESPAÑA / ECONOMIC BULLETIN / JULY 2001
QUARTERLY REPORT ON THE SPANISH ECONOMY
As already mentioned, in 2001 Q1, the vol-ume of external liabilities accumulated by theSpanish economy fell substantially. The net ac-quisition of securities issued by general govern-ment by non-residents fell, owing to the signifi-cant volume of redemptions during that quarter.Likewise, the acquisition of shares and otherequity in Spanish firms also fell. Credit institu-tions, by contrast, continued to raise largeamounts of funds abroad in the form of de-posits, while the non-financial private sector ob-tained a significant volume of financing from therest of the world.
As regards 2001 Q2, only balance-of-pay-ments information to April is available. Accord-ing to the latter, non-financial firms received ahigh volume of financing that month, part ofwhich came from foreign parent companies. Forits part, foreign direct investment, in the form ofshares, showed signs of recovery.
The negative balance of the Spanisheconomy’s net financial transactions with the
rest of the world helped to increase its exter-nal debit position during 2001 Q1 (see Table8). By sector, resident credit institutions in-creased their net debit position (by almost 2percentage points of GDP), while the net for-eign assets of non-financial corporations andinstitutional investors continued to rise. Forits part, general government hardly changedits net debit posit ion with the rest of theworld. The growth of the net external assetsof non-financial corporations in recent quar-ters has been af fected by exchange ratemovements, which have tended to increasethe euro value of foreign investments. Thiseffect was very significant during 2000, owingto the rapid rise in the acquisition of externalassets that year. This revaluation was notoffset by similar changes in the euro value ofliabilities with the rest of the world, since,among other factors, the market value of theshares of national firms held by non-residentsfell last year.
30.7.2001.
TABLE 8Net financial assets vis-à-vis the rest of the world (a)
(Q4 data)% of GDP
1996 1997 1998 1999 2000 2001 (b)
Total economy -19.7 -20.6 -21.7 -22.7 -22.7 -23.2
Non-financial corporations and households and NPIs - 13.3 -10.8 -8.9 -9.1 -3.1 -1.9
Non-financial corporations -18.3 -17.2 -15.2 -16.9 -11.1 -9.8
Households and NPIs 5.0 6.4 6.3 7.8 8.0 7.9
Financial institutions 8.8 7.2 5.1 7.1 5.2 3.5
Credit institutions (c) 6.7 2.4 -5.4 -7.5 -12.6 -14.5
Institutional investors (d) 2.2 4.9 10.9 15.2 18.5 18.9
Other financial institutions -0.1 -0.1 -0.4 -0.6 -0.8 -0.9
General government -15.3 -17.0 -18.0 -20.6 -24.8 -24.8
Source: Banco de España. (a) Calculated as the difference between the stock of financial assets and liabilities vis-à-vis the rest of the world according to quarterly financialaccounts data. (b) Q1 data. (c) Defined according to the First Banking Directive. (d) Insurance corporations and collective investment undertakings.