Embed Size (px)
Citation preview

[Translation]
Quarterly Report
(The Third Quarter of 149th Business Term)
From October 1, 2017 to December 31, 2017
6-6, Marunouchi 1-chome, Chiyoda-ku, Tokyo
Hitachi, Ltd.

[Cover]
[Document Filed] Quarterly Report (“Shihanki Hokokusho”)
[Applicable Law] Article 24-4-7, Paragraph 1 of the Financial Instruments and Exchange Act of Japan
[Filed with] Director, Kanto Local Finance Bureau
[Filing Date] February 7 , 2018
[Fiscal Year] The Third Quarter of 149th Business Term (from October 1, 2017 to December 31, 2017)
[Company Name] Kabushiki Kaisha Hitachi Seisakusho
[Company Name in English] Hitachi, Ltd.
[Title and Name of Representative] Toshiaki Higashihara, President & CEO
[Address of Head Office] 6-6, Marunouchi 1-chome, Chiyoda-ku, Tokyo
[Phone No.] 03-3258-1111
[Contact Person] Masachika Sawada, Manager, Legal Division
[Contact Address] 6-6, Marunouchi 1-chome, Chiyoda-ku, Tokyo
[Phone No.] 03-3258-1111
[Contact Person] Masachika Sawada, Manager, Legal Division
[Place Where Available for Public Inspection]
Tokyo Stock Exchange, Inc.
(2-1, Nihombashi Kabutocho, Chuo-ku, Tokyo)
Nagoya Stock Exchange, Inc.
(8-20, Sakae 3-chome, Naka-ku, Nagoya)
This is an English translation of the Quarterly Report filed with the Director of the Kanto Local Finance Bureau via Electronic Disclosure for Investors’ NETwork (“EDINET”) pursuant to the Financial Instruments and Exchange Act of Japan. The translation of the Confirmation Letter for the original Quarterly Report is included at the end of this document. Unless the context indicates otherwise, the term “Company” refers to Hitachi, Ltd. and the term “Hitachi” refers to the Company and its consolidated subsidiaries. Unless otherwise stated, in this document, where we present information in millions or hundreds of millions of yen, we have truncated amounts of less than one million or one hundred million, as the case may be. Accordingly, the total of figures presented in columns or otherwise may not equal the total of the individual items. We have rounded all percentages to the nearest percent, one-tenth of one percent or one-hundredth of one percent, as the case may be. References in this document to the “Financial Instruments and Exchange Act” are to the Financial Instruments and Exchange Act of Japan and other laws and regulations amending and/or supplementing the Financial Instruments and Exchange Act of Japan.
Contents
Part I Information on the Company ……………………………………………………………………………………………… 1
I. Overview of the Company …………………………………………………………………………………………………… 1 1. Key Financial Data ……………………………………………………………………………………………………… 1 2. Description of Business …………………………………………………………………………………………………… 1
II. Business Overview ………………………………………………………………………………………………………… 2 1. Risk Factors ……………………………………………………………………………………………………………… 2 2. Material Agreements, etc. ………………………………………………………………………………………………… 2 3. Analyses of Consolidated Financial Condition, Operating Results and Cash Flows …………………………………… 2
III. Information on the Company ……………………………………………………………………………………………… 8 1. Information on the Company’s Stock, etc. ……………………………………………………………………………… 8
(1) Total number of shares, etc. …………………………………………………………………………………………… 8 (2) Information on the stock acquisition rights, etc. ……………………………………………………………………… 8 (3) Information on moving strike convertible bonds, etc. ………………………………………………………………… 8 (4) Information on shareholder right plans ……………………………………………………………………………… 8 (5) Changes in the total number of issued shares and the amount of common stock and other ………………………… 8 (6) Major shareholders …………………………………………………………………………………………………… 8 (7) Information on voting rights ………………………………………………………………………………………… 9
2. Changes in Senior Management ………………………………………………………………………………………… 10 IV. Financial Information ……………………………………………………………………………………………………… 10
Part II Information on Guarantors, etc. for the Company ………………………………………………………………………… 10 [Condensed Quarterly Consolidated Financial Statements] ……………………………………………………………………… F1 [Confirmation Letter] ……………………………………………………………………………………………………………… A1

Part I Information on the Company I. Overview of the Company
1. Key Financial Data Consolidated financial data, etc.
(Millions of yen, unless otherwise stated)
Nine months ended December 31, 2016
Nine months ended December 31, 2017
Year ended March 31, 2017
Revenues 6,519,311 6,674,028
9,162,264 [2,165,537] [2,297,561]
Income from continuing operations, before income taxes
356,963 468,152 469,091
Net income attributable to Hitachi, Ltd. stockholders
191,264 258,582 231,261
[77,764] [97,969] Comprehensive income attributable to Hitachi, Ltd. stockholders
208,520 324,628 299,397
Total Hitachi, Ltd. stockholders’ equity 2,884,773 3,220,508 2,967,085
Total equity 4,066,913 4,449,438 4,096,995
Total assets 9,640,179 10,196,152 9,663,917
Earnings per share attributable to Hitachi, Ltd. stockholders, basic (yen)
39.61 53.56 47.90
[16.11] [20.29] Earnings per share attributable to Hitachi, Ltd. stockholders, diluted (yen)
39.60 53.51 47.88
Total Hitachi, Ltd. stockholders’ equity ratio (%) 29.9 31.6 30.7
Net cash provided by operating activities 379,177 473,210 629,582
Net cash used in investing activities (200,648) (314,238) (337,955)
Net cash provided by (used in) financing activities
(112,026) (142,413) (209,536)
Cash and cash equivalents at end of period 763,416 811,324 765,242
(Notes) 1. Hitachi's consolidated financial statements have been prepared in conformity with the International Financial Reporting Standards (“IFRS”) as issued by the International Accounting Standards Board.
2. Revenues do not include the consumption tax, etc. 3. The figures of “Revenues,” “Net income attributable to Hitachi, Ltd. stockholders” and “Earnings per share attributable
to Hitachi, Ltd. stockholders, basic” in square bracket are those for the three months ended December 31, 2016 and 2017, respectively.
2. Description of Business There were no material changes in principal businesses of Hitachi during the nine months ended December 31, 2017. The Hitachi Group is comprised of the Company, 885 consolidated subsidiaries, and 398 equity-method associates and joint-ventures. Changes in principal affiliated companies during the nine months ended December 31, 2017 were as follows.
Main products and services Positioning of principal affiliated companies
Manufacturing Sales and services Information & Telecommunication Systems
[Consolidated subsidiaries] (Change in company name) Hitachi Vantara Corporation
Social Infrastructure & Industrial Systems
[Consolidated subsidiaries] (New) Sullair US Purchaser, Inc.
(Notes) 1. Hitachi Data Systems Corporation changed its name to Hitachi Vantara Corporation as of September 26, 2017. 2. Sullair US Purchaser, Inc. has become a consolidated subsidiary of the Company on July 12, 2017 as Hitachi America,
Ltd., a consolidated subsidiary of the Company, acquired Sullair US Purchaser, Inc., which is the holding company of companies that manufacture and sell air compressors with the “Sullair” brand.
1

II. Business Overview 1. Risk Factors
There were no new risk factors recognized during the nine months ended December 31, 2017. There were no material changes in the risk factors stated in the Annual Securities Report for the 148th business term pursuant to the Financial Instruments and Exchange Act of Japan.
2. Material Agreements, etc.
No material agreements were entered into during the three months ended December 31, 2017. The material agreement renewed after the end of three months ended December 31, 2017 until the filing date is as follows. Cross License Agreement
Party Party Country Item under contract
Contract description Contract period
Hitachi, Ltd. (The Company)
International Business Machines Corp. U.S.A.
Information handling systems
Cross license of patents
From January 1, 2008 to the expiration of patents applied on or before January 1, 2023
3. Analyses of Consolidated Financial Condition, Operating Results and Cash Flows
(1) Outline of Business Results Results of Operations During the nine months ended December 31, 2017, the global economy expanded at a moderate pace. In the U.S., consumer spending and capital investment remained firm. In Europe, mainly in Germany, the economy continued to recover slowly. In China, increases in infrastructure spending and consumer spending underpinned economic growth. The Japanese economy has continued its moderate recovery trend, reflecting firm consumer spending due to improving employment and income and upward trend in capital investment.
Under these conditions, results of operations in the nine months ended December 31, 2017 were as follows. Revenues increased 2% to ¥6,674.0 billion, as compared with the nine months ended December 31, 2016, due mainly to higher revenues in the Construction Machinery segment, in which overseas sales has increased mainly in China, and in the High Functional Materials & Components segment, in which sales of the electronics- and automotive-related products has increased. The increase was partially offset by the effect of the move to transform business portfolio such as conversion of Hitachi Capital Corporation and Hitachi Transport System, Ltd. to equity-method associates and deconsolidation of Hitachi Koki Co., Ltd. in the year ended March 31, 2017. Cost of sales increased 2% to ¥4,896.9 billion, as compared with the nine months ended December 31, 2016, and the ratio of cost of sales to revenues decreased 1% to 73%. Gross profit increased 4% to ¥1,777.0 billion, as compared with the nine months ended December 31, 2016. Selling, general and administrative expenses (“SG&A”) decreased 2% to ¥1,302.5 billion, as compared with the nine months ended December 31, 2016, and the ratio of SG&A to revenues was 20%, which was the same level as the nine months ended December 31, 2016. Other income decreased ¥37.4 billion to ¥4.6 billion, as compared with the nine months ended December 31, 2016, due mainly to the absence of net gain on business reorganization and others related to the sale of a part of shares of Hitachi Transport System, Ltd. recorded in the nine months ended December 31, 2016. Other expenses decreased ¥16.6 billion to ¥52.6 billion, as compared with the nine months ended December 31, 2016, due mainly to a decrease in restructuring charges (structural reform expenses). Financial income (excluding interest income) increased ¥1.3 billion to ¥7.1 billion and financial expenses (excluding interest charges) decreased ¥17.4 billion to ¥6.3 billion, as compared with the nine months ended December 31, 2016, respectively. Share of profits of investments accounted for using the equity method increased ¥11.3 billion to ¥45.4 billion, as compared with the nine months ended December 31, 2016. EBIT (earnings before interest and taxes, which is presented as income from continuing operations, before income taxes less interest income plus interest charges) increased ¥110.7 billion to ¥472.8 billion, as compared with the nine months ended December 31, 2016. Interest income increased ¥1.1 billion to ¥10.8 billion and interest charges increased ¥0.8 billion to ¥15.5 billion, as compared with the nine months ended December 31, 2016. Income from continuing operations, before income taxes increased ¥111.1 billion to ¥468.1 billion, as compared with the nine months ended December 31, 2016. Income taxes increased ¥29.6 billion to ¥116.4 billion, as compared with the nine months ended December 31, 2016. Income from discontinued operations was ¥98 million, as compared with the loss of ¥0.8 billion for the nine months ended December 31, 2016. Net income increased ¥82.5 billion to ¥351.7 billion, as compared with the nine months ended December 31, 2016. Net income attributable to non-controlling interests increased ¥15.2 billion to ¥93.2 billion, as compared with the nine months ended December 31, 2016. As a result of the foregoing, net income attributable to Hitachi, Ltd. stockholders increased ¥67.3 billion to ¥258.5 billion, as compared with the nine months ended December 31, 2016.
2
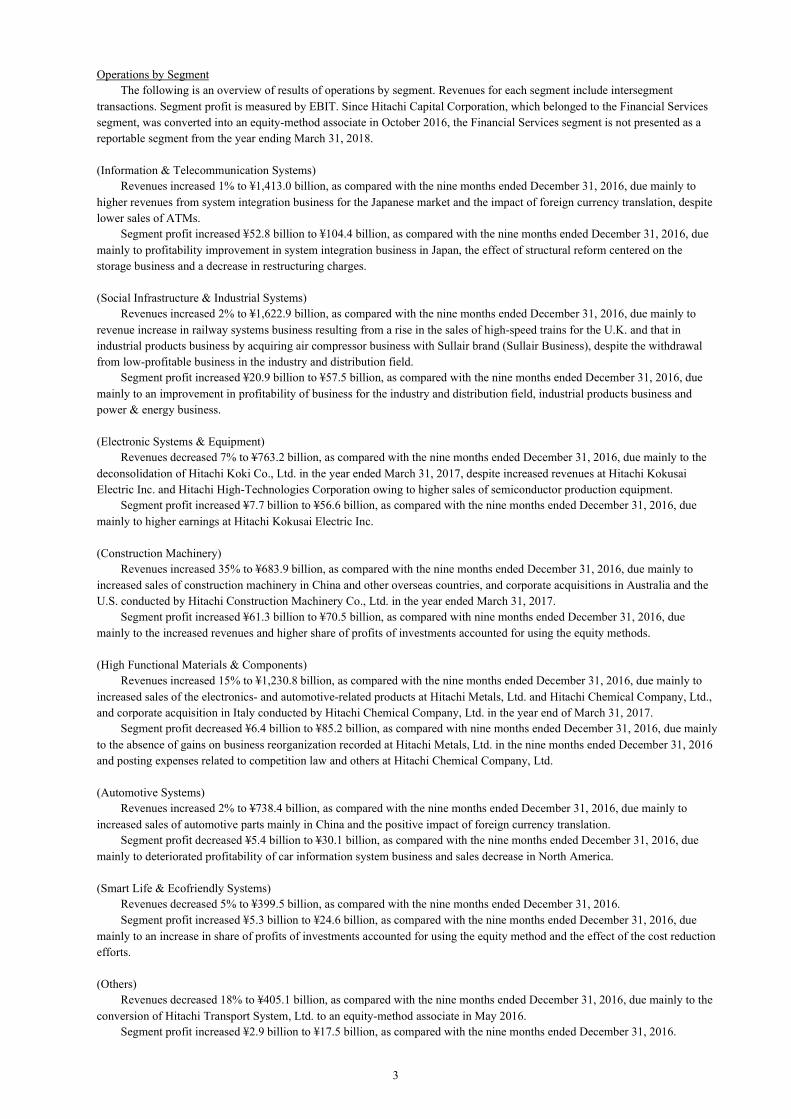
Operations by Segment The following is an overview of results of operations by segment. Revenues for each segment include intersegment transactions. Segment profit is measured by EBIT. Since Hitachi Capital Corporation, which belonged to the Financial Services segment, was converted into an equity-method associate in October 2016, the Financial Services segment is not presented as a reportable segment from the year ending March 31, 2018.
(Information & Telecommunication Systems) Revenues increased 1% to ¥1,413.0 billion, as compared with the nine months ended December 31, 2016, due mainly to higher revenues from system integration business for the Japanese market and the impact of foreign currency translation, despite lower sales of ATMs. Segment profit increased ¥52.8 billion to ¥104.4 billion, as compared with the nine months ended December 31, 2016, due mainly to profitability improvement in system integration business in Japan, the effect of structural reform centered on the storage business and a decrease in restructuring charges. (Social Infrastructure & Industrial Systems) Revenues increased 2% to ¥1,622.9 billion, as compared with the nine months ended December 31, 2016, due mainly to revenue increase in railway systems business resulting from a rise in the sales of high-speed trains for the U.K. and that in industrial products business by acquiring air compressor business with Sullair brand (Sullair Business), despite the withdrawal from low-profitable business in the industry and distribution field. Segment profit increased ¥20.9 billion to ¥57.5 billion, as compared with the nine months ended December 31, 2016, due mainly to an improvement in profitability of business for the industry and distribution field, industrial products business and power & energy business.
(Electronic Systems & Equipment) Revenues decreased 7% to ¥763.2 billion, as compared with the nine months ended December 31, 2016, due mainly to the deconsolidation of Hitachi Koki Co., Ltd. in the year ended March 31, 2017, despite increased revenues at Hitachi Kokusai Electric Inc. and Hitachi High-Technologies Corporation owing to higher sales of semiconductor production equipment. Segment profit increased ¥7.7 billion to ¥56.6 billion, as compared with the nine months ended December 31, 2016, due mainly to higher earnings at Hitachi Kokusai Electric Inc.
(Construction Machinery) Revenues increased 35% to ¥683.9 billion, as compared with the nine months ended December 31, 2016, due mainly to increased sales of construction machinery in China and other overseas countries, and corporate acquisitions in Australia and the U.S. conducted by Hitachi Construction Machinery Co., Ltd. in the year ended March 31, 2017. Segment profit increased ¥61.3 billion to ¥70.5 billion, as compared with nine months ended December 31, 2016, due mainly to the increased revenues and higher share of profits of investments accounted for using the equity methods.
(High Functional Materials & Components) Revenues increased 15% to ¥1,230.8 billion, as compared with the nine months ended December 31, 2016, due mainly to increased sales of the electronics- and automotive-related products at Hitachi Metals, Ltd. and Hitachi Chemical Company, Ltd., and corporate acquisition in Italy conducted by Hitachi Chemical Company, Ltd. in the year end of March 31, 2017. Segment profit decreased ¥6.4 billion to ¥85.2 billion, as compared with nine months ended December 31, 2016, due mainly to the absence of gains on business reorganization recorded at Hitachi Metals, Ltd. in the nine months ended December 31, 2016 and posting expenses related to competition law and others at Hitachi Chemical Company, Ltd. (Automotive Systems) Revenues increased 2% to ¥738.4 billion, as compared with the nine months ended December 31, 2016, due mainly to increased sales of automotive parts mainly in China and the positive impact of foreign currency translation. Segment profit decreased ¥5.4 billion to ¥30.1 billion, as compared with the nine months ended December 31, 2016, due mainly to deteriorated profitability of car information system business and sales decrease in North America.
(Smart Life & Ecofriendly Systems) Revenues decreased 5% to ¥399.5 billion, as compared with the nine months ended December 31, 2016. Segment profit increased ¥5.3 billion to ¥24.6 billion, as compared with the nine months ended December 31, 2016, due mainly to an increase in share of profits of investments accounted for using the equity method and the effect of the cost reduction efforts. (Others) Revenues decreased 18% to ¥405.1 billion, as compared with the nine months ended December 31, 2016, due mainly to the conversion of Hitachi Transport System, Ltd. to an equity-method associate in May 2016. Segment profit increased ¥2.9 billion to ¥17.5 billion, as compared with the nine months ended December 31, 2016.
3
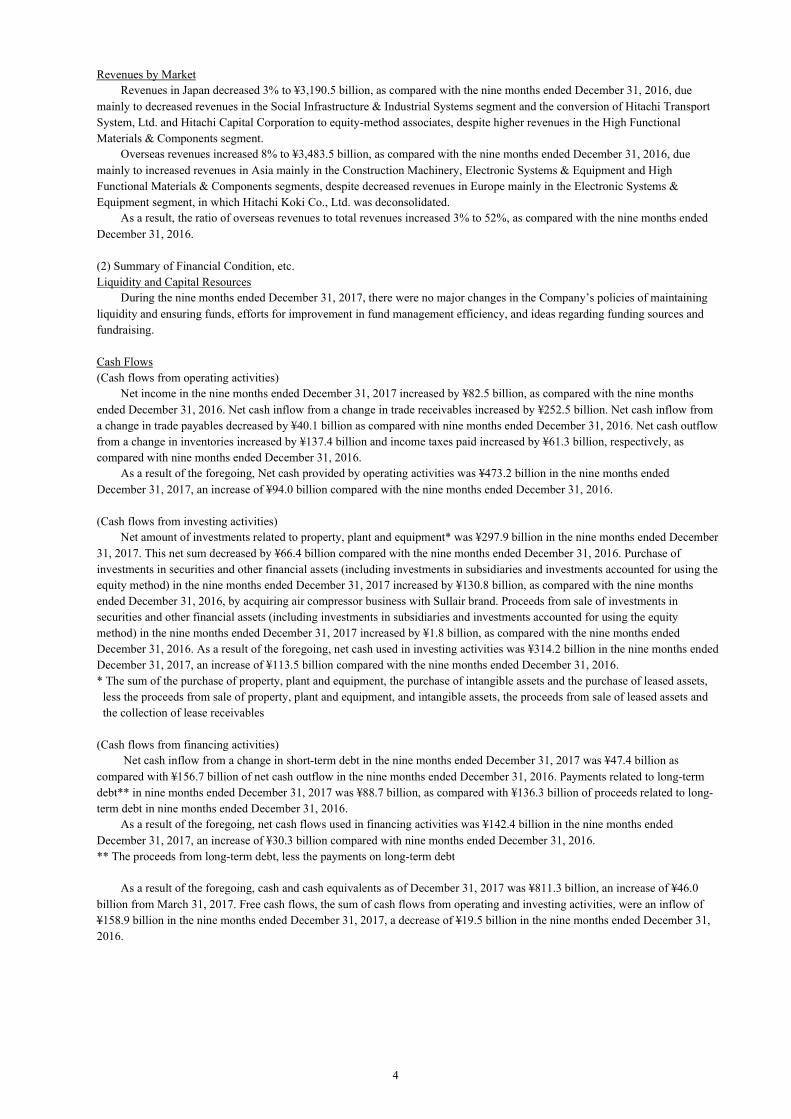
Revenues by Market Revenues in Japan decreased 3% to ¥3,190.5 billion, as compared with the nine months ended December 31, 2016, due mainly to decreased revenues in the Social Infrastructure & Industrial Systems segment and the conversion of Hitachi Transport System, Ltd. and Hitachi Capital Corporation to equity-method associates, despite higher revenues in the High Functional Materials & Components segment. Overseas revenues increased 8% to ¥3,483.5 billion, as compared with the nine months ended December 31, 2016, due mainly to increased revenues in Asia mainly in the Construction Machinery, Electronic Systems & Equipment and High Functional Materials & Components segments, despite decreased revenues in Europe mainly in the Electronic Systems & Equipment segment, in which Hitachi Koki Co., Ltd. was deconsolidated. As a result, the ratio of overseas revenues to total revenues increased 3% to 52%, as compared with the nine months ended December 31, 2016. (2) Summary of Financial Condition, etc. Liquidity and Capital Resources During the nine months ended December 31, 2017, there were no major changes in the Company’s policies of maintaining liquidity and ensuring funds, efforts for improvement in fund management efficiency, and ideas regarding funding sources and fundraising.
Cash Flows (Cash flows from operating activities) Net income in the nine months ended December 31, 2017 increased by ¥82.5 billion, as compared with the nine months ended December 31, 2016. Net cash inflow from a change in trade receivables increased by ¥252.5 billion. Net cash inflow from a change in trade payables decreased by ¥40.1 billion as compared with nine months ended December 31, 2016. Net cash outflow from a change in inventories increased by ¥137.4 billion and income taxes paid increased by ¥61.3 billion, respectively, as compared with nine months ended December 31, 2016. As a result of the foregoing, Net cash provided by operating activities was ¥473.2 billion in the nine months ended December 31, 2017, an increase of ¥94.0 billion compared with the nine months ended December 31, 2016. (Cash flows from investing activities) Net amount of investments related to property, plant and equipment* was ¥297.9 billion in the nine months ended December 31, 2017. This net sum decreased by ¥66.4 billion compared with the nine months ended December 31, 2016. Purchase of investments in securities and other financial assets (including investments in subsidiaries and investments accounted for using the equity method) in the nine months ended December 31, 2017 increased by ¥130.8 billion, as compared with the nine months ended December 31, 2016, by acquiring air compressor business with Sullair brand. Proceeds from sale of investments in securities and other financial assets (including investments in subsidiaries and investments accounted for using the equity method) in the nine months ended December 31, 2017 increased by ¥1.8 billion, as compared with the nine months ended December 31, 2016. As a result of the foregoing, net cash used in investing activities was ¥314.2 billion in the nine months ended December 31, 2017, an increase of ¥113.5 billion compared with the nine months ended December 31, 2016. * The sum of the purchase of property, plant and equipment, the purchase of intangible assets and the purchase of leased assets,
less the proceeds from sale of property, plant and equipment, and intangible assets, the proceeds from sale of leased assets and the collection of lease receivables
(Cash flows from financing activities) Net cash inflow from a change in short-term debt in the nine months ended December 31, 2017 was ¥47.4 billion as compared with ¥156.7 billion of net cash outflow in the nine months ended December 31, 2016. Payments related to long-term debt** in nine months ended December 31, 2017 was ¥88.7 billion, as compared with ¥136.3 billion of proceeds related to long-term debt in nine months ended December 31, 2016. As a result of the foregoing, net cash flows used in financing activities was ¥142.4 billion in the nine months ended December 31, 2017, an increase of ¥30.3 billion compared with nine months ended December 31, 2016. ** The proceeds from long-term debt, less the payments on long-term debt
As a result of the foregoing, cash and cash equivalents as of December 31, 2017 was ¥811.3 billion, an increase of ¥46.0 billion from March 31, 2017. Free cash flows, the sum of cash flows from operating and investing activities, were an inflow of ¥158.9 billion in the nine months ended December 31, 2017, a decrease of ¥19.5 billion in the nine months ended December 31, 2016.
4

Assets, Liabilities and Equity The following is an overview of Hitachi’s assets, liabilities and equity as of December 31, 2017. Total assets were ¥10,196.1 billion, an increase of ¥532.2 billion from March 31, 2017. This was due mainly to the acquisition of air compressor business with Sullair brand and an increase in inventories reflecting production progress. Total interest-bearing debt, the sum of short-term debt and long-term debt, was ¥1,246.9 billion, an increase of ¥70.3 billion from March 31, 2017. This was due mainly to an increase in short-term debt. Total Hitachi, Ltd. stockholders’ equity increased by ¥253.4 billion from March 31, 2017, to ¥3,220.5 billion, due mainly to posting net income attributable to Hitachi, Ltd. stockholders. The ratio of total Hitachi, Ltd. stockholders’ equity to total assets increased 0.9% from March 31, 2017 to 31.6%. Non-controlling interests were ¥1,228.9 billion, an increase of ¥99.0 billion from March 31, 2017. Total equity was ¥4,449.4 billion, an increase of ¥352.4 billion from March 31, 2017. The ratio of interest-bearing debt to total equity was 0.28, as compared with 0.29 as of March 31, 2017.
(3) Management Policy There were no material changes in Hitachi’s management policy during the nine months ended December 31, 2017. (4) Challenges Facing Hitachi Group
1) Business and Financial Condition There were no material changes in Hitachi’s business strategy during the nine months ended December 31, 2017. 2) Fundamental Policy on the Conduct of Persons Influencing Decision on the Company’s Financial and Business Policies The Group invests a great deal of business resources in fundamental research and in the development of market-leading products and businesses that will bear fruit in the future, and realizing the benefits from these management policies requires that they be continued for a set period of time. For this purpose, the Company keeps its shareholders and investors well informed of not just the business results for each period but also of the Company’s business policies for creating value in the future. The Company does not deny the significance of the vitalization of business activities and performance that can be brought about through a change in management control, but it recognizes the necessity of determining the impact on company value and the interests of all shareholders of the buying activities and buyout proposals of parties attempting to acquire a large share of stock of the Company or a Group company by duly examining the business description, future business plans, past investment activities, and other necessary aspects of such a party. There is no party that is currently attempting to acquire a large share of the Company’s stocks nor is there a specific threat, neither does the Company intend to implement specified so-called anti-takeover measures in advance of the appearance of such a party, but the Company does understand that it is one of the natural duties bestowed upon it by the shareholders and investors to continuously monitor the state of trading of the Company’s stock and then to immediately take what the Company deems to be the best action in the event of the appearance of a party attempting to purchase a large share of the Company’s stock. In particular, together with outside experts, the Company will evaluate the buyout proposal of the party and hold negotiations with the buyer, and if the Company deems that said buyout will not maintain the Company’s value and is not in the best interest of the shareholders, then the Company will quickly determine the necessity, content, etc., of specific countermeasures and prepare to implement them. The same response will also be taken in the event a party attempts to acquire a large percentage of the shares of a Group company.
5

(5) Research and Development There were no material changes in the research and development of the Hitachi Group (the Company and consolidated subsidiaries) stated in the Annual Securities Report for the 148th business term pursuant to the Financial Instruments and Exchange Act of Japan. The Hitachi Group’s R&D expenditures in the nine months ended December 31, 2017 were ¥240.6 billion, 3.6% of revenues. A breakdown of R&D expenditures by segment is shown below.
(Billions of yen)
Segment Nine months ended December 31, 2017
Information & Telecommunication Systems 36.0
Social Infrastructure & Industrial Systems 40.3
Electronic Systems & Equipment 36.9
Construction Machinery 16.4
High Functional Materials & Components 35.4
Automotive Systems 51.7
Smart Life & Ecofriendly Systems 5.3
Others 1.6
Corporate Items 16.5
Total 240.6
6
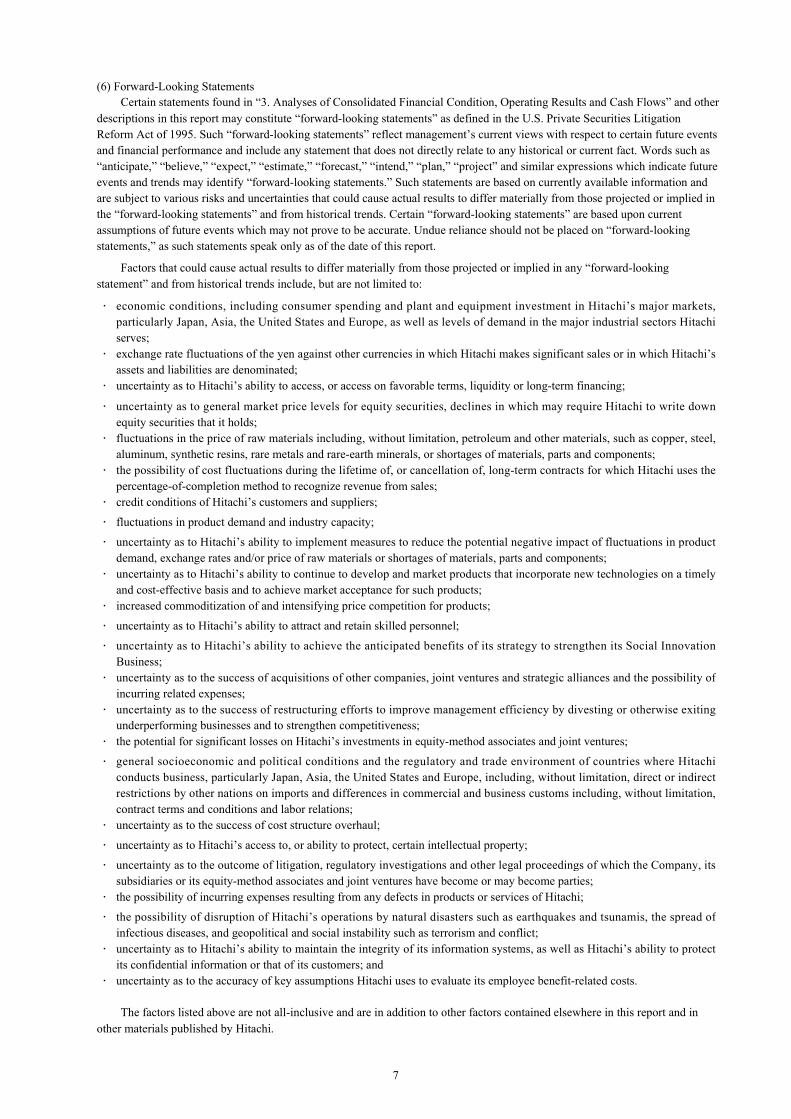
(6) Forward-Looking Statements Certain statements found in “3. Analyses of Consolidated Financial Condition, Operating Results and Cash Flows” and other descriptions in this report may constitute “forward-looking statements” as defined in the U.S. Private Securities Litigation Reform Act of 1995. Such “forward-looking statements” reflect management’s current views with respect to certain future events and financial performance and include any statement that does not directly relate to any historical or current fact. Words such as “anticipate,” “believe,” “expect,” “estimate,” “forecast,” “intend,” “plan,” “project” and similar expressions which indicate future events and trends may identify “forward-looking statements.” Such statements are based on currently available information and are subject to various risks and uncertainties that could cause actual results to differ materially from those projected or implied in the “forward-looking statements” and from historical trends. Certain “forward-looking statements” are based upon current assumptions of future events which may not prove to be accurate. Undue reliance should not be placed on “forward-looking statements,” as such statements speak only as of the date of this report.
Factors that could cause actual results to differ materially from those projected or implied in any “forward-looking statement” and from historical trends include, but are not limited to: • economic conditions, including consumer spending and plant and equipment investment in Hitachi’s major markets,
particularly Japan, Asia, the United States and Europe, as well as levels of demand in the major industrial sectors Hitachi serves;
• exchange rate fluctuations of the yen against other currencies in which Hitachi makes significant sales or in which Hitachi’s assets and liabilities are denominated;
• uncertainty as to Hitachi’s ability to access, or access on favorable terms, liquidity or long-term financing;
• uncertainty as to general market price levels for equity securities, declines in which may require Hitachi to write down equity securities that it holds;
• fluctuations in the price of raw materials including, without limitation, petroleum and other materials, such as copper, steel, aluminum, synthetic resins, rare metals and rare-earth minerals, or shortages of materials, parts and components;
• the possibility of cost fluctuations during the lifetime of, or cancellation of, long-term contracts for which Hitachi uses the percentage-of-completion method to recognize revenue from sales;
• credit conditions of Hitachi’s customers and suppliers;
• fluctuations in product demand and industry capacity;
• uncertainty as to Hitachi’s ability to implement measures to reduce the potential negative impact of fluctuations in product demand, exchange rates and/or price of raw materials or shortages of materials, parts and components;
• uncertainty as to Hitachi’s ability to continue to develop and market products that incorporate new technologies on a timely and cost-effective basis and to achieve market acceptance for such products;
• increased commoditization of and intensifying price competition for products;
• uncertainty as to Hitachi’s ability to attract and retain skilled personnel;
• uncertainty as to Hitachi’s ability to achieve the anticipated benefits of its strategy to strengthen its Social Innovation Business;
• uncertainty as to the success of acquisitions of other companies, joint ventures and strategic alliances and the possibility of incurring related expenses;
• uncertainty as to the success of restructuring efforts to improve management efficiency by divesting or otherwise exiting underperforming businesses and to strengthen competitiveness;
• the potential for significant losses on Hitachi’s investments in equity-method associates and joint ventures;
• general socioeconomic and political conditions and the regulatory and trade environment of countries where Hitachi conducts business, particularly Japan, Asia, the United States and Europe, including, without limitation, direct or indirect restrictions by other nations on imports and differences in commercial and business customs including, without limitation, contract terms and conditions and labor relations;
• uncertainty as to the success of cost structure overhaul;
• uncertainty as to Hitachi’s access to, or ability to protect, certain intellectual property;
• uncertainty as to the outcome of litigation, regulatory investigations and other legal proceedings of which the Company, its subsidiaries or its equity-method associates and joint ventures have become or may become parties;
• the possibility of incurring expenses resulting from any defects in products or services of Hitachi;
• the possibility of disruption of Hitachi’s operations by natural disasters such as earthquakes and tsunamis, the spread of infectious diseases, and geopolitical and social instability such as terrorism and conflict;
• uncertainty as to Hitachi’s ability to maintain the integrity of its information systems, as well as Hitachi’s ability to protect its confidential information or that of its customers; and
• uncertainty as to the accuracy of key assumptions Hitachi uses to evaluate its employee benefit-related costs.
The factors listed above are not all-inclusive and are in addition to other factors contained elsewhere in this report and in other materials published by Hitachi.
7
III. Information on the Company 1. Information on the Company’s Stock, etc.
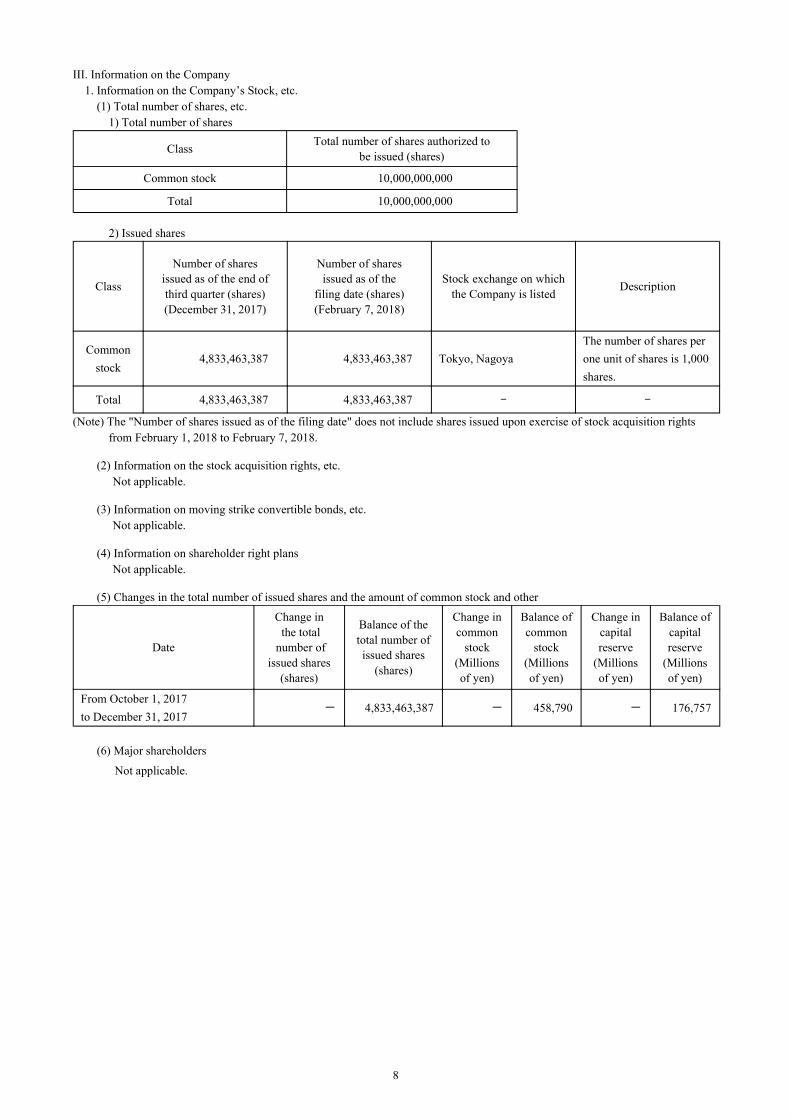
(1) Total number of shares, etc. 1) Total number of shares
Class Total number of shares authorized to be issued (shares)
Common stock 10,000,000,000
Total 10,000,000,000
2) Issued shares
Class
Number of shares issued as of the end of third quarter (shares) (December 31, 2017)
Number of shares issued as of the
filing date (shares) (February 7, 2018)
Stock exchange on which the Company is listed Description
Common stock
4,833,463,387 4,833,463,387 Tokyo, Nagoya The number of shares per one unit of shares is 1,000 shares.
Total 4,833,463,387 4,833,463,387 - -
(Note) The "Number of shares issued as of the filing date" does not include shares issued upon exercise of stock acquisition rights from February 1, 2018 to February 7, 2018.
(2) Information on the stock acquisition rights, etc.
Not applicable.
(3) Information on moving strike convertible bonds, etc. Not applicable.
(4) Information on shareholder right plans
Not applicable.
(5) Changes in the total number of issued shares and the amount of common stock and other
Date
Change in the total
number of issued shares
(shares)
Balance of the total number of issued shares
(shares)
Change in common
stock (Millions of yen)
Balance of common
stock (Millions of yen)
Change in capital reserve
(Millions of yen)
Balance of capital reserve
(Millions of yen)
From October 1, 2017 to December 31, 2017
- 4,833,463,387 - 458,790 - 176,757
(6) Major shareholders
Not applicable.
8
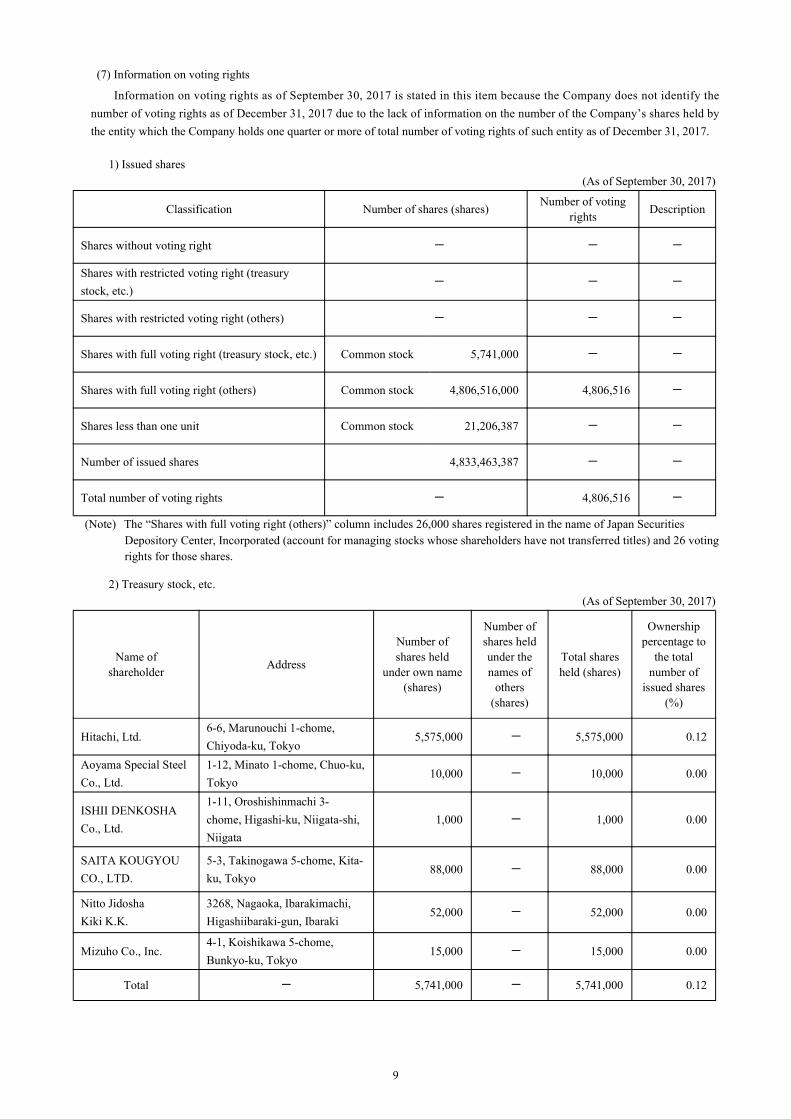
(7) Information on voting rights
Information on voting rights as of September 30, 2017 is stated in this item because the Company does not identify the number of voting rights as of December 31, 2017 due to the lack of information on the number of the Company’s shares held by the entity which the Company holds one quarter or more of total number of voting rights of such entity as of December 31, 2017.
1) Issued shares
(As of September 30, 2017)
Classification Number of shares (shares) Number of voting rights Description
Shares without voting right - - -
Shares with restricted voting right (treasury stock, etc.)
- - -
Shares with restricted voting right (others) - - -
Shares with full voting right (treasury stock, etc.) Common stock 5,741,000 - -
Shares with full voting right (others) Common stock 4,806,516,000 4,806,516 -
Shares less than one unit Common stock 21,206,387 - -
Number of issued shares 4,833,463,387 - -
Total number of voting rights - 4,806,516 -
(Note) The “Shares with full voting right (others)” column includes 26,000 shares registered in the name of Japan Securities Depository Center, Incorporated (account for managing stocks whose shareholders have not transferred titles) and 26 voting rights for those shares.
2) Treasury stock, etc.
(As of September 30, 2017)
Name of shareholder Address
Number of shares held
under own name (shares)
Number of shares held under the names of
others (shares)
Total shares held (shares)
Ownership percentage to
the total number of
issued shares (%)
Hitachi, Ltd. 6-6, Marunouchi 1-chome, Chiyoda-ku, Tokyo
5,575,000 - 5,575,000 0.12
Aoyama Special Steel Co., Ltd.
1-12, Minato 1-chome, Chuo-ku, Tokyo
10,000 - 10,000 0.00
ISHII DENKOSHA Co., Ltd.
1-11, Oroshishinmachi 3- chome, Higashi-ku, Niigata-shi, Niigata
1,000 - 1,000 0.00
SAITA KOUGYOU CO., LTD.
5-3, Takinogawa 5-chome, Kita-ku, Tokyo
88,000 - 88,000 0.00
Nitto Jidosha Kiki K.K.
3268, Nagaoka, Ibarakimachi, Higashiibaraki-gun, Ibaraki
52,000 - 52,000 0.00
Mizuho Co., Inc. 4-1, Koishikawa 5-chome, Bunkyo-ku, Tokyo
15,000 - 15,000 0.00
Total - 5,741,000 - 5,741,000 0.12
9

2. Changes in Senior Management Changes in senior managements from the filing date of the Annual Securities Report for the 148th business term to
December 31, 2017 were as follows. 1) Changes in Responsibility [Effective October 1, 2017]
Former Position and responsibility New Position and responsibility Name
Position Responsibility Position Responsibility Representative Executive Officer Executive Vice President and Executive Officer
Assistant to the President and management strategies
Representative Executive Officer Executive Vice President and Executive Officer
Assistant to the President, management strategies and information security management
Toshikazu Nishino
(Note) Matters delegated to the Executive Officer by the Board of Directors are described in “Responsibility” column. 2) The Number of Men and Women and Women's Percentage after Changes in Senior Management
Men: 45 persons, Women: 2 persons (Women’s percentage to total number of Directors and Executive Officers: 4%)The numbers and the percentage mentioned above are the same as those described in the Annual Securities Report for
the 148th business term.
IV. Financial Information Refer to the condensed quarterly consolidated financial statements incorporated in this Quarterly Report. Part II Information on Guarantors, etc. for the Company Not applicable.
10

Condensed Quarterly Consolidated Financial Statements
Condensed Quarterly Consolidated Statement of Financial Position
Millions of yen
December 31, 2017 March 31, 2017 Assets Current assets Cash and cash equivalents 811,324 765,242 Trade receivables 2,214,369 2,433,149 Inventories 1,559,471 1,225,907 Investments in securities and other financial assets (note 2 and 6) 325,213 388,792 Other current assets (note 2) 249,813 189,516 Total current assets 5,160,190 5,002,606 Non-current assets Investments accounted for using the equity method 732,171 691,251 Investments in securities and other financial assets (note 2 and 6) 752,926 758,350 Property, plant and equipment 2,127,457 1,998,411 Intangible assets 1,121,567 919,201 Other non-current assets 301,841 294,098 Total non-current assets 5,035,962 4,661,311 Total assets 10,196,152 9,663,917 Liabilities Current liabilities Short-term debt 283,606 196,357 Current portion of long-term debt (note 6) 130,413 190,233 Other financial liabilities (note 6) 282,296 274,270 Trade payables 1,481,975 1,402,233 Accrued expenses 594,870 687,905 Advances received 546,195 472,132 Other current liabilities 533,910 497,729 Total current liabilities 3,853,265 3,720,859 Non-current liabilities Long-term debt (note 6) 832,894 790,013 Retirement and severance benefits 619,091 635,684 Other non-current liabilities (note 2) 441,464 420,366 Total non-current liabilities 1,893,449 1,846,063 Total liabilities 5,746,714 5,566,922 Equity Hitachi, Ltd. stockholders’ equity Common stock 458,790 458,790 Capital surplus 575,974 577,573 Retained earnings (note 7) 1,995,609 1,793,570 Accumulated other comprehensive income 194,227 141,068 Treasury stock, at cost (4,092) (3,916) Total Hitachi, Ltd. stockholders’ equity 3,220,508 2,967,085 Non-controlling interests 1,228,930 1,129,910 Total equity 4,449,438 4,096,995 Total liabilities and equity 10,196,152 9,663,917 See accompanying notes to condensed quarterly consolidated financial statements.
F-1
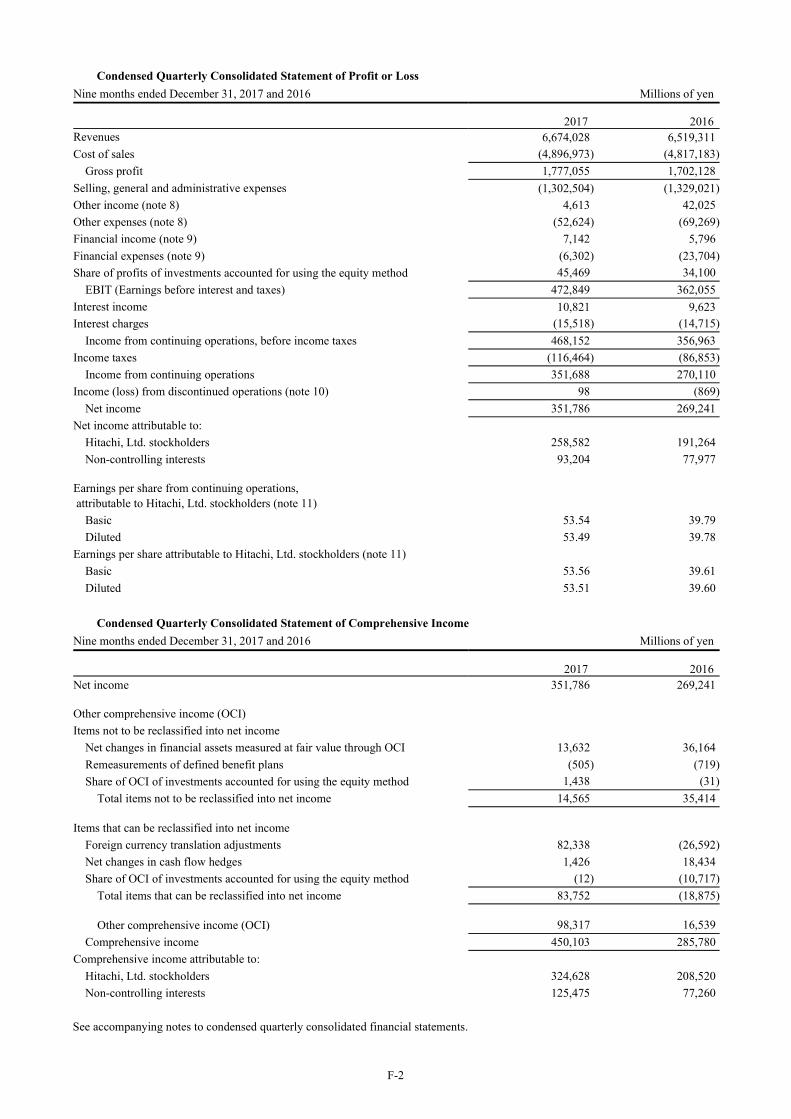
Condensed Quarterly Consolidated Statement of Profit or Loss Nine months ended December 31, 2017 and 2016 Millions of yen
2017 2016 Revenues 6,674,028 6,519,311 Cost of sales (4,896,973) (4,817,183) Gross profit 1,777,055 1,702,128 Selling, general and administrative expenses (1,302,504) (1,329,021) Other income (note 8) 4,613 42,025 Other expenses (note 8) (52,624) (69,269) Financial income (note 9) 7,142 5,796 Financial expenses (note 9) (6,302) (23,704) Share of profits of investments accounted for using the equity method 45,469 34,100 EBIT (Earnings before interest and taxes) 472,849 362,055 Interest income 10,821 9,623 Interest charges (15,518) (14,715) Income from continuing operations, before income taxes 468,152 356,963 Income taxes (116,464) (86,853) Income from continuing operations 351,688 270,110 Income (loss) from discontinued operations (note 10) 98 (869) Net income 351,786 269,241 Net income attributable to: Hitachi, Ltd. stockholders 258,582 191,264 Non-controlling interests 93,204 77,977 Earnings per share from continuing operations, attributable to Hitachi, Ltd. stockholders (note 11)
Basic 53.54 39.79 Diluted 53.49 39.78 Earnings per share attributable to Hitachi, Ltd. stockholders (note 11) Basic 53.56 39.61 Diluted 53.51 39.60 Condensed Quarterly Consolidated Statement of Comprehensive Income Nine months ended December 31, 2017 and 2016 Millions of yen
2017 2016 Net income 351,786 269,241 Other comprehensive income (OCI) Items not to be reclassified into net income Net changes in financial assets measured at fair value through OCI 13,632 36,164 Remeasurements of defined benefit plans (505) (719) Share of OCI of investments accounted for using the equity method 1,438 (31) Total items not to be reclassified into net income 14,565 35,414 Items that can be reclassified into net income Foreign currency translation adjustments 82,338 (26,592) Net changes in cash flow hedges 1,426 18,434 Share of OCI of investments accounted for using the equity method (12) (10,717) Total items that can be reclassified into net income 83,752 (18,875) Other comprehensive income (OCI) 98,317 16,539 Comprehensive income 450,103 285,780 Comprehensive income attributable to: Hitachi, Ltd. stockholders 324,628 208,520 Non-controlling interests 125,475 77,260 See accompanying notes to condensed quarterly consolidated financial statements.
F-2

Condensed Quarterly Consolidated Statement of Profit or Loss Three months ended December 31, 2017 and 2016 Millions of yen
2017 2016 Revenues 2,297,561 2,165,537 Cost of sales (1,691,374) (1,597,575) Gross profit 606,187 567,962 Selling, general and administrative expenses (434,879) (427,695) Other income 2,604 885 Other expenses (11,685) (25,959) Financial income 2,277 1,941 Financial expenses (12,124) (4,425) Share of profits of investments accounted for using the equity method 23,977 30,781 EBIT (Earnings before interest and taxes) 176,357 143,490 Interest income 4,097 4,047 Interest charges (5,364) (4,739) Income from continuing operations, before income taxes 175,090 142,798 Income taxes (43,609) (33,291) Income from continuing operations 131,481 109,507 Income (loss) from discontinued operations 1,372 (893) Net income 132,853 108,614 Net income attributable to: Hitachi, Ltd. stockholders 97,969 77,764 Non-controlling interests 34,884 30,850 Earnings per share from continuing operations, attributable to Hitachi, Ltd. stockholders (note 11)
Basic 20.01 16.29 Diluted 19.99 16.28 Earnings per share attributable to Hitachi, Ltd. stockholders (note 11) Basic 20.29 16.11 Diluted 20.27 16.10 Condensed Quarterly Consolidated Statement of Comprehensive Income Three months ended December 31, 2017 and 2016 Millions of yen
2017 2016 Net income 132,853 108,614 Other comprehensive income (OCI) Items not to be reclassified into net income Net changes in financial assets measured at fair value through OCI 7,210 52,601 Remeasurements of defined benefit plans (505) (255) Share of OCI of investments accounted for using the equity method 588 790 Total items not to be reclassified into net income 7,293 53,136 Items that can be reclassified into net income Foreign currency translation adjustments 25,879 203,025 Net changes in cash flow hedges 2,098 (5,322) Share of OCI of investments accounted for using the equity method (9,496) 30,921 Total items that can be reclassified into net income 18,481 228,624 Other comprehensive income (OCI) 25,774 281,760 Comprehensive income 158,627 390,374 Comprehensive income attributable to: Hitachi, Ltd. stockholders 112,368 289,676 Non-controlling interests 46,259 100,698 See accompanying notes to condensed quarterly consolidated financial statements.
F-3
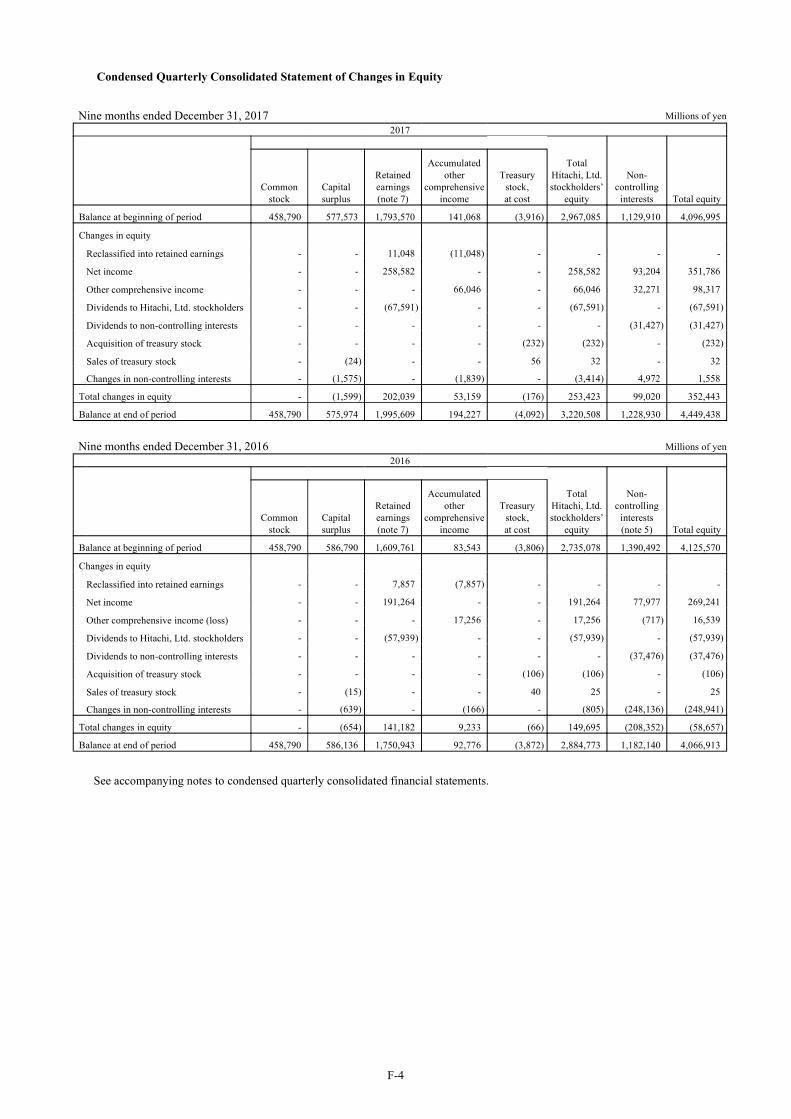
Condensed Quarterly Consolidated Statement of Changes in Equity
Nine months ended December 31, 2017 Millions of yen
2017
Total Hitachi, Ltd. stockholders’
equity
Non- controlling
interests Total equity
Common
stock Capital surplus
Retained earnings (note 7)
Accumulated other
comprehensive income
Treasury stock, at cost
Balance at beginning of period 458,790 577,573 1,793,570 141,068 (3,916) 2,967,085 1,129,910 4,096,995 Changes in equity Reclassified into retained earnings - - 11,048 (11,048) - - - - Net income - - 258,582 - - 258,582 93,204 351,786 Other comprehensive income - - - 66,046 - 66,046 32,271 98,317 Dividends to Hitachi, Ltd. stockholders - - (67,591) - - (67,591) - (67,591) Dividends to non-controlling interests - - - - - - (31,427) (31,427) Acquisition of treasury stock - - - - (232) (232) - (232) Sales of treasury stock - (24) - - 56 32 - 32 Changes in non-controlling interests - (1,575) - (1,839) - (3,414) 4,972 1,558 Total changes in equity - (1,599) 202,039 53,159 (176) 253,423 99,020 352,443 Balance at end of period 458,790 575,974 1,995,609 194,227 (4,092) 3,220,508 1,228,930 4,449,438
Nine months ended December 31, 2016 Millions of yen
2016
Total Hitachi, Ltd. stockholders’
equity
Non- controlling
interests (note 5) Total equity
Common
stock Capital surplus
Retained earnings (note 7)
Accumulated other
comprehensive income
Treasury stock, at cost
Balance at beginning of period 458,790 586,790 1,609,761 83,543 (3,806) 2,735,078 1,390,492 4,125,570 Changes in equity Reclassified into retained earnings - - 7,857 (7,857) - - - - Net income - - 191,264 - - 191,264 77,977 269,241 Other comprehensive income (loss) - - - 17,256 - 17,256 (717) 16,539 Dividends to Hitachi, Ltd. stockholders - - (57,939) - - (57,939) - (57,939) Dividends to non-controlling interests - - - - - - (37,476) (37,476) Acquisition of treasury stock - - - - (106) (106) - (106) Sales of treasury stock - (15) - - 40 25 - 25 Changes in non-controlling interests - (639) - (166) - (805) (248,136) (248,941) Total changes in equity - (654) 141,182 9,233 (66) 149,695 (208,352) (58,657) Balance at end of period 458,790 586,136 1,750,943 92,776 (3,872) 2,884,773 1,182,140 4,066,913
See accompanying notes to condensed quarterly consolidated financial statements.
F-4

Condensed Quarterly Consolidated Statement of Cash flows Nine months ended December 31, 2017 and 2016 Millions of yen 2017 2016 Cash flows from operating activities: Net income 351,786 269,241 Adjustments to reconcile net income to net cash provided by operating activities Depreciation and amortization 271,944 320,915 Impairment losses 2,297 28,407 Income taxes 116,473 86,919 Share of profits of investments accounted for using the equity method (45,469) (34,100) Financial income and expenses (2,200) (393) Net gain on business reorganization and others (2,746) (39,184) (Gain) loss on sale of property, plant and equipment 73 (704) Change in trade receivables 369,035 116,473 Change in inventories (321,693) (184,285) Change in other assets (28,153) (2,780) Change in trade payables 1,146 41,279 Change in retirement and severance benefits (20,484) (30,268) Change in other liabilities (36,370) (81,899) Other (9,984) 5,976 Subtotal 645,655 495,597 Interest received 10,815 8,420 Dividends received 16,695 12,710 Interest paid (16,746) (15,653) Income taxes paid (183,209) (121,897) Net cash provided by (used in) operating activities 473,210 379,177 Cash flows from investing activities: Purchase of property, plant and equipment (251,105) (231,553) Purchase of intangible assets (62,412) (70,069) Purchase of leased assets (2,653) (264,487) Proceeds from sale of property, plant and equipment, and intangible assets 11,054 26,696 Proceeds from sale of leased assets 7,118 10,415 Collection of lease receivables - 164,516
Purchase of investments in securities and other financial assets (including investments in subsidiaries and investments accounted for using the equity method) (165,074) (34,269)
Proceeds from sale of investments in securities and other financial assets (including investments in subsidiaries and investments accounted for using the equity method) 159,572 157,702
Other (10,738) 40,401 Net cash provided by (used in) investing activities (314,238) (200,648) Cash flows from financing activities: Change in short-term debt, net 47,405 (156,740) Proceeds from long-term debt 137,479 488,144 Payments on long-term debt (226,223) (351,809) Proceeds from payments from non-controlling interests 3,953 7,009 Dividends paid to Hitachi, Ltd. stockholders (67,614) (57,977) Dividends paid to non-controlling interests (31,126) (36,300) Acquisition of common stock for treasury (232) (106) Proceeds from sales of treasury stock 37 25 Purchase of shares of consolidated subsidiaries from non-controlling interests (6,234) (4,305) Proceeds from partial sales of shares of consolidated subsidiaries to non-controlling interests 205 60 Other (63) (27) Net cash provided by (used in) financing activities (142,413) (112,026) Effect of exchange rate changes on cash and cash equivalents 29,523 (2,402) Change in cash and cash equivalents 46,082 64,101 Cash and cash equivalents at beginning of period 765,242 699,315 Cash and cash equivalents at end of period 811,324 763,416 See accompanying notes to condensed quarterly consolidated financial statements.
F-5
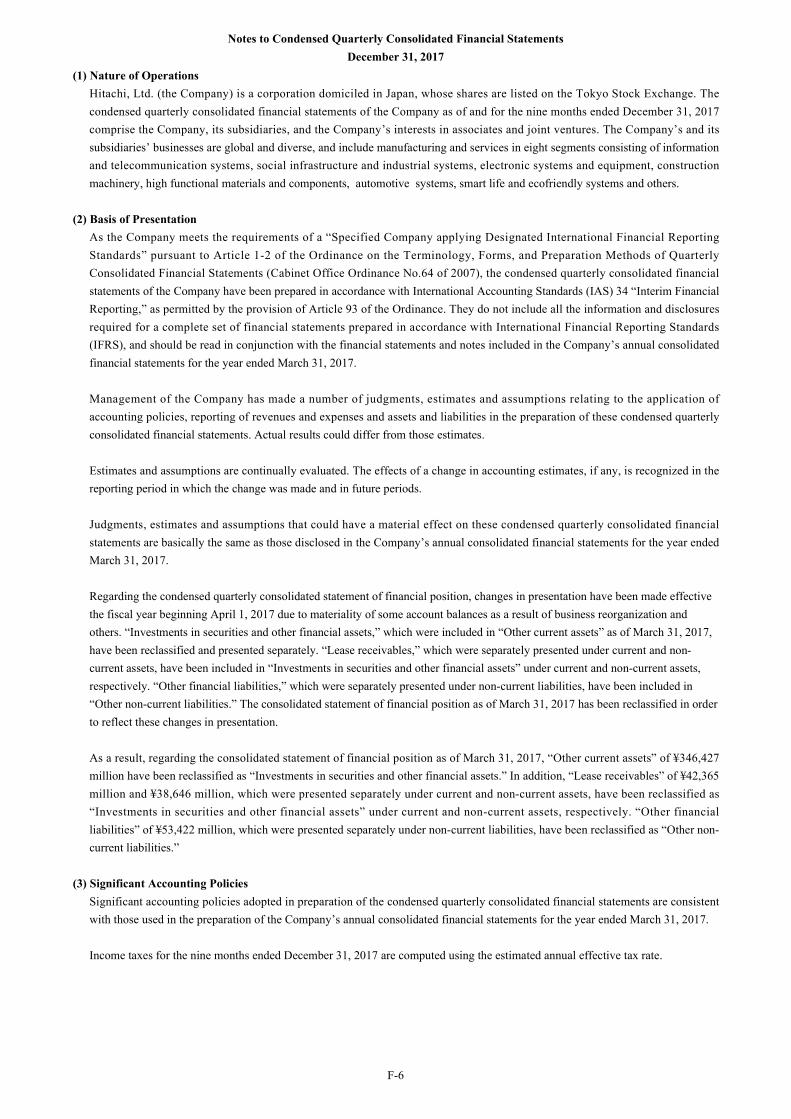
(1) Nature of Operations Hitachi, Ltd. (the Company) is a corporation domiciled in Japan, whose shares are listed on the Tokyo Stock Exchange. The condensed quarterly consolidated financial statements of the Company as of and for the nine months ended December 31, 2017 comprise the Company, its subsidiaries, and the Company’s interests in associates and joint ventures. The Company’s and its subsidiaries’ businesses are global and diverse, and include manufacturing and services in eight segments consisting of information and telecommunication systems, social infrastructure and industrial systems, electronic systems and equipment, construction machinery, high functional materials and components, automotive systems, smart life and ecofriendly systems and others.
(2) Basis of Presentation
As the Company meets the requirements of a “Specified Company applying Designated International Financial Reporting Standards” pursuant to Article 1-2 of the Ordinance on the Terminology, Forms, and Preparation Methods of Quarterly Consolidated Financial Statements (Cabinet Office Ordinance No.64 of 2007), the condensed quarterly consolidated financial statements of the Company have been prepared in accordance with International Accounting Standards (IAS) 34 “Interim Financial Reporting,” as permitted by the provision of Article 93 of the Ordinance. They do not include all the information and disclosures required for a complete set of financial statements prepared in accordance with International Financial Reporting Standards (IFRS), and should be read in conjunction with the financial statements and notes included in the Company’s annual consolidated financial statements for the year ended March 31, 2017.
Management of the Company has made a number of judgments, estimates and assumptions relating to the application of accounting policies, reporting of revenues and expenses and assets and liabilities in the preparation of these condensed quarterly consolidated financial statements. Actual results could differ from those estimates.
Estimates and assumptions are continually evaluated. The effects of a change in accounting estimates, if any, is recognized in the reporting period in which the change was made and in future periods.
Judgments, estimates and assumptions that could have a material effect on these condensed quarterly consolidated financial statements are basically the same as those disclosed in the Company’s annual consolidated financial statements for the year ended March 31, 2017. Regarding the condensed quarterly consolidated statement of financial position, changes in presentation have been made effective the fiscal year beginning April 1, 2017 due to materiality of some account balances as a result of business reorganization and others. “Investments in securities and other financial assets,” which were included in “Other current assets” as of March 31, 2017, have been reclassified and presented separately. “Lease receivables,” which were separately presented under current and non-current assets, have been included in “Investments in securities and other financial assets” under current and non-current assets, respectively. “Other financial liabilities,” which were separately presented under non-current liabilities, have been included in “Other non-current liabilities.” The consolidated statement of financial position as of March 31, 2017 has been reclassified in order to reflect these changes in presentation. As a result, regarding the consolidated statement of financial position as of March 31, 2017, “Other current assets” of ¥346,427 million have been reclassified as “Investments in securities and other financial assets.” In addition, “Lease receivables” of ¥42,365 million and ¥38,646 million, which were presented separately under current and non-current assets, have been reclassified as “Investments in securities and other financial assets” under current and non-current assets, respectively. “Other financial liabilities” of ¥53,422 million, which were presented separately under non-current liabilities, have been reclassified as “Other non-current liabilities.”
(3) Significant Accounting Policies
Significant accounting policies adopted in preparation of the condensed quarterly consolidated financial statements are consistent with those used in the preparation of the Company’s annual consolidated financial statements for the year ended March 31, 2017.
Income taxes for the nine months ended December 31, 2017 are computed using the estimated annual effective tax rate.
F-6
Notes to Condensed Quarterly Consolidated Financial StatementsDecember 31, 2017

(4) Segment Information The operating segments of the Company are the components for which separate financial information is available and which is evaluated regularly by the chief operating decision maker in deciding how to allocate resources and in assessing performance.
The Company discloses its business in eight reportable segments, corresponding to categories of activities classified primarily by the similarities for the nature of markets, products and services, and economic characteristics. Several operating segments are aggregated into Social Infrastructure & Industrial Systems, Electronic Systems & Equipment and High Functional Materials & Components for financial reporting purposes so that financial statement users better understand the Company’s financial position and business performance. The Company aggregates operating segments based on the similarities of economic characteristics mainly using profit margin ratios of operating segment. The primary products and services included in each segment are as follows:
Information & Telecommunication Systems: Systems integration, Consulting, Cloud services, Servers, Storage, Software, Telecommunication & network and ATMs
Social Infrastructure & Industrial Systems: Industrial machinery and plants, Elevators, Escalators, Railway systems, Thermal, Nuclear and Renewable energy power generation systems and Transmission & distribution systems
Electronic Systems & Equipment: Semiconductor processing equipment, Test and measurement equipment, Advanced industrial products and Medical electronics equipment
Construction Machinery: Hydraulic excavators, Wheel loaders and Mining machinery
High Functional Materials & Components: Semiconductor and display related materials, Circuit boards and materials, Automotive parts (molded plastics, etc.), Energy storage devices, Specialty steels, Magnetic materials and components, High grade casting components and materials and Wires and cables
Automotive Systems: Engine management systems, Electric powertrain systems, Drive control systems and Car information systems
Smart Life & Ecofriendly Systems: Air-conditioning equipment, Room air conditioners, Refrigerators and Washing machines Others: Optical disk drives, Property management and others
In October 2016, the Company sold a certain number of shares of Hitachi Capital Corporation (Hitachi Capital). As a result, Hitachi Capital and its subsidiaries, which were included in the Financial Services segment, became equity-method associates of the Company. Accordingly, from the beginning of the third quarter of the year ended March 31, 2017, the Company includes its share of profit (loss) of investments accounted for using the equity method of Hitachi Capital and its subsidiaries in Corporate items and Eliminations.
F-7
Notes to Condensed Quarterly Consolidated Financial StatementsDecember 31, 2017

The following tables show business segment information for the nine months ended December 31, 2017 and 2016. Revenues from Outside Customers
Millions of yen
2017 2016
Information & Telecommunication Systems 1,320,736 1,268,331 Social Infrastructure & Industrial Systems 1,465,037 1,398,182 Electronic Systems & Equipment 683,546 744,855 Construction Machinery 683,503 500,289 High Functional Materials & Components 1,191,538 1,025,977 Automotive Systems 735,479 720,690 Smart Life & Ecofriendly Systems 377,093 399,587 Others 212,199 287,330 Financial Services - 170,583 Subtotal 6,669,131 6,515,824 Corporate items 4,897 3,487 Total 6,674,028 6,519,311
Revenues from Intersegment Transactions
Millions of yen
2017 2016
Information & Telecommunication Systems 92,312 129,054 Social Infrastructure & Industrial Systems 157,913 189,463 Electronic Systems & Equipment 79,714 73,043 Construction Machinery 399 6,717 High Functional Materials & Components 39,361 41,418 Automotive Systems 2,936 2,466 Smart Life & Ecofriendly Systems 22,464 21,138 Others 192,984 209,105 Financial Services - 8,629 Subtotal 588,083 681,033 Corporate items and Eliminations (588,083) (681,033) Total - -
F-8
Notes to Condensed Quarterly Consolidated Financial StatementsDecember 31, 2017

Total Revenues Millions of yen
2017 2016
Information & Telecommunication Systems 1,413,048 1,397,385 Social Infrastructure & Industrial Systems 1,622,950 1,587,645 Electronic Systems & Equipment 763,260 817,898 Construction Machinery 683,902 507,006 High Functional Materials & Components 1,230,899 1,067,395 Automotive Systems 738,415 723,156 Smart Life & Ecofriendly Systems 399,557 420,725 Others 405,183 496,435 Financial Services - 179,212 Subtotal 7,257,214 7,196,857 Corporate items and Eliminations (583,186) (677,546) Total 6,674,028 6,519,311
Segment Profit (Loss)
Millions of yen
2017 2016
Information & Telecommunication Systems 104,419 51,579 Social Infrastructure & Industrial Systems 57,526 36,584 Electronic Systems & Equipment 56,677 48,917 Construction Machinery 70,518 9,216 High Functional Materials & Components 85,204 91,640 Automotive Systems 30,122 35,580 Smart Life & Ecofriendly Systems 24,623 19,280 Others 17,577 14,672 Financial Services - 22,841 Subtotal 446,666 330,309 Corporate items and Eliminations 26,183 31,746 Total 472,849 362,055 Interest income 10,821 9,623 Interest charges (15,518) (14,715) Income from continuing operations, before income taxes 468,152 356,963
Segment profit (loss) is measured by EBIT. Intersegment transactions are generally recorded at the same prices used in arm’s length transactions. Corporate items include corporate expenses not allocated to individual business segments, such as expenditures for leading-edge R&D, a part of net gain (loss) on business reorganization and share of profit (loss) of investments accounted for using the equity method, and others.
F-9
Notes to Condensed Quarterly Consolidated Financial StatementsDecember 31, 2017

(5) Business Acquisitions and Divestitures The following are the main Business Acquisitions and Divestitures for the nine months ended December 31, 2017, including the period up to the approval date of the condensed quarterly consolidated financial statements. (a) Sale of shares and business reorganization of Hitachi Kokusai Electric Inc. (Hitachi Kokusai)
On April 26, 2017, the Company signed a basic agreement with HKE Holdings K.K. (HKE), which is indirectly held and operated by a related investment fund whose equity interests are wholly owned by Kohlberg Kravis Roberts & Co. L.P. and with HVJ Holdings Inc. (HVJ), in which is invested by funds which are managed, operated, provided with information and the like by Japan Industrial Partners, Inc., regarding (i) a tender offer scheduled to be conducted by HKE for the common shares of Hitachi Kokusai, which is a consolidated subsidiary of the Company in the Electronic Systems & Equipment segment and a share consolidation of the share of Hitachi Kokusai, and the acquisition of treasury shares by Hitachi Kokusai, through which Hitachi Kokusai becomes a wholly-owned subsidiary of HKE, (ii) an absorption-type company split of the thin-film process solutions business of Hitachi Kokusai, whereby HKE will be the company succeeding in the absorption-type split, to be conducted by HKE and Hitachi Kokusai after Hitachi Kokusai becomes a wholly-owned subsidiary of HKE, and (iii) the transfer by HKE of 20% of the share of Hitachi Kokusai to the Company and 20% of the share of Hitachi Kokusai to HVJ that is scheduled to take place after the absorption-type company split, and other transactions that are incidental or related to those transactions. Furthermore, on October 11, 2017, the Company signed a memorandum of understanding to amend the basic agreement (the Amendment Memorandum) with HKE and HVJ. HKE commenced the tender offer on October 12, 2017 pursuant to the Amendment Memorandum, and the tender offer was completed on December 8, 2017. Following the completion of the tender offer, the above related transactions, such as the share consolidation of Hitachi Kokusai shares, are scheduled to take place. Based on the assumption that all related transactions will be completed, the Company's ownership ratio of shares of Hitachi Kokusai will decrease from 51.7% to 20.0% and Hitachi Kokusai will turn into an equity-method associate of the Company. The effects of this transaction on the Company’s consolidated financial statements are currently being evaluated.
(b) Acquisition of “Sullair” business
On April 25, 2017, the Company signed an agreement with Accudyne Industries Borrower, S.C.A. (Accudyne) to acquire Accudyne’s subsidiaries and certain related assets that manufacture and sell air compressors under the “Sullair” brand mainly in North America, in order to expand global business of industrial equipment business. In accordance with the agreement, on July 12, 2017 (the acquisition date), the Company and Hitachi America, Ltd., a subsidiary of the Company, acquired the Sullair business by acquiring all the shares of holding companies of the Sullair business.
The following table summarizes the fair value of the consideration paid for the Sullair business and the provisional amounts of the assets acquired and liabilities assumed recognized as of the acquisition date.
Millions of yen Cash and cash equivalents Trade receivables Inventories Other current assets Non-current assets (excluding intangible assets) Intangible assets Goodwill (deductible for tax purposes)
9,341 9,351 7,409
790 9,296
17,121
Goodwill (not deductible for tax purposes) 46,907 Other intangible assets 71,170 Total 171,385 Current liabilities 67,282 Non-current liabilities 10,815 Total 78,097 Cash paid for acquisition 93,288
The goodwill mainly comprises excess earning power and expected synergies arising from the acquisition.
Hitachi America, Ltd. repaid USD 517 million (¥57,502 million) of loans which were included in the Sullair business, in addition to the acquisition.
F-10
Notes to Condensed Quarterly Consolidated Financial StatementsDecember 31, 2017
The Company is currently evaluating the fair values to be assigned to assets and liabilities of the Sullair business at the acquisition date, and therefore the above amounts are subject to change.
The operating results of the Sullair business for the period from the acquisition date to December 31, 2017 were not material.
On a pro forma basis, revenues and net income attributable to Hitachi, Ltd. stockholders using an assumed acquisition date for the Sullair business of April 1, 2017 would not differ materially from the amounts reported in the condensed quarterly consolidated financial statements for the nine months ended December 31, 2017.
F-11
Notes to Condensed Quarterly Consolidated Financial StatementsDecember 31, 2017
Information on a business acquisition completed in the year ended March 31, 2017 for which the provisional amounts of the assets acquired and liabilities assumed recognized as of the acquisition date were adjusted during the nine months ended December 31, 2017 is as follows:
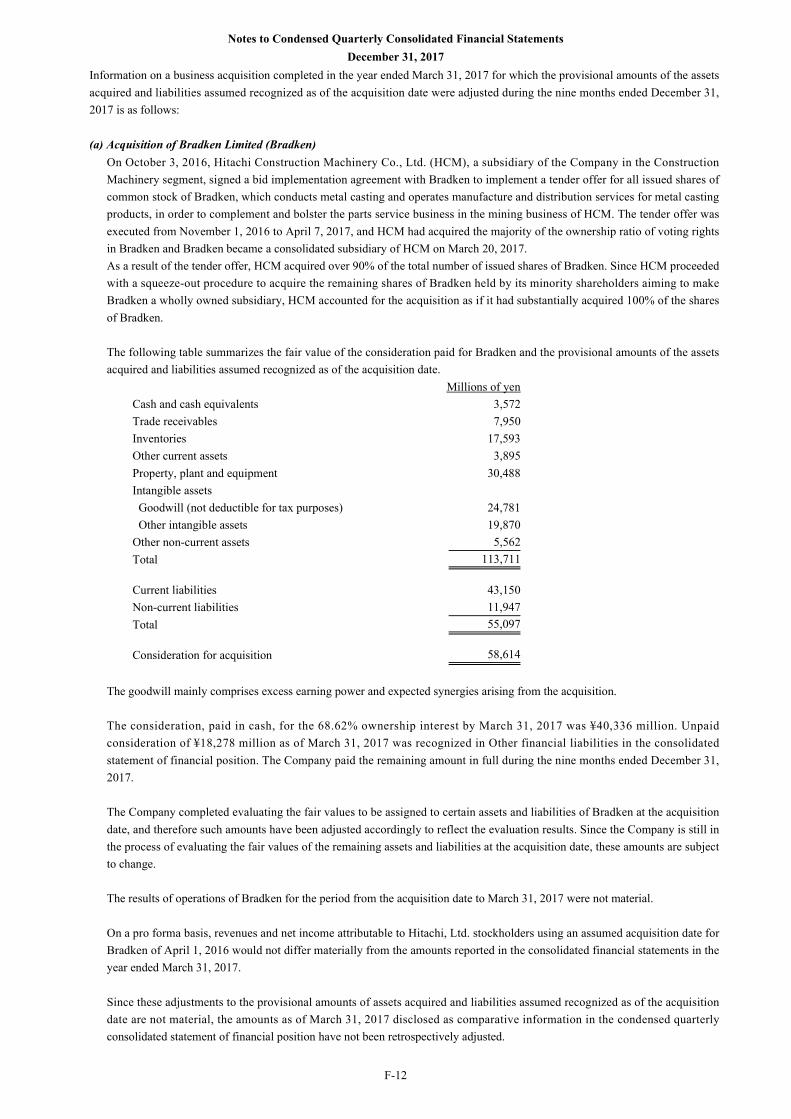
(a) Acquisition of Bradken Limited (Bradken)
On October 3, 2016, Hitachi Construction Machinery Co., Ltd. (HCM), a subsidiary of the Company in the Construction Machinery segment, signed a bid implementation agreement with Bradken to implement a tender offer for all issued shares of common stock of Bradken, which conducts metal casting and operates manufacture and distribution services for metal casting products, in order to complement and bolster the parts service business in the mining business of HCM. The tender offer was executed from November 1, 2016 to April 7, 2017, and HCM had acquired the majority of the ownership ratio of voting rights in Bradken and Bradken became a consolidated subsidiary of HCM on March 20, 2017. As a result of the tender offer, HCM acquired over 90% of the total number of issued shares of Bradken. Since HCM proceeded with a squeeze-out procedure to acquire the remaining shares of Bradken held by its minority shareholders aiming to make Bradken a wholly owned subsidiary, HCM accounted for the acquisition as if it had substantially acquired 100% of the shares of Bradken. The following table summarizes the fair value of the consideration paid for Bradken and the provisional amounts of the assets acquired and liabilities assumed recognized as of the acquisition date.
Millions of yen Cash and cash equivalents 3,572 Trade receivables 7,950 Inventories 17,593 Other current assets 3,895 Property, plant and equipment 30,488 Intangible assets Goodwill (not deductible for tax purposes) 24,781 Other intangible assets 19,870 Other non-current assets 5,562 Total 113,711 Current liabilities 43,150 Non-current liabilities 11,947 Total 55,097 Consideration for acquisition 58,614
The goodwill mainly comprises excess earning power and expected synergies arising from the acquisition. The consideration, paid in cash, for the 68.62% ownership interest by March 31, 2017 was ¥40,336 million. Unpaid consideration of ¥18,278 million as of March 31, 2017 was recognized in Other financial liabilities in the consolidated statement of financial position. The Company paid the remaining amount in full during the nine months ended December 31, 2017. The Company completed evaluating the fair values to be assigned to certain assets and liabilities of Bradken at the acquisition date, and therefore such amounts have been adjusted accordingly to reflect the evaluation results. Since the Company is still in the process of evaluating the fair values of the remaining assets and liabilities at the acquisition date, these amounts are subject to change. The results of operations of Bradken for the period from the acquisition date to March 31, 2017 were not material. On a pro forma basis, revenues and net income attributable to Hitachi, Ltd. stockholders using an assumed acquisition date for Bradken of April 1, 2016 would not differ materially from the amounts reported in the consolidated financial statements in the year ended March 31, 2017. Since these adjustments to the provisional amounts of assets acquired and liabilities assumed recognized as of the acquisition date are not material, the amounts as of March 31, 2017 disclosed as comparative information in the condensed quarterly consolidated statement of financial position have not been retrospectively adjusted.
F-12
Notes to Condensed Quarterly Consolidated Financial StatementsDecember 31, 2017
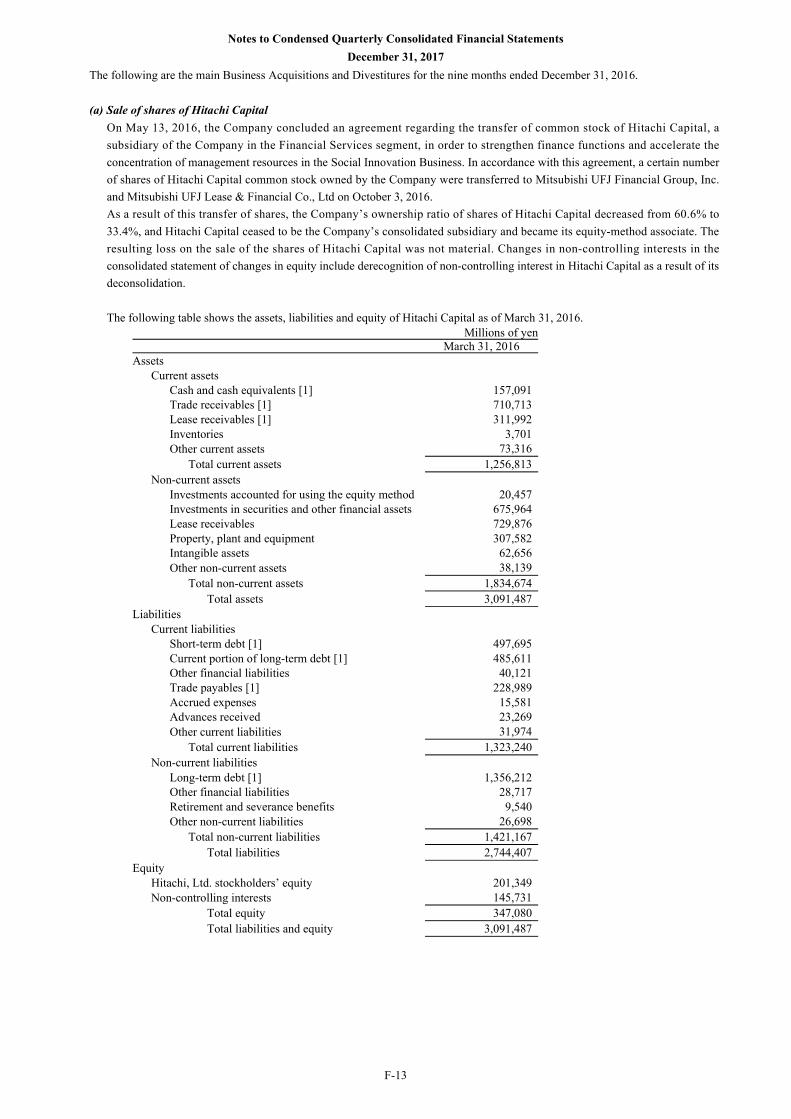
The following are the main Business Acquisitions and Divestitures for the nine months ended December 31, 2016.
(a) Sale of shares of Hitachi Capital On May 13, 2016, the Company concluded an agreement regarding the transfer of common stock of Hitachi Capital, a subsidiary of the Company in the Financial Services segment, in order to strengthen finance functions and accelerate the concentration of management resources in the Social Innovation Business. In accordance with this agreement, a certain number of shares of Hitachi Capital common stock owned by the Company were transferred to Mitsubishi UFJ Financial Group, Inc. and Mitsubishi UFJ Lease & Financial Co., Ltd on October 3, 2016. As a result of this transfer of shares, the Company’s ownership ratio of shares of Hitachi Capital decreased from 60.6% to 33.4%, and Hitachi Capital ceased to be the Company’s consolidated subsidiary and became its equity-method associate. The resulting loss on the sale of the shares of Hitachi Capital was not material. Changes in non-controlling interests in the consolidated statement of changes in equity include derecognition of non-controlling interest in Hitachi Capital as a result of its deconsolidation. The following table shows the assets, liabilities and equity of Hitachi Capital as of March 31, 2016.
Millions of yen March 31, 2016
Assets Current assets
Cash and cash equivalents [1] 157,091 Trade receivables [1] 710,713 Lease receivables [1] 311,992 Inventories 3,701 Other current assets 73,316
Total current assets 1,256,813 Non-current assets
Investments accounted for using the equity method 20,457 Investments in securities and other financial assets 675,964 Lease receivables 729,876 Property, plant and equipment 307,582 Intangible assets 62,656 Other non-current assets 38,139
Total non-current assets 1,834,674 Total assets 3,091,487
Liabilities Current liabilities
Short-term debt [1] 497,695 Current portion of long-term debt [1] 485,611 Other financial liabilities 40,121 Trade payables [1] 228,989 Accrued expenses 15,581 Advances received 23,269 Other current liabilities 31,974
Total current liabilities 1,323,240 Non-current liabilities
Long-term debt [1] 1,356,212 Other financial liabilities 28,717 Retirement and severance benefits 9,540 Other non-current liabilities 26,698
Total non-current liabilities 1,421,167 Total liabilities 2,744,407
Equity Hitachi, Ltd. stockholders’ equity 201,349 Non-controlling interests 145,731
Total equity 347,080 Total liabilities and equity 3,091,487
F-13
Notes to Condensed Quarterly Consolidated Financial StatementsDecember 31, 2017
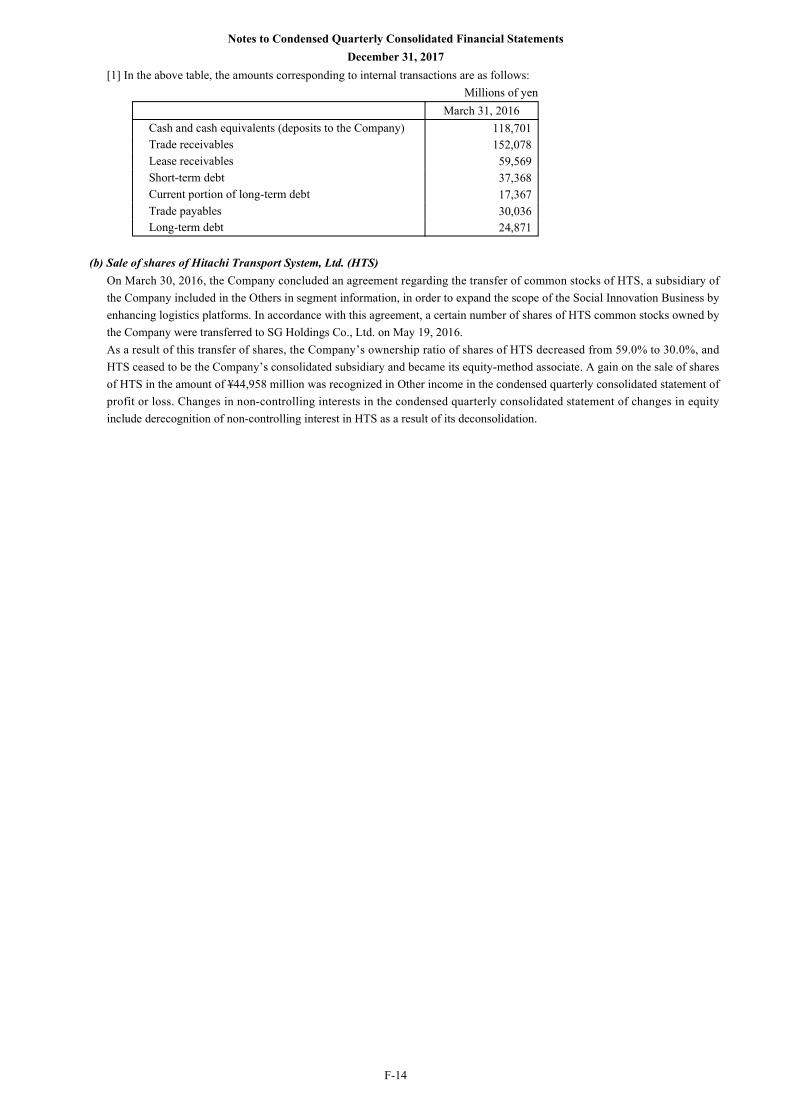
[1] In the above table, the amounts corresponding to internal transactions are as follows: Millions of yen March 31, 2016 Cash and cash equivalents (deposits to the Company) 118,701 Trade receivables 152,078 Lease receivables 59,569 Short-term debt 37,368 Current portion of long-term debt 17,367 Trade payables 30,036 Long-term debt 24,871
(b) Sale of shares of Hitachi Transport System, Ltd. (HTS)
On March 30, 2016, the Company concluded an agreement regarding the transfer of common stocks of HTS, a subsidiary of the Company included in the Others in segment information, in order to expand the scope of the Social Innovation Business by enhancing logistics platforms. In accordance with this agreement, a certain number of shares of HTS common stocks owned by the Company were transferred to SG Holdings Co., Ltd. on May 19, 2016. As a result of this transfer of shares, the Company’s ownership ratio of shares of HTS decreased from 59.0% to 30.0%, and HTS ceased to be the Company’s consolidated subsidiary and became its equity-method associate. A gain on the sale of shares of HTS in the amount of ¥44,958 million was recognized in Other income in the condensed quarterly consolidated statement of profit or loss. Changes in non-controlling interests in the condensed quarterly consolidated statement of changes in equity include derecognition of non-controlling interest in HTS as a result of its deconsolidation.
F-14
Notes to Condensed Quarterly Consolidated Financial StatementsDecember 31, 2017

(6) Fair Value of Financial Instruments (a) Fair Value Measurements
The following methods and assumptions are used to measure the fair value of financial assets and liabilities.
Cash and cash equivalents, Trade receivables, Short-term loans receivable, Other receivables, Short-term debt, Other payables and Trade payables The carrying amount approximates the fair value because of the short maturity of these instruments.
Investments in securities and other financial assets The fair value of lease receivables is based on the present value of lease payments receivable based on years to maturity, using discount rates that reflect the time to maturity and credit risk. Investment securities with quoted market prices are estimated using the quoted share prices. In the absence of an active market for investment securities, quoted prices for similar investment securities, quoted prices associated with transactions that are not distressed for identical or similar investment securities or other relevant information including market interest rate curves, referenced credit spreads or default rates, are used to determine fair value. If significant inputs of fair value measurement are unobservable, the Company uses price information provided by financial institutions to evaluate such investments. The information provided is corroborated by the income approach using its own valuation model, or the market approach using comparisons with prices of similar securities.
The fair value of long-term loans receivable is estimated based on the present value of future cash flows using the interest rate applicable to an additional loan of the same type.
Derivative assets are measured at fair value based on quoted prices associated with transactions that are not distressed, prices in inactive markets, or based on models using interest rate curves and forward and spot prices for currencies and commodities. If significant inputs are unobservable, the Company mainly uses the income approach or the market approach to corroborate relevant information provided by financial institutions and other available information.
Long-term debt The fair value of long-term debt is estimated based on quoted market prices or the present value of future cash flows using the market interest rates applicable to the same contractual terms.
Other financial liabilities Derivative liabilities are measured at fair value based on quoted prices associated with transactions that are not distressed, prices in inactive markets, or based on models using interest rate curves and forward and spot prices for currencies and commodities. If significant inputs are unobservable, the Company uses mainly the income approach or the market approach to corroborate relevant information provided by financial institutions and other available information.
F-15
Notes to Condensed Quarterly Consolidated Financial StatementsDecember 31, 2017

(b) Financial Instruments Measured at Amortized Cost The carrying amounts and estimated fair values of the financial instruments measured at amortized cost as of December 31 and March 31, 2017 are as follows. The fair value estimated for financial assets and liabilities measured at amortized cost is classified in Level 2 of the fair value hierarchy.
Millions of yen
December 31, 2017 March 31, 2017
Carrying amounts Estimated fair values Carrying amounts Estimated
fair values
Assets Investments in securities and other financial assets
Lease receivables 89,354 89,855 81,011 82,007
Debt securities 62,224 62,229 155,745 155,751
Long-term loans receivable 100,656 102,376 102,384 103,257
Liabilities
Long-term debt [1]
Lease obligations 48,862 49,135 49,703 50,027
Bonds 149,782 153,515 159,820 164,037
Long-term debt 764,663 771,644 770,723 777,341
[1] Long-term debt is included in Current portion of long-term debt and Long-term debt in the condensed quarterly consolidated
statement of financial position.
(c) Financial Instruments Measured at Fair Value Financial instruments measured at fair value on a recurring basis after the initial recognition are classified into three levels of the fair value hierarchy based on the measurement inputs’ observability as follows:
Level 1: Quoted prices (unadjusted) for identical assets or liabilities in active markets Level 2: Valuations measured by direct or indirect observable inputs other than Level 1 Level 3: Valuations measured by significant unobservable inputs
When several inputs are used for a fair value measurement, the level is determined based on the input that is significant with the lowest level in the fair value measurement as a whole. Transfers between levels are deemed at the beginning of each quarter period.
F-16
Notes to Condensed Quarterly Consolidated Financial StatementsDecember 31, 2017

The following tables present the assets and liabilities that are measured at fair value on a recurring basis as of December 31 and March 31, 2017.
December 31, 2017 Millions of yen
Class of financial instruments Level 1 Level 2 Level 3 Total
FVTPL financial assets: Investments in securities and other financial assets
Equity securities - - 1,047 1,047
Debt securities 11,728 7,045 8,932 27,705
Derivatives - 28,559 7,839 36,398
FVTOCI financial assets: Investments in securities and other financial assets
Equity securities 329,089 49 114,617 443,755
Total financial assets at fair value 340,817 35,653 132,435 508,905
FVTPL financial liabilities:
Other financial liabilities
Derivatives - 45,499 - 45,499
Total financial liabilities at fair value - 45,499 - 45,499
March 31, 2017 Millions of yen
Class of financial instruments Level 1 Level 2 Level 3 Total
FVTPL financial assets: Investments in securities and other financial assets
Equity securities - - 704 704
Debt securities 11,593 6,814 8,991 27,398
Derivatives - 40,724 6,061 46,785
FVTOCI financial assets: Investments in securities and other financial assets
Equity securities 355,310 104 109,766 465,180
Total financial assets at fair value 366,903 47,642 125,522 540,067
FVTPL financial liabilities:
Other financial liabilities
Derivatives - 57,763 - 57,763
Total financial liabilities at fair value - 57,763 - 57,763
F-17
Notes to Condensed Quarterly Consolidated Financial StatementsDecember 31, 2017

The following tables present the changes in Level 3 instruments measured on a recurring basis for the nine months ended December 31, 2017 and 2016.
December 31, 2017 Millions of yen
Level 3 financial assets Equity securities
Debt securities Derivatives Total
Balance at beginning of period 110,470 8,991 6,061 125,522 Gain (loss) in profit or loss [1] 35 (60) 72 47 Gain in OCI [2] 6,262 - - 6,262 Purchases 3,148 593 1,706 5,447 Sales and redemption (4,736) (595) - (5,331) Acquisitions and divestitures 254 (20) - 234 Other 231 23 - 254
Balance at end of period 115,664 8,932 7,839 132,435 Unrealized gain relating to financial assets held at end of period [4]
35 7 72 114
December 31, 2016 Millions of yen
Level 3 financial assets Equity securities
Debt securities Derivatives Total
Balance at beginning of period 117,317 38,025 6,061 161,403 Gain (loss) in profit or loss [1] 30 (79) - (49) Loss in OCI [2] (2,337) - - (2,337) Purchases 2,298 1,940 - 4,238 Sales and redemption (2,903) (11,045) - (13,948) Acquisitions and divestitures (4,492) (19,506) - (23,998) Transfer from Level 3 [3] (168) - - (168) Other 432 (742) - (310)
Balance at end of period 110,177 8,593 6,061 124,831 Unrealized gain (loss) relating to financial assets held at end of period [4]
54 (68) - (14)
[1] Gain (loss) in profit or loss related to FVTPL financial assets is included in Financial income and Financial expenses in the
condensed quarterly consolidated statement of profit or loss. [2] Gain (loss) in OCI related to FVTOCI financial assets is included in Net changes in financial assets measured at fair value
through OCI in the condensed quarterly consolidated statement of comprehensive income. [3] Transfer from Level 3 is mainly the result of an investee being listed on the stock market. [4] Unrealized gain (loss) relating to FVTPL financial assets held at the end of period is included in Financial income and
Financial expenses in the condensed quarterly consolidated statement of profit or loss.
Written put options on non-controlling interests of subsidiaries are not included in the above table. Such put options are classified as Level 3 financial liabilities measured on a recurring basis, and changes in fair value are recognized in Capital surplus. The fair value of the put options above as of December 31 and March 31, 2017 were ¥16,868 million and ¥14,495 million, respectively, included in Other financial liabilities in the condensed quarterly consolidated statement of financial position. Fair values are measured by the finance departments in accordance with the Company’s policies and procedures. Valuation models are determined so that they reflect each financial instrument’s nature, characteristics and risks most appropriately. The finance departments continually examine changes in important inputs that could affect the fair value. In case the fair value of a financial instrument was significantly impaired, administrators review and approve the impairment loss.
F-18
Notes to Condensed Quarterly Consolidated Financial StatementsDecember 31, 2017
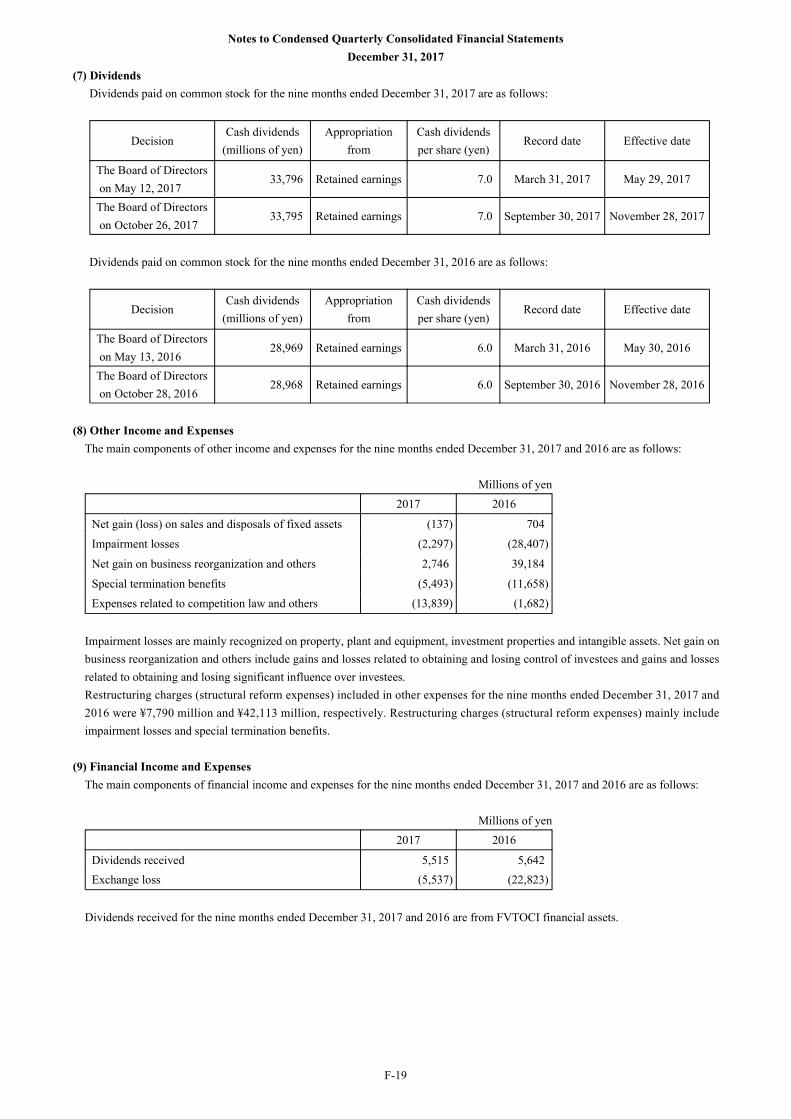
(7) Dividends Dividends paid on common stock for the nine months ended December 31, 2017 are as follows:
Decision Cash dividends
(millions of yen) Appropriation
from Cash dividends per share (yen)
Record date Effective date
The Board of Directors on May 12, 2017
33,796 Retained earnings 7.0 March 31, 2017 May 29, 2017
The Board of Directors on October 26, 2017
33,795 Retained earnings 7.0 September 30, 2017 November 28, 2017
Dividends paid on common stock for the nine months ended December 31, 2016 are as follows:
Decision Cash dividends
(millions of yen) Appropriation
from Cash dividends per share (yen)
Record date Effective date
The Board of Directors on May 13, 2016
28,969 Retained earnings 6.0 March 31, 2016 May 30, 2016
The Board of Directors on October 28, 2016
28,968 Retained earnings 6.0 September 30, 2016 November 28, 2016
(8) Other Income and Expenses
The main components of other income and expenses for the nine months ended December 31, 2017 and 2016 are as follows:
Millions of yen 2017 2016
Net gain (loss) on sales and disposals of fixed assets (137) 704
Impairment losses (2,297) (28,407)
Net gain on business reorganization and others 2,746 39,184
Special termination benefits (5,493) (11,658)
Expenses related to competition law and others (13,839) (1,682)
Impairment losses are mainly recognized on property, plant and equipment, investment properties and intangible assets. Net gain on business reorganization and others include gains and losses related to obtaining and losing control of investees and gains and losses related to obtaining and losing significant influence over investees. Restructuring charges (structural reform expenses) included in other expenses for the nine months ended December 31, 2017 and 2016 were ¥7,790 million and ¥42,113 million, respectively. Restructuring charges (structural reform expenses) mainly include impairment losses and special termination benefits.
(9) Financial Income and Expenses
The main components of financial income and expenses for the nine months ended December 31, 2017 and 2016 are as follows:
Millions of yen 2017 2016
Dividends received 5,515 5,642 Exchange loss (5,537) (22,823)
Dividends received for the nine months ended December 31, 2017 and 2016 are from FVTOCI financial assets.
F-19
Notes to Condensed Quarterly Consolidated Financial StatementsDecember 31, 2017
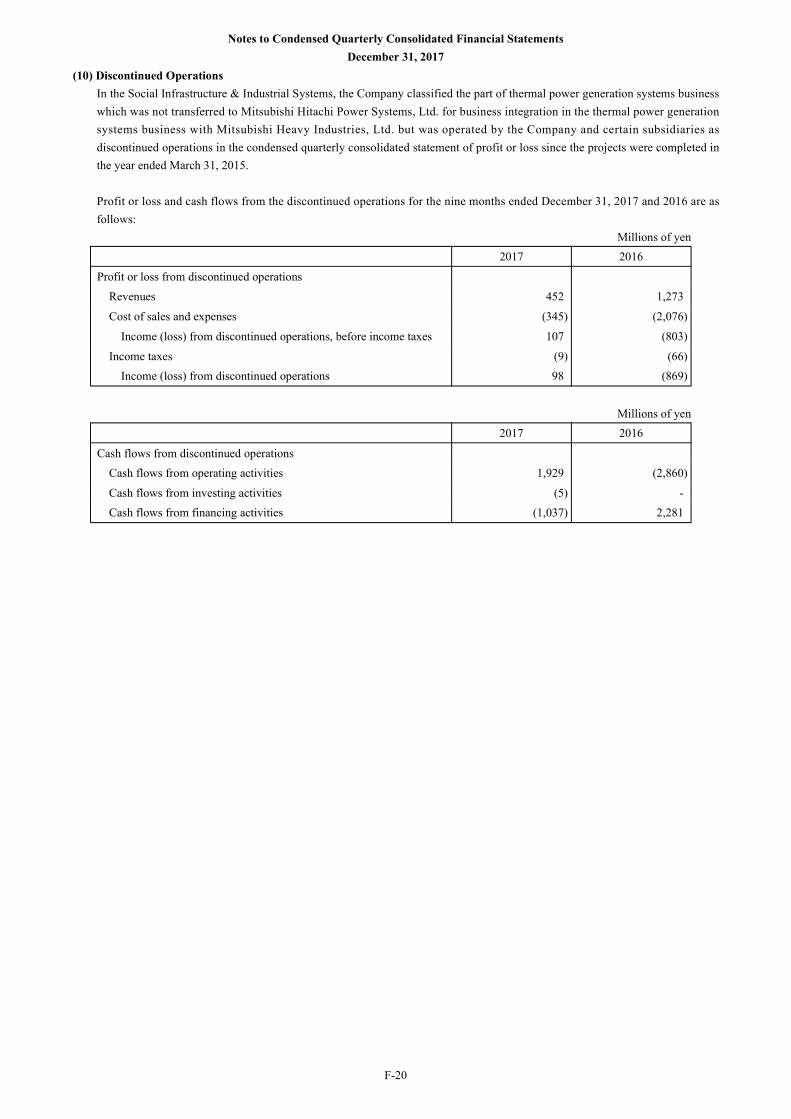
(10) Discontinued Operations In the Social Infrastructure & Industrial Systems, the Company classified the part of thermal power generation systems business which was not transferred to Mitsubishi Hitachi Power Systems, Ltd. for business integration in the thermal power generation systems business with Mitsubishi Heavy Industries, Ltd. but was operated by the Company and certain subsidiaries as discontinued operations in the condensed quarterly consolidated statement of profit or loss since the projects were completed in the year ended March 31, 2015.
Profit or loss and cash flows from the discontinued operations for the nine months ended December 31, 2017 and 2016 are as follows:
Millions of yen 2017 2016
Profit or loss from discontinued operations
Revenues 452 1,273
Cost of sales and expenses (345) (2,076)
Income (loss) from discontinued operations, before income taxes 107 (803)
Income taxes (9) (66)
Income (loss) from discontinued operations 98 (869)
Millions of yen
2017 2016
Cash flows from discontinued operations
Cash flows from operating activities 1,929 (2,860)
Cash flows from investing activities (5) -
Cash flows from financing activities (1,037) 2,281
F-20
Notes to Condensed Quarterly Consolidated Financial StatementsDecember 31, 2017
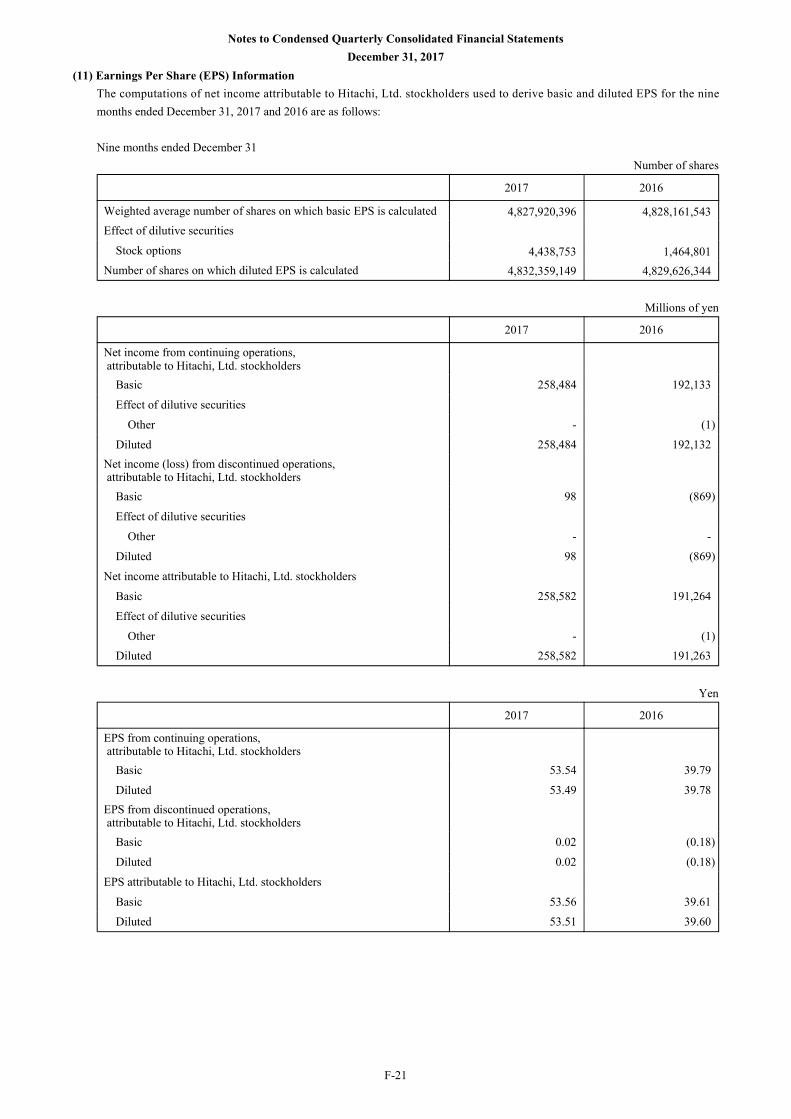
(11) Earnings Per Share (EPS) Information The computations of net income attributable to Hitachi, Ltd. stockholders used to derive basic and diluted EPS for the nine months ended December 31, 2017 and 2016 are as follows:
Nine months ended December 31 Number of shares
2017 2016
Weighted average number of shares on which basic EPS is calculated 4,827,920,396 4,828,161,543 Effect of dilutive securities
Stock options 4,438,753 1,464,801 Number of shares on which diluted EPS is calculated 4,832,359,149 4,829,626,344
Millions of yen
2017 2016
Net income from continuing operations, attributable to Hitachi, Ltd. stockholders
Basic 258,484 192,133
Effect of dilutive securities
Other - (1)
Diluted 258,484 192,132 Net income (loss) from discontinued operations, attributable to Hitachi, Ltd. stockholders
Basic 98 (869)
Effect of dilutive securities
Other - -
Diluted 98 (869)
Net income attributable to Hitachi, Ltd. stockholders
Basic 258,582 191,264
Effect of dilutive securities
Other - (1)
Diluted 258,582 191,263
Yen
2017 2016
EPS from continuing operations, attributable to Hitachi, Ltd. stockholders
Basic 53.54 39.79
Diluted 53.49 39.78 EPS from discontinued operations, attributable to Hitachi, Ltd. stockholders
Basic 0.02 (0.18)
Diluted 0.02 (0.18)
EPS attributable to Hitachi, Ltd. stockholders
Basic 53.56 39.61
Diluted 53.51 39.60
F-21
Notes to Condensed Quarterly Consolidated Financial StatementsDecember 31, 2017

The computations of net income attributable to Hitachi, Ltd. stockholders used to derive basic and diluted EPS for the three months ended December 31, 2017 and 2016 are as follows:
Three months ended December 31 Number of shares
2017 2016
Weighted average number of shares on which basic EPS is calculated 4,827,814,687 4,828,115,494 Effect of dilutive securities
Stock options 4,480,400 2,165,700 Number of shares on which diluted EPS is calculated 4,832,295,087 4,830,281,194
Millions of yen
2017 2016
Net income from continuing operations, attributable to Hitachi, Ltd. stockholders
Basic 96,597 78,657
Effect of dilutive securities
Other - (0)
Diluted 96,597 78,657 Net income (loss) from discontinued operations, attributable to Hitachi, Ltd. stockholders
Basic 1,372 (893)
Effect of dilutive securities
Other - -
Diluted 1,372 (893)
Net income attributable to Hitachi, Ltd. stockholders
Basic 97,969 77,764
Effect of dilutive securities
Other - (0)
Diluted 97,969 77,764
Yen
2017 2016
EPS from continuing operations, attributable to Hitachi, Ltd. stockholders
Basic 20.01 16.29
Diluted 19.99 16.28 EPS from discontinued operations, attributable to Hitachi, Ltd. stockholders
Basic 0.28 (0.18)
Diluted 0.28 (0.18)
EPS attributable to Hitachi, Ltd. stockholders
Basic 20.29 16.11
Diluted 20.27 16.10
F-22
Notes to Condensed Quarterly Consolidated Financial StatementsDecember 31, 2017

(12) Contingencies (a)Litigation
In June 2009, a subsidiary in Japan received a grand jury subpoena in connection with the investigation conducted by the Antitrust Division of the U.S. Department of Justice and received requests for information from the European Commission in respect of alleged antitrust violations relating to optical disk drives. In November 2011, the subsidiary in Japan paid a fine in relation to the investigation from the Antitrust Division of the U.S. Department of Justice. In July 2012, the subsidiary in Japan received a statement of objections from the European Commission in respect of alleged antitrust violations. In October 2015, the European Commission announced the amount of the fine for the subsidiary in Japan in respect of alleged antitrust violations, and in June 2016, two subsidiaries in Japan and Korea paid the fines. In July 2011, a subsidiary in the U.S.A. received a grand jury subpoena from the Antitrust Division of the U.S. Department of Justice, the Company and a subsidiary in Europe received requests for information from the European Commission, and a subsidiary in Canada received requests for information from the Canadian Competition Bureau, all in respect of alleged antitrust violations relating to automotive equipment. In November 2013, a subsidiary in Japan, which had been also primarily responsible for responding to the investigation from the Antitrust Division of the U.S. Department of Justice, paid fines. In January 2016, the Company and the subsidiary in Japan which had been also primarily responsible for responding to the investigation from European Commission reached a settlement with the European Commission, and paid fines in April 2016. In April 2014, a subsidiary in the U.S.A. received a grand jury subpoena in connection with the investigation conducted by the Antitrust Division of the U.S. Department of Justice in respect of alleged antitrust violations relating to automotive equipment. In August 2016, a subsidiary in Japan, which had been also primarily responsible for responding to the investigation, concluded an agreement in which the subsidiary will pay fines, and paid fines in March 2017. In June 2014, a subsidiary in Japan was investigated by the Japan Fair Trade Commission in respect of alleged antitrust violations relating to capacitors. In March 2016, the subsidiary received a notice that the investigation was over from the Japan Fair Trade Commission. The subsidiary in Japan and subsidiaries in Europe, the U.S.A., and others are being investigated by competition authorities in each country or region, all in respect of alleged antitrust violations relating to capacitors. In April 2016, the subsidiary in Japan concluded an agreement in which the subsidiary will pay fines, and in June 2016, the subsidiary in Japan paid the fines. In November 2015, the subsidiaries in Japan received a statement of objections from the European Commission in respect of alleged antitrust violations. In addition to the above, the Company, its subsidiaries and associates have cooperated with the competent authorities. Depending upon the outcome of these matters, fines or surcharge payments, the amount of which is uncertain, may be imposed on them. Also, in connection with pending and settled antitrust violations, civil disputes, including class action lawsuits, involving the Company and some of these companies have arisen in a number of countries, including in the U.S.A. and Canada. An amount, which was considered to be a reasonable estimate in respect of these claims, was accrued for the potential losses in relation to certain of these civil disputes. In August 2012, a subsidiary in Europe received a complaint filed by a customer in Europe seeking compensation for consequential losses of EUR 1,058 million (¥142,846 million), additional costs and interest allegedly incurred by the delay in the construction process of a power plant against, jointly and severally, the Company, the subsidiary in Europe, a consortium including the Company and the subsidiary in Europe, and two other companies. In addition, in October 2013 and February 2016, the subsidiary in Europe received additional complains requesting compensation for consequential losses of EUR 239 million (¥32,317 million) and EUR 105 million (¥14,120 million), respectively. In June 2016, the Company was informed that the customer added an associate in Europe as one of the defendants. Although the Company, the subsidiary and the associate in Europe and the consortium will vigorously defend themselves against this lawsuit, there can be no assurance that they will not be held liable for any amounts claimed. In December 2013, the Company, a subsidiary in Europe and a consortium consisting of the Company and the subsidiary in Europe, jointly and severally received a request from a customer in Europe to refer a dispute to arbitration demanding EUR 637 million (¥85,980 million) in compensation for consequential losses allegedly incurred by the delay in the construction process of a power plant. In November 2016, an arbitral award was issued by an arbitral tribunal and the award was paid in February 2017. In addition, a settlement regarding a part of unsettled matters was paid in July 2017. The customer, the Company, the subsidiary in Europe and the consortium consisting of the Company and the subsidiary in Europe continue their negotiations to achieve a final settlement regarding other unsettled matters.
F-23
Notes to Condensed Quarterly Consolidated Financial StatementsDecember 31, 2017

In addition, in December 2015, these companies, jointly and severally received a request for arbitration from the customer demanding EUR 161 million (¥21,769 million) in compensation primarily for performance related deficiencies of a power plant. As of December 31, 2017, the amount of compensation claimed by the customer was changed to EUR 163 million (¥22,102 million). Although, the Company, the subsidiary in Europe and the consortium consisting of the Company and the subsidiary in Europe will vigorously defend themselves against this lawsuit, there can be no assurance that they will not be held liable for any amounts claimed. In January 2016, a subsidiary in Europe notified its customer in Europe that the subsidiary had commenced arbitration proceedings to resolve a disagreement about construction of a power plant, and then the arbitration was started. While the subsidiary is seeking payments of the unpaid amounts based on the contract, a counterclaim was filed by the customer. Thus, there can be no assurance that the subsidiary will not be held liable for any amounts. In November 2017, a subsidiary in Japan received a complaint that was filed against three companies, including the subsidiary in Japan, by a contractee in Japan seeking approximately ¥45.9 billion in compensation for expenses of allegedly incurred arising from concerns over partial deficiencies of piling work during the construction phases of a condominium. Although the subsidiary in Japan will address this claim and explain its position, there can be no assurance that it will not be held liable for any amounts claimed. In December 2017, a subsidiary and an associate in Europe received a complaint filed by a customer in Europe seeking compensation for consequential losses of EUR 263 million (¥35,495 million) and interest allegedly incurred by performance defects of a power plant. Although the subsidiary and the associate in Europe will vigorously defend themselves against this lawsuit, there can be no assurance that they will not be held liable for any amounts claimed. The Company and its subsidiaries execute a number of business reorganizations, including mergers, acquisitions and divestitures. Contracts for these reorganizations include clauses for transaction price adjustments subsequent to the reorganizations. There is a possibility products or services provided by the Company and its subsidiaries contain defects. As the result of price adjustments, or in compensation for defects in products or services etc. there is a possibility that the Company pays for any amounts. Depending upon the outcome of the above legal proceedings, there may be an adverse effect on the consolidated financial position or results of operations. Currently, the Company is unable to estimate the adverse effect, if any, of many of these proceedings. The actual amount of fines, surcharge payments or any other payments resulting from these legal proceedings may be different from the accrued amounts.
In addition to the above, the Company and its subsidiaries are subject to legal proceedings and claims which have arisen in the ordinary course of business and have not been finally adjudicated. These actions when ultimately concluded and determined will not, in the opinion of management, have a material adverse effect on the condensed quarterly consolidated financial position or results of operations of the Company and subsidiaries.
(b)Other On February 1, 2014 (hereinafter the “effective date of company split”), the Company and Mitsubishi Heavy Industries, Ltd. (hereinafter “MHI”) integrated their thermal power generation systems businesses into MHI’s consolidated subsidiary, MITSUBISHI HITACHI POWER SYSTEMS, LTD. (hereinafter “MHPS”), through a spin-off in the form of an absorption-type company-split. As part of this business integration, assets and liabilities associated with boiler construction projects for Medupi and Kusile Power Stations for which the Company’s consolidated subsidiaries in the Republic of South Africa, Hitachi Power Africa Proprietary Limited (hereinafter “HPA”) and other companies received orders in 2007, as well as their contractual status in relation to customers, and rights and obligations thereof were transferred from HPA to MHI’s consolidated subsidiary, Mitsubishi Hitachi Power Systems Africa Proprietary Limited (hereinafter “MHPS Africa”) (hereinafter, the “Transfer of South African Business”). Under the agreement executed between the Company and MHI regarding the Transfer of South African Business, the Company and HPA shall be liable for contingent liabilities resulting from events that occurred before the effective date of company split as well as claims that had already been made as of the said date, while MHPS and MHPS Africa shall be held responsible for the execution of business on and after the effective date of company split. Given these conditions, it has been agreed upon to determine the final transfer price upon agreement on future construction schedule as of the effective date of company split and
F-24
Notes to Condensed Quarterly Consolidated Financial StatementsDecember 31, 2017

confirmation of estimated project cash flows based on such schedule between the parties, and settle the difference with the provisional price. On March 31, 2016, MHI requested the Company to pay ZAR 48,200 million (approximately ¥379.0 billion when ZAR 1 = ¥7.87) to MHPS Africa as a portion of transfer price adjustment, etc. The Company replied to MHI on April 6, 2016 that the details of the demand letter lacked legal grounds under any agreement and thus the Company cannot accept it. On January 31, 2017, MHI extended the amount above and requested the Company to pay ZAR 89,700 million (approximately ¥763.4 billion when ZAR 1 = ¥8.51). The Company again replied to MHI that the Company cannot accept the request since it lacks legal grounds under any agreement as does the request of March 2016. On August 21, 2017, the Company received a notice from the Japan Commercial Arbitration Association (hereinafter, the “JCAA”) stating that MHI had filed a request for arbitration with the JCAA on July 31, 2017 in order to claim for payment of ZAR 90,779 million (approximately ¥774.3 billion when ZAR 1 = ¥8.53) as the said transfer price adjustment, etc. against the Company. The Company will address this claim and explain its position in the arbitration proceedings. The Company has recorded provisions based on reasonable estimates for the aforementioned agreement related to the South African Business. The amount of the said transfer price adjustment, etc. to be determined under the agreement may be different from the accrued amount.
(13) Approval of Condensed Quarterly Consolidated Financial Statements
The condensed quarterly consolidated financial statements were approved on February 7, 2018 by Toshiaki Higashihara, President and CEO of the Company.
F-25
Notes to Condensed Quarterly Consolidated Financial StatementsDecember 31, 2017
[Cover] [Document Filed] Confirmation Letter [Applicable Law] Article 24-4-8, Paragraph 1 of the Financial Instruments and Exchange Act of Japan [Filed with] Director, Kanto Local Finance Bureau [Filing Date] February 7 , 2018 [Company Name] Kabushiki Kaisha Hitachi Seisakusho [Company Name in English] Hitachi, Ltd. [Title and Name of Representative] Toshiaki Higashihara, President & CEO [Name and title of CFO] Mitsuaki Nishiyama, Senior Vice President and Executive Officer [Address of Head Office] 6-6, Marunouchi 1-chome, Chiyoda-ku, Tokyo [Place Where Available for Public Inspection] Tokyo Stock Exchange, Inc.
(2-1, Nihombashi Kabutocho, Chuo-ku, Tokyo) Nagoya Stock Exchange, Inc. (8-20, Sakae 3-chome, Naka-ku, Nagoya)
A-1

1. Matters Related to Adequacy of Statements Contained in the Quarterly Report Mr. Toshiaki Higashihara, President & CEO, and Mr. Mitsuaki Nishiyama, Senior Vice President and Executive Officer, confirmed that statements contained in the Quarterly Report for the third quarter of the 149th fiscal year (from October 1, 2017 to December 31, 2017) were adequate under the Financial Instruments and Exchange Act.
2. Special Notes
None.
A-2


![Quarterly Report - Hitachi · 2020-02-28 · Hitachi Kokusai Electric Inc. [Consolidated subsidiaries] Hitachi Industry & Control Solutions, Ltd. Hitachi Plant Services Co., Ltd](https://img.pdfslide.us/doc/110x75/5f2f7176f85d3c1d652bbf74/quarterly-report-2020-02-28-hitachi-kokusai-electric-inc-consolidated-subsidiaries.jpg)