Embed Size (px)
Citation preview
Q U A R T E R L Y R E P O R T
2017 THIRD QUARTER
2 QUARTERLY REPORT Q3 2017
Contents Highlights 3
Group summary 5
Business areas 6
Other matters 7
Outlook 7
Financial statements 9
Notes to the financial statements 12
Definitions 15
Financial calendar and investor information 16
3 QUARTERLY REPORT Q3 2017
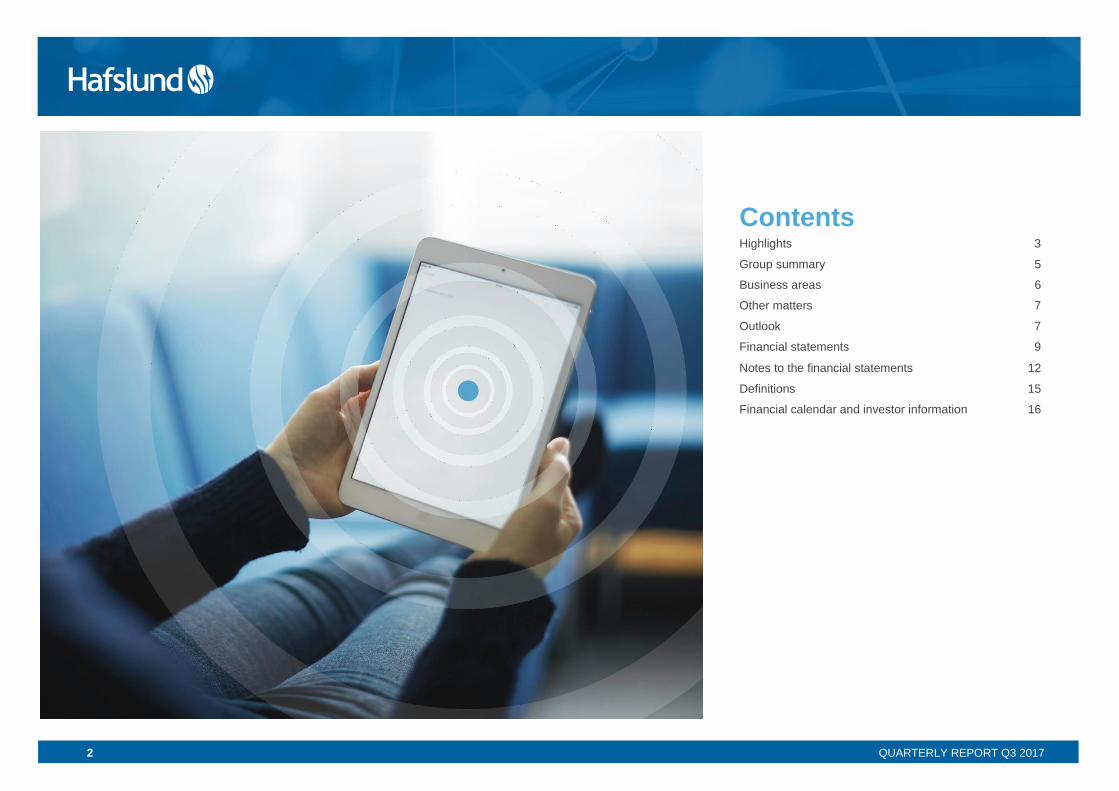
Highlights per third quarter 2017
Hafslund ASA de-listed from Oslo Stock Exchange, de-merger and Hafslund AS established effective 4 August, with main business Hafslund Nett.
Hafslund Marked, Hafslund Varme and Hafslund Produksjon spun off and sold to Fortum, E-CO and the Oslo kommune on 4 August.
Year-to-date EBITDA of NOK 1,124 million and year-to-date profit after tax before discontinued operations of NOK 362 million at end of third quarter.
Solid operations and KILE costs in Q3 on a par with last year.
AMS project progressing well – more than half of 700,000 meters installed.
Net debt of NOK 6.2 billion and net debt/EBITDA ratio of 3.9.
Ytd EBITDA
NOK
1,124 million
Net debt/ EBITDA
3.9
4 QUARTERLY REPORT Q3 2017
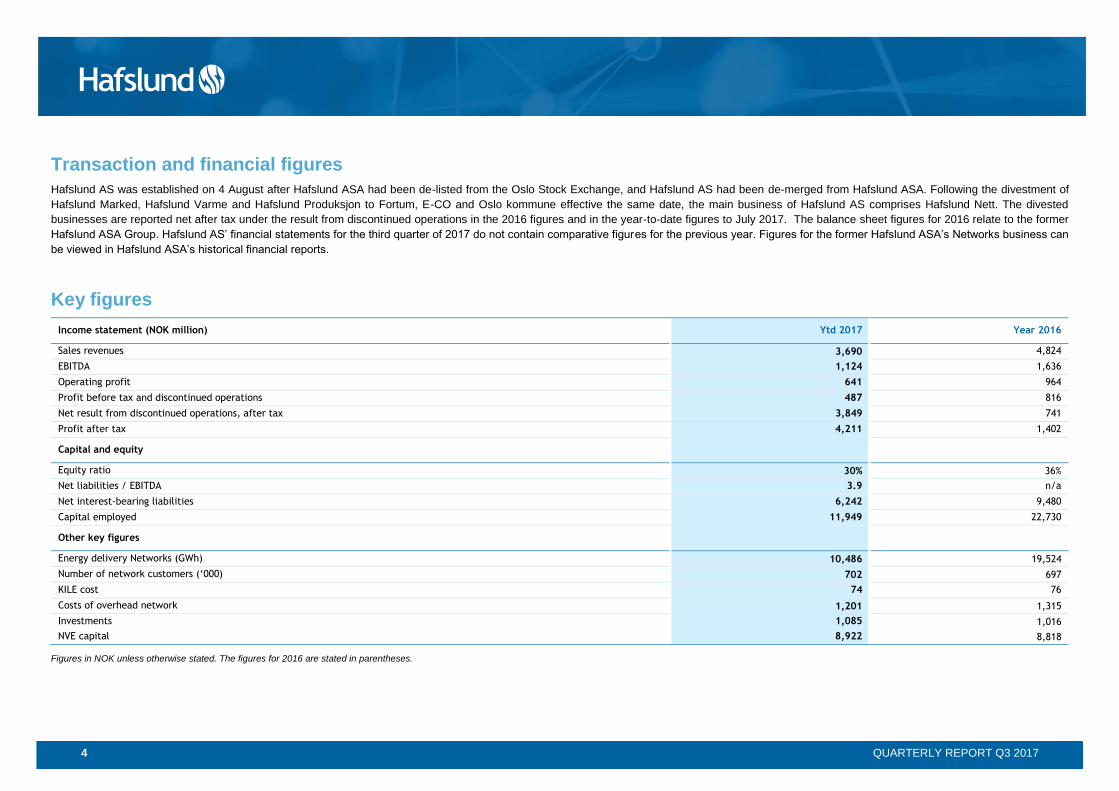
Transaction and financial figures
Hafslund AS was established on 4 August after Hafslund ASA had been de-listed from the Oslo Stock Exchange, and Hafslund AS had been de-merged from Hafslund ASA. Following the divestment of
Hafslund Marked, Hafslund Varme and Hafslund Produksjon to Fortum, E-CO and Oslo kommune effective the same date, the main business of Hafslund AS comprises Hafslund Nett. The divested
businesses are reported net after tax under the result from discontinued operations in the 2016 figures and in the year-to-date figures to July 2017. The balance sheet figures for 2016 relate to the former
Hafslund ASA Group. Hafslund AS’ financial statements for the third quarter of 2017 do not contain comparative figures for the previous year. Figures for the former Hafslund ASA’s Networks business can
be viewed in Hafslund ASA’s historical financial reports.
Key figures
Income statement (NOK million) Ytd 2017 Year 2016
Sales revenues 3,690 4,824
EBITDA 1,124 1,636
Operating profit 641 964
Profit before tax and discontinued operations 487 816
Net result from discontinued operations, after tax 3,849 741
Profit after tax 4,211 1,402
Capital and equity
Equity ratio 30% 36%
Net liabilities / EBITDA 3.9 n/a
Net interest-bearing liabilities 6,242 9,480
Capital employed 11,949 22,730
Other key figures
Energy delivery Networks (GWh) 10,486 19,524
Number of network customers (‘000) 702 697
KILE cost 74 76
Costs of overhead network 1,201 1,315
Investments 1,085 1,016
NVE capital 8,922 8,818
Figures in NOK unless otherwise stated. The figures for 2016 are stated in parentheses.
5 QUARTERLY REPORT Q3 2017
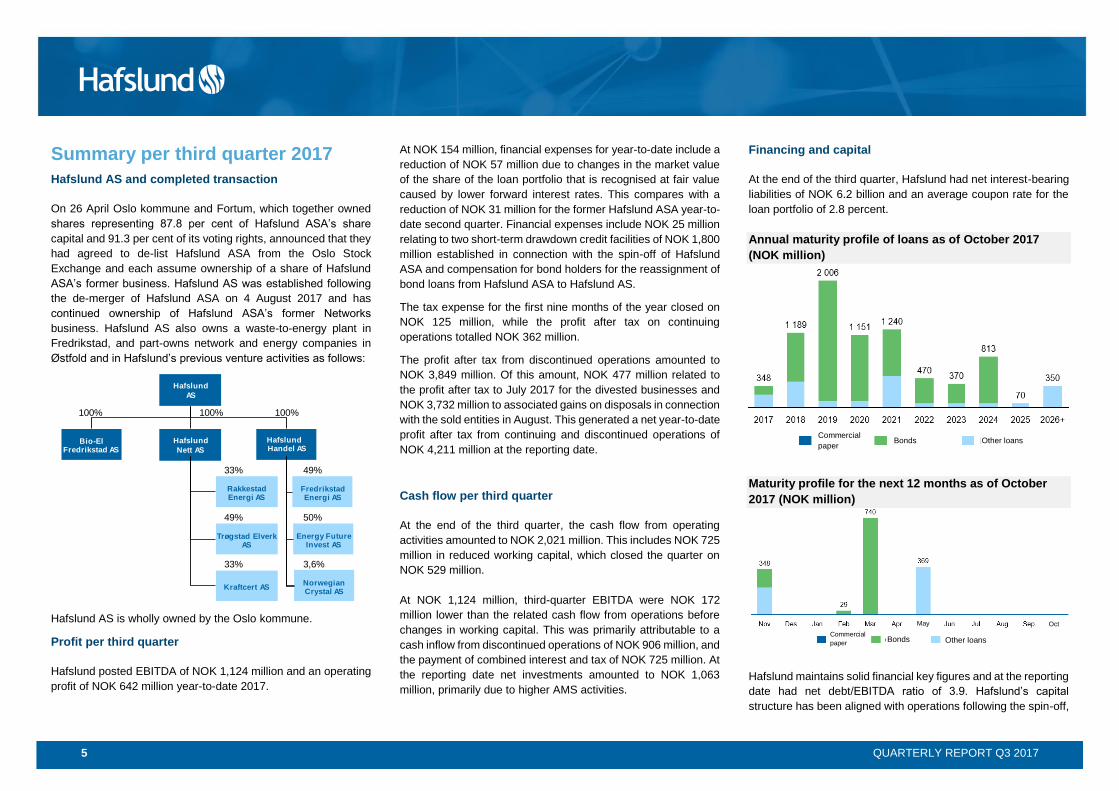
Summary per third quarter 2017
Hafslund AS and completed transaction
On 26 April Oslo kommune and Fortum, which together owned
shares representing 87.8 per cent of Hafslund ASA’s share
capital and 91.3 per cent of its voting rights, announced that they
had agreed to de-list Hafslund ASA from the Oslo Stock
Exchange and each assume ownership of a share of Hafslund
ASA’s former business. Hafslund AS was established following
the de-merger of Hafslund ASA on 4 August 2017 and has
continued ownership of Hafslund ASA’s former Networks
business. Hafslund AS also owns a waste-to-energy plant in
Fredrikstad, and part-owns network and energy companies in
Østfold and in Hafslund’s previous venture activities as follows:
Hafslund AS is wholly owned by the Oslo kommune.
Profit per third quarter
Hafslund posted EBITDA of NOK 1,124 million and an operating
profit of NOK 642 million year-to-date 2017.
At NOK 154 million, financial expenses for year-to-date include a
reduction of NOK 57 million due to changes in the market value
of the share of the loan portfolio that is recognised at fair value
caused by lower forward interest rates. This compares with a
reduction of NOK 31 million for the former Hafslund ASA year-to-
date second quarter. Financial expenses include NOK 25 million
relating to two short-term drawdown credit facilities of NOK 1,800
million established in connection with the spin-off of Hafslund
ASA and compensation for bond holders for the reassignment of
bond loans from Hafslund ASA to Hafslund AS.
The tax expense for the first nine months of the year closed on
NOK 125 million, while the profit after tax on continuing
operations totalled NOK 362 million.
The profit after tax from discontinued operations amounted to
NOK 3,849 million. Of this amount, NOK 477 million related to
the profit after tax to July 2017 for the divested businesses and
NOK 3,732 million to associated gains on disposals in connection
with the sold entities in August. This generated a net year-to-date
profit after tax from continuing and discontinued operations of
NOK 4,211 million at the reporting date.
Cash flow per third quarter
At the end of the third quarter, the cash flow from operating
activities amounted to NOK 2,021 million. This includes NOK 725
million in reduced working capital, which closed the quarter on
NOK 529 million.
At NOK 1,124 million, third-quarter EBITDA were NOK 172
million lower than the related cash flow from operations before
changes in working capital. This was primarily attributable to a
cash inflow from discontinued operations of NOK 906 million, and
the payment of combined interest and tax of NOK 725 million. At
the reporting date net investments amounted to NOK 1,063
million, primarily due to higher AMS activities.
Financing and capital
At the end of the third quarter, Hafslund had net interest-bearing
liabilities of NOK 6.2 billion and an average coupon rate for the
loan portfolio of 2.8 percent.
Annual maturity profile of loans as of October 2017
(NOK million)
Maturity profile for the next 12 months as of October
2017 (NOK million)
Hafslund maintains solid financial key figures and at the reporting
date had net debt/EBITDA ratio of 3.9. Hafslund’s capital
structure has been aligned with operations following the spin-off,
Fredrikstad Energi AS
Energy FutureInvest AS
49%
Norwegian Crystal AS
3,6%
50%
Hafslund
AS
Rakkestad Energi AS
Trøgstad Elverk AS
33%
49%
Kraftcert AS
33%
Hafslund Handel AS
Bio-El Fredrikstad AS
Hafslund
Nett AS
100% 100%100%
Commercial
paper Bonds Other loans
Commercial
paper Bonds Other loans
May Oct
6 QUARTERLY REPORT Q3 2017
with an aim of maintaining a similar credit profile to that of the
former Hafslund ASA. Gross interest-bearing liabilities are
expected to be on a par with net interest-bearing liabilities by the
first half of 2018. Hafslund’s capital requirements will increase
slightly towards the end of 2018, in part due to the completion of
the roll-out of automatic meters (the "AMS project"). The
company’s net-interest bearing liabilities/EBITDA ratio is not
expected in exceed 5.
At the end of the third quarter, Hafslund had cash and cash
equivalents of NOK 2,066 million and a drawdown facility of NOK
500 million that matures in October 2018. Management is
working to establish a new, larger drawdown facility that is
expected to be in place in the fourth quarter of 2017. Hafslund
has a robust financing structure with sufficient liquidity to cover
at least the next 12 months’ maturities.
Networks
Key financial figures
NOK million Q3 17 Q3 16 Ytd 2017 Ytd 2016
Sales revenues 1,110 1,103 3,603 3,400
Gross contribution 688 751 2,128 2,175
EBITDA 386 411 1,160 1,195
Operating profit 224 255 687 748
Energy delivery (GWh) 4,065 3,856 10,486 10,458
Number of customers (‘000)
702 693
Costs of overhead network
361 304 1201 963
Investments 410 254 1,085 605
NVE capital 8,922 8,294
Capital employed 11,694 11,279 11,694 11,279
Networks posted sales revenues of NOK 1,110 million in the
quarter, up NOK 7 million on the comparable prior-year period.
The increase was attributable to a higher volume and network
rental. The energy delivery for the third quarter came in at NOK
4,065 GWh, an increase of five per cent on the previous year.
Combined costs for the overhead network (Statnett) and energy
purchases for network losses amounted to NOK 409 million
(NOK 345 million) in the quarter. The increase primarily relates
to higher costs for the overhead network (Statnett) of NOK 57
million. This generated a gross contribution of NOK 688 million
(NOK 751 million) for the third quarter.
At NOK 302 million, operating expenses for the third quarter were
NOK 38 million lower than the third quarter of 2016. Operating
and maintenance expenses fell by NOK 32 million, of which NOK
20 million relates to customer-initiated work, NOK 3 million to
lower contingency costs, and NOK 9 million to other operating
expenses. Remaining operating expenses decreased by NOK 17
million, primarily due to lower costs for meter reading, invoicing
and revenue collection services for network customers.
Investment contributions rose by NOK 6 million against the
previous year. These contributions have no impact on profit due
to the fact that there is a corresponding increase in income.
Third-quarter EBITDA of NOK 386 million were NOK 25 million
lower than the previous year.
Assuming normal energy demand, planned network tariffs and
forward power prices, as well as planned maintenance and cost
changes, Networks’ operating profit for 2017 is expected to come
in around 15 percent lower than in 2016. This is attributable to
major positive non-recurring effects in 2016 relating to the
purchased networks business in Østfold in 2014.
At the end of 2016, Networks had accumulated surplus income
of NOK 187 million. According the current forecasts,
accumulated surplus income is expected to increase to around
NOK 310 million by the end of 2017. The increase in surplus
income is part due to Hafslund Nett’s desire to maintain the
network rental as stable as possible.
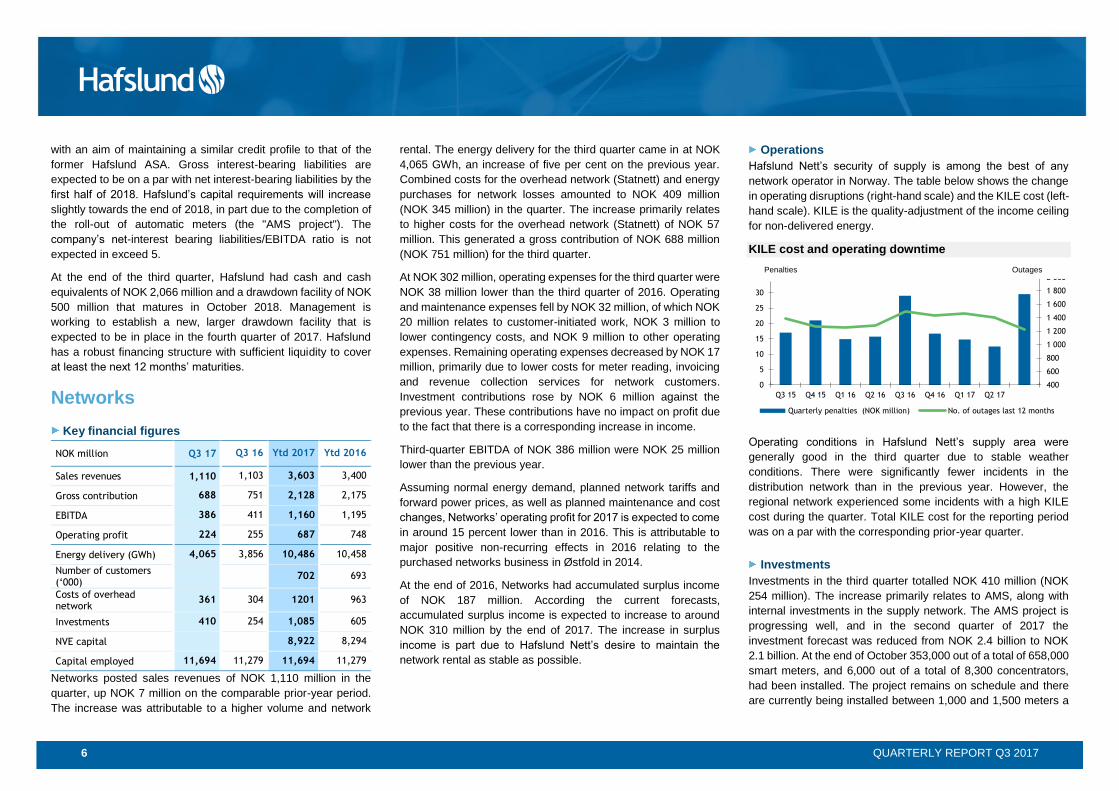
Operations
Hafslund Nett’s security of supply is among the best of any
network operator in Norway. The table below shows the change
in operating disruptions (right-hand scale) and the KILE cost (left-
hand scale). KILE is the quality-adjustment of the income ceiling
for non-delivered energy.
KILE cost and operating downtime
Operating conditions in Hafslund Nett’s supply area were
generally good in the third quarter due to stable weather
conditions. There were significantly fewer incidents in the
distribution network than in the previous year. However, the
regional network experienced some incidents with a high KILE
cost during the quarter. Total KILE cost for the reporting period
was on a par with the corresponding prior-year quarter.
Investments
Investments in the third quarter totalled NOK 410 million (NOK
254 million). The increase primarily relates to AMS, along with
internal investments in the supply network. The AMS project is
progressing well, and in the second quarter of 2017 the
investment forecast was reduced from NOK 2.4 billion to NOK
2.1 billion. At the end of October 353,000 out of a total of 658,000
smart meters, and 6,000 out of a total of 8,300 concentrators,
had been installed. The project remains on schedule and there
are currently being installed between 1,000 and 1,500 meters a
400
600
800
1 000
1 200
1 400
1 600
1 800
2 000
0
5
10
15
20
25
30
35
Q3 15 Q4 15 Q1 16 Q2 16 Q3 16 Q4 16 Q1 17 Q2 17
Quarterly penalties (NOK million) No. of outages last 12 months
OutagesPenalties
7 QUARTERLY REPORT Q3 2017
day. The risk profile is relatively unchanged against the second
quarter. The greatest areas of uncertainty for the project relate to
continuation of the current installment rate, efficient use of IT
support and capacity in the radio-mesh network. At the end of the
third quarter of 2017, Networks had capital employed of NOK
11.7 billion (NOK 11.3 billion).
Other business
NOK million Ytd 2017 Year 2016
Staff functions (62) (48)
Other business 16 (44)
Operating loss Other business (46) (92)
Other business posted a total operating loss of NOK 46 million in
the third quarter. Staff functions, which related to the former
parent company Hafslund ASA until 4 August and subsequently
to the new company Hafslund AS, posted an operating loss of
NOK 62 million for the nine months to 30 September 2017. This
compares to a loss of NOK 27 million at the end of the second
quarter for the former Hafslund ASA. The operating loss for staff
functions includes NOK 29 million in costs relating to the
transaction. Staff functions have been scaled down in the new
company Hafslund AS. Other business comprises Bio-El
Fredrikstad AS, associates and changes in the value of interest-
rate derivatives. The low result in 2016 primarily relates to
impairments in associates and Other business.
Business disposals
In August 2017, Hafslund’s Markets, Heat and Production
business areas were spun off and sold. The income statement
for the first nine months of 2017 has been restated with the
results of discontinued operations shown separately. The
comparative figures for 2016 have been restated accordingly.
See also discussion in Note 2.
Other matters
Settlement of transaction
Profit from discontinued operations is based on the latest
estimated purchase figures per balance sheet date. It is expected
that the final purchase figures and settlement will be completed
in fourth-quarter 2017. Preliminary calculations indicate that
Hafslund's cash holdings will be reduced by approximately NOK
250 million, mainly as a result of tax and working capital
adjustments.
The Board of Directors of Hafslund AS
Hafslund AS’ Board of Directors comprises:
• Hilde Tonne – Chair
• Bente Sollid Storehaug
• Jeanette Iren Moen
• Odd Håkon Hoelsæter
• Bjørn Erik Næss
• Per Orfjell – Employee
representative
• Per Luneborg – Employee
representative
• Tommy Linder –
Employee representative
Bjørn Erik Næss is the Chair of the Audit Committee
Outlook
The transaction agreed with Oslo kommune and Fortum was
implemented on 4 August this year. Hafslund was de-merged,
and Hafslund Marked, Hafslund Varme and Hafslund Produksjon
were sold. The main business of Hafslund now comprises
Hafslund ASA’s former Networks operations. Hafslund Nett,
which owns and operates the bulk of the regional and distribution
network in Akershus, Oslo and Østfold, is Norway’s largest
network operator with 700,000 customers. Ownership of the
regulated network business provides a solid basis for stable and
predictable returns.
In implementing the de-merger, importance was attached to
maintaining deliveries to customers, securing stable and efficient
operations and upholding expertise levels and the performance
of the business areas. Hafslund will deliver Group services to the
divested businesses for a transitional period, and significant work
is being performed to securely embed Hafslund and the divested
businesses with their new owners.
Networks’ long-term earnings are influenced by the business
area’s relative cost efficiency compared with the rest of the
networks industry, interest rate fluctuations and changes in
public regulations. Digitalisation of the value chain and the
customer interface is absolutely critical to achieving efficient
operations and retaining satisfied customers.
Hafslund will ramp up its investments to a yearly average of
around NOK 1.7 billion in 2017 and 2018, compared with a yearly
average of NOK 0.7 billion between 2013 and 2015 and NOK 1
billion in 2016. In addition to ongoing investments in operations
and expansion, the Group’s future investments will be
characterised by investments of NOK 2.1 billion in automatic
meters at all customers and associated new ICT systems.
Hafslund ASA’s debt have been transferred to Hafslund AS, and
will be aligned with the business’ activities and strategy. Hafslund
AS aims to maintain a similar credit profile to that of the former
Hafslund ASA.
Hafslund will continue the previously communicated growth and
improvement initiatives and further develop Hafslund Nett as one
of Norway’s most efficient network operators. Hafslund also
holds a 49 per cent stake in Fredrikstad Energi AS, which has
94,000 customers, and shareholdings in two smaller network
operators. Hafslund will seek out further growth opportunities
both organically and through acquisitions and intend to
participate in any consolidation in the eastern parts of Norway.
Oslo, 27 November 2017
Hafslund AS
Board of Directors
8 QUARTERLY REPORT Q3 2017
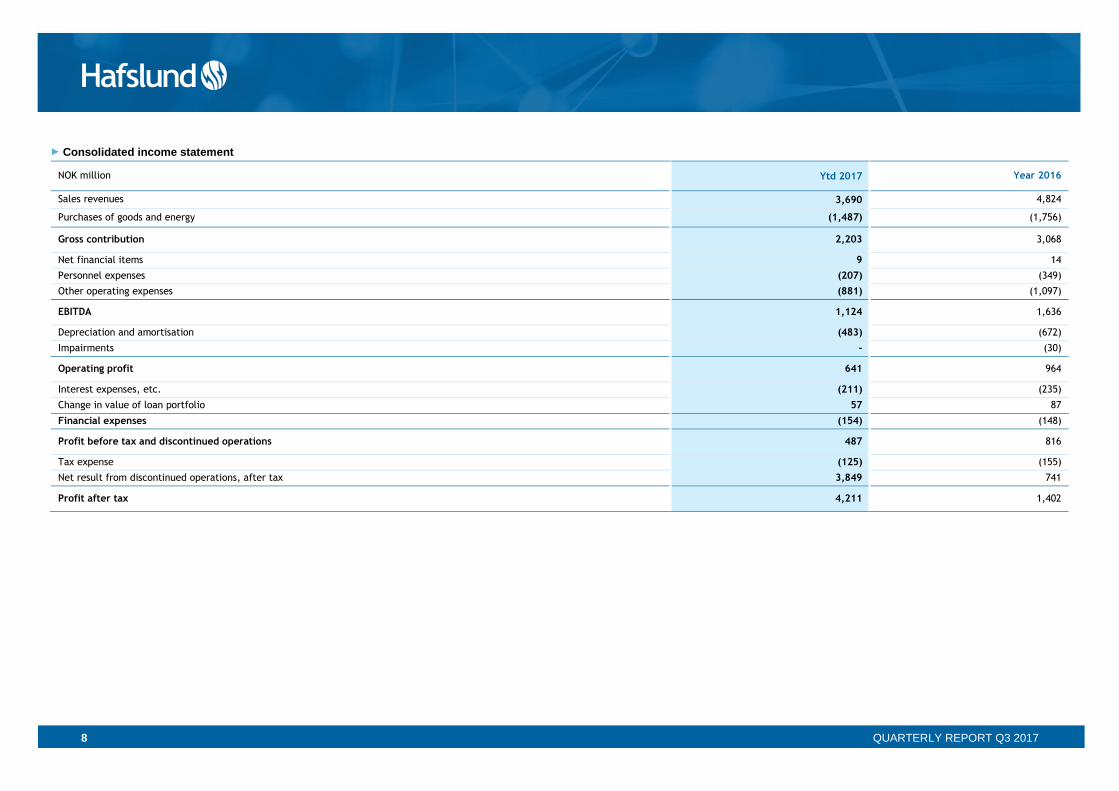
Consolidated income statement
NOK million Ytd 2017 Year 2016
Sales revenues 3,690 4,824
Purchases of goods and energy (1,487) (1,756)
Gross contribution 2,203 3,068
Net financial items 9 14
Personnel expenses (207) (349)
Other operating expenses (881) (1,097)
EBITDA 1,124 1,636
Depreciation and amortisation (483) (672)
Impairments - (30)
Operating profit 641 964
Interest expenses, etc. (211) (235)
Change in value of loan portfolio 57 87
Financial expenses (154) (148)
Profit before tax and discontinued operations 487 816
Tax expense (125) (155)
Net result from discontinued operations, after tax 3,849 741
Profit after tax 4,211 1,402
9 QUARTERLY REPORT Q3 2017
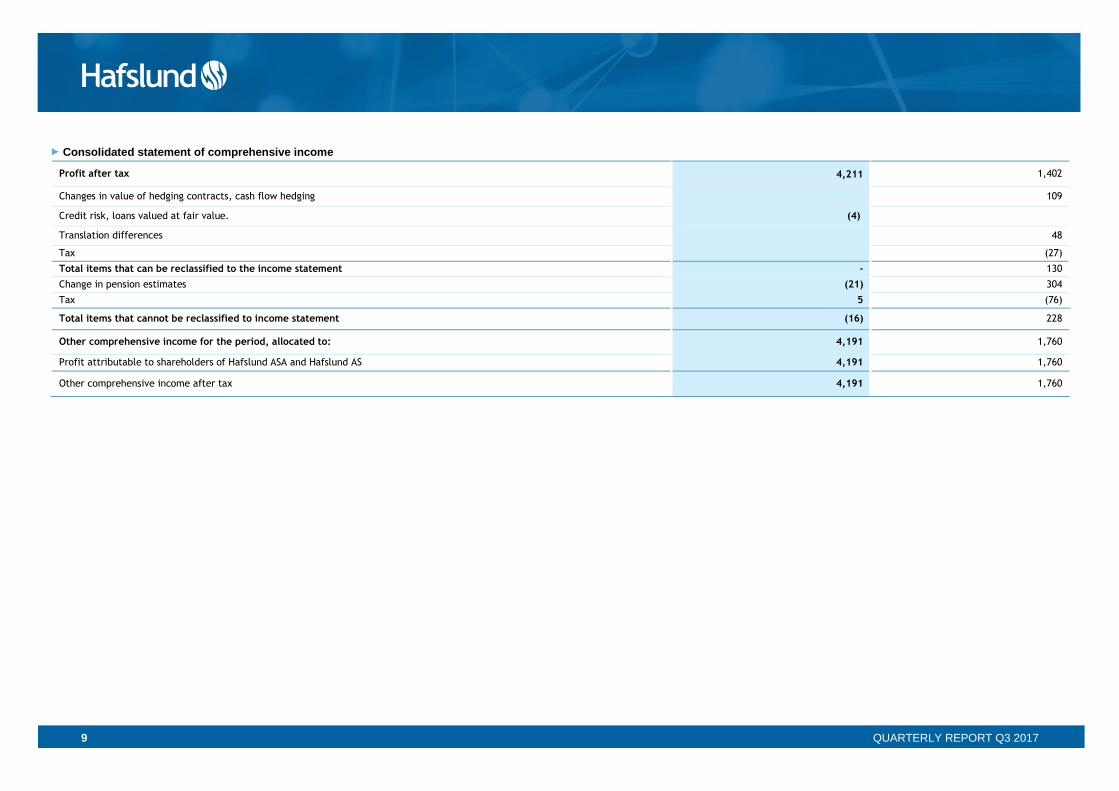
Consolidated statement of comprehensive income
Profit after tax 4,211 1,402
Changes in value of hedging contracts, cash flow hedging 109
Credit risk, loans valued at fair value. (4)
Translation differences 48
Tax (27)
Total items that can be reclassified to the income statement - 130
Change in pension estimates (21) 304
Tax 5 (76)
Total items that cannot be reclassified to income statement (16) 228
Other comprehensive income for the period, allocated to: 4,191 1,760
Profit attributable to shareholders of Hafslund ASA and Hafslund AS 4,191 1,760
Other comprehensive income after tax 4,191 1,760
10 QUARTERLY REPORT Q3 2017
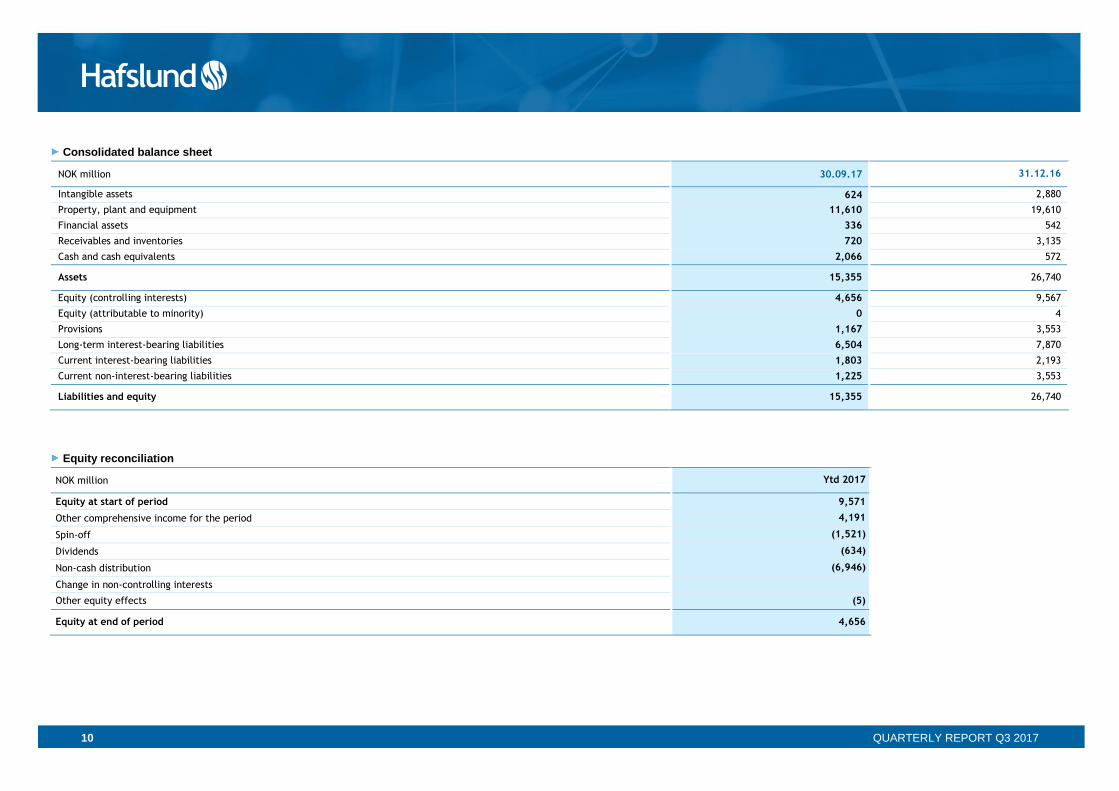
Consolidated balance sheet
NOK million 30.09.17 31.12.16
Intangible assets 624 2,880
Property, plant and equipment 11,610 19,610
Financial assets 336 542
Receivables and inventories 720 3,135
Cash and cash equivalents 2,066 572
Assets 15,355 26,740
Equity (controlling interests) 4,656 9,567
Equity (attributable to minority) 0 4
Provisions 1,167 3,553
Long-term interest-bearing liabilities 6,504 7,870
Current interest-bearing liabilities 1,803 2,193
Current non-interest-bearing liabilities 1,225 3,553
Liabilities and equity 15,355 26,740
Equity reconciliation
NOK million Ytd 2017
Equity at start of period 9,571
Other comprehensive income for the period 4,191
Spin-off (1,521)
Dividends (634)
Non-cash distribution (6,946)
Change in non-controlling interests
Other equity effects (5)
Equity at end of period 4,656
11 QUARTERLY REPORT Q3 2017
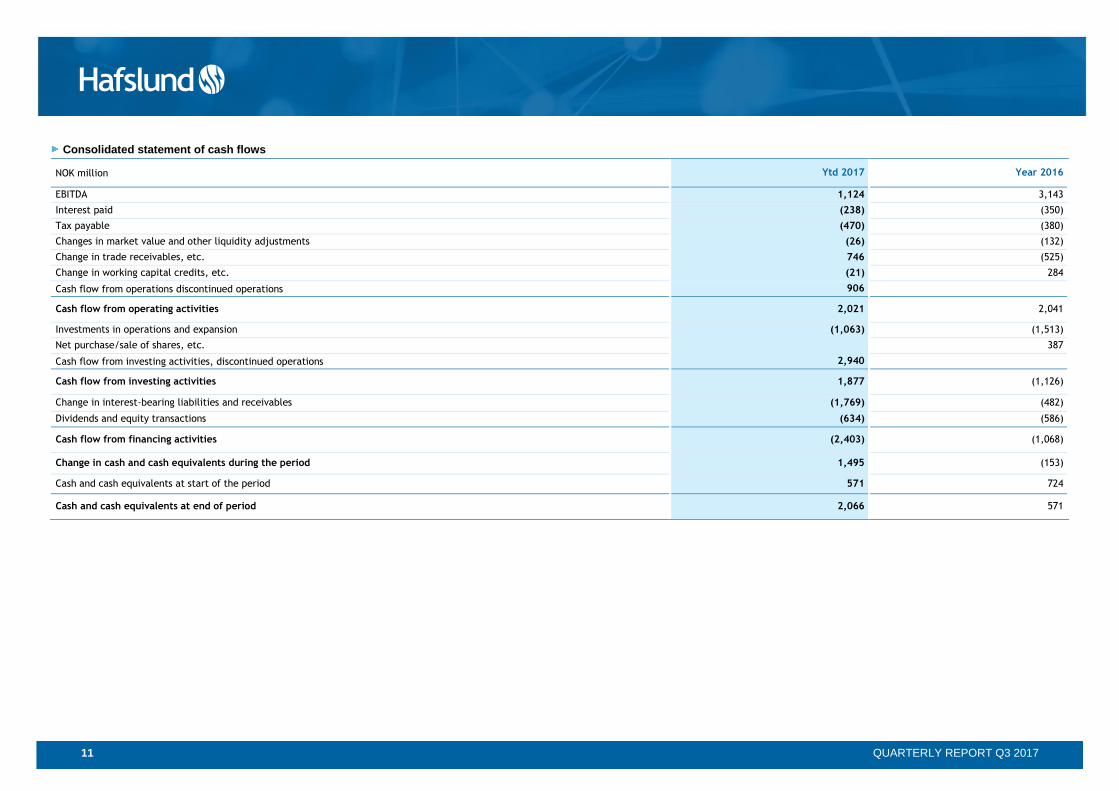
Consolidated statement of cash flows
NOK million Ytd 2017 Year 2016
EBITDA 1,124 3,143
Interest paid (238) (350)
Tax payable (470) (380)
Changes in market value and other liquidity adjustments (26) (132)
Change in trade receivables, etc. 746 (525)
Change in working capital credits, etc. (21) 284
Cash flow from operations discontinued operations 906
Cash flow from operating activities 2,021 2,041
Investments in operations and expansion (1,063) (1,513)
Net purchase/sale of shares, etc. 387
Cash flow from investing activities, discontinued operations 2,940
Cash flow from investing activities 1,877 (1,126)
Change in interest-bearing liabilities and receivables (1,769) (482)
Dividends and equity transactions (634) (586)
Cash flow from financing activities (2,403) (1,068)
Change in cash and cash equivalents during the period 1,495 (153)
Cash and cash equivalents at start of the period 571 724
Cash and cash equivalents at end of period 2,066 571
12 QUARTERLY REPORT Q3 2017
Notes to the financial statements
1) Framework conditions and key accounting policies
The consolidated financial statements for the third quarter of 2017, for the period ending 30
September 2017, have been prepared in accordance with International Financial Reporting
Standards (IFRSs) as adopted by the EU and include Hafslund AS, its subsidiaries and associates.
Financial figures have not been prepared for the third quarter in isolation; however, year-to-date
figures have been prepared as of 30 September 2017 following the completion of the spin-off. This
deviates from the requirements for interim reporting contained in IAS 34. This interim report has not
been audited,
The interim financial statements do not provide the same scope of information as the annual financial
statements and should therefore be viewed in the context of Hafslund ASA’s consolidated financial
statements for 2016. The accounting policies and calculation methods applied in interim reporting
are the same as those described in Note 2 to the consolidated annual financial statements of the
Hafslund ASA Group for 2016, with the exception of IFRS 9 Financial Instruments.
The Group has decided to early-adopt IFRS 9, which replaces IAS 39, and will apply IFRS 9 from 1
January 2017. In accordance with IFRS 9 financial assets are divided into three categories: fair value
through profit or loss; fair value through other comprehensive income; and amortised cost. The
standard deals with the classification, measurement, recognition and de-recognition of financial
assets and liabilities, and introduces new rules for hedge accounting and a new impairment model
for financial assets. The following areas have been affected by IFRS 9:
✓ The standard essentially continues the requirements of IAS 39 for financial liabilities, where the
most significant change relates to use of the fair value option for financial liabilities. In
accordance with IFRS 9 changes in fair value attributable to changes in inherent credit risk are
recognised in other comprehensive income. At the end of the third quarter of 2017, this change
amounted to NOK -4 million.
✓ Impairments attributable to credit risk are now recognised based on expected losses rather than
under previous models where losses must already have been incurred. The new impairment
model has not materially impacted the consolidated figures at the end of the third quarter of
2017.
IFRS 9 will be of less relevance for the residual business following the disposal of Hafslund’s power-
exposed operations. The Group is also working to implement IFRS 15 Revenues from Contracts
with Customers and IFRS 16 Leases. See Note 2 to Hafslund ASA’s consolidated annual financial
statements for 2016.
2) Business disposals
On 3 July 2017, Oslo kommune made a voluntary offering for all the shares in Hafslund ASA
through its wholly owned subsidiary Oslo Energi Holding AS. After the compulsory acquisition of
the shares of minority shareholders, the shares were de-listed from the Oslo Stock Exchange. On
4 August 2017 Hafslund ASA implemented a spin-off pursuant to company law with continuity of
shareholders’ shares and rights, in which all assets, rights and obligations, apart from those
assets, rights and liabilities associated with Hafslund Produksjon, were spun off to the new
company Hafslund AS.
From a company-law perspective Hafslund AS is the acquiring company in the spin-off described
above. However, for consolidated accounting purposes the financial entity represented by the
former Hafslund ASA Group is continued as the reporting entity. Since Hafslund AS acquired three
of four business areas in the spin-off, the consolidated financial statements of Hafslund AS are
deemed to represent a continuation of the former Hafslund ASA Group. Consequently, the values
have not been re-measured in the Hafslund AS Group. The disposal of the power production
segment is recognised in the consolidated financial statements as a reduction in equity as a result
of the spin-off in the statement of changes in equity. The results of the power production business
for the period 1 January 2016 to the spin-off date are recognised under the result from
discontinued operations.
Immediately after the spin-off, Hafslund AS sold 100 percent of the shares in the subsidiary
Hafslund Marked AS and 50 per cent of the shares in the subsidiary Hafslund Varme AS to
Fortum.
The gain on the sale of the shares in Hafslund Market AS is recognised in the consolidated
financial statements as the difference between the carrying amount in the Group and the
consideration received. The results from the Markets segment for the period 1 January 2016 to the
disposal date are recognised in the result from discontinued operations together with the gain.
The sale of 50 per cent of the shares in Hafslund AS is recognised in the consolidated financial
statements as a sell-off with loss of control. The residual shareholding is measured at fair value,
with the resulting upwards revaluation recognised in income. The results from the Heat segment
for the period from 1 January 2016 to the disposal date are recognised in the result from
discontinued operations together with the associated gains.
13 QUARTERLY REPORT Q3 2017
The residual 50 percent shareholding in Hafslund Varme AS, and receivables due from Fortum
following the disposal of the shares in Hafslund Varme AS and Hafslund Marked AS, were
distributed as a non-cash asset to Oslo Energi Holding AS as of 30 September 2017. This
distribution is recognised at fair value in the consolidated financial statements.
The consideration for all the above transactions was measured at fair value and subject to normal
purchase sum calculations. The result from discontinued operations is based on the latest
estimated purchase sum calculations available at the balance sheet date. It is expected that the
final purchase figures and settlement will be completed in fourth-quarter 2017. Preliminary
calculations indicate that Hafslund's cash holdings will be reduced by approximately NOK 250
million, mainly as a result of tax and working capital adjustments.
Result from discontinued operations
NOK million Ytd 2017 2016
Operating revenues 5,428 9,126
Operating expenses (4,660) (7,898)
Net financial items (47) (69)
Profit before tax 721 1,159
Tax expense (244) (418)
Net profit for the period 477 741
Profit after tax 3,372
Result from discontinued operations 3,849 741
3) Networks – income ceiling and income surpluses/shortfalls
Permitted income for the year
Electrical power is distributed via networks, which represent a natural monopoly within the individual
network business’s geographic area. The Norwegian Water Resources and Energy Directorate
(NVE) therefore establishes an income ceiling that represents the maximum income level the
networks businesses are allowed to collect in network rental, and which is intended to provide a
reasonable return on invested capital, and to cover normal operating and maintenance expenses.
The regulated income ceiling, plus re-invoicing of expenses from the overhead network (Statnett)
are referred to as permitted income and established for the year as a whole.
Actual income for the year
Actual income (tariff income) for a network company comprises the tariffs, power output and actually
transmitted energy volumes at any one time in the network company’s supply area. In accordance
with IFRSs, income is recognised in the Networks business based on actual income for the year,
and not permitted income as described above. However, the tariffs, or network rental, are
established based on the premise that over time actual income will correspond to the permitted
income for the Networks business.
Annual income surpluses and shortfalls
Permitted income will normally deviate from actual income for the year due to the effect of the
weather and temperatures on the transmitted volume in the network. If actual income is higher than
permitted income, this results in an income surplus; and if it is lower, in an income deficit. Under
IFRSs, income surpluses and income shortfalls are defined as regulated liabilities or assets that do
not qualify for balance-sheet recognition. This is justified on the grounds that a contract has not been
entered into with a particular customer and therefore the resulting receivable/liability is theoretically
contingent on a future delivery.
At the end of 2016, Networks had an accumulated income surplus of NOK 187 million. According
the available forecasts, accumulated surplus income is expected to increase to around NOK 310
million by the end of 2017. The increase in surplus income is partly due to Hafslund Nett’s desire to
maintain the network rental charge as stable as possible.
4) Interest-bearing loans and interest and currency derivatives
At the end of the third quarter of 2017, the value of the loan portfolio recognised in the balance sheet
amounted to NOK 8,386 million, of which NOK 6,583 million related to long-term liabilities and NOK
1,803 million to current liabilities. The change in the fair value of the loans boosted profits by NOK
51 million in the third quarter, while the change in the fair value of interest rate derivatives reduced
profits by NOK 9 million. Hafslund’s credit spreads narrowed by 30–40 basis points for maturities of
between three months and ten years during the reporting period. The Nibor and swap rates fell by
up to 40 basis points for maturities of up to one year and by 10 to 20 basis points for terms of two to
five years. The interest rates for longer terms remained virtually unchanged. The net effect of the
above was that the market interest rate (including Hafslund’s credit spreads) narrowed by around 60
to 70 basis points for maturities of up to one year and by around 40 basis points for longer maturities.
The change in the fair value of loans is recognised as financial expenses in the income statement,
while any change in the value of interest rate derivatives is recognised as a net financial item in the
operating result.
14 QUARTERLY REPORT Q3 2017
Hafslund has a drawdown facility of NOK 500 million maturing in October 2018 which was unutilised
at the reporting date. Management is working to establish a new, larger drawdown facility that is
expected to be in place in the fourth quarter of 2017.
Until 31 December 2009, Hafslund’s entire loan portfolio was valued at fair value through profit or
loss. Since 2010, new loans have been measured at amortised cost. At the end of the third quarter
of 2017, these were valued at NOK 6,603 million.
5) Financial Instruments by category, including hedging instruments
The following principles have been applied in the subsequent measurement of financial
instruments for financial instruments recognised in the balance sheet:
NOK million
Derivatives used for hedging purposes
Assets at fair value through profit or loss
Receivables at amortised cost
Total
Long-term receivables 128 128
Derivatives 21 21
Trade and other receivables 487 487
Cash and cash equivalents 2,697 2,697
Total financial assets as of 30 September 2017 21 3,312 3,333
NOK million
Derivatives used for hedging purposes
Liabilities at fair value through profit or loss
Other financial liabilities at amortised cost
Total
Loans 1,783 6,603 8,386
Trade and other current payables 1,121 1,121
Total financial liabilities as of 30 September 2017 1,783 7,724 9,507
Derivative financial instruments are valued either at fair value through profit or loss or for hedging
purposes. Hafslund’s interest rate derivatives are recognised at fair value through profit or loss.
The table below shows financial instruments at fair value by valuation method. The levels are:
1. Listed price in an active market for an identical asset or liability (level 1). 2. Valuation based on observable factors other than listed prices (level 1) either directly (prices)
or indirectly (derived from prices) for the asset or liability (level 2).
3. Where it is not practicable to use only a listed price or transaction value, discounted future cash
flows and the Group’s own estimates are used.
NOK million Level 1 Level 2 Level 3 Total
Financial assets at fair value through profit or loss:
Interest rate derivatives 21 21
Total assets 21 21
Financial liabilities at fair value through profit or loss:
Loans 1,783 1,783
Total liabilities 1,783 1,783
6) Operating assets
A total of NOK 1,085 million was invested in operating assets for continuing operations in the third
quarter of 2017. Investments relate in their entirety to investments in operations and expansion.
7) Related party transactions
Hafslund enters into purchase and sales transactions with related parties as part of normal business
operations. In 2017 Hafslund bought and sold goods and services from/to Oslo kommune. The Oslo
kommune owns 100 percent of the shares in Hafslund AS through Oslo Energi Holding AS.
Examples of sales to the Oslo kommune include network rental. Examples of purchases from the
Oslo kommune include waste heat from the Norwegian Waste-to-Energy Agency (EGE). Purchases
from the Oslo kommune relate to discontinued operations. All transactions between the parties are
conducted in accordance with the arm’s length principle.
The table below shows transactions with related parties:
NOK million Sales of goods and services
Purchases of goods and services
Purchases recognised as investments
Trade receivables Trade payables
Ytd 2017
Oslo kommune 103 30 6
15 QUARTERLY REPORT Q3 2017
Definitions
Capital employed Equity + Net interest-bearing liabilities + Net tax positions
NVE capital Finished non-current assets including a fixed percentage add-on for working capital
Equity ratio Equity / Total capital
Net interest-bearing liabilities Interest-bearing liabilities - Interest-bearing receivables and cash equivalents
Liabilities / EBITDA Net interest-bearing liabilities / EBITDA for the last 12 months
16 QUARTERLY REPORT Q3 2017
Financial calendar
1. Fourth Quarter 2017 Report and provisional annual result – 15 February 2018
2. First Quarter 2018 Report – 2 May 2018
3. Second Quarter 2018 Report – 10 July 2018
4. Third Quarter 2018 Report – 24 October 2018
Investor information
1. Information is displayed on Hafslund's website:
o www.hafslund.no
o You can subscribe to stock market notifications via "My page" at www.oslobors.no
2. CFO, Heidi Ulmo,
o Tel.: +47 909 19 325
3. Head of Finance and Investor Relations, Martin S. Lundby
o Tel.: +47 416 14 448


![Jerusalem Quarterly Winter 2011 [in Colonial Shoes -- Notes on the Material Afterlife in Post-Oslo Palestine]](https://img.pdfslide.us/doc/110x75/577d222f1a28ab4e1e96c649/jerusalem-quarterly-winter-2011-in-colonial-shoes-notes-on-the-material.jpg)