Embed Size (px)
Citation preview
Solar A/S
LEI: 21380031XTLI9X5MTY92 Industrivej Vest 43 ■ DK-6600 Vejen ■ Denmark
Tel. +45 79 30 00 00 ■ CVR no. 15 90 84 16 ■ Web: www.solar.eu
1 of 3
Announcement no. 15 2019
8 August 2019
Quarterly Report Q2 2019
Q2 revenue was slightly above our expectations and EBITA was on
par with expectations. We reconfirm our outlook for 2019 EBITA of
DKK 365m.
CEO Jens Andersen says:
"We continue to see growth in all our markets and improve earnings.
In H1, we delivered organic growth of almost 6% and increased
EBITA by 12% compared to H1 2018. At the same time, we have
strengthened our position within heating and plumbing, and climate
and energy in the Swedish market by a successful and swift
integration of our newly acquired business activities. We have a
continued keen focus on optimising our organisation to match
changing business requirements.”
Financial highlights
(DKK million)*
Q2
2019
Q2
2018
H1
2019
H1
2018
Revenue 2,868 2,733 5,825 5,550
EBITA 60 56 140 125
Earnings before tax 56 10 49 113
Cash flow from operating
activities
-17 -41 -149 -80
Financial ratios (%)
Organic growth adj. for
number of working days
5.6 1.6 5.6 3.2
EBITA margin 2.1 2.0 2.4 2.3
Net working capital, period-
end/revenue (LTM)
12.9 10.7 12.9 10.7
Gearing (NIBD/EBITDA), no. of
times
2.6 1.8 2.6 1.8
* Due to the divestments of our Austrian and Belgian business activities, GFI
GmbH and Claessen ELGB NV, in 2018, and the divestment of our Norwegian
training business, STI, in Q1 2019, 2018 and 2019 figures in this announcement
relate to our continuing operations.
Solar A/S
LEI: 21380031XTLI9X5MTY92 Industrivej Vest 43 ■ DK-6600 Vejen ■ Denmark
Tel. +45 79 30 00 00 ■ CVR no. 15 90 84 16 ■ Web: www.solar.eu
2 of 3
Q2 2019 Revenue
• Revenue was slightly above our expectations.
• Adjusted organic growth amounted to 5.6% (1.6%).
Q2 2019 EBITA
• EBITA was on par with our expectations.
• EBITA from core business was up at DKK 66m (DKK 62m) driven
by improvements in Solar Nederland, Solar Danmark and Solar
Norge.
• EBITA from related business was unchanged at DKK -6m
(DKK -6m).
BIMobject valuation
• Based on the share price on 30 June, the BIMobject value
amounted to DKK 203m. Therefore, Solar reversed DKK 29m of
the write-down recognised in Q1 2019. The initial purchase price
amounted to DKK 171m.
2019 outlook
• We expect total revenue of at least DKK 11.6bn corresponding to
organic growth of at least 2% and EBITA of approx. DKK 365m.
• For core business, we expect revenue of at least DKK 10.95bn
corresponding to an organic growth of at least 1.5% and EBITA of
approx. DKK 370m.
• For the related business, we expect revenue of approx.
DKK 650m corresponding to an organic growth of approx. 15% and
EBITA of approx. DKK -5m.
Guidance 2019
DKK million
Core
business
Related
business
Solar
Group
Revenue At least
10,950
650
At least
11,600
EBITA 370 -5 365
Audio webcast and teleconference today
The presentation of Quarterly Report Q2 2019 will be made in
English on 8 August 2019 at 11:00 CET. The presentation will be
transmitted as an audio webcast and will be available at
www.solar.eu. Participation will be possible via a teleconference.
Teleconference call-in numbers:
DK: tel. +45 354 455 83
UK: tel. +44 203 194 0544
US: tel. +1 855 269 2604
Yours faithfully,
Solar A/S
Jens Andersen
Contacts
CEO Jens Andersen - tel. +45 79 30 02 01
CFO Michael H. Jeppesen - tel. +45 79 30 02 62
Director, Stakeholder Relations Charlotte Risskov Kræfting –
tel. +45 40 34 29 08
Enclosure: Quarterly Report Q2 2019, pages 1-32.
Solar A/S
LEI: 21380031XTLI9X5MTY92 Industrivej Vest 43 ■ DK-6600 Vejen ■ Denmark
Tel. +45 79 30 00 00 ■ CVR no. 15 90 84 16 ■ Web: www.solar.eu
3 of 3
Facts about Solar
Solar Group is a leading sourcing and services company. Our core
business centres on product sourcing, value-adding services and
optimisation of our customers’ businesses.
Being a sourcing and services company, we focus on each individual
customer. We always strive to understand our customers’ unique
and genuine needs in order to provide relevant, personal and value-
adding services, turning our customers into winners.
Solar Group is headquartered in Denmark, generated revenue of
more than DKK 11bn in 2018 and has approx. 3,000 employees.
Solar is listed on Nasdaq Copenhagen and operates under the short
designation SOLAR B. For more information, please visit
www.solar.eu.
Disclaimer
This announcement was published in Danish and English today via
Nasdaq Copenhagen. In the event of any inconsistency between the
two versions, the Danish version shall prevail.
Q2 2019
Solar A/SCVR no. 15 90 84 16
2
ContentsMANAGEMENT’S REVIEW
3 Financial highlights4 Business update6 Financial review
11 Outlook 13 Shareholder information 15 100th anniversary
FINANCIAL STATEMENTS
16 Statement of comprehensive income 17 Balance sheet18 Cash flow statement19 Statement of changes in equity
21 Notes29 Quarterly figures
31 Statement by the Executive Board and the Board of Directors
3
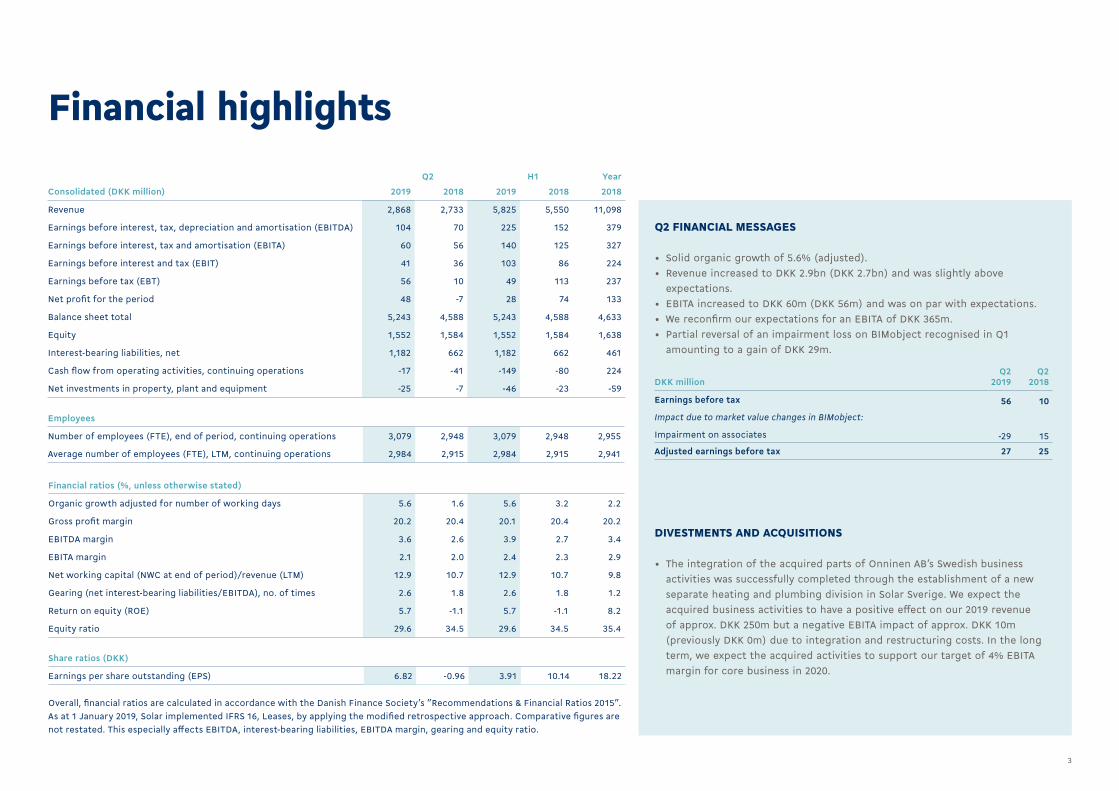
Q2 H1 Year
Consolidated (DKK million) 2019 2018 2019 2018 2018
Revenue 2,868 2,733 5,825 5,550 11,098
Earnings before interest, tax, depreciation and amortisation (EBITDA) 104 70 225 152 379
Earnings before interest, tax and amortisation (EBITA) 60 56 140 125 327
Earnings before interest and tax (EBIT) 41 36 103 86 224
Earnings before tax (EBT) 56 10 49 113 237
Net profit for the period 48 -7 28 74 133
Balance sheet total 5,243 4,588 5,243 4,588 4,633
Equity 1,552 1,584 1,552 1,584 1,638
Interest-bearing liabilities, net 1,182 662 1,182 662 461
Cash flow from operating activities, continuing operations -17 -41 -149 -80 224
Net investments in property, plant and equipment -25 -7 -46 -23 -59
Employees
Number of employees (FTE), end of period, continuing operations 3,079 2,948 3,079 2,948 2,955
Average number of employees (FTE), LTM, continuing operations 2,984 2,915 2,984 2,915 2,941
Financial ratios (%, unless otherwise stated)
Organic growth adjusted for number of working days 5.6 1.6 5.6 3.2 2.2
Gross profit margin 20.2 20.4 20.1 20.4 20.2
EBITDA margin 3.6 2.6 3.9 2.7 3.4
EBITA margin 2.1 2.0 2.4 2.3 2.9
Net working capital (NWC at end of period)/revenue (LTM) 12.9 10.7 12.9 10.7 9.8
Gearing (net interest-bearing liabilities/EBITDA), no. of times 2.6 1.8 2.6 1.8 1.2
Return on equity (ROE) 5.7 -1.1 5.7 -1.1 8.2
Equity ratio 29.6 34.5 29.6 34.5 35.4
Share ratios (DKK)
Earnings per share outstanding (EPS) 6.82 -0.96 3.91 10.14 18.22
Overall, financial ratios are calculated in accordance with the Danish Finance Society’s ”Recommendations & Financial Ratios 2015”.As at 1 January 2019, Solar implemented IFRS 16, Leases, by applying the modified retrospective approach. Comparative figures are not restated. This especially affects EBITDA, interest-bearing liabilities, EBITDA margin, gearing and equity ratio.
Q2 FINANCIAL MESSAGES
• Solid organic growth of 5.6% (adjusted).• Revenue increased to DKK 2.9bn (DKK 2.7bn) and was slightly above
expectations.• EBITA increased to DKK 60m (DKK 56m) and was on par with expectations.• We reconfirm our expectations for an EBITA of DKK 365m.• Partial reversal of an impairment loss on BIMobject recognised in Q1
amounting to a gain of DKK 29m.
DKK millionQ2
2019Q2
2018
Earnings before tax 56 10
Impact due to market value changes in BIMobject:
Impairment on associates -29 15
Adjusted earnings before tax 27 25
DIVESTMENTS AND ACQUISITIONS
• The integration of the acquired parts of Onninen AB’s Swedish businessactivities was successfully completed through the establishment of a newseparate heating and plumbing division in Solar Sverige. We expect theacquired business activities to have a positive effect on our 2019 revenueof approx. DKK 250m but a negative EBITA impact of approx. DKK 10m(previously DKK 0m) due to integration and restructuring costs. In the longterm, we expect the acquired activities to support our target of 4% EBITAmargin for core business in 2020.
Financial highlights
4
Successful and swift integration of acquired activities
INTEGRATION OF NEW BUSINESS ACTIVITIESThe integration of the Swedish business activities, which we acquired in May, is completed according to plan.
The former Onninen Express stores have become Solar drive-ins and all Onninen systems have been phased out. Since mid-June, therefore, all IT sys-tems have become exclusively Solar.
We also announced that we would close a total of eight branches. Three were closed in June, another three will follow before year-end and the remaining two will close in Q1 2020. Furthermore, we reduced the total headcount by 45 FTEs.
As a natural consequence of the intensive integra-tion of the acquired business activities in Sweden, we are now planning to continue our implemen-tation of the SAP eWM - Extended Warehouse Management system - at our central warehouse in Örebro in Sweden in the autumn.
STRATEGIC SUPPLIERS We continue to pursue growth opportunities within concept sales and to harvest synergies across our markets.
We have strengthened our position in the Swedish market within heating and plumbing as well as within climate and energy by integrating the business activities we recently acquired from Onninen.
Business update
INDUSTRY FOCUSWe continue to develop our Scandinavian industry business.
Through our Total Cost of Ownership (TCO) approach, we provide customers with a full and documented overview of total costs, allowing them to focus on their core business.
Our entire outdoor sales team within Industry have completed sales training in line with our TCO approach. The training is based on valuable feedback from our industry customers and centres on value-adding sales dialogues.
Our customers have clearly indicated that they wish to have insight from their own industry, for risks to be identified and to be confident in the implementation of, for example, services or strategic sourcing. In addition, they want us to play an active role in ensuring buy-in from their own employees.
We now facilitate development meetings with our customers based on a competence model to drive business development and identify needs and relevant services. Early findings indicate
that this is having a significantly positive impact on our customer satisfaction levels.
Moreover, to match our industry customers’ purchasing patterns, we are continuously expanding our product assortment with new product categories and products. We recently added 30,000 new products within Mechanics and made them available in the Danish market. During Q3, we will also launch them in the Norwegian and Swedish markets. Furthermore, during H2 we will continue to add another 30,000 products. All these products are being made available to our customers without increasing the number of stock keeping units.
We continue to attract new customers and to establish new business agreements. In Norway, we recently won significant framework agreements with Bane NOR and Forsvarsbygg Norge concerning the delivery of electrical installation products.
OPERATIONAL EXCELLENCECross-border customers, new competitors and new demands on delivery services inspire us to work in new ways.
5
Business update Business update
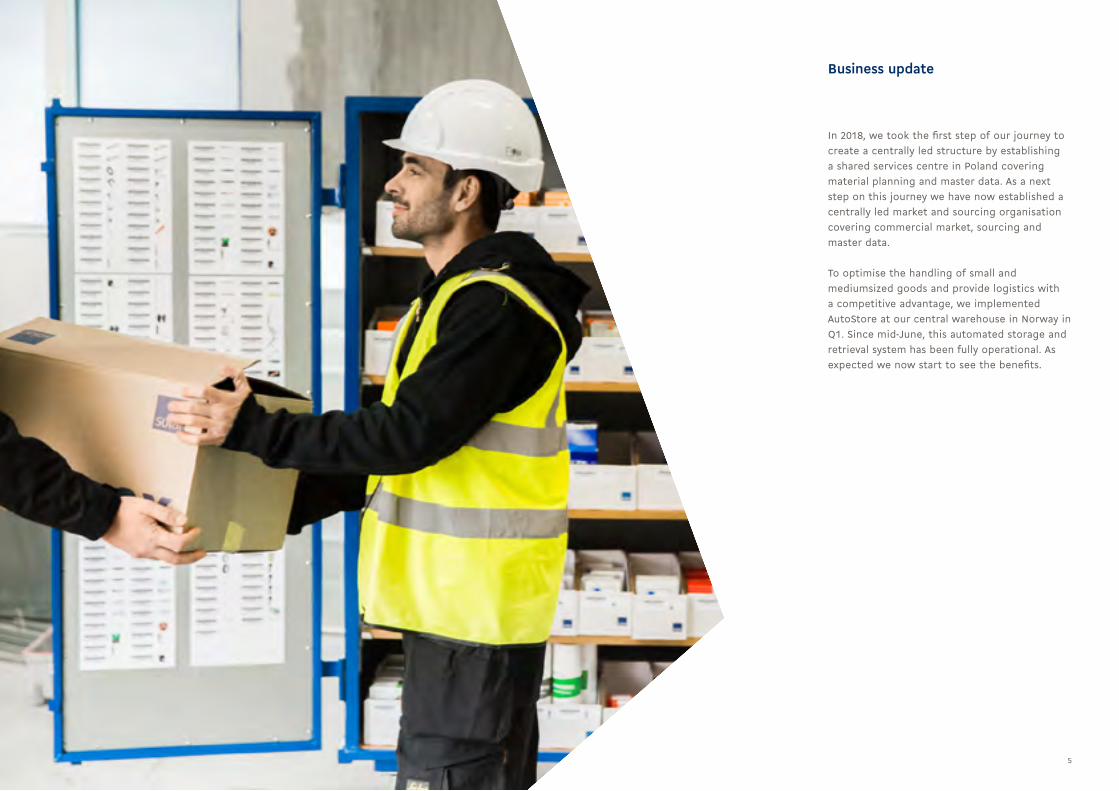
In 2018, we took the first step of our journey to create a centrally led structure by establishing a shared services centre in Poland covering material planning and master data. As a next step on this journey we have now established a centrally led market and sourcing organisation covering commercial market, sourcing and master data.
To optimise the handling of small and mediumsized goods and provide logistics with a competitive advantage, we implemented AutoStore at our central warehouse in Norway in Q1. Since mid-June, this automated storage and retrieval system has been fully operational. As expected we now start to see the benefits.
6
Q2 2019REVENUEThe Installation and Industry segments continued to see growth in all our markets in Q2, and growth in the Norwegian market was particularly notable. However, a significant part of the growth in Norway derived from non-recurring direct deliveries with very low margins. Solar Sverige delivered organic growth of 3.2%.
Solar’s overall adjusted organic growth for Installation and Industry was around 8% and 5% respectively.
In Q2 2019, adjusted organic growth at Group level amounted to 5.6% (1.6%). Revenue reached DKK 2.9bn (DKK 2.7bn), including approx. DKK 40m from the acquisition of the Swedish business activities.
Core business delivered adjusted organic growth of 5.6% (0.6%), and we saw positive adjusted organic growth in all entities.
Adjusted organic growth in related business amounted to 6.3% (31.1%). Revenue
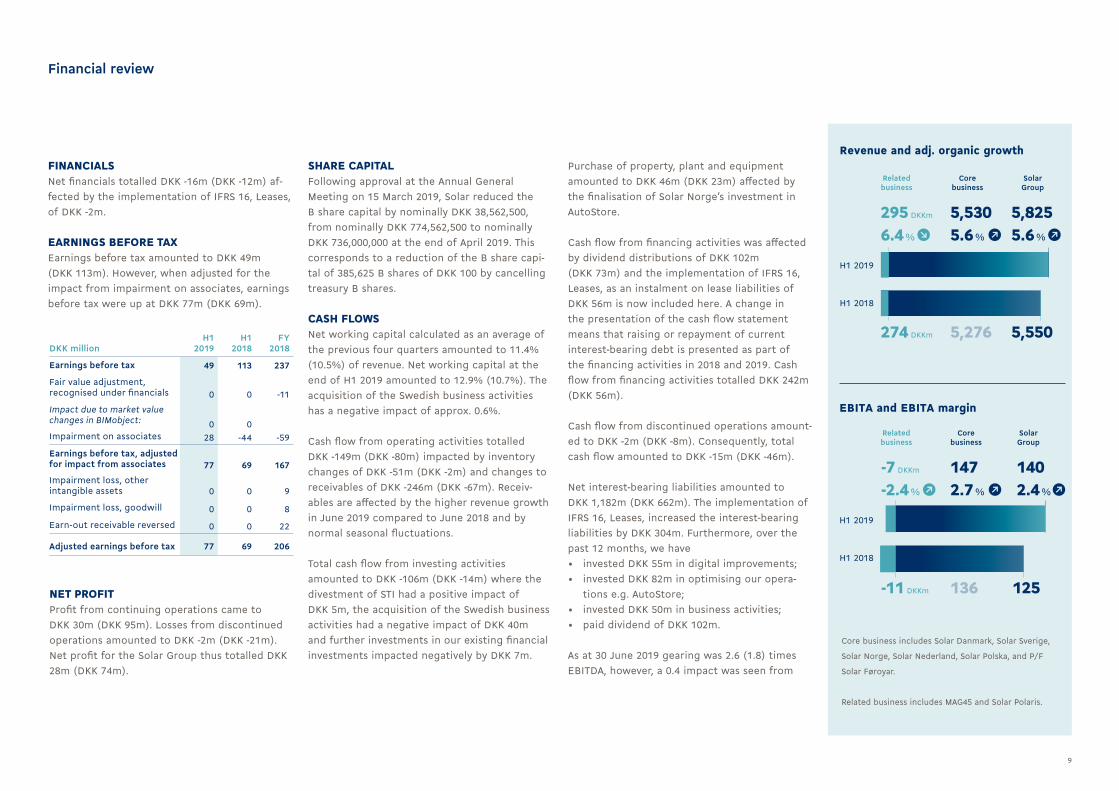
With adjusted organic growth of 5.6%, revenue from continuing operations reached DKK 5.8bn (DKK 5.6bn), while EBITA from continuing operations was up at DKK 140m (DKK 125m). In May 2019, Solar acquired additional Swedish business activities, which affected revenue by approx. DKK 40m and EBITA by approx. DKK -5m in H1 2019. Adjusted H1 EBITA margin showed 2.5% (2.3%).
For the Solar Group as a whole, revenue was sligthly above expectations, while EBITA was on par with our expectations.
EBITA increased by DKK 15m to DKK 140m in H1
Financial review(Figures in brackets are corresponding figures from Q2 or H1 2018)
Our comments on core and related business and disclosures in the note segment information should be regarded as supplementary information. Information on the following segments - Installation, Industry and Other - is included in the note segment information.
DIVESTMENTS AND ACQUISITIONSAcquisition of Swedish business activitiesOn 15 May 2019, Solar A/S acquired selected parts of Onninen AB’s Swedish business activi-ties from the Finnish Kesko Corporation. Solar acquired the heating, plumbing and air-con-ditioning business segment, which serves mostly small and medium-sized contractors in Sweden. The acquisition includes 12 branch-es, corresponding to a full year revenue of approx. DKK 400m. We expect our acquired business activities to have a positive effect on our 2019 revenue of approx. DKK 250m but a negative EBITA impact of approx. DKK 10m due to integration and restructuring costs. In the long term, we expect the Onninen activities to support our target of 4% EBITA margin for core business in 2020.
Divestment of Norwegian training businessIn March 2019, Solar concluded the process, initiated in December 2018, of a management buyout of our Norwegian training business, Scandinavian Technology Institute (STI), part of our related business, cf. company an-nouncements nos. 7 2019 and 21 2018.
The divestment constituted a loss of DKK 17m, which was recognised in the Solar Group’s income statement as part of the loss from discontinued operations in Q4 2018.
Divestment of Austrian and Belgian business activitiesAt the end of January 2018, Solar entered into an agreement with Sonepar concerning the divestment of activities in the loss-making sub-sidiaries GFI GmbH, Austria, and Claessen ELGB NV, Belgium, cf. company announcements nos. 3, 12 and 14 2018. The divestment constituted a loss of DKK 47m, which was recognised in the Solar Group’s income statement as part of the loss from discontinued operations in Q4 2017.
Consequently, in this report GFI GmbH, Austria and Claessen ELGB NV, Belgium, are presented as discontinued operations in 2018 while STI, Norway, is presented as discontinued opera-tions for both 2018 and 2019. Unless otherwise stated, this report solely recognises Solar’s continuing operations.
7
performance for MAG45 was below expectations.
In total, revenue was slightly above our expec-tations.
GROSS PROFIT MARGINGross profit margin decreased to 20.2% (20.4%) in Q2 2019.
Freight costs increased and negatively affected the gross profit margin at Group level by 0.1 per-centage points due to a general increase in fuel costs and lack of capacity.
In addition, a significant part of the revenue growth of Solar Norge was related to direct deliveries with low margin, which had a negative impact of approx. 0.2 percentage points on gross profit margin at Group level.
OTHER INCOMEOther income amounted to DKK 5m (DKK 0m). This primarily relates to the net impact of the ac-quisition of the Swedish business activities where negative goodwill of DKK 18m was recognised as income and DKK 16m in provisions for restructur-ing etc. were recognised as costs.
EXTERNAL OPERATING COSTS AND DEPRECIATIONDue to the implementation of IFRS 16, Leases, external operating costs were down by DKK 29m while correspondingly, depreciation was up by DKK 29m and net financials by DKK 1m. Were this change to be reversed, external operating costs would amount to DKK 117m
Financial review
(DKK 110m) and depreciation to DKK 15m (DKK 14m). Furthermore, external operating costs and depreciation were negatively affected by the acquisition of the Swedish business activities by approx. DKK 5m and DKK 1m respectively.
LOSS ON TRADE RECEIVABLESLoss on trade receivables amounted to 0.2 per-centage points (0.1 percentage points) affected by a general increase in provisions for loss.
EBITAEBITA increased to DKK 60m (DKK 56m) corresponding to an EBITA margin of 2.1% (2.0%) of revenue. The acquisition of the Swedish business activities had a negative impact on EBITA of approx. DKK 5m corresponding to approx. 0.2 percentage points at Group level. The adjusted margin thus increased to 2.3% (2.0%).
EBITA from core business was up at DKK 66m (DKK 62m) driven by improvements in Solar Nederland, Solar Danmark and Solar Norge. Only Solar Sverige’s performance was below the level of Q2 2018. Solar Sverige’s result was, among other things, negatively affected by the acquisition of the Swedish business activities. Furthermore, when adjusted for the number of working days the performance of Solar Sverige remained at approximately the same low level as in Q2 2018 despite the organic growth. This is unsatisfactory, therefore, in addition to the recently implemented structural changes we are implementing further initiatives to improve earnings.
The results of the individual countries are disclosed on page 24.
EBITA from related business was unchanged at DKK -6m (DKK -6m). MAG45 results were disappointing in Q2 due to lower-than-expected revenue. The slow-down in growth is attributable to a few key customers. Their indications are that revenue in H2 will still reach the expected level.
In total, EBITA was on par with expectations.
SHARE OF NET PROFIT FROM ASSOCIATESOur share of earnings from our digital, construc-tion and services associates amounted to DKK -5m (DKK -4m) of which DKK -3m related to the earnings development of BIMobject while DKK -2m related to the write-down of the HomeBob app.
IMPAIRMENT ON ASSOCIATESBased on the share price on 30 June, the BIMobject value amounted to DKK 203m. Therefore, Solar reversed DKK 29m of the write-down recognised in Q1 2019. In Q2 2018, we identified the need for a write-down on BIMobject AB of DKK 15m. The initial purchase price amounted to DKK 171m.
FINANCIALSNet financials totalled DKK -9m (DKK -7m) affected by the implementation of IFRS 16, Leases, of DKK -1m.
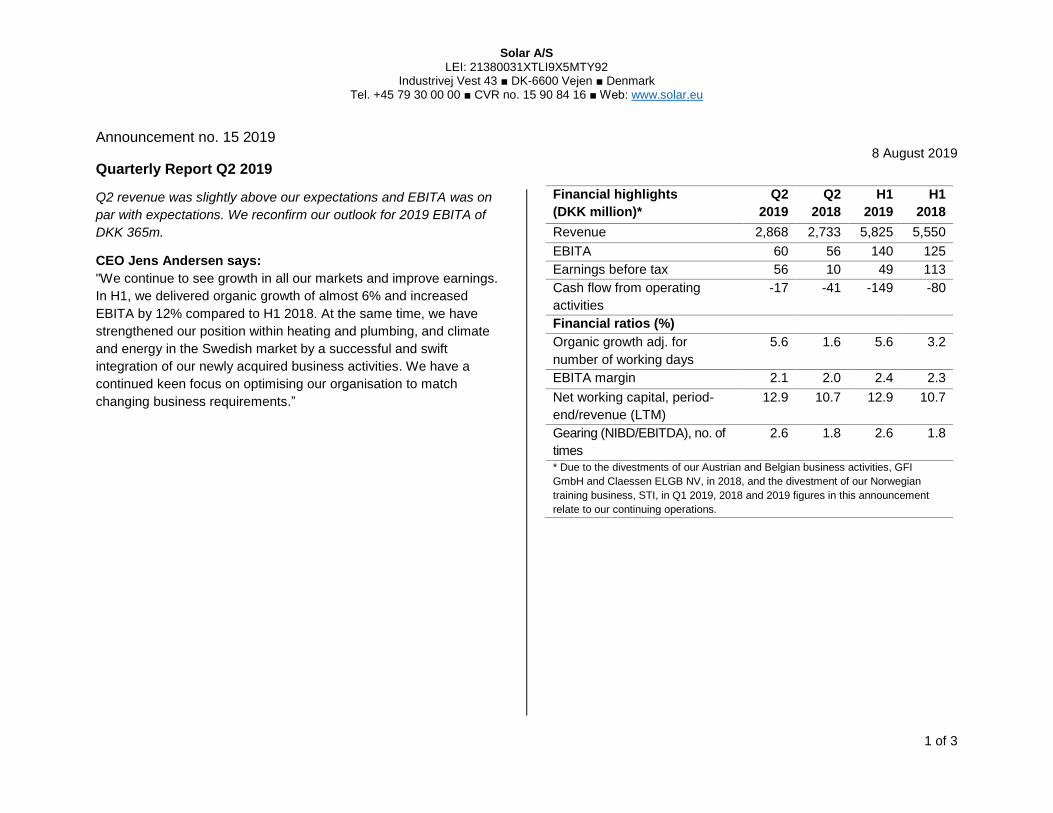
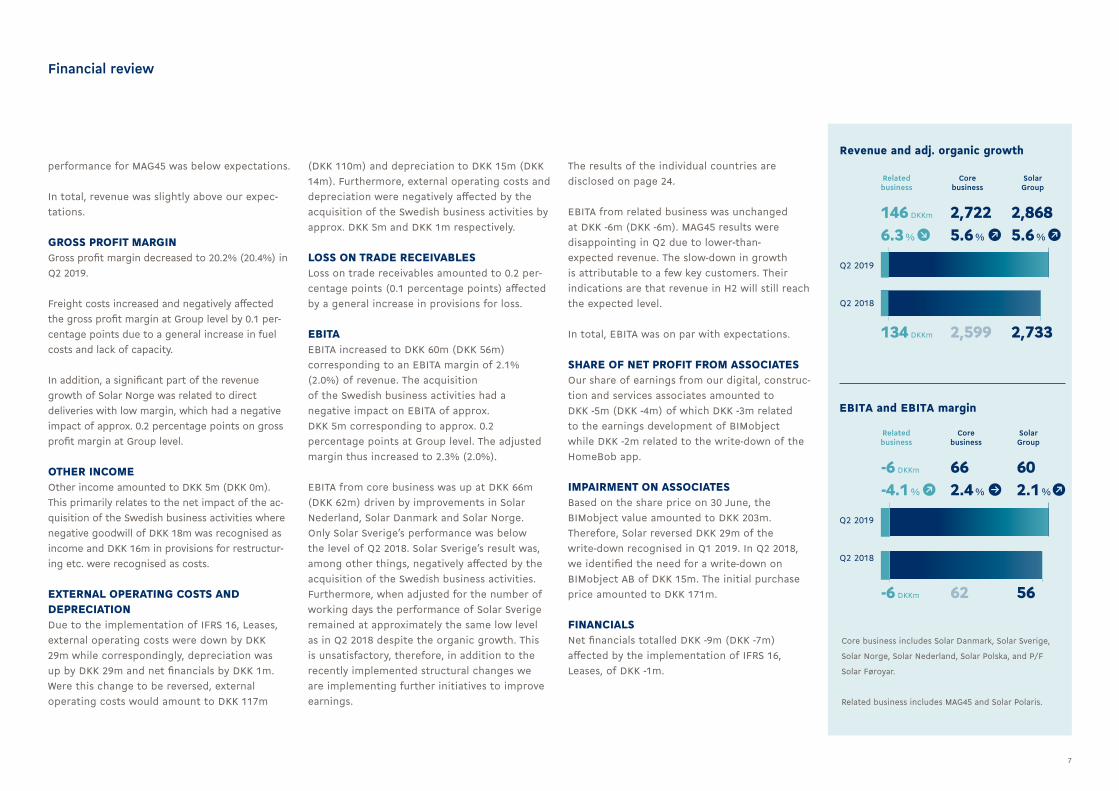
Core business includes Solar Danmark, Solar Sverige,
Solar Norge, Solar Nederland, Solar Polska, and P/F
Solar Føroyar.
Related business includes MAG45 and Solar Polaris.
Q2 2019
Q2 2019
Q2 2018
Q2 2018
Revenue and adj. organic growth
EBITA and EBITA margin
Related business
Related business
Core business
Corebusiness
SolarGroup
Solar Group
2,599
62
146 DKKm
6.3 %
-6 DKKm
-4.1 %
2,7225.6 %
2,8685.6 %
662.4 %
602.1 %
134 DKKm
-6 DKKm
2,733
56
8
GROSS PROFIT MARGINGross profit margin decreased to 20.1% (20.4%) in H1 2019.
Freight costs increased and negatively affected gross profit margin at Group level by 0.1 percent-age points due to a general increase in fuel costs and lack of capacity.
In addition, a significant part of the revenue growth for Solar Norge was related to direct deliveries with low margin, which had a negative impact of approx. 0.2 percentage points on the gross profit margin at Group level.
OTHER INCOMEOther income amounted to DKK 5m (DKK 0m). This primarily relates to the net impact of the ac-quisition of the Swedish business activities where negative goodwill of DKK 18m was recognised as income and DKK 16m in provisions for restructur-ing etc. was recognised as costs.
EXTERNAL OPERATING COSTS AND DEPRECIATIONDue to the implementation of IFRS 16, Leases, external operating costs were down by DKK 58m while correspondingly, depreciation was up by DKK 57m and net financials by DKK 2m. Were this change to be reversed, external operating costs would amount to DKK 239m (DKK 242m) and depreciation to DKK 28m (DKK 27m).
LOSS ON TRADE RECEIVABLESLoss on trade receivables amounted to 0.2 per-centage points (0.1 percentage points) affected by a general increase in provisions for loss.
Financial review
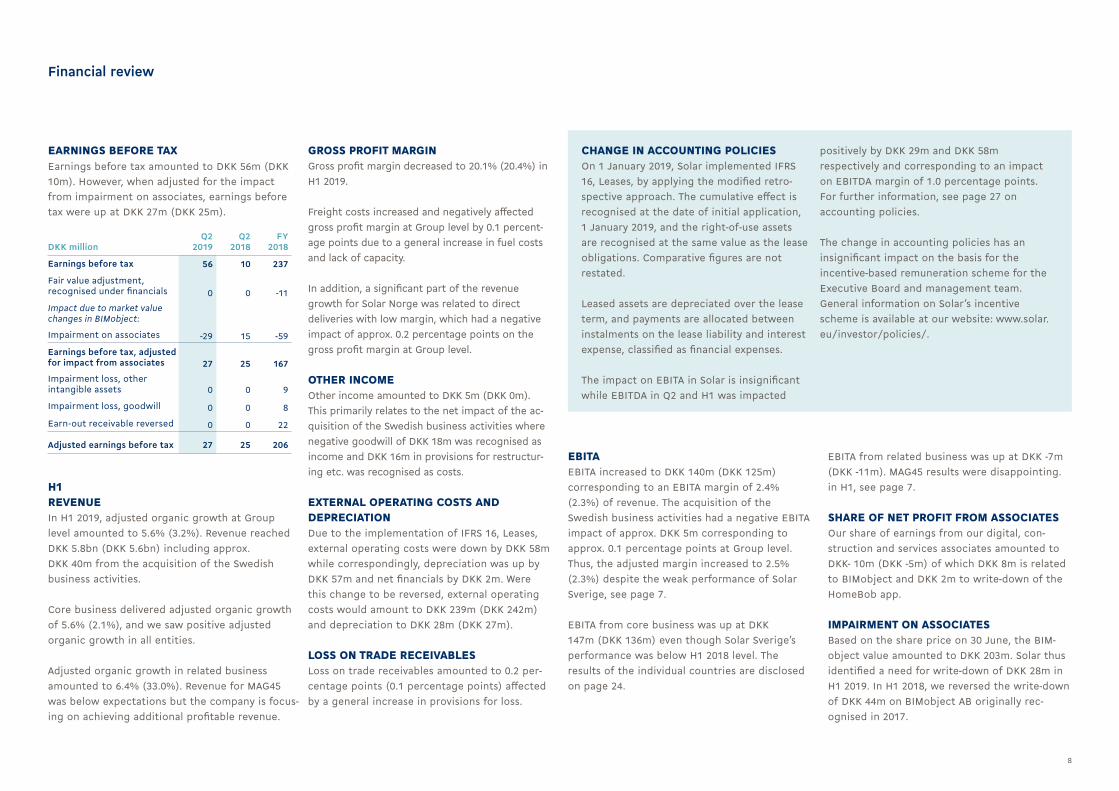
EARNINGS BEFORE TAXEarnings before tax amounted to DKK 56m (DKK 10m). However, when adjusted for the impact from impairment on associates, earnings before tax were up at DKK 27m (DKK 25m).
CHANGE IN ACCOUNTING POLICIESOn 1 January 2019, Solar implemented IFRS 16, Leases, by applying the modified retro-spective approach. The cumulative effect is recognised at the date of initial application, 1 January 2019, and the right-of-use assets are recognised at the same value as the lease obligations. Comparative figures are not restated.
Leased assets are depreciated over the lease term, and payments are allocated between instalments on the lease liability and interest expense, classified as financial expenses.
The impact on EBITA in Solar is insignificant while EBITDA in Q2 and H1 was impacted
positively by DKK 29m and DKK 58m respectively and corresponding to an impact on EBITDA margin of 1.0 percentage points. For further information, see page 27 on accounting policies.
The change in accounting policies has an insignificant impact on the basis for the incentive-based remuneration scheme for the Executive Board and management team.General information on Solar’s incentive scheme is available at our website: www.solar.eu/investor/policies/.
EBITAEBITA increased to DKK 140m (DKK 125m) corresponding to an EBITA margin of 2.4% (2.3%) of revenue. The acquisition of the Swedish business activities had a negative EBITA impact of approx. DKK 5m corresponding to approx. 0.1 percentage points at Group level. Thus, the adjusted margin increased to 2.5% (2.3%) despite the weak performance of Solar Sverige, see page 7.
EBITA from core business was up at DKK 147m (DKK 136m) even though Solar Sverige’s performance was below H1 2018 level. The results of the individual countries are disclosed on page 24.
EBITA from related business was up at DKK -7m (DKK -11m). MAG45 results were disappointing. in H1, see page 7.
SHARE OF NET PROFIT FROM ASSOCIATESOur share of earnings from our digital, con-struction and services associates amounted to DKK- 10m (DKK -5m) of which DKK 8m is related to BIMobject and DKK 2m to write-down of the HomeBob app.
IMPAIRMENT ON ASSOCIATESBased on the share price on 30 June, the BIM-object value amounted to DKK 203m. Solar thus identified a need for write-down of DKK 28m in H1 2019. In H1 2018, we reversed the write-down of DKK 44m on BIMobject AB originally rec-ognised in 2017.
DKK millionQ2
2019Q2
2018FY
2018
Earnings before tax 56 10 237
Fair value adjustment, recognised under financials 0 0 -11
Impact due to market value changes in BIMobject:
Impairment on associates -29 15 -59
Earnings before tax, adjusted for impact from associates 27 25 167
Impairment loss, other intangible assets 0 0 9
Impairment loss, goodwill 0 0 8
Earn-out receivable reversed 0 0 22
Adjusted earnings before tax 27 25 206
H1REVENUEIn H1 2019, adjusted organic growth at Group level amounted to 5.6% (3.2%). Revenue reached DKK 5.8bn (DKK 5.6bn) including approx. DKK 40m from the acquisition of the Swedish business activities.
Core business delivered adjusted organic growth of 5.6% (2.1%), and we saw positive adjusted organic growth in all entities.
Adjusted organic growth in related business amounted to 6.4% (33.0%). Revenue for MAG45 was below expectations but the company is focus-ing on achieving additional profitable revenue.
9
FINANCIALSNet financials totalled DKK -16m (DKK -12m) af-fected by the implementation of IFRS 16, Leases, of DKK -2m.
EARNINGS BEFORE TAXEarnings before tax amounted to DKK 49m (DKK 113m). However, when adjusted for the impact from impairment on associates, earnings before tax were up at DKK 77m (DKK 69m).
NET PROFITProfit from continuing operations came to DKK 30m (DKK 95m). Losses from discontinued operations amounted to DKK -2m (DKK -21m). Net profit for the Solar Group thus totalled DKK 28m (DKK 74m).
Purchase of property, plant and equipment amounted to DKK 46m (DKK 23m) affected by the finalisation of Solar Norge’s investment in AutoStore.
Cash flow from financing activities was affected by dividend distributions of DKK 102m (DKK 73m) and the implementation of IFRS 16, Leases, as an instalment on lease liabilities of DKK 56m is now included here. A change in the presentation of the cash flow statement means that raising or repayment of current interest-bearing debt is presented as part of the financing activities in 2018 and 2019. Cash flow from financing activities totalled DKK 242m (DKK 56m).
Cash flow from discontinued operations amount-ed to DKK -2m (DKK -8m). Consequently, total cash flow amounted to DKK -15m (DKK -46m).
Net interest-bearing liabilities amounted to DKK 1,182m (DKK 662m). The implementation of IFRS 16, Leases, increased the interest-bearing liabilities by DKK 304m. Furthermore, over the past 12 months, we have• invested DKK 55m in digital improvements;• invested DKK 82m in optimising our opera-
tions e.g. AutoStore;• invested DKK 50m in business activities;• paid dividend of DKK 102m.
As at 30 June 2019 gearing was 2.6 (1.8) times EBITDA, however, a 0.4 impact was seen from
Financial review
DKK millionH1
2019H1
2018FY
2018
Earnings before tax 49 113 237
Fair value adjustment, recognised under financials 0 0 -11
Impact due to market value changes in BIMobject: 0 0Impairment on associates 28 -44 -59
Earnings before tax, adjusted for impact from associates 77 69 167
Impairment loss, other intangible assets 0 0 9
Impairment loss, goodwill 0 0 8
Earn-out receivable reversed 0 0 22
Adjusted earnings before tax 77 69 206
Core business includes Solar Danmark, Solar Sverige,
Solar Norge, Solar Nederland, Solar Polska, and P/F
Solar Føroyar.
Related business includes MAG45 and Solar Polaris.
H1 2019
H1 2019
H1 2018
H1 2018
Revenue and adj. organic growth
EBITA and EBITA margin
Related business
Related business
Core business
Corebusiness
SolarGroup
Solar Group
5,276
136
295 DKKm
6.4 %
-7 DKKm
-2.4 %
5,5305.6 %
5,8255.6 %
1472.7 %
1402.4 %
274 DKKm
-11 DKKm
5,550
125
SHARE CAPITALFollowing approval at the Annual General Meeting on 15 March 2019, Solar reduced the B share capital by nominally DKK 38,562,500, from nominally DKK 774,562,500 to nominally DKK 736,000,000 at the end of April 2019. This corresponds to a reduction of the B share capi-tal of 385,625 B shares of DKK 100 by cancelling treasury B shares.
CASH FLOWSNet working capital calculated as an average of the previous four quarters amounted to 11.4% (10.5%) of revenue. Net working capital at the end of H1 2019 amounted to 12.9% (10.7%). The acquisition of the Swedish business activities has a negative impact of approx. 0.6%.
Cash flow from operating activities totalled DKK -149m (DKK -80m) impacted by inventory changes of DKK -51m (DKK -2m) and changes to receivables of DKK -246m (DKK -67m). Receiv-ables are affected by the higher revenue growth in June 2019 compared to June 2018 and by normal seasonal fluctuations.
Total cash flow from investing activities amounted to DKK -106m (DKK -14m) where the divestment of STI had a positive impact of DKK 5m, the acquisition of the Swedish business activities had a negative impact of DKK 40m and further investments in our existing financial investments impacted negatively by DKK 7m.
10
Financial review
implementing IFRS 16, Leases, as at 1 January 2019. Calculated as an average our gearing was 1.9 times EBITDA. Our gearing target is 1.5-3.0 times EBITDA.
As at 30 June 2019, Solar had undrawn credit facilities of DKK 250m.
Invested capital for the Solar Group totalled DKK 2,461m (DKK 1,972m) affected by the imple-mentation of IFRS 16, Leases, of DKK 304m. ROIC amounted to 7.9% (6.2%). However, a -0.6 impact was seen from implementing IFRS 16, Leases, as at 1 January 2019.
Activities with a Solar equity interest of less than 50% and discontinued activities are not in-cluded in the ROIC calculation. Invested capital only includes operating assets and liabilities.
KEY RISKSSolar’s Annual Report 2018 details the commer-cial and financial risks related to our activities. The key risks are that Solar, like other interna-tional companies, is affected by both global trends and local conditions in the markets where we operate.
11
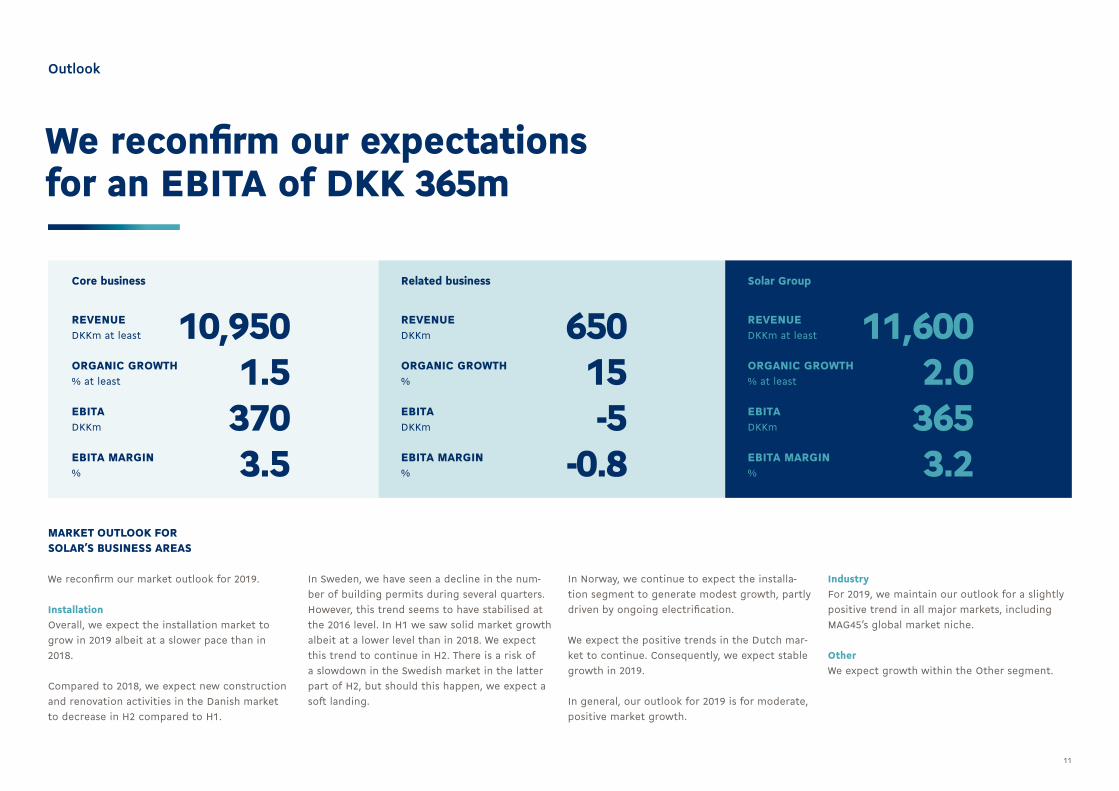
MARKET OUTLOOK FOR SOLAR’S BUSINESS AREAS
We reconfirm our market outlook for 2019.
InstallationOverall, we expect the installation market to grow in 2019 albeit at a slower pace than in 2018.
Compared to 2018, we expect new construction and renovation activities in the Danish market to decrease in H2 compared to H1.
In Sweden, we have seen a decline in the num-ber of building permits during several quarters. However, this trend seems to have stabilised at the 2016 level. In H1 we saw solid market growth albeit at a lower level than in 2018. We expect this trend to continue in H2. There is a risk of a slowdown in the Swedish market in the latter part of H2, but should this happen, we expect a soft landing.
In Norway, we continue to expect the installa-tion segment to generate modest growth, partly driven by ongoing electrification.
We expect the positive trends in the Dutch mar-ket to continue. Consequently, we expect stable growth in 2019.
In general, our outlook for 2019 is for moderate, positive market growth.
IndustryFor 2019, we maintain our outlook for a slightly positive trend in all major markets, including MAG45’s global market niche.
OtherWe expect growth within the Other segment.
Core business
REVENUE DKKm at least 10,950ORGANIC GROWTH % at least 1.5EBITA DKKm 370EBITA MARGIN % 3.5
REVENUEDKKm 650ORGANIC GROWTH % 15EBITA DKKm -5EBITA MARGIN % -0.8
Related business
We reconfirm our expectations for an EBITA of DKK 365m
Outlook
REVENUE DKKm at least 11,600ORGANIC GROWTH % at least 2.0EBITA DKKm 365EBITA MARGIN % 3.2
Solar Group
12
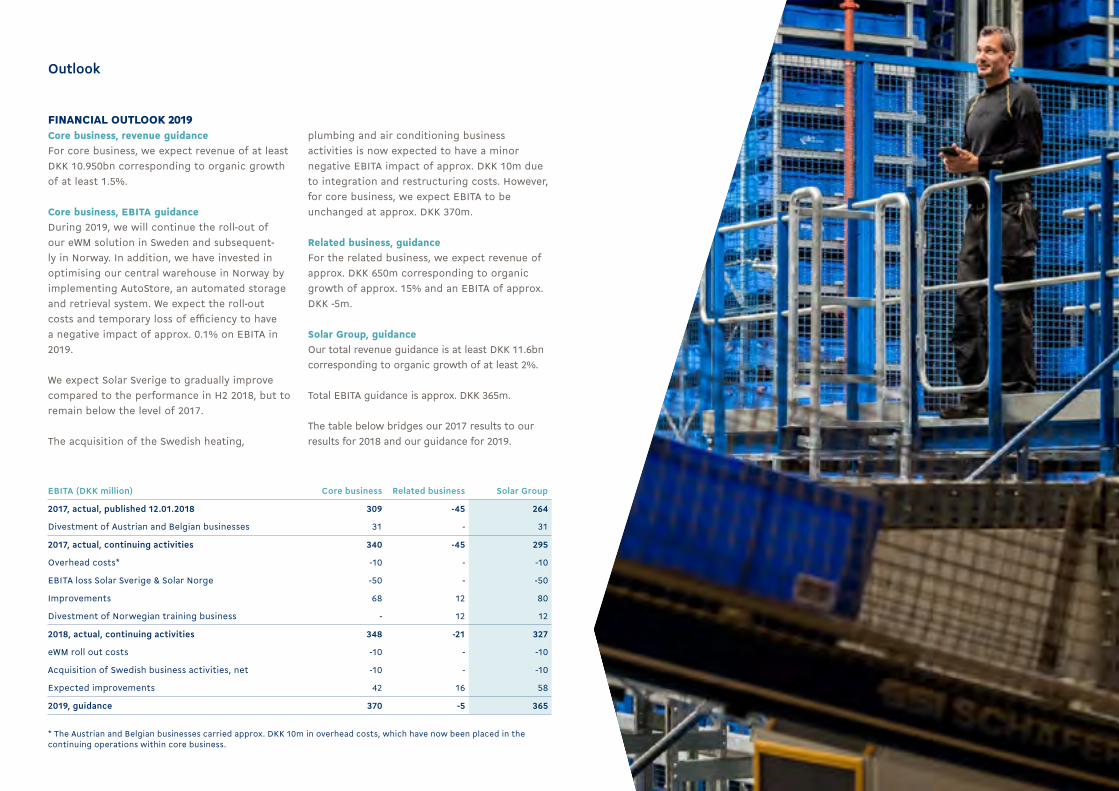
FINANCIAL OUTLOOK 2019 Core business, revenue guidanceFor core business, we expect revenue of at least DKK 10.950bn corresponding to organic growth of at least 1.5%.
Core business, EBITA guidanceDuring 2019, we will continue the roll-out of our eWM solution in Sweden and subsequent-ly in Norway. In addition, we have invested in optimising our central warehouse in Norway by implementing AutoStore, an automated storage and retrieval system. We expect the roll-out costs and temporary loss of efficiency to have a negative impact of approx. 0.1% on EBITA in 2019.
We expect Solar Sverige to gradually improve compared to the performance in H2 2018, but to remain below the level of 2017.
The acquisition of the Swedish heating,
EBITA (DKK million) Core business Related business Solar Group
2017, actual, published 12.01.2018 309 -45 264
Divestment of Austrian and Belgian businesses 31 - 31
2017, actual, continuing activities 340 -45 295
Overhead costs* -10 - -10
EBITA loss Solar Sverige & Solar Norge -50 - -50
Improvements 68 12 80
Divestment of Norwegian training business - 12 12
2018, actual, continuing activities 348 -21 327
eWM roll out costs -10 - -10
Acquisition of Swedish business activities, net -10 - -10
Expected improvements 42 16 58
2019, guidance 370 -5 365
* The Austrian and Belgian businesses carried approx. DKK 10m in overhead costs, which have now been placed in thecontinuing operations within core business.
plumbing and air conditioning business activities is now expected to have a minor negative EBITA impact of approx. DKK 10m due to integration and restructuring costs. However, for core business, we expect EBITA to be unchanged at approx. DKK 370m.
Related business, guidanceFor the related business, we expect revenue of approx. DKK 650m corresponding to organic growth of approx. 15% and an EBITA of approx. DKK -5m.
Solar Group, guidanceOur total revenue guidance is at least DKK 11.6bn corresponding to organic growth of at least 2%.
Total EBITA guidance is approx. DKK 365m.
The table below bridges our 2017 results to our results for 2018 and our guidance for 2019.
Outlook
13
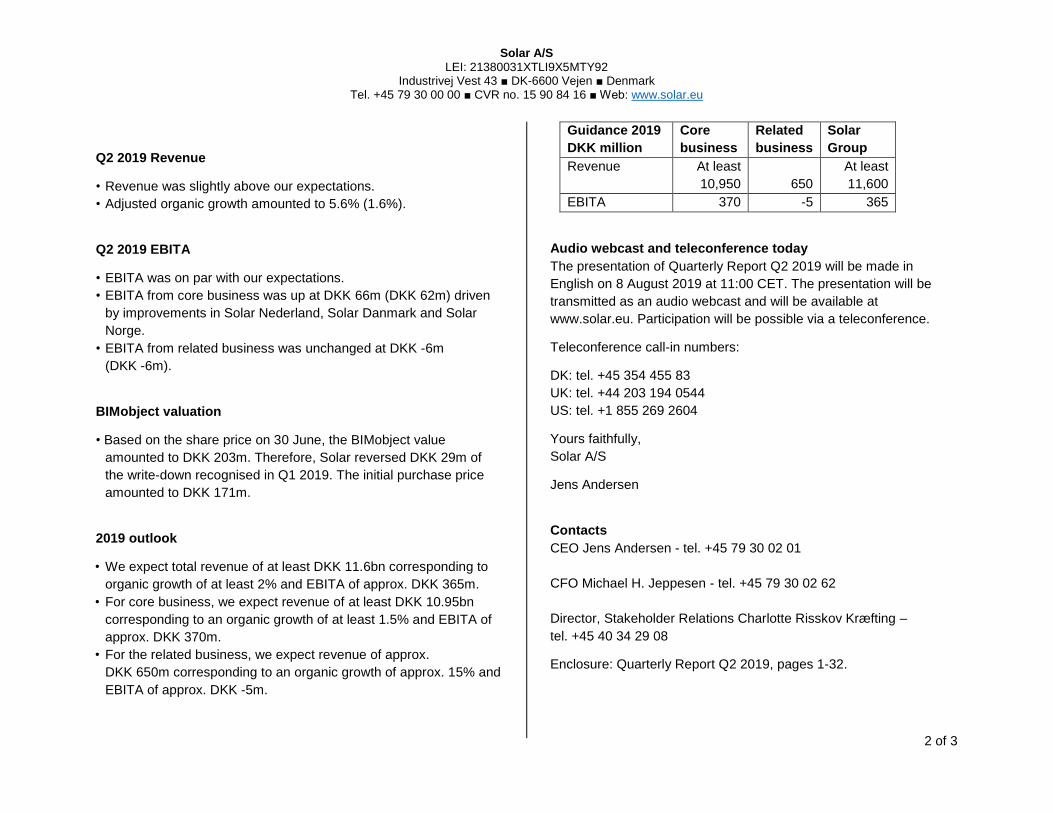
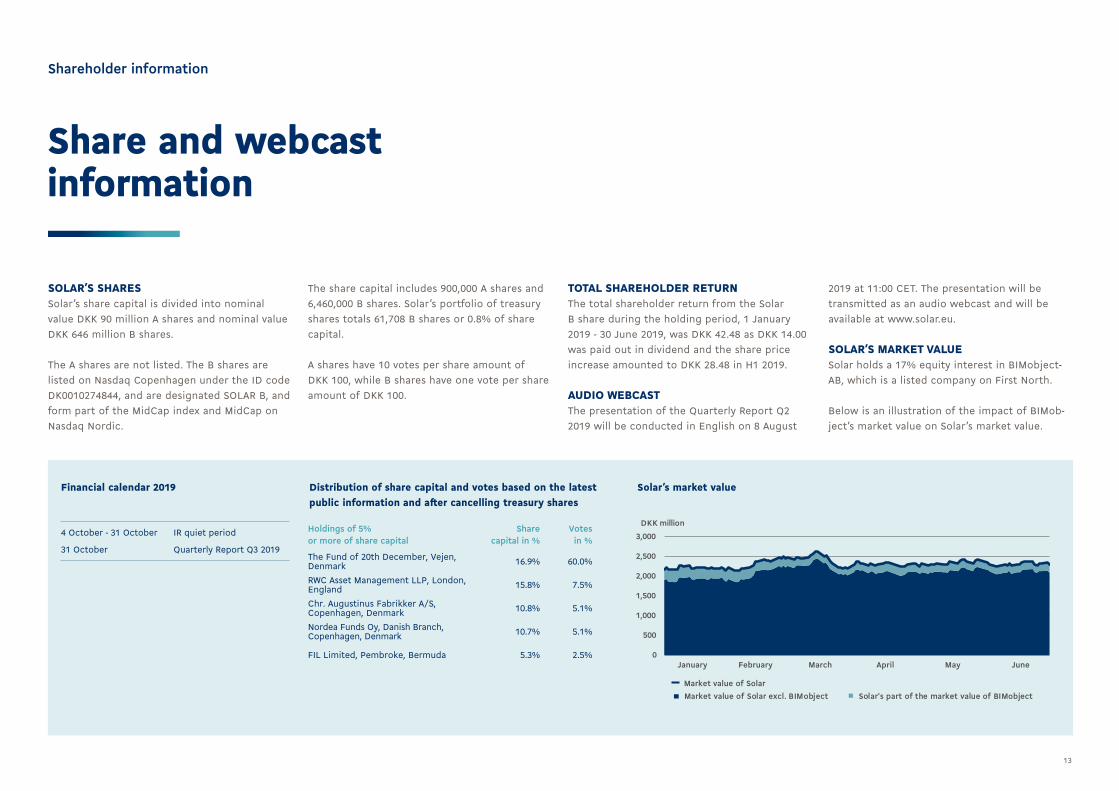
0
500
1,000
1,500
2,000
2,500
3,000
January February March April May June
DKK million
Market value of Solar excl. BIMobject Solar's part of the market value of BIMobjectMarket value of Solar
Share and webcast information
Shareholder information
SOLAR’S SHARESSolar’s share capital is divided into nominal value DKK 90 million A shares and nominal value DKK 646 million B shares.
The A shares are not listed. The B shares are listed on Nasdaq Copenhagen under the ID code DK0010274844, and are designated SOLAR B, and form part of the MidCap index and MidCap on Nasdaq Nordic.
The share capital includes 900,000 A shares and 6,460,000 B shares. Solar’s portfolio of treasury shares totals 61,708 B shares or 0.8% of share capital.
A shares have 10 votes per share amount of DKK 100, while B shares have one vote per share amount of DKK 100.
TOTAL SHAREHOLDER RETURNThe total shareholder return from the Solar B share during the holding period, 1 January 2019 - 30 June 2019, was DKK 42.48 as DKK 14.00 was paid out in dividend and the share price increase amounted to DKK 28.48 in H1 2019.
AUDIO WEBCASTThe presentation of the Quarterly Report Q2 2019 will be conducted in English on 8 August
Solar’s market valueDistribution of share capital and votes based on the latest public information and after cancelling treasury shares
Holdings of 5% or more of share capital
Share capital in %
Votes in %
The Fund of 20th December, Vejen, Denmark 16.9% 60.0%
RWC Asset Management LLP, London, England 15.8% 7.5%
Chr. Augustinus Fabrikker A/S, Copenhagen, Denmark 10.8% 5.1%
Nordea Funds Oy, Danish Branch, Copenhagen, Denmark 10.7% 5.1%
FIL Limited, Pembroke, Bermuda 5.3% 2.5%
Financial calendar 2019
4 October - 31 October IR quiet period
31 October Quarterly Report Q3 2019
2019 at 11:00 CET. The presentation will be transmitted as an audio webcast and will be available at www.solar.eu.
SOLAR’S MARKET VALUESolar holds a 17% equity interest in BIMobject-AB, which is a listed company on First North.
Below is an illustration of the impact of BIMob-ject’s market value on Solar’s market value.
14
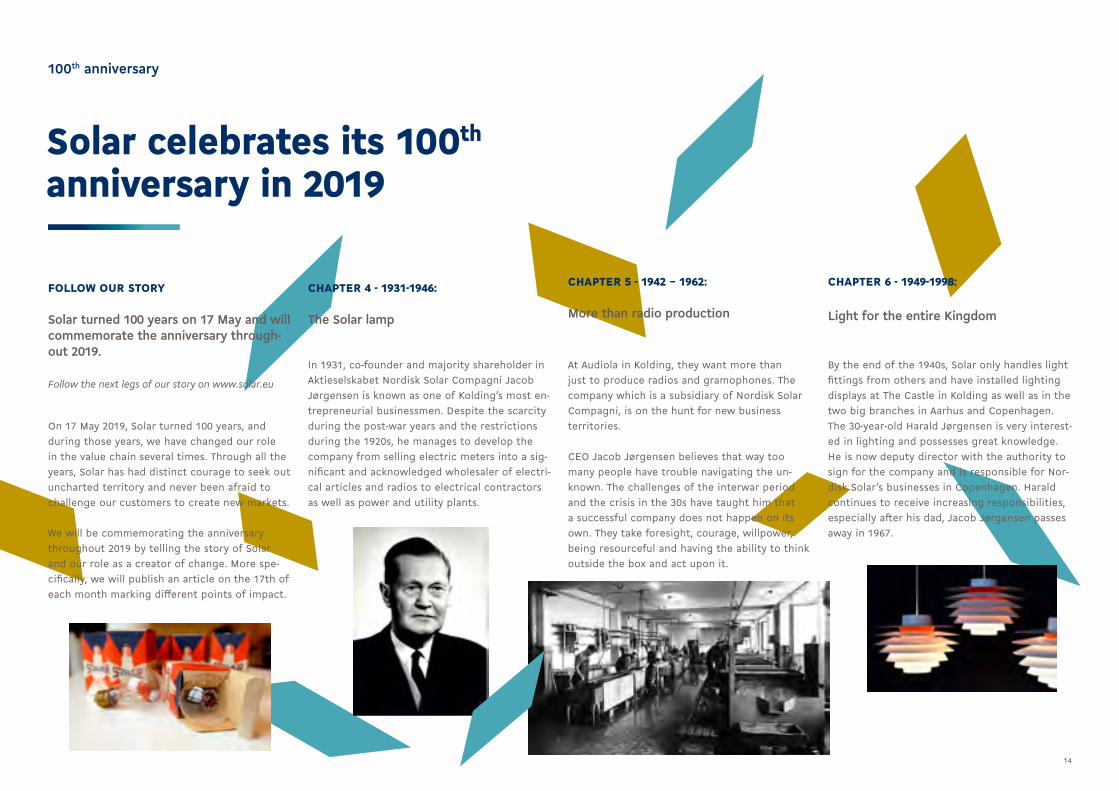
Solar celebrates its 100th anniversary in 2019
100th anniversary
CHAPTER 5 - 1942 – 1962:
More than radio production
At Audiola in Kolding, they want more than just to produce radios and gramophones. The company which is a subsidiary of Nordisk Solar Compagni, is on the hunt for new business territories.
CEO Jacob Jørgensen believes that way too many people have trouble navigating the un-known. The challenges of the interwar period and the crisis in the 30s have taught him that a successful company does not happen on its own. They take foresight, courage, willpower, being resourceful and having the ability to think outside the box and act upon it.
CHAPTER 4 - 1931-1946:
The Solar lamp
In 1931, co-founder and majority shareholder in Aktieselskabet Nordisk Solar Compagni Jacob Jørgensen is known as one of Kolding’s most en-trepreneurial businessmen. Despite the scarcity during the post-war years and the restrictions during the 1920s, he manages to develop the company from selling electric meters into a sig-nificant and acknowledged wholesaler of electri-cal articles and radios to electrical contractors as well as power and utility plants.
FOLLOW OUR STORY
Solar turned 100 years on 17 May and will commemorate the anniversary through-out 2019.
Follow the next legs of our story on www.solar.eu
On 17 May 2019, Solar turned 100 years, and during those years, we have changed our role in the value chain several times. Through all the years, Solar has had distinct courage to seek out uncharted territory and never been afraid to challenge our customers to create new markets.
We will be commemorating the anniversary throughout 2019 by telling the story of Solar and our role as a creator of change. More spe-cifically, we will publish an article on the 17th of each month marking different points of impact.
CHAPTER 6 - 1949-1998:
Light for the entire Kingdom
By the end of the 1940s, Solar only handles light fittings from others and have installed lighting displays at The Castle in Kolding as well as in the two big branches in Aarhus and Copenhagen. The 30-year-old Harald Jørgensen is very interest-ed in lighting and possesses great knowledge. He is now deputy director with the authority to sign for the company and is responsible for Nor-disk Solar’s businesses in Copenhagen. Harald continues to receive increasing responsibilities, especially after his dad, Jacob Jørgensen passes away in 1967.

15
Q4 2018
1515
Consolidated financial statements
16
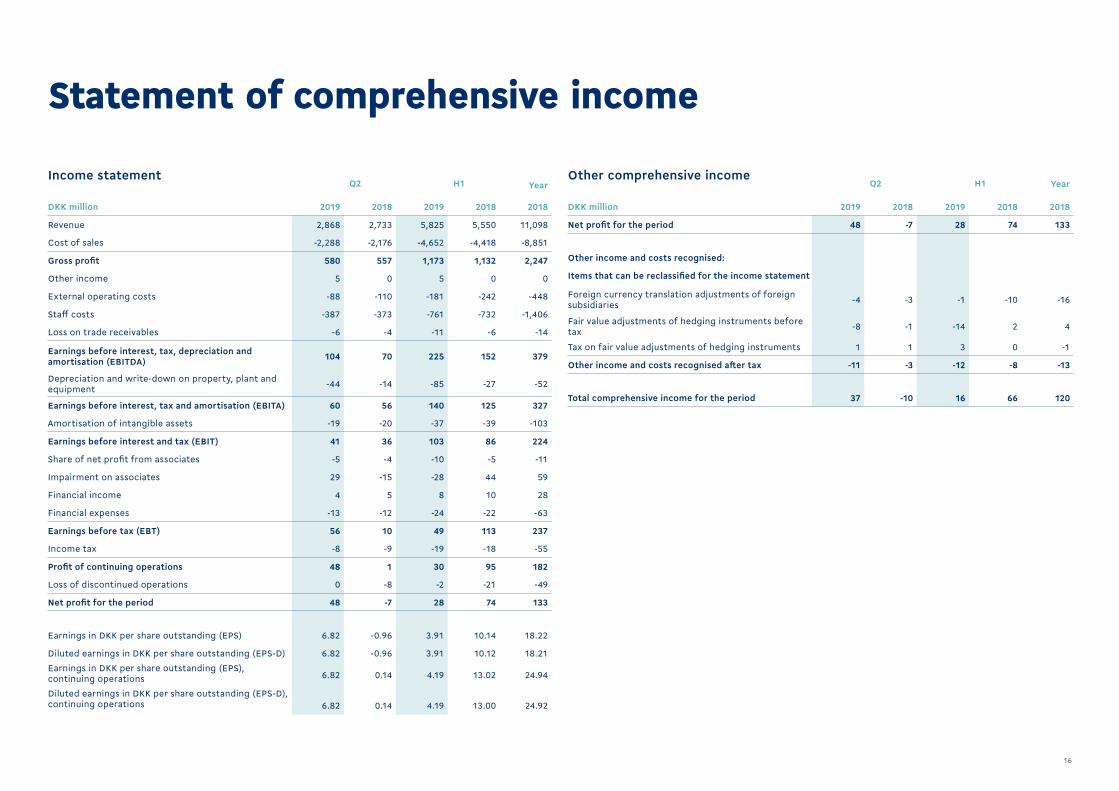
Income statementYearQ2 H1
DKK million 2019 2018 2019 2018 2018
Revenue 2,868 2,733 5,825 5,550 11,098
Cost of sales -2,288 -2,176 -4,652 -4,418 -8,851
Gross profit 580 557 1,173 1,132 2,247
Other income 5 0 5 0 0
External operating costs -88 -110 -181 -242 -448
Staff costs -387 -373 -761 -732 -1,406
Loss on trade receivables -6 -4 -11 -6 -14
Earnings before interest, tax, depreciation and amortisation (EBITDA) 104 70 225 152 379
Depreciation and write-down on property, plant and equipment -44 -14 -85 -27 -52
Earnings before interest, tax and amortisation (EBITA) 60 56 140 125 327
Amortisation of intangible assets -19 -20 -37 -39 -103
Earnings before interest and tax (EBIT) 41 36 103 86 224
Share of net profit from associates -5 -4 -10 -5 -11
Impairment on associates 29 -15 -28 44 59
Financial income 4 5 8 10 28
Financial expenses -13 -12 -24 -22 -63
Earnings before tax (EBT) 56 10 49 113 237
Income tax -8 -9 -19 -18 -55
Profit of continuing operations 48 1 30 95 182
Loss of discontinued operations 0 -8 -2 -21 -49
Net profit for the period 48 -7 28 74 133
Earnings in DKK per share outstanding (EPS) 6.82 -0.96 3.91 10.14 18.22
Diluted earnings in DKK per share outstanding (EPS-D) 6.82 -0.96 3.91 10.12 18.21Earnings in DKK per share outstanding (EPS), continuing operations 6.82 0.14 4.19 13.02 24.94
Diluted earnings in DKK per share outstanding (EPS-D), continuing operations 6.82 0.14 4.19 13.00 24.92
Statement of comprehensive income
Other comprehensive incomeYearQ2 H1
DKK million 2019 2018 2019 2018 2018
Net profit for the period 48 -7 28 74 133
Other income and costs recognised:
Items that can be reclassified for the income statement
Foreign currency translation adjustments of foreign subsidiaries -4 -3 -1 -10 -16
Fair value adjustments of hedging instruments before tax -8 -1 -14 2 4
Tax on fair value adjustments of hedging instruments 1 1 3 0 -1
Other income and costs recognised after tax -11 -3 -12 -8 -13
Total comprehensive income for the period 37 -10 16 66 120
17
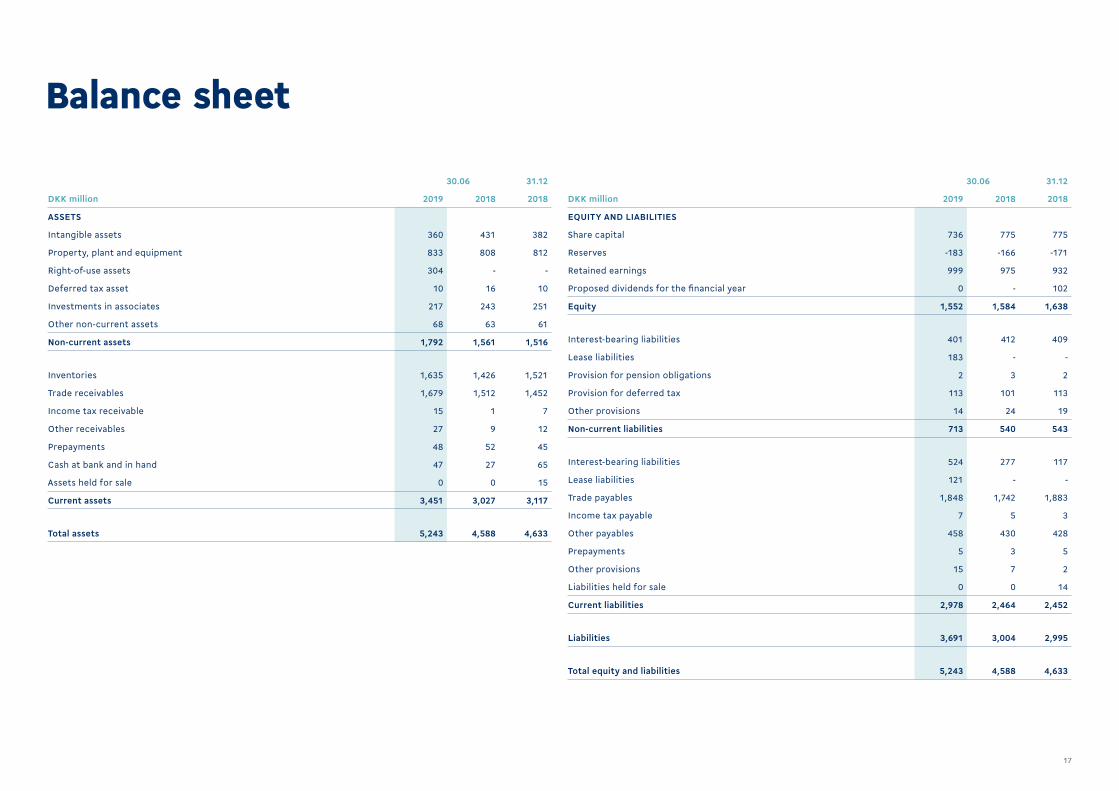
Balance sheet
30.06 31.12
DKK million 2019 2018 2018
ASSETS
Intangible assets 360 431 382
Property, plant and equipment 833 808 812
Right-of-use assets 304 - -
Deferred tax asset 10 16 10
Investments in associates 217 243 251
Other non-current assets 68 63 61
Non-current assets 1,792 1,561 1,516
Inventories 1,635 1,426 1,521
Trade receivables 1,679 1,512 1,452
Income tax receivable 15 1 7
Other receivables 27 9 12
Prepayments 48 52 45
Cash at bank and in hand 47 27 65
Assets held for sale 0 0 15
Current assets 3,451 3,027 3,117
Total assets 5,243 4,588 4,633
30.06 31.12
DKK million 2019 2018 2018
EQUITY AND LIABILITIES
Share capital 736 775 775
Reserves -183 -166 -171
Retained earnings 999 975 932
Proposed dividends for the financial year 0 - 102
Equity 1,552 1,584 1,638
Interest-bearing liabilities 401 412 409
Lease liabilities 183 - -
Provision for pension obligations 2 3 2
Provision for deferred tax 113 101 113
Other provisions 14 24 19
Non-current liabilities 713 540 543
Interest-bearing liabilities 524 277 117
Lease liabilities 121 - -
Trade payables 1,848 1,742 1,883
Income tax payable 7 5 3
Other payables 458 430 428
Prepayments 5 3 5
Other provisions 15 7 2
Liabilities held for sale 0 0 14
Current liabilities 2,978 2,464 2,452
Liabilities 3,691 3,004 2,995
Total equity and liabilities 5,243 4,588 4,633
18
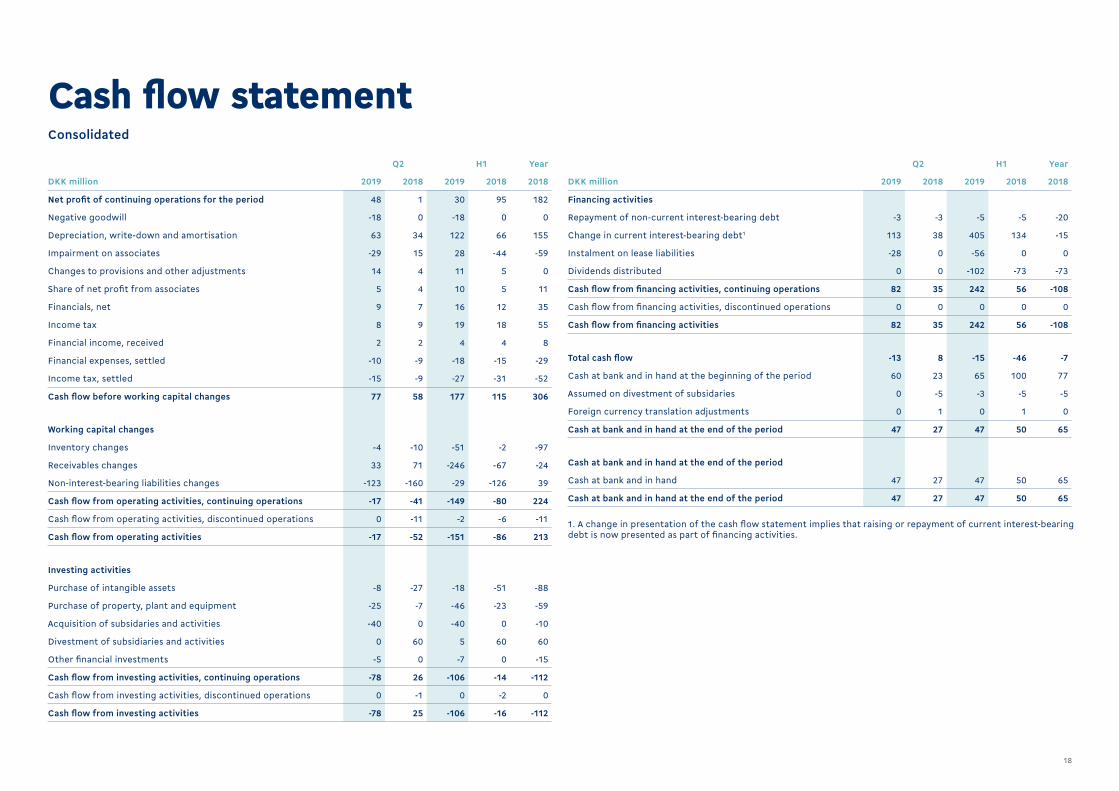
Q2 H1 Year
DKK million 2019 2018 2019 2018 2018
Net profit of continuing operations for the period 48 1 30 95 182
Negative goodwill -18 0 -18 0 0
Depreciation, write-down and amortisation 63 34 122 66 155
Impairment on associates -29 15 28 -44 -59
Changes to provisions and other adjustments 14 4 11 5 0
Share of net profit from associates 5 4 10 5 11
Financials, net 9 7 16 12 35
Income tax 8 9 19 18 55
Financial income, received 2 2 4 4 8
Financial expenses, settled -10 -9 -18 -15 -29
Income tax, settled -15 -9 -27 -31 -52
Cash flow before working capital changes 77 58 177 115 306
Working capital changes
Inventory changes -4 -10 -51 -2 -97
Receivables changes 33 71 -246 -67 -24
Non-interest-bearing liabilities changes -123 -160 -29 -126 39
Cash flow from operating activities, continuing operations -17 -41 -149 -80 224
Cash flow from operating activities, discontinued operations 0 -11 -2 -6 -11
Cash flow from operating activities -17 -52 -151 -86 213
Investing activities
Purchase of intangible assets -8 -27 -18 -51 -88
Purchase of property, plant and equipment -25 -7 -46 -23 -59
Acquisition of subsidaries and activities -40 0 -40 0 -10
Divestment of subsidiaries and activities 0 60 5 60 60
Other financial investments -5 0 -7 0 -15
Cash flow from investing activities, continuing operations -78 26 -106 -14 -112
Cash flow from investing activities, discontinued operations 0 -1 0 -2 0
Cash flow from investing activities -78 25 -106 -16 -112
Cash flow statementQ2 H1 Year
DKK million 2019 2018 2019 2018 2018
Financing activities
Repayment of non-current interest-bearing debt -3 -3 -5 -5 -20
Change in current interest-bearing debt1 113 38 405 134 -15
Instalment on lease liabilities -28 0 -56 0 0
Dividends distributed 0 0 -102 -73 -73
Cash flow from financing activities, continuing operations 82 35 242 56 -108
Cash flow from financing activities, discontinued operations 0 0 0 0 0
Cash flow from financing activities 82 35 242 56 -108
Total cash flow -13 8 -15 -46 -7
Cash at bank and in hand at the beginning of the period 60 23 65 100 77
Assumed on divestment of subsidaries 0 -5 -3 -5 -5
Foreign currency translation adjustments 0 1 0 1 0
Cash at bank and in hand at the end of the period 47 27 47 50 65
Cash at bank and in hand at the end of the period
Cash at bank and in hand 47 27 47 50 65
Cash at bank and in hand at the end of the period 47 27 47 50 65
1. A change in presentation of the cash flow statement implies that raising or repayment of current interest-bearingdebt is now presented as part of financing activities.
Consolidated
19
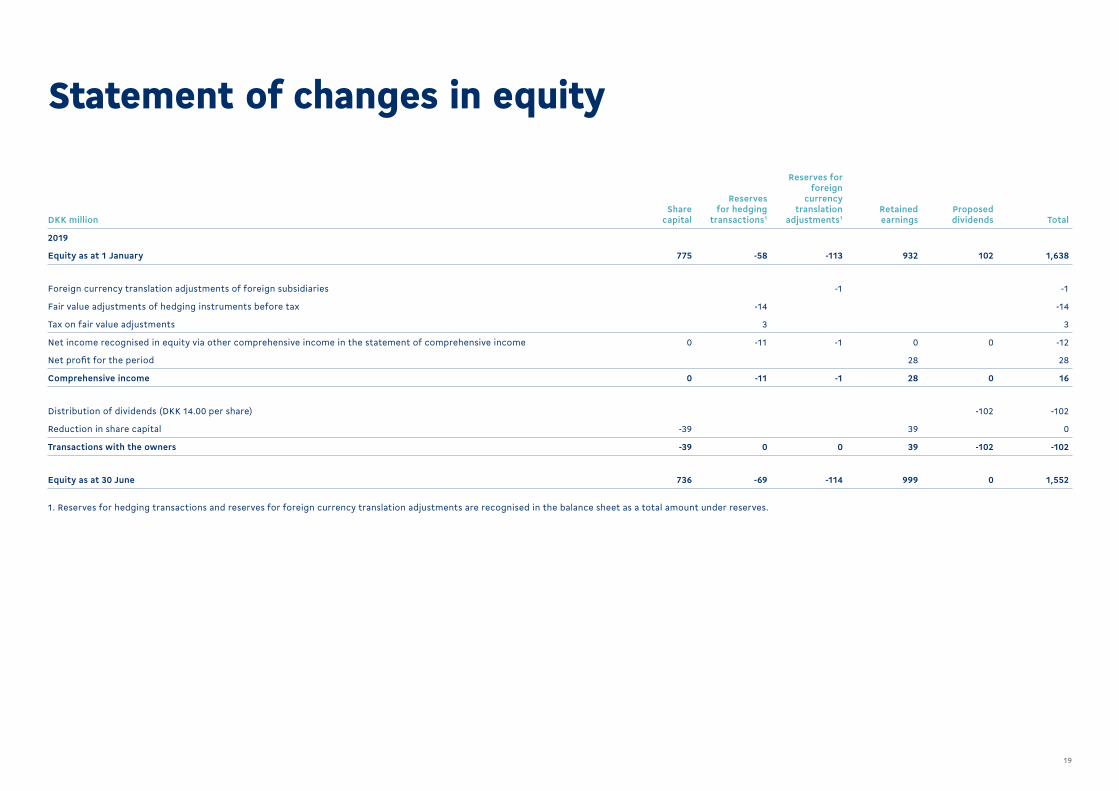
Statement of changes in equity
DKK millionShare
capital
Reservesfor hedging
transactions1
Reserves for foreign
currencytranslation
adjustments1Retainedearnings
Proposeddividends Total
2019
Equity as at 1 January 775 -58 -113 932 102 1,638
Foreign currency translation adjustments of foreign subsidiaries -1 -1
Fair value adjustments of hedging instruments before tax -14 -14
Tax on fair value adjustments 3 3
Net income recognised in equity via other comprehensive income in the statement of comprehensive income 0 -11 -1 0 0 -12
Net profit for the period 28 28
Comprehensive income 0 -11 -1 28 0 16
Distribution of dividends (DKK 14.00 per share) -102 -102
Reduction in share capital -39 39 0
Transactions with the owners -39 0 0 39 -102 -102
Equity as at 30 June 736 -69 -114 999 0 1,552
1. Reserves for hedging transactions and reserves for foreign currency translation adjustments are recognised in the balance sheet as a total amount under reserves.
20
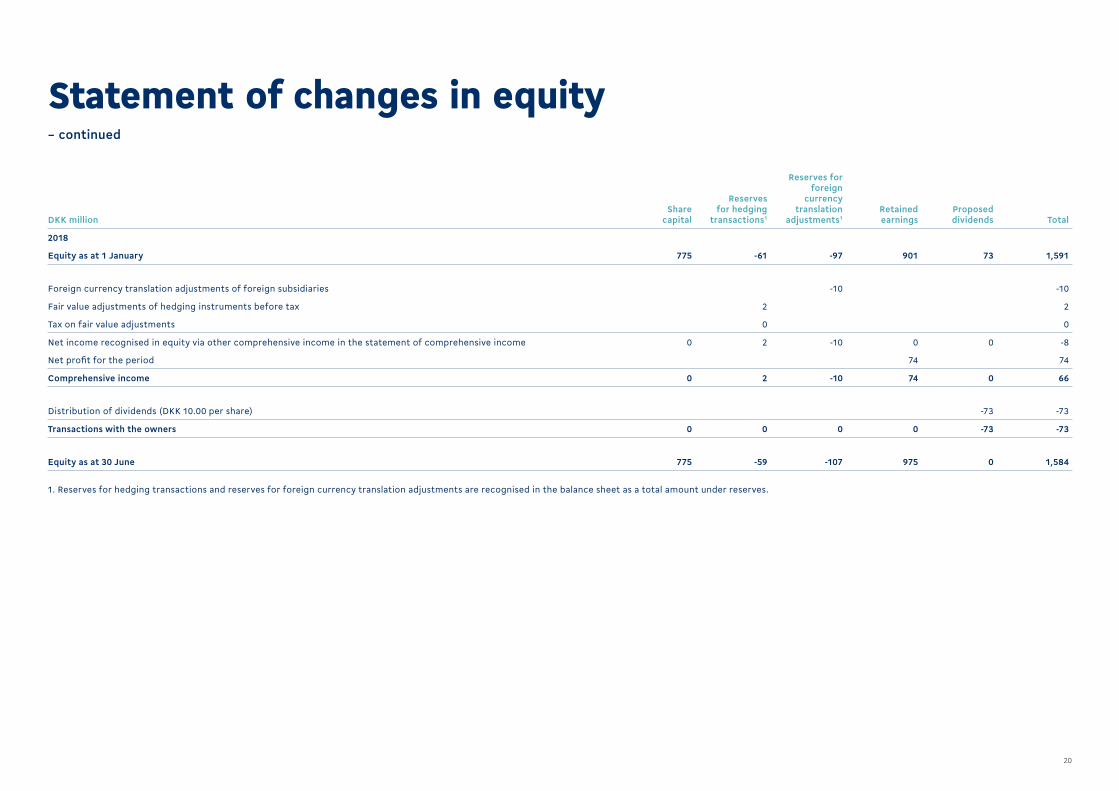
DKK millionShare
capital
Reservesfor hedging
transactions1
Reserves for foreign
currencytranslation
adjustments1Retainedearnings
Proposeddividends Total
2018
Equity as at 1 January 775 -61 -97 901 73 1,591
Foreign currency translation adjustments of foreign subsidiaries -10 -10
Fair value adjustments of hedging instruments before tax 2 2
Tax on fair value adjustments 0 0
Net income recognised in equity via other comprehensive income in the statement of comprehensive income 0 2 -10 0 0 -8
Net profit for the period 74 74
Comprehensive income 0 2 -10 74 0 66
Distribution of dividends (DKK 10.00 per share) -73 -73
Transactions with the owners 0 0 0 0 -73 -73
Equity as at 30 June 775 -59 -107 975 0 1,584
1. Reserves for hedging transactions and reserves for foreign currency translation adjustments are recognised in the balance sheet as a total amount under reserves.
Statement of changes in equity– continued
21
DKK million Installation Industry Other Total
Q2 2019
Revenue 1,826 888 154 2,868
Cost of sales -1,488 -683 -117 -2,288
Gross profit 338 205 37 580
Direct costs -66 -28 -5 -99
Earnings before indirect costs 272 177 32 481
Indirect costs -154 -45 -12 -211
Segment profit 118 132 20 270
Non-allocated costs -166
Earnings before interest, tax, depreciation and amortisation (EBITDA) 104
Depreciation and amortisation -63
Earnings before interest and tax (EBIT) 41
Financials, net, and impact from associates 15
Earnings before tax (EBT) 56
DKK million Installation Industry Other Total
Q2 2018
Revenue 1,707 871 155 2,733
Cost of sales -1,381 -673 -122 -2,176
Gross profit 326 198 33 557
Direct costs -63 -26 -8 -97
Earnings before indirect costs 263 172 25 460
Indirect costs -134 -45 -13 -192
Segment profit 129 127 12 268
Non-allocated costs -198
Earnings before interest, tax, depreciation and amortisation (EBITDA) 70
Depreciation and amortisation -34
Earnings before interest and tax (EBIT) 36
Financials, net, and impact from associates -26
Earnings before tax (EBT) 10
Notes
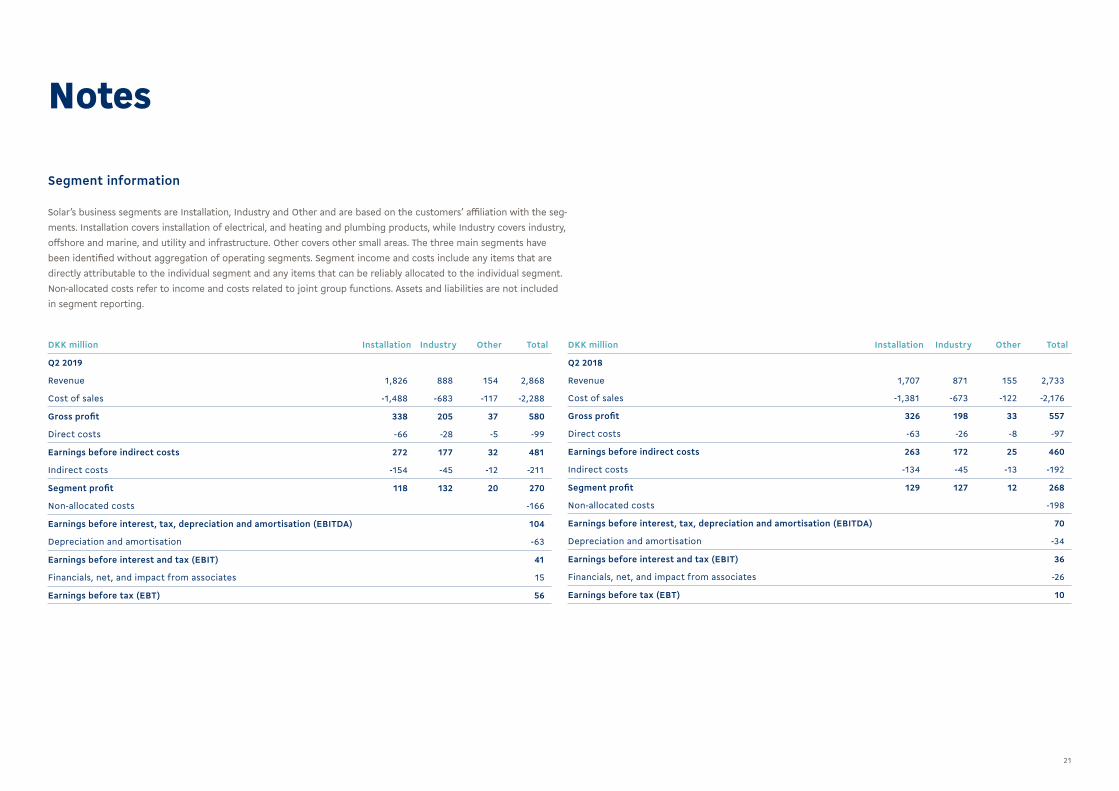
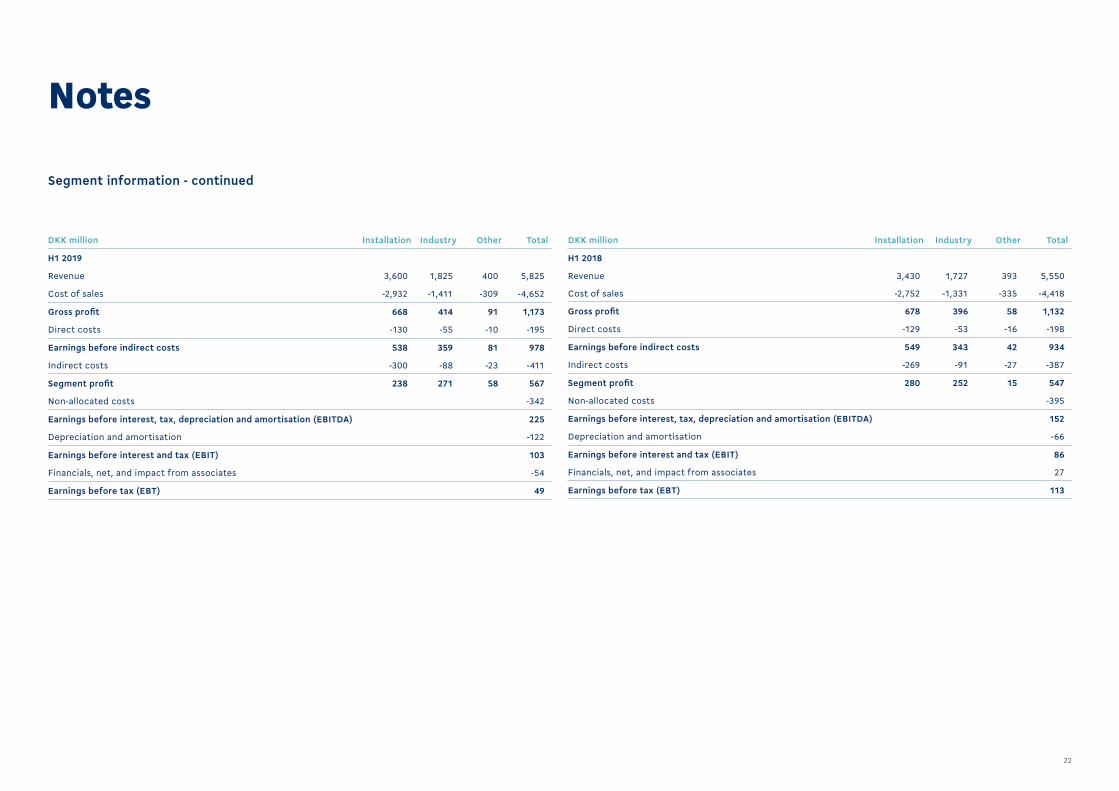
Solar’s business segments are Installation, Industry and Other and are based on the customers’ affiliation with the seg-ments. Installation covers installation of electrical, and heating and plumbing products, while Industry covers industry, offshore and marine, and utility and infrastructure. Other covers other small areas. The three main segments have been identified without aggregation of operating segments. Segment income and costs include any items that are directly attributable to the individual segment and any items that can be reliably allocated to the individual segment. Non-allocated costs refer to income and costs related to joint group functions. Assets and liabilities are not included in segment reporting.
Segment information
22
Segment information - continued
Notes
DKK million Installation Industry Other Total
H1 2019
Revenue 3,600 1,825 400 5,825
Cost of sales -2,932 -1,411 -309 -4,652
Gross profit 668 414 91 1,173
Direct costs -130 -55 -10 -195
Earnings before indirect costs 538 359 81 978
Indirect costs -300 -88 -23 -411
Segment profit 238 271 58 567
Non-allocated costs -342
Earnings before interest, tax, depreciation and amortisation (EBITDA) 225
Depreciation and amortisation -122
Earnings before interest and tax (EBIT) 103
Financials, net, and impact from associates -54
Earnings before tax (EBT) 49
DKK million Installation Industry Other Total
H1 2018
Revenue 3,430 1,727 393 5,550
Cost of sales -2,752 -1,331 -335 -4,418
Gross profit 678 396 58 1,132
Direct costs -129 -53 -16 -198
Earnings before indirect costs 549 343 42 934
Indirect costs -269 -91 -27 -387
Segment profit 280 252 15 547
Non-allocated costs -395
Earnings before interest, tax, depreciation and amortisation (EBITDA) 152
Depreciation and amortisation -66
Earnings before interest and tax (EBIT) 86
Financials, net, and impact from associates 27
Earnings before tax (EBT) 113
23
DKK million RevenueAdjusted
organic growth2 EBITA EBITA marginNon-current
assets
Q2 2019
Denmark 844 4.0 42 5.0 2,111
Sweden 633 3.2 -4 -0.6 335
Norway 484 14.3 9 1.9 209
The Netherlands 713 4.4 17 2.4 313
Poland1 94 1.3 1 1.1 35
Other markets 7 15.1 1 14.3 10
Eliminations -53 - 0 0.0 -1,291
Core business 2,722 5.6 66 2.4 1,722
Several markets (MAG45)1 140 4.6 -5 -3.6 69
Other markets 6 - -1 -16.7 1
Related business 146 6.3 -6 -4.1 70
Solar Group 2,868 5.6 60 2.1 1,792
1 Previously part of other markets2 Adjustment for intercompany revenue has been made. The organic growth in Solar Sverige has been adjusted for the estimated impact of the acquisition of business activities.
DKK million RevenueAdjusted
organic growth EBITA EBITA marginNon-current
assets
Q2 2018
Denmark 831 5.1 39 4.7 1,876
Sweden 584 -5.2 7 1.2 241
Norway 441 -3.4 6 1.4 157
The Netherlands 668 3.2 10 1.5 292
Poland1 85 4.7 0 0.0 29
Other markets 14 3.1 0 0.0 6
Eliminations -24 - 0 0.0 -1,077
Core business 2,599 0.6 62 2.4 1,524
Several markets (MAG45)1 131 33.1 -4 -3.1 37
Other markets 3 - -2 -66.7 0
Related business 134 31.1 -6 -4.5 37
Solar Group 2,733 1.6 56 2.0 1,561
1 Previously part of other markets
Notes
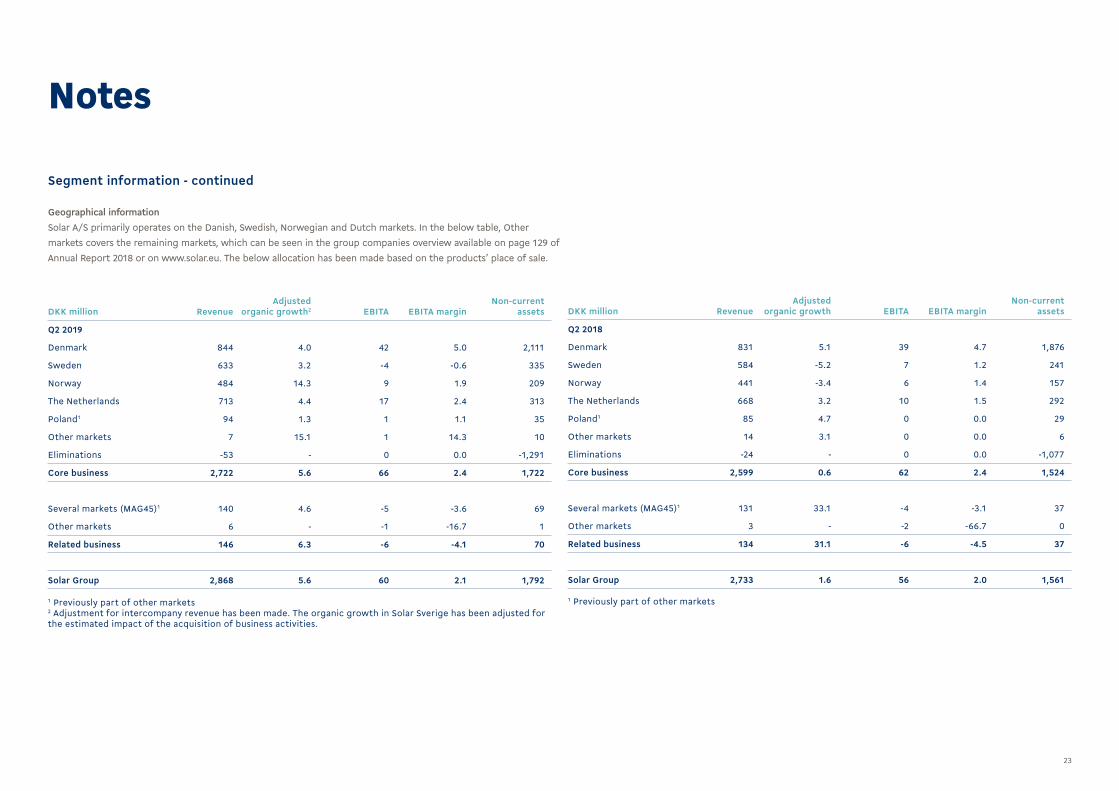
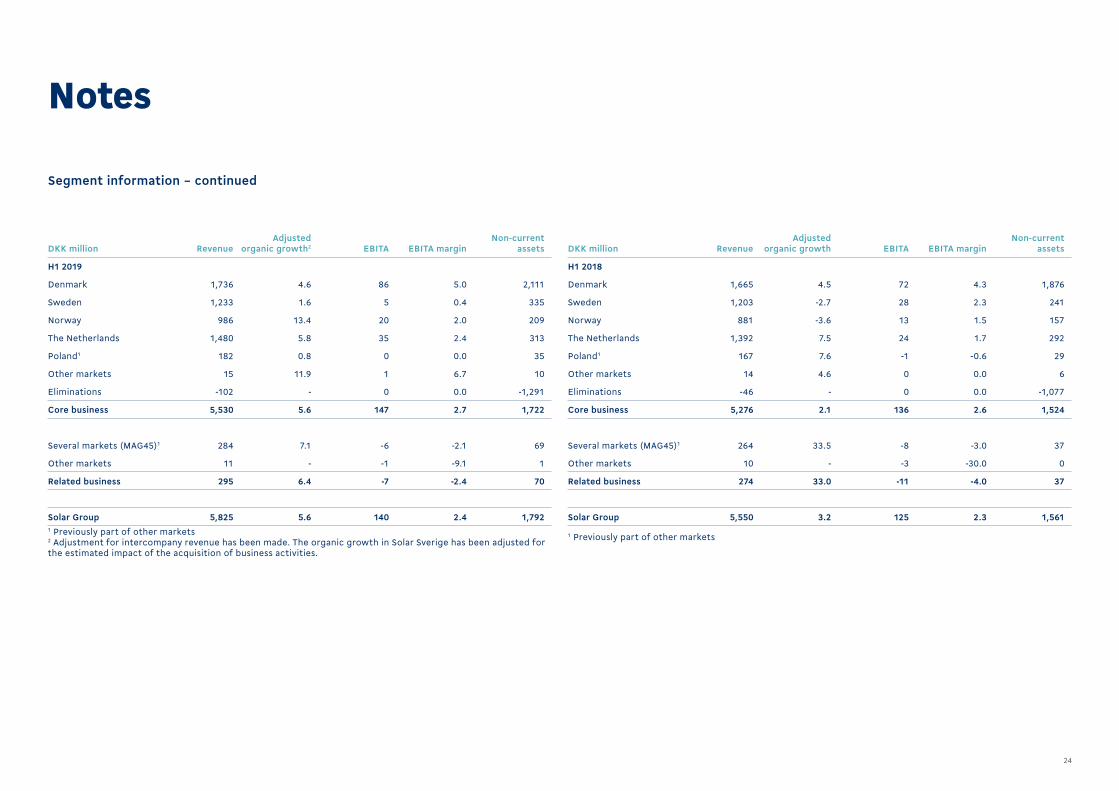
Geographical informationSolar A/S primarily operates on the Danish, Swedish, Norwegian and Dutch markets. In the below table, Other markets covers the remaining markets, which can be seen in the group companies overview available on page 129 of Annual Report 2018 or on www.solar.eu. The below allocation has been made based on the products’ place of sale.
Segment information - continued
24
Segment information – continued
Notes
DKK million RevenueAdjusted
organic growth2 EBITA EBITA marginNon-current
assets
H1 2019
Denmark 1,736 4.6 86 5.0 2,111
Sweden 1,233 1.6 5 0.4 335
Norway 986 13.4 20 2.0 209
The Netherlands 1,480 5.8 35 2.4 313
Poland1 182 0.8 0 0.0 35
Other markets 15 11.9 1 6.7 10
Eliminations -102 - 0 0.0 -1,291
Core business 5,530 5.6 147 2.7 1,722
Several markets (MAG45)1 284 7.1 -6 -2.1 69
Other markets 11 - -1 -9.1 1
Related business 295 6.4 -7 -2.4 70
Solar Group 5,825 5.6 140 2.4 1,7921 Previously part of other markets2 Adjustment for intercompany revenue has been made. The organic growth in Solar Sverige has been adjusted for the estimated impact of the acquisition of business activities.
DKK million RevenueAdjusted
organic growth EBITA EBITA marginNon-current
assets
H1 2018
Denmark 1,665 4.5 72 4.3 1,876
Sweden 1,203 -2.7 28 2.3 241
Norway 881 -3.6 13 1.5 157
The Netherlands 1,392 7.5 24 1.7 292
Poland1 167 7.6 -1 -0.6 29
Other markets 14 4.6 0 0.0 6
Eliminations -46 - 0 0.0 -1,077
Core business 5,276 2.1 136 2.6 1,524
Several markets (MAG45)1 264 33.5 -8 -3.0 37
Other markets 10 - -3 -30.0 0
Related business 274 33.0 -11 -4.0 37
Solar Group 5,550 3.2 125 2.3 1,561
1 Previously part of other markets
25
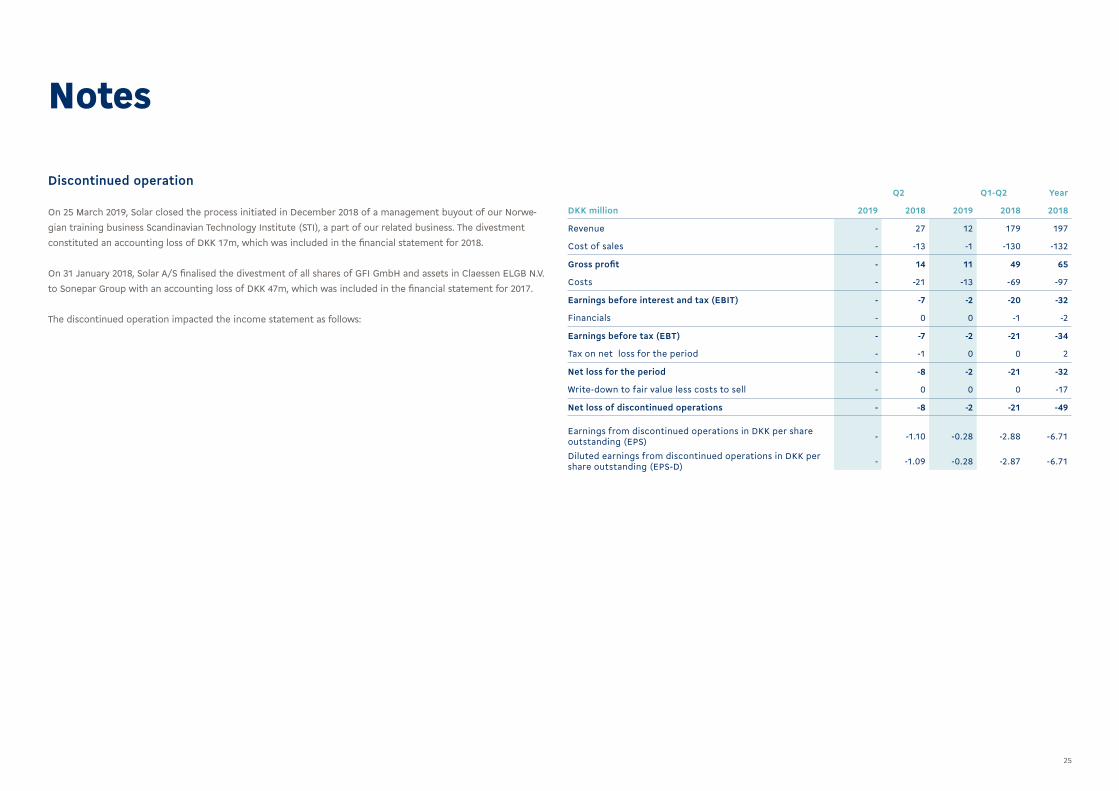
Discontinued operation
On 25 March 2019, Solar closed the process initiated in December 2018 of a management buyout of our Norwe-gian training business Scandinavian Technology Institute (STI), a part of our related business. The divestment constituted an accounting loss of DKK 17m, which was included in the financial statement for 2018.
On 31 January 2018, Solar A/S finalised the divestment of all shares of GFI GmbH and assets in Claessen ELGB N.V. to Sonepar Group with an accounting loss of DKK 47m, which was included in the financial statement for 2017.
The discontinued operation impacted the income statement as follows:
Q2 Q1-Q2 Year
DKK million 2019 2018 2019 2018 2018
Revenue - 27 12 179 197
Cost of sales - -13 -1 -130 -132
Gross profit - 14 11 49 65
Costs - -21 -13 -69 -97
Earnings before interest and tax (EBIT) - -7 -2 -20 -32
Financials - 0 0 -1 -2
Earnings before tax (EBT) - -7 -2 -21 -34
Tax on net loss for the period - -1 0 0 2
Net loss for the period - -8 -2 -21 -32
Write-down to fair value less costs to sell - 0 0 0 -17
Net loss of discontinued operations - -8 -2 -21 -49
Earnings from discontinued operations in DKK per share outstanding (EPS) - -1.10 -0.28 -2.88 -6.71
Diluted earnings from discontinued operations in DKK per share outstanding (EPS-D) - -1.09 -0.28 -2.87 -6.71
Notes
26
Notes
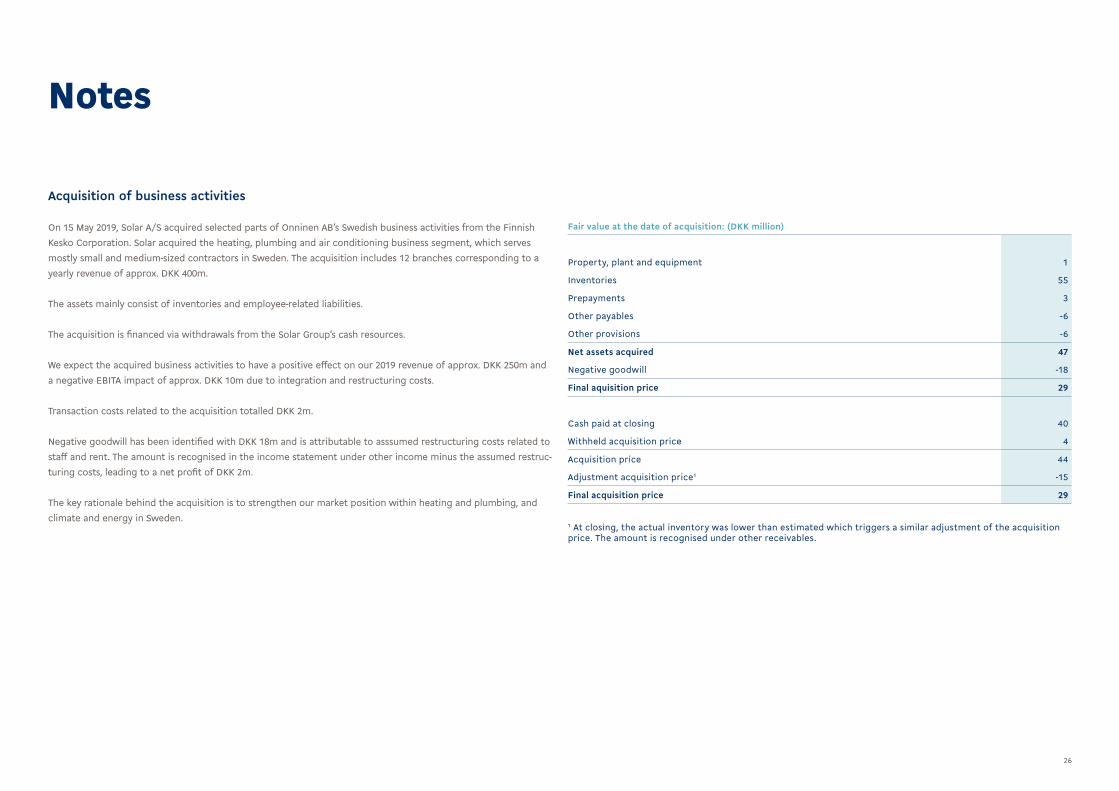
Acquisition of business activities
On 15 May 2019, Solar A/S acquired selected parts of Onninen AB’s Swedish business activities from the Finnish Kesko Corporation. Solar acquired the heating, plumbing and air conditioning business segment, which serves mostly small and medium-sized contractors in Sweden. The acquisition includes 12 branches corresponding to a yearly revenue of approx. DKK 400m.
The assets mainly consist of inventories and employee-related liabilities.
The acquisition is financed via withdrawals from the Solar Group’s cash resources.
We expect the acquired business activities to have a positive effect on our 2019 revenue of approx. DKK 250m and a negative EBITA impact of approx. DKK 10m due to integration and restructuring costs.
Transaction costs related to the acquisition totalled DKK 2m.
Negative goodwill has been identified with DKK 18m and is attributable to asssumed restructuring costs related to staff and rent. The amount is recognised in the income statement under other income minus the assumed restruc-turing costs, leading to a net profit of DKK 2m.
The key rationale behind the acquisition is to strengthen our market position within heating and plumbing, and climate and energy in Sweden.
Fair value at the date of acquisition: (DKK million)
Property, plant and equipment 1
Inventories 55
Prepayments 3
Other payables -6
Other provisions -6
Net assets acquired 47
Negative goodwill -18
Final aquisition price 29
Cash paid at closing 40
Withheld acquisition price 4
Acquisition price 44
Adjustment acquisition price1 -15
Final acquisition price 29
1 At closing, the actual inventory was lower than estimated which triggers a similar adjustment of the acquisition price. The amount is recognised under other receivables.
27
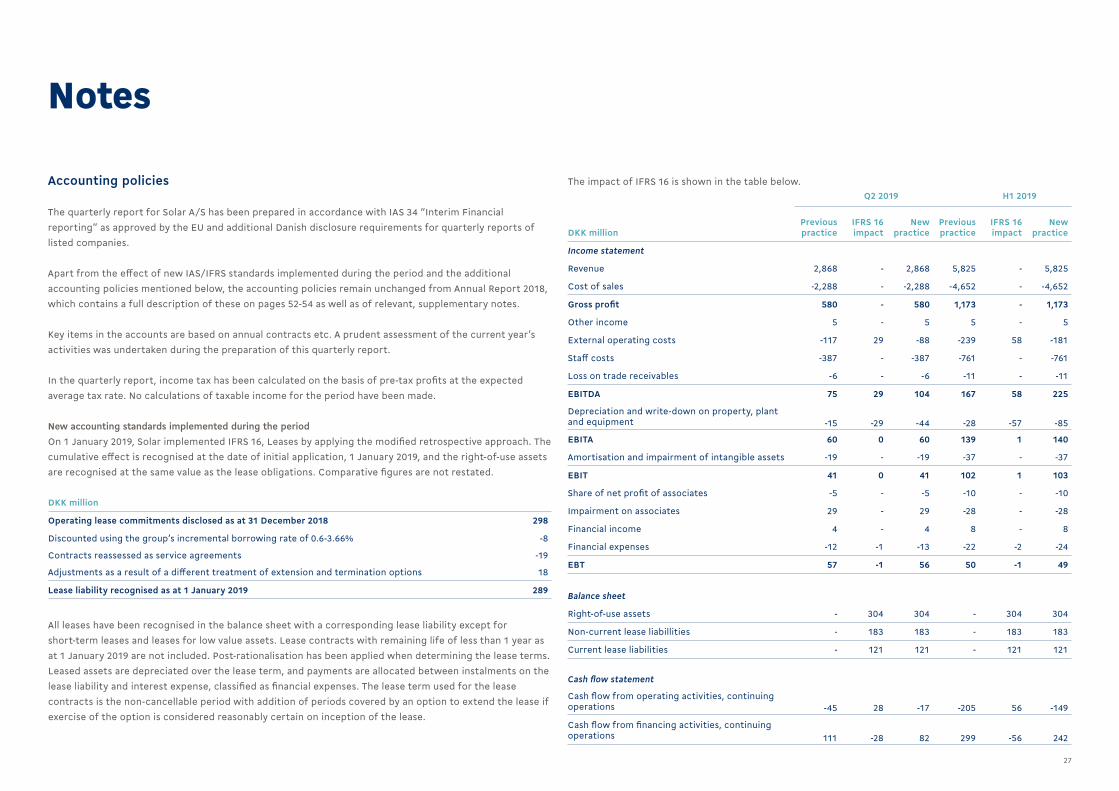
Accounting policies
The quarterly report for Solar A/S has been prepared in accordance with IAS 34 “Interim Financial reporting” as approved by the EU and additional Danish disclosure requirements for quarterly reports of listed companies.
Apart from the effect of new IAS/IFRS standards implemented during the period and the additional accounting policies mentioned below, the accounting policies remain unchanged from Annual Report 2018, which contains a full description of these on pages 52-54 as well as of relevant, supplementary notes.
Key items in the accounts are based on annual contracts etc. A prudent assessment of the current year’s activities was undertaken during the preparation of this quarterly report.
In the quarterly report, income tax has been calculated on the basis of pre-tax profits at the expected average tax rate. No calculations of taxable income for the period have been made.
New accounting standards implemented during the periodOn 1 January 2019, Solar implemented IFRS 16, Leases by applying the modified retrospective approach. The cumulative effect is recognised at the date of initial application, 1 January 2019, and the right-of-use assets are recognised at the same value as the lease obligations. Comparative figures are not restated.
Notes
DKK million
Operating lease commitments disclosed as at 31 December 2018 298
Discounted using the group’s incremental borrowing rate of 0.6-3.66% -8
Contracts reassessed as service agreements -19
Adjustments as a result of a different treatment of extension and termination options 18
Lease liability recognised as at 1 January 2019 289
All leases have been recognised in the balance sheet with a corresponding lease liability except for short-term leases and leases for low value assets. Lease contracts with remaining life of less than 1 year as at 1 January 2019 are not included. Post-rationalisation has been applied when determining the lease terms. Leased assets are depreciated over the lease term, and payments are allocated between instalments on the lease liability and interest expense, classified as financial expenses. The lease term used for the lease contracts is the non-cancellable period with addition of periods covered by an option to extend the lease if exercise of the option is considered reasonably certain on inception of the lease.
Q2 2019 H1 2019
DKK millionPrevious practice
IFRS 16 impact
New practice
Previous practice
IFRS 16 impact
New practice
Income statement
Revenue 2,868 - 2,868 5,825 - 5,825
Cost of sales -2,288 - -2,288 -4,652 - -4,652
Gross profit 580 - 580 1,173 - 1,173
Other income 5 - 5 5 - 5
External operating costs -117 29 -88 -239 58 -181
Staff costs -387 - -387 -761 - -761
Loss on trade receivables -6 - -6 -11 - -11
EBITDA 75 29 104 167 58 225
Depreciation and write-down on property, plant and equipment -15 -29 -44 -28 -57 -85
EBITA 60 0 60 139 1 140
Amortisation and impairment of intangible assets -19 - -19 -37 - -37
EBIT 41 0 41 102 1 103
Share of net profit of associates -5 - -5 -10 - -10
Impairment on associates 29 - 29 -28 - -28
Financial income 4 - 4 8 - 8
Financial expenses -12 -1 -13 -22 -2 -24
EBT 57 -1 56 50 -1 49
Balance sheet
Right-of-use assets - 304 304 - 304 304
Non-current lease liabillities - 183 183 - 183 183
Current lease liabilities - 121 121 - 121 121
Cash flow statement
Cash flow from operating activities, continuing operations -45 28 -17 -205 56 -149
Cash flow from financing activities, continuing operations 111 -28 82 299 -56 242
The impact of IFRS 16 is shown in the table below.
28
Notes
Also, we have implemented new amendments and interpretations on existing IFRS standards. These changes have no impact on Solar.
As a consequence of implementation of IFRS 16, Leases, the following accounting policies are added:
Right-of-use assetsRight-of-use assets are lease assets arising from a lease agreement. Lease assets are initially measured at cost consisting of the amount of the initial measurement of the leases liability with addition of lease payments made to the lessor at or before the commencement date less any lease incentives received.Five different types of leases have been identified:
• Rental of premises• IT equipment• Cars• Technical equipment• Other
The lease assets are depreciated on a straight-line basis over the lease term. The carrying amount of the right-of-use asset can be adjusted due to modifications to the lease agreement or in special cases reassessment of the lease term.
Payments associated with short-term leases and leases of low-value assets are recognised on a straight-line basis as an expense in the income statement. Short-term leases are leases with a term of 12 months or less. Low-value assets comprise IT-equipment and small items of office furniture with a value below DKK 37,000.
Lease liabilitiesLease liabilities arise from a lease agreement. Lease liabilities are initially measured at the present value of the lease payments during the non-cancellable lease period with addition of periods covered by an option to extend the lease if exercise of the option is considered reasonably certain on inception of the lease.
At initial recognition, each contract is assessed individually to assess the likelihood of exercising a potential extension option in the contract. The option to extend the contract period will be included in measuring the lease liability if it is reasonably certain that Solar will exercise the option.
When calculating the net present value, a discount rate corresponding to Solar’s incremental borrowing rate has been used. The weighted average lessee’s incremental borrowing rate applied to the lease liabilities on January 1, 2019 are between 0.6% and 3.66% depending among other things on the term and the currency in which the contracts are denominated.
The lease liability will be remeasured when changes occur due to modifications to the contract (extension, termination etc.), indexation or in special cases reassessment of the lease term.
New accounting standards to be implemented in coming accounting periodsFor information on new accounting standards, reference is made to note 28 on page 92 in Annual Report 2018. No new or amended standards have been issued in 2019 other than those stated in the annual report.
On auditThis quarterly report has not been audited or reviewed.
Accounting policies – continued
2929
Quarterly figuresQ1 Q2 Q3 Q4
Income statement (DKK million) 2019 2018 2019 2018 2018 2017 2018 2017
Revenue 2,957 2,817 2,868 2,733 2,539 2,596 3,009 2,967
Earnings before interest, tax, depreciation and amortisation (EBITDA) 121 82 104 70 106 110 121 103
Earnings before interest, tax and amortisation (EBITA) 80 69 60 56 93 97 109 90
Earnings before interest and tax (EBIT) 62 50 41 36 64 78 74 10
Financials, net -7 -5 -9 -7 -7 -4 -16 9
Earnings before tax (EBT) -7 103 56 10 70 73 54 -50
Net profit or loss for the quarter -20 81 48 -7 49 42 10 -134
Balance sheet (DKK million)
Non-current assets 1,739 1,580 1,792 1,561 1,572 1,675 1,516 1,522
Current assets 3,425 3,254 3,451 3,027 3,121 3,339 3,117 3,195
Balance sheet total 5,164 4,834 5,243 4,588 4,693 5,014 4,633 4,717
Equity 1,515 1,594 1,552 1,584 1,645 1,745 1,638 1,591
Non-current liabilities 713 546 713 540 536 362 543 557
Current liabilities 2,936 2,694 2,978 2,464 2,512 2,907 2,452 2,569
Interest-bearing liabilities, net 1,032 632 1,182 662 712 728 461 489
Invested capital 2,302 1,895 2,461 1,972 2,055 2,190 1,797 1,790
Net working capital, end of period 1,331 1,145 1,466 1,196 1,312 1,398 1,090 1,081
Net working capital, average 1,230 1,168 1,299 1,173 1,184 1,209 1,182 1,133
Cash flows (DKK million)
Cash flow from operating activities -132 -39 -17 -41 -23 -2 327 279
Cash flow from investing activities -28 -40 -78 26 -30 -25 -68 -39
Cash flow from financing activities 160 21 82 35 35 14 -199 -175
Net investments in intangible assets -10 -24 -8 -27 -20 -27 -17 -26
Net investments in property, plant and equipment -21 -16 -25 -7 -10 7 -26 -5
Acquisition and disposal of subsidiaries and activities, net 5 0 -40 60 0 0 -10 -6
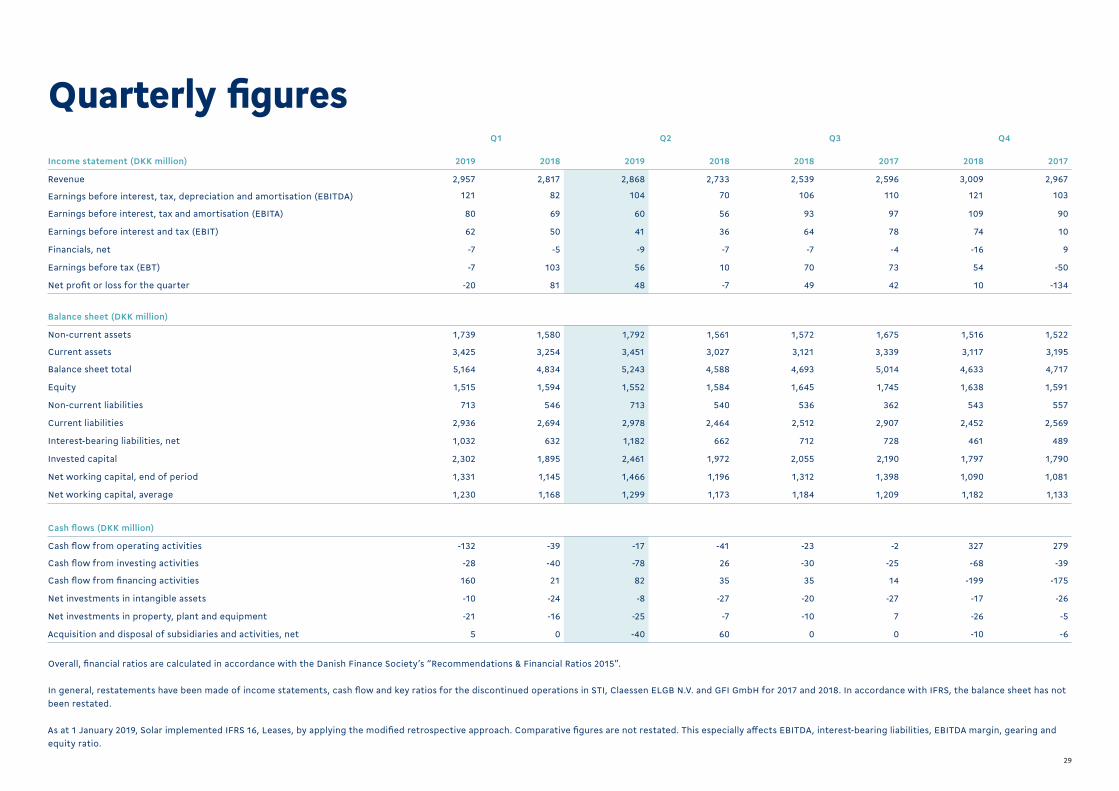
Overall, financial ratios are calculated in accordance with the Danish Finance Society’s “Recommendations & Financial Ratios 2015”.
In general, restatements have been made of income statements, cash flow and key ratios for the discontinued operations in STI, Claessen ELGB N.V. and GFI GmbH for 2017 and 2018. In accordance with IFRS, the balance sheet has not been restated.
As at 1 January 2019, Solar implemented IFRS 16, Leases, by applying the modified retrospective approach. Comparative figures are not restated. This especially affects EBITDA, interest-bearing liabilities, EBITDA margin, gearing and equity ratio.
3030
Quarterly figures– continued
Q1 Q2 Q3 Q4Financial ratios (% unless otherwise stated) 2019 2018 2019 2018 2018 2017 2018 2017
Revenue growth 5.0 -0.3 4.9 2.2 -2.2 7.3 1.4 4.6
Organic growth 6.0 1.4 4.2 3.6 -0.3 7.3 2.3 5.4
Organic growth adjusted for number of working days 5.8 4.5 5.6 1.6 -0.3 9.0 2.5 7.1
Gross profit margin 20.1 20.4 20.2 20.4 20.2 20.7 20.0 20.3
EBITDA margin 4.1 2.9 3.6 2.6 4.2 4.2 4.0 3.5
EBITA margin 2.7 2.4 2.1 2.0 3.7 3.7 3.6 3.0
EBIT margin 2.1 1.8 1.4 1.3 2.5 3.0 2.5 0.3
Net working capital (NWC end of period)/revenue (LTM) 11.8 10.3 12.9 10.7 11.8 11.5 9.8 9.7
Net working capital (NWC average)/revenue (LTM) 10.9 10.5 11.4 10.5 10.7 9.8 10.6 10.2
Gearing (interest-bearing liabilities,net/EBITDA), no. of times 2.5 1.7 2.6 1.8 2.0 1.8 1.2 1.3
Return on equity (ROE) 2.0 -1.4 5.7 -1.1 -0.7 11.7 8.1 1.1
Return on invested capital (ROIC) 8.1 6.4 7.9 6.2 5.6 10.6 8.1 6.3
Adjusted enterprise value/earnings before interest, tax and amortisation (EV/EBITA) 8.5 10.3 8.9 10.4 10.7 9.3 6.8 10.4
Equity ratio 29.3 33.0 29.6 34.5 35.1 34.8 35.4 33.7
Share ratios (DKK)
Earnings in DKK per share outstanding (EPS) -2.74 11.10 6.82 -0.96 6.71 5.75 1.37 -18.36
Intrinsic value in DKK per share outstanding 207.58 218.41 224.52 217.04 225.40 239.10 224.44 218.00
Share price in DKK 286.68 398.53 312.60 398.72 401.55 381.25 284.12 414.52
Share price/intrinsic value 1.38 1.82 1.39 1.84 1.78 1.59 1.27 1.90
Employees
Number of employees (FTE), end of period 2,982 2,944 3,079 2,948 2,918 2,865 2,955 2,905
Average number of employees (FTE), LTM 2,951 2,894 2,984 2,915 2,929 2,841 2,941 2,870
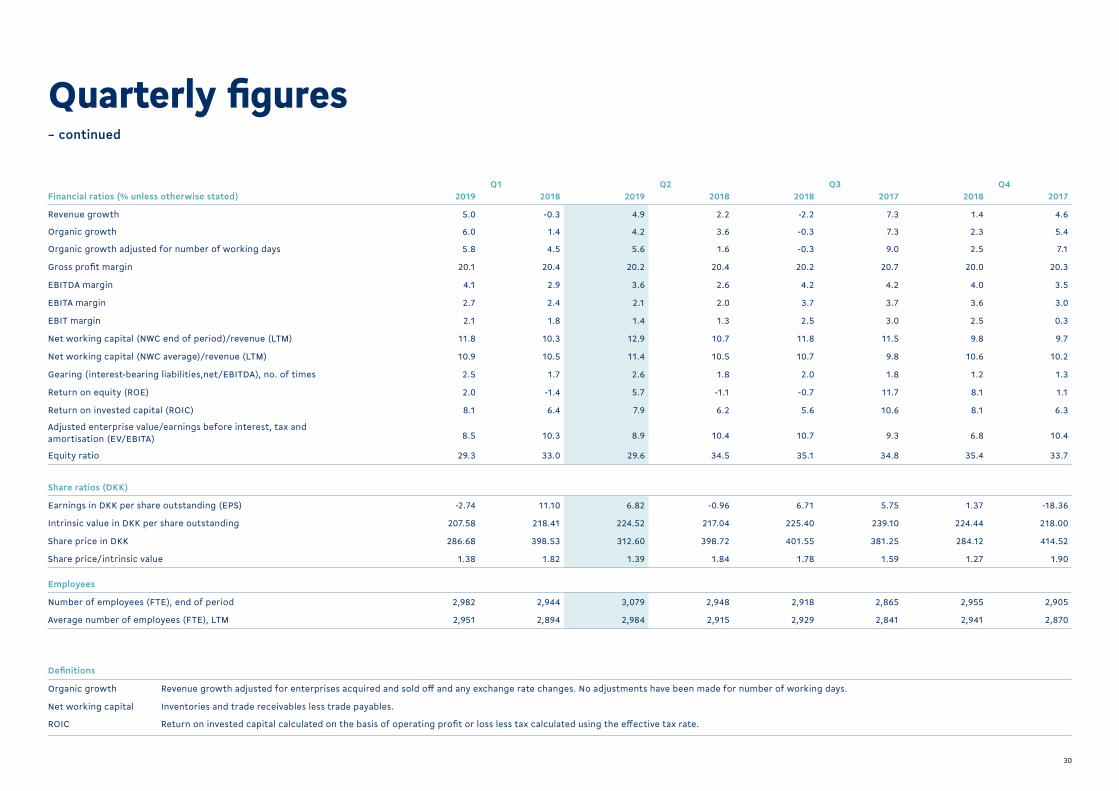
Definitions
Organic growth Revenue growth adjusted for enterprises acquired and sold off and any exchange rate changes. No adjustments have been made for number of working days.
Net working capital Inventories and trade receivables less trade payables.
ROIC Return on invested capital calculated on the basis of operating profit or loss less tax calculated using the effective tax rate.
31
Statement bythe Executive Board andthe Board of Directors
Today, the group’s Board of Directors and Executive Board discussed and approved the Q2 2019 quarterly report of Solar A/S.
The quarterly report, which has not been audited or reviewed by the company’s auditor, is presented in accordance with IAS 34 “Interim Financial Reporting” as approved by the EU and additional Dan-ish disclosure requirements for quarterly reports of listed companies.
In our opinion, the quarterly report gives a fair presentation of the group’s assets, equity and liabil-ities and financial position as at 30 June 2019 as well as of the results of the group’s activities and cash flow for Q2 2019.
Further, in our opinion, the management’s review gives a true and fair statement of the develop-ment of the group’s activities and financial situation, net profit or loss for the period and of the group’s overall financial position and describes the most significant risks and uncertainties that the group faces.
Vejen, 8 August 2019
EXECUTIVE BOARD
Jens E. Andersen Hugo Dorph Michael H. JeppesenCEO CCO CFO
BOARD OF DIRECTORS
Jens Borum Jesper Dalsgaard Lars Lange AndersenChairman Vice chairman
Peter Bang Morten Chrone Ulrik Damgaard
Bent H. Frisk Louise Knauer Jens Peter Toft
32
Q4 2018
Solar A/SIndustrivej Vest 43DK-6600 VejenTel. +45 79 30 00 00CVR no. 15908416
www.solar.euhttp://www.linkedin.com/company/solar-as