Embed Size (px)
Citation preview
Quarterly Report
Energy
on European Gas MarketsMarket Observatory for EnergyDG EnergyVolume 9 (issue 1; fourth quarter of 2015 and first quarter of 2016)

DISCLAIMER: This report prepared by the Market Observatory for Energy of the European Commission aims at enhancing public access to information about prices of natural gas in the Members States of the European Union. Our goal is to keep this information timely and accurate. If errors are brought to our attention, we will try to correct them. However the Commission accepts no responsibility or liability whatsoever with regard to the information contained in this publication.
Copyright notice: Reproduction is authorised provided the source is acknowledged. © European Commission, Directorate-General for Energy, Market Observatory for Energy, 2016
Commission européenne, B-1049 Bruxelles / Europese Commissie, B-1049 Brussel – Belgium
E-mail: [email protected]
ContentHighlights of the report 2
Executive summary 3
1. Gas Consumption – Production – Imports 4
1.1. Consumption 4
1.2. Production 8
1.3. Imports 9
1.4. Ukraine 13
2. Gas storage 16
3. Wholesale gas markets 20
3.1. The broader energy commodity picture: comparisons between oil, gas and coal prices in the EU 20
3.2. International gas markets 21
3.3. European gas markets 24
4. Retail gas prices in the EU 32
5. Glossary 38
2
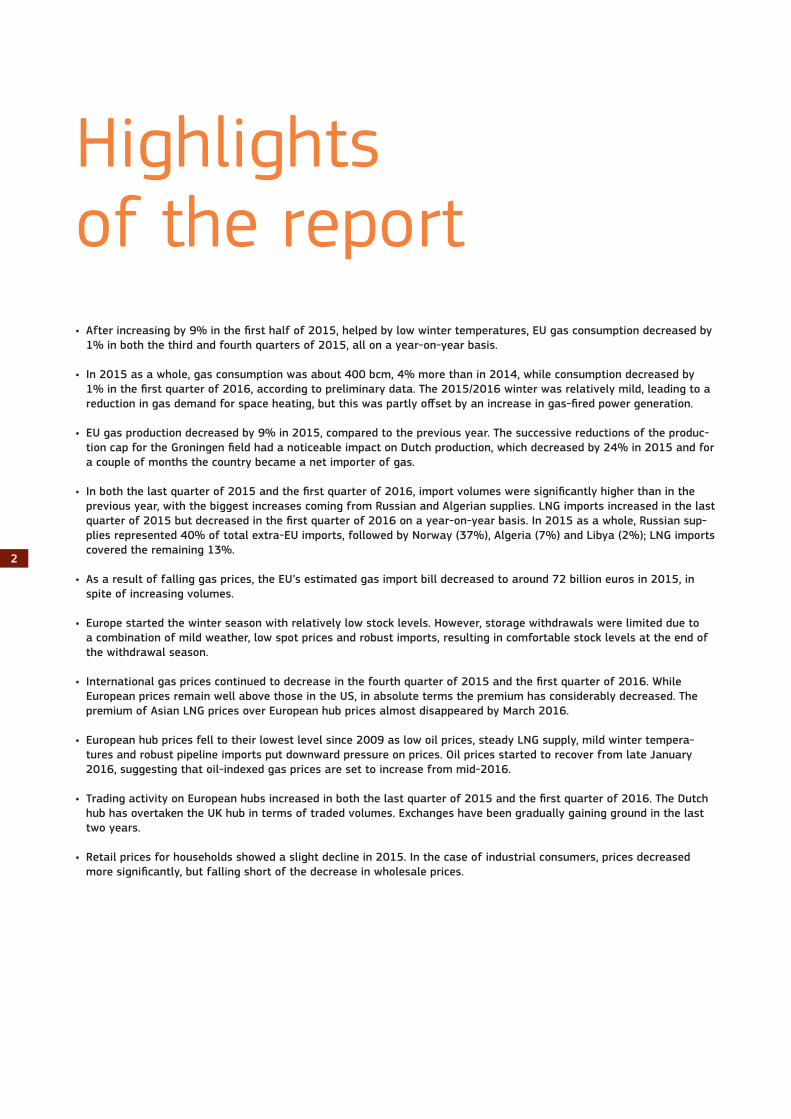
Highlights of the report• Afterincreasingby9%inthefirsthalfof2015,helpedbylowwintertemperatures,EUgasconsumptiondecreasedby
1% in both the third and fourth quarters of 2015, all on a year-on-year basis.
• In 2015 as a whole, gas consumption was about 400 bcm, 4% more than in 2014, while consumption decreased by 1%inthefirstquarterof2016,accordingtopreliminarydata.The2015/2016winterwasrelativelymild,leadingtoareductioningasdemandforspaceheating,butthiswaspartlyoffsetbyanincreaseingas-firedpowergeneration.
• EU gas production decreased by 9% in 2015, compared to the previous year. The successive reductions of the produc-tioncapfortheGroningenfieldhadanoticeableimpactonDutchproduction,whichdecreasedby24%in2015andfora couple of months the country became a net importer of gas.
• Inboththelastquarterof2015andthefirstquarterof2016,importvolumesweresignificantlyhigherthanintheprevious year, with the biggest increases coming from Russian and Algerian supplies. LNG imports increased in the last quarterof2015butdecreasedinthefirstquarterof2016onayear-on-yearbasis.In2015asawhole,Russiansup-plies represented 40% of total extra-EU imports, followed by Norway (37%), Algeria (7%) and Libya (2%); LNG imports covered the remaining 13%.
• As a result of falling gas prices, the EU’s estimated gas import bill decreased to around 72 billion euros in 2015, in spite of increasing volumes.
• Europe started the winter season with relatively low stock levels. However, storage withdrawals were limited due to a combination of mild weather, low spot prices and robust imports, resulting in comfortable stock levels at the end of the withdrawal season.
• Internationalgaspricescontinuedtodecreaseinthefourthquarterof2015andthefirstquarterof2016.WhileEuropean prices remain well above those in the US, in absolute terms the premium has considerably decreased. The premium of Asian LNG prices over European hub prices almost disappeared by March 2016.
• European hub prices fell to their lowest level since 2009 as low oil prices, steady LNG supply, mild winter tempera-tures and robust pipeline imports put downward pressure on prices. Oil prices started to recover from late January 2016, suggesting that oil-indexed gas prices are set to increase from mid-2016.
• TradingactivityonEuropeanhubsincreasedinboththelastquarterof2015andthefirstquarterof2016.TheDutchhub has overtaken the UK hub in terms of traded volumes. Exchanges have been gradually gaining ground in the last two years.
• Retail prices for households showed a slight decline in 2015. In the case of industrial consumers, prices decreased moresignificantly,butfallingshortofthedecreaseinwholesaleprices.
3
Executive summary• EU gas consumption decreased by 1% in both the third and fourth quarters of 2015 compared to the same period in
2014. In 2015 as a whole, consumption increased by 4% year-on-year, mainly driven by colder weather at the beginning of the year.
• Preliminary Eurostat data shows that consumption in the in the first quarter of 2016 decreased by 1% compared to the same period of 2015. The relatively mild temperatures reduced gas demand for space heating, but at the same time falling gas prices improved the profitability of gas-fired power generation, thereby increasing the gas intake in the sector.
• Production in the third and fourth quarters was down by 14% and 15%, respectively on a year-on-year basis. In 2015 as a whole, EU gas output decreased by 9%. Although UK production grew by 8%, this was more than offset by the 24% reduc-tion of Dutch output. Gas output in the Netherlands is on the decline because of the successive cuts of the production cap for the Groningen field, which resulted in the country becoming a net importer of gas for a couple of months in mid-2015.
• EU gas imports were significantly higher than a year earlier: in the last quarter of 2015, imports were 15% higher than in the same period of 2014; in the first quarter of 2016, the year-on-year increase was 21%. Russian and Algerian supplies showed the biggest increases but Norwegian imports were also robust. LNG imports increased in the last quarter of 2015 but decreased in the first three months of 2016.
• In 2015 as a whole, imports were 11% higher than in 2014. In absolute volumes, deliveries from all five import sources in-creased compared to 2014. Russian supplies represented 40% of total extra-EU imports, followed by Norway (37%), Algeria (7%) and Libya (2%); LNG imports covered the remaining 13%. LNG imports increased by 5% in 2015, with most of the incremental volumes arriving to Northwest Europe. Qatar remained the top LNG supplier to the EU, covering 56% of total LNG imports in 2015.
• Poland’s Świnoujście terminal received its first cargo in December 2015; commercial operation is planned to start in the second quarter of 2016. The US commenced LNG exports in February 2016; the first delivery to Europe is expected in the second quarter of the year.
• In spite of increasing import volumes, falling prices reduced the EU’s gas import bill to around 72 billion euros in 2015 from around 73 billion euros in 2014. The estimated import bill amounted to 14 billion euros in the first quarter of 2016.
• In the fourth quarter of 2015, after an EU-brokered deal for the period from 1 October 2015 until 31 March 2016, Ukraine resumed imports from Russia in October 2015 but supplies were suspended again in late November. The country went through the whole winter without Russian supplies, relying instead on domestic production and imports from the EU.
• Europe started the 2015/2016 winter with relatively low stock levels but storage withdrawals were moderate as mild weather, low spot prices and robust pipeline and LNG imports reduced the demand for gas from storage. As a result, stock levels were relatively high at the end of the withdrawal season: on 31 March 2016, the average utilisation of storage capacities was 8 percentage points higher than a year earlier.
• International gas prices continued to fall in late 2015 and early 2016. While European prices were still 2.2 times higher than those in the US in the first quarter of 2016, in absolute terms the difference has considerably decreased. The premium of Asian LNG prices over European hub prices almost disappeared by March 2016.
• Spot prices at European gas hubs declined to 12-15 Euro/MWh in the first quarter of 2016, reaching the lowest levels since 2009. Low oil prices, above-average winter temperatures, steady LNG supply and increasing pipeline imports put downward pressure on European hub prices. Since January 2016, oil prices started to recover which means that oil-indexed prices are set to start increasing from about mid-2016.
• Trading activity on European gas hubs increased: traded volumes reached 10,250 TWh in the fourth quarter of 2015, 13% more than in the same period of 2014; in the first quarter of 2016 traded volumes totalled nearly 13,500 TWh, 4% more than in the same period of 2015. The UK and Dutch hubs continued to dominate gas trade in Europe, with the Dutch hub gradually overtaking the UK hub. The share of exchange-traded volumes increased from 23% to 33% in the last two years.
• Retail prices for both households and industry decreased since 2014. The decrease was minimal for households but more substantial for industrial customers, although falling short of the decrease in wholesale prices. No real price convergence could be observed in the last year, either for households or for industrial customers.
4
1. Gas Consumption – Production – Imports
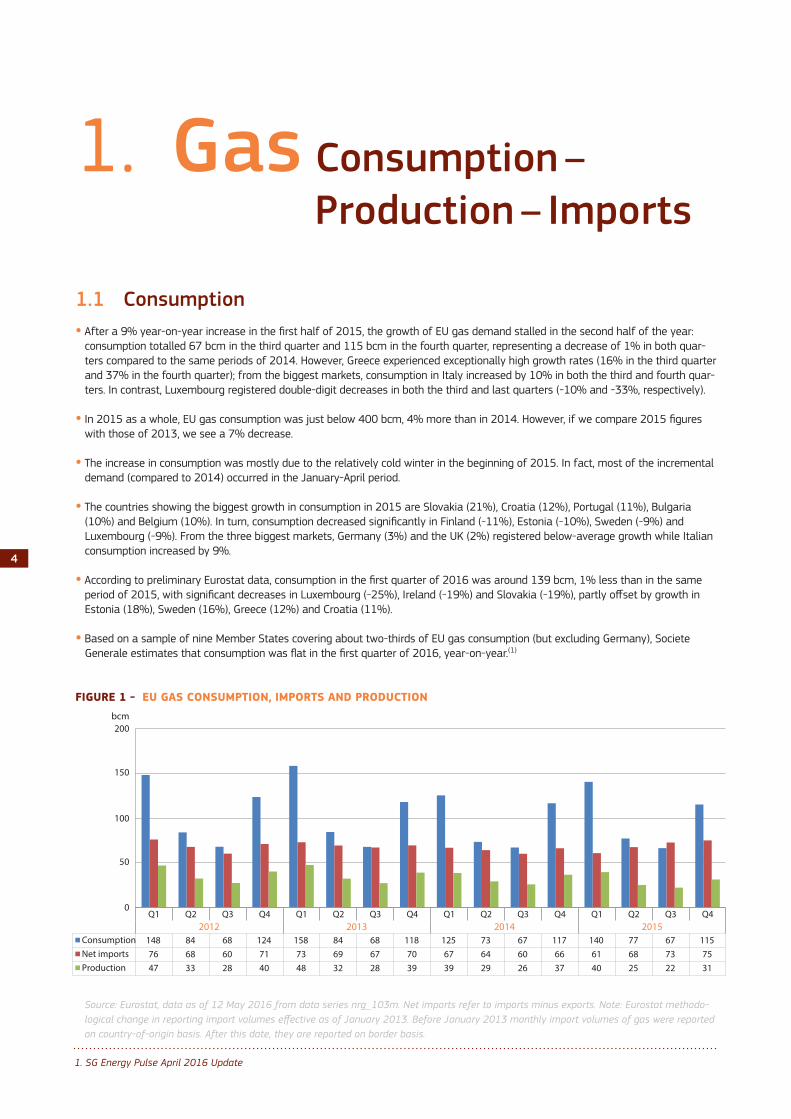
1.1 Consumption • After a 9% year-on-year increase in the first half of 2015, the growth of EU gas demand stalled in the second half of the year:
consumption totalled 67 bcm in the third quarter and 115 bcm in the fourth quarter, representing a decrease of 1% in both quar-ters compared to the same periods of 2014. However, Greece experienced exceptionally high growth rates (16% in the third quarter and 37% in the fourth quarter); from the biggest markets, consumption in Italy increased by 10% in both the third and fourth quar-ters. In contrast, Luxembourg registered double-digit decreases in both the third and last quarters (-10% and -33%, respectively).
• In 2015 as a whole, EU gas consumption was just below 400 bcm, 4% more than in 2014. However, if we compare 2015 figures with those of 2013, we see a 7% decrease.
• The increase in consumption was mostly due to the relatively cold winter in the beginning of 2015. In fact, most of the incremental demand (compared to 2014) occurred in the January-April period.
• The countries showing the biggest growth in consumption in 2015 are Slovakia (21%), Croatia (12%), Portugal (11%), Bulgaria (10%) and Belgium (10%). In turn, consumption decreased significantly in Finland (-11%), Estonia (-10%), Sweden (-9%) and Luxembourg (-9%). From the three biggest markets, Germany (3%) and the UK (2%) registered below-average growth while Italian consumption increased by 9%.
• According to preliminary Eurostat data, consumption in the first quarter of 2016 was around 139 bcm, 1% less than in the same period of 2015, with significant decreases in Luxembourg (-25%), Ireland (-19%) and Slovakia (-19%), partly offset by growth in Estonia (18%), Sweden (16%), Greece (12%) and Croatia (11%).
• Based on a sample of nine Member States covering about two-thirds of EU gas consumption (but excluding Germany), Societe Generale estimates that consumption was flat in the first quarter of 2016, year-on-year.(1)
FIGURE 1 - EU GAS CONSUMPTION, IMPORTS AND PRODUCTION
Source: Eurostat, data as of 12 May 2016 from data series nrg_103m. Net imports refer to imports minus exports. Note: Eurostat methodo-logical change in reporting import volumes effective as of January 2013. Before January 2013 monthly import volumes of gas were reported on country-of-origin basis. After this date, they are reported on border basis.
1. SG Energy Pulse April 2016 Update
Q1 Q2 Q3 Q4 Q1 Q2 Q3 Q4 Q1 Q2 Q3 Q4 Q1 Q2 Q3 Q42012 2013 2014 2015
Consumption 148 84 68 124 158 84 68 118 125 73 67 117 140 77 67 115Net imports 76 68 60 71 73 69 67 70 67 64 60 66 61 68 73 75Production 47 33 28 40 48 32 28 39 39 29 26 37 40 25 22 31
0
50
100
150
200bcm
5
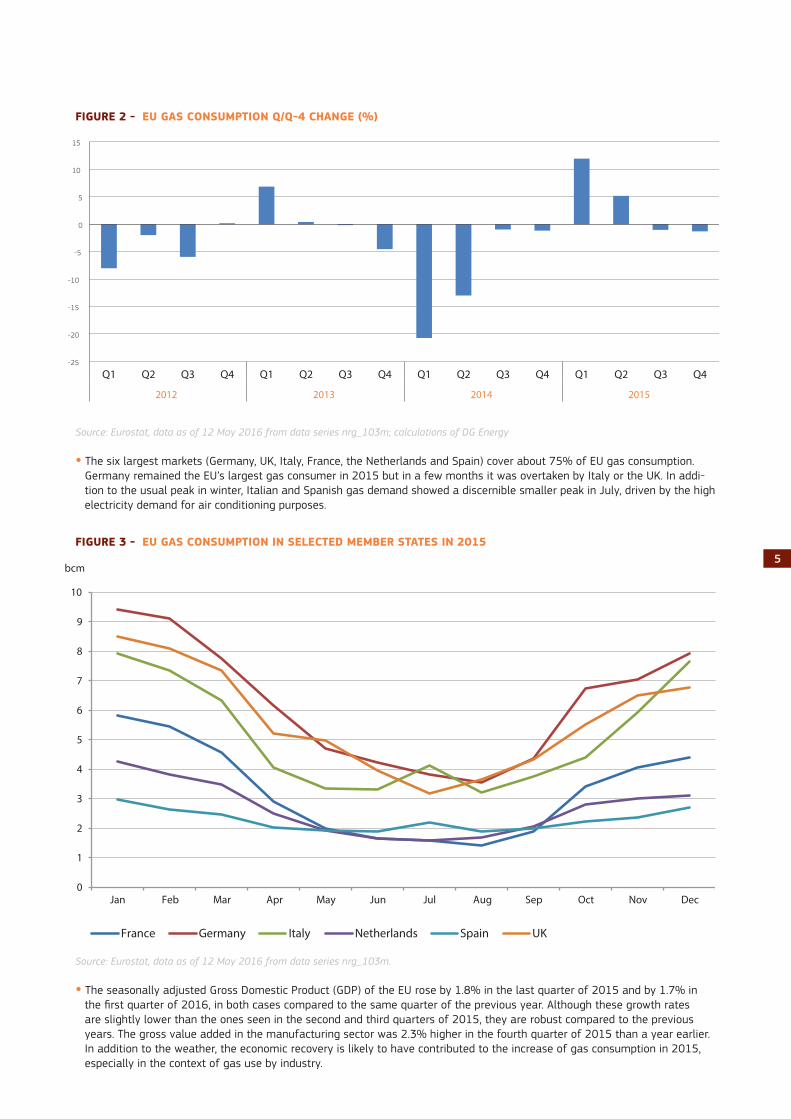
FIGURE 2 - EU GAS CONSUMPTION Q/Q-4 CHANGE (%)
Source: Eurostat, data as of 12 May 2016 from data series nrg_103m; calculations of DG Energy
• The six largest markets (Germany, UK, Italy, France, the Netherlands and Spain) cover about 75% of EU gas consumption. Germany remained the EU’s largest gas consumer in 2015 but in a few months it was overtaken by Italy or the UK. In addi-tion to the usual peak in winter, Italian and Spanish gas demand showed a discernible smaller peak in July, driven by the high electricity demand for air conditioning purposes.
FIGURE 3 - EU GAS CONSUMPTION IN SELECTED MEMBER STATES IN 2015
Source: Eurostat, data as of 12 May 2016 from data series nrg_103m.
• The seasonally adjusted Gross Domestic Product (GDP) of the EU rose by 1.8% in the last quarter of 2015 and by 1.7% in the first quarter of 2016, in both cases compared to the same quarter of the previous year. Although these growth rates are slightly lower than the ones seen in the second and third quarters of 2015, they are robust compared to the previous years. The gross value added in the manufacturing sector was 2.3% higher in the fourth quarter of 2015 than a year earlier. In addition to the weather, the economic recovery is likely to have contributed to the increase of gas consumption in 2015, especially in the context of gas use by industry.
-25
-20
-15
-10
-5
0
5
10
15
Q1 Q2 Q3 Q4 Q1 Q2 Q3 Q4 Q1 Q2 Q3 Q4 Q1 Q2 Q3 Q4
2012 2013 2014 2015
0
1
2
3
4
5
6
7
8
9
10
Jan Feb Mar Apr May Jun Jul Aug Sep Oct Nov Dec
bcm
France Germany Italy Netherlands Spain UK
6
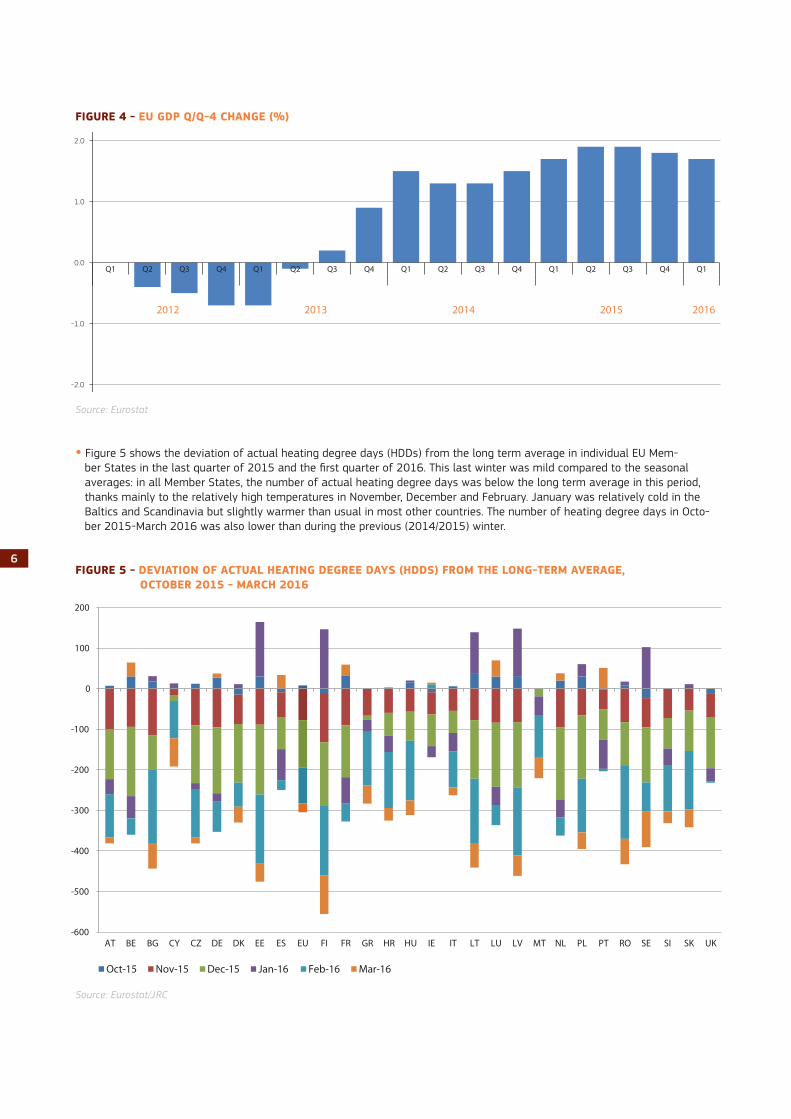
FIGURE 4 - EU GDP Q/Q-4 CHANGE (%)
Source: Eurostat
• Figure 5 shows the deviation of actual heating degree days (HDDs) from the long term average in individual EU Mem-ber States in the last quarter of 2015 and the first quarter of 2016. This last winter was mild compared to the seasonal averages: in all Member States, the number of actual heating degree days was below the long term average in this period, thanks mainly to the relatively high temperatures in November, December and February. January was relatively cold in the Baltics and Scandinavia but slightly warmer than usual in most other countries. The number of heating degree days in Octo-ber 2015-March 2016 was also lower than during the previous (2014/2015) winter.
FIGURE 5 - DEVIATION OF ACTUAL HEATING DEGREE DAYS (HDDS) FROM THE LONG-TERM AVERAGE, OCTOBER 2015 - MARCH 2016
Source: Eurostat/JRC
-3.0
-2.0
-1.0
0.0
1.0
2.0
3.0
Q1 Q2 Q3 Q4 Q1 Q2 Q3 Q4 Q1 Q2 Q3 Q4 Q1 Q2 Q3 Q4 Q1
2012 2013 2014 2015 2016
-600
-500
-400
-300
-200
-100
0
100
200
AT BE BG CY CZ DE DK EE ES EU FI FR GR HR HU IE IT LT LU LV MT NL PL PT RO SE SI SK UK
Oct-15 Nov-15 Dec-15 Jan-16 Feb-16 Mar-16
7
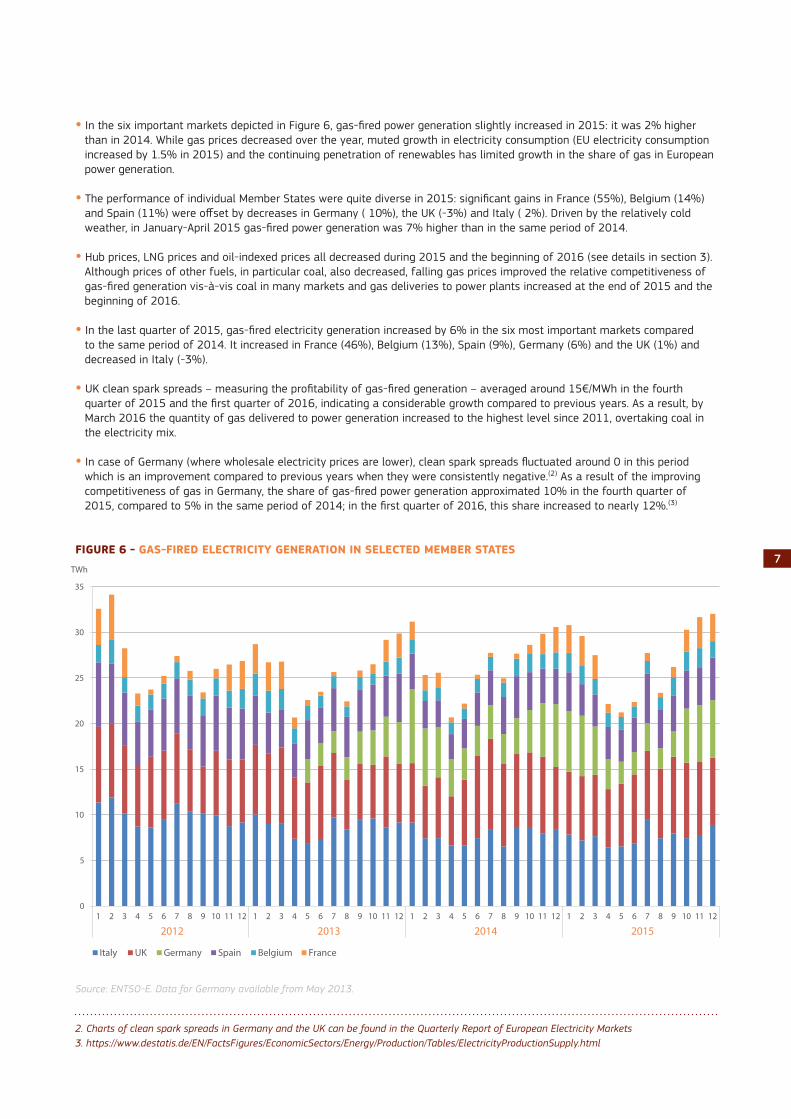
• In the six important markets depicted in Figure 6, gas-fired power generation slightly increased in 2015: it was 2% higher than in 2014. While gas prices decreased over the year, muted growth in electricity consumption (EU electricity consumption increased by 1.5% in 2015) and the continuing penetration of renewables has limited growth in the share of gas in European power generation.
• The performance of individual Member States were quite diverse in 2015: significant gains in France (55%), Belgium (14%) and Spain (11%) were offset by decreases in Germany ( 10%), the UK (-3%) and Italy ( 2%). Driven by the relatively cold weather, in January-April 2015 gas-fired power generation was 7% higher than in the same period of 2014.
• Hub prices, LNG prices and oil-indexed prices all decreased during 2015 and the beginning of 2016 (see details in section 3). Although prices of other fuels, in particular coal, also decreased, falling gas prices improved the relative competitiveness of gas-fired generation vis-à-vis coal in many markets and gas deliveries to power plants increased at the end of 2015 and the beginning of 2016.
• In the last quarter of 2015, gas-fired electricity generation increased by 6% in the six most important markets compared to the same period of 2014. It increased in France (46%), Belgium (13%), Spain (9%), Germany (6%) and the UK (1%) and decreased in Italy (-3%).
• UK clean spark spreads – measuring the profitability of gas-fired generation – averaged around 15€/MWh in the fourth quarter of 2015 and the first quarter of 2016, indicating a considerable growth compared to previous years. As a result, by March 2016 the quantity of gas delivered to power generation increased to the highest level since 2011, overtaking coal in the electricity mix.
• In case of Germany (where wholesale electricity prices are lower), clean spark spreads fluctuated around 0 in this period which is an improvement compared to previous years when they were consistently negative.(2) As a result of the improving competitiveness of gas in Germany, the share of gas-fired power generation approximated 10% in the fourth quarter of 2015, compared to 5% in the same period of 2014; in the first quarter of 2016, this share increased to nearly 12%.(3)
FIGURE 6 - GAS-FIRED ELECTRICITY GENERATION IN SELECTED MEMBER STATES
Source: ENTSO-E. Data for Germany available from May 2013.
0
5
10
15
20
25
30
35
1 2 3 4 5 6 7 8 9 10 11 12 1 2 3 4 5 6 7 8 9 10 11 12 1 2 3 4 5 6 7 8 9 10 11 12 1 2 3 4 5 6 7 8 9 10 11 12
2012 2013 2014 2015
TWh
Italy UK Germany Spain Belgium France
2. Charts of clean spark spreads in Germany and the UK can be found in the Quarterly Report of European Electricity Markets3. https://www.destatis.de/EN/FactsFigures/EconomicSectors/Energy/Production/Tables/ElectricityProductionSupply.html
8
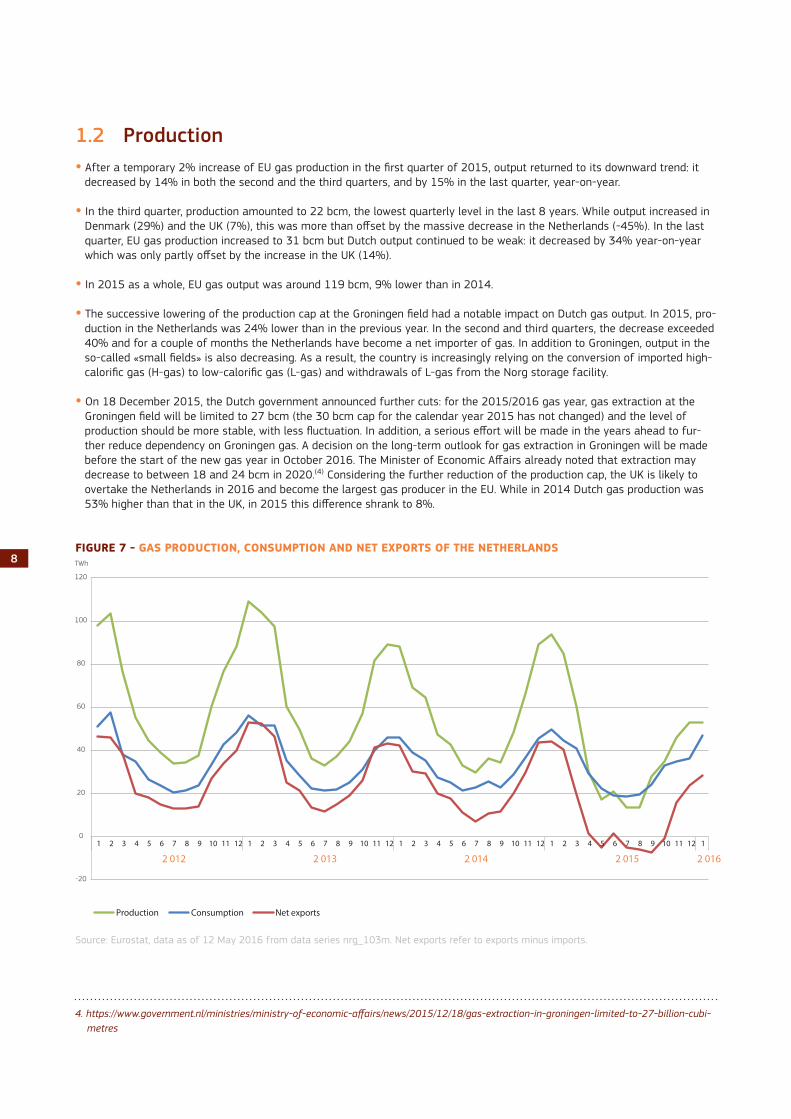
1.2 Production• After a temporary 2% increase of EU gas production in the first quarter of 2015, output returned to its downward trend: it
decreased by 14% in both the second and the third quarters, and by 15% in the last quarter, year-on-year.
• In the third quarter, production amounted to 22 bcm, the lowest quarterly level in the last 8 years. While output increased in Denmark (29%) and the UK (7%), this was more than offset by the massive decrease in the Netherlands (-45%). In the last quarter, EU gas production increased to 31 bcm but Dutch output continued to be weak: it decreased by 34% year-on-year which was only partly offset by the increase in the UK (14%).
• In 2015 as a whole, EU gas output was around 119 bcm, 9% lower than in 2014.
• The successive lowering of the production cap at the Groningen field had a notable impact on Dutch gas output. In 2015, pro-duction in the Netherlands was 24% lower than in the previous year. In the second and third quarters, the decrease exceeded 40% and for a couple of months the Netherlands have become a net importer of gas. In addition to Groningen, output in the so-called «small fields» is also decreasing. As a result, the country is increasingly relying on the conversion of imported high-calorific gas (H-gas) to low-calorific gas (L-gas) and withdrawals of L-gas from the Norg storage facility.
• On 18 December 2015, the Dutch government announced further cuts: for the 2015/2016 gas year, gas extraction at the Groningen field will be limited to 27 bcm (the 30 bcm cap for the calendar year 2015 has not changed) and the level of production should be more stable, with less fluctuation. In addition, a serious effort will be made in the years ahead to fur-ther reduce dependency on Groningen gas. A decision on the long-term outlook for gas extraction in Groningen will be made before the start of the new gas year in October 2016. The Minister of Economic Affairs already noted that extraction may decrease to between 18 and 24 bcm in 2020.(4) Considering the further reduction of the production cap, the UK is likely to overtake the Netherlands in 2016 and become the largest gas producer in the EU. While in 2014 Dutch gas production was 53% higher than that in the UK, in 2015 this difference shrank to 8%.
FIGURE 7 - GAS PRODUCTION, CONSUMPTION AND NET EXPORTS OF THE NETHERLANDS
Source: Eurostat, data as of 12 May 2016 from data series nrg_103m. Net exports refer to exports minus imports.
-20
0
20
40
60
80
100
120
1 2 3 4 5 6 7 8 9 10 11 12 1 2 3 4 5 6 7 8 9 10 11 12 1 2 3 4 5 6 7 8 9 10 11 12 1 2 3 4 5 6 7 8 9 10 11 12 1
2 012 2 013 2 014 2 015 2 016
TWh
Production Consumption Net exports
4. https://www.government.nl/ministries/ministry-of-economic-affairs/news/2015/12/18/gas-extraction-in-groningen-limited-to-27-billion-cubi-metres
9
• In contrast, UK gas output increased by a healthy 8% in 2015, as new project starts offset decreasing output from mature fields. However, sustained low oil and gas prices put pressure on producers to cut costs which leads to cancellations and delays of new projects, thereby making the longer-term supply outlook less promising.
• The Shell-operated Corrib gas field in Ireland started production on 30 December 2015. This will entail a significant impro-vement to the country’s security of gas supply: at peak production, the offshore field has the potential to meet up to 60% of Ireland’s gas needs, reducing the dependency on supplies coming from the UK.(5)
1.3 Imports• According to Eurostat data, net imports increased by 21% year-on-year in the third quarter of 2015, reaching around 73
bcm. This represents the highest Q3 net imports since 2009. In the last quarter, net imports amounted to 75 bcm, 13% more than in the same period of 2014. In addition to the decline of indigenous production (particularly from the Groningen field in the Netherlands), falling prices and high demand for storage injection contributed to the rise of imports in the second half of 2015.
• In 2015 as a whole, net imports increased by 7% compared to 2014. In the first quarter, when high storage withdrawals offset unusually low Russian imports, net imports decreased by 9% year-on-year but this was offset by increases during the rest of the year.
• Gas imports typically show a seasonal drop in the second and third quarters of the year but this was not the case in 2015: according to ENTSO-G data, quarterly imports gradually increased throughout the year. In the last quarter, imports were 15% higher than in the same period of 2014. For 2015 as a whole, imports were 11% higher than in 2014.
• In 2015, imports from Russia were 7% higher than in 2014. Russian imports gradually gained momentum: year-on-year, imports decreased by 22% in the first quarter, followed by a growth of 4% in the second quarter, 26% in the third quarter and 28% in the fourth quarter. Russia had a 41% share from total extra-EU imports in the last quarter.
• Long-term contracts typically allow buyers to vary monthly/quarterly purchases within some flexibility. Taking advantage of this flexibility, buyers of Russian gas gradually increased nominations as oil-indexed contracts became cheaper. As oil-in-dexed prices are set to increase from mid-2016, imports from Russia are expected to decrease from recent highs.
• Following the first Gazprom auction taking place in September 2015, the company conducted another one in March 2016, this time for the three Baltic States. About 0.56 bcm of gas was offered, to be delivered in the second, third and fourth quar-ters of 2016 to Kotlovka on the Belorussian-Lithuanian border. Gas volumes in the Inčukalns storage facility (Latvia) were also offered. As a result of the auction, over 0.42 bcm was sold to six clients.(6)
• Imports from Norway remained high in the fourth quarter of 2015 although fell short of the record level seen in the same period of 2014 (-1%). The share of the country from total extra-EU imports was 37% in the fourth quarter. In 2015 as a whole, imports from Norway increased by 6%. This was facilitated by the ramp up of production at the Troll field; as a result, Norway exported more gas in 2015 (114 bcm) than ever before.(7)
• While Russian flows have been heavily influenced by price developments in 2014-2015, Norwegian imports largely followed a seasonal pattern, with deliveries peaking in winter and dropping in summer. This reflects the declining role of oil-indexation for Norwegian gas. Therefore, buyers have less opportunity to optimize gas purchases across the year based on oil price developments.
• Pipeline imports from North Africa increased by 15% in the fourth quarter of 2015, year-on-year. Imports increased from Algeria (28%) but decreased from Libya (-19%). In 2015 as a whole, imports from both Algeria and Libya increased by 9% while their share from total extra-EU imports was 7% and 2%, respectively.
• Imports of LNG covered 14% of total extra-EU gas imports in the fourth quarter of 2015, compared to 11% in the same period of 2014 (see further details below).
5. http://www.shell.com/media/news-and-media-releases/2015/first-gas-flows-from-shell-corrib-gas-field-in-ireland.html6. http://www.gazprom.com/about/subsidiaries/news/2016/march/article269297/7. https://www.regjeringen.no/en/topics/energy/oil-and-gas/Gas-exports-from-the-Norwegian-shelf/id766092/
10
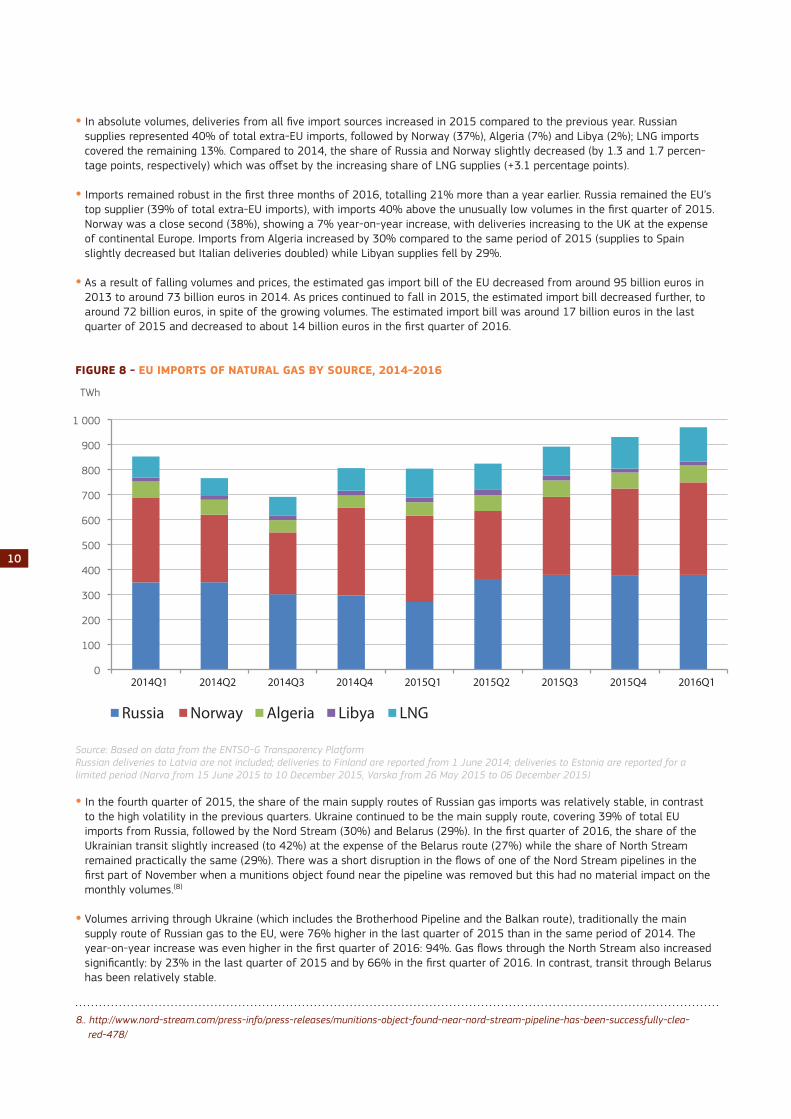
• In absolute volumes, deliveries from all five import sources increased in 2015 compared to the previous year. Russian supplies represented 40% of total extra-EU imports, followed by Norway (37%), Algeria (7%) and Libya (2%); LNG imports covered the remaining 13%. Compared to 2014, the share of Russia and Norway slightly decreased (by 1.3 and 1.7 percen-tage points, respectively) which was offset by the increasing share of LNG supplies (+3.1 percentage points).
• Imports remained robust in the first three months of 2016, totalling 21% more than a year earlier. Russia remained the EU’s top supplier (39% of total extra-EU imports), with imports 40% above the unusually low volumes in the first quarter of 2015. Norway was a close second (38%), showing a 7% year-on-year increase, with deliveries increasing to the UK at the expense of continental Europe. Imports from Algeria increased by 30% compared to the same period of 2015 (supplies to Spain slightly decreased but Italian deliveries doubled) while Libyan supplies fell by 29%.
• As a result of falling volumes and prices, the estimated gas import bill of the EU decreased from around 95 billion euros in 2013 to around 73 billion euros in 2014. As prices continued to fall in 2015, the estimated import bill decreased further, to around 72 billion euros, in spite of the growing volumes. The estimated import bill was around 17 billion euros in the last quarter of 2015 and decreased to about 14 billion euros in the first quarter of 2016.
FIGURE 8 - EU IMPORTS OF NATURAL GAS BY SOURCE, 2014-2016
Source: Based on data from the ENTSO-G Transparency PlatformRussian deliveries to Latvia are not included; deliveries to Finland are reported from 1 June 2014; deliveries to Estonia are reported for a limited period (Narva from 15 June 2015 to 10 December 2015, Varska from 26 May 2015 to 06 December 2015)
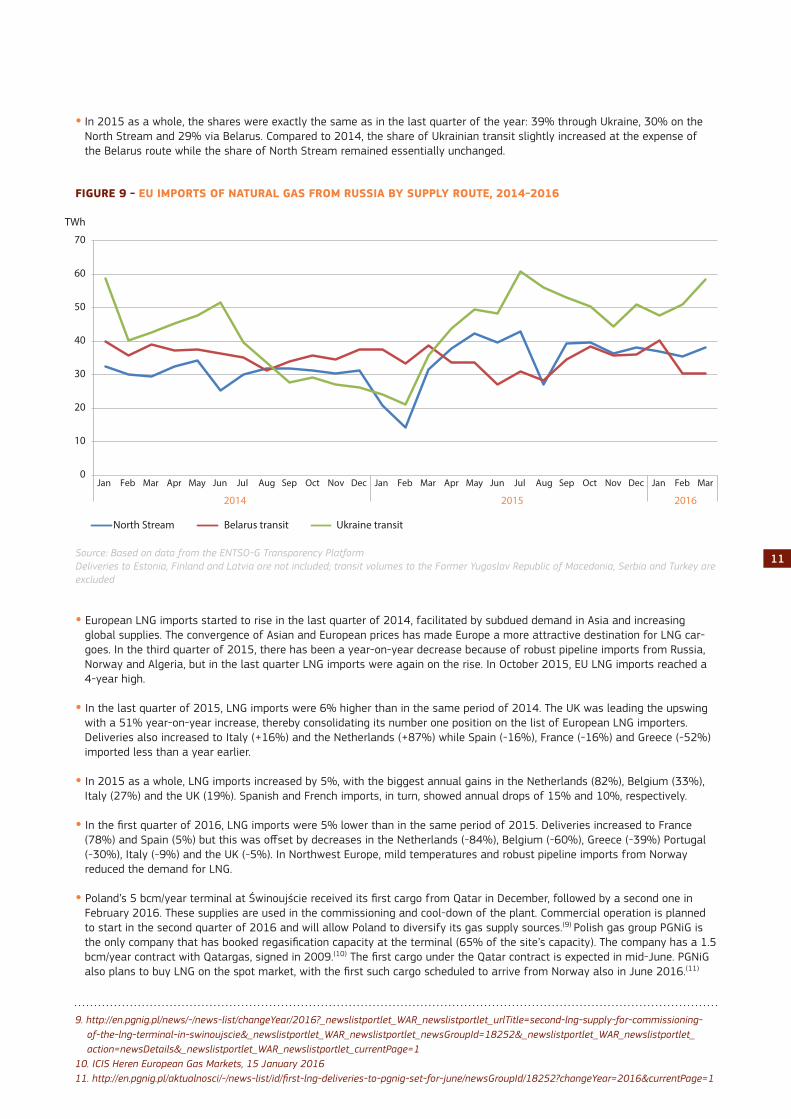
• In the fourth quarter of 2015, the share of the main supply routes of Russian gas imports was relatively stable, in contrast to the high volatility in the previous quarters. Ukraine continued to be the main supply route, covering 39% of total EU imports from Russia, followed by the Nord Stream (30%) and Belarus (29%). In the first quarter of 2016, the share of the Ukrainian transit slightly increased (to 42%) at the expense of the Belarus route (27%) while the share of North Stream remained practically the same (29%). There was a short disruption in the flows of one of the Nord Stream pipelines in the first part of November when a munitions object found near the pipeline was removed but this had no material impact on the monthly volumes.(8)
• Volumes arriving through Ukraine (which includes the Brotherhood Pipeline and the Balkan route), traditionally the main supply route of Russian gas to the EU, were 76% higher in the last quarter of 2015 than in the same period of 2014. The year-on-year increase was even higher in the first quarter of 2016: 94%. Gas flows through the North Stream also increased significantly: by 23% in the last quarter of 2015 and by 66% in the first quarter of 2016. In contrast, transit through Belarus has been relatively stable.
0
100
200
300
400
500
600
700
800
900
1 000
2014Q1 2014Q2 2014Q3 2014Q4 2015Q1 2015Q2 2015Q3 2015Q4 2016Q1
TWh
Russia Norway Algeria Libya LNG
8.. http://www.nord-stream.com/press-info/press-releases/munitions-object-found-near-nord-stream-pipeline-has-been-successfully-clea-red-478/
11
• In 2015 as a whole, the shares were exactly the same as in the last quarter of the year: 39% through Ukraine, 30% on the North Stream and 29% via Belarus. Compared to 2014, the share of Ukrainian transit slightly increased at the expense of the Belarus route while the share of North Stream remained essentially unchanged.
FIGURE 9 - EU IMPORTS OF NATURAL GAS FROM RUSSIA BY SUPPLY ROUTE, 2014-2016
Source: Based on data from the ENTSO-G Transparency PlatformDeliveries to Estonia, Finland and Latvia are not included; transit volumes to the Former Yugoslav Republic of Macedonia, Serbia and Turkey are excluded
• European LNG imports started to rise in the last quarter of 2014, facilitated by subdued demand in Asia and increasing global supplies. The convergence of Asian and European prices has made Europe a more attractive destination for LNG car-goes. In the third quarter of 2015, there has been a year-on-year decrease because of robust pipeline imports from Russia, Norway and Algeria, but in the last quarter LNG imports were again on the rise. In October 2015, EU LNG imports reached a 4-year high.
• In the last quarter of 2015, LNG imports were 6% higher than in the same period of 2014. The UK was leading the upswing with a 51% year-on-year increase, thereby consolidating its number one position on the list of European LNG importers. Deliveries also increased to Italy (+16%) and the Netherlands (+87%) while Spain (-16%), France (-16%) and Greece (-52%) imported less than a year earlier.
• In 2015 as a whole, LNG imports increased by 5%, with the biggest annual gains in the Netherlands (82%), Belgium (33%), Italy (27%) and the UK (19%). Spanish and French imports, in turn, showed annual drops of 15% and 10%, respectively.
• In the first quarter of 2016, LNG imports were 5% lower than in the same period of 2015. Deliveries increased to France (78%) and Spain (5%) but this was offset by decreases in the Netherlands (-84%), Belgium (-60%), Greece (-39%) Portugal (-30%), Italy (-9%) and the UK (-5%). In Northwest Europe, mild temperatures and robust pipeline imports from Norway reduced the demand for LNG.
• Poland’s 5 bcm/year terminal at Świnoujście received its first cargo from Qatar in December, followed by a second one in February 2016. These supplies are used in the commissioning and cool-down of the plant. Commercial operation is planned to start in the second quarter of 2016 and will allow Poland to diversify its gas supply sources.(9) Polish gas group PGNiG is the only company that has booked regasification capacity at the terminal (65% of the site’s capacity). The company has a 1.5 bcm/year contract with Qatargas, signed in 2009.(10) The first cargo under the Qatar contract is expected in mid-June. PGNiG also plans to buy LNG on the spot market, with the first such cargo scheduled to arrive from Norway also in June 2016.(11)
9. http://en.pgnig.pl/news/-/news-list/changeYear/2016?_newslistportlet_WAR_newslistportlet_urlTitle=second-lng-supply-for-commissioning-of-the-lng-terminal-in-swinoujscie&_newslistportlet_WAR_newslistportlet_newsGroupId=18252&_newslistportlet_WAR_newslistportlet_action=newsDetails&_newslistportlet_WAR_newslistportlet_currentPage=1
10. ICIS Heren European Gas Markets, 15 January 201611. http://en.pgnig.pl/aktualnosci/-/news-list/id/first-lng-deliveries-to-pgnig-set-for-june/newsGroupId/18252?changeYear=2016¤tPage=1
0
10
20
30
40
50
60
70
Jan Feb Mar Apr May Jun Jul Aug Sep Oct Nov Dec Jan Feb Mar Apr May Jun Jul Aug Sep Oct Nov Dec Jan Feb Mar
2014 2015 2016
TWh
North Stream Belarus transit Ukraine transit
12
• France’s new LNG terminal is Dunkirk is set to receive the first delivery in July 2016; this will be followed by tests during an estimated 2-2.5 months.(12) To complement the facility, a new pipeline allowing reverse flows from France to Belgium was commissioned on 1 November 2015. The new investments will enable the terminal to transmit the equivalent of 20% of French and Belgian gas consumption, thereby improving the security and diversification of the gas supply for Northwest Europe.(13)
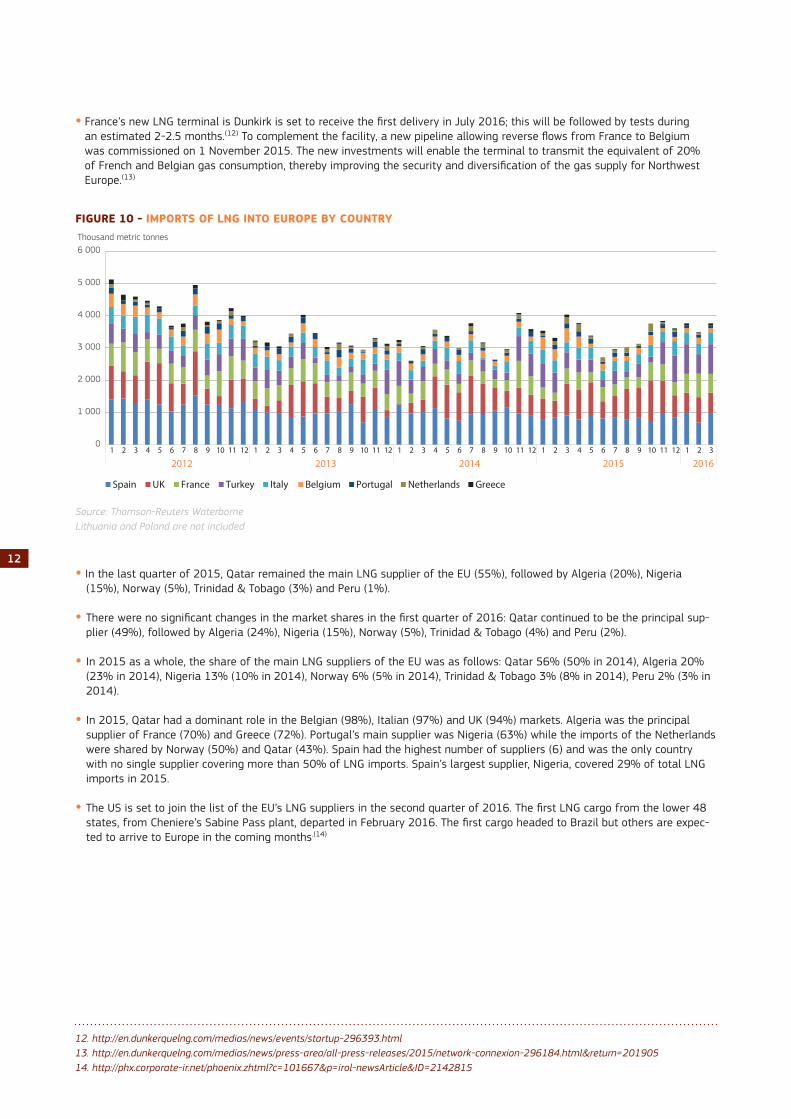
FIGURE 10 - IMPORTS OF LNG INTO EUROPE BY COUNTRY
Source: Thomson-Reuters WaterborneLithuania and Poland are not included
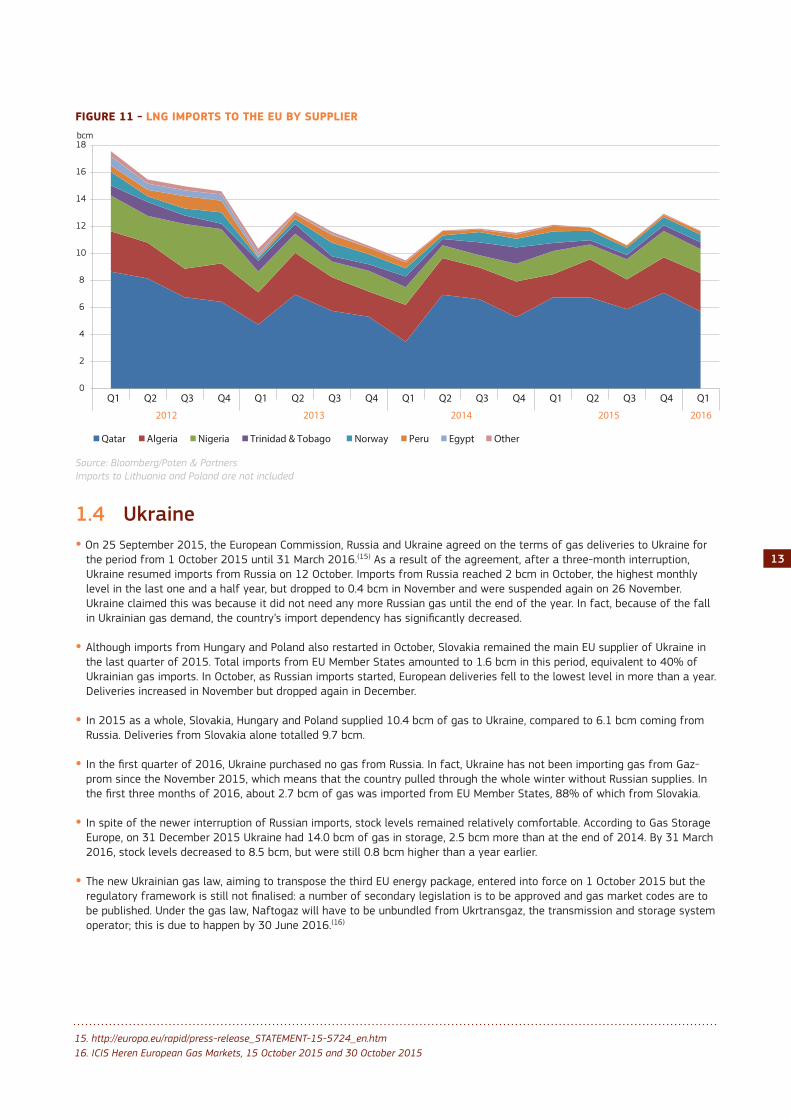
• In the last quarter of 2015, Qatar remained the main LNG supplier of the EU (55%), followed by Algeria (20%), Nigeria (15%), Norway (5%), Trinidad & Tobago (3%) and Peru (1%).
• There were no significant changes in the market shares in the first quarter of 2016: Qatar continued to be the principal sup-plier (49%), followed by Algeria (24%), Nigeria (15%), Norway (5%), Trinidad & Tobago (4%) and Peru (2%).
• In 2015 as a whole, the share of the main LNG suppliers of the EU was as follows: Qatar 56% (50% in 2014), Algeria 20% (23% in 2014), Nigeria 13% (10% in 2014), Norway 6% (5% in 2014), Trinidad & Tobago 3% (8% in 2014), Peru 2% (3% in 2014).
• In 2015, Qatar had a dominant role in the Belgian (98%), Italian (97%) and UK (94%) markets. Algeria was the principal supplier of France (70%) and Greece (72%). Portugal’s main supplier was Nigeria (63%) while the imports of the Netherlands were shared by Norway (50%) and Qatar (43%). Spain had the highest number of suppliers (6) and was the only country with no single supplier covering more than 50% of LNG imports. Spain’s largest supplier, Nigeria, covered 29% of total LNG imports in 2015.
• The US is set to join the list of the EU’s LNG suppliers in the second quarter of 2016. The first LNG cargo from the lower 48 states, from Cheniere’s Sabine Pass plant, departed in February 2016. The first cargo headed to Brazil but others are expec-ted to arrive to Europe in the coming months.(14)
12
12. http://en.dunkerquelng.com/medias/news/events/startup-296393.html 13. http://en.dunkerquelng.com/medias/news/press-area/all-press-releases/2015/network-connexion-296184.html&return=20190514. http://phx.corporate-ir.net/phoenix.zhtml?c=101667&p=irol-newsArticle&ID=2142815
0
1 000
2 000
3 000
4 000
5 000
6 000
1 2 3 4 5 6 7 8 9 10 11 12 1 2 3 4 5 6 7 8 9 10 11 12 1 2 3 4 5 6 7 8 9 10 11 12 1 2 3 4 5 6 7 8 9 10 11 12 1 2 3
2012 2013 2014 2015 2016
Thousand metric tonnes
Spain UK France Turkey Italy Belgium Portugal Netherlands Greece
13
0
2
4
6
8
10
12
14
16
18
Q1 Q2 Q3 Q4 Q1 Q2 Q3 Q4 Q1 Q2 Q3 Q4 Q1 Q2 Q3 Q4 Q1
2012 2013 2014 2015 2016
bcm
Qatar Algeria Nigeria Trinidad & Tobago Norway Peru Egypt Other
15. http://europa.eu/rapid/press-release_STATEMENT-15-5724_en.htm16. ICIS Heren European Gas Markets, 15 October 2015 and 30 October 2015
FIGURE 11 - LNG IMPORTS TO THE EU BY SUPPLIER
Source: Bloomberg/Poten & PartnersImports to Lithuania and Poland are not included
1.4 Ukraine• On 25 September 2015, the European Commission, Russia and Ukraine agreed on the terms of gas deliveries to Ukraine for
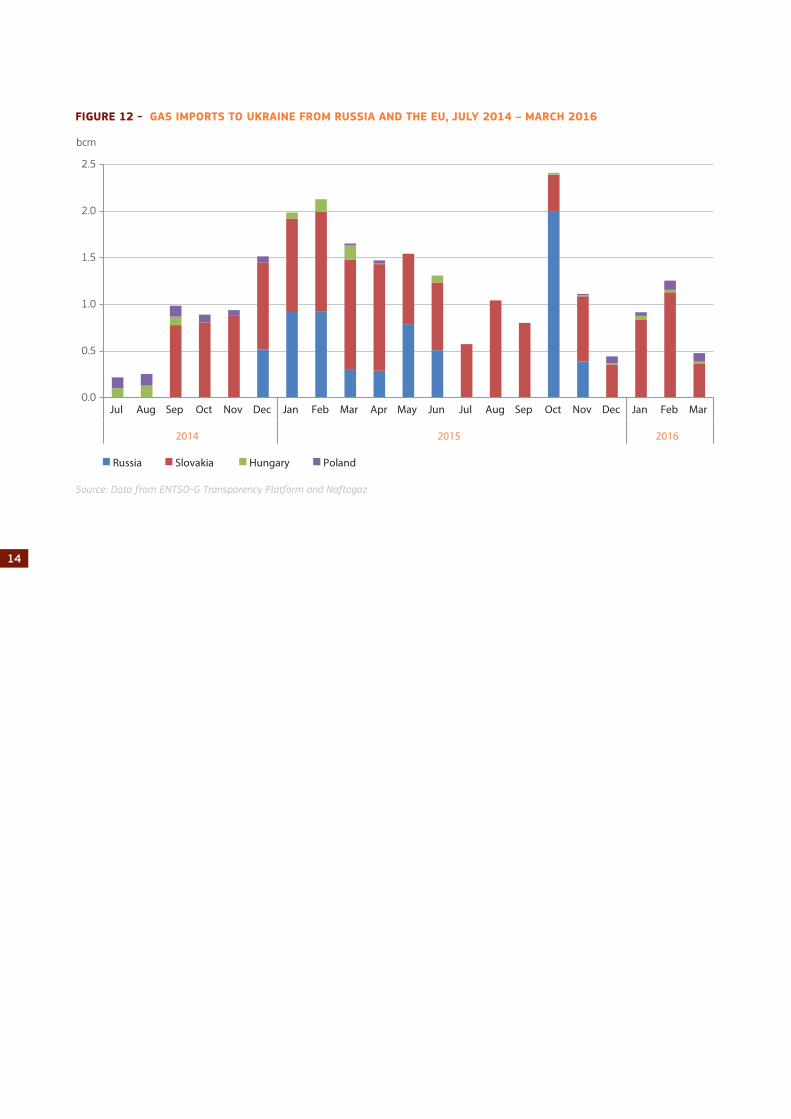
the period from 1 October 2015 until 31 March 2016.(15) As a result of the agreement, after a three-month interruption, Ukraine resumed imports from Russia on 12 October. Imports from Russia reached 2 bcm in October, the highest monthly level in the last one and a half year, but dropped to 0.4 bcm in November and were suspended again on 26 November. Ukraine claimed this was because it did not need any more Russian gas until the end of the year. In fact, because of the fall in Ukrainian gas demand, the country’s import dependency has significantly decreased.
• Although imports from Hungary and Poland also restarted in October, Slovakia remained the main EU supplier of Ukraine in the last quarter of 2015. Total imports from EU Member States amounted to 1.6 bcm in this period, equivalent to 40% of Ukrainian gas imports. In October, as Russian imports started, European deliveries fell to the lowest level in more than a year. Deliveries increased in November but dropped again in December.
• In 2015 as a whole, Slovakia, Hungary and Poland supplied 10.4 bcm of gas to Ukraine, compared to 6.1 bcm coming from Russia. Deliveries from Slovakia alone totalled 9.7 bcm.
• In the first quarter of 2016, Ukraine purchased no gas from Russia. In fact, Ukraine has not been importing gas from Gaz-prom since the November 2015, which means that the country pulled through the whole winter without Russian supplies. In the first three months of 2016, about 2.7 bcm of gas was imported from EU Member States, 88% of which from Slovakia.
• In spite of the newer interruption of Russian imports, stock levels remained relatively comfortable. According to Gas Storage Europe, on 31 December 2015 Ukraine had 14.0 bcm of gas in storage, 2.5 bcm more than at the end of 2014. By 31 March 2016, stock levels decreased to 8.5 bcm, but were still 0.8 bcm higher than a year earlier.
• The new Ukrainian gas law, aiming to transpose the third EU energy package, entered into force on 1 October 2015 but the regulatory framework is still not finalised: a number of secondary legislation is to be approved and gas market codes are to be published. Under the gas law, Naftogaz will have to be unbundled from Ukrtransgaz, the transmission and storage system operator; this is due to happen by 30 June 2016.(16)
14
FIGURE 12 - GAS IMPORTS TO UKRAINE FROM RUSSIA AND THE EU, JULY 2014 – MARCH 2016
Source: Data from ENTSO-G Transparency Platform and Naftogaz
0.0
0.5
1.0
1.5
2.0
2.5
Jul Aug Sep Oct Nov Dec Jan Feb Mar Apr May Jun Jul Aug Sep Oct Nov Dec Jan Feb Mar
2014 2015 2016
bcm
Russia Slovakia Hungary Poland

16
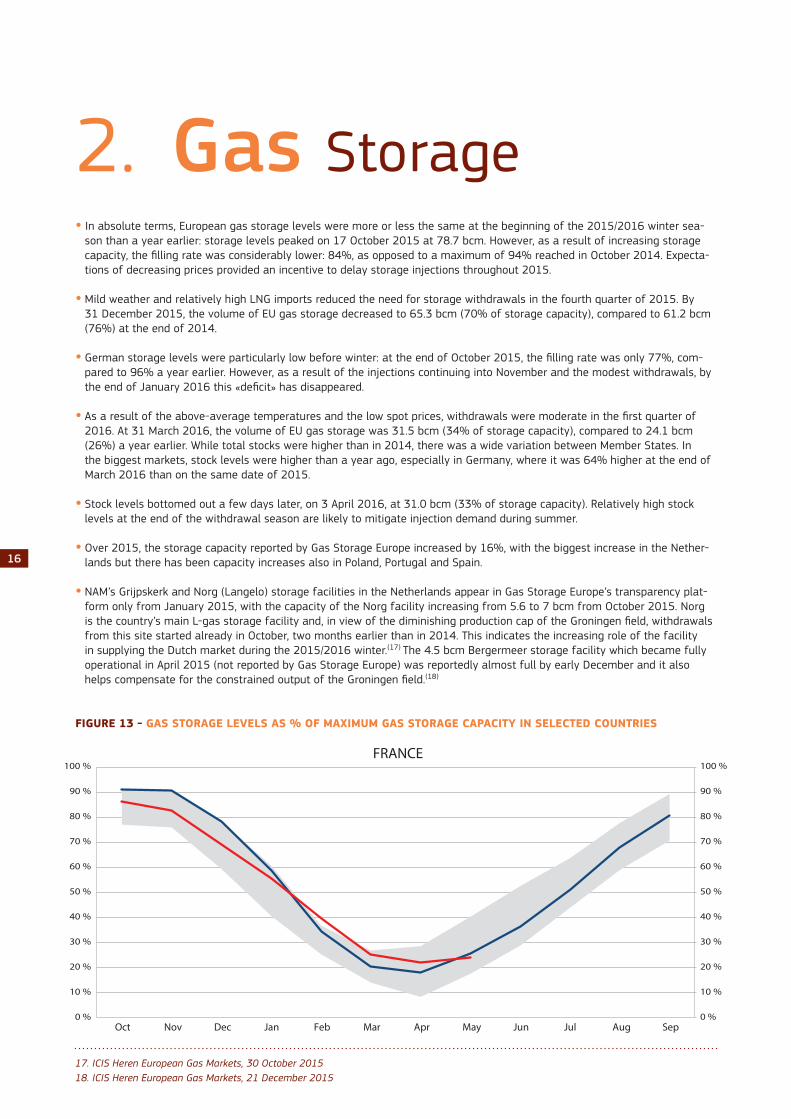
2. Gas Storage • In absolute terms, European gas storage levels were more or less the same at the beginning of the 2015/2016 winter sea-
son than a year earlier: storage levels peaked on 17 October 2015 at 78.7 bcm. However, as a result of increasing storage capacity, the filling rate was considerably lower: 84%, as opposed to a maximum of 94% reached in October 2014. Expecta-tions of decreasing prices provided an incentive to delay storage injections throughout 2015.
• Mild weather and relatively high LNG imports reduced the need for storage withdrawals in the fourth quarter of 2015. By 31 December 2015, the volume of EU gas storage decreased to 65.3 bcm (70% of storage capacity), compared to 61.2 bcm (76%) at the end of 2014.
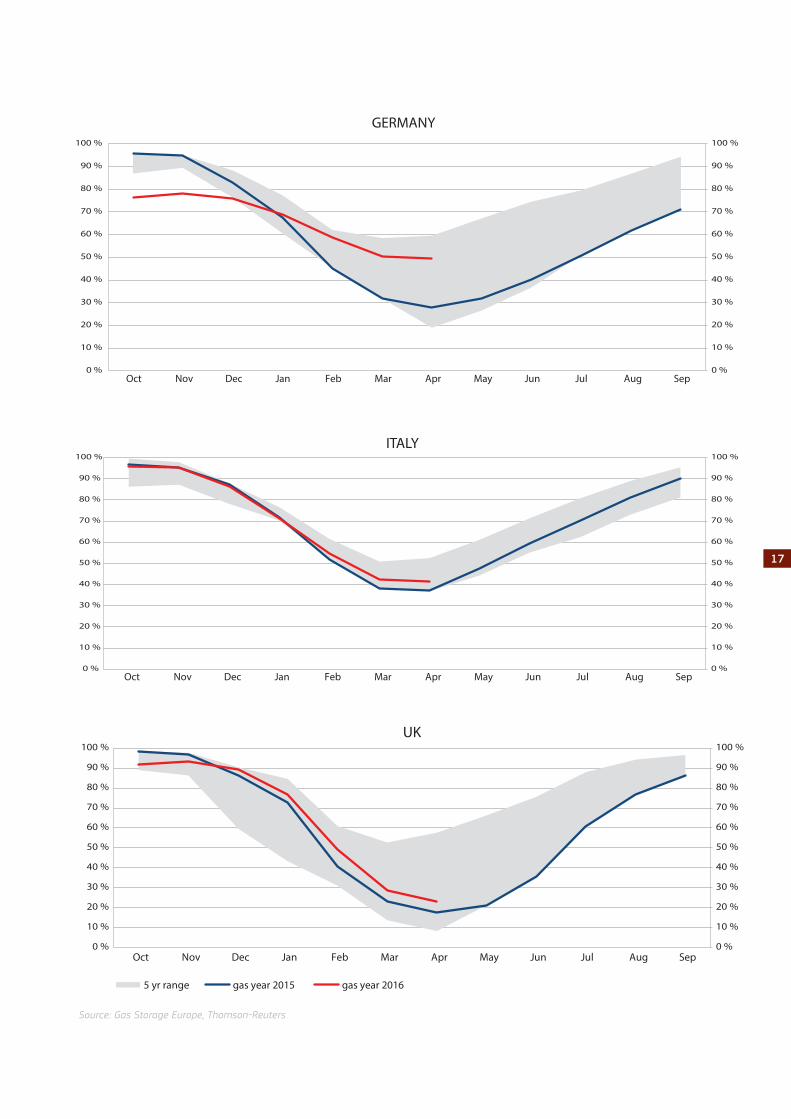
• German storage levels were particularly low before winter: at the end of October 2015, the filling rate was only 77%, com-pared to 96% a year earlier. However, as a result of the injections continuing into November and the modest withdrawals, by the end of January 2016 this «deficit» has disappeared.
• As a result of the above-average temperatures and the low spot prices, withdrawals were moderate in the first quarter of 2016. At 31 March 2016, the volume of EU gas storage was 31.5 bcm (34% of storage capacity), compared to 24.1 bcm (26%) a year earlier. While total stocks were higher than in 2014, there was a wide variation between Member States. In the biggest markets, stock levels were higher than a year ago, especially in Germany, where it was 64% higher at the end of March 2016 than on the same date of 2015.
• Stock levels bottomed out a few days later, on 3 April 2016, at 31.0 bcm (33% of storage capacity). Relatively high stock levels at the end of the withdrawal season are likely to mitigate injection demand during summer.
• Over 2015, the storage capacity reported by Gas Storage Europe increased by 16%, with the biggest increase in the Nether-lands but there has been capacity increases also in Poland, Portugal and Spain.
• NAM’s Grijpskerk and Norg (Langelo) storage facilities in the Netherlands appear in Gas Storage Europe’s transparency plat-form only from January 2015, with the capacity of the Norg facility increasing from 5.6 to 7 bcm from October 2015. Norg is the country’s main L-gas storage facility and, in view of the diminishing production cap of the Groningen field, withdrawals from this site started already in October, two months earlier than in 2014. This indicates the increasing role of the facility in supplying the Dutch market during the 2015/2016 winter.(17) The 4.5 bcm Bergermeer storage facility which became fully operational in April 2015 (not reported by Gas Storage Europe) was reportedly almost full by early December and it also helps compensate for the constrained output of the Groningen field.(18)
FIGURE 13 - GAS STORAGE LEVELS AS % OF MAXIMUM GAS STORAGE CAPACITY IN SELECTED COUNTRIES
0 %
10 %
20 %
30 %
40 %
50 %
60 %
70 %
80 %
90 %
100 %
0 %
10 %
20 %
30 %
40 %
50 %
60 %
70 %
80 %
90 %
100 %
Oct Nov Dec Jan Feb Mar Apr May Jun Jul Aug Sep
FRANCE
5 yr range gas year 2015 gas year 201617. ICIS Heren European Gas Markets, 30 October 201518. ICIS Heren European Gas Markets, 21 December 2015
17
Source: Gas Storage Europe, Thomson-Reuters
0 %
10 %
20 %
30 %
40 %
50 %
60 %
70 %
80 %
90 %
100 %
0 %
10 %
20 %
30 %
40 %
50 %
60 %
70 %
80 %
90 %
100 %
Oct Nov Dec Jan Feb Mar Apr May Jun Jul Aug Sep
GERMANY
5 yr range gas year 2015 gas year 2016
0 %
10 %
20 %
30 %
40 %
50 %
60 %
70 %
80 %
90 %
100 %
0 %
10 %
20 %
30 %
40 %
50 %
60 %
70 %
80 %
90 %
100 %
Oct Nov Dec Jan Feb Mar Apr May Jun Jul Aug Sep
ITALY
5 yr range gas year 2015 gas year 2016
0 %
10 %
20 %
30 %
40 %
50 %
60 %
70 %
80 %
90 %
100 %
0 %
10 %
20 %
30 %
40 %
50 %
60 %
70 %
80 %
90 %
100 %
Oct Nov Dec Jan Feb Mar Apr May Jun Jul Aug Sep
UK
5 yr range gas year 2015 gas year 2016
18
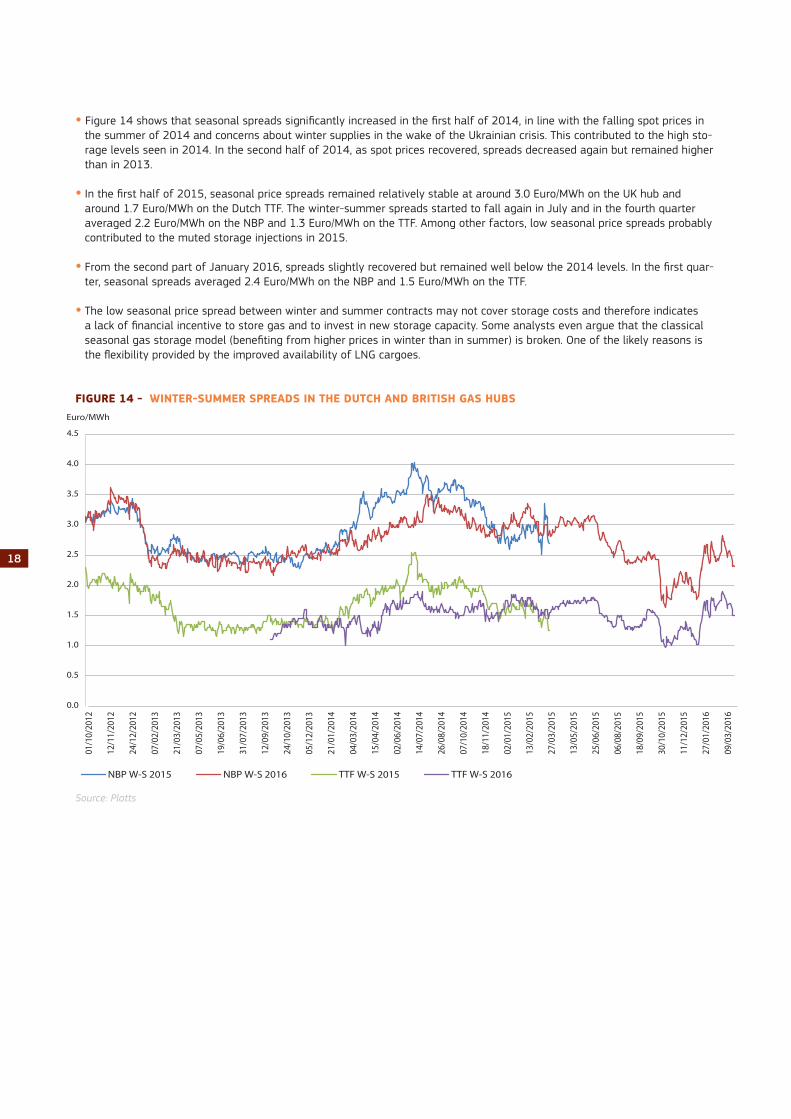
• Figure 14 shows that seasonal spreads significantly increased in the first half of 2014, in line with the falling spot prices in the summer of 2014 and concerns about winter supplies in the wake of the Ukrainian crisis. This contributed to the high sto-rage levels seen in 2014. In the second half of 2014, as spot prices recovered, spreads decreased again but remained higher than in 2013.
• In the first half of 2015, seasonal price spreads remained relatively stable at around 3.0 Euro/MWh on the UK hub and around 1.7 Euro/MWh on the Dutch TTF. The winter-summer spreads started to fall again in July and in the fourth quarter averaged 2.2 Euro/MWh on the NBP and 1.3 Euro/MWh on the TTF. Among other factors, low seasonal price spreads probably contributed to the muted storage injections in 2015.
• From the second part of January 2016, spreads slightly recovered but remained well below the 2014 levels. In the first quar-ter, seasonal spreads averaged 2.4 Euro/MWh on the NBP and 1.5 Euro/MWh on the TTF.
• The low seasonal price spread between winter and summer contracts may not cover storage costs and therefore indicates a lack of financial incentive to store gas and to invest in new storage capacity. Some analysts even argue that the classical seasonal gas storage model (benefiting from higher prices in winter than in summer) is broken. One of the likely reasons is the flexibility provided by the improved availability of LNG cargoes.
FIGURE 14 - WINTER-SUMMER SPREADS IN THE DUTCH AND BRITISH GAS HUBS
Source: Platts
0.0
0.5
1.0
1.5
2.0
2.5
3.0
3.5
4.0
4.5
01/1
0/20
12
12/1
1/20
12
24/1
2/20
12
07/0
2/20
13
21/0
3/20
13
07/0
5/20
13
19/0
6/20
13
31/0
7/20
13
12/0
9/20
13
24/1
0/20
13
05/1
2/20
13
21/0
1/20
14
04/0
3/20
14
15/0
4/20
14
02/0
6/20
14
14/0
7/20
14
26/0
8/20
14
07/1
0/20
14
18/1
1/20
14
02/0
1/20
15
13/0
2/20
15
27/0
3/20
15
13/0
5/20
15
25/0
6/20
15
06/0
8/20
15
18/0
9/20
15
30/1
0/20
15
11/1
2/20
15
27/0
1/20
16
09/0
3/20
16
Euro/MWh
NBP W-S 2015 NBP W-S 2016 TTF W-S 2015 TTF W-S 2016

20
3. Wholesale Gas markets
3.1 The broader energy commodity picture: comparisons between oil, gas and coal prices in the EU
• Oil prices have been on a declining trajectory since mid-2014, driven by persistent global oversupply. The trend continued in the last quarter of 2015. In January 2016, helped by weak economic data and the lifting of the Iranian sanctions, Brent drop-ped to 26 USD/barrel, its lowest level since 2003; this means the price decreased by 77% in 19 months. Since then, howe-ver, Brent has been on the rise as low prices and spending cuts finally start to take their toll on non-OPEC oil supply. OPEC production, on the other hand, remains high: in its December meeting, the group removed any notional ceiling on output and, in April 2016, the discussions between major OPEC and non-OPEC producers concerning a potential freeze in production levels at January levels proved fruitless. Nevertheless, the market is expected to rebalance in 2016-2017 but the high stocks accumulated over the last two years will probably limit the potential for a significant price rise.
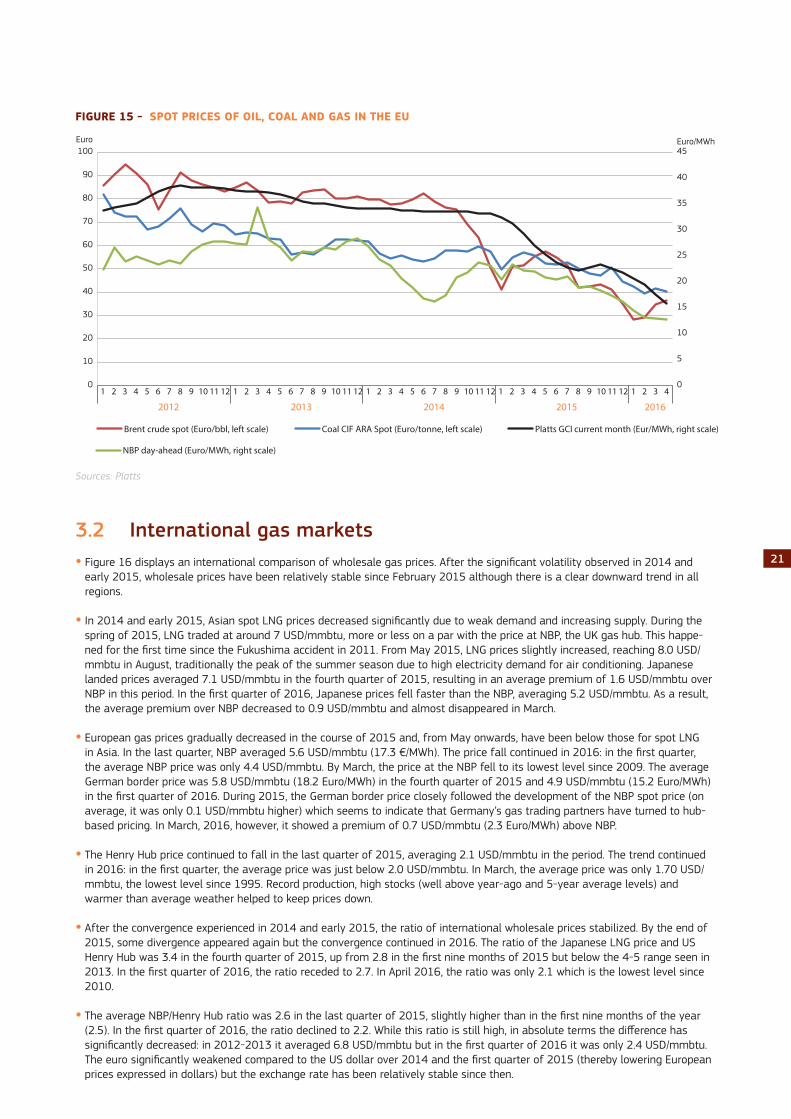
• The NBP spot price showed a clear decreasing trend in 2015 and early 2016: it fell from an average 23.3 Euro/MWh in February 2015 to 16.1 Euro/MWh in December 2015 and 12.9 Euro/MWh in March 2015. A combination of mild weather, falling oil prices and a well-supplied market with steady LNG supply put downward pressure on European hub prices. In the fourth quarter of 2015, NBP averaged 17.3 Euro/MWh, 24% less than a year earlier. Despite the winter season, the drop continued in 2016: in the first quarter, the average price was 13.5 Euro/MWh, the lowest level since 2009. Section 5.3.2 looks at European wholesale gas prices in more detail.
• Falling oil prices directly affect oil-indexed gas prices, albeit with a 6-9 month time lag. Oil-indexed prices started to increase in September 2015 but the repeated oil price drop since mid-2015 means that they continued to decrease from October. In spite of the recovery of oil prices in early 2016, oil-indexed prices continued to fall in the first four months of the year but are set to increase again from May onwards. Platt’s North West Europe Gas Contract Indicator (GCI), a theoretical index showing what a gas price linked 100% to oil would be, averaged 22.5 Euro/MWh in the fourth quarter of 2015 and 19.2 Euro/MWh in the first quarter of 2016. As hub prices fell even faster, GCI’s premium over NBP increased: it was less than 2 Euro/MWh in July 2015 but exceeded 6 Euro/MWh in January and February 2016.
• Coal prices have been on a declining trend since 2011, driven by global oversupply. This trend is reinforced by China’s gradual switch away from coal which has profound implications on the country’s coal imports. The price fall continued in 2014-2015 but the decline was not as spectacular as in the case of crude oil. Although the CIF ARA spot price rose in November 2015, in the fourth quarter of 2015 the average price measured in Euro was 19% lower than in the same period in the previous year. The trend continued in early 2016. Since late 2014, the development of European spot prices of coal and gas show a remar-kable similarity, suggesting that the relative competitiveness of the two fuels has stabilized.
21
FIGURE 15 - SPOT PRICES OF OIL, COAL AND GAS IN THE EU
Sources: Platts
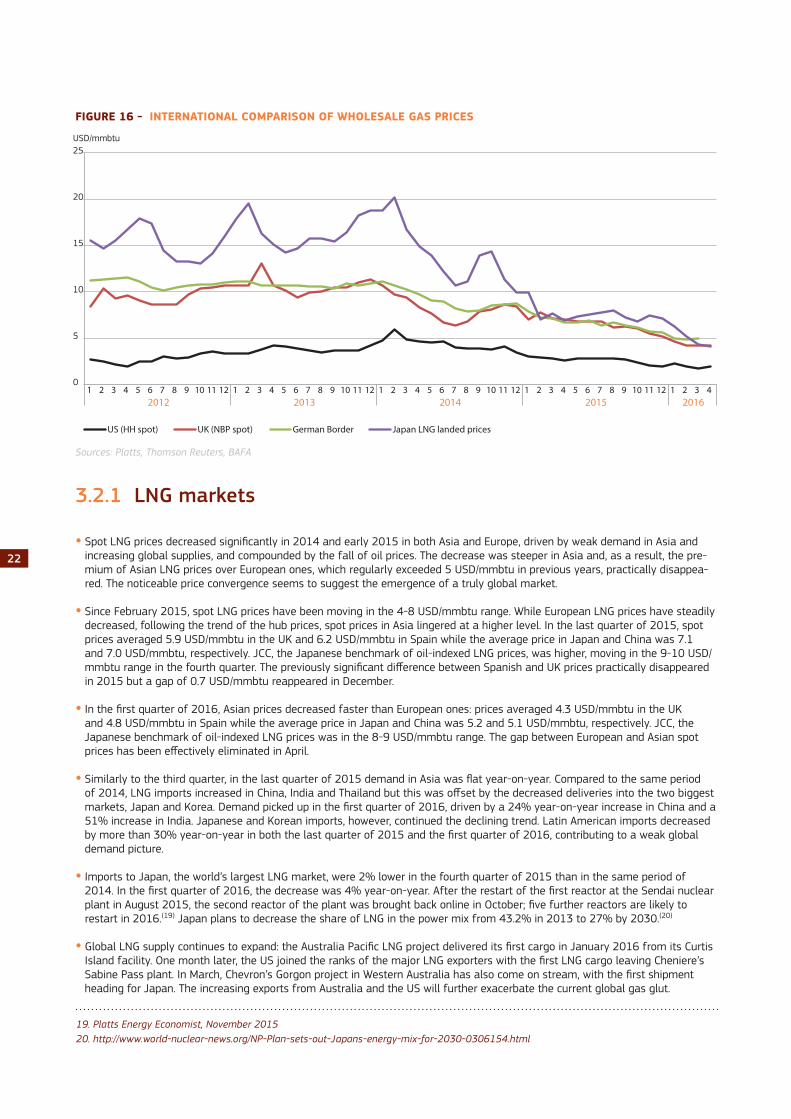
3.2 International gas markets • Figure 16 displays an international comparison of wholesale gas prices. After the significant volatility observed in 2014 and
early 2015, wholesale prices have been relatively stable since February 2015 although there is a clear downward trend in all regions.
• In 2014 and early 2015, Asian spot LNG prices decreased significantly due to weak demand and increasing supply. During the spring of 2015, LNG traded at around 7 USD/mmbtu, more or less on a par with the price at NBP, the UK gas hub. This happe-ned for the first time since the Fukushima accident in 2011. From May 2015, LNG prices slightly increased, reaching 8.0 USD/mmbtu in August, traditionally the peak of the summer season due to high electricity demand for air conditioning. Japanese landed prices averaged 7.1 USD/mmbtu in the fourth quarter of 2015, resulting in an average premium of 1.6 USD/mmbtu over NBP in this period. In the first quarter of 2016, Japanese prices fell faster than the NBP, averaging 5.2 USD/mmbtu. As a result, the average premium over NBP decreased to 0.9 USD/mmbtu and almost disappeared in March.
• European gas prices gradually decreased in the course of 2015 and, from May onwards, have been below those for spot LNG in Asia. In the last quarter, NBP averaged 5.6 USD/mmbtu (17.3 €/MWh). The price fall continued in 2016: in the first quarter, the average NBP price was only 4.4 USD/mmbtu. By March, the price at the NBP fell to its lowest level since 2009. The average German border price was 5.8 USD/mmbtu (18.2 Euro/MWh) in the fourth quarter of 2015 and 4.9 USD/mmbtu (15.2 Euro/MWh) in the first quarter of 2016. During 2015, the German border price closely followed the development of the NBP spot price (on average, it was only 0.1 USD/mmbtu higher) which seems to indicate that Germany’s gas trading partners have turned to hub-based pricing. In March, 2016, however, it showed a premium of 0.7 USD/mmbtu (2.3 Euro/MWh) above NBP.
• The Henry Hub price continued to fall in the last quarter of 2015, averaging 2.1 USD/mmbtu in the period. The trend continued in 2016: in the first quarter, the average price was just below 2.0 USD/mmbtu. In March, the average price was only 1.70 USD/mmbtu, the lowest level since 1995. Record production, high stocks (well above year-ago and 5-year average levels) and warmer than average weather helped to keep prices down.
• After the convergence experienced in 2014 and early 2015, the ratio of international wholesale prices stabilized. By the end of 2015, some divergence appeared again but the convergence continued in 2016. The ratio of the Japanese LNG price and US Henry Hub was 3.4 in the fourth quarter of 2015, up from 2.8 in the first nine months of 2015 but below the 4-5 range seen in 2013. In the first quarter of 2016, the ratio receded to 2.7. In April 2016, the ratio was only 2.1 which is the lowest level since 2010.
• The average NBP/Henry Hub ratio was 2.6 in the last quarter of 2015, slightly higher than in the first nine months of the year (2.5). In the first quarter of 2016, the ratio declined to 2.2. While this ratio is still high, in absolute terms the difference has significantly decreased: in 2012-2013 it averaged 6.8 USD/mmbtu but in the first quarter of 2016 it was only 2.4 USD/mmbtu. The euro significantly weakened compared to the US dollar over 2014 and the first quarter of 2015 (thereby lowering European prices expressed in dollars) but the exchange rate has been relatively stable since then.
0
5
10
15
20
25
30
35
40
45
0
10
20
30
40
50
60
70
80
90
100
1 2 3 4 5 6 7 8 9 10 11 12 1 2 3 4 5 6 7 8 9 10 11 12 1 2 3 4 5 6 7 8 9 10 11 12 1 2 3 4 5 6 7 8 9 10 11 12 1 2 3 4
2012 2013 2014 2015 2016
Euro/MWh Euro
Brent crude spot (Euro/bbl, left scale) Coal CIF ARA Spot (Euro/tonne, left scale) Platts GCI current month (Eur/MWh, right scale)
NBP day-ahead (Euro/MWh, right scale)
22
FIGURE 16 - INTERNATIONAL COMPARISON OF WHOLESALE GAS PRICES
Sources: Platts, Thomson Reuters, BAFA
3.2.1 LNG markets
• Spot LNG prices decreased significantly in 2014 and early 2015 in both Asia and Europe, driven by weak demand in Asia and increasing global supplies, and compounded by the fall of oil prices. The decrease was steeper in Asia and, as a result, the pre-mium of Asian LNG prices over European ones, which regularly exceeded 5 USD/mmbtu in previous years, practically disappea-red. The noticeable price convergence seems to suggest the emergence of a truly global market.
• Since February 2015, spot LNG prices have been moving in the 4-8 USD/mmbtu range. While European LNG prices have steadily decreased, following the trend of the hub prices, spot prices in Asia lingered at a higher level. In the last quarter of 2015, spot prices averaged 5.9 USD/mmbtu in the UK and 6.2 USD/mmbtu in Spain while the average price in Japan and China was 7.1 and 7.0 USD/mmbtu, respectively. JCC, the Japanese benchmark of oil-indexed LNG prices, was higher, moving in the 9-10 USD/mmbtu range in the fourth quarter. The previously significant difference between Spanish and UK prices practically disappeared in 2015 but a gap of 0.7 USD/mmbtu reappeared in December.
• In the first quarter of 2016, Asian prices decreased faster than European ones: prices averaged 4.3 USD/mmbtu in the UK and 4.8 USD/mmbtu in Spain while the average price in Japan and China was 5.2 and 5.1 USD/mmbtu, respectively. JCC, the Japanese benchmark of oil-indexed LNG prices was in the 8-9 USD/mmbtu range. The gap between European and Asian spot prices has been effectively eliminated in April.
• Similarly to the third quarter, in the last quarter of 2015 demand in Asia was flat year-on-year. Compared to the same period of 2014, LNG imports increased in China, India and Thailand but this was offset by the decreased deliveries into the two biggest markets, Japan and Korea. Demand picked up in the first quarter of 2016, driven by a 24% year-on-year increase in China and a 51% increase in India. Japanese and Korean imports, however, continued the declining trend. Latin American imports decreased by more than 30% year-on-year in both the last quarter of 2015 and the first quarter of 2016, contributing to a weak global demand picture.
• Imports to Japan, the world’s largest LNG market, were 2% lower in the fourth quarter of 2015 than in the same period of 2014. In the first quarter of 2016, the decrease was 4% year-on-year. After the restart of the first reactor at the Sendai nuclear plant in August 2015, the second reactor of the plant was brought back online in October; five further reactors are likely to restart in 2016.(19) Japan plans to decrease the share of LNG in the power mix from 43.2% in 2013 to 27% by 2030.(20)
• Global LNG supply continues to expand: the Australia Pacific LNG project delivered its first cargo in January 2016 from its Curtis Island facility. One month later, the US joined the ranks of the major LNG exporters with the first LNG cargo leaving Cheniere’s Sabine Pass plant. In March, Chevron’s Gorgon project in Western Australia has also come on stream, with the first shipment heading for Japan. The increasing exports from Australia and the US will further exacerbate the current global gas glut.
19. Platts Energy Economist, November 201520. http://www.world-nuclear-news.org/NP-Plan-sets-out-Japans-energy-mix-for-2030-0306154.html
0
5
10
15
20
25
1 2 3 4 5 6 7 8 9 10 11 12 1 2 3 4 5 6 7 8 9 10 11 12 1 2 3 4 5 6 7 8 9 10 11 12 1 2 3 4 5 6 7 8 9 10 11 12 1 2 3 42012 2013 2014 2015 2016
USD/mmbtu
US (HH spot) UK (NBP spot) German Border Japan LNG landed prices
23
FIGURE 17 – SPOT LNG PRICES IN THE EU AND ASIA
Note: Landed prices for LNGSource: Thomson-Reuters Waterborne
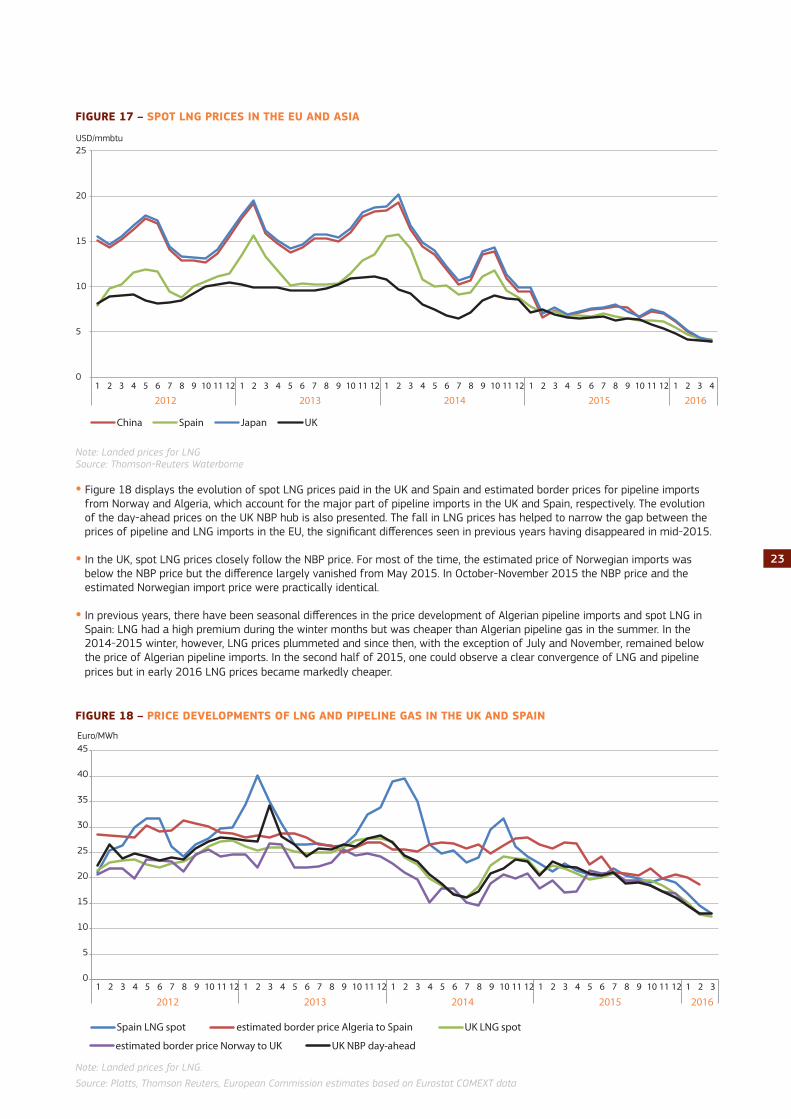
• Figure 18 displays the evolution of spot LNG prices paid in the UK and Spain and estimated border prices for pipeline imports from Norway and Algeria, which account for the major part of pipeline imports in the UK and Spain, respectively. The evolution of the day-ahead prices on the UK NBP hub is also presented. The fall in LNG prices has helped to narrow the gap between the prices of pipeline and LNG imports in the EU, the significant differences seen in previous years having disappeared in mid-2015.
• In the UK, spot LNG prices closely follow the NBP price. For most of the time, the estimated price of Norwegian imports was below the NBP price but the difference largely vanished from May 2015. In October-November 2015 the NBP price and the estimated Norwegian import price were practically identical.
• In previous years, there have been seasonal differences in the price development of Algerian pipeline imports and spot LNG in Spain: LNG had a high premium during the winter months but was cheaper than Algerian pipeline gas in the summer. In the 2014-2015 winter, however, LNG prices plummeted and since then, with the exception of July and November, remained below the price of Algerian pipeline imports. In the second half of 2015, one could observe a clear convergence of LNG and pipeline prices but in early 2016 LNG prices became markedly cheaper.
FIGURE 18 – PRICE DEVELOPMENTS OF LNG AND PIPELINE GAS IN THE UK AND SPAIN
Note: Landed prices for LNG.
Source: Platts, Thomson Reuters, European Commission estimates based on Eurostat COMEXT data
0
5
10
15
20
25
1 2 3 4 5 6 7 8 9 10 11 12 1 2 3 4 5 6 7 8 9 10 11 12 1 2 3 4 5 6 7 8 9 10 11 12 1 2 3 4 5 6 7 8 9 10 11 12 1 2 3 4
2012 2013 2014 2015 2016
USD/mmbtu
China Spain Japan UK
0
5
10
15
20
25
30
35
40
45
1 2 3 4 5 6 7 8 9 10 11 12 1 2 3 4 5 6 7 8 9 10 11 12 1 2 3 4 5 6 7 8 9 10 11 12 1 2 3 4 5 6 7 8 9 10 11 12 1 2 3
2012 2013 2014 2015 2016
Euro/MWh
Spain LNG spot estimated border price Algeria to Spain UK LNG spot
estimated border price Norway to UK UK NBP day-ahead
24
3.3 European gas markets
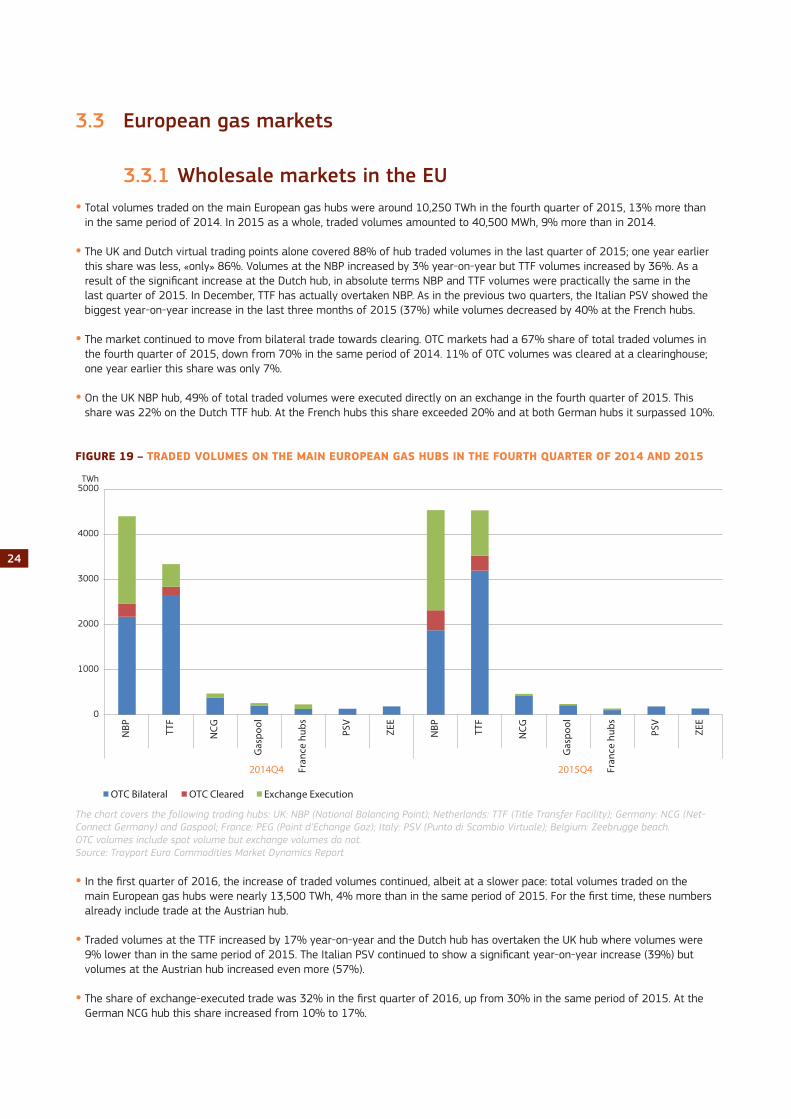
3.3.1 Wholesale markets in the EU• Total volumes traded on the main European gas hubs were around 10,250 TWh in the fourth quarter of 2015, 13% more than
in the same period of 2014. In 2015 as a whole, traded volumes amounted to 40,500 MWh, 9% more than in 2014.
• The UK and Dutch virtual trading points alone covered 88% of hub traded volumes in the last quarter of 2015; one year earlier this share was less, «only» 86%. Volumes at the NBP increased by 3% year-on-year but TTF volumes increased by 36%. As a result of the significant increase at the Dutch hub, in absolute terms NBP and TTF volumes were practically the same in the last quarter of 2015. In December, TTF has actually overtaken NBP. As in the previous two quarters, the Italian PSV showed the biggest year-on-year increase in the last three months of 2015 (37%) while volumes decreased by 40% at the French hubs.
• The market continued to move from bilateral trade towards clearing. OTC markets had a 67% share of total traded volumes in the fourth quarter of 2015, down from 70% in the same period of 2014. 11% of OTC volumes was cleared at a clearinghouse; one year earlier this share was only 7%.
• On the UK NBP hub, 49% of total traded volumes were executed directly on an exchange in the fourth quarter of 2015. This share was 22% on the Dutch TTF hub. At the French hubs this share exceeded 20% and at both German hubs it surpassed 10%.
FIGURE 19 – TRADED VOLUMES ON THE MAIN EUROPEAN GAS HUBS IN THE FOURTH QUARTER OF 2014 AND 2015
The chart covers the following trading hubs: UK: NBP (National Balancing Point); Netherlands: TTF (Title Transfer Facility); Germany: NCG (Net-Connect Germany) and Gaspool; France: PEG (Point d’Echange Gaz); Italy: PSV (Punto di Scambio Virtuale); Belgium: Zeebrugge beach.OTC volumes include spot volume but exchange volumes do not.Source: Trayport Euro Commodities Market Dynamics Report
• In the first quarter of 2016, the increase of traded volumes continued, albeit at a slower pace: total volumes traded on the main European gas hubs were nearly 13,500 TWh, 4% more than in the same period of 2015. For the first time, these numbers already include trade at the Austrian hub.
• Traded volumes at the TTF increased by 17% year-on-year and the Dutch hub has overtaken the UK hub where volumes were 9% lower than in the same period of 2015. The Italian PSV continued to show a significant year-on-year increase (39%) but volumes at the Austrian hub increased even more (57%).
• The share of exchange-executed trade was 32% in the first quarter of 2016, up from 30% in the same period of 2015. At the German NCG hub this share increased from 10% to 17%.
0
1000
2000
3000
4000
5000
NBP TT
F
NCG
Gas
pool
Fran
ce h
ubs
PSV
ZEE
NBP TT
F
NCG
Gas
pool
Fran
ce h
ubs
PSV
ZEE
2014Q4 2015Q4
TWh
OTC Bilateral OTC Cleared Exchange Execution
25
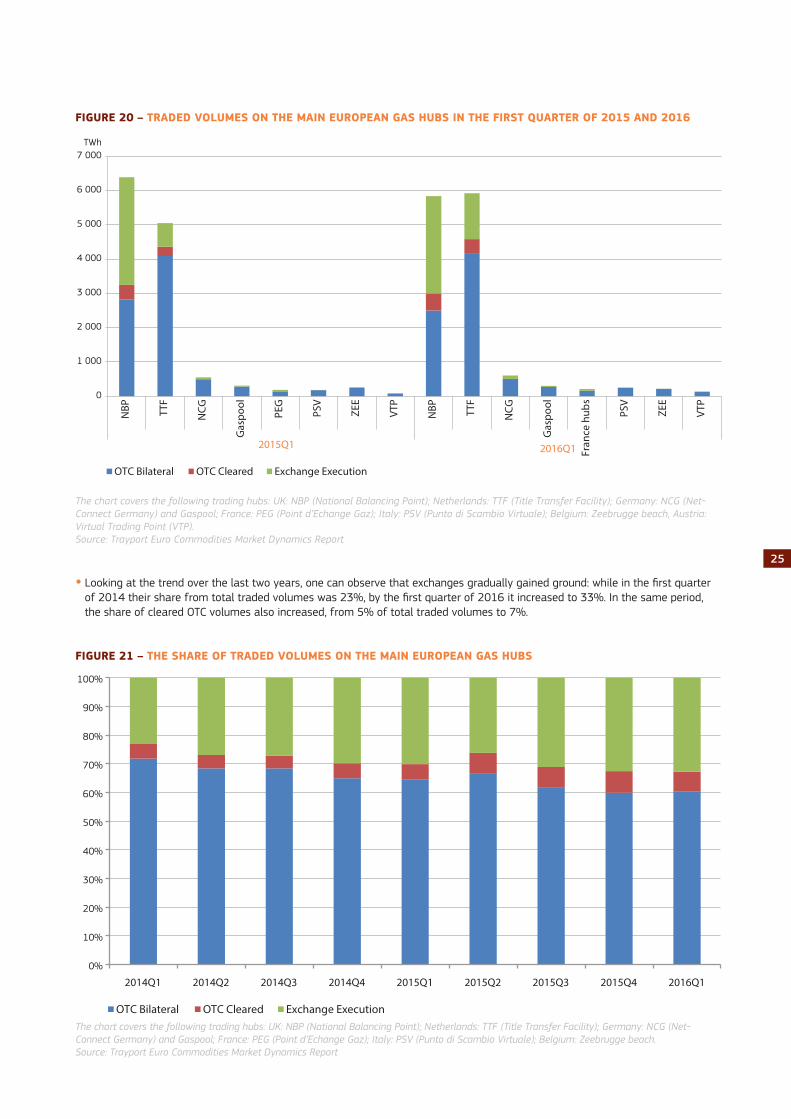
FIGURE 20 – TRADED VOLUMES ON THE MAIN EUROPEAN GAS HUBS IN THE FIRST QUARTER OF 2015 AND 2016
The chart covers the following trading hubs: UK: NBP (National Balancing Point); Netherlands: TTF (Title Transfer Facility); Germany: NCG (Net-Connect Germany) and Gaspool; France: PEG (Point d’Echange Gaz); Italy: PSV (Punto di Scambio Virtuale); Belgium: Zeebrugge beach, Austria: Virtual Trading Point (VTP).Source: Trayport Euro Commodities Market Dynamics Report
• Looking at the trend over the last two years, one can observe that exchanges gradually gained ground: while in the first quarter of 2014 their share from total traded volumes was 23%, by the first quarter of 2016 it increased to 33%. In the same period, the share of cleared OTC volumes also increased, from 5% of total traded volumes to 7%.
FIGURE 21 – THE SHARE OF TRADED VOLUMES ON THE MAIN EUROPEAN GAS HUBS
The chart covers the following trading hubs: UK: NBP (National Balancing Point); Netherlands: TTF (Title Transfer Facility); Germany: NCG (Net-Connect Germany) and Gaspool; France: PEG (Point d’Echange Gaz); Italy: PSV (Punto di Scambio Virtuale); Belgium: Zeebrugge beach.Source: Trayport Euro Commodities Market Dynamics Report
0%
10%
20%
30%
40%
50%
60%
70%
80%
90%
100%
2014Q1 2014Q2 2014Q3 2014Q4 2015Q1 2015Q2 2015Q3 2015Q4 2016Q1
OTC Bilateral OTC Cleared Exchange Execution
0
1 000
2 000
3 000
4 000
5 000
6 000
7 000
NBP TT
F
NCG
Gas
pool
PEG
PSV
ZEE
VTP
NBP TT
F
NCG
Gas
pool
Fran
ce h
ubs
PSV
ZEE
VTP
2015Q1 2016Q1
TWh
OTC Bilateral OTC Cleared Exchange Execution
26
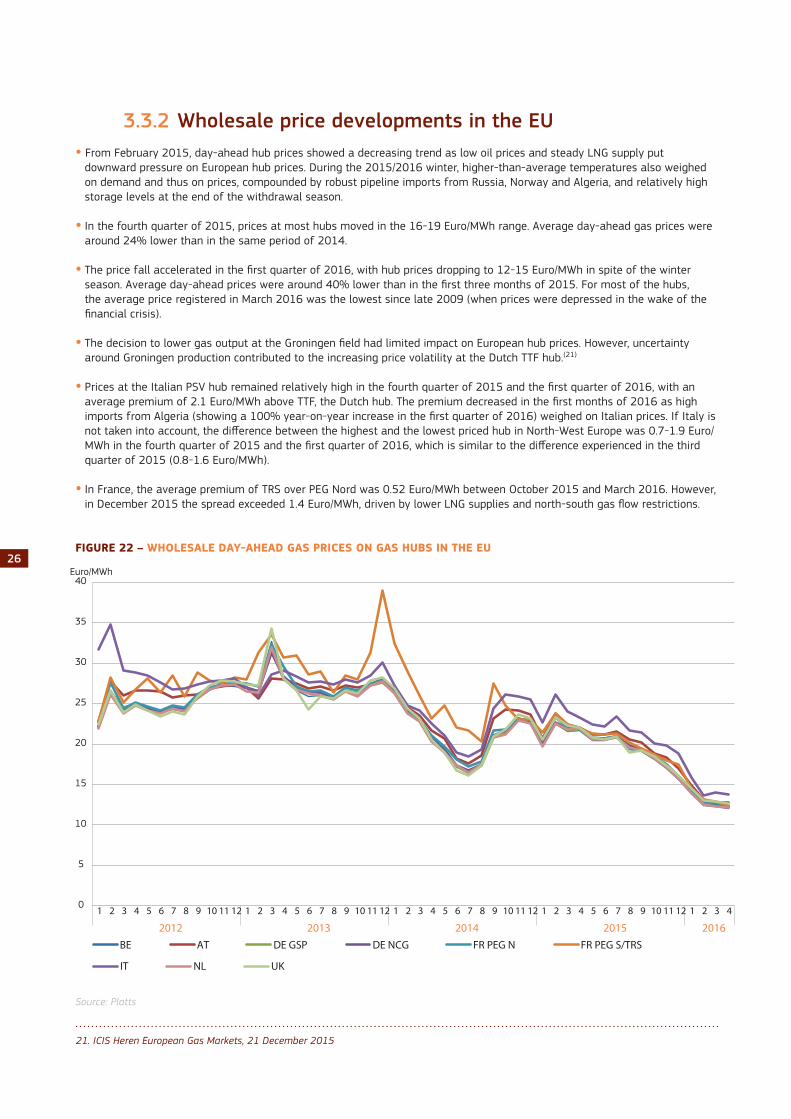
3.3.2 Wholesale price developments in the EU• From February 2015, day-ahead hub prices showed a decreasing trend as low oil prices and steady LNG supply put
downward pressure on European hub prices. During the 2015/2016 winter, higher-than-average temperatures also weighed on demand and thus on prices, compounded by robust pipeline imports from Russia, Norway and Algeria, and relatively high storage levels at the end of the withdrawal season.
• In the fourth quarter of 2015, prices at most hubs moved in the 16-19 Euro/MWh range. Average day-ahead gas prices were around 24% lower than in the same period of 2014.
• The price fall accelerated in the first quarter of 2016, with hub prices dropping to 12-15 Euro/MWh in spite of the winter season. Average day-ahead prices were around 40% lower than in the first three months of 2015. For most of the hubs, the average price registered in March 2016 was the lowest since late 2009 (when prices were depressed in the wake of the financial crisis).
• The decision to lower gas output at the Groningen field had limited impact on European hub prices. However, uncertainty around Groningen production contributed to the increasing price volatility at the Dutch TTF hub.(21)
• Prices at the Italian PSV hub remained relatively high in the fourth quarter of 2015 and the first quarter of 2016, with an average premium of 2.1 Euro/MWh above TTF, the Dutch hub. The premium decreased in the first months of 2016 as high imports from Algeria (showing a 100% year-on-year increase in the first quarter of 2016) weighed on Italian prices. If Italy is not taken into account, the difference between the highest and the lowest priced hub in North-West Europe was 0.7-1.9 Euro/MWh in the fourth quarter of 2015 and the first quarter of 2016, which is similar to the difference experienced in the third quarter of 2015 (0.8-1.6 Euro/MWh).
• In France, the average premium of TRS over PEG Nord was 0.52 Euro/MWh between October 2015 and March 2016. However, in December 2015 the spread exceeded 1.4 Euro/MWh, driven by lower LNG supplies and north-south gas flow restrictions.
FIGURE 22 – WHOLESALE DAY-AHEAD GAS PRICES ON GAS HUBS IN THE EU
Source: Platts
0
5
10
15
20
25
30
35
40
1 2 3 4 5 6 7 8 9 10 11 12 1 2 3 4 5 6 7 8 9 10 11 12 1 2 3 4 5 6 7 8 9 10 11 12 1 2 3 4 5 6 7 8 9 10 11 12 1 2 3 4
2012 2013 2014 2015 2016
Euro/MWh
BE AT DE GSP DE NCG FR PEG N FR PEG S/TRS
IT NL UK
21. ICIS Heren European Gas Markets, 21 December 2015
27
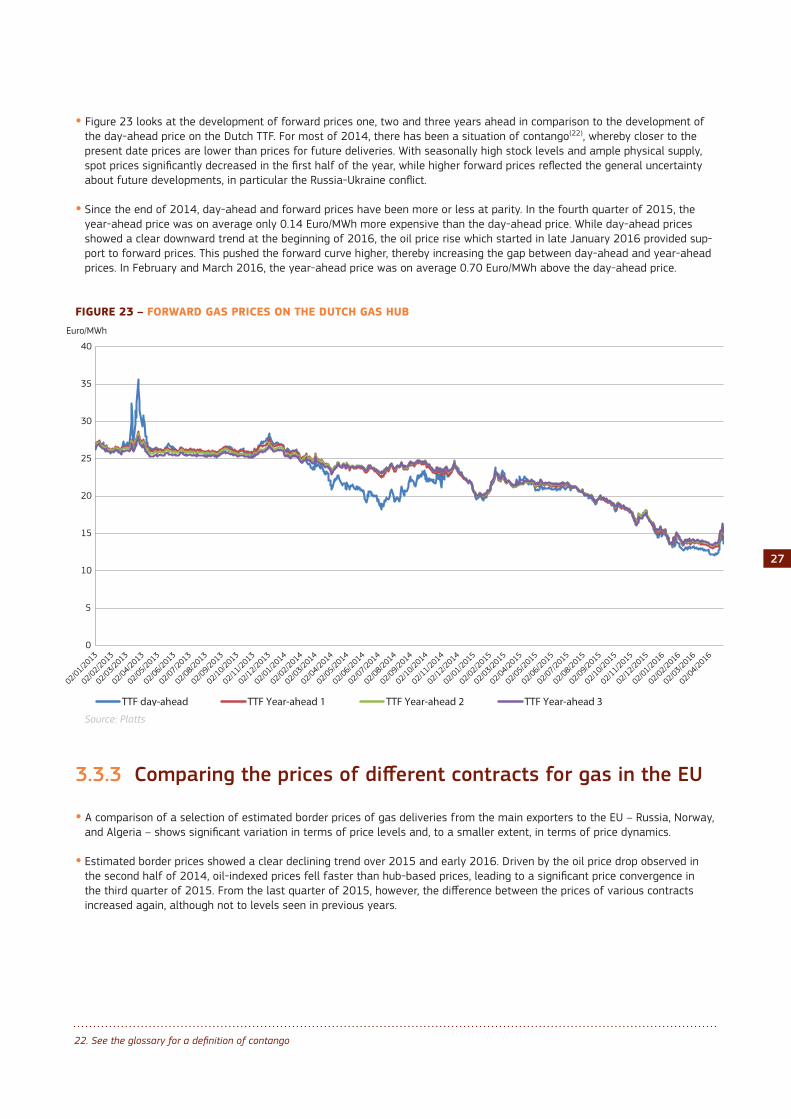
• Figure 23 looks at the development of forward prices one, two and three years ahead in comparison to the development of the day-ahead price on the Dutch TTF. For most of 2014, there has been a situation of contango(22), whereby closer to the present date prices are lower than prices for future deliveries. With seasonally high stock levels and ample physical supply, spot prices significantly decreased in the first half of the year, while higher forward prices reflected the general uncertainty about future developments, in particular the Russia-Ukraine conflict.
• Since the end of 2014, day-ahead and forward prices have been more or less at parity. In the fourth quarter of 2015, the year-ahead price was on average only 0.14 Euro/MWh more expensive than the day-ahead price. While day-ahead prices showed a clear downward trend at the beginning of 2016, the oil price rise which started in late January 2016 provided sup-port to forward prices. This pushed the forward curve higher, thereby increasing the gap between day-ahead and year-ahead prices. In February and March 2016, the year-ahead price was on average 0.70 Euro/MWh above the day-ahead price.
FIGURE 23 – FORWARD GAS PRICES ON THE DUTCH GAS HUB
Source: Platts
3.3.3 ComparingthepricesofdifferentcontractsforgasintheEU
• A comparison of a selection of estimated border prices of gas deliveries from the main exporters to the EU – Russia, Norway, and Algeria – shows significant variation in terms of price levels and, to a smaller extent, in terms of price dynamics.
• Estimated border prices showed a clear declining trend over 2015 and early 2016. Driven by the oil price drop observed in the second half of 2014, oil-indexed prices fell faster than hub-based prices, leading to a significant price convergence in the third quarter of 2015. From the last quarter of 2015, however, the difference between the prices of various contracts increased again, although not to levels seen in previous years.
0
5
10
15
20
25
30
35
40
Euro/MWh
TTF day-ahead TTF Year-ahead 1 TTF Year-ahead 2 TTF Year-ahead 3
22. See the glossary for a definition of contango
28
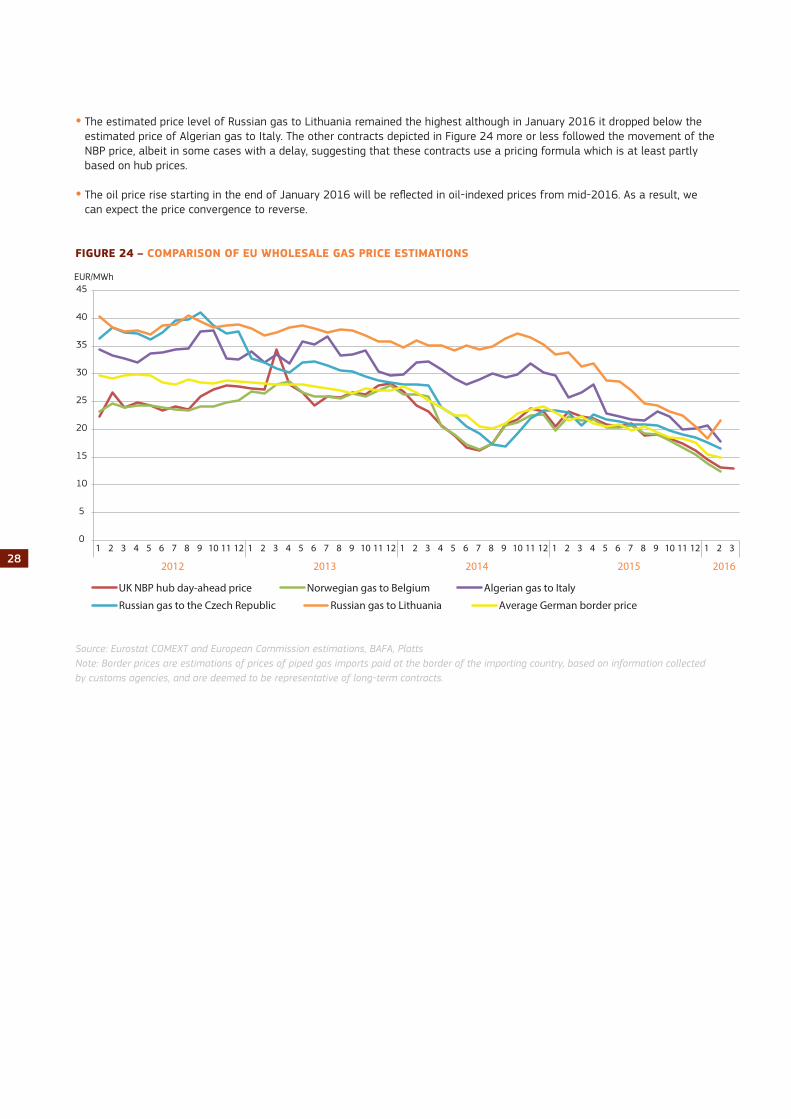
• The estimated price level of Russian gas to Lithuania remained the highest although in January 2016 it dropped below the estimated price of Algerian gas to Italy. The other contracts depicted in Figure 24 more or less followed the movement of the NBP price, albeit in some cases with a delay, suggesting that these contracts use a pricing formula which is at least partly based on hub prices.
• The oil price rise starting in the end of January 2016 will be reflected in oil-indexed prices from mid-2016. As a result, we can expect the price convergence to reverse.
FIGURE 24 – COMPARISON OF EU WHOLESALE GAS PRICE ESTIMATIONS
Source: Eurostat COMEXT and European Commission estimations, BAFA, PlattsNote: Border prices are estimations of prices of piped gas imports paid at the border of the importing country, based on information collected by customs agencies, and are deemed to be representative of long-term contracts.
0
5
10
15
20
25
30
35
40
45
1 2 3 4 5 6 7 8 9 10 11 12 1 2 3 4 5 6 7 8 9 10 11 12 1 2 3 4 5 6 7 8 9 10 11 12 1 2 3 4 5 6 7 8 9 10 11 12 1 2 3
2012 2013 2014 2015 2016
EUR/MWh
UK NBP hub day-ahead price Norwegian gas to Belgium Algerian gas to Italy
Russian gas to the Czech Republic Russian gas to Lithuania Average German border price
29
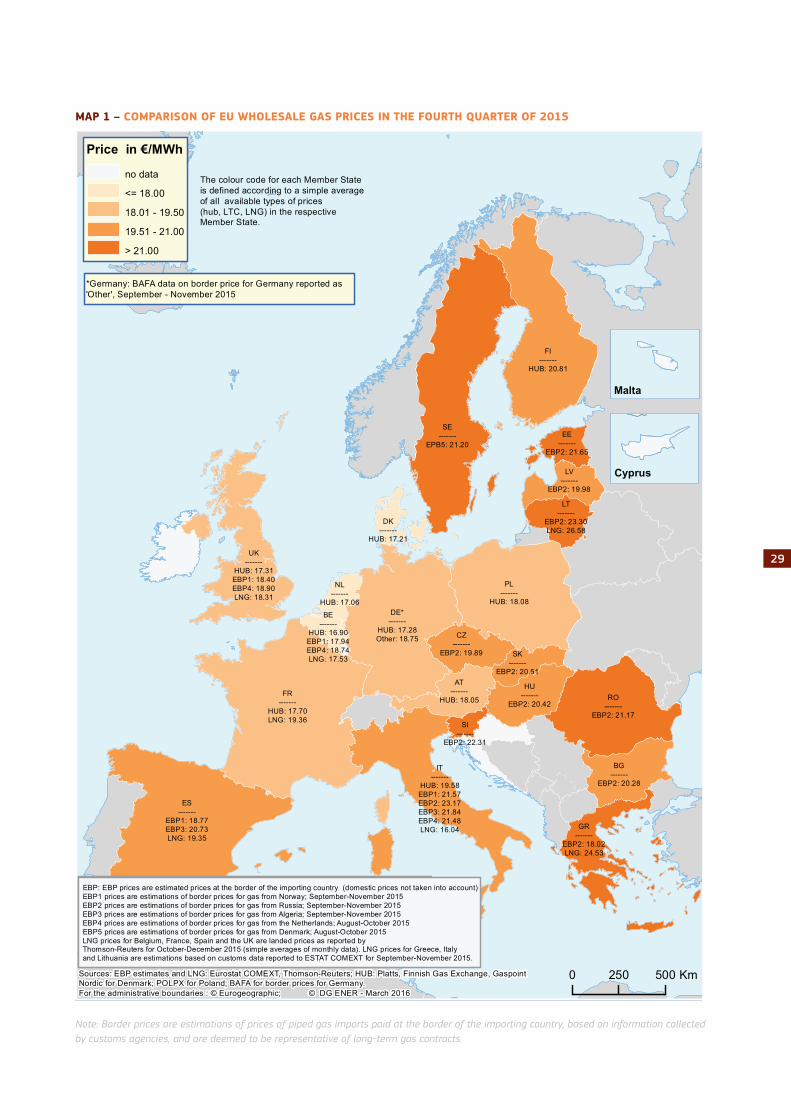
MAP 1 – COMPARISON OF EU WHOLESALE GAS PRICES IN THE FOURTH QUARTER OF 2015
Note: Border prices are estimations of prices of piped gas imports paid at the border of the importing country, based on information collected by customs agencies, and are deemed to be representative of long-term gas contracts.
BE-------
HUB: 16.90EBP1: 17.94EBP4: 18.74LNG: 17.53
NL-------
HUB: 17.06
EE-------
EBP2: 21.65
SK-------
EBP2: 20.51
GR-------
EBP2: 18.02LNG: 24.53
LV-------
EBP2: 19.98
IT-------
HUB: 19.58EBP1: 21.57EBP2: 23.17EBP3: 21.84EBP4: 21.48LNG: 16.04
UK-------
HUB: 17.31EBP1: 18.40EBP4: 18.90LNG: 18.31
LT-------
EBP2: 23.30LNG: 26.58
CZ-------
EBP2: 19.89
AT-------
HUB: 18.05
HU-------
EBP2: 20.42
BG-------
EBP2: 20.28
RO-------
EBP2: 21.17
PL-------
HUB: 18.08
ES-------
EBP1: 18.77EBP3: 20.73LNG: 19.35
DE*-------
HUB: 17.28Other: 18.75
FR-------
HUB: 17.70LNG: 19.36 SI
-------EBP2: 22.31
DK-------
HUB: 17.21
0 250 500 Km
Malta
Cyprus
Price in €/MWh
<= 18.00
18.01 - 19.50
19.51 - 21.00
> 21.00
no data The colour code for each Member Stateis defined according to a simple averageof all available types of prices (hub, LTC, LNG) in the respective Member State.
FI-------
HUB: 20.81
SE-------
EPB5: 21.20
Comparison of EU average wholesale gas prices during the fourth quarter of 2015
EBP: EBP prices are estimated border prices (domestic prices not taken into account)EBP1 prices are estimations of border prices for gas from Norway; June-August 2014EBP2 prices are estimations of border prices for gas from Russia; June-August 2014 EBP3 prices are estimations of border prices for gas from Algeria; June-August 2014EBP4 prices are estimations of border prices for gas from the Netherlands; May-July 2014 EBP5 prices are estimations of border prices for gas from Denmark; May-July 2014. LNG prices for Belgium, France, Spain and the UK are landed prices as reported by Thomson-Reuters for July-September 2014 (simple averages of monthly data). LNG prices for Greece and Italy are estimations based on customs data reported to ESTAT COMEXT for first four months of 2014. Portugal not reported due to missing data in ESTAT COMEXT since October 2013.
Sources: EBP estimates and LNG: Eurostat COMEXT, Thomson-Reuters; HUB: Platts, Finnish Gas Exchange, GaspointNordic for Denmark; POLPX for Poland; BAFA for border prices for Germany.For the administrative boundaries : © Eurogeographic; © DG ENER - March 2016
EBP: EBP prices are estimated prices at the border of the importing country (domestic prices not taken into account)EBP1 prices are estimations of border prices for gas from Norway; September-November 2015EBP2 prices are estimations of border prices for gas from Russia; September-November 2015 EBP3 prices are estimations of border prices for gas from Algeria; September-November 2015EBP4 prices are estimations of border prices for gas from the Netherlands; August-October 2015 EBP5 prices are estimations of border prices for gas from Denmark; August-October 2015 LNG prices for Belgium, France, Spain and the UK are landed prices as reported by Thomson-Reuters for October-December 2015 (simple averages of monthly data). LNG prices for Greece, Italyand Lithuania are estimations based on customs data reported to ESTAT COMEXT for September-November 2015.
*Germany: BAFA data on border price for Germany reported as'Other', September - November 2015
30
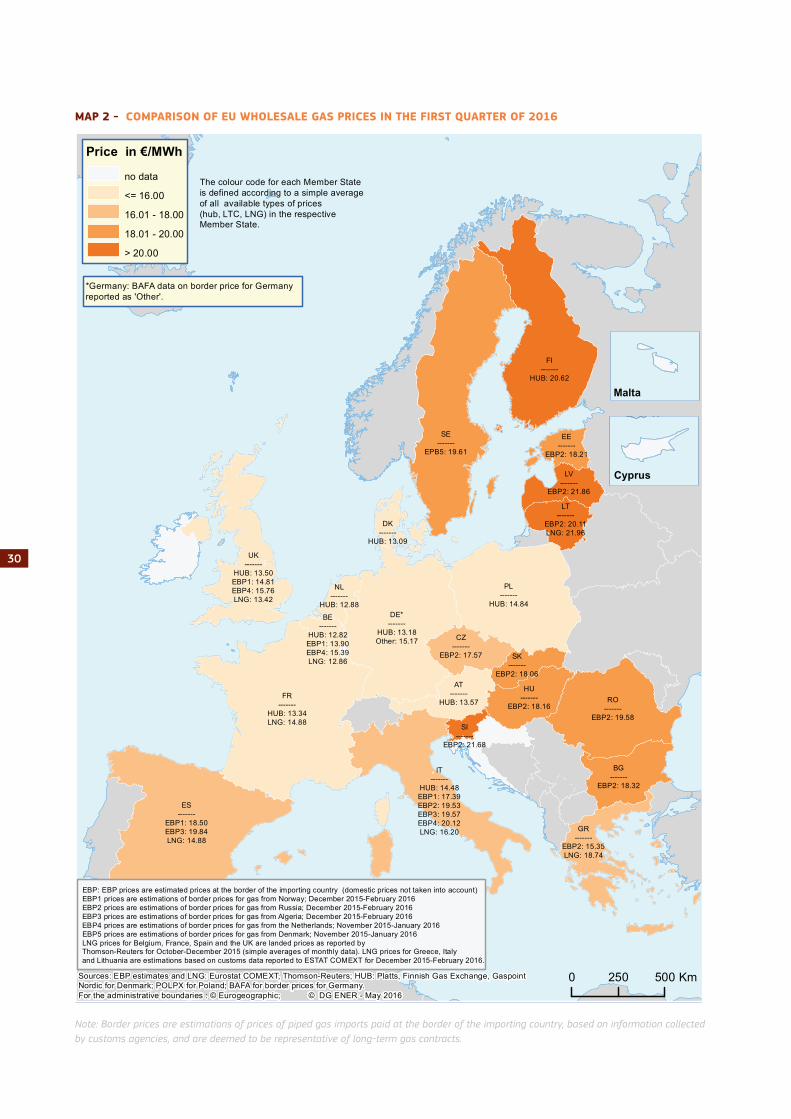
MAP 2 - COMPARISON OF EU WHOLESALE GAS PRICES IN THE FIRST QUARTER OF 2016
Note: Border prices are estimations of prices of piped gas imports paid at the border of the importing country, based on information collected by customs agencies, and are deemed to be representative of long-term gas contracts.
BE-------
HUB: 12.82EBP1: 13.90EBP4: 15.39LNG: 12.86
NL-------
HUB: 12.88
EE-------
EBP2: 18.21
SK-------
EBP2: 18.06
GR-------
EBP2: 15.35LNG: 18.74
LV-------
EBP2: 21.86
IT-------
HUB: 14.48EBP1: 17.39EBP2: 19.53EBP3: 19.57EBP4: 20.12LNG: 16.20
UK-------
HUB: 13.50EBP1: 14.81EBP4: 15.76LNG: 13.42
LT-------
EBP2: 20.11LNG: 21.96
CZ-------
EBP2: 17.57
AT-------
HUB: 13.57
HU-------
EBP2: 18.16
BG-------
EBP2: 18.32
RO-------
EBP2: 19.58
PL-------
HUB: 14.84
ES-------
EBP1: 18.50EBP3: 19.84LNG: 14.88
DE*-------
HUB: 13.18Other: 15.17
FR-------
HUB: 13.34LNG: 14.88 SI
-------EBP2: 21.68
DK-------
HUB: 13.09
0 250 500 Km
Malta
Cyprus
Price in €/MWh
<= 16.00
16.01 - 18.00
18.01 - 20.00
> 20.00
no data The colour code for each Member Stateis defined according to a simple averageof all available types of prices (hub, LTC, LNG) in the respective Member State.
FI-------
HUB: 20.62
SE-------
EPB5: 19.61
Comparison of EU average wholesale gas prices during the first quarter of 2016
EBP: EBP prices are estimated border prices (domestic prices not taken into account)EBP1 prices are estimations of border prices for gas from Norway; June-August 2014EBP2 prices are estimations of border prices for gas from Russia; June-August 2014 EBP3 prices are estimations of border prices for gas from Algeria; June-August 2014EBP4 prices are estimations of border prices for gas from the Netherlands; May-July 2014 EBP5 prices are estimations of border prices for gas from Denmark; May-July 2014. LNG prices for Belgium, France, Spain and the UK are landed prices as reported by Thomson-Reuters for July-September 2014 (simple averages of monthly data). LNG prices for Greece and Italy are estimations based on customs data reported to ESTAT COMEXT for first four months of 2014. Portugal not reported due to missing data in ESTAT COMEXT since October 2013.
Sources: EBP estimates and LNG: Eurostat COMEXT, Thomson-Reuters; HUB: Platts, Finnish Gas Exchange, GaspointNordic for Denmark; POLPX for Poland; BAFA for border prices for Germany.For the administrative boundaries : © Eurogeographic; © DG ENER - May 2016
EBP: EBP prices are estimated prices at the border of the importing country (domestic prices not taken into account)EBP1 prices are estimations of border prices for gas from Norway; December 2015-February 2016EBP2 prices are estimations of border prices for gas from Russia; December 2015-February 2016 EBP3 prices are estimations of border prices for gas from Algeria; December 2015-February 2016EBP4 prices are estimations of border prices for gas from the Netherlands; November 2015-January 2016EBP5 prices are estimations of border prices for gas from Denmark; November 2015-January 2016LNG prices for Belgium, France, Spain and the UK are landed prices as reported by Thomson-Reuters for October-December 2015 (simple averages of monthly data). LNG prices for Greece, Italyand Lithuania are estimations based on customs data reported to ESTAT COMEXT for December 2015-February 2016.
*Germany: BAFA data on border price for Germanyreported as 'Other'.

32
4. Retail gas prices in the EU
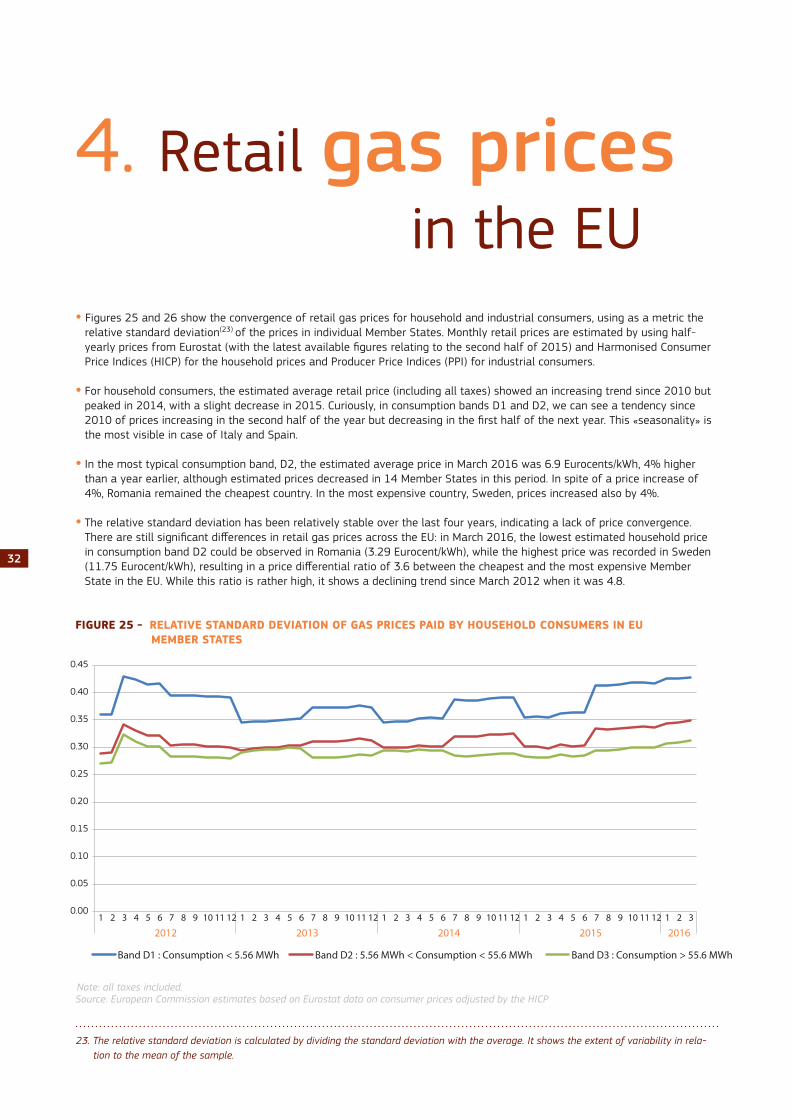
• Figures 25 and 26 show the convergence of retail gas prices for household and industrial consumers, using as a metric the relative standard deviation(23) of the prices in individual Member States. Monthly retail prices are estimated by using half-yearly prices from Eurostat (with the latest available figures relating to the second half of 2015) and Harmonised Consumer Price Indices (HICP) for the household prices and Producer Price Indices (PPI) for industrial consumers.
• For household consumers, the estimated average retail price (including all taxes) showed an increasing trend since 2010 but peaked in 2014, with a slight decrease in 2015. Curiously, in consumption bands D1 and D2, we can see a tendency since 2010 of prices increasing in the second half of the year but decreasing in the first half of the next year. This «seasonality» is the most visible in case of Italy and Spain.
• In the most typical consumption band, D2, the estimated average price in March 2016 was 6.9 Eurocents/kWh, 4% higher than a year earlier, although estimated prices decreased in 14 Member States in this period. In spite of a price increase of 4%, Romania remained the cheapest country. In the most expensive country, Sweden, prices increased also by 4%.
• The relative standard deviation has been relatively stable over the last four years, indicating a lack of price convergence. There are still significant differences in retail gas prices across the EU: in March 2016, the lowest estimated household price in consumption band D2 could be observed in Romania (3.29 Eurocent/kWh), while the highest price was recorded in Sweden (11.75 Eurocent/kWh), resulting in a price differential ratio of 3.6 between the cheapest and the most expensive Member State in the EU. While this ratio is rather high, it shows a declining trend since March 2012 when it was 4.8.
FIGURE 25 - RELATIVE STANDARD DEVIATION OF GAS PRICES PAID BY HOUSEHOLD CONSUMERS IN EU MEMBER STATES
Note: all taxes included. Source: European Commission estimates based on Eurostat data on consumer prices adjusted by the HICP
0.00
0.05
0.10
0.15
0.20
0.25
0.30
0.35
0.40
0.45
1 2 3 4 5 6 7 8 9 10 11 12 1 2 3 4 5 6 7 8 9 10 11 12 1 2 3 4 5 6 7 8 9 10 11 12 1 2 3 4 5 6 7 8 9 10 11 12 1 2 3
2012 2013 2014 2015 2016
Band D1 : Consumption < 5.56 MWh Band D2 : 5.56 MWh < Consumption < 55.6 MWh Band D3 : Consumption > 55.6 MWh
23. The relative standard deviation is calculated by dividing the standard deviation with the average. It shows the extent of variability in rela-tion to the mean of the sample.
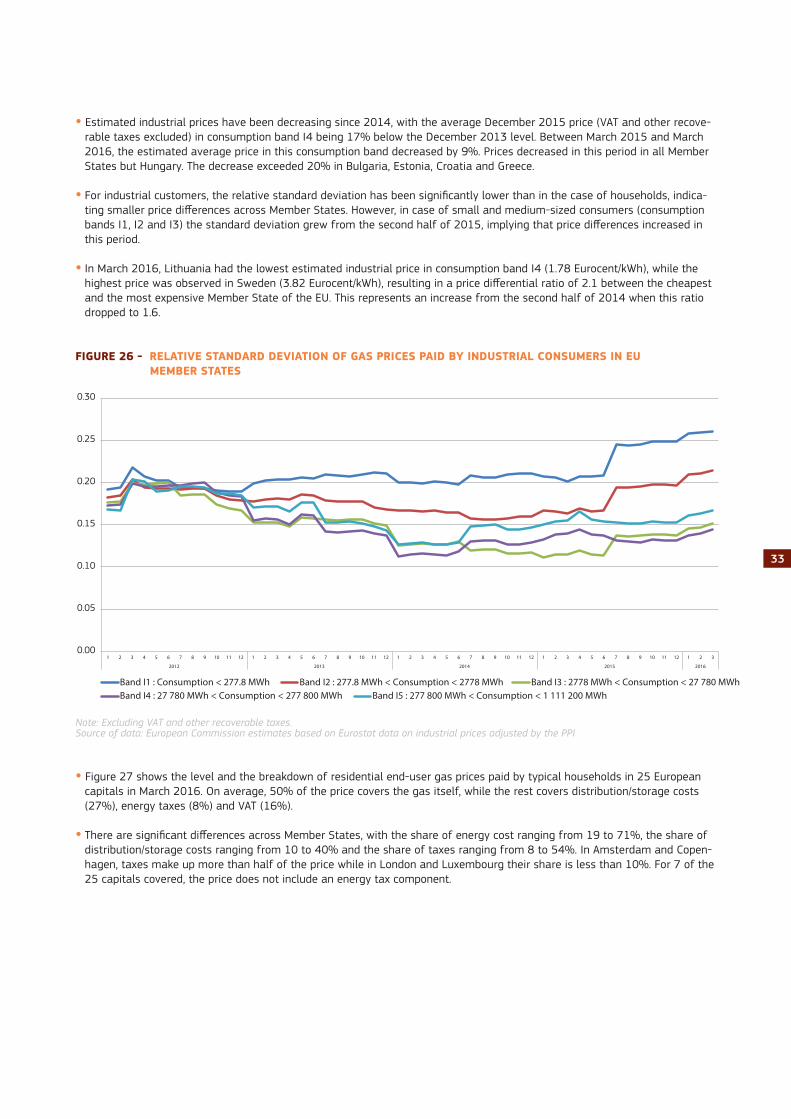
33
0.00
0.05
0.10
0.15
0.20
0.25
0.30
1 2 3 4 5 6 7 8 9 10 11 12 1 2 3 4 5 6 7 8 9 10 11 12 1 2 3 4 5 6 7 8 9 10 11 12 1 2 3 4 5 6 7 8 9 10 11 12 1 2 3
2012 2013 2014 2015 2016
Band I1 : Consumption < 277.8 MWh Band I2 : 277.8 MWh < Consumption < 2778 MWh Band I3 : 2778 MWh < Consumption < 27 780 MWhBand I4 : 27 780 MWh < Consumption < 277 800 MWh Band I5 : 277 800 MWh < Consumption < 1 111 200 MWh
• Estimated industrial prices have been decreasing since 2014, with the average December 2015 price (VAT and other recove-rable taxes excluded) in consumption band I4 being 17% below the December 2013 level. Between March 2015 and March 2016, the estimated average price in this consumption band decreased by 9%. Prices decreased in this period in all Member States but Hungary. The decrease exceeded 20% in Bulgaria, Estonia, Croatia and Greece.
• For industrial customers, the relative standard deviation has been significantly lower than in the case of households, indica-ting smaller price differences across Member States. However, in case of small and medium-sized consumers (consumption bands I1, I2 and I3) the standard deviation grew from the second half of 2015, implying that price differences increased in this period.
• In March 2016, Lithuania had the lowest estimated industrial price in consumption band I4 (1.78 Eurocent/kWh), while the highest price was observed in Sweden (3.82 Eurocent/kWh), resulting in a price differential ratio of 2.1 between the cheapest and the most expensive Member State of the EU. This represents an increase from the second half of 2014 when this ratio dropped to 1.6.
FIGURE 26 - RELATIVE STANDARD DEVIATION OF GAS PRICES PAID BY INDUSTRIAL CONSUMERS IN EU MEMBER STATES
Note: Excluding VAT and other recoverable taxes. Source of data: European Commission estimates based on Eurostat data on industrial prices adjusted by the PPI
• Figure 27 shows the level and the breakdown of residential end-user gas prices paid by typical households in 25 European capitals in March 2016. On average, 50% of the price covers the gas itself, while the rest covers distribution/storage costs (27%), energy taxes (8%) and VAT (16%).
• There are significant differences across Member States, with the share of energy cost ranging from 19 to 71%, the share of distribution/storage costs ranging from 10 to 40% and the share of taxes ranging from 8 to 54%. In Amsterdam and Copen-hagen, taxes make up more than half of the price while in London and Luxembourg their share is less than 10%. For 7 of the 25 capitals covered, the price does not include an energy tax component.
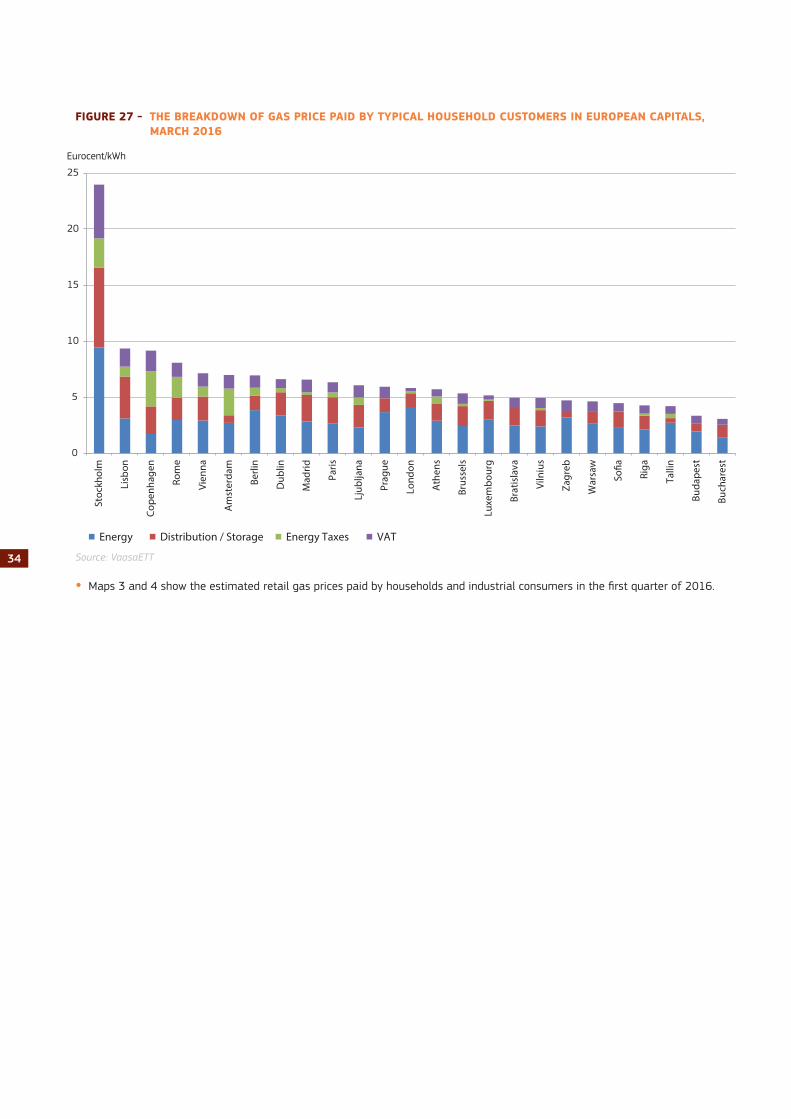
34
FIGURE 27 - THE BREAKDOWN OF GAS PRICE PAID BY TYPICAL HOUSEHOLD CUSTOMERS IN EUROPEAN CAPITALS, MARCH 2016
Source: VaasaETT
• Maps 3 and 4 show the estimated retail gas prices paid by households and industrial consumers in the first quarter of 2016.
0
5
10
15
20
25
Stoc
khol
m
Lisb
on
Cope
nhag
en
Rom
e
Vien
na
Am
ster
dam
Berli
n
Dub
lin
Mad
rid
Paris
Ljub
ljana
Prag
ue
Lond
on
Ath
ens
Brus
sels
Luxe
mbo
urg
Brat
isla
va
Viln
ius
Zagr
eb
War
saw
So�a
Riga
Talli
n
Buda
pest
Buch
ares
t
Eurocent/kWh
Energy Distribution / Storage Energy Taxes VAT
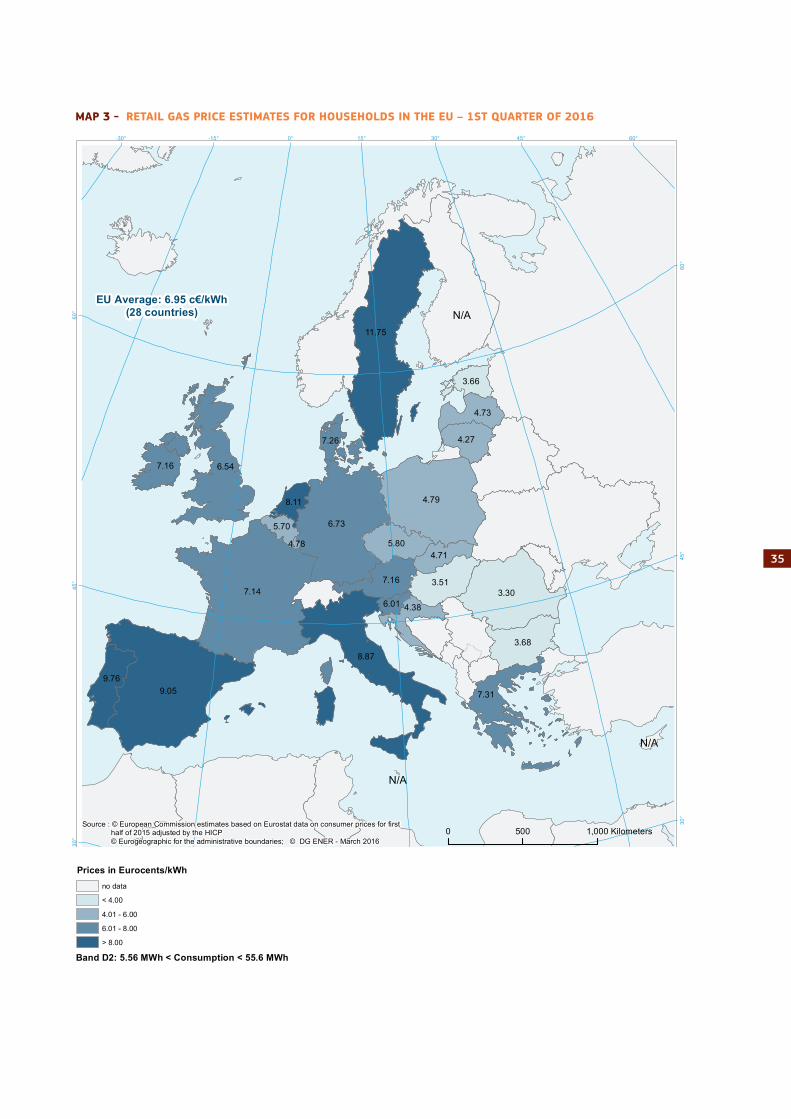
35
MAP 3 - RETAIL GAS PRICE ESTIMATES FOR HOUSEHOLDS IN THE EU – 1ST QUARTER OF 2016
7.14
9.05
11.75
6.73
4.79
8.87
3.30
6.54
3.68
3.51
9.76
7.31
7.16
5.80
7.16
4.27
4.73
4.38
4.71
3.66
8.11
5.70
7.26
6.01
4.78
60°45°
30°
30°
15°
15°
0°
0°-15°-30°
60°
60°
45°
45°
30°
30°
0 500 1,000 Kilometers
Energy
EU Average: 6.95 c€/kWh(28 countries)
N/A
N/A
Source : © European Commission estimates based on Eurostat data on consumer prices for first half of 2015 adjusted by the HICP © Eurogeographic for the administrative boundaries; © DG ENER - March 2016
N/A
GAS PRICES FOR DOMESTIC CONSUMERSEstimates for the first quarter of 2016
Including all taxes and levies
Prices in Eurocents/kWh
< 4.00
4.01 - 6.00
6.01 - 8.00
> 8.00
no data
Band D2: 5.56 MWh < Consumption < 55.6 MWh
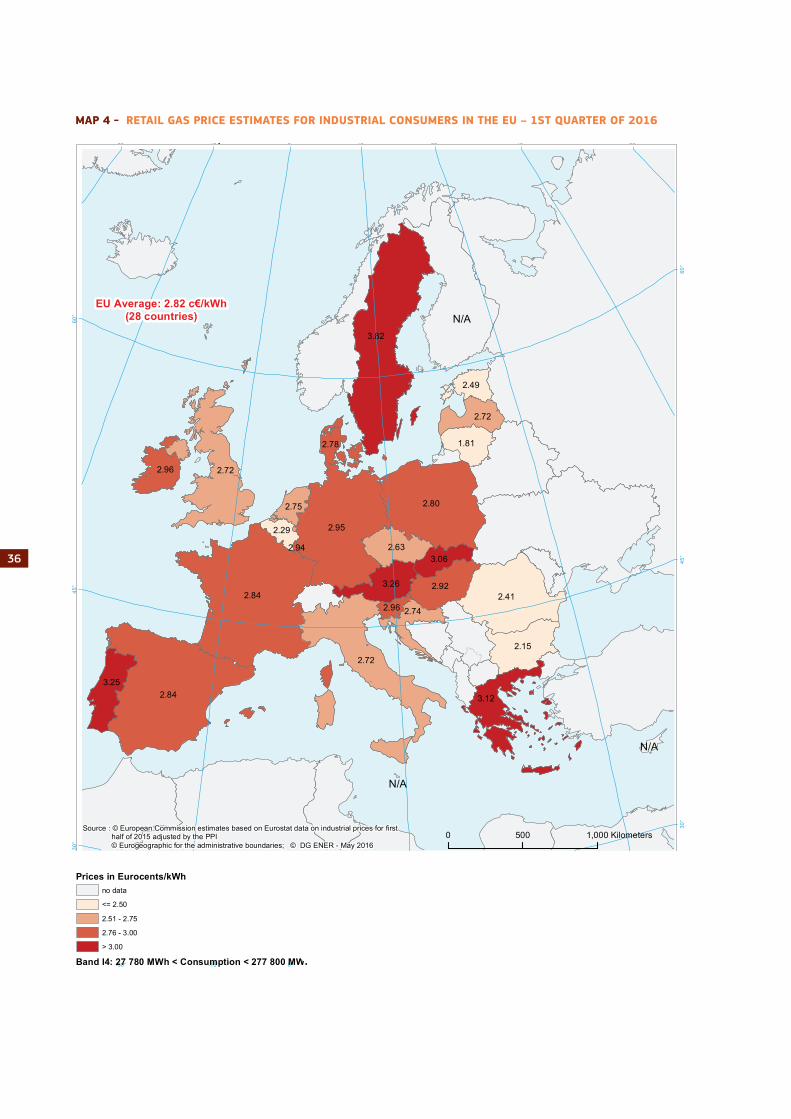
36
MAP 4 - RETAIL GAS PRICE ESTIMATES FOR INDUSTRIAL CONSUMERS IN THE EU – 1ST QUARTER OF 2016
2.84
2.84
3.82
2.95
2.80
2.72
2.41
2.72
2.15
2.92
3.25
3.12
3.26
2.63
2.96
1.81
2.72
2.74
3.06
2.49
2.75
2.29
2.78
2.96
2.94
60°45°
30°
30°
15°
15°
0°
0°-15°-30°
60°
60°
45°
45°
30°
30°
Source : © European Commission estimates based on Eurostat data on industrial prices for first half of 2015 adjusted by the PPI © Eurogeographic for the administrative boundaries; © DG ENER - May 2016
0 500 1,000 Kilometers
Energy
N/A
N/A
EU Average: 2.82 c€/kWh(28 countries) N/A
GAS PRICES FOR INDUSTRIAL CONSUMERSEstimates for the first quarter of 2016
Excluding VAT (value added tax) and other recoverable taxes
Prices in Eurocents/kWh
<= 2.50
2.51 - 2.75
2.76 - 3.00
> 3.00
no data
Band I4: 27 780 MWh < Consumption < 277 800 MWh
2.84
2.84
3.82
2.95
2.80
2.72
2.41
2.72
2.15
2.92
3.25
3.12
3.26
2.63
2.96
1.81
2.72
2.74
3.06
2.49
2.75
2.29
2.78
2.96
2.94
60°45°
30°
30°
15°
15°
0°
0°-15°-30°
60°
60°
45°
45°
30°
30°
Source : © European Commission estimates based on Eurostat data on industrial prices for first half of 2015 adjusted by the PPI © Eurogeographic for the administrative boundaries; © DG ENER - May 2016
0 500 1,000 Kilometers
Energy
N/A
N/A
EU Average: 2.82 c€/kWh(28 countries) N/A
GAS PRICES FOR INDUSTRIAL CONSUMERSEstimates for the first quarter of 2016
Excluding VAT (value added tax) and other recoverable taxes
Prices in Eurocents/kWh
<= 2.50
2.51 - 2.75
2.76 - 3.00
> 3.00
no data
Band I4: 27 780 MWh < Consumption < 277 800 MWh

38
5. GlossaryBackwardation occurs when the closer-to-maturity contract is priced higher than the contract which matures at a later stage
Clean dark spreads are defined as the average difference between the price of coal and carbon emission, and the equivalent price of electricity. Dark spreads are reported as indicative prices giving the average difference between the cost of coal deli-vered ex-ship and the power price. As such, they do not include operation, maintenance or transport costs. Spreads are defined for a coal-fired plant with 35 % efficiency. Dark spreads are given for UK and Germany, with the coal and power reference price as reported by Platts.
Clean spark spreads are defined as the average difference between the cost of gas and emissions, and the equivalent price of electricity. Spark spreads are indicative prices showing the average difference between the cost of gas delivered on the gas transmission system and the power price. As such, they do not include operation, maintenance or transport costs. The spark spreads are calculated for gas-fired plants with standard efficiencies of 50% and 60%. This report uses the 50% efficiency. Spreads are quoted for the UK, German and Benelux markets.
Contango: A situation of contango arises in the when the closer to maturity contract has a lower price than the contract which is longer to maturity on the forward curve.
Flow against price differentials (FAPDs): By combining daily price and flow data, Flow Against Price Differentials (FAPDs) are designed to give a measure of the consistency of economic decisions of market participants in the context of close to real time operation of natural gas systems. With the closure of the day-ahead markets (D-1), the price for delivering gas in a given hub on day D is known by market participants. Based on price information for adjacent areas, market participants can establish price differentials. Later in D-1, market participants also nominate commercial schedules for day D. An event labelled as an FAPD occurs when commercial nominations for cross border capacities are such that gas is set to flow from a higher price area to a lower price area. The FAPD event is defined by the minimum threshold of price difference under which no FAPD is recorded. The minimum threshold for gas is set at 0.5 €/MWh. After the day ahead market closes, market participants still have the opportunity to level off their positions on the balancing market. That is why a high level of FAPD does not necessarily equate to irrational behaviour. In addition, it should be noted that close-to real time transactions represent only a fractional amount of the total trade on gas contracts. The FAPD chart provides detailed information on adverse flows. It has two panels: The first panel estimates the ratio of the number of days with adverse flows to the total number of trading days in a given period. It also estimates the monetary value of energy exchanged under adverse flow conditions (mark-up) compared to the total value of energy exchanged across the border. The mark-up is also referred to as «welfare loss». A colour code informs about the relative size of FAPD events in the observed sample, going from green if less than 10% of traded days in a given period are FAPDs to red if more than 50% of the days are FAPDs. The second panel gives the split of FAPDs by sub-category of pre-esta-blished intervals of price differentials. It represents the average exchanged energy and relative importance of each sub-cate-gory on two vertical axes.
Heating degree days (HDDs) express the severity of a meteorological condition for a given area and in a specific time period. HDDs are defined relative to the outdoor temperature and to what is considered as comfortable room temperature. The colder is the weather, the higher is the number of HDDs. These quantitative indices are designed to reflect the demand for energy needed to heat a building.
LNG sendout expresses the amount of gas flowing out of LNG terminals into pipelines.