Embed Size (px)
Citation preview
Quarterly Report December 2012
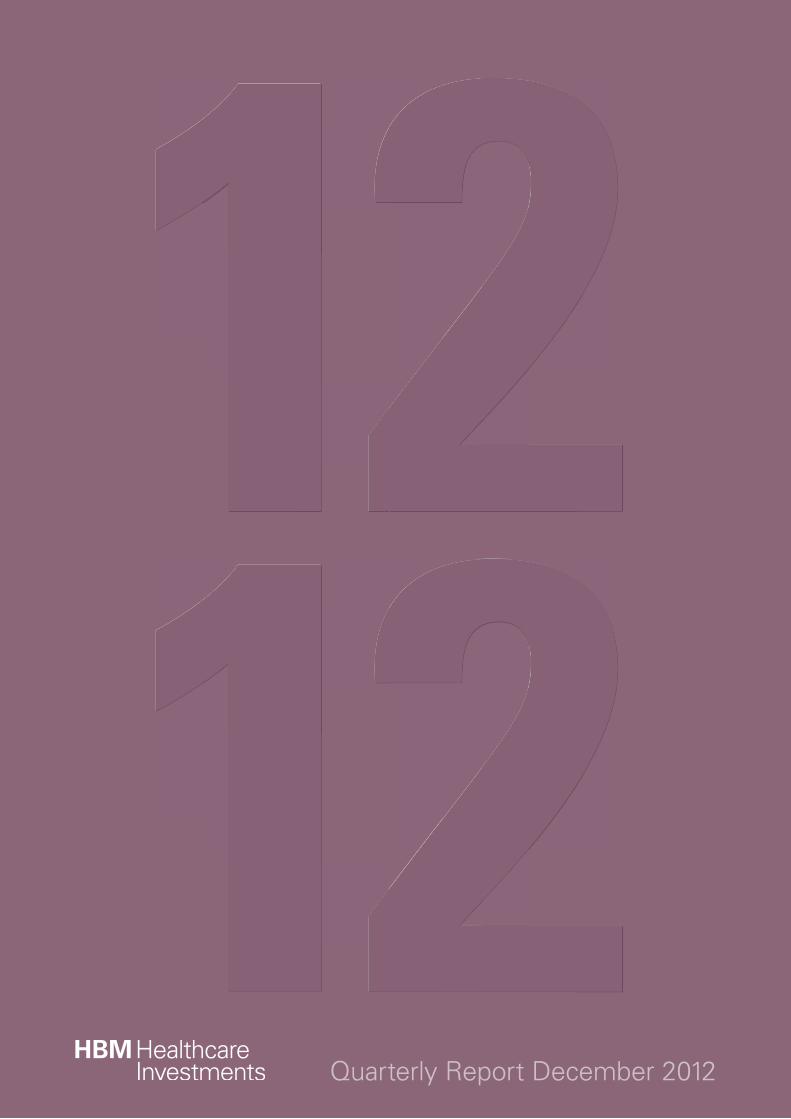
Profile HBM Healthcare Investments invests in the healthcare sector. The Company holds and manages an international portfolio of some twenty-five promising companies in the bio-technology/human medicine, medical tech-nology and diagnostics sectors. Many of these companies have their lead products already available on the market, or at an advanced stage of development. The focus of investment
is on follow-on financing for existing portfolio companies. These portfolio companies are closely tracked and actively guided on their strategic directions. This is what makes HBM Healthcare Investments an interesting alter-native to investing in big pharma and biotech companies. HBM Healthcare Investments has an international shareholder base and is listed on SIX Swiss Exchange (ticker: HBMN).
At a Glance
1) Incl. short-term receivables from sale of portfolio companies. 2) Total investments as at 31.12.2012: CHF 444 million.
Allocation of assets Mainly invested in private companies with high value- creation potential.
Private companies 3
1%
Funds 1
4%
Public companies 4
1%
Other ass
ets 7%
Cash and cash
equivalents
7% 1)
US dollar (U
SD) 61%
Euro (EUR) 9
%
Swiss fra
nc (CHF)
27%
Other curre
ncies (DKK, G
BP, SEK) 3
%
Currency allocation Emphasis on US dollar investments.
Profitable 5%
Products on th
e marke
t 31%
Phase III
44%
Phase II
16%
Phase I 3
%
Preclinical 1
%
Development phase of portfolio companies2)
Largely invested in revenue generating companies or in companies with products in advanced development phase.
Metabolic dise
ases 1
0%
Ophthalmology 5
%
Oncology 3%
Autoimmune dise
ases 7
%
Other 28%
Therapeutic area of the lead productof portfolio companies2)
Broadly diversified areas of activity.
Antiinfectiv
es 36%
Medical technology/d
iagnostics 1
1%HB
M H
ealth
care
Inve
stm
ents
· Q
uart
erly
Rep
ort
Dec
embe
r 20
12
131.
3.200
9
31.3.2
010
31.3.2
011
31.3.2
012
31.12.
2012
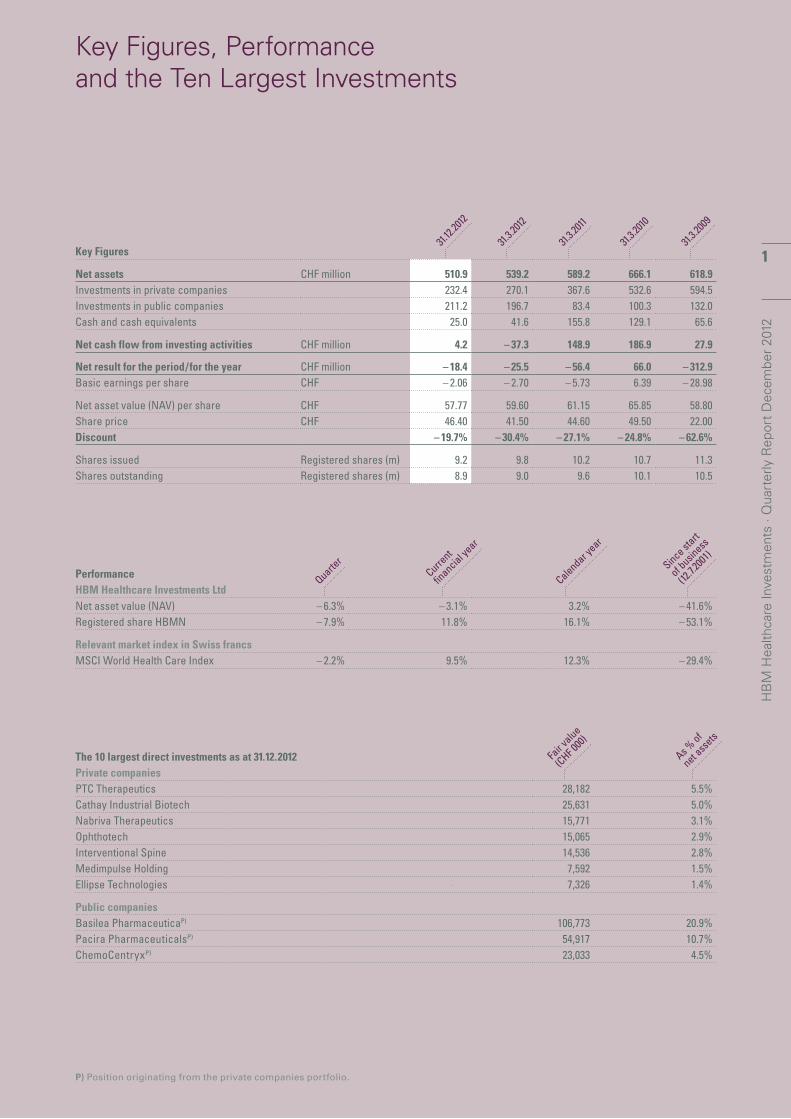
Key Figures
Net assets CHF million 510.9 539.2 589.2 666.1 618.9 Investments in private companies 232.4 270.1 367.6 532.6 594.5 Investments in public companies 211.2 196.7 83.4 100.3 132.0 Cash and cash equivalents 25.0 41.6 155.8 129.1 65.6
Net cash flow from investing activities CHF million 4.2 – 37.3 148.9 186.9 27.9
Net result for the period/for the year CHF million – 18.4 – 25.5 – 56.4 66.0 – 312.9 Basic earnings per share CHF – 2.06 – 2.70 – 5.73 6.39 – 28.98
Net asset value (NAV) per share CHF 57.77 59.60 61.15 65.85 58.80 Share price CHF 46.40 41.50 44.60 49.50 22.00 Discount – 19.7% – 30.4% – 27.1% – 24.8% – 62.6%
Shares issued Registered shares (m) 9.2 9.8 10.2 10.7 11.3 Shares outstanding Registered shares (m) 8.9 9.0 9.6 10.1 10.5
As % of
net ass
ets
Fair v
alue
(CHF 000
)
The 10 largest direct investments as at 31.12.2012
Private companiesPTC Therapeutics 28,182 5.5%Cathay Industrial Biotech 25,631 5.0%Nabriva Therapeutics 15,771 3.1%Ophthotech 15,065 2.9%Interventional Spine 14,536 2.8%Medimpulse Holding 7,592 1.5%Ellipse Technologies 7,326 1.4%
Public companiesBasilea PharmaceuticaP) 106,773 20.9%Pacira PharmaceuticalsP) 54,917 10.7%ChemoCentryxP) 23,033 4.5%
Since start
of busin
ess
(12.7.2
001)
Current
fi nancial y
ear
Calendar year
Quarter
PerformanceHBM Healthcare Investments LtdNet asset value (NAV) – 6.3% – 3.1% 3.2% – 41.6%Registered share HBMN – 7.9% 11.8% 16.1% – 53.1%
Relevant market index in Swiss francsMSCI World Health Care Index – 2.2% 9.5% 12.3% – 29.4%
Key Figures, Performanceand the Ten Largest Investments
1
P) Position originating from the private companies portfolio.
HB
M H
ealth
care
Inve
stm
ents
· Q
uart
erly
Rep
ort
Dec
embe
r 20
12
2
Dear ShareholdersThe last two weeks of the year just ended brought us success and disappointment in quick succession. While Novartis acquired the British portfolio company Vivacta Limited at a price well above our book value in mid-December, we were forced to write down our holding in US company Lux Biosciences in full shortly before the end of the month owing to unsatisfactory results from a key phase-III trial.
Combined with slightly lower share prices for our public portfolio companies, and the modest depreciation of the US dollar against the Swiss franc, these events resulted in a 6.3-percent decline in net asset value (NAV) per share to CHF 57.77 at the end of the quarter.
This compares with a 3.2 percent increase in net asset value per share over the twelve months of calendar 2012. The share price advanced by 16 percent over the same period, to close December at CHF 46.40. Share performance is therefore in line with that of a number of share indices, such as the SMI (+15%), the SPI (+ 14%), and the MSCI World Health Care Index (+ 12% in Swiss franc terms).
Private companiesIn December, Novartis acquired the British diagnostics company Vivacta Limited for a total of USD 90 million. HBM Healthcare Investments had invested around GBP4.1 million in Vivacta since November 2007, and held 17 percent of the company. The sale generated pro-ceeds totalling USD 14.5 million, which is around 2.2 times the capital originally invested.
In October, US research company Nereus Pharma-ceuticals sold one of its two oncology programmes. The company received a USD 17.5 million advance for the deal, and will be entitled over the coming years to success based milestone payments which could be as high as USD 155 million. Nereus was significantly downsized sometime ago. The company is to close completely in early 2013 and will be transferred to a liquidating trust. All of the funds that are currently held in the company, or which will accrue to it in the future from the aforementioned partnership, will be distributed to the shareholders of Nereus.
HBM Healthcare Investments has invested a total of USD 16.1 million in Nereus since 2004, and holds a stake of around 17 percent. The deal resulted in a modest upward revaluation in our holding during the quarter under review, to USD 4.8 million at the end of December 2012. As the company is wound up, HBM Healthcare Investments will receive around USD 2.2 million in cash in the first quarter of 2013. The achievement of future milestones could generate returns of up to a further USD 30 million before the end of the current decade, if the planned studies deliver the target results.
Management Report
“Our investmentin Vivacta returned 20% per year.”
HB
M H
ealth
care
Inve
stm
ents
· Q
uart
erly
Rep
ort
Dec
embe
r 20
12
3
Just before the end of the year, Lux Biosciences suffered a disappointing setback with its primary development candidate LuveniqTM – an agent to treat the non-infectious inflammatory eye disease uveitis. The additional phase-III trial demanded by the US Food and Drug Administration produced a very high placebo response rate, and was thus unable to confirm the positive findings of the initial phase-III trial. This means that he application for regulatory approval for the drug, which was submitted in 2010, cannot be completed successfully at present. The company’s future is now uncertain. HBM Healthcare Investments has booked a value adjustment on its stake in Lux over the amount of USD 24 million.
The valuation of Cylene Pharmaceuticals was also adjusted downward by around USD 2.4 million owing to the conditions which are expected to apply to a forthcoming financing round.
Public companiesThere was little change in HBM Healthcare Investments’ portfolio of public companies during the quarter just ended. The market valuations of Basilea Pharmaceutica and ChemoCentryx each declined by around 6 percent, while those of Pacira Pharma-ceuticals and Swedish Orphan Biovitrum remained more or less the same.
Basilea announced in mid-December that it had completed patient recruitment as planned for a phase-III trial of Isavuconazole®, an anti-fungal agent which is being developed in association with the Japanese company Astellas. The results of the trial are expected in mid-2013.
At Pacira, marketing activities for the long-acting analgesic ExparelTM, which had its market launch in April 2012, are proving as successful as expected.
OutlookThe coming twelve months will see a number of events that will influence the value of HBM Healthcare Investments. In the public portfolio, ChemoCentryx is expecting important study results. Basilea will learn whether or not its Ceftobiprole® antibiotic will be approved for sale in Europe, and is also scheduled to publish phase-III data on Isavu-conazole®. At Pacira, Investors will continue to focus on the sales performance of ExparelTM.
In the private portfolio, the first half of the year will decide whether or not Forest Laboratories will exercise the purchase option for Nabriva Therapeutics. A number of the companies in this portfolio are also well positioned for an IPO or a trade sale.
Dr Andreas Wicki Erwin TroxlerCEO CFO
HB
M H
ealth
care
Inve
stm
ents
· Q
uart
erly
Rep
ort
Dec
embe
r 20
12
4
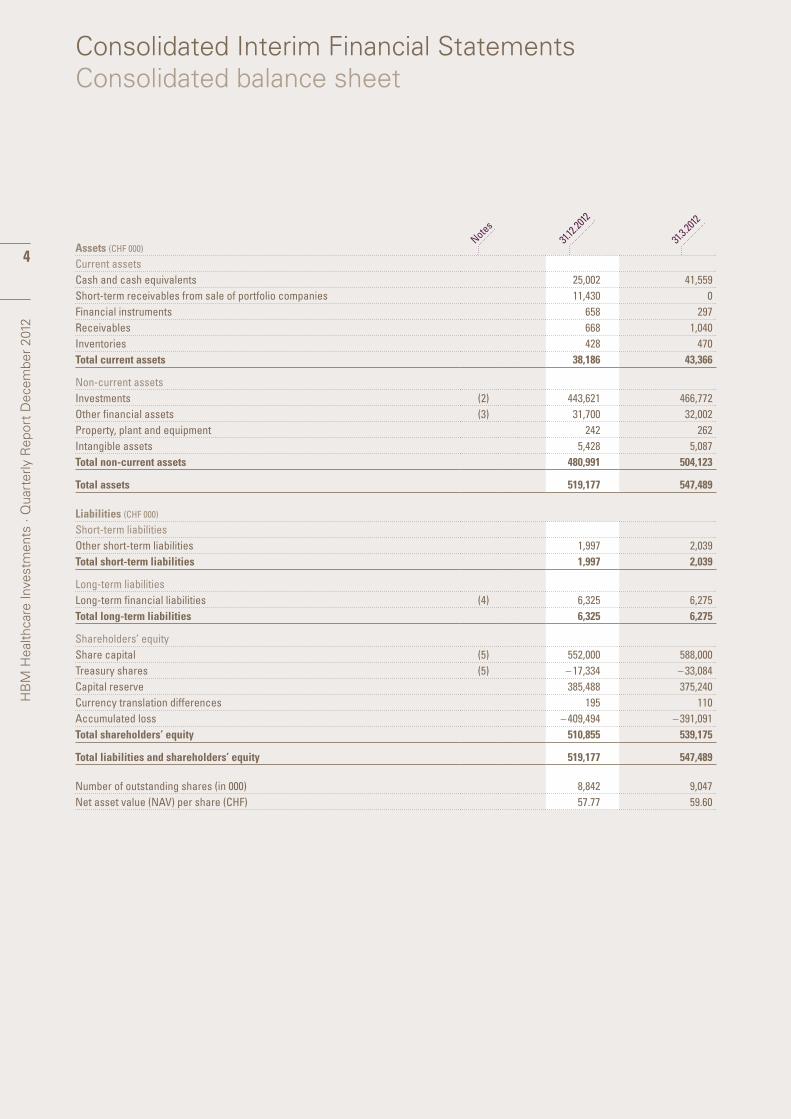
Consolidated Interim Financial StatementsConsolidated balance sheet
Notes31.
12.201
2
31.3.2
012
Assets (CHF 000)
Current assetsCash and cash equivalents 25,002 41,559Short-term receivables from sale of portfolio companies 11,430 0Financial instruments 658 297Receivables 668 1,040Inventories 428 470Total current assets 38,186 43,366
Non-current assetsInvestments (2) 443,621 466,772Other financial assets (3) 31,700 32,002Property, plant and equipment 242 262Intangible assets 5,428 5,087Total non-current assets 480,991 504,123
Total assets 519,177 547,489
Liabilities (CHF 000)
Short-term liabilitiesOther short-term liabilities 1,997 2,039Total short-term liabilities 1,997 2,039
Long-term liabilitiesLong-term financial liabilities (4) 6,325 6,275Total long-term liabilities 6,325 6,275
Shareholders’ equityShare capital (5) 552,000 588,000Treasury shares (5) – 17,334 – 33,084Capital reserve 385,488 375,240Currency translation differences 195 110Accumulated loss – 409,494 – 391,091Total shareholders’ equity 510,855 539,175
Total liabilities and shareholders’ equity 519,177 547,489
Number of outstanding shares (in 000) 8,842 9,047Net asset value (NAV) per share (CHF) 57.77 59.60
HB
M H
ealth
care
Inve
stm
ents
· Q
uart
erly
Rep
ort
Dec
embe
r 20
12
5
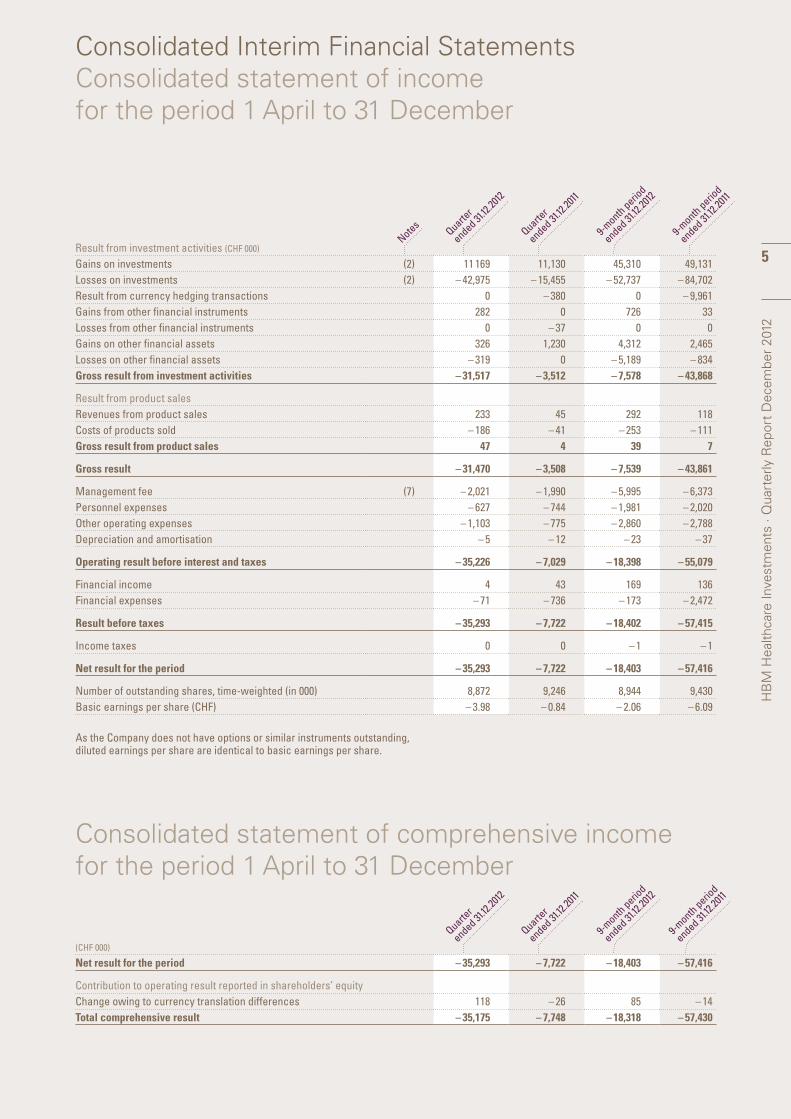
Consolidated Interim Financial StatementsConsolidated statement of incomefor the period 1 April to 31 December
Notes9-m
onth period
ended 31.12
.2012
9-month perio
d
ended 31.12
.2012
Quarter
ended 31.12
.2011
Quarter
ended 31.12
.2011
Quarter
ended 31.12
.2012
Quarter
ended 31.12
.2012
9-month perio
d
ended 31.12
.2011
9-month perio
d
ended 31.12
.2011
Result from investment activities (CHF 000)
Gains on investments (2) 11 169 11,130 45,310 49,131Losses on investments (2) – 42,975 – 15,455 – 52,737 – 84,702Result from currency hedging transactions 0 – 380 0 – 9,961Gains from other financial instruments 282 0 726 33Losses from other financial instruments 0 – 37 0 0Gains on other financial assets 326 1,230 4,312 2,465Losses on other financial assets – 319 0 – 5,189 – 834Gross result from investment activities – 31,517 – 3,512 – 7,578 – 43,868
Result from product salesRevenues from product sales 233 45 292 118Costs of products sold – 186 – 41 – 253 – 111Gross result from product sales 47 4 39 7
Gross result – 31,470 – 3,508 – 7,539 – 43,861
Management fee (7) – 2,021 – 1,990 – 5,995 – 6,373Personnel expenses – 627 – 744 – 1,981 – 2,020Other operating expenses – 1,103 – 775 – 2,860 – 2,788Depreciation and amortisation – 5 – 12 – 23 – 37
Operating result before interest and taxes – 35,226 – 7,029 – 18,398 – 55,079
Financial income 4 43 169 136Financial expenses – 71 – 736 – 173 – 2,472
Result before taxes – 35,293 – 7,722 – 18,402 – 57,415
Income taxes 0 0 – 1 – 1
Net result for the period – 35,293 – 7,722 – 18,403 – 57,416
Number of outstanding shares, time-weighted (in 000) 8,872 9,246 8,944 9,430Basic earnings per share (CHF) – 3.98 – 0.84 – 2.06 – 6.09
As the Company does not have options or similar instruments outstanding, diluted earnings per share are identical to basic earnings per share.
(CHF 000)
Net result for the period – 35,293 – 7,722 – 18,403 – 57,416
Contribution to operating result reported in shareholders’ equityChange owing to currency translation differences 118 – 26 85 – 14Total comprehensive result – 35,175 – 7,748 – 18,318 – 57,430
Consolidated statement of comprehensive income for the period 1 April to 31 December
HB
M H
ealth
care
Inve
stm
ents
· Q
uart
erly
Rep
ort
Dec
embe
r 20
12
6
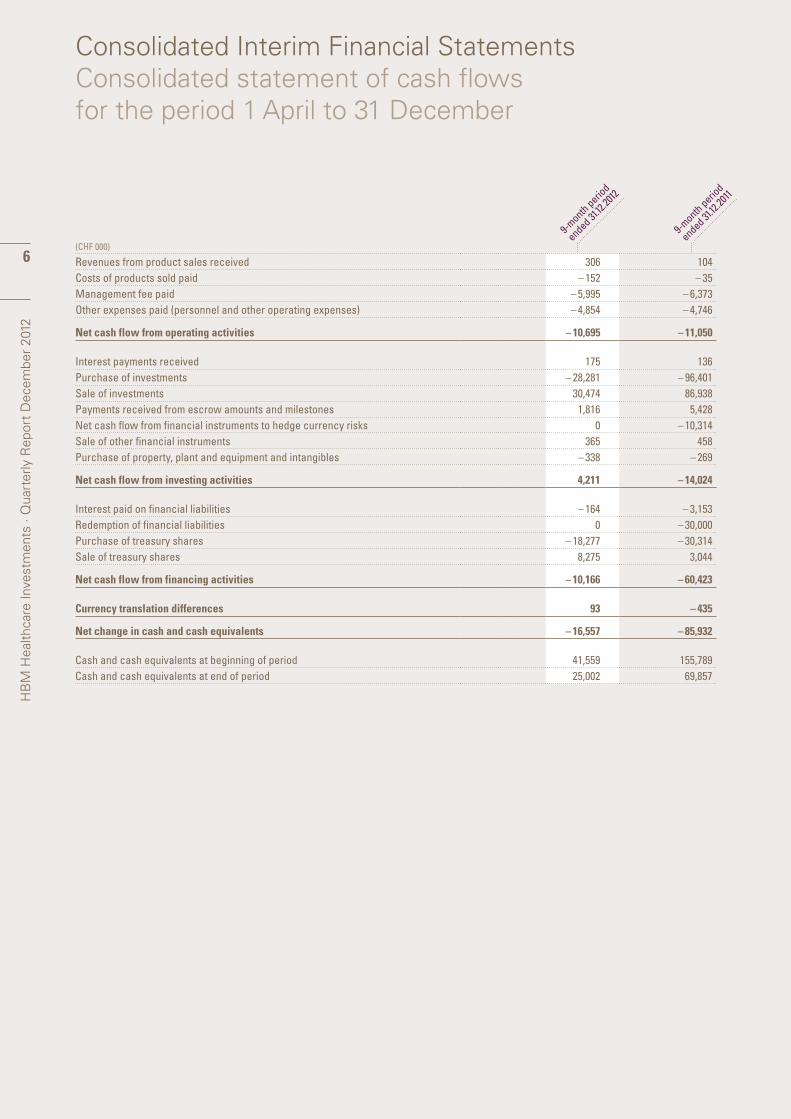
Consolidated Interim Financial StatementsConsolidated statement of cash flowsfor the period 1 April to 31 December
9-month perio
d
ended 31.12
.2012
9-month perio
d
ended 31.12
.2011
(CHF 000)
Revenues from product sales received 306 104Costs of products sold paid – 152 – 35Management fee paid – 5,995 – 6,373Other expenses paid (personnel and other operating expenses) – 4,854 – 4,746
Net cash flow from operating activities – 10,695 – 11,050
Interest payments received 175 136Purchase of investments – 28,281 – 96,401Sale of investments 30,474 86,938Payments received from escrow amounts and milestones 1,816 5,428Net cash flow from financial instruments to hedge currency risks 0 – 10,314Sale of other financial instruments 365 458Purchase of property, plant and equipment and intangibles – 338 – 269
Net cash flow from investing activities 4,211 – 14,024
Interest paid on financial liabilities – 164 – 3,153Redemption of financial liabilities 0 – 30,000Purchase of treasury shares – 18,277 – 30,314Sale of treasury shares 8,275 3,044
Net cash flow from financing activities – 10,166 – 60,423
Currency translation differences 93 – 435
Net change in cash and cash equivalents – 16,557 – 85,932
Cash and cash equivalents at beginning of period 41,559 155,789Cash and cash equivalents at end of period 25,002 69,857
HB
M H
ealth
care
Inve
stm
ents
· Q
uart
erly
Rep
ort
Dec
embe
r 20
12
7
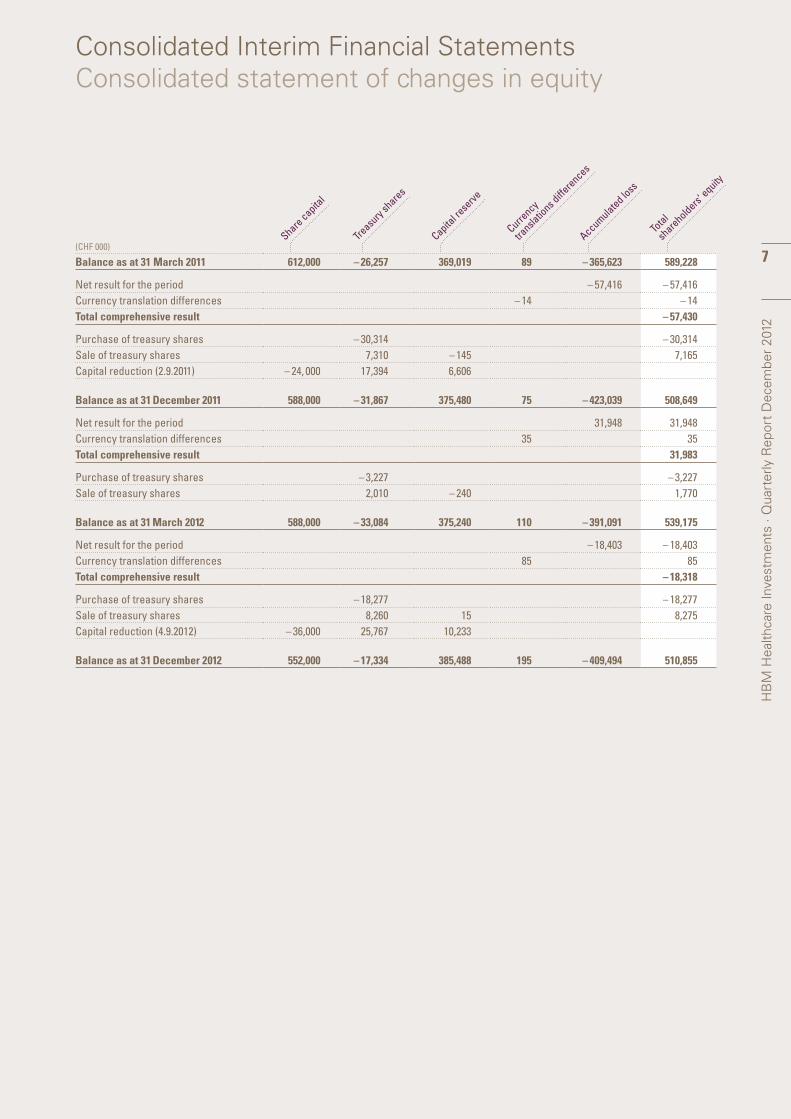
Consolidated Interim Financial StatementsConsolidated statement of changes in equity
Total
shareholders‘
equity
Accumulated loss
Capital re
serve
Share capital
Currency
transla
tions d
ifferences
Treasu
ry sh
ares
(CHF 000)
Balance as at 31 March 2011 612,000 – 26,257 369,019 89 – 365,623 589,228
Net result for the period – 57,416 – 57,416Currency translation differences – 14 – 14Total comprehensive result – 57,430
Purchase of treasury shares – 30,314 – 30,314Sale of treasury shares 7,310 – 145 7,165Capital reduction (2.9.2011) – 24, 000 17,394 6,606
Balance as at 31 December 2011 588,000 – 31,867 375,480 75 – 423,039 508,649
Net result for the period 31,948 31,948Currency translation differences 35 35Total comprehensive result 31,983
Purchase of treasury shares – 3,227 – 3,227Sale of treasury shares 2,010 – 240 1,770
Balance as at 31 March 2012 588,000 – 33,084 375,240 110 – 391,091 539,175
Net result for the period – 18,403 – 18,403Currency translation differences 85 85Total comprehensive result – 18,318
Purchase of treasury shares – 18,277 – 18,277Sale of treasury shares 8,260 15 8,275Capital reduction (4.9.2012) – 36,000 25,767 10,233
Balance as at 31 December 2012 552,000 – 17,334 385,488 195 – 409,494 510,855
HB
M H
ealth
care
Inve
stm
ents
· Q
uart
erly
Rep
ort
Dec
embe
r 20
12
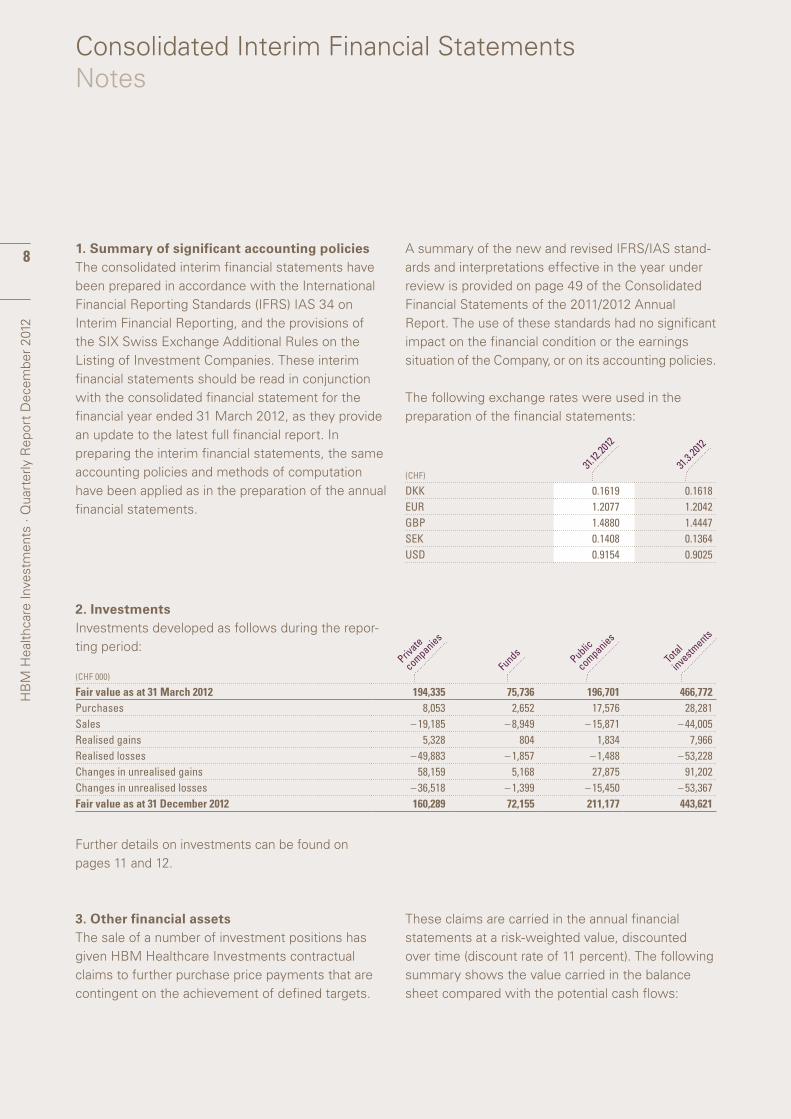
8 1. Summary of significant accounting policiesThe consolidated interim financial statements have been prepared in accordance with the International Financial Reporting Standards (IFRS) IAS 34 on Interim Financial Reporting, and the provisions of the SIX Swiss Exchange Additional Rules on the Listing of Investment Companies. These interim financial statements should be read in conjunction with the consolidated financial statement for the financial year ended 31 March 2012, as they provide an update to the latest full financial report. In preparing the interim financial statements, the same accounting policies and methods of computation have been applied as in the preparation of the annual financial statements.
A summary of the new and revised IFRS/IAS stand-ards and interpretations effective in the year under review is provided on page 49 of the Consolidated Financial Statements of the 2011/2012 Annual Report. The use of these standards had no significant impact on the financial condition or the earnings situation of the Company, or on its accounting policies.
The following exchange rates were used in the preparation of the financial statements:
31.3.2
012
31.12.
2012
(CHF) DKK 0.1619 0.1618EUR 1.2077 1.2042GBP 1.4880 1.4447SEK 0.1408 0.1364USD 0.9154 0.9025
Consolidated Interim Financial StatementsNotes
Total
investm
ents
Public
companies
Funds
Private
companies
(CHF 000) Fair value as at 31 March 2012 194,335 75,736 196,701 466,772Purchases 8,053 2,652 17,576 28,281Sales – 19,185 – 8,949 – 15,871 – 44,005Realised gains 5,328 804 1,834 7,966Realised losses – 49,883 – 1,857 – 1,488 – 53,228Changes in unrealised gains 58,159 5,168 27,875 91,202Changes in unrealised losses – 36,518 – 1,399 – 15,450 – 53,367Fair value as at 31 December 2012 160,289 72,155 211,177 443,621
2. InvestmentsInvestments developed as follows during the repor-ting period:
3. Other financial assetsThe sale of a number of investment positions has given HBM Healthcare Investments contractual claims to further purchase price payments that are contingent on the achievement of defined targets.
These claims are carried in the annual financial statements at a risk-weighted value, discounted over time (discount rate of 11 percent). The following summary shows the value carried in the balance sheet compared with the potential cash flows:
Further details on investments can be found on pages 11 and 12.
HB
M H
ealth
care
Inve
stm
ents
· Q
uart
erly
Rep
ort
Dec
embe
r 20
12
9
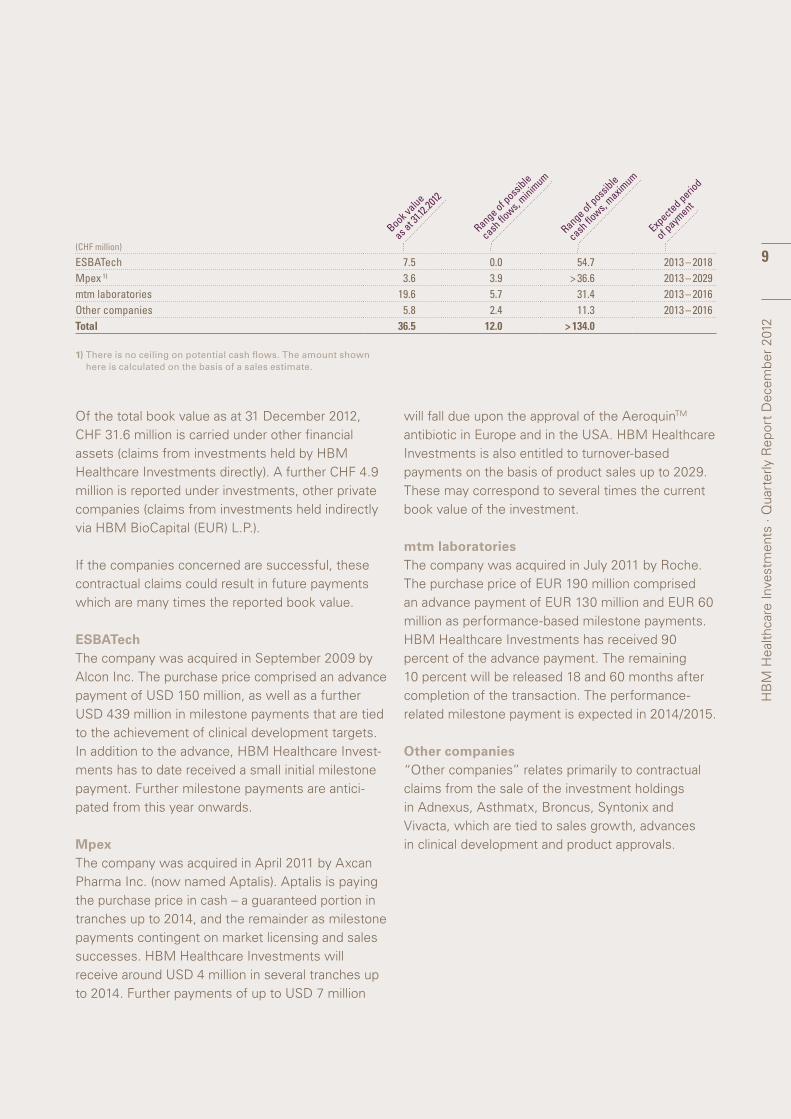
Of the total book value as at 31 December 2012, CHF 31.6 million is carried under other financial assets (claims from investments held by HBM Healthcare Investments directly). A further CHF 4.9 million is reported under investments, other private companies (claims from investments held indirectly via HBM BioCapital (EUR) L.P.).
If the companies concerned are successful, these contractual claims could result in future payments which are many times the reported book value.
ESBATechThe company was acquired in September 2009 by Alcon Inc. The purchase price comprised an advance payment of USD 150 million, as well as a further USD 439 million in milestone payments that are tied to the achievement of clinical development targets. In addition to the advance, HBM Healthcare Invest-ments has to date received a small initial milestone payment. Further milestone payments are antici-pated from this year onwards.
MpexThe company was acquired in April 2011 by Axcan Pharma Inc. (now named Aptalis). Aptalis is paying the purchase price in cash – a guaranteed portion in tranches up to 2014, and the remainder as milestone payments contingent on market licensing and sales successes. HBM Healthcare Investments will receive around USD 4 million in several tranches up to 2014. Further payments of up to USD 7 million
will fall due upon the approval of the AeroquinTM antibiotic in Europe and in the USA. HBM Healthcare Investments is also entitled to turnover-based payments on the basis of product sales up to 2029. These may correspond to several times the current book value of the investment.
mtm laboratoriesThe company was acquired in July 2011 by Roche. The purchase price of EUR 190 million comprised an advance payment of EUR 130 million and EUR 60 million as performance-based milestone payments. HBM Healthcare Investments has received 90 percent of the advance payment. The remaining 10 percent will be released 18 and 60 months after completion of the transaction. The performance- related milestone payment is expected in 2014/2015.
Other companies“Other companies” relates primarily to contractual claims from the sale of the investment holdings in Adnexus, Asthmatx, Broncus, Syntonix and Vivacta, which are tied to sales growth, advances in clinical development and product approvals.
Range of poss
ible
cash flows,
minimum
Range of poss
ible
cash flows,
maximum
Book value
as at 3
1.12.20
12
Expected perio
d
of paym
ent
(CHF million) ESBATech 7.5 0.0 54.7 2013 – 2018Mpex 1) 3.6 3.9 > 36.6 2013 – 2029mtm laboratories 19.6 5.7 31.4 2013 – 2016Other companies 5.8 2.4 11.3 2013 – 2016Total 36.5 12.0 > 134.0
1) There is no ceiling on potential cash flows. The amount shown here is calculated on the basis of a sales estimate.
HB
M H
ealth
care
Inve
stm
ents
· Q
uart
erly
Rep
ort
Dec
embe
r 20
12
10 4. Financial liabilitiesThe following financial liabilities were outstanding as of the balance sheet date:> Debtor: Tensys Medical Inc.
USD 6.9 million secured loan, including cumu-lated interest, interest rate 3.5 percent on the nom-inal value of USD 5 million, maturity 1 May 2015, convertible into 30 percent of outstanding shares of Tensys Medical Inc.
5. Equity capital5.1 Share capitalAs at the balance sheet date, the Company’s share capital amounts to CHF 552 million, divided into 9,200,000 registered shares at a par value of CHF 60 each. The Ordinary Shareholders’ Meeting of 22 June 2012 decided to reduce the Company’s share capital by cancelling 600,000 treasury shares. The capital reduction was entered in the Commercial Register of the Canton of Zug on 4 September 2012.
5.2 Treasury sharesThe Ordinary Shareholders’ Meeting of 22 June 2012 authorised the Board of Directors to repurchase a maximum of 920,000 of the company’s own shares via a second trading line. The share buy-back programme is intended to reduce capital and will run until 30 June 2015 (“Share buy-back programme 2012”). Under this share buy-back programme a total of 66,000 of the Company’s own shares have been repurchased to date. As at the balance sheet date of 31 December 2012, the Company held 176,000 of its own shares (31 March 2012: 597,345 own shares). In the 9-month period of the current financial year, a total of 178,655 of own shares were acquired over the second trading line at an average price of CHF 47.41.
In addition, as at the balance sheet date, HBM Healthcare Investments (Cayman) Ltd held 181,576
treasury shares (155,710 as at 31 March 2012), acquired over the regular trading line. During the 9-month period up to the end of December 2012, a total of 197,144 treasury shares were acquired over the regular trading line at an average price of CHF 49.74 per share (previous year: 80,479 shares at CHF 43.74), while 171,278 treasury shares were sold at an average price of CHF 48.32 (previous year: 142,363 shares at CHF 50.33). The gain of CHF 0.015 million (previous year: loss of CHF 0.1 million) from trading in treasury shares, which is reported in shareholders’ equity, is based on the proceeds of shares sold, minus the pro-rata average acquisition price of all shares purchased over the regular trading line.
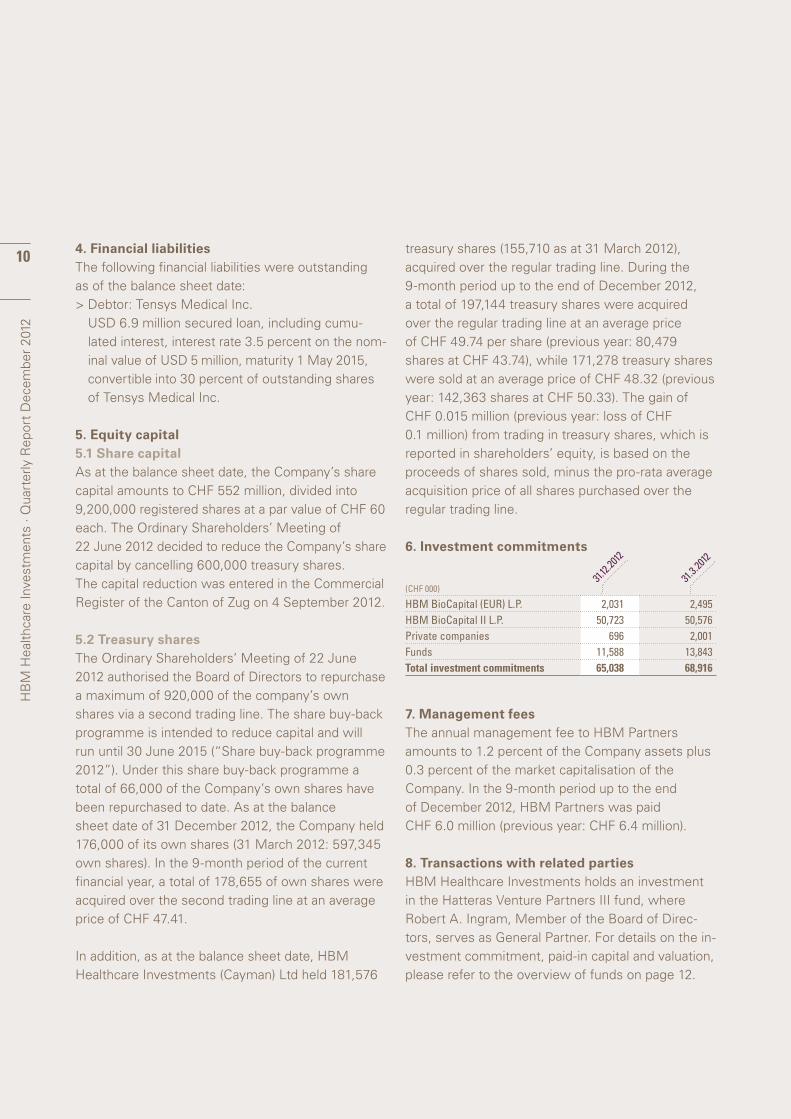
6. Investment commitments
31.3.2
012
31.12.
2012
(CHF 000) HBM BioCapital (EUR) L.P. 2,031 2,495 HBM BioCapital II L.P. 50,723 50,576 Private companies 696 2,001 Funds 11,588 13,843 Total investment commitments 65,038 68,916
7. Management feesThe annual management fee to HBM Partners amounts to 1.2 percent of the Company assets plus 0.3 percent of the market capitalisation of the Company. In the 9-month period up to the end of December 2012, HBM Partners was paid CHF 6.0 million (previous year: CHF 6.4 million).
8. Transactions with related partiesHBM Healthcare Investments holds an investment in the Hatteras Venture Partners III fund, where Robert A. Ingram, Member of the Board of Direc-tors, serves as General Partner. For details on the in-vestment commitment, paid-in capital and valuation, please refer to the overview of funds on page 12.
HB
M H
ealth
care
Inve
stm
ents
· Q
uart
erly
Rep
ort
Dec
embe
r 20
12
11
Fair v
alue as at
31.3.
2012
(CHF 000
)
Fair v
alue as at
31.12.
2012 (
CHF 000
)
Investm
ent curre
ncy (IC)
DomicileOwnersh
ip as %
of portf
olio company
Fair v
alue as at
31.12.
2012 (
IC m)
Amount disb
ursed
as at 3
1.12.20
12 (IC
m)
Changes in th
e
reporting perio
d (IC m
)
Amount disb
ursed
as at 3
1.3.20
12 (IC
m)
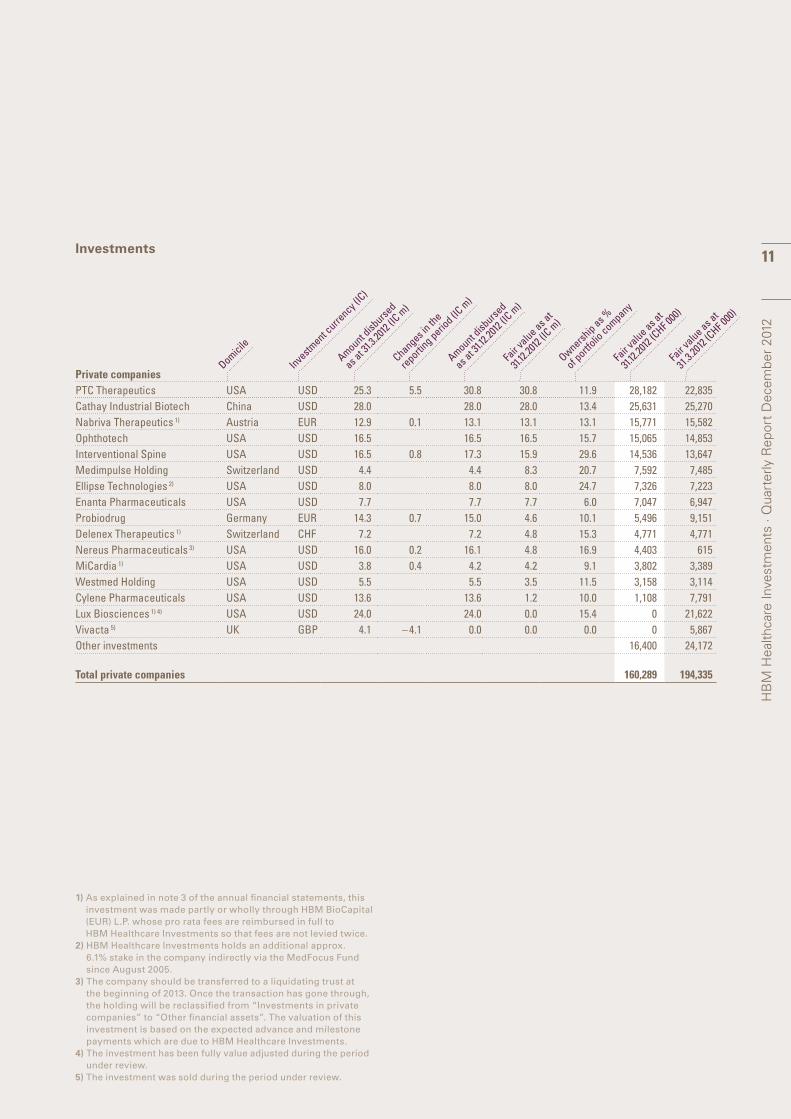
1) As explained in note 3 of the annual financial statements, this investment was made partly or wholly through HBM BioCapital (EUR) L.P. whose pro rata fees are reim bursed in full to HBM Healthcare Investments so that fees are not levied twice.
2) HBM Healthcare Investments holds an additional approx. 6.1% stake in the company indirectly via the MedFocus Fund since August 2005.
3) The company should be transferred to a liquidating trust at the beginning of 2013. Once the transaction has gone through, the holding will be reclassified from “Investments in private com panies” to “Other financial assets”. The valuation of this investment is based on the expected advance and milestone payments which are due to HBM Healthcare Investments.
4) The investment has been fully value adjusted during the period under review.
5) The investment was sold during the period under review.
Investments
Private companiesPTC Therapeutics USA USD 25.3 5.5 30.8 30.8 11.9 28,182 22,835Cathay Industrial Biotech China USD 28.0 28.0 28.0 13.4 25,631 25,270Nabriva Therapeutics 1) Austria EUR 12.9 0.1 13.1 13.1 13.1 15,771 15,582Ophthotech USA USD 16.5 16.5 16.5 15.7 15,065 14,853Interventional Spine USA USD 16.5 0.8 17.3 15.9 29.6 14,536 13,647Medimpulse Holding Switzerland USD 4.4 4.4 8.3 20.7 7,592 7,485Ellipse Technologies 2) USA USD 8.0 8.0 8.0 24.7 7,326 7,223Enanta Pharmaceuticals USA USD 7.7 7.7 7.7 6.0 7,047 6,947Probiodrug Germany EUR 14.3 0.7 15.0 4.6 10.1 5,496 9,151Delenex Therapeutics 1) Switzerland CHF 7.2 7.2 4.8 15.3 4,771 4,771Nereus Pharmaceuticals 3) USA USD 16.0 0.2 16.1 4.8 16.9 4,403 615MiCardia 1) USA USD 3.8 0.4 4.2 4.2 9.1 3,802 3,389Westmed Holding USA USD 5.5 5.5 3.5 11.5 3,158 3,114Cylene Pharmaceuticals USA USD 13.6 13.6 1.2 10.0 1,108 7,791Lux Biosciences 1) 4) USA USD 24.0 24.0 0.0 15.4 0 21,622Vivacta 5) UK GBP 4.1 – 4.1 0.0 0.0 0.0 0 5,867Other investments 16,400 24,172
Total private companies 160,289 194,335
HB
M H
ealth
care
Inve
stm
ents
· Q
uart
erly
Rep
ort
Dec
embe
r 20
12
12
Fair v
alue as at
31.3.
2012
(CHF 000
)
Fair v
alue as at
31.12.
2012 (
CHF 000
)
Fair v
alue as at
31.12.
2012 (
IC m)
Cumulative re
payments
as at 3
1.12.20
12 (IC
m)
Cumulative paym
ents
as at 3
1.12.20
12 (IC
m)
Repayments
in the
reporting perio
d (IC m
)
Payments
in the
reporting perio
d (IC m
)
Total
commitment (I
C m)
Investm
ent curre
ncy (IC)
Domicile
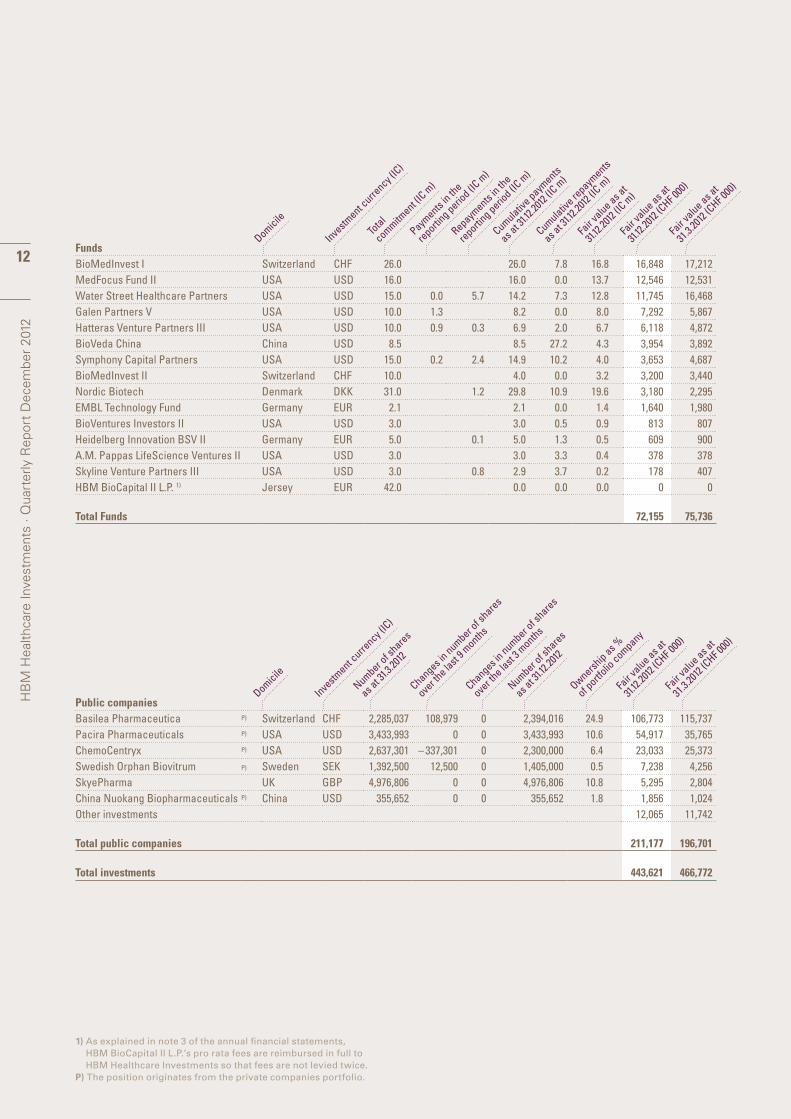
1) As explained in note 3 of the annual financial statements, HBM BioCapital II L.P.’s pro rata fees are reimbursed in full to HBM Healthcare Investments so that fees are not levied twice.
P) The position originates from the private companies portfolio.
Fair v
alue as at
31.3.
2012
(CHF 000
)
Fair v
alue as at
31.12.
2012 (
CHF 000
)
Ownership as %
of portf
olio company
Number of s
hares
as at 3
1.12.20
12
Changes in number o
f shares
over th
e last
9 months
Changes in number o
f shares
over th
e last
3 months
Number of s
hares
as at 3
1.3.20
12
Investm
ent curre
ncy (IC)
Domicile
FundsBioMedInvest I Switzerland CHF 26.0 26.0 7.8 16.8 16,848 17,212MedFocus Fund II USA USD 16.0 16.0 0.0 13.7 12,546 12,531Water Street Healthcare Partners USA USD 15.0 0.0 5.7 14.2 7.3 12.8 11,745 16,468Galen Partners V USA USD 10.0 1.3 8.2 0.0 8.0 7,292 5,867Hatteras Venture Partners III USA USD 10.0 0.9 0.3 6.9 2.0 6.7 6,118 4,872BioVeda China China USD 8.5 8.5 27.2 4.3 3,954 3,892Symphony Capital Partners USA USD 15.0 0.2 2.4 14.9 10.2 4.0 3,653 4,687BioMedInvest II Switzerland CHF 10.0 4.0 0.0 3.2 3,200 3,440Nordic Biotech Denmark DKK 31.0 1.2 29.8 10.9 19.6 3,180 2,295EMBL Technology Fund Germany EUR 2.1 2.1 0.0 1.4 1,640 1,980BioVentures Investors II USA USD 3.0 3.0 0.5 0.9 813 807Heidelberg Innovation BSV II Germany EUR 5.0 0.1 5.0 1.3 0.5 609 900A.M. Pappas LifeScience Ventures II USA USD 3.0 3.0 3.3 0.4 378 378Skyline Venture Partners III USA USD 3.0 0.8 2.9 3.7 0.2 178 407HBM BioCapital II L.P. 1) Jersey EUR 42.0 0.0 0.0 0.0 0 0
Total Funds 72,155 75,736
Public companiesBasilea Pharmaceutica P) Switzerland CHF 2,285,037 108,979 0 2,394,016 24.9 106,773 115,737Pacira Pharmaceuticals P) USA USD 3,433,993 0 0 3,433,993 10.6 54,917 35,765ChemoCentryx P) USA USD 2,637,301 – 337,301 0 2,300,000 6.4 23,033 25,373Swedish Orphan Biovitrum P) Sweden SEK 1,392,500 12,500 0 1,405,000 0.5 7,238 4,256SkyePharma UK GBP 4,976,806 0 0 4,976,806 10.8 5,295 2,804China Nuokang Biopharmaceuticals P) China USD 355,652 0 0 355,652 1.8 1,856 1,024Other investments 12,065 11,742
Total public companies 211,177 196,701
Total investments 443,621 466,772
HB
M H
ealth
care
Inve
stm
ents
· Q
uart
erly
Rep
ort
Dec
embe
r 20
12
Investor Information
13
Information on shares
Swiss security number 1.262.725German security number 984345ISIN CH 0012627250CUSIP H 3553X112Telekurs 126,126272SIX Swiss Exchange Ticker HBMNInternet www.hbmhealthcare.com
Board of Directors
Hans Peter Hasler, ChairmanProf. Dr Dr h.c. mult. Heinz Riesenhuber1), Vice ChairmanMario G. Giuliani Dr Eduard E. HoldenerRobert A. Ingram2)
Dr Rudolf Lanz1)2)
Dr Benedikt Suter, Secretary of the Board of Directors1) Member of the Audit Committee2) Member of the Nominating Committee
Management
Dr Andreas Wicki, Chief Executive OfficerErwin Troxler, Chief Financial Officer
Fees
Management fees (paid quarterly):1.2% of Company assets plus 0.3% of the Company’s market capitalisationPerformance fee (paid annually on increasein value above the high water mark) 15%High water mark per share for all outstanding shares NAV of CHF 107.71
Significant shareholdersBased on the notifications received by the Company, the following shareholders are known to hold 3 percent or more of the share capital of HBM Health-care Investments Ltd as at 31 December 2012:
Shareholders
10 – 15 % Astellas Pharma Inc., Tokyo JP 7.4.2011
Shareholder group:Alpine Select Ltd, Zug & Absolute Invest Ltd, Zug CH 25.6.2012
3 – 5 % Red Rocks Capital LLC, CO USA 4.10.2012Prudential PLC, London UK 8.11.2012HBM Healthcare Investments Ltd, Zug (treasury shares) CH 8.9.2012
Latest
notificatio
n
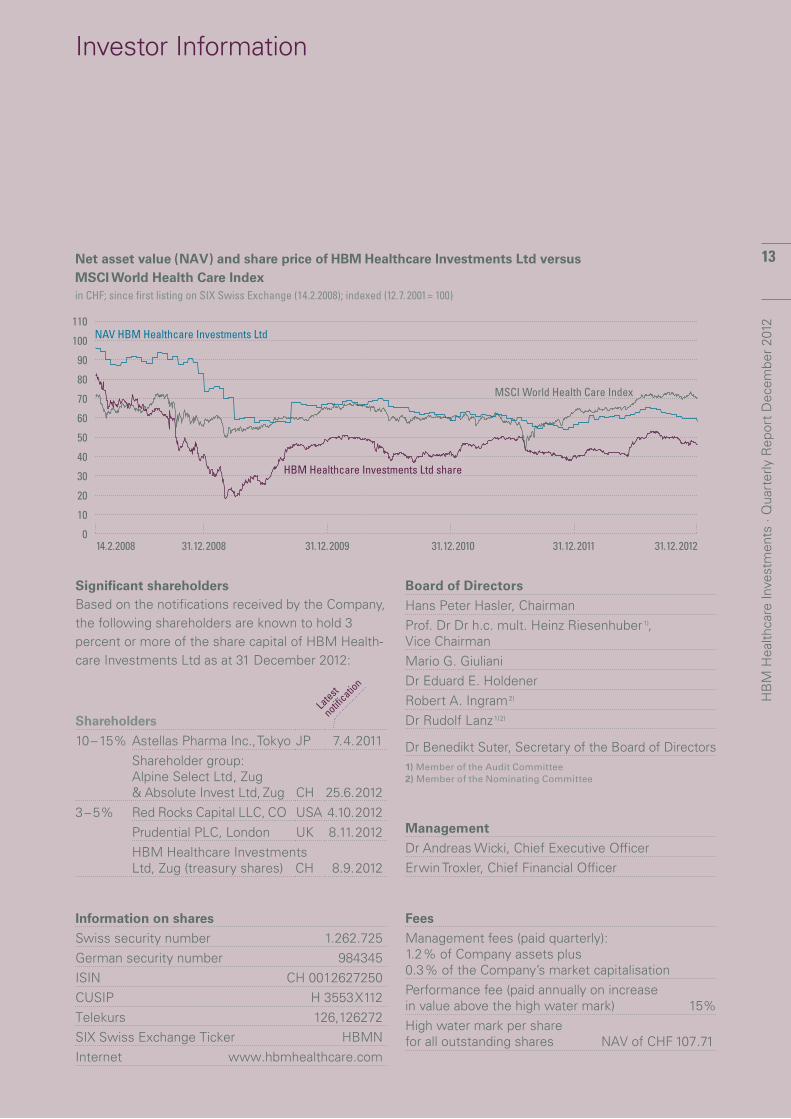
Net asset value (NAV) and share price of HBM Healthcare Investments Ltd versus MSCI World Health Care Indexin CHF; since first listing on SIX Swiss Exchange (14.2.2008); indexed (12.7.2001 = 100)
110
100
90
80
70
60
50
40
30
20
10
0
MSCI World Health Care Index
HBM Healthcare Investments Ltd share
NAV HBM Healthcare Investments Ltd
14.2.2008 31.12.2008 31.12.2009 31.12.2010 31.12.2011 31.12.2012
HB
M H
ealth
care
Inve
stm
ents
· Q
uart
erly
Rep
ort
Dec
embe
r 20
12

14
HBM Healthcare Investments LtdBundesplatz 1, 6300 Zug/SwitzerlandPhone +41 41 768 11 08www.hbmhealthcare.com