Embed Size (px)
Citation preview
2. kvartal / 1. halvår 2021 KONGSBERG 1
QUARTERLYREPORT
2nd QUARTER 1ST HALF
2021

2 2nd quarter / 1st half 2021 KONGSBERG
GEIR HÅØYPresident & CEO
“KONGSBERG continue to develop well, with a 13 per cent increase in operating revenues and a 34 per cent improvement in EBITDA compared with the corresponding quarter last year. Kongsberg Defence & Aerospace (KDA) has shown good growth and solid profitability. Kongsberg Maritime (KM) has a book-to-bill ratio of more than one, increasing turnover and improving its margin by 4 percentage points compared with Q2 last year. At Kongsberg Digital (KDI), the main focus is to expand on the customer portfolio and to develop the digital ecosystem for Vessel Insight and Kognitwin. The business area has shown positive development, both in terms of the roll-out of its digital solutions and the creation of new customer relationships.
Going forward, we expect continued growth for KDA. While a number of KM’s markets remain challenging, the progress we have seen, particularly in the last six months, makes us more optimistic for the future. Through the expansion of our product portfolio and the efficiency measures we have implemented in recent years we have never been better positioned for an upswing in the market. With KDI, we have established a number of leading positions in digitalisation, and the number of users of our systems is constantly increasing.
Through our expertise in technology, we will contribute to solve the environmental challenges that our industries and the world are facing. We also see significant business opportunities connected to the green shift, including in offshore wind, where KM has signed a number of important contracts.
Just two weeks into Q3, we have already signed significant orders. KDA has signed a significant agreement for the delivery of combat systems for submarines and NSMs. KM has signed a contract for the delivery of an extensive technology package for two offshore wind installation vessels and KDI has signed an important agreement with ExxonMobil.
Overall, the group has a solid foundation with technology and market positons in both established and new future markets. This makes us confident that KONGSBERG will continue a positive trajectory.”

2nd quarter / 1st half 2021 KONGSBERG 3
Highlights
Growth and continued solid project execution and cost discipline resulted in increased EBITDA in Q2 2021 compared with Q2 2020. MNOK 1,440 paid in dividends and shares cancelled in connection with the repurchase programme. KOG currently has 178,833,446 outstanding shares, a reduction of approximately 0.6 percent of outstanding shares.
Q2 H1Revenues: MNOK 6,762 MNOK 13,127EBITDA: MNOK 993 MNOK 1,876EBITDA margin: 14.7 per cent 14.3 per cent
KONGSBERG
A book-to-bill ratio of 1.03 with the order intake including deliveries to new offshore wind construction and service vessels. Growth, improved profitability and improved market prospects in general.
Q2 H1Revenues: MNOK 4,092 MNOK 7,898EBITDA: MNOK 452 MNOK 879EBITDA margin: 11.1 per cent 11.1 per cent
KONGSBERG MARITIME
Increase in operating revenues of 22 per cent, and solid project execution during the quarter. The MUSD 498 extension of the CROWS framework agreement provides consistency in deliveries of remote weapon stations in future periods.
Q2 H1Revenues: MNOK 2,456 MNOK 4,806EBITDA: MNOK 513 MNOK 982EBITDA margin: 20.9 per cent 20.4 per cent
KONGSBERG DEFENCE & AEROSPACE
A high level of activity and scaling up the business. Delivery of new dynamic digital twins and roll-out of Vessel Insight to new and existing customers.
Q2 H1Revenues: MNOK 204 MNOK 396EBITDA: MNOK 10 MNOK 1Share of “recurring revenues”: 41 per cent 40 per cent
KONGSBERG DIGITAL
4 2nd quarter / 1st half 2021 KONGSBERG
Key figures
1.4 - 30.6 1.1 - 30.6
MNOK 2021 2020 2021 2020 2020
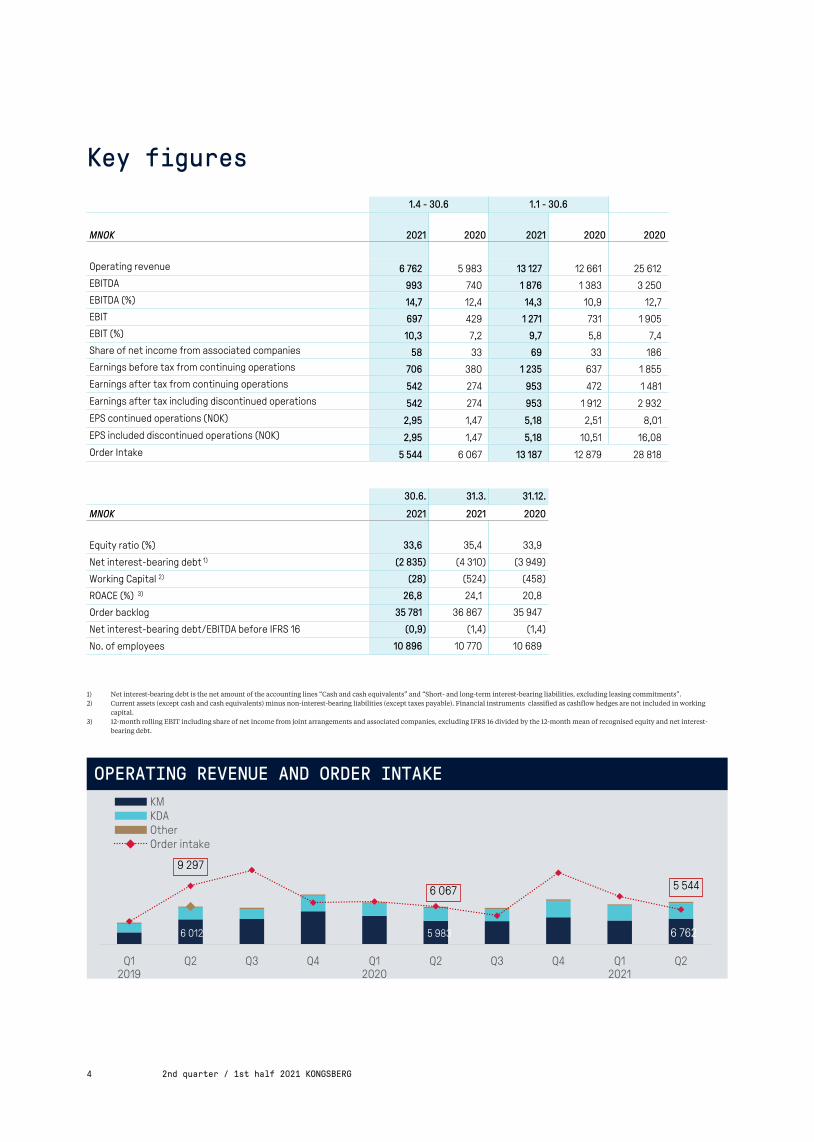
Operating revenue 6 762 5 983 13 127 12 661 25 612
EBITDA 993 740 1 876 1 383 3 250
EBITDA (%) 14,7 12,4 14,3 10,9 12,7
EBIT 697 429 1 271 731 1 905
EBIT (%) 10,3 7,2 9,7 5,8 7,4
Share of net income from associated companies 58 33 69 33 186
Earnings before tax from continuing operations 706 380 1 235 637 1 855
Earnings after tax from continuing operations 542 274 953 472 1 481
Earnings after tax including discontinued operations 542 274 953 1 912 2 932
EPS continued operations (NOK) 2,95 1,47 5,18 2,51 8,01
EPS included discontinued operations (NOK) 2,95 1,47 5,18 10,51 16,08
Order Intake 5 544 6 067 13 187 12 879 28 818
30.6. 31.3. 31.12.
MNOK 2021 2021 2020
Equity ratio (%) 33,6 35,4 33,9
Net interest-bearing debt 1) (2 835) (4 310) (3 949)
Working Capital 2) (28) (524) (458)
ROACE (%) 3) 26,8 24,1 20,8
Order backlog 35 781 36 867 35 947
Net interest-bearing debt/EBITDA before IFRS 16 (0,9) (1,4) (1,4)
No. of employees 10 896 10 770 10 689
1) Net interest-bearing debt is the net amount of the accounting lines “Cash and cash equivalents” and “Short- and long-term interest-bearing liabilities, excluding leasing commitments”.2) Current assets (except cash and cash equivalents) minus non-interest-bearing liabilities (except taxes payable). Financial instruments classified as cashflow hedges are not included in working
capital.3) 12-month rolling EBIT including share of net income from joint arrangements and associated companies, excluding IFRS 16 divided by the 12-month mean of recognised equity and net interest-
bearing debt.
OPERATING REVENUE AND ORDER INTAKE
6 012 5 983 6 762
9 297
6 067 5 544
Q12019
Q2 Q3 Q4 Q12020
Q2 Q3 Q4 Q12021
Q2
KMKDAOtherOrder intake

2nd quarter / 1st half 2021 KONGSBERG 5
ORDER BACKLOG
31 %
34 %
35 %27 177
32 93535 781
-
5 000
10 000
15 000
20 000
25 000
30 000
35 000
40 000
Q12019
Q2 Q3 Q4 Q12020
Q2 Q3 Q4 Q12021
Q2
2021
2022
2023+
Order backlog
EBITDA 414
740
993
Q12019
Q2 Q3 Q4 Q12020
Q2 Q3 Q4 Q12021
Q2
EPSContinued operations
0,22
1,47
2,95
Q12019
Q2 Q3 Q4 Q12020
Q2 Q3 Q4 Q12021
Q2
EPS continued operations

6 2nd quarter / 1st half 2021 KONGSBERG
Performance, market and ordersOperating revenues in Q2 were MNOK 6,762 against MNOK 5,983 in the same quarter the previous year, representing an increase of 13 per cent. Both Kongsberg Defence & Aerospace (KDA) and Kongsberg Maritime (KM) increased their operating revenues while Kongsberg Digital (KDI) had operating revenues at the same level as Q2 2020. Operating revenues for the year so far have been MNOK 13,127 (MNOK 12,661).
EBITDA was MNOK 993 in Q2, an EBITDA margin of 14.7 per cent compared to MNOK 740 (12.4 per cent) in the same quarter the previous year. EBITDA in the first half of 2021 was MNOK 1,876, an increase of MNOK 493 compared with the first half of 2020.
During Q2, order intake amounted to MNOK 5,544, compared to MNOK 6,067 in the same quarter last year. This gives a book-to-bill ratio for the quarter of 0.82. KM had a book-to-bill ratio of 1.03, KDA had a book-to-bill ratio of 0.46 and KDI had a book-to-bill ratio of 0.98 during the quarter. Variations in order intake are normal and must be seen in the context of when large contracts are signed, particularly at KDA. As a result the order intake can vary significantly between individual quarters. The Group’s order intake was MNOK 13,187 (MNOK 12,879) in the first half of the year, equivalent to a book-to-bill ratio of 1.00.
The order backlog at the end of Q2 was MNOK 35,781, a reduction of MNOK 1,086 during the quarter.
Cash flowKONGSBERG recorded a net reduction in cash and cash equivalents of MNOK 1,987 in Q2 2021. Net cash flow from operating activities amounted to MNOK 348. Out of this, EBITDA amounted to MNOK 993, while the change in net current assets and other operating items amounted to MNOK -645. This is mainly related to normal variations in working capital at KDA and the payment of holiday pay. Group cash flow from investment activities amounted to MNOK -51. This is a combination of investments in property, plant and equipment, as well as capitalised research and development, offset by dividends received from KSAT and Patria of MNOK 147. Cash flow from financing activities was MNOK -2,300. This includes payment of dividends to shareholders of MNOK 1,440, the repurchase of shares related to the repurchase programme and redemption of the remaining part of KOG08.
In the first half of 2021, net cash and cash equivalents decreased by MNOK 1,630. The largest negative cash flows are related to the payment of dividends, an increase in working capital at KDA and the settlement of bond loan KOG08. The largest positive cash flow elements were cash flow from operations and the issue of a new bond.
OPERATING REVENUES
6 762MNOK
EBITDA-MARGIN
14,7%
ORDER INTAKE
5 544MNOK

2nd quarter / 1st half 2021 KONGSBERG 7
Balance sheetAt the end of the quarter, the group had net interest-bearing debt totalling MNOK 2,955. The long-term interest-bearing debt consisted of four bond loans totalling MNOK 2,450 and other long-term interest-bearing debt of MNOK 3. The KOG12 bond is classified as short-term interest-bearing debt. At the end of the quarter, short-term interest-bearing debt was MNOK 502, see Note 8. The group had MNOK 5,790 in cash and cash equivalents at the end of Q2, against MNOK 7,778 at the end of Q1 and MNOK 7,420 at the end of Q4 2020.
At the KONGSBERG Annual General Meeting on 6 May 2021, it was resolved that the company’s share capital should be reduced by NOK 1,445,773.75 through the cancellation and redemption of a total of 1,156,619 shares. This capital reduction has been implemented in accordance with the resolution of the Annual General Meeting. After this, the share capital of KONGSBERG is NOK 223,541,807.50 divided into 178,833,446 shares, each with a nominal value of NOK 1.25. The Annual General Meeting also authorised the board to acquire shares for cancellation up to a total value of MNOK 400. This authorisation is valid until the next Annual General Meeting.
At the end of Q2, net interest-bearing debt was MNOK -2,835, compared to MNOK -4,310 at the end of Q1 and MNOK -3,949 at the end of 2020. The change in the quarter was mainly due to reduced cash holdings through the payment of dividends. In addition, the group had a syndicated and committed credit facility of MNOK 2,300 and an overdraft credit facility of MNOK 500. These were unused at the end of Q2 2021.
The overall balance sheet reduced by MNOK 1,127 during the quarter and by MNOK 2,263 since the end of 2020.
On 7 April 2021, the credit rating agency Nordic Credit Rating awarded Kongsberg Gruppen ASA a long-term issuer rating of A- with “stable prospects”. The standalone credit assessment was set to BBB+.
30.6. 31.3. 31.12.
MNOK 2021 2021 2020
Equity 12 415 13 478 13 301
Equity ratio (%) 33,6 35,4 33,9
Total assets 36 967 38 094 39 230
Working capital 1) (28) (524) (458)
Gross interest-bearing debt 2 955 3 468 3 471
Cash and cash equivalents 5 790 7 778 7 420
Net interest bearing debt 1) (2 835) (4 310) (3 949)
Net interest bearing debt/EBITDA before IFRS 16 (0,9) (1,4) (1,4)
1) See definition note 13
NET INTEREST-BEARING DEBT
-2 835MNOK
EQUITY RATIO
33,6%
8 2nd quarter / 1st half 2021 KONGSBERG
CurrencyKONGSBERG’s financial policy stipulates that contracts over a certain amount must be hedged upon establishment, and these are largely hedged using currency forward exchange contracts (fair value hedges). The net fair value of this type of hedge was MNOK 378 as of Q2 2021. In special cases, forward contracts are used as cash flow hedges, for example in the case of large tenders where the probability of winning the contract is considered high. The company’s portfolio of cash flow hedges had a net fair value of MNOK -78 at the end of the quarter, which is recognised in equity. The fair value (market value) here represents unrealised profits/losses in relation to agreed rates. In addition, other financial instruments are used, such as interest rate and currency swaps and currency options, where fair value is also recognised against equity. See Note 8 for a numerical representation and further information.
Changes to the maturity structure in underlying contracts may result in cash effects when rolling over related forward contracts. The size of this effect will be determined by the position of the Norwegian krone relative to the initial agreed exchange rate.
KONGSBERG’s finance policy means that accounting income recognition will largely be based on exchange rates secured at historical levels. This limits short-term effects on profits in the event of a sharp rise or fall in the value of the company’s functional currency (NOK).
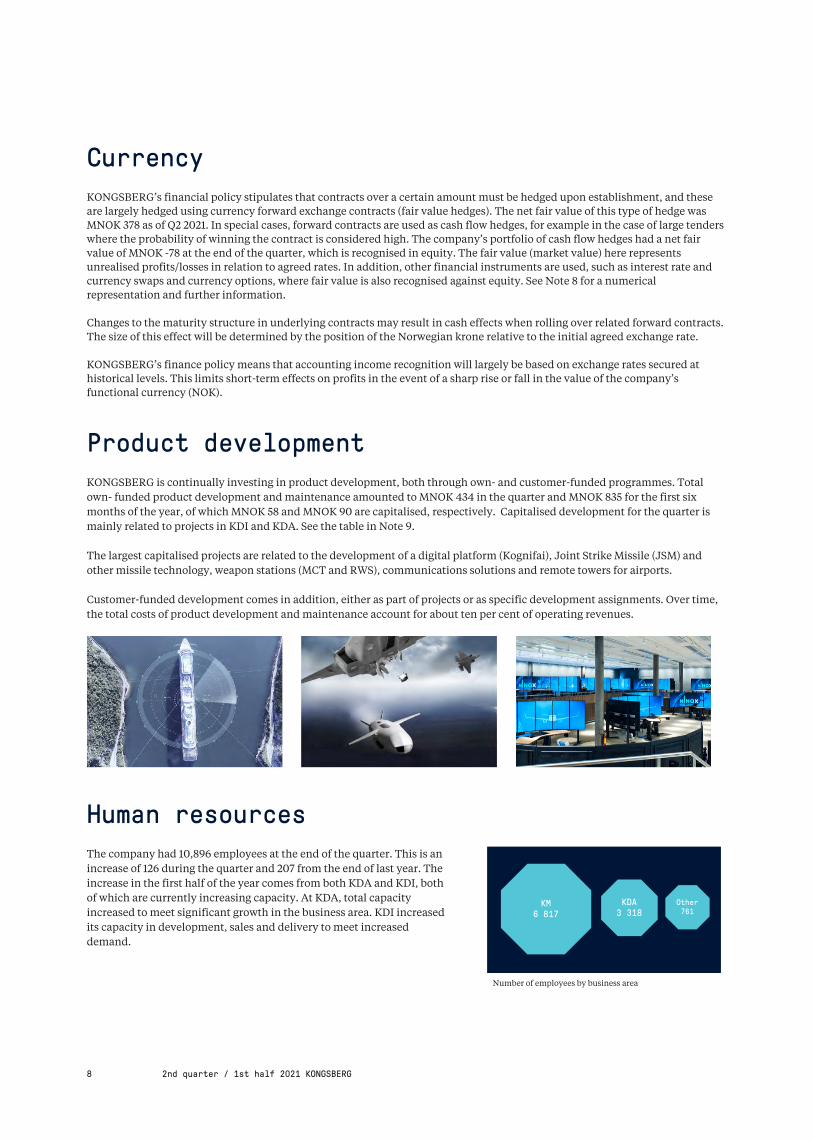
Product developmentKONGSBERG is continually investing in product development, both through own- and customer-funded programmes. Total own- funded product development and maintenance amounted to MNOK 434 in the quarter and MNOK 835 for the first six months of the year, of which MNOK 58 and MNOK 90 are capitalised, respectively. Capitalised development for the quarter is mainly related to projects in KDI and KDA. See the table in Note 9.
The largest capitalised projects are related to the development of a digital platform (Kognifai), Joint Strike Missile (JSM) and other missile technology, weapon stations (MCT and RWS), communications solutions and remote towers for airports.
Customer-funded development comes in addition, either as part of projects or as specific development assignments. Over time, the total costs of product development and maintenance account for about ten per cent of operating revenues.
Human resourcesThe company had 10,896 employees at the end of the quarter. This is an increase of 126 during the quarter and 207 from the end of last year. The increase in the first half of the year comes from both KDA and KDI, both of which are currently increasing capacity. At KDA, total capacity increased to meet significant growth in the business area. KDI increased its capacity in development, sales and delivery to meet increased demand.
KM6 817
KDA 3 318
Other 761
Number of employees by business area

2nd quarter / 1st half 2021 KONGSBERG 9

10 2nd quarter / 1st half 2021 KONGSBERG
PerformanceOperating revenues amounted to MNOK 4,092 in Q2, compared to MNOK 3,762 during the same quarter last year, an increase of 9 per cent. This increase was driven by positive after-market trends as well as the Deck Machinery and Propulsion & Engines divisions. Operating revenues for the first half of the year totalled MNOK 7,898 (MNOK 8,305).
EBITDA was MNOK 452 in Q2, an EBITDA margin of 11.1 per cent, compared to MNOK 267 (7.1 per cent) in the same quarter the previous year. Accumulated EBITDA at the end of the first half of the year was MNOK 879, an increase of MNOK 222 compared to the same period last year. The increase in margin is a result of the successful integration programme implemented in 2019 and 2020 related to the acquisition of Commercial Marine (CM), continuous efficiency improvements and a good project mix. We saw a good increase in profitability, particularly in the divisions primarily supplying the vessel market. Compared to Q2 2020, there has also been a clear improvement in the after-market. This market generally sees relatively short times between orders and deliveries. This meant that the market was quickly hit by a reduction in demand caused by the pandemic in 2020. Over the last few quarters, we have seen a gradual increase in demand, and both sales and results in Q2 confirm this trend.
Market and ordersOrder intake in Q2 was MNOK 4,220, equivalent to a book-to-bill ratio of 1.03, compared to MNOK 3,850 in Q2 2020. The after-market is an important driver for the order intake, turnover and profitability of the business area. Here, KM has seen a positive trend in terms of volume in recent quarters.
KM experience increased interest in energy-efficient and environmentally friendly solutions from both customers and partners. In Q2, a contract was signed with Hurtigruten to upgrade three Hurtigruten vessels with hybrid solutions. With this upgrade, Hurtigruten aim to reduce CO2 emissions by a minimum of 25 per cent.
Efficient operations, in terms of time, safety and energy efficiency, have always been an important driver for the further development of the KM product portfolio. This lead to opportunities in markets beyond than the traditional offshore and shipping markets. Offshore wind is a growth market, and KM has secured a number of significant contracts within this market. In Q2, the business area signed a contract worth MNOK 250 with the Chinese shipyard China Merchant Heavy Industries for the delivery of a comprehensive technology package for two new construction and service vessels to be built for the Norwegian company Awind. Further, so far in 2021 there have
KEY FIGURES
1.4 - 30.6 1.1 - 30.6
MNOK 2021 2020 2021 2020 2020
Operating revenues 4 092 3 762 7 898 8 305 16 319
EBITDA 452 267 879 657 1 532
EBITDA (%) 11,1 7,1 11,1 7,9 9,4
Order Intake 4 220 3 850 8 294 8 663 15 925
30.6. 31.3. 31.12.
MNOK 2021 2021 2020
Order backlog 11 731 11 483 11 386
No. of employees 6 817 6 769 6 815
Operating revenue
3 989 3 7624 092
Q12019
Q2 Q3 Q4 Q12020
Q2 Q3 Q4 Q12021
Q2
EBITDA
168
267
452-
Q12019
Q2 Q3 Q4 Q12020
Q2 Q3 Q4 Q12021
Q2

2nd quarter / 1st half 2021 KONGSBERG 11
been contracts signed for deliveries of three new wind turbine installation vessels. The total value of these contracts, which were signed in March and July 2021, is MNOK 900.
An important driver of growth at KM is sales synergies between KM and the acquired business CM. A large part of the rationale behind the acquisition of CM in 2019 was the complementary product and market portfolio between the two companies. In the first half of the year, cross-sales of MNOK 750 were achieved, MNOK 550 of which were in Q2. Around MNOK 700 in cross-sales were achieved in total during 2020. This only includes additional sales as a result of the integration of CM and KM. Around half of the additional sales are linked to offshore wind projects. The remainder is divided between offshore, traditional merchant marine, LNG and fishing.
At the end of Q2 2021, KM had an order backlog of MNOK 11,731. There were cancellations of contracts totalling MNOK 28 in the quarter. This figure can be considered low.
KM and COVID-19At the outbreak of the ongoing pandemic in the winter/spring of 2020, a number of measures were quickly implemented to limit infection, maintain as normal a level of operations as possible and ensure that cost levels were adapted to the level of activity. The results achieved by KM during the pandemic would not have been possible without the measures that were and, in some cases, still are being implemented. The degree of measures and restrictions has varied throughout the pandemic, but there is still extensive use of digital solutions for customer support as well as significant infection-control measures in place, including the use of home office. KM has employees in 34 countries and operations practically all over the world, which means that the measures vary considerably according to the current restrictions in individual territories. During the pandemic, our worldwide presence has been important for delivery of both projects and service assignments, as travel and other restrictions have proved to be a significant challenge.
There is still some uncertainty about the impact on order intake, operating income and results arising from the pandemic, but a number of regions around the world have now started the transition to a more normal day-to-day life.
Operating revenueYTD by division
Integrated Soutions
21%
Sensors & Robotics
16%Global
Customer Support & Services
43%
Propulsion & Engines
14%
Deck Machinery
6%
Order backlogBreakdown by delivery date
2021 49%2022 35%
2023+ 16%
Orders
4 220
12 920 12 111 11 731
4 917 3 850
Q12019
Q2 Q3 Q4 Q12020
Q2 Q3 Q4 Q12021
Q2
Order intake
Order backlog

12 2nd quarter / 1st half 2021 KONGSBERG
PerformanceOperating revenues amounted to MNOK 2,456 in Q2, compared to MNOK 2,008 during the same quarter last year, an increase of 22 per cent. The increase in operating revenues is particularly driven by an increase in deliveries of weapon stations to the US CROWS programme as well as major international air defence projects. In the first half of the year, operating revenues were MNOK 4,806, up from MNOK 3,950 in the first half of 2020.
EBITDA was MNOK 513 in Q2, an EBITDA margin of 20.9 per cent, compared to MNOK 437 (21.8 per cent) in the same quarter the previous year. This solid margin is a result of good project execution, a favourable project mix and high efficiency throughout the organisation. In the first half of 2021, EBITDA was MNOK 982 (MNOK 668), equivalent to an EBITDA margin of 20.4 per cent (16.9 per cent)
The share of net income from associated companies totalled MNOK 59 (NOK 37) in the quarter. See also Note 6.
Market and ordersOrder intake reached MNOK 1,120 in Q2, compared to MNOK 1,788 for the same quarter last year. Total order intake for the first half of the year was MNOK 4,466 (MNOK 3,556). The defence market is characterised by relatively few, but large, contracts. Deliveries are normally made over a number of years. Significant fluctuations in order intake between quarters and years are, therefore, considered normal.
The order intake in the quarter is evenly distributed between the business area’s divisions and is not a result of large individual orders. During the quarter, an important framework agreement was signed with the US military, an extension of the existing CROWS framework agreement to the tune of MUSD 498. KONGSBERG has been a supplier of CROWS remote weapon stations to the US military continuously since 2007. Over the course of these 14 years, over 13,000 systems have been delivered to the US military. In addition, KONGSBERG has sold weapon stations to 25 other countries and a total of more than 20,000 systems have been sold worldwide. The extended framework agreement is dependent on the customer’s future needs and allocations, but secures that KONGSBERG will continue to develop and deliver for the US military in the future.
At the end of Q2 2021, KDA had an order backlog of MNOK 23,145.
KEY FIGURES
1.4 - 30.6 1.1 - 30.6
MNOK 2021 2020 2021 2020 2020
Operating revenues 2 456 2 008 4 806 3 950 8 503
EBITDA 513 437 982 668 1 656
EBITDA (%) 20,9 21,8 20,4 16,9 19,5
Share of netincome associated companies
59 37 73 47 206
Order Intake 1 120 1 788 4 466 3 556 11 891
30.6. 31.3. 31.12.
MNOK 2021 2021 2020
Order backlog 23 145 24 470 23 477
No. of employees 3 318 3 283 3 189
Operating revenues
1 8292 008
2 456
Q12019
Q2 Q3 Q4 Q12020
Q2 Q3 Q4 Q12021
Q2
EBITDA
260
437
513-
-
Q12019
Q2 Q3 Q4 Q12020
Q2 Q3 Q4 Q12021
Q2
2nd quarter / 1st half 2021 KONGSBERG 13
KDA and COVID-19The defence business has not experienced major consequences as a result of COVID-19. Progress of projects has to little degree been affected by the situation. However, some contract negotiations have proved more time-consuming due to travel restrictions. KDA is dependent on the supply capacity of several hundred subcontractors, both in Norway and elsewhere. Additional resources were introduced at an early stage of the pandemic, to ensure the flow of goods, shipments and, where necessary, alternative subcontractors to avoid production delays.
The COVID-19 situation may still lead to delays in order intake in the future. As a result, this may lead to programmes that KDA is prepared for to be scaled down or cancelled. However, there are no such signs yet.
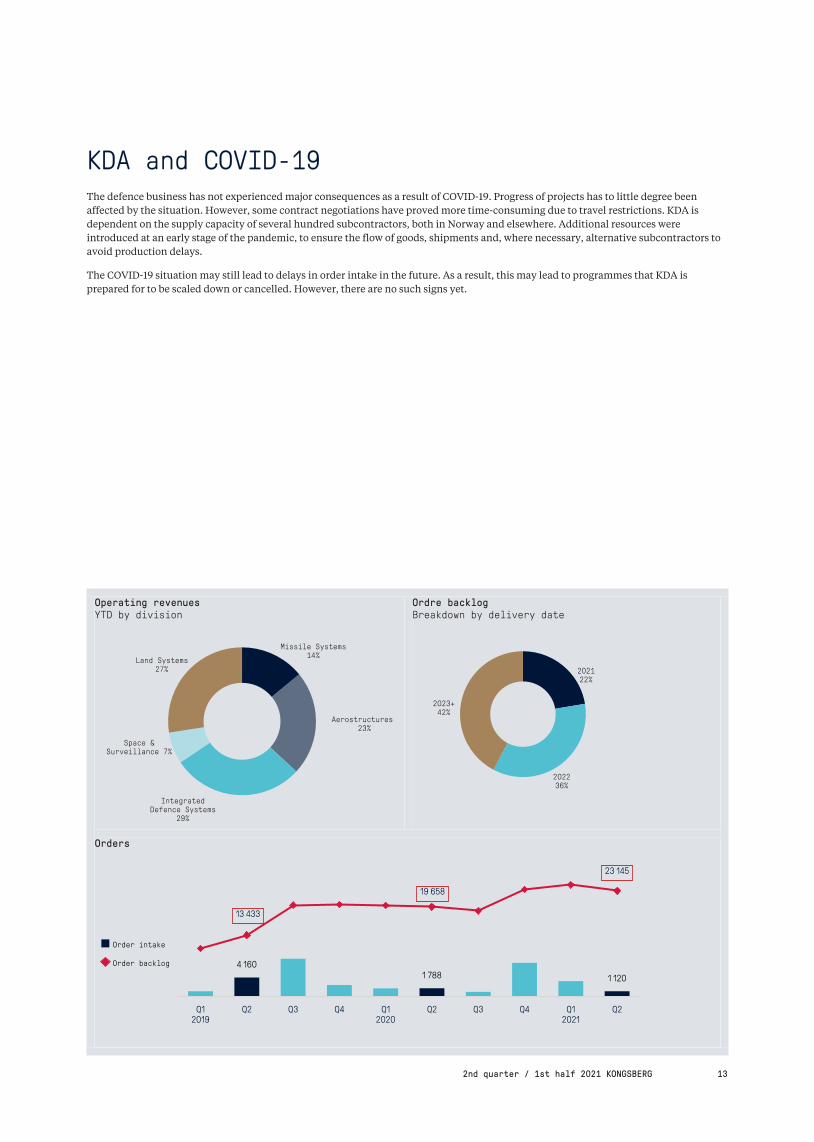
Operating revenuesYTD by division
Missile Systems 14%
Aerostructures 23%
Integrated Defence Systems
29%
Space & Surveillance 7%
Land Systems 27%
Ordre backlogBreakdown by delivery date
2021 22%
2022 36%
2023+ 42%
Orders
13 433
19 658
23 145
4 1601 788 1 120
Q12019
Q2 Q3 Q4 Q12020
Q2 Q3 Q4 Q12021
Q2
Order intake
Order backlog

14 2nd quarter / 1st half 2021 KONGSBERG
Operating revenues and performanceOperating revenues were MNOK 204 in Q2, compared to MNOK 209 in the same quarter in 2020. Recurring revenues (RR) are an important focus for KDI. In Q2, RR stood at MNOK 83, corresponding to 41 per cent of operating revenues, up from MNOK 77 (40 per cent) in Q1. Accumulated over the first half of the year, KDI had operating revenues of MNOK 396 with an RR share of 40 per cent.
Demand for digital twins and the “ship to cloud” solution Vessel Insight, which collects and aggregates data in a cost-effective and secure way, is growing.
During Q2, KDI delivered several new Kognitwin (dynamic digital twin) systems. After the end of the quarter, KDI signed an agreement on 1 July with ExxonMobil under which the company will evaluate and test Kognitwin on one of its installations.
The roll-out of Vessel Insight continues, and several new agreements were entered into with both vessel owners and application partners during the quarter. For instance, an agreement has been entered into with the Norwegian Coastal Administration for the installation of Vessel Insight. On the application side, agreements have been entered into with a view to expanding functionality using the MarineInsight and Bunkerplanner applications. This will increase the value of the system for users.
The demand for traditional maritime simulators has been negatively affected by the COVID-19 pandemic. This has led to a reduction in operating revenues from the sector, which amounts to about 40 per cent of KDI operating revenues.
KONGSBERG has high ambitions for growth for KDI and significant investments are being made in the scaling and roll-out of new solutions and applications. This will affect EBITDA in the business area.
KDI in the future Since KONGSBERG established KDI in 2016, the business area has established itself as a leading supplier of digitalisation solutions to the energy sector and maritime industry, including the products Kognitwin® Energy and Vessel Insight. These are Software as a Service (SaaS) solutions. In 2020 and 2021, there was a focus on market positioning, and KDI experience great interest in its products and solutions. In response, the business area has recently increased capacity related to development, sales and delivery.
KEY FIGURES
1.4 - 30.6 1.1 - 30.6
MNOK 2021 2020 2021 2020 2020
Operating revenues 204 209 396 417 821
of this Recurring revenues*
83 67 160 128 278
EBITDA 10 33 1 31 34
EBITDA (%) 4,9 15,6 0,2 7,3 4,1
Order Intake 199 428 391 643 997
30.6. 31.3. 31.12.
MNOK 2021 2021 2020
Order backlog 964 972 977
No. of employees 641 598 565
Operating revenues
209 209 204
Q12019
Q2 Q3 Q4 Q12020
Q2 Q3 Q4 Q12021
Q2
Recurring Revenues*
67
83
--
Q12020
Q2 Q3 Q4 Q12020
Q2
*Recurring revenues (RR) consist of revenues from Software as aService revenues, Software Leases and Software Maintenance & UserSupport.

2nd quarter / 1st half 2021 KONGSBERG 15
In 2020 KDI signed a global framework agreement with Shell for the digitisation of current and future energy units. Kognitwin® Energy has already been delivered and is operational at both upstream and downstream facilities. Work on the delivery of multiple digital twins is being done in parallel. Going forward, the number of installed twins will increase significantly.
The digitalisation of the vessels market is an important driver for Vessel Insight. A prerequisite for digitalisation is to connect the vessel to the cloud and make contextualised data available. Vessel Insight makes this possible quickly and efficiently and provides significant benefits, from cost, efficiency, environmental and operational perspectives. There is an increasing degree of maturity in the market and in the second quarter Höegh Autoliners announced that they would install Vessel Insight on new vessels after testing the system on two of their vessels over a period of time. KDI’s ambition is to increase its number of Vessel Insight customers significantly, starting this year.
The phase that KDI now finds itself in means that it is natural to assess both future partner models and other models in order to fully realise the potential KONGSBERG sees in the sector, including a stock exchange listing in the longer term.
Orders
804
1 083 964
233
428
199
Q12019
Q2 Q3 Q4 Q12020
Q2 Q3 Q4 Q12021
Q2
Ordre intake
Order backlog

16 2nd quarter / 1st half 2021 KONGSBERG
KONGSBERG has a solid balance sheet and an order backlog of BNOK 35.8 at the end of the first half of 2021. Out of the order backlog, BNOK 11 is expected to be delivered in the second half of 2021. Order intake from the after-market is to little degree included in the order backlog. The order backlog of associated companies, in addition to framework agreements, are in addition to the reported order backlog.
During Q2, several countries started post-pandemic reopening, but restrictions and uncertainty will continue to affect the world and the markets in which the group operates. Throughout the pandemic, KDA has maintained operations at an almost normal level, and this is expected to continue in the future. For KM and KDI, several markets have been challenging, but there are signs of improvement and the group has a more optimistic view of market developments in the future. KONGSBERG has established new working methods and solutions as a consequence of the pandemic. The experience gained through this, together with continuous efficiency improvements and cost discipline, is a good basis for the group to achieve its stated objectives.
Going forward, KDA and KDI will continue to increase capacity, both to deliver the existing order backlog and to build a base for further growth. KDA has a record order backlog and is also well positioned in a number of significant international defence programmes. The maritime market has been characterised by a generally low level of vessel contracting for a number of years. In recent quarters, the contracting of new vessels has picked up in a number of segments. The company believes that this trend will continue. KONGSBERG has a technology portfolio contributing to a significant reduction in the climate footprint. The order intake so far this year shows that customers have an increased willingness to invest in more sustainable vessel and energy solutions.
Service and maintenance are a significant part of the business activities of KONGSBERG, and important to the company’s customers. KM has equipment installed on over 30,000 vessels and, in recent years, KDA has built up a significant MRO (Maintenance, Repair & Overhaul) business. The after-market has shown positive development in recent quarters, and this trend is expected to continue.
The group expects growth within KDA to contribute to growth for the group overall in 2021. For KDI, the proportion of “recurring revenue” is expected to continue increasing, while KM expects activity approximately on a par with 2020 levels.
Kongsberg, 13 July 2021
The Board of Kongsberg Gruppen ASA

2nd quarter / 1st half 2021 KONGSBERG 17

18 2nd quarter / 1st half 2021 KONGSBERG
Key figures by quarter
KONGSBERG 2021 2020 2019
MNOK 2021 Q2 Q1 2020 Q4 Q3 Q2 Q1 2019 Q4 Q3 Q2 Q1
Operating revenues 13 127 6 762 6 364 25 612 7 148 5 802 5 983 6 678 23 245 7 938 5 833 6 012 3 462
EBITDA 1 876 993 883 3 250 948 919 740 643 2 113 825 496 414 378
EBITDA (%) 14,3 14,7 13,9 12,7 13,3 15,8 12,4 9,6 9,1 10,4 8,5 6,9 10,9
EBIT 1 271 697 575 1 905 579 595 429 302 1 029 532 193 98 206
EBIT (%) 9,7 10,3 9,0 7,4 8,1 10,3 7,2 4,5 4,4 6,7 3,3 1,6 6,0
Share of net income associated companies 69 58 11 186 118 35 33 - 21 (2) (9) 29 3
Order intake 13 187 5 544 7 643 28 818 11 381 4 558 6 067 6 812 31 413 6 645 11 810 9 297 3 661
Order backlog 35 781 35 781 36 867 35 947 35 947 31 748 32 935 33 342 32 347 32 347 33 306 27 177 16 786
KONGSBERG MARITIME 2021 2020 2019
MNOK 2021 Q2 Q1 2020 Q4 Q3 Q2 Q1 2019 Q4 Q3 Q2 Q1
Operating revenues 7 898 4 092 3 807 16 319 4 319 3 695 3 762 4 543 15 198 5 263 4 041 3 989 1 905
EBITDA 879 452 427 1 532 464 411 267 390 1 005 408 223 168 206
EBITDA (%) 11,1 11,1 11,2 9,4 10,7 11,1 7,1 8,6 6,6 7,8 5,5 4,2 10,8
EBIT 549 295 254 718 236 227 86 169 356 234 33 (46) 136
EBIT (%) 6,9 7,2 6,7 4,4 5,5 6,2 2,3 3,7 2,3 4,5 0,8 (1,2) 7,1
Share of net income associated companies - - - - - - (1) 1 - - - - -
Order intake 8 294 4 220 4 074 15 925 3 822 3 439 3 850 4 813 14 427 3 858 3 345 4 917 2 306
Order backlog 11 731 11 731 11 483 11 386 11 386 11 825 12 111 12 404 11 311 11 311 12 446 12 920 5 465
KONGSBERG DEFENCE AEROSPACE 2021 2020 2019
MNOK 2021 Q2 Q1 2020 Q4 Q3 Q2 Q1 2019 Q4 Q3 Q2 Q1
Operating revenues 4 806 2 456 2 350 8 503 2 619 1 933 2 008 1 942 7 245 2 468 1 578 1 829 1 369
EBITDA 982 513 469 1 656 514 473 437 231 1 123 446 252 260 165
EBITDA (%) 20,4 20,9 20,0 19,5 19,6 24,5 21,8 11,9 15,5 18,1 16,0 14,2 12,1
EBIT 731 386 344 1 157 389 338 314 116 725 336 150 164 75
EBIT (%) 15,2 15,7 14,7 13,6 14,8 17,5 15,6 6,0 10,0 13,6 9,5 9,0 5,5
Share of net income associated companies 73 59 14 206 120 38 37 10 34 2 (5) 31 6
Order intake 4 466 1 120 3 346 11 891 7 348 987 1 788 1 769 16 060 2 509 8 254 4 160 1 137
Order backlog 23 145 23 145 24 470 23 477 23 477 18 757 19 658 19 977 20 146 20 146 20 027 13 433 10 519
KONGSBERG DIGITAL 2021 2020 2019
MNOK 2021 Q2 Q1 2020 Q4 Q3 Q2 Q1 2019 Q4 Q3 Q2 Q1
Operating revenues 396 204 192 821 220 185 209 207 799 214 176 209 200
EBITDA 1 10 (9) 34 (23) 26 33 (2) 15 - 7 (2) 9
EBITDA (%) 0,2 4,9 (4,8) 4,1 (10,4) 14,1 15,6 (1,0) 1,8 (0,1) 4,0 (0,8) 4,7
EBIT (36) (8) (28) (22) (44) 14 21 (14) (28) (10) (5) (12) (1)
EBIT (%) (9,0) (4,0) (14,4) (2,7) (19,8) 7,7 10,1 (6,6) (3,5) (4,8) (2,8) (5,8) (0,5)
Order intake 391 199 192 997 203 151 428 216 884 260 174 233 218
Order backlog 964 964 972 977 977 1 034 1 083 876 842 842 809 804 783
Due to eliminations, the sum of Business Areas does not add up to Group.

2nd quarter / 1st half 2021 KONGSBERG 19
Condensed income statement
1.4 - 30.6 1.1 - 30.6
MNOK Note 2021 2020 2021 2020 2020
Operating revenues 5 6 762 5 983 13 127 12 661 25 612
Operating expenses 9 (5 769) (5 243) (11 250) (11 279) (22 362)
EBITDA 5, 13 993 740 1 876 1 383 3 250
Depreciation (114) (122) (230) (236) (481)
Depreciation, leasing assets 7 (99) (105) (197) (203) (411)
Impairment of property, plant and equipment - - (3) - (52)
Amortisation (83) (84) (175) (167) (339)
Impairment of intangible assets - - - (45) (60)
EBIT 5, 13 697 429 1 271 731 1 905
Share of net income from joint arrangements and associated companies 6 58 33 69 33 186
Interest on leasing liabilities 7 (34) (37) (68) (73) (142)
Net financial items 8 (15) (44) (37) (54) (93)
Earnings before tax from continuing operations (EBT) 706 380 1 235 637 1 855
Income tax expense 12 (164) (107) (282) (165) (374)
Earnings after tax from continuing operations 542 274 953 472 1 481
Earnings after tax from discontinued operations - - - 1 440 1 451
Earnings after tax (EAT) 542 274 953 1 912 2 932
Attributable to:
Equity holders of the parent 522 264 927 1 891 2 891
Non-controlling interests 19 9 26 21 41
Earnings per share (EPS) / EPS diluted in NOK
-Earnings per share from continuing operations 2,95 1,47 5,18 2,51 8,01
-Earnings per share from continuing operations, diluted 2,95 1,47 5,18 2,51 8,01
-Earnings per share 2,95 1,47 5,18 10,51 16,08
-Earnings per share, diluted 2,95 1,47 5,18 10,51 16,08

20 2nd quarter / 1st half 2021 KONGSBERG
Condensed statement of comprehensive income
1.4 - 30.6 1.1 - 30.6
MNOK Note 2021 2020 2021 2020 2020
Earnings after tax 542 274 953 1 912 2 932
Specification of other comprehensive income for the period:
Items to be reclassified to profit or loss in subsequent periods:
Change in fair value, financial instruments
- Cash flow hedges 8 (10) (38) 49 (143) (118)
Tax effect cash flow hedges 2 8 (11) 31 26
Translation differences currency (45) (461) (188) 318 76
Total items to be reclassified to profit or loss in subsequent periods (53) (491) (150) 206 (16)
Items not to be reclassified to profit or loss:
Actuarial gains/losses pensions - - - - (167)
Tax effect on actuarial gain/loss on pension - - - - 36
Total items not to be reclassified to profit or loss - - - - (131)
Comprehensive income 489 (217) 804 2 118 2 785

2nd quarter / 1st half 2021 KONGSBERG 21
Condensed statement of financial position
30.6. 31.3. 31.12.
MNOK Note 2021 2021 2020
Property, plant and equipment 3 641 3 611 3 665
Leasing assets 7 1 805 1 899 1 965
Intangible assets 9 5 116 5 141 5 196
Shares in joint arrangements and associated companies 6 3 320 3 476 3 465
Other non-current assets 541 512 516
Total non-current assets 14 423 14 640 14 808
Inventories 4 097 4 268 4 132
Trade receivables 5 318 4 220 5 542
Customer contracts, asset 8 5 918 5 642 5 783
Derivatives 8 641 961 964
Other short-term receivables 781 586 580
Cash and cash equivalents 5 790 7 778 7 420
Total current assets 22 544 23 454 24 422
Total assets 36 967 38 094 39 230
Issued capital 4 5 932 5 933 5 933
Retained earnings 5 999 7 020 6 754
Other reserves 410 464 559
Non-controlling interests 74 62 55
Total equity 12 415 13 478 13 301
Long-term interest-bearing loans 8 2 453 2 471 1 971
Long-term leasing liabilities 7 1 599 1 683 1 753
Other non-current liabilities and provisions 3 2 619 2 548 2 509
Total non-current liabilities and provisions 6 671 6 701 6 233
Customer contracts, liabilities 8 10 387 9 964 11 103
Derivatives 8 345 550 546
Short-term interest-bearing loans 8 502 997 1 500
Short-term leasing liabilities 7 353 354 339
Other current liabilities and provisions 3 6 294 6 050 6 208
Total current liabilities and provisions 17 882 17 915 19 696
Total equity, liabilities and provisions 36 967 38 094 39 230
Equity ratio (%) 33,6 35,4 33,9
Net interest-bearing debt (2 835) (4 310) (3 949)

22 2nd quarter / 1st half 2021 KONGSBERG
Condensed statement of changes in equity
30.6. 31.3. 31.12
MNOK Note 2021 2021 2020
Equity opening balance 13 301 13 301 12 810
Other comprehensive income 804 315 2 785
Dividends paid (1 425) - (450)
Additional dividend paid - - (1 800)
Share buy-back related to share buy-back programme - (80) (29)
Transactions with treasury shares related to employee share programme (62) (59) (15)
Capital reduction (196) - -
Dividends, non-controlling interests (5) - -
Purchase/sale, in non-controlling interests (1) - -
Equity closing balance 12 415 13 478 13 301

2nd quarter / 1st half 2021 KONGSBERG 23
Condensed cash flow statement
1.4 - 30.6 1.1 - 30.6
MNOK Note 2021 2020 2021 2020 2020
EBITDA 993 740 1 876 1 383 3 250
EBITDA from discontinued operations - - - 40 40
Change in net current assets and other operatings-related items (645) (920) (689) (682) (539)
Net cash flow from operating activities 348 (180) 1 187 741 2 751
Dividend from joint arrangements and associated companies 147 130 147 130 130
Purchase/disposal of property, plant and equipment (130) (128) (239) (243) (506)
Proceeds from acquiring subsidiaries and associated companies (8) (39) (8) (39) (59)
Proceeds from sale of business - - - 3 631 3 051
Capitalised internal developed/ purchase of intangible assets (R&D) 9 (60) (80) (91) (147) (224)
Net cash flow from investing activities (51) (117) (190) 3 332 2 392
Net change interest-bearing loans (512) (5) (516) (540) (617)
Payment of principal portion of lease liabilities 7 (89) (83) (176) (171) (342)
Interest paid (17) (27) (40) (59) (102)
Interest paid on leasing liabilities 7 (34) (38) (68) (73) (142)
Interest income 7 9 17 24 36 57
Net payment related to employee share programme (25) 109 (91) (51) (51)
Share buy-back related to share buy-back programme (96) - (164) - (29)
Dividends paid to equity holders of the parent (1 440) (450) (1 440) (450) (450)
- of which dividends from treasury shares 15 2 15 2 2
Additional dividend - - - - (1 800)
Settlement of cross-currency swaps 8 (112) - (112) - -
Net cash flow from financing activities (2 300) (475) (2 567) (1 306) (3 474)
Effect of changes in exchange rates on cash and cash equivalents 15 (154) (60) 190 97
Net change in cash and cash equivalents (1 987) (926) (1 630) 2 957 1 766
Cash and cash equivalents at the beginning of the period 7 778 9 537 7 420 5 654 5 654
Cash and cash equivalents at the end of the period 5 790 8 610 5 790 8 610 7 420

24 2nd quarter / 1st half 2021 KONGSBERG
Note 1 | General information and principles
General informationThe consolidated financial statement for Q2 (interim financial statement) covers Kongsberg Gruppen ASA, its subsidiaries and shares in joint arrangements and associated companies that are included according to the equity method.
PrinciplesInterim financial statements are compiled in accordance with IAS 34 (interim reporting), stock exchange regulations and the additional requirements of the Securities Trading Act. Interim financial statements do not include the same amount of information as the full financial statements and should be read in the context of the consolidated financial statements for 2020. The consolidated financial statements for 2020 were prepared in compliance with the Norwegian Accounting Act and international standards for financial reporting (IFRS) established by the EU.
The consolidated financial statements for 2020 are available on www.kongsberg.com.
The interim financial statement has not been audited.
Note 2 | New standards as from 1.1.2021
The accounting principles used in the quarterly report are the same principles as those applied to the consolidated financial statements for 2020 , with the exception of changes to IFRS 9, IFRS 7 and IFRS 16 regarding amendments to new interest-rate benchmarks, which was implemented 1 January 2021 . The implementation of the changes has not had any significant effect on the consolidated financial statements.
Note 3 | Estimates
Preparing the interim financial statement involves assessments, estimates and assumptions that affect the use of accounting principles and posted amounts for assets and obligations, revenues and expenses. Actual results may deviate from these estimates. The key considerations in connection with the application of the Group’s accounting principles and the major sources of uncertainty remain the same as when the 2020 consolidated financial statements was compiled.
Note 4 | Capital reduction
KONGSBERG’s Annual General Meeting resolved on 6 May 2021 to reduce the company’s share capital by NOK 1, 445, 773.75 from NOK 224,987,581.25, through cancellation and redemption of 1, 156, 619 shares.
Following the capital reduction, the share capital of KONGSBERG is NOK 223, 541, 807.50 divided into 178, 833, 446 shares of NOK 1,25 each.

2nd quarter / 1st half 2021 KONGSBERG 25
Note 5 | Segment information
OPERATING REVENUES EBITDA EBIT
1.4 - 30.6 1.1 - 30.6 1.4 - 30.6 1.1 - 30.6 1.4 - 30.6 1.1 - 30.6
MNOK 2021 2020 2021 2020 2020 2021 2020 2021 2020 2020 2021 2020 2021 2020 2020
KM 4 092 3 762 7 898 8 305 16 319 452 267 879 657 1 532 295 86 549 255 718
KDA 2 456 2 008 4 806 3 950 8 503 513 437 982 668 1 656 386 314 731 430 1 157
Other1) 215 213 423 406 790 28 35 15 58 62 15 29 (8) 46 30
Group 6 762 5 983 13 127 12 661 25 612 993 740 1 876 1 383 3 250 697 429 1 271 731 1 905
1) Other activities consist of Kongsberg Digital (KDI), property and corporate functions. For information about KDI see separate section.
Operating revenues YTD by division:
MNOK 2021 2020
Divisions
Global customer suppport & Services 3 690 3 776
Integrated Solutions 1 857 2 317
Sensor & Robotics 1 386 1 427
Propulsion & Engines 1 227 1 071
Deck Machinery 495 365
Other/elimination (757) (651)
Kongsberg Maritime 7 898 8 305
Land Systems 1 437 958
Integrated Defence Systems 1 504 1 165
Aerostructures 1 195 1 088
Missile Systems 735 674
Space & Surveillance 362 289
Other/elimination (427) (224)
Kongsberg Defence & Aerospace 4 806 3 950
Other/elimination 423 406
Total revenues 13 127 12 661
The table shows the anticipated date on which remaining performance obligations as of 30 June 2021 are recognised as income:
2021 2020
Date of revenue recognition Date of revenue recognition
MNOK
Order backlog 30.6.21 2021 2022
2023 and later
Order backlog 30.6.20 2020 2021
2022 and later
Kongsberg Martime 11 731 5 705 4 127 1 899 12 155 5 672 5 062 1 421
Kongsberg Defence & Aerospace 23 145 5 022 7 706 10 418 19 659 4 557 7 442 7 660
Other/elimination 905 301 394 210 1 122 417 373 331
Total 35 781 11 028 12 226 12 527 32 935 10 645 12 877 9 412

26 2nd quarter / 1st half 2021 KONGSBERG
Note 6 | Shares in joint arrangements and associated companies
Specification of movement in the balance sheet line “Shares in joint arrangements and associated companies”1 January to 30 June
MNOK Ownership
Carrying amount 1.1.2021
Additions/ disposals
Dividends received
Share of net income 1)
Other items and
comprehensive income
Carrying amount 30.6.21
Patria Oyj 49,9 % 2 841 - (84) 20 (69) 2 707
Kongsberg Satellite Services AS 50,0 % 557 - (63) 62 - 556
Other shares 68 2 - (12) - 57
Total 3 465 2 (147) 69 (69) 3 320
1) The share of net result is included after tax and amortisation of excess value.
Share of net result from Patria:
1.4 - 30.6 1.1 - 30.6 1.1 - 30.6 1.1 - 30.6 1.1. - 31.12
Millions 2021 2020 2021 2020 2020
KONGSBERG's share (49,9%) 1) 39 12 27 12 132
Amortisation of excess values after tax (4) (6) (7) (12) (25)
Share of net income recognised in KDA for the period 35 6 20 - 108
1) Share of Patria's net income after tax adjusted for non-controlling interests and net income from KAMS.
Share of net income and dividend from associated companies per business:
Share of net income Dividend
1.4 - 30.6 1.1 - 30.6 1.4 - 30.6 1.1 - 30.6
MNOK 2021 2020 2021 2020 2020 2021 2020 2021 2020 2020
KM - (1) - - - - - - - -
KDA 59 37 73 47 206 147 130 147 130 130
Other (1) (3) (4) (14) (20) - - - - -
Group 58 33 69 33 186 147 130 147 130 130

2nd quarter / 1st half 2021 KONGSBERG 27
Note 7 | Leasing
KONGSBERG has leases that are primarily related to land and buildings, as well as leases for machinery, vehicles and equipment.
IFRS 16 effects on condensed statement of financial position:
Opening balance 1 January 2021 1 965
Addition 47
Depreciation Q1 (98)
Translation differences (16)
Opening balance 1 April 2021 1 899
Addition 5
Disposal (4)
Depreciation Q2 (99)
Translation differences 4
Closing balance 30 June 2021 1 805
30.6.2021 31.3.2021 31.12.2020
Leasing assets 1 805 1 899 1 965
Long-term leasing liabilities 1 599 1 683 1 753
Short-term leasing liabilities 353 354 339
IFRS 16 effects on condensed income statement in the period:
1.4 - 30.6 1.1 - 30.6
2021 2020 2021 2020 2020
Returned rental cost earlier included in EBITDA 122 121 243 244 484
Profit/Loss on disposed leases - - 1 - -
Increased EBITDA in the period 122 121 244 244 484
Depreciation on leases (99) (105) (197) (203) (411)
Increased EBIT in the period 24 16 47 41 73
Interest cost on leasing liabilities for the period (34) (37) (68) (73) (142)
Reduced EBT in the period (10) (21) (21) (32) (69)

28 2nd quarter / 1st half 2021 KONGSBERG
Note 8 | Financial instruments
Loans and credit facilities The group has five bond loans amounting to a total of MNOK 2,950. The loans are classified as long-term loans, except KOG12 (nominal value of MNOK 500), which is due within a year and are reclassified to short-term loans. The maturity dates of the long-term bond loans range from 5 December 2023 to 2 June 2026. In addition, the group has a syndicated credit facility of MNOK 2,300 and an overdraft credit facility of MNOK 500. Neither are utilised.
Interest-bearing loans:
30.6.2021 31.12.2020
MNOK Due dateNominal
interest rate Value1 Value1
Long-term loans:
Bond issue KOG09 - fixed interest rate 02.06.2026 3,20% 1 000 1 000
Bond issue KOG11 - fixed interest rate 05.12.2023 2,90% 450 450
Bond issue KOG13 - floating interest rate 06.06.2024 1,43% 500 500
Bond issue KOG14 - floating interest rate2 26.02.2026 1,12% 500 -
Other long-term loans3 3 21
Total long-term loans 2 453 1 971
Short-term loans:
Bond issue KOG12 - floating interest rate4 06.12.2021 1,11% 500 500
Other short-term loans 2 -
Total short-term loans 502 500
Total interest-bearing loans 2 955 2 471
Syndicated credit facility (unutilised borrowing limit) 15.03.2023 2 300 2 300
Overdraft facility (unutilised) 500 500
1) Value is equal to nominal amount. For long-term bond loans, the carrying amount is equal to the nominal amount.2) KONGSBERG issued MNOK 500 on 22 February 2021 in a new bond with a 5-year tenor and a floating rate coupon of 3M NIBOR + 0.86% p.a. The issue is subject to a prospectus, which will be issued in due course. The bonds will be applied for listing at Oslo Stock Exchange.
3) Other long-term loans consist of minor loans in some of the Group’s subsidiaries.
4) The bond issue KOG12 was reclassified to short-term loans at 31 December 2020.

2nd quarter / 1st half 2021 KONGSBERG 29
Forward exchange contracts Fair value of balances classified as cash flow hedges, as shown in the condensed statement of comprehensive income, has been increased by MNOK 49 before tax during the period 1 January – 30 June 2021. The total change in net fair value of fair value hedges represents a decrease of MNOK 251 from the end of last year. The end-of-quarter spot prices were USD/NOK 8.48, EUR/NOK 10.12 and GBP/NOK 11.77.
Forward exchange contracts classified as cash flow hedges:
Due in 2021 Due in 2022 or later Total
MNOK Value in NOK on
agreed ratesFair value at
30.6.21Value in NOK on
agreed ratesFair value at
30.6.21Value in NOK on
agreed rates
Change in fair value from
31.12.20Fair value at
30.6.21
USD (100) (39) 247 (38) 147 (8) (77)
EUR 120 3 (84) (3) 36 9 (0)
Other (31) 0 (42) (2) (73) (1) (1)
Sum (11) (36) 122 (43) 110 0 (78)
Roll-over of currency futures
(27) (60) 33 (87)
Total (11) (62) 122 (102) 110 34 (165)
Forward exchange contracts cash flow hedges, assets 12
Forward exchange contracts cash flow hedges, liabilities 90
Net forward exchange contracts cash flow hedges (78)
Fair value is referring to the net present value of the variance between the revaluated forward rate at 30 June 2021 and the forward rate at the time of entering the forward exchange contract.
The difference (MNOK 15) between changes in the fair value of balances classified as cash flow hedges (MNOK 49) and changes in fair value on forward exchange contracts (MNOK 34) is ascribable to a change in fair value of cross-currency swaps (MNOK 27) and revers of fair value of terminated currency options with net MNOK -11.
Forward exchange contracts classified as fair value hedges:
Due in 2021 Due in 2022 or later Total
MNOKValue in NOK on
agreed ratesFair value at
30.6.21Value in NOK on
agreed ratesFair value at
30.6.21Value in NOK on
agreed rates
Change in fair value from
31.12.20Fair value at
30.6.21
USD 4 920 112 3 467 95 8 387 (198) 207
EUR 1 804 38 3 235 102 5 039 45 140
GBP 273 9 898 (8) 1 171 (14) 1
Other 381 7 74 24 455 (84) 30
Total 7 377 165 7 674 213 15 051 (251) 378
Forward exchange contracts fair value hedges, assets 629
Forward exchange contracts fair value hedges, liabilities 251
Net forward exchange contracts fair value hedges 378
The net value of fair value hedges is recognized as derivates in the statement of financial position, offset against customer contracts, assets by MNOK 314 (decrease) and customer contracts, liabilities by MNOK 64 (increase).

30 2nd quarter / 1st half 2021 KONGSBERG
Specification of derivatives:
30.6. 31.3. 31.12.
MNOK 2021 2021 2020
Forward exchange contracts, cash flow hedges 12 6 23
Forward exchange contracts, fair value hedges 629 945 924
Currency options - 9 17
Total derivatives, current assets 641 961 964
Forward exchange contracts, cash flow hedges 90 125 101
Forward exchange contracts, fair value hedges 251 341 295
Cross-currency swaps 5 82 144
Currency options - 2 6
Total derivatives, current liabilities 346 550 546
Cross-currency swaps
Subsequent to the acquisition of shares in Patria Oyj in 2016 cross-currency swaps totalling MEUR 130 were entered in order to partially hedge a net investment in a foreign entity. These cross-currency swaps totalling MEUR 140 are rolled forward in Q2 and effect the cash flow negatively MNOK 112 in the quarter.

2nd quarter / 1st half 2021 KONGSBERG 31
Note 9 | Product development
Product maintenance cost and development recognised in the income statement during the period:
1.4 - 30.6 1.1 - 30.6
MNOK 2021 2020 2021 2020 2020
Product maintenance 105 95 213 200 414
Development cost 271 234 532 472 939
Total 376 329 745 671 1 353
Capitalised development recognised during the period:
1.4 - 30.6 1.1 - 30.6
MNOK 2021 2020 2021 2020 2020
Capitalised development 58 83 90 147 223
The largest capitalised projects are related to the development of a digital platform (Kognifai), Joint Strike Missile (JSM) and other missiletechnology, medium-calibre weapon station (MCT and RWS), communication solutions and remote towers for airports.
Note 10 | Related parties
The Board is not aware of any changes or transactions in Q2 associated with related parties that in any significant way have an impact on the Group’s financial position and profit for the period.
Note 11 | Important risk and uncertainty factors
The Group’s risk management is described in the 2020 annual report. No new risk and uncertainty factors emerged during this quarter.
Note 12 | Tax
The income tax expense as of Q2 is calculated to be 22.2 per cent of earnings before tax. The income tax expense is affected by non-deductible costs and the fact that shares of net income from associated companies are recognised after tax.

32 2nd quarter / 1st half 2021 KONGSBERG
Note 13 | Definitions
Definitions
KONGSBERG uses terms in the consolidated financial statements that are not anchored in the IFRS accounting standards. Our definitions and explanations of these terms follow below.
Kongsberg considers EBITDA and EBIT to be normal accounting terms, but they are not included in the IFRS accounting standards. EBITDA is the abbreviation of “Earnings Before Interest, Taxes, Depreciation and Amortisation”. KONGSBERG uses EBITDA in the income statement as a summation line for other accounting lines. These accounting lines are defined in our accounting principles, which are part of the 2020 financial statements. The same applies to EBIT.
Restructuring costs consist of salaries and social security tax upon termination of employment (such as severance and gratuity) in connection with workforce reductions. In addition to this are rent and other related costs and any one-off payments in the event of the premature termination of tenancy agreements for premises that are not in use.
Integration costs are those associated with integrating Commercial Marine into Kongsberg Maritime.
Net interest-bearing debt is the net amount of the accounting lines “Cash and cash equivalents” and “Short- and long-term interest-bearing liabilities, excluding leasing commitments”.
Return on Average Capital Employed (ROACE) is defined as the 12-month rolling EBIT including share of net income from joint arrangements and associated companies, excluding IFRS 16 divided by the 12-month mean of recognised equity and net interest-bearing debt.
Working capital is defined as current assets (except cash and cash equivalents) minus non-interest-bearing liabilities (except taxes payable). Financial instruments classified as cash flow hedges are not included in working capital.
Working capital is calculated as follow:
30.6. 31.3. 31.12.
MNOK 2021 2021 2020
Current assets 22 544 23 454 24 422
Current liabilities and provisions (17 882) (17 915) (19 696)
Adjusted for:
Cash and cash equivalents (5 790) (7 778) (7 420)
Short-term interest-bearing loans 502 997 1 500
Short-term leasing liabilities 353 354 339
Net tax payable 75 92 66
Financial instruments classified as cash flow hedges 170 271 332
Working capital (28) (524) (458)
Book-to-bill ratio is order intake divided by operating revenues.
Recurring revenues consist of revenues from Software as a Service revenues, Software Leases and Software Maintenance & User Support.
Organic growth is change in operating revenues exclusive acquired companies.

2nd quarter / 1st half 2021 KONGSBERG 33
Statement from the Board of Directors and CEO
We hereby confirm that, to the best of our conviction, the H1 accounts for 1 January to 30 June 2021 have been prepared in compliance with IAS 34 – Interim Reporting, and that the information disclosed in the H1 accounts gives an accurate picture of the Group’s assets, liabilities, financial position and performance as a whole, and gives an accurate picture of the information mentioned in §5-6, fourth subsection, of Norway’s Securities Trading Act.
Kongsberg, 13 July 2021
Eivind ReitenChairman
Anne-Grete Strøm-ErichsenDeputy Chairman
Merete HvervenDirector
Morten HenriksenDirector
Per A. SørlieDirector
Rune FanøyDirector
Oda Linn A. EllingsenDirector
Jo Even BjerknesDirector
Geir HåøyPresident and CEO
This translation from Norwegian of KONGSBERG’s first half report of 2021 has been made for information purposes only.

34 2nd quarter / 1st half 2021 KONGSBERG