Embed Size (px)
Citation preview

Quarterly Report 2012
1
UNCONSOLIDATED CONDENSED INTERIM FINANCIAL INFORMATION
Company Information 2
Directors’ Review 3
Unconsolidated Condensed Interim Balance Sheet 4
Unconsolidated Condensed Interim Profit and Loss Account 6
Unconsolidated Condensed Interim Statement of Comprehensive Income 7
Unconsolidated Condensed Interim Cash Flow Statement 8
Unconsolidated Condensed Interim Statement of Changes in Equity 9
Selected Notes to the Unconsolidated Condensed Interim Financial Information 10
CONSOLIDATED CONDENSED INTERIM FINANCIAL INFORMATION
Directors’ Review on Consolidated Interim Financial Information 19
Condensed Interim Consolidated Balance Sheet 20
Condensed Interim Consolidated Profit and Loss Account 22
Condensed Interim Consolidated Statement of Comprehensive Income 23
Condensed Interim Consolidated Cash Flow Statement 24
Condensed Interim Consolidated Statement of Changes in Equity 25
Selected Notes to the Condensed Interim Consolidated Financial Information 26
CONTENTS

2
Company Information
BOARD OF DIRECTORSMR. TARIQ SAYEED SAIGOL CHAIRMANMR. TAUFIQUE SAYEED SAIGOL CHIEF EXECUTIVEMR. SAYEED TARIQ SAIGOL MR. WALEED TARIQ SAIGOL MR. DANIAL TAUFIQUE SAIGOL MR. ZAMIRUDDIN AZAR MR. ARIF IJAZ SYED MOHSIN RAZA NAQVI AUDIT COMMITTEEMR. ZAMIRUDDIN AZAR CHAIRMANMR. SAYEED TARIQ SAIGOL MEMBERMR. WALEED TARIQ SAIGOL MEMBERMR. DANIAL TAUFIQUE SAIGOL MEMBERMR. ARIF IJAZ MEMBER
CHIEF FINANCIAL OFFICER SYED MOHSIN RAZA NAQVI
COMPANY SECRETARYMR. MUHAMMAD ASHRAF
CHIEF INTERNAL AUDITORMR. BILAL HUSSAIN
AUDITORSM/S. RIAZ AHMAD & COMPANYCHARTERED ACCOUNTANTS
REGISTERED OFFICE42-LAWRENCE ROAD, LAHORE.TEL: (92-042) 36302261-62FAX: (92-042) 36368721
SHARE REGISTRARVISION CONSULTING LTD 3-C, LDA FLATS, LAWRENCE ROAD, LAHORE.TEL: (92-042) 36375531-36375339FAX: (92-042) 36374839E-MAIL: [email protected]: www.vcl.com.pk BANKERSAL BARAKA BANK (PAKISTAN) LIMITEDALLIED BANK LIMITEDASKARI BANK LIMITEDBANK ALFALAH LIMITEDBANK AL-HABIB LIMITEDBURJ BANK LTDCITIBANK N.A.FAYSAL BANK LIMITEDHSBC BANK MIDDLE EAST LIMITEDMCB BANK LIMITEDMEEZAN BANK LIMITEDNATIONAL BANK OF PAKISTANNIB BANK LIMITEDSAUDI PAK INDUSTRIAL & AGRICULTURAL INVESTMENT CO. LTD.SILK BANK LIMITEDSTANDARD CHARTERED BANK (PAKISTAN) LIMITEDTHE BANK OF PUNJABUNITED BANK LIMITED
MILLS• PESHAWAR ROAD, RAWALPINDI TEL: (92-051) 5473940-3 FAX: (92-051) 5471795• 8TH K.M., MANGA RAIWIND ROAD, DISTRICT KASUR TEL: (92-042) 35394133-35 FAX: (92-042) 35394132 • GULYANA ROAD, GUJAR KHAN, DISTRICT RAWALPINDI TEL: (92-0513) 564472-74 FAX: (92-0513) 564337 WEB SITE: www.kmlg.com
Note: KTML’S FINANCIAL STATEMENTS ARE ALSO AVAILABLE AT THE ABOVE WEBSITE.

Quarterly Report 2012
3
The Directors present un-audited accounts of the Company for the nine months ended March 31, 2012, in compliance with requirements of Section 245 of the Companies Ordinance, 1984.
OPERATING AND FINANCIAL RESULTS
The Company recorded after-tax profit of Rs.16.653 million for the nine months ended on March 31, 2012, as compared to after-tax profit of Rs.140.023 million during the corresponding period last year.
Sales turnover for the period amounted to Rs.7,927.963 million, a substantial decrease of 18.16% from last year due to considerably reduced cotton prices this year resulting in sharp depreciation in selling rates for the Company’s products. The Company earned gross profit of Rs.1,252.469 million (15.80%), relative to gross profit of Rs.1,527.669 million (15.77%) during the same period last year. Operating profit before adjustment for financial charges amounted to Rs.844.694 million for the period under review, compared to Rs.1,016.383 million during the previous corresponding period.
The period under review has been marked by significant shortages of natural gas and electricity which necessitated the use of Heavy Furnace Oil (HFO) and Liquid Petroleum Gas (LPG) to generate energy for operations. The high cost associated with this substitution has resulted in much reduced margins than was originally envisaged for the third quarter.
The Company’s spinning segments have performed well over this period despite use of expensive energy resulting in lower than expected profitability. The impact of this has been somewhat contained due to completion of arrangements for electricity supply from IESCO. The economics of the spinning business continue to exhibit a favorable trend as the domestic fine thread count business thrives on the back of robust sales of ladies clothing, particularly lawns and voiles. The Company has procured, at reasonable prices, raw material stocks sufficient for spinning operations till the arrival of the new crop. We expect a strong performance from this segment through the upcoming period.
The weaving segment continues to operate at full capacity and contributed well to the bottom line of the Company. However, the outlook for home textiles is less favorable, as the sector continues to face difficulties due to ongoing recession in Europe and North America. This situation, as well as the continuing increases in utility costs, has negatively impacted our financial results. The Company continues in its efforts to reduce costs to offset inflationary trends.
The energy shortages have also had a negative impact on the company’s Processing and Cut & Sew operations. However, as yarn prices are considerably lower than last year, these segments have delivered improved results. The Company continues to work to improve yields, and has taken stringent cost reduction measures. Further, marketing efforts are continuing to locate customers requiring higher thread count products which we consider to be our niche market. This, combined with our expectation of improved availability of natural gas over the warmer months, leads us to hold an optimistic outlook for the next quarter.
ACKNOWLEDGEMENTS
As always, the Company remains thankful to all its employees, partners, and stakeholders for their efforts and continued support.
For and on behalf of the Board
Lahore Taufique Sayeed SaigolApril 25, 2012 Chief Executive Officer
Directors’ Review

4
Un-audited Audited Note 31 March 30 June 2012 2011
(Rupees in thousand)EQUITY AND LIABILITIES SHARE CAPITAL AND RESERVES Authorized share capital 370,000,000 (30 June 2011 : 370,000,000) 3,700,000 3,700,000 ordinary shares of Rupees 10 each 30,000,000 (30 June 2011 : 30,000,000) preference 300,000 300,000 shares of Rupees 10 each 4,000,000 4,000,000 Issued, subscribed and paid-up share capital 245,526,216 (30 June 2011 : 245,526,216) ordinary shares of Rupees 10 each 2,455,262 2,455,262 Reserves 1,948,027 1,931,374
Total equity 4,403,289 4,386,636 Surplus on revaluation of land and investment properties 3,685,497 3,685,497 NON-CURRENT LIABILITIES Long term financing 5 843,536 1,318,710 Liabilities against assets subject to finance lease 23,264 42,843 Deferred income tax liability 125,734 62,141
992,534 1,423,694 CURRENT LIABILITIES Trade and other payables 1,120,365 834,691 Due to subsidiary company 185,405 - Accrued mark-up 206,547 230,138 Short term borrowings 4,329,734 5,130,265 Current portion of non-current liabilities 726,755 611,744
6,568,806 6,806,838
TOTAL LIABILITIES 7,561,340 8,230,532 CONTINGENCIES AND COMMITMENTS 6 TOTAL EQUITY AND LIABILITIES 15,650,126 16,302,665 The annexed notes form an integral part of this unconsolidated condensed interim financial information.
Unconsolidated Condensed Interim Balance Sheet As at 31 March 2012
CHIEF EXECUTIVE OFFICER
LahoreApril 25, 2012

Quarterly Report 2012
5
Un-audited AuditedNote 31 March 30 June
2012 2011
(Rupees in thousand)ASSETS
NON-CURRENT ASSETS
Property, plant and equipment 7 6,613,520 6,747,691 Intangible assets 7,104 9,563 Investment properties 1,721,714 1,721,714 Long term investments 8 3,248,680 3,248,880 Long term deposits 54,390 35,758
11,645,408 11,763,606
CURRENT ASSETS
Stores, spare parts and loose tools 325,124 328,393 Stock-in-trade 1,658,857 1,657,252 Trade debts 845,664 707,400 Advances 296,198 241,331 Security deposits and short term prepayments 22,415 19,045 Accrued interest - 46 Due from subsidiary companies - 601,144 Other receivables 352,727 432,943 Short term investments 841 600 Taxation recoverable 130,806 129,909 Cash and bank balances 372,086 420,996
4,004,718 4,539,059
TOTAL ASSETS 15,650,126 16,302,665
DIRECTORDIRECTOR
6
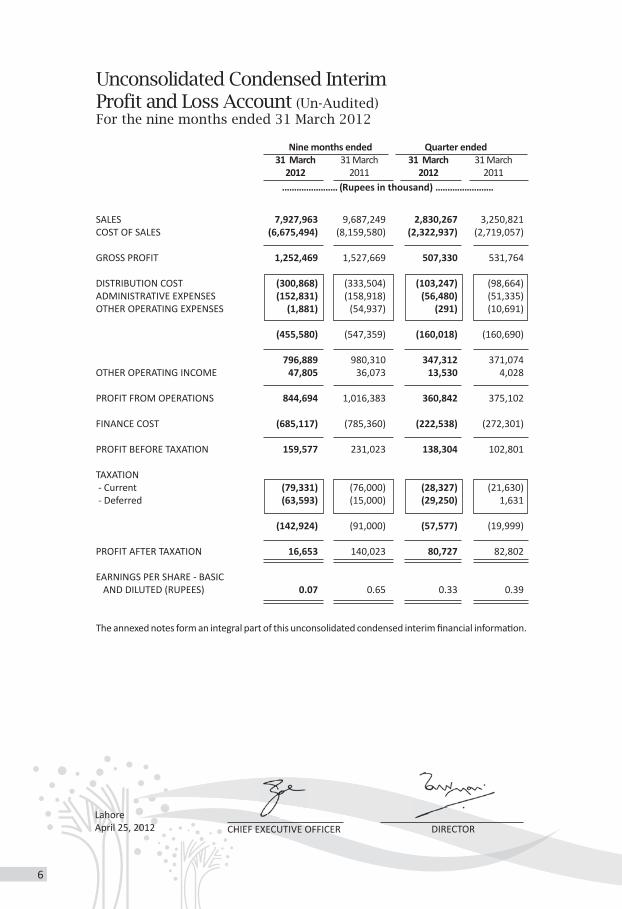
Unconsolidated Condensed Interim Profit and Loss Account (Un-Audited)For the nine months ended 31 March 2012
CHIEF EXECUTIVE OFFICER DIRECTORLahoreApril 25, 2012
Nine months ended Quarter ended 31 March 31 March 31 March 31 March 2012 2011 2012 2011 ....................... (Rupees in thousand) ........................
SALES 7,927,963 9,687,249 2,830,267 3,250,821 COST OF SALES (6,675,494) (8,159,580) (2,322,937) (2,719,057)
GROSS PROFIT 1,252,469 1,527,669 507,330 531,764 DISTRIBUTION COST (300,868) (333,504) (103,247) (98,664)ADMINISTRATIVE EXPENSES (152,831) (158,918) (56,480) (51,335)OTHER OPERATING EXPENSES (1,881) (54,937) (291) (10,691)
(455,580) (547,359) (160,018) (160,690)
796,889 980,310 347,312 371,074 OTHER OPERATING INCOME 47,805 36,073 13,530 4,028
PROFIT FROM OPERATIONS 844,694 1,016,383 360,842 375,102 FINANCE COST (685,117) (785,360) (222,538) (272,301)
PROFIT BEFORE TAXATION 159,577 231,023 138,304 102,801 TAXATION - Current (79,331) (76,000) (28,327) (21,630) - Deferred (63,593) (15,000) (29,250) 1,631 (142,924) (91,000) (57,577) (19,999)
PROFIT AFTER TAXATION 16,653 140,023 80,727 82,802 EARNINGS PER SHARE - BASIC AND DILUTED (RUPEES) 0.07 0.65 0.33 0.39
The annexed notes form an integral part of this unconsolidated condensed interim financial information.

Quarterly Report 2012
7
Unconsolidated Condensed Interim Statementof Comprehensive Income (Un-Audited)For the nine months ended 31 March 2012
CHIEF EXECUTIVE OFFICER DIRECTORLahoreApril 25, 2012
Nine months ended Quarter ended 31 March 31 March 31 March 31 March 2012 2011 2012 2011 ....................... (Rupees in thousand) ........................
PROFIT AFTER TAXATION 16,653 140,023 80,727 82,802 OTHER COMPREHENSIVE INCOME Surplus on remeasurement of available for sale investment - 120,805 - (79,918)Deferred income tax on remeasurement of available for sale investment - (31,711) - 20,978
Other comprehensive income / (loss) for the period - net of tax - 89,094 - (58,940) TOTAL COMPREHENSIVE INCOME FOR THE PERIOD 16,653 229,117 80,727 23,862 The annexed notes form an integral part of this unconsolidated condensed interim financial information.

8
Unconsolidated Condensed Interim Cash Flow Statement (Un-Audited)For the nine months ended 31 March 2012
Nine months ended Note 31 March 31 March 2012 2011 (Rupees in thousand)
CASH FLOWS FROM OPERATING ACTIVITIES Cash generated from operations 9 1,517,292 2,176,935 Finance cost paid (708,708) (835,929)Income tax paid (80,228) (97,303)Worker’s Profit Participation Fund paid - (14,520)Net (increase) / decrease in long term deposits (18,632) 15,236
Net cash generated from operating activities 709,724 1,244,419 CASH FLOWS FROM INVESTING ACTIVITIES Capital expenditure on property, plant and equipment (133,309) (86,763)Investment made - (172)Interest received 9,685 420 Proceeds from sale of property, plant and equipment 1,408 1,455 Proceeds from disposal of investments 543,905 9,004 Proceeds from sale of land classified as held for sale - 120,000 Advance against sale of land received back - 100,000 Dividend received - 6,590
Net cash from investing activities 421,689 150,534 CASH FLOWS FROM FINANCING ACTIVITIES Short term borrowings - net (800,531) (852,649)Repayment of long term financing (349,914) (477,316)Repayment of liabilities against assets subject to finance lease (29,828) (51,815)Dividend paid (50) - Net cash used in financing activities (1,180,323) (1,381,780)
NET (DECREASE) / INCREASE IN CASH AND CASH EQUIVALENTS (48,910) 13,173 CASH AND CASH EQUIVALENTS AT THE BEGINING OF THE PERIOD 420,996 78,851 CASH AND CASH EQUIVALENTS AT THE END OF THE PERIOD 372,086 92,024 The annexed notes form an integral part of this unconsolidated condensed interim financial information.
CHIEF EXECUTIVE OFFICER DIRECTORLahoreApril 25, 2012

Quarterly Report 2012
9
Un
con
soli
dat
ed C
on
den
sed
In
teri
m S
tate
men
t of
Ch
anges
in
Eq
uit
y (U
n-A
ud
ited
)Fo
r th
e n
ine
mon
ths
end
ed 3
1 M
arch
20
12
-
----
----
----
----
----
----
----
----
----
----
----
----
----
----
----
----
----
----
----
----
----
----
-(Ru
pees
in th
ousa
nd)-
----
----
----
----
----
----
----
----
----
----
----
----
----
----
----
----
----
----
----
----
----
-
Bala
nce
as a
t 30
June
201
0 - (
Aud
ited
) 1
,455
,262
1
44,9
19
462
,483
6
07,4
02
1,4
50,4
91
(151
,887
) 1
,298
,604
1
,906
,006
3
,361
,268
Ord
inar
y sh
ares
issu
ed o
ther
than
thro
ugh
a ri
ght i
ssue
1
,000
,000
-
-
-
-
-
-
-
1
,000
,000
To
tal c
ompr
ehen
sive
inco
me
for
the
nine
mon
ths
en
ded
31 M
arch
201
1 -
-
8
9,09
4
89,
094
-
1
40,0
23
140
,023
2
29,1
17
229
,117
Bala
nce
as a
t 31
Mar
ch 2
011
- (U
n-au
dite
d)
2,4
55,2
62
144
,919
5
51,5
77
696
,496
1
,450
,491
(1
1,86
4)
1,4
38,6
27
2,1
35,1
23
4,5
90,3
85
To
tal c
ompr
ehen
sive
loss
for
the
peri
od
en
ded
30 Ju
ne 2
011
-
(5
51,5
77)
(551
,577
) -
3
47,8
28
347
,828
(2
03,7
49)
(203
,749
)
Bala
nce
as a
t 30
June
201
1 - (
Aud
ited
) 2
,455
,262
1
44,9
19
-
144
,919
1
,450
,491
3
35,9
64
1,7
86,4
55
1,9
31,3
74
4,3
86,6
36
To
tal c
ompr
ehen
sive
inco
me
for
the
nine
mon
ths
en
ded
31 M
arch
201
2 -
-
-
-
-
1
6,65
3
16,
653
1
6,65
3
16,
653
Ba
lanc
e as
at 3
1 M
arch
201
2 - (
Un-
audi
ted)
2
,455
,262
1
44,9
19
-
144
,919
1
,450
,491
3
52,6
17
1,8
03,1
08
1,9
48,0
27
4,4
03,2
89
The
anne
xed
note
s fo
rm a
n in
tegr
al p
art o
f thi
s un
cons
olid
ated
con
dens
ed in
teri
m fi
nanc
ial i
nfor
mati
on.
SHA
RE
CAPI
TAL
Shar
ePr
emiu
mFa
ir V
alue
Rese
rve
Sub
Tota
lG
ener
alRe
serv
e
Una
ppro
pria
ted
profi
t / (A
ccum
ulat
ed
Loss
)
TOTA
LTO
TAL
EQU
ITY
Sub
Tota
l
CAPI
TAL
RES
ERV
ESR
EVEN
UE
RES
ERV
ES
RES
ERV
ES
DIR
ECTO
RCH
IEF
EXEC
UTI
VE O
FFIC
ERCH
IEF
EXEC
UTI
VE O
FFIC
ERD
IREC
TOR
Laho
reA
pril
25, 2
012

10
Selected Notes to the Unconsolidated Condensed Interim Financial Information (Un-Audited)For the nine months ended 31 March 2012
1. THE COMPANY AND ITS OPERATIONS
Kohinoor Textile Mills Limited is a public limited company incorporated in Pakistan under the Companies Act, 1913 (Now Companies Ordinance, 1984) and listed on all Stock Exchanges in Pakistan. The registered office of the Company is situated at 42 Lawrence Road, Lahore. The principal activity of the Company is manufacturing of yarn and cloth, processing and stitching the cloth and trade of textile products.
2. BASIS OF PREPARATION
This unconsolidated condensed interim financial information is un-audited and is being submitted to shareholders as required by section 245 of the Companies Ordinance, 1984. This unconsolidated condensed interim financial information of the Company for the nine months ended 31 March 2012 has been prepared in accordance with the requirements of International Accounting Standard (IAS) 34 “Interim Financial Reporting” and provisions of and directives issued under the Companies Ordinance, 1984. In case where requirements differ, the provisions of or directives issued under the Companies Ordinance, 1984 have been followed. This unconsolidated condensed interim financial information should be read in conjunction with the audited annual published financial statements of the Company for the year ended 30 June 2011.
3. ACCOUNTING POLICIES
The accounting policies and methods of computation adopted for the preparation of this unconsolidated condensed interim financial information are the same as applied in the preparation of the preceding audited annual published financial statements of the Company for the year ended 30 June 2011.
4. CRITICAL ACCOUNTING ESTIMATES AND JUDGEMENTS
The preparation of this unconsolidated condensed interim financial information in conformity with the approved accounting standards requires the use of certain critical accounting estimates. It also requires the management to exercise its judgment in the process of applying the Company’s accounting policies. Estimates and judgments are continually evaluated and are based on historical experience and other factors, including expectations of future events that are believed to be reasonable under the circumstances.
During preparation of this unconsolidated condensed interim financial information, the significant judgments made by the management in applying the Company’s accounting policies and the key sources of estimation and uncertainty were the same as those that applied in the preceding audited annual published financial statements of the Company for the year ended 30 June 2011.
Quarterly Report 2012
11
Un-audited Audited31 March 30 June
2012 2011(Rupees in thousand)
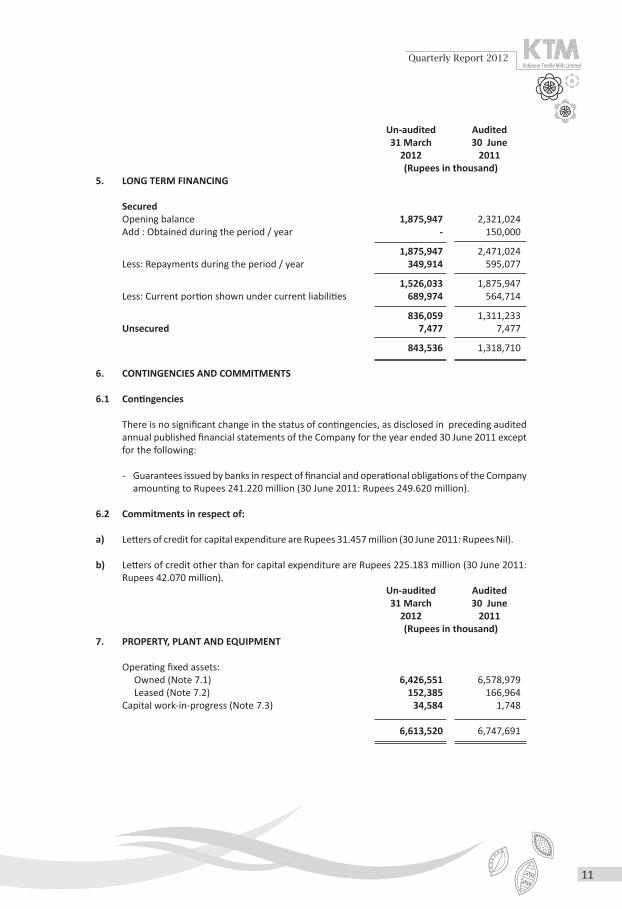
5. LONG TERM FINANCING
Secured Opening balance 1,875,947 2,321,024 Add : Obtained during the period / year - 150,000
1,875,947 2,471,024 Less: Repayments during the period / year 349,914 595,077
1,526,033 1,875,947 Less: Current portion shown under current liabilities 689,974 564,714
836,059 1,311,233 Unsecured 7,477 7,477
843,536 1,318,710 6. CONTINGENCIES AND COMMITMENTS 6.1 Contingencies
There is no significant change in the status of contingencies, as disclosed in preceding audited annual published financial statements of the Company for the year ended 30 June 2011 except for the following:
- Guarantees issued by banks in respect of financial and operational obligations of the Company
amounting to Rupees 241.220 million (30 June 2011: Rupees 249.620 million).
6.2 Commitments in respect of: a) Letters of credit for capital expenditure are Rupees 31.457 million (30 June 2011: Rupees Nil).
b) Letters of credit other than for capital expenditure are Rupees 225.183 million (30 June 2011:
Rupees 42.070 million). Un-audited Audited31 March 30 June
2012 2011(Rupees in thousand)
7. PROPERTY, PLANT AND EQUIPMENT
Operating fixed assets: Owned (Note 7.1) 6,426,551 6,578,979 Leased (Note 7.2) 152,385 166,964 Capital work-in-progress (Note 7.3) 34,584 1,748
6,613,520 6,747,691

12
Un-audited Audited31 March 30 June
2012 2011(Rupees in thousand)
7.1 Operating fixed assets - Owned
Opening book value 6,578,979 6,129,589 Add : Cost of additions during the period / year (Note 7.1.1) 100,473 260,620 Add: Surplus on revaluation of freehold land during the period / year - 11,672 Add: Transferred from leased assets (Note 7.2.2) 3,115 117,277 Add: Transferred from non-current assets classified as held for sale during the period / year - 399,673
6,682,567 6,918,831 Less : Book value of deletions during the period / year (Note 7.1.2) 888 5,464
6,681,679 6,913,367 Less : Depreciation charged during the period / year 255,128 334,388
Closing book value 6,426,551 6,578,979 7.1.1 Cost of additions
Buildings 7,702 77,797 Plant and machinery 85,399 172,647 Service and other equipment - 101 Computers 2,062 3,594 Furniture and fixture 159 1,288 Office equipment 1,286 1,910 Vehicles 3,865 3,283
100,473 260,620 7.1.2 Book value of deletions
Plant and machinery 191 2,283 Furniture and fixture 148 - Vehicles 549 3,181
888 5,464
7.2 Operating fixed assets - Leased
Opening book value 166,964 280,386 Add: Cost of additions during the period/year (Note 7.2.1) - 27,212
166,964 307,598 Less : Transferred to owned assets (Note 7.2.2) 3,115 117,277
163,849 190,321 Less : Depreciation charged during the period / year 11,464 23,357
Closing book value 152,385 166,964 7.2.1 Cost of additions
Plant and machinery - 27,212
7.2.2 Book value of deletions / transfers
Plant and machinery 3,115 - 3,115 -
Quarterly Report 2012
13
Un-audited Audited31 March 30 June
2012 2011(Rupees in thousand)
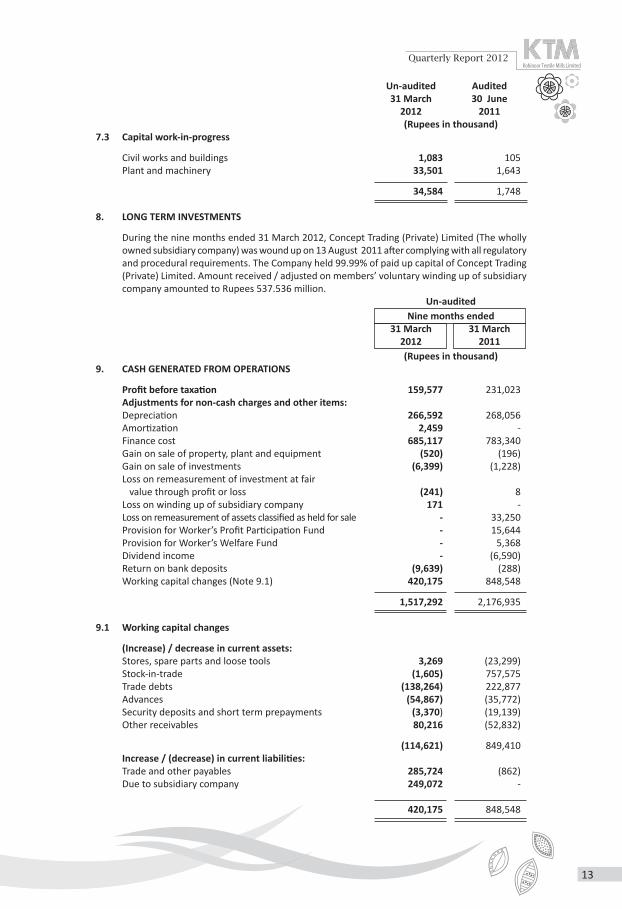
7.3 Capital work-in-progress
Civil works and buildings 1,083 105 Plant and machinery 33,501 1,643
34,584 1,748 8. LONG TERM INVESTMENTS
During the nine months ended 31 March 2012, Concept Trading (Private) Limited (The wholly owned subsidiary company) was wound up on 13 August 2011 after complying with all regulatory and procedural requirements. The Company held 99.99% of paid up capital of Concept Trading (Private) Limited. Amount received / adjusted on members’ voluntary winding up of subsidiary company amounted to Rupees 537.536 million.
Un-auditedNine months ended
31 March 31 March2012 2011(Rupees in thousand)
9. CASH GENERATED FROM OPERATIONS
Profit before taxation 159,577 231,023 Adjustments for non-cash charges and other items: Depreciation 266,592 268,056 Amortization 2,459 - Finance cost 685,117 783,340 Gain on sale of property, plant and equipment (520) (196)Gain on sale of investments (6,399) (1,228)Loss on remeasurement of investment at fair value through profit or loss (241) 8 Loss on winding up of subsidiary company 171 - Loss on remeasurement of assets classified as held for sale - 33,250 Provision for Worker’s Profit Participation Fund - 15,644 Provision for Worker’s Welfare Fund - 5,368 Dividend income - (6,590)Return on bank deposits (9,639) (288)Working capital changes (Note 9.1) 420,175 848,548
1,517,292 2,176,935 9.1 Working capital changes
(Increase) / decrease in current assets: Stores, spare parts and loose tools 3,269 (23,299)Stock-in-trade (1,605) 757,575 Trade debts (138,264) 222,877 Advances (54,867) (35,772)Security deposits and short term prepayments (3,370) (19,139)Other receivables 80,216 (52,832)
(114,621) 849,410 Increase / (decrease) in current liabilities: Trade and other payables 285,724 (862)Due to subsidiary company 249,072 -
420,175 848,548

14
10.
SEG
MEN
T IN
FORM
ATIO
N
10.1
Spin
ning
W
eavi
ng
Proc
essi
ng a
nd h
ome
texti
le
To
tal -
Com
pany
U
n-A
udit
ed
Un-
Aud
ited
U
n-A
udit
ed
Un-
Aud
ited
U
n-A
udit
ed
Nin
e m
onth
s en
ded
Nin
e m
onth
s en
ded
Nin
e m
onth
s en
ded
Nin
e m
onth
s en
ded
Nin
e m
onth
s en
ded
Nin
e m
onth
s en
ded
31
Mar
12
31 M
ar 1
1 31
Mar
12
31 M
ar 1
1 31
Mar
12
31 M
ar 1
1 31
Mar
12
31 M
ar 1
1 31
Mar
12
31 M
ar 1
1
----
----
----
----
----
----
----
----
----
----
----
----
----
----
----
----
----
----
----
----
----
----
----
----
----
(Rup
ees
in th
ousa
nds-
----
----
----
----
----
----
----
----
----
----
----
----
----
----
----
----
----
----
----
----
----
----
----
----
----
SALE
S :
EXTE
RNA
L
2,8
13,4
46
3,3
30,5
85
1,9
54,2
58
1,7
72,9
14
3,1
60,2
59
4,5
83,7
50
-
-
7,9
27,9
63
9,6
87,2
49
IN
TER
SEG
MEN
T 4
46,9
44
1,1
27,5
98
859
,181
1
,209
,615
-
-
(1
,306
,125
) (2
,337
,213
) -
-
3,2
60,3
90
4,4
58,1
83
2,8
13,4
39
2,9
82,5
29
3,1
60,2
59
4,5
83,7
50
(1,3
06,1
25)
(2,3
37,2
13)
7,9
27,9
63
9,6
87,2
49
CO
ST O
F SA
LES
(2,7
73,2
03)
(3,6
36,8
17)
(2,4
77,9
06)
(2,5
71,3
89)
(2,7
30,5
10)
(4,2
88,5
87)
1,3
06,1
25
2,3
37,2
13
(6,6
75,4
94)
(8,1
59,5
80)
G
ROSS
PRO
FIT
487
,187
8
21,3
66
335
,533
4
11,1
40
429
,749
2
95,1
63
-
-
1,2
52,4
69
1,5
27,6
69
DIS
TRIB
UTI
ON
CO
ST
(7,4
00)
(12,
332)
(6
8,52
5)
(49,
745)
(2
24,9
43)
(271
,427
) -
-
(3
00,8
68)
(333
,504
)
AD
MIN
ISTR
ATIV
E EX
PEN
SES
(28,
459)
(5
0,18
4)
(59,
341)
(5
0,56
8)
(65,
031)
(5
8,16
6)
-
-
(152
,831
) (1
58,9
18)
(35,
859)
(6
2,51
6)
(127
,866
) (1
00,3
13)
(289
,974
) (3
29,5
93)
-
-
(453
,699
) (4
92,4
22)
PR
OFI
T/ (L
OSS
) BEF
ORE
TA
X A
ND
UN
ALL
OCA
TED
IN
COM
E A
ND
EXP
ENSE
S 4
51,3
28
758
,850
2
07,6
67
310
,827
1
39,7
75
(34,
430)
-
-
7
98,7
70
1,0
35,2
47
UN
ALL
OCA
TED
INCO
ME
AN
D E
XPEN
SES
FI
NA
NCE
CO
ST
(685
,117
) (7
85,3
60)
O
THER
OPE
RATI
NG
EXP
ENSE
S
(1
,881
) (5
4,93
7)
OTH
ER O
PERA
TIN
G IN
COM
E
4
7,80
5
36,
073
TA
XATI
ON
(1
42,9
24)
(91,
000)
(782
,117
) (8
95,2
24)
PR
OFI
T A
FTER
TA
XATI
ON
1
6,65
3
140
,023
10
.2
Reco
ncili
ation
of r
epor
tabl
e se
gmen
t ass
ets
Sp
inni
ng
Wea
ving
Pr
oces
sing
and
hom
e te
xtile
To
tal -
Com
pany
U
n-au
dite
d A
udit
ed
Un-
audi
ted
Aud
ited
U
n-au
dite
d A
udit
ed
Un-
audi
ted
Aud
ited
31
Mar
12
30 Ju
ne 1
1 31
Mar
12
30 Ju
ne 1
1 31
Mar
12
30 Ju
ne 1
1 31
Mar
12
30 Ju
ne 1
1
----
----
----
----
----
----
----
----
----
----
----
----
----
----
----
----
----
---(
Rupe
es in
thou
sand
s---
----
----
----
----
----
----
----
----
----
----
----
----
----
----
----
----
----
----
--
TO
TAL
ASS
ETS
FOR
REPO
RTA
BLE
SEG
MEN
TS
3,2
01,8
93
2,7
41,1
04
2,5
99,4
70
2,1
87,3
89
4,4
48,2
03
2,7
07,3
11
10,
249,
566
7
,635
,804
U
NA
LLO
CATE
D A
SSET
S
5
,400
,560
8
,666
,861
TO
TAL
ASS
ETS
AS
PER
BALA
NCE
SH
EET
15,
650,
126
1
6,30
2,66
5
TO
TAL
LIA
BILI
TIES
FO
R RE
PORT
ABL
E SE
GM
ENT
1,6
14,7
04
998
,668
1
,534
,880
1
,860
,641
4
,238
,592
4
,257
,469
7
,388
,176
7
,116
,778
U
NA
LLO
CATE
D L
IABI
LITI
ES
173
,164
1
,113
,754
TO
TAL
LIA
BILI
TIES
AS
PER
BALA
NCE
SH
EET
7,5
61,3
40
8,2
30,5
32
Elim
inati
on o
f int
er-s
egm
ent
tran
sacti
ons
Quarterly Report 2012
15
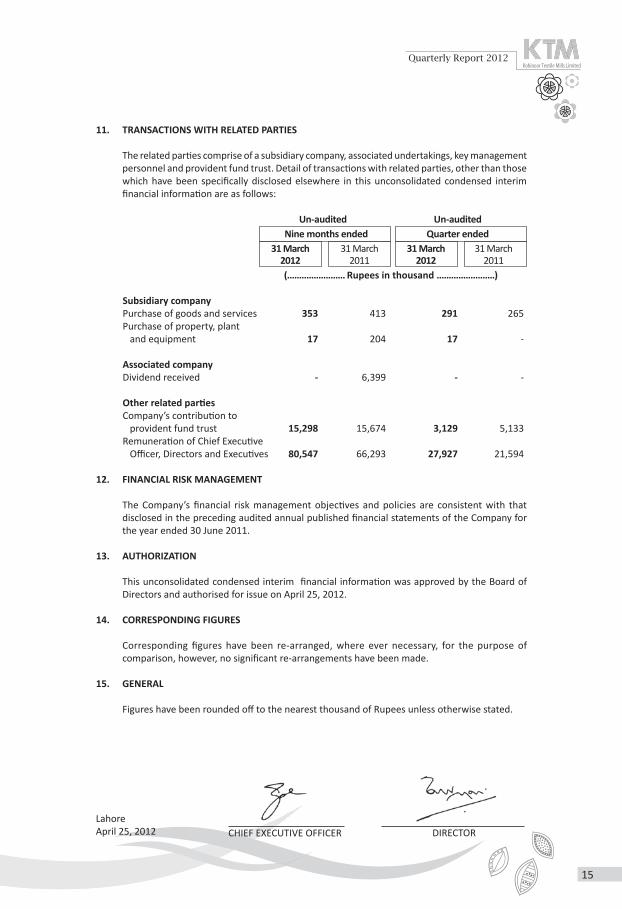
11. TRANSACTIONS WITH RELATED PARTIES The related parties comprise of a subsidiary company, associated undertakings, key management
personnel and provident fund trust. Detail of transactions with related parties, other than those which have been specifically disclosed elsewhere in this unconsolidated condensed interim financial information are as follows:
Un-audited Un-audited Nine months ended Quarter ended 31 March 31 March 31 March 31 March 2012 2011 2012 2011 (........................ Rupees in thousand ........................) Subsidiary company Purchase of goods and services 353 413 291 265 Purchase of property, plant and equipment 17 204 17 - Associated company Dividend received - 6,399 - - Other related parties Company’s contribution to provident fund trust 15,298 15,674 3,129 5,133 Remuneration of Chief Executive Officer, Directors and Executives 80,547 66,293 27,927 21,594
12. FINANCIAL RISK MANAGEMENT The Company’s financial risk management objectives and policies are consistent with that
disclosed in the preceding audited annual published financial statements of the Company for the year ended 30 June 2011.
13. AUTHORIZATION This unconsolidated condensed interim financial information was approved by the Board of
Directors and authorised for issue on April 25, 2012. 14. CORRESPONDING FIGURES Corresponding figures have been re-arranged, where ever necessary, for the purpose of
comparison, however, no significant re-arrangements have been made. 15. GENERAL Figures have been rounded off to the nearest thousand of Rupees unless otherwise stated.
CHIEF EXECUTIVE OFFICER DIRECTORLahoreApril 25, 2012

16

17
Quarterly Report 2012
KOHINOOR TEXTILE MILLS LIMITED
CONSOLIDATED CONDENSED INTERIM FINANCIAL INFORMATION
FOR THE NINE MONTHS ENDED 31 MARCH 2012

18

19
Quarterly Report 2012
The Directors are pleased to present their report together with the un-audited Group results of Kohinoor
Textile Mills Limited and its subsidiary, Maple Leaf Cement Factory Limited for the nine months ended
March 31, 2012. Kohinoor Textile Mills Limited (Holding Company) holds 64.62% shares of Maple Leaf
Cement Factory Limited (Subsidiary Company).
The Group recorded after-tax profit of Rupees 705.532 million as compared to after-tax loss of Rupees
1,425.407 million during the corresponding period. The consolidated profit of the Holding Company
and its share in its Subsidiary for the period is Rupees 624.228 million as compared to consolidated
loss of Rupees 898.431 million for the corresponding period.
The Subsidiary suffered after-tax loss of Rupees 220.712 million as compared to after-tax loss of Rupees
1,565.412 million for the corresponding period.
For and on behalf of the Board
Lahore Taufique Sayeed SaigolApril 25, 2012 Chief Executive Officer
Directors’ Review

20
Consolidated Condensed Interim Balance Sheet As at 31 March 2012
CHIEF EXECUTIVE OFFICER
LahoreApril 25, 2012
Un-audited Audited Note 31 March 30 June 2012 2011
(Rupees in thousand)EQUITY AND LIABILITIES SHARE CAPITAL AND RESERVES Authorized share capital 370,000,000 (30 June 2011 : 370,000,000) 3,700,000 3,700,000 30,000,000 (30 June 2011 : 30,000,000) preference 300,000 300,000 shares of Rupees 10 each 4,000,000 4,000,000 Issued, subscribed and paid up share capital 2,455,262 2,455,262 245,526,216 (30 June 2011: 245,526,216) ordinary shares of Rupees 10 each. Reserves 880,952 659,690
Equity attributable to equity holders of the Holding Company 3,336,214 3,114,952 Non controlling interest 1,046,990 1,046,234
Total equity 4,383,204 4,161,186 Surplus on revaluation of property, plant and equipment and investment properties 9,046,457 9,233,617 NON-CURRENT LIABILITIES
Long term financing 5 4,553,302 5,372,895 Redeemable capital 7,383,000 7,983,000 Liabilities against assets subject to finance lease 368,898 507,209 Long term deposits 5,919 5,569 Employees’ compensated absences 21,874 19,149 Deferred income tax 2,161,235 2,414,958
14,494,228 16,302,780 CURRENT LIABILITIES
Trade and other payables 4,628,407 4,757,981 Accrued mark-up 1,138,542 1,021,299 Short term borrowings 7,991,039 9,214,931 Current portion of non-current liabilities 3,110,091 1,988,378
16,868,079 16,982,589
TOTAL LIABILITIES 31,362,307 33,285,369
CONTINGENCIES AND COMMITMENTS 6 - - TOTAL EQUITY AND LIABILITIES 44,791,968 46,680,172 The annexed notes form an integral part of this consolidated condensed interim financial information.

21
Quarterly Report 2012
DIRECTORDIRECTOR
Un-audited Audited Note 31 March 30 June 2012 2011
(Rupees in thousand)ASSETS NON-CURRENT ASSETS Property, plant and equipment 7 33,717,554 34,950,932 Intangible assets 18,099 27,154 Investment properties 1,721,714 1,721,714 Long term lnvestments 3,037 -Long term loans to employees 2,426 2,531 Long term deposits and prepayments 107,417 87,794 35,570,247 36,790,125 CURRENT ASSETS Stores, spare parts and loose tools 3,216,680 3,361,339 Stock -in- trade 2,353,800 2,196,336 Trade debts 1,633,326 1,267,503 Loans and advances 499,763 386,392 Security deposits and short term prepayments 93,390 140,941 Accrued interest 256 936 Other receivables 478,392 547,892 Short term investments 19,846 942,941 Taxation recoverable 322,557 336,291 Cash and bank balances 603,711 709,476 9,221,721 9,890,047
TOTAL ASSETS 44,791,968 46,680,172

22
Consolidated Condensed Interim Profit and Loss Account (Un-Audited)For the nine months ended 31 March 2012
CHIEF EXECUTIVE OFFICER DIRECTORLahoreApril 25, 2012
Nine months ended Quarter ended 31 March 31 March 31 March 31 March 2012 2011 2012 2011 ....................... (Rupees in thousand) ........................
SALES 19,041,106 19,253,279 6,922,668 6,474,721 COST OF SALES (15,021,915) (16,220,724) (5,231,514) (5,428,256)
GROSS PROFIT 4,019,191 3,032,555 1,691,154 1,046,465 DISTRIBUTION COST (925,108) (1,570,458) (297,775) (553,175)ADMINISTRATIVE EXPENSES (344,907) (302,290) (139,458) (110,248)OTHER OPERATING EXPENSES (384,317) (143,665) (345,378) (75,801)
(1,654,332) (2,016,413) (782,611) (739,224)
2,364,859 1,016,142 908,543 307,241 OTHER OPERATING INCOME 968,884 58,109 15,534 19,648 PROFIT FROM OPERATIONS 3,333,743 1,074,251 924,077 326,889 FINANCE COST (2,451,945) (2,390,401) (768,481) (790,094)
PROFIT / (LOSS) BEFORE TAXATION 881,798 (1,316,150) 155,596 (463,205) TAXATION (176,266) (109,257) (72,515) (37,565) PROFIT / (LOSS) AFTER TAXATION 705,532 (1,425,407) 83,081 (500,770)
SHARE OF PROFIT / (LOSS) ATTRIBUTABLE TO: EQUITY HOLDERS OF HOLDING COMPANY 624,228 (898,431) 73,926 (426,277)NON CONTROLLING INTEREST DIVIDEND ON PREFERENCE SHARES 39,221 39,595 12,876 13,199 SHARE IN PROFIT / (LOSS) FOR THE PERIOD 42,083 (566,571) (3,721) (87,692)
81,304 (526,976) 9,155 (74,493)PROFIT / (LOSS) AFTER TAXATION AND NON CONTROLLING INTEREST 705,532 (1,425,407) 83,081 (500,770) EARNING / (LOSS) PER SHARE - BASIC AND DILUTED (RUPEES) 2.87 (4.19) 0.34 (1.99) The annexed notes form an integral part of this consolidated condensed interim financial information.

23
Quarterly Report 2012
Consolidated Condensed Interim Statementof Comprehensive Income (Un-Audited)For the nine months ended 31 March 2012
CHIEF EXECUTIVE OFFICER DIRECTORLahoreApril 25, 2012
Nine months ended Quarter ended 31 March 31 March 31 March 31 March 2012 2011 2012 2011 ....................... (Rupees in thousand) ........................
PROFIT / (LOSS) AFTER TAXATION 705,532 (1,425,407) 83,081 (500,770) OTHER COMPREHENSIVE INCOME / (LOSS) Surplus on remeasurement of available for sale investments - 207,080 - 260,869 Reclassification adjustment for gain/ loss included in profit and loss (670,674) - Deferred income tax on remeasurement of available for sale investments - (54,359) - (68,478) Other comprehensive income / (loss) for the period - net of tax (670,674) 152,721 - 192,391 TOTAL COMPREHENSIVE INCOME / (LOSS) FOR THE PERIOD 34,858 (1,272,686) 83,081 (308,379) Share of total comprehensive income/ (loss) attributable to: Equity holders of Holding Company 100,301 (768,171) 73,926 (143,025)Non controlling interest (65,443) (504,515) 9,155 (165,354) 34,858 (1,272,686) 83,081 (308,379)
The annexed notes form an integral part of this consolidated condensed interim financial information.

24
Consolidated Condensed Interim Cash Flow Statement (Un-Audited)For the nine months ended 31 March 2012
CHIEF EXECUTIVE OFFICER DIRECTORLahoreApril 25, 2012
Nine months ended Note 31 March 31 March 2012 2011 (Rupees in thousand)
CASH FLOWS FROM OPERATING ACTIVITIES Cash generated from operations 8 3,420,895 2,990,275 Finance cost paid (2,334,702) (1,286,556)Workers’ Profit Participation Fund paid - (14,520)Compensated absences paid (13,722) (7,429)Income tax paid (177,537) (137,352)Net (increase) / decrease in long term deposits (19,623) 17,629
Net cash generated from operating activities 875,311 1,562,047 CASH FLOWS FROM INVESTING ACTIVITIES Capital expenditure on property, plant and equipment (271,609) (625,484)Long term loans to employees 105 1,451 Investment made (2,837) (172)Interest received 16,327 4,063 Proceeds from sale of property, plant and equipment 2,055 2,005 Proceeds from disposal of investments 934,667 9,004 Proceed from sale of land classified as held for sale - 120,000 Advance against purchase of land received back - 100,000 Dividend received - 11,160
Net cash generated from/ (used in) investing activities 678,708 (377,973) CASH FLOWS FROM FINANCING ACTIVITIES Proceed from long term financing - secured 200,000 - Short term borrowings (net) (1,223,892) (477,905)Repayment of long term financing - secured (594,774) (630,496)Repayment of redeemable capital (5,100) (5,100)Repayment of liabilities against assets subject to finance lease (36,317) (55,762)Long term deposits from stockists - net 350 - Dividend paid (51) -
Net cash used in financing activities (1,659,784) (1,169,263)
NET (DECREASE) / INCREASE IN CASH AND CASH EQUIVALENTS (105,765) 14,811 CASH AND CASH EQUIVALENTS AT THE BEGINNING OF THE PERIOD 709,476 152,453
CASH AND CASH EQUIVALENTS AT THE END OF THE PERIOD 603,711 167,264 The annexed notes form an integral part of this consolidated condensed interim financial information.
25
Quarterly Report 2012
-
----
----
----
----
----
----
----
----
----
----
----
----
----
----
----
----
----
----
----
----
----
----
-(Ru
pees
in th
ousa
nd)-
----
----
----
----
----
----
----
----
----
----
----
----
----
----
----
----
----
----
----
----
----
-
Bala
nce
as a
t 30
June
201
0 - (
Aud
ited
) 1
,455
,262
1
44,9
19
628
,077
7
72,9
96
1,4
50,4
91
(760
,559
) 6
89,9
32
1,4
62,9
28
2,9
18,1
90
2,4
05,2
63
5,3
23,4
53
O
rdin
ary
shar
es is
sued
oth
er th
an th
roug
h
a ri
ght i
ssue
1
,000
,000
-
-
-
-
-
-
-
1
,000
,000
-
1
,000
,000
Is
sue
of o
rdin
ary
shar
es to
non
-con
trol
ling
in
tere
st h
olde
rs
-
-
-
-
-
-
-
-
-
290
2
90
Tota
l com
preh
ensi
ve in
com
e/ (l
oss)
for
the
nine
mon
ths
ende
d 31
Mar
ch 2
011
-
-
130
,260
1
30,2
60
-
(898
,431
) (8
98,4
31)
(768
,171
) (7
68,1
71)
(504
,515
) (1
,272
,686
)Su
rplu
s on
reva
luati
on o
f pro
pert
y, p
lant
and
equi
pmen
t rea
lized
thro
ugh
incr
emen
tal d
epre
ciati
on
-
-
-
-
-
45,
675
4
5,67
5
45,
675
4
5,67
5
24,
920
7
0,59
5
Bala
nce
as a
t 31
Mar
ch 2
011
2,4
55,2
62
144
,919
7
58,3
37
903
,256
1
,450
,491
(1
,613
,315
) (1
62,8
24)
740
,432
3
,195
,694
1
,925
,958
5
,121
,652
Tran
sfer
red
from
sur
plus
on
reva
luati
on o
f pro
pert
y,
pl
ant a
nd e
quip
men
t (ne
t of t
ax)
-
89,
643
8
9,64
3
89,
643
8
9,64
3
49,
059
1
38,7
02
Reve
rsal
of s
urpl
us o
n re
valu
ation
of d
ispo
sal o
f
prop
erty
, pla
nt a
nd e
quip
men
t (ne
t of t
ax)
- -
- -
-
7,4
63
7,4
63
7,4
63
7,4
63
4,0
85
11,
548
Tota
l com
preh
ensi
ve lo
ss fo
r th
e pe
riod
ende
d 30
June
201
1 -
-
(2
34,4
10)
(234
,410
) -
(5
21,4
53)
(521
,453
) (7
55,8
63)
(755
,863
) (3
54,8
53)
(1,1
10,7
16)
Incr
ease
in in
tere
st o
f equ
ity h
olde
rs o
f the
Hol
ding
Com
pany
-
-
-
-
-
5
78,0
15
578
,015
5
78,0
15
578
,015
(5
78,0
15)
-
Ba
lanc
e as
at 3
0 Ju
ne 2
011
- (A
udit
ed)
2,4
55,2
62
144
,919
5
23,9
27
668
,846
1
,450
,491
(1
,459
,647
) (9
,156
) 6
59,6
90
3,1
14,9
52
1,0
46,2
34
4,1
61,1
86
Tr
ansf
erre
d fr
om s
urpl
us o
n re
valu
ation
of p
rope
rty,
plan
t and
equ
ipm
ent (
net o
f tax
)
-
-
120
,961
1
20,9
61
120
,961
1
20,9
61
66,
199
1
87,1
60
Tota
l com
preh
ensi
ve in
com
e/ (l
oss)
for
the
nine
mon
ths
ende
d 31
Mar
ch 2
012
-
-
(523
,927
) (5
23,9
27)
-
624
,228
6
24,2
28
100
,301
1
00,3
01
(65,
443)
3
4,85
8
Bala
nce
as a
t 31
Mar
ch 2
012
2,4
55,2
62
144
,919
-
1
44,9
19
1,4
50,4
91
(714
,458
) 7
36,0
33
880
,952
3
,336
,214
1
,046
,990
4
,383
,204
The
anne
xed
note
s fo
rm a
n in
tegr
al p
art o
f thi
s co
nsol
idat
ed c
onde
nsed
inte
rim
fina
ncia
l inf
orm
ation
.
SHA
RE
CAPI
TAL
Shar
epr
emiu
mFa
ir v
alue
rese
rve
Sub
Tota
lG
ener
alRe
serv
e
Tota
lRe
serv
es
NO
N
CON
TRO
LL-
ING
INTE
RES
T
TOTA
LEQ
UIT
YTO
TAL
CAPI
TAL
RES
ERV
ESR
EVEN
UE
RES
ERV
ES
RES
ERV
ES
ATTR
IBU
TAB
LE T
O E
QU
ITY
HO
LDER
S O
F TH
E H
OLD
ING
CO
MPA
NY
Acc
umul
ated
lo
ssSu
b To
tal
Con
soli
dat
ed C
on
den
sed
In
teri
m S
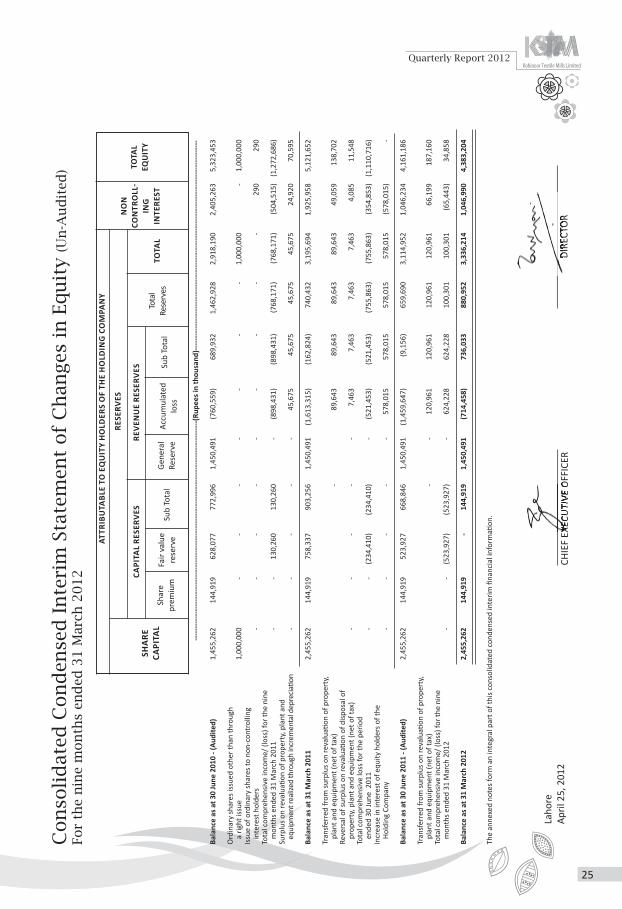
tate
men
t of
Ch
anges
in
Eq
uit
y (U
n-A
ud
ited
)Fo
r th
e n
ine
mon
ths
end
ed 3
1 M
arch
20
12
DIR
ECTO
RCH
IEF
EXEC
UTI
VE O
FFIC
ERCH
IEF
EXEC
UTI
VE O
FFIC
ERD
IREC
TOR
Laho
reA
pril
25, 2
012

26
Selected Notes to the Consolidated Condensed Interim Financial Information (Un-Audited)For the nine months ended 31 March 2012
1. THE GROUP AND ITS OPERATIONS
1.1 Holding Company
Kohinoor Textile Mills Limited (“the Holding Company”) is a public limited company incorporated in Pakistan under the Companies Act,1913 (now Companies Ordinance, 1984) and listed on all Stock Exchanges of Pakistan. The registered office of the Company is situated at 42-Lawrence Road, Lahore. The Holding Company holds 64.62% (2011: 64.63%) shares of Maple Leaf Cement Factory Limited. The principal activity of the Holding Company is manufacturing of yarn and cloth, processing and stitching the cloth and trade of textile products.
1.2 Subsidiary Company
Maple Leaf Cement Factory Limited (“the Subsidiary”) was incorporated in Pakistan on 13 April, 1960 under the Companies Act, 1913 (now the Companies Ordinance, 1984) as a public company limited by shares and was listed on stock exchanges in Pakistan on 17 August, 1994. The registered office of the Subsidiary is situated at 42-Lawrence Road, Lahore. The Subsidiary is engaged in production and sale of cement.
2. BASIS OF PREPARATION
This condensed interim consolidated financial information is unaudited and is being submitted to the shareholders as required by section 245 of the Companies Ordinance, 1984. This condensed interim consolidated financial information has been prepared in accordance with the International Accounting Standard (IAS) 34 “Interim Financial Reporting” as applicable in Pakistan and notified by the Securities and Exchange Commission of Pakistan (SECP). This consolidated interim financial information should be read in conjunction with the annual consolidated financial statements of the Group for the year ended 30 June 2011.
3. ACCOUNTING POLICIES
The accounting policies and methods of computations adopted for the preparation of this condensed interim consolidated financial information are the same as those applied in the preparation of the financial statements for the preceding annual published financial statements of the Group for the year ended 30 June 2011.
4. CRITICAL ACCOUNTING ESTIMATES AND JUDGEMENTS
The preparation of this consolidated condensed interim financial information in conformity with the approved accounting standards requires the use of certain critical accounting estimates. It also requires the management to exercise its judgment in the process of applying the Company’s accounting policies. Estimates and judgments are continually evaluated and are based on historical experience and other factors, including expectations of future events that are believed to be reasonable under the circumstances.
During preparation of this consolidated condensed interim financial information, the significant judgments made by the management in applying the Group’s accounting policies and the key sources of estimation and uncertainty were the same as those that applied in the preceding audited annual published financial statements of the company for the year ended 30 June 2011.
27
Quarterly Report 2012
Un-audited Audited31 March 30 June
2012 2011(Rupees in thousand)
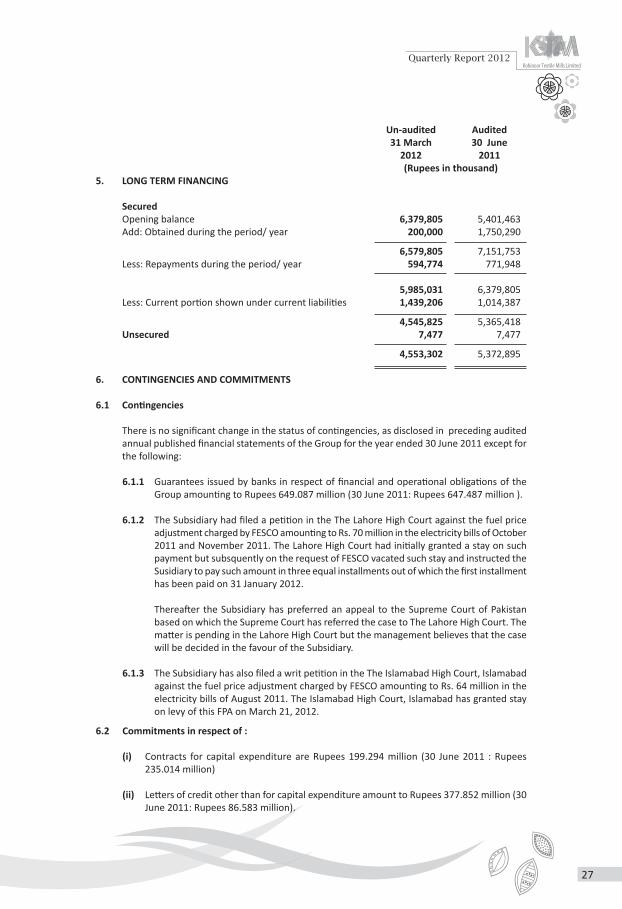
5. LONG TERM FINANCING
SecuredOpening balance 6,379,805 5,401,463 Add: Obtained during the period/ year 200,000 1,750,290
6,579,805 7,151,753 Less: Repayments during the period/ year 594,774 771,948
5,985,031 6,379,805 Less: Current portion shown under current liabilities 1,439,206 1,014,387
4,545,825 5,365,418 Unsecured 7,477 7,477
4,553,302 5,372,895 6. CONTINGENCIES AND COMMITMENTS 6.1 Contingencies
There is no significant change in the status of contingencies, as disclosed in preceding audited annual published financial statements of the Group for the year ended 30 June 2011 except for the following:
6.1.1 Guarantees issued by banks in respect of financial and operational obligations of the Group amounting to Rupees 649.087 million (30 June 2011: Rupees 647.487 million ).
6.1.2 The Subsidiary had filed a petition in the The Lahore High Court against the fuel price
adjustment charged by FESCO amounting to Rs. 70 million in the electricity bills of October 2011 and November 2011. The Lahore High Court had initially granted a stay on such payment but subsquently on the request of FESCO vacated such stay and instructed the Susidiary to pay such amount in three equal installments out of which the first installment has been paid on 31 January 2012.
Thereafter the Subsidiary has preferred an appeal to the Supreme Court of Pakistan based on which the Supreme Court has referred the case to The Lahore High Court. The matter is pending in the Lahore High Court but the management believes that the case will be decided in the favour of the Subsidiary.
6.1.3 The Subsidiary has also filed a writ petition in the The Islamabad High Court, Islamabad against the fuel price adjustment charged by FESCO amounting to Rs. 64 million in the electricity bills of August 2011. The Islamabad High Court, Islamabad has granted stay on levy of this FPA on March 21, 2012.
6.2 Commitments in respect of :
(i) Contracts for capital expenditure are Rupees 199.294 million (30 June 2011 : Rupees 235.014 million)
(ii) Letters of credit other than for capital expenditure amount to Rupees 377.852 million (30
June 2011: Rupees 86.583 million).
28
Un-audited Audited31 March 30 June
2012 2011(Rupees in thousand)
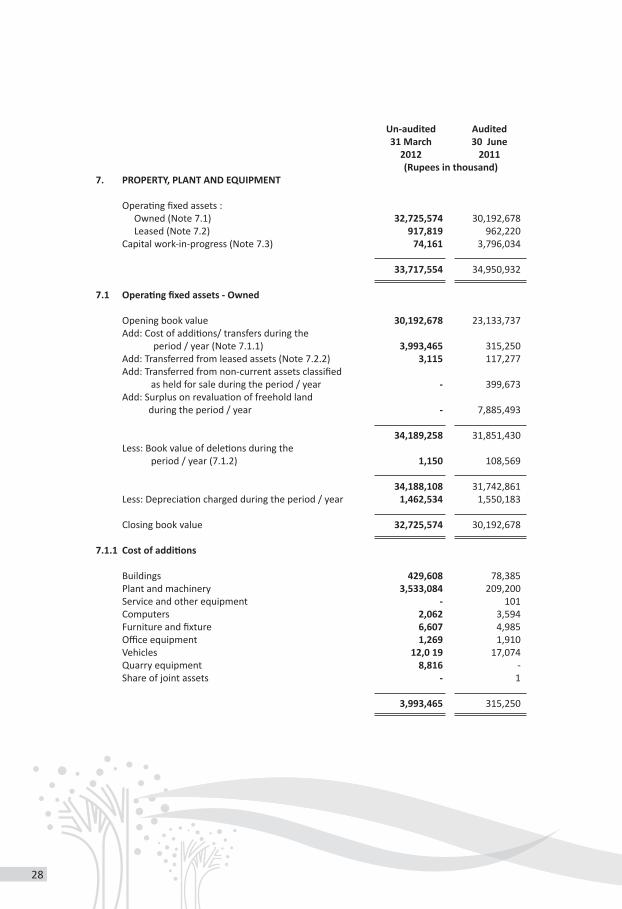
7. PROPERTY, PLANT AND EQUIPMENT
Operating fixed assets : Owned (Note 7.1) 32,725,574 30,192,678 Leased (Note 7.2) 917,819 962,220 Capital work-in-progress (Note 7.3) 74,161 3,796,034
33,717,554 34,950,932 7.1 Operating fixed assets - Owned
Opening book value 30,192,678 23,133,737 Add: Cost of additions/ transfers during the period / year (Note 7.1.1) 3,993,465 315,250 Add: Transferred from leased assets (Note 7.2.2) 3,115 117,277 Add: Transferred from non-current assets classified as held for sale during the period / year - 399,673 Add: Surplus on revaluation of freehold land during the period / year - 7,885,493
34,189,258 31,851,430 Less: Book value of deletions during the period / year (7.1.2) 1,150 108,569
34,188,108 31,742,861 Less: Depreciation charged during the period / year 1,462,534 1,550,183
Closing book value 32,725,574 30,192,678 7.1.1 Cost of additions
Buildings 429,608 78,385 Plant and machinery 3,533,084 209,200 Service and other equipment - 101 Computers 2,062 3,594 Furniture and fixture 6,607 4,985 Office equipment 1,269 1,910 Vehicles 12,0 19 17,074 Quarry equipment 8,816 - Share of joint assets - 1
3,993,465 315,250

29
Quarterly Report 2012
Un-audited Audited31 March 30 June
2012 2011(Rupees in thousand)
7.1.2 Book value of deletions
Plant and machinery 191 105,013 Service and other equipment 148 - Vehicles 811 3,556
1,150 108,569 7.2 Operating fixed assets - Leased
Opening book value 962,220 1,113,114 Add : Cost of additions during the period / year (Note 7.2.1) - 27,212
962,220 1,140,326 Less : Transferred to owned assets (Note 7.2.2) 3,115 117,277
959,105 1,023,049 Less : Depreciation charged during the period / year 41,286 60,829
Closing book value 917,819 962,220
7.2.1 Cost of additions
Plant and machinery - 27,212 7.2.2 Book value of deletions/ transfers
Plant and machinery 3,115 -
3,115 -
7.3 Capital work-in-progress
Civil works and buildings - 105 Plant and machinery 58,578 3,203,712 Un-allocated capital expenditure 1,001 477,163 Advances to suppliers against: - purchase of land 2,000 2,000 - civil works 1,505 3,505 - buildings 1,083 3,505 - plant and machinery 9,737 104,999 - vehicles 257 4,550
74,161 3,796,034

30
Un-Audited Nine months ended 31 March 31 March 2012 2011 (Rupees in thousand) 8. CASH GENERATED FROM OPERATIONS
Profit / (loss) before taxation 881,798 (1,316,150)
Adjustment for non-cash charges and other items
Depreciation 1,503,820 1,138,689
Amortization of intangible assets 9,055 8,268
Finance cost 2,451,945 2,388,381
Provision for doubtful debts 31,797 -
Employees’ compensated absences 16,462 6,086
Gain on sale of property, plant and equipment (904) (499)
Gain on remeasurement of investment (747) (1,104)
Loss on remeasurement of assets classified as held for sale - 33,250
Loss on winding up of subsidiary 142 -
Gain on sale of investment (920,360) (1,228)
Dividend income - (11,160)
Return on bank deposits (15,647) (3,439)
Working capital changes (Note 8.1) (536,466) 749,181
3,420,895 2,990,275
8.1 Working capital changes
(Increase)/ decrease in current assets
Stores, spare parts and loose tools 144,659 (506,315)
Stock-in-trade (157,464) 924,246
Trade debts (397,620) 147,986
Loans and advances (113,371) (60,323)
Security deposits and short term prepayments 47,551 (49,248)
Due from gratuity fund trust - (344)
Other receivables 133,168 (138,543)
(343,077) 317,459
Increase / (decrease) in current liabilities
Trade and other payables (193,389) 431,722
(536,466) 749,181

31
Quarterly Report 20129.
S
EGM
ENT
INFO
RMAT
ION
9.1
Spin
ning
W
eavi
ng
Proc
essi
ng a
nd h
ome
texti
le
Cem
ent
Elim
inati
on o
f int
er-
Tota
l - G
roup
se
gmen
t tra
nsac
tion
s
U
n-A
udit
ed
Un-
Aud
ited
U
n-A
udit
ed
Un-
Aud
ited
U
n-A
udit
ed
Un-
Aud
ited
31
Mar
12
31 M
ar 1
1 31
Mar
12
31 M
ar 1
1 31
Mar
12
31 M
ar 1
1 31
Mar
12
31 M
ar 1
1 31
Mar
12
31 M
ar 1
1 31
Mar
12
31 M
ar 1
1
--
----
----
----
----
----
----
----
----
----
----
----
----
----
----
- ( R
u p
e e
s i
n t
h o
u s
a n
d ) -
----
----
----
----
----
----
----
----
----
----
----
----
----
----
----
SA
LES:
EXTE
RNA
L
2,8
13,4
46
3,3
30,5
85
1,9
54,2
58
1,7
72,9
14
3,1
60,2
59
4,5
83,7
50
11,
113,
143
9
,566
,030
-
-
1
9,04
1,10
6
19,
253,
279
INTE
R SE
GM
ENT
446
,944
1
,127
,598
8
59,1
81
1,2
09,6
15
-
-
353
2
08
(1,3
06,4
78)
(2,3
37,4
21)
-
-
3
,260
,390
4
,458
,183
2
,813
,439
2
,982
,529
3
,160
,259
4
,583
,750
1
1,11
3,49
6
9,5
66,2
38
(1,3
06,4
78)
(2,3
37,4
21)
19,
041,
106
1
9,25
3,27
9 CO
ST O
F SA
LES
(2,7
73,2
03)
(3,6
36,8
17)
(2,4
77,9
06)
(2,5
71,3
89)
(2,7
30,5
10)
(4,2
88,5
87)
(8,3
46,7
74)
(8,0
61,3
52)
1,3
06,4
78
2,3
37,4
21
(15,
021,
915)
(1
6,22
0,72
4)
GRO
SS P
ROFI
T 4
87,1
87
821
,366
3
35,5
33
411
,140
4
29,7
49
295
,163
2
,766
,722
1
,504
,886
-
-
4
,019
,191
3
,032
,555
D
ISTR
IBU
TIO
N C
OST
(7
,400
) (1
2,33
2)
(68,
525)
(4
9,74
5)
(224
,943
) (2
71,4
27)
(624
,240
) (1
,236
,954
) -
-
(9
25,1
08)
(1,5
70,4
58)
AD
MIN
ISTR
ATIV
E EX
PEN
SES
(28,
459)
(5
0,18
4)
(59,
341)
(5
0,56
8)
(65,
031)
(5
8,16
6)
(192
,076
) (1
43,3
72)
-
-
(344
,907
) (3
02,2
90)
(3
5,85
9)
(62,
516)
(1
27,8
66)
(100
,313
) (2
89,9
74)
(329
,593
) (8
16,3
16)
(1,3
80,3
26)
-
-
(1,2
70,0
15)
(1,8
72,7
48)
PRO
FIT
/ (L
OSS
) BEF
ORE
TA
X A
ND
UN
ALLO
CATE
D IN
COM
E AN
D E
XPEN
SES
451
,328
7
58,8
50
207
,667
3
10,8
27
139
,775
(3
4,43
0)
1,9
50,4
06
124
,560
-
-
2
,749
,176
1
,159
,807
UN
ALL
OCA
TED
INCO
ME
AN
D E
XPEN
SES
FI
NA
NCE
CO
ST
(2,4
51,9
45)
(2,3
90,4
01)
OTH
ER O
PERA
TIN
G E
XPEN
SES
(384
,317
) (1
43,6
65)
OTH
ER O
PERA
TIN
G IN
COM
E
9
68,8
84
58,
109
TAXA
TIO
N
(176
,266
) (1
09,2
57)
(2
,043
,644
) (2
,585
,214
)
PRO
FIT
/ (L
OSS
) AFT
ER T
AXA
TIO
N
705
,532
(1
,425
,407
)
9.2
Rec
onci
liati
on o
f rep
orta
ble
segm
ent a
sset
s
Sp
inni
ng
Wea
ving
Pr
oces
sing
and
hom
e te
xtile
Ce
men
t To
tal -
Gro
up
U
n-au
dite
d A
udit
ed
Un-
audi
ted
Aud
ited
U
n-au
dite
d A
udit
ed
Un-
audi
ted
Aud
ited
U
n-au
dite
d A
udit
ed
31
Mar
12
30 Ju
ne 1
1 31
Mar
12
30 Ju
ne 1
1 31
Mar
12
30 Ju
ne 1
1 31
Mar
12
30 Ju
ne 1
1 31
Mar
12
30 Ju
ne 1
1
----
----
----
----
----
----
----
----
----
----
----
----
----
----
--- (
R u
p e
e s
in
t h
o u
s a
n d
) ---
----
----
----
----
----
----
----
----
----
----
----
----
----
----
--
TOTA
L A
SSET
S FO
R RE
PORT
ABL
E
SEG
MEN
T 3
,201
,893
2
,741
,104
2
,599
,470
2
,187
,389
4
,448
,203
2
,707
,311
3
2,57
6,09
6
33,
690,
116
4
2,82
5,66
2
41,
325,
920
UN
ALL
OCA
TED
ASS
ETS
1,9
66,3
06
5,3
54,2
52
TOTA
L A
SSET
S A
S PE
R BA
LAN
CE S
HEE
T
4
4,79
1,96
8
46,
680,
172
TOTA
L LI
ABI
LITI
ES F
OR
REPO
RTA
BLE
SE
GM
ENT
1,6
14,7
04
998
,668
1
,534
,880
1
,860
,641
4
,238
,592
4
,257
,469
2
3,77
1,71
7
18,
759,
581
3
1,15
9,89
3
25,
876,
359
UN
ALL
OCA
TED
LIA
BILI
TIES
2
02,4
14
7,4
09,0
10
TOTA
L LI
ABI
LITI
ES A
S PE
R BA
LAN
CE S
HEE
T
3
1,36
2,30
7
33,
285,
369

32
10. TRANSACTIONS WITH RELATED PARTIES The related parties comprise of subsidiaries, associated undertakings, directors of the Group and
their close relatives, key management personnel and staff retirement fund. Detail of transactions with related parties, other than those which have been specifically disclosed elsewhere in these consolidated financial statements are as follows:
Un-audited Un-audited Nine months ended Quarter ended 31 March 31 March 31 March 31 March 2012 2011 2012 2011 (........................ Rupees in thousand ........................)
Associated company Dividend income - 10,969 - - Other related parties Group’s contribution to employee’s benefits 22,553 15,674 3,129 5,133 Remuneration paid to Chief Executive Officers, Directors and Executives 150,144 124,871 86,505 41,286
11. FINANCIAL RISK MANAGEMENT
The Group’s financial risk management objectives and policies are consistant with that disclosed in the preceding audited annual published financial statements of the Group for the year ended 30 June 2011.
12. AUTHORIZATION This condensed interim consolidated financial information has been authorized for issue by the
Board of Directors of the Company on April 25, 2012. 13. CORRESPONDING FIGURES Corresponding figures have been re-arranged, where ever necessary, for the purpose of
comparison, however, no significant re-arrangements have been made. 14. GENERAL Figures have been rounded off to the nearest thousand of Rupees unless otherwise stated..
CHIEF EXECUTIVE OFFICER DIRECTORLahoreApril 25, 2012