Embed Size (px)
Citation preview
THE
QUARTERLY JOURNAL
OF ECONOMICS
Vol CXVIII November 2003 Issue 4
MANAGING WITH STYLE: THE EFFECT OF MANAGERS ON FIRM POLICIES*
Marianne Bertrand and Antoinette Schoar
This paper investigates whether and how individual managers affect corpo rate behavior and performance. We construct a manager-firm matched panel data
set which enables us to track the top managers across different firms over time.
We find that manager fixed effects matter for a wide range of corporate decisions.
A significant extent of the heterogeneity in investment, financial, and organiza tional practices of firms can be explained by the presence of manager fixed effects.
We identify specific patterns in managerial decision-making that appear to indi
cate general differences in "style" across managers. Moreover, we show that
management style is significantly related to manager fixed effects in performance and that managers with higher performance fixed effects receive higher compen sation and are more likely to be found in better governed firms. In a final step, we
tie back these findings to observable managerial characteristics. We find that
executives from earlier birth cohorts appear on average to be more conservative; on the other hand, managers who hold an MBA degree seem to follow on average
more aggressive strategies.
I. Introduction
"In the old days I would have said it was capital, history, the name of the
bank. Garbage?it's about the guy at the top. I am very much a process
* We thank the editors (Lawrence Katz and Edward Glaeser), three anony mous referees, Kent Daniel, Rebecca Henderson, Steven Kaplan, Kevin J. Mur
phy, Sendhil Mullainathan, Canice Prendergast, David Scharfstein, Jerry Warner, Michael Weisbach, seminar participants at Harvard University, the
Kellogg Graduate School of Management at Northwestern University, the Mas sachusetts Institute of Technology, the University of Chicago Graduate School of
Business, the University of Illinois at Urbana-Champaign, Rochester University, and the Stockholm School of Economics for many helpful comments. We thank
Kevin J. Murphy and Robert Parrino for generously providing us with their data. Jennifer Fiumara and Michael McDonald provided excellent research assistance. E-mail: [email protected]; [email protected].
? 2003 by the President and Fellows of Harvard College and the Massachusetts Institute of
Technology. The Quarterly Journal of Economics, November 2003
1169
1170 QUARTERLY JOURNAL OF ECONOMICS
person, a builder. Sandy [Weil] is an acquirer. Just totally different." ?John
Reed, CEO Citicorp
How much do individual managers matter for firm behavior
and economic performance? Research in finance and economics so
far has given little consideration to this question.1 Existing em
pirical studies typically rely on firm-, industry-, or market-level
characteristics to explain corporate behavior and performance but largely ignore the possible role that individual managers may
play in shaping these outcomes. Yet, a prevailing view in the
business press and among managers themselves (as the quote by John Reed at the beginning of the paper suggests) is that CEOs
and other top executives are key factors in the determination of
corporate practices. Managers are often perceived as having their own "styles" when making investment, financing, and other stra
tegic decisions, thereby imprinting their personal marks on the
companies they manage.2 The novel contribution of this paper is
to explicitly introduce such a people, or manager, dimension in an
empirical study of corporate practices.3 The relevance of this approach is further underlined when we
consider the large heterogeneity in corporate practices that is left
unexplained by more standard models that rely only on firm- and
industry-level factors. For example, research on the cross-sec
tional determinants of capital structure (e.g., Titman and Wes
sels [1988], Smith and Watts [1992], and Bradley, Jarrell, and
Kim [1984]) shows that a large amount of variation remains
unexplained after controlling for firm-level characteristics (such as market-to-book ratios, the type of assets a firm operates or
1. A few recent exceptions in the theory literature are papers by Rotemberg and Saloner [2000] and Van den Steen [2002]. These papers explicitly model the vision of the CEO as an important determinant of firm policy.
2. To mention just one example, an article in a May 2001 issue of Business
Week, titled "The Koszlowski Method," discusses the aggressive acquisition style of Dennis Koszlowski, the CEO of Tyco.
3. While the role of managers in shaping corporate practices has been virtu
ally ignored in the economics and finance literature, there is a large body of work in the management science literature analyzing the determinants of decision
making among CEOs (see, for example, Hambrick and Mason [1984] or Waldman, Ramirez, House, and Puranam [2001]). Yet, both the specific focus of this litera ture and the methodological approach it follows differ substantially from the
study we propose to undertake here. First, the outcome variables considered in
the management literature are mostly process-related variables (e.g., communi cation process or charisma) rather than the actual economic outcomes we care
about here. Second, most of the existing work in management science relies on case studies, laboratory experiments, or subjective survey responses, therefore
lacking the level of generality of our approach. A paper that follows an empirical approach more closely related to ours is Lieberman, Lau, and Williams [1990],
who find significant manager fixed effects in productivity in the U. S. and Japa nese automobile industry.
MANAGING WITH STYLE 1171
nondebt tax shields) or industry fixed effects.4 In a similar vein, the ongoing debate about differences in investment to cash flow
and investment to Q sensitivities [Fazzari, Hubbard, and Pe
tersen 1988; Kaplan and Zingales 1997] highlights the consider
able disagreement as to the roots of the wide variation in invest
ment behavior across firms. One primary objective of this paper is
to ask whether managers' personalities, as opposed to firm, in
dustry, or market factors, can in part account for these unex
plained differences.
Intuitively, we want to quantify how much of the observed
variation in firm policies can be attributed to manager fixed
effects. Since manager effects might be correlated with other
firm-specific characteristics, we estimate the role of managers in
a framework where we can control for observable and unobserv
able differences across firms. For this purpose, we construct a
manager-firm matched panel data set, where we track individual
top managers across different firms over time. This allows us to
estimate how much of the unexplained variation in firm practices can be attributed to manager fixed effects, after controlling for
firm fixed effects and time-varying firm characteristics.5
The specific corporate variables we study relate to invest
ment policy (capital expenditures, investment to Q sensitivity, investment to cash flow sensitivity, and acquisition policy), finan
cial policy (financial leverage, interest coverage, cash holdings, and dividend payouts), organizational strategy (R&D expendi
tures, advertising expenditures, diversification policy, and cost
cutting policy), and performance.6 Our results show that manager fixed effects are empirically
important determinants of a wide range of corporate variables.
On average, adding the fixed effects to models of corporate prac tices that already account for observable and unobservable firm
characteristics results in increases in adjusted i?2's of more than
four percentage points. More interestingly, we find that manager
4. For a recent study of intraindustry variation in leverage, see MacKay and
Phillips [2002]. 5. A few recent papers relate managerial characteristics to firm performance
and investment. See, for example, Malmendier and T?te [2002] and Wasserman, Nohria, and Anand [2002]. However, these papers do not control for firm fixed effects and therefore cannot separate manager effects from firm effects. In a more recent paper Malmendier and T?te [2003] use a methodology more similar to ours.
They track switchers across firms to study the effect of managerial overconfidence on acquisition behavior.
6. The fixed effects approach used in this analysis intends to measure whether there is persistence of managerial style over time and across different
jobs. This is the very definition of "style" used in this paper. But we do not want to rule out that managers may learn or develop their style over time.

1172 QUARTERLY JOURNAL OF ECONOMICS
effects matter much more for some decisions than others. Man
ager fixed effects appear to be especially important in acquisition or diversification decisions, dividend policy, interest coverage, and cost-cutting policy.
By correlating these estimated manager fixed effects across
different corporate variables, we are also able to identify some
overarching patterns in managerial decision-making. Among other things, we find that managers seem to differ in their ap
proach toward company growth and in their financial aggressive ness. Managers who engage in more external acquisitions and
diversification also display lower levels of capital expenditures and R&D. We also find that managers who have high investment
to Q fixed effects rank lower in their investment to cash flow
sensitivity (and vice versa), suggesting that managers may differ, all else equal, in the benchmark that they use when making investment decisions.
These results provide evidence that top executives vary con
siderably in their management "styles" and thereby suggest a
rather novel approach for corporate finance research. Yet, they also raise questions as to why managers may behave so differ
ently in apparently similar economic environments. Do these
findings reflect differences in preferences, absolute or relative
skills, or opinions? More importantly, what are the efficiency
implications of these findings? While these questions outline clear
directions for future work, we provide some preliminary evidence
on some of these issues. First, we show that the differences in
managerial practices documented above are systematically re
lated to differences in performance. More precisely, we show that
there are significant managerial fixed effects in performance and
these effects are statistically related to some of the fixed effects in
corporate practices. For example, managers who are more invest
ment-Q sensitive, and have higher administrative expenses, and
are less active in the acquisition and diversification markets also
have lower performance fixed effects. In addition, we show that
managers with higher performance fixed effects also receive
higher salary and total compensation and that these managers are more likely to be found in better governed firms. These results
are suggestive of possibly important efficiency implications of our
findings. In a final step, we tie back differences in style to observable
managerial characteristics. The two characteristics we consider
are birth cohort and MBA graduation. We analyze the extent to
MANAGING WITH STYLE 1173
which corporate decisions are affected by these two characteris
tics, after controlling for any fixed differences across firms and
other time-varying firm factors. We find that older generations of
CEOs appear overall more conservative in their decision-making. On the other hand, managers who hold an MBA degree appear overall to follow more aggressive strategies.
The rest of this paper is organized as follows. Section II
provides a brief discussion of alternative hypotheses as to why individual managers may matter for corporate decisions. Section
III presents the different data sources, describes the construction
of the data set, and defines the main variables of interest. Section
IV quantifies the importance of manager fixed effects for various
corporate practices, and Section V discusses possible efficiency
implications of these findings. Section VI studies birth cohort and
MBA graduation as two specific determinants of managerial
style. Section VII summarizes and offers some concluding remarks.
II. Why Should Individual Managers Matter?
Many empirical studies of corporate decisions implicitly as
sume a neoclassical view of the firm in which top managers are
homogeneous and selfless inputs into the production process. Under this quite narrow view, different managers are regarded as perfect substitutes for one another. An even more extreme
assumption is that top managers simply do not matter for what is
going on within a firm. While executives might differ in their
preferences, risk-aversion or skill levels, none of this translates
into actual corporate policies, if a single person cannot easily affect these policies. Under either of these scenarios, we would
not expect individual managers to matter for corporate decisions.
Two firms sharing similar technologies, factor, and product mar
ket conditions will make similar choices, whether or not they also
share the same management team.
In contrast, standard agency models acknowledge that man
agers may have discretion inside their firm, which they can use to
alter corporate decisions and advance their own objectives. How
ever, these models do not generally imply that corporate behavior
will vary with individual managers, as they typically do not focus on idiosyncratic differences across managers. Rather, agency
models attribute variations in corporate behavior to heterogene

1174 QUARTERLY JOURNAL OF ECONOMICS
ity in the strength of governance mechanisms across firms, i.e.,
heterogeneity in firms' ability to control managers.7 Heterogeneity in corporate practices across managers will
arise in models that explicitly allow managers to differ in their
preferences, risk aversion, skill levels, or opinions. But there are
two distinct interpretations as to how these managerial differ ences translate into corporate choices. The first are extensions of
the standard agency models in which a manager can impose his or her own idiosyncratic style on a company, if corporate control
is poor or limited. Under this view, one might expect that the
impact of managers to increase as the sources of internal and
external controls weaken. Alternatively, if some management
styles are more performance-enhancing than others, better gov erned firms may be more likely to select managers with such
styles. A second set of models that imply manager-specific effects in
corporate practices are extensions of the neoclassical model in
which managers vary in their match quality with firms. In this
case, managers do not impose their idiosyncratic style on the firm
they lead, but are purposefully chosen by firms because of these
specific attributes. For example, a board may determine the need
to go through an external growth phase and therefore hire a new
manager who is more aggressive or more prone to engage in
expansion strategies.8 Under this interpretation and given the
empirical framework we develop below, we would only find sig nificant manager effects in corporate practices if firms' optimal
strategies change over time. Indeed, if a given company's optimal
strategy were invariant over time, an incoming manager's style would only be the continuation of the prior manager's style.
These two main variants of the "managers matter" view of
corporate decisions have very different efficiency implications. Under the first interpretation, some managerial traits or prefer ences may cause corporations to adopt suboptimal strategies. The
extent to which this occurs will be limited by boards' ability to
7. One exception is Hermalin and Weisbach [1998], who model a process by which good managers can gain more discretion, which in turn allows them to
change the governance relationship within their firm. Also, career concern models show that the intensity of the conflict of interest between managers and owners
may vary over the life cycle of managers. 8. Alternatively, one could argue that boards systematically get fooled and
mistakenly infer a manager's style based on the manager's prior job experience. A
manager may by chance be involved in a wave of acquisitions in her or his prior firm, which may be wrongly perceived as an "acquisition style" and influence future hiring by other firms. We discuss this alternative view in more detail in subsection IV. C.
MANAGING WITH STYLE 1175
screen or monitor managers. Under the second interpretation,
managerial differences in style will not lead to inefficiencies as
long as boards optimally select the right manager for the right
job. However, under either interpretation, individual managers are central in bringing about the changes in corporate policies.
While our primary goal in this paper is not to distinguish between these different interpretations but rather to first estab
lish that individual managers do matter in the determination of
firm policies, we will provide some preliminary evidence about
possible efficiency implications of our findings in Section V.
III. Data
III.A. Sample Construction
A straightforward way to proceed when trying to determine
whether there are systematic differences in the way top manag ers behave would be to ask whether there are important manager fixed effects in corporate practices, controlling for all relevant
observable firm-level characteristics. One obvious problem with
this approach is that there might be persistent differences in
practices across firms due to some unobservable third factors and
that these factors might be correlated with the manager fixed
effects. Practically, this implies that one needs to separate man
ager fixed effects from firm fixed effects.
We therefore construct a manager-firm matched panel data
set that allows us to track the same top managers across different
firms over time. The data we use are the Forbes 800 files, from
1969 to 1999, and Execucomp data, from 1992 to 1999. The
Forbes data provide information on the CEOs of the 800 largest U. S. firms. Execucomp allows us to track the names of the top five highest paid executives in 1500 publicly traded U. S. firms.
These include the CEO, but also other top executives, most often
the CFO, COO, and subdivision CEOs.9 We then restrict our
attention to the subset of firms for which at least one specific top executive can be observed in at least one other firm.10 In doing so,
we also impose that the managers have to be in each firm for at
least three years.11 For each firm satisfying these requirements,
9. We use the variable titlean in Execucomp to code the specific position of a
manager in a given firm. 10. We discuss below (subsection IV.A) the possible selection issues associ
ated with this sample construction. 11. This three-year requirement ensures that managers are given a chance to
"imprint their mark" in a given company. All of the results below were replicated
1176 QUARTERLY JOURNAL OF ECONOMICS
we keep all observations, i.e., including years where the firm has
managers that we do not observe in multiple firms. The resulting
sample contains about 600 firms and slightly over 500 individual
managers who can be followed in at least two different firms.12
The average length of stay of a manager within a given firm is a
little over five years in our data. As is customary in the study of
investment regressions, we exclude firms in the banking and
insurance industries as well as utilities from our sample. To
preserve consistency across results, we also exclude these firms in
the analysis of noninvestment variables.13
For this sample of firms, we use COMPUSTAT and SDC data
to construct a series of annual accounting variables. We concen
trate our analysis on three different sets of corporate decisions
(investment policy, financial policy, and organizational strategy) as well as on corporate performance. The definition and construc
tion of the specific variables used in the analysis are reported in
the Data Appendix.
III.B. Sample Description
Table I presents means and standard deviations for all the
corporate variables of interest. The first two columns report sum
mary statistics for the manager-firm matched sample. For com
parison, the last two columns of Table I report equivalent sum
mary statistics for the entire COMPUSTAT sample between 1969
and 1999. As expected, constraining our sample to firms where we
can observe at least one executive switch leads us to select larger firms. Indeed, executives from larger firms are more likely to
move between COMPUSTAT firms. Executives from smaller
firms, on the other hand, might have a higher probability to move
to private firms or positions within large firms that are below the
top five level. Such executives cannot be tracked in our data
sources.14 The average firm in our sample also has a somewhat
higher Tobin's Q ratio, higher rate of return on assets, and higher
ignoring this three-year requirement in the sample construction. The results we
obtained were qualitatively similar but, not surprisingly, statistically weaker. 12. A very small subset of managers are observed in strictly more than two
different firms. 13. When we include these observations in the noninvestment regressions,
our results are virtually unchanged. 14. One could argue that this required focus on larger firms may in fact bias
our results against finding systematic effects of managers on firm policies. Indeed, a specific individual might be more influential in a smaller organization that
requires more personal involvement of the top managers in day-to-day activities. An alternative argument would be that managers who have more distinct "styles" are more likely to be found in larger firms.

MANAGING WITH STYLE 1177
TABLE I Descriptive Statistics
Manager-firm matched
sample
Manager characteristics
sample Compustat
Mean St. dev. Mean St. dev. Mean
St.
dev.
Total sales 5606.5 11545.6 5333.3 10777.4 2649.6 5878.2
Investment 0.39 2.94 0.28 0.50 0.34 2.67
Average Tobin's Q 2.40 3.85 2.03 2.05 1.70 1.43
Cashflow 0.44 1.91 0.45 2.10 0.43 2.47
N of acquisitions 0.77 1.48 0.65 1.40 0.36 1.45
Leverage 0.35 0.39 0.34 0.28 0.45 1.21
Interest coverage 35.0 875.1 40.5 663.1 27.6 166.2
Cash holdings 0.11 0.16 0.08 0.11 0.17 0.80
Dividends/earnings 0.11 0.79 0.14 1.05 0.16 0.25
N of diversifying acquisitions 0.32 1.09 0.28 0.91 0.12 0.63
R&D 0.05 0.07 0.04 0.14 0.03 0.06
Advertising 0.05 0.06 0.05 0.06 0.04 0.06
SG&A 0.26 0.98 0.21 0.19 0.18 0.64
Return on assets 0.16 0.11 0.19 0.15 0.10 0.09
Operating return on assets 0.09 0.12 0.11 0.22 0.08 0.13
Sample size 6766 10472 38489
a. "Manager-firm matched sample" refers to the set of firm-year observations for firms that have at least one manager observed in multiple firms with at least a three-year stay at each firm. This sample includes observations for these firms in the years in which they have other managers that we do not observe in
multiple firms (see subsection III.A for details). "Manager characteristics sample" refers to the set of
firm-year observations for which we can obtain information on the year of birth and educational background of the CEO (see subsection VI.A for details). "Compustat" is a comparison sample of the 1500 largest listed firms over the period 1969 to 1999. All samples exclude firms in the banking and insurance industry, as well as regulated industries.
b. Details on the definition and construction of the variables reported in the table are available in the Data Appendix.
c. Total sales are expressed in 1990 dollars. d. Sample size refers to the maximum number of observations; not all variables are available for each
year and firm.
number of acquisitions, but slightly lower cash holdings and
leverage levels. It is, however, very similar to the average COM
PUSTAT firm with respect to cash flow, investment levels, divi
dend payouts, R&D, and SG&A.
Table II tabulates the nature of the executive transitions in
our sample. We separate three major executive categories: CEOs,
CFOs, and "Others." The majority of the job titles in this "Others"
category correspond to operationally important positions: 44 per cent are subdivision CEOs or Presidents, 16 percent are Execu
tive Vice-Presidents, and 12 percent are COOs; the rest are Vice
Presidents and other more generic titles.
1178 QUARTERLY JOURNAL OF ECONOMICS
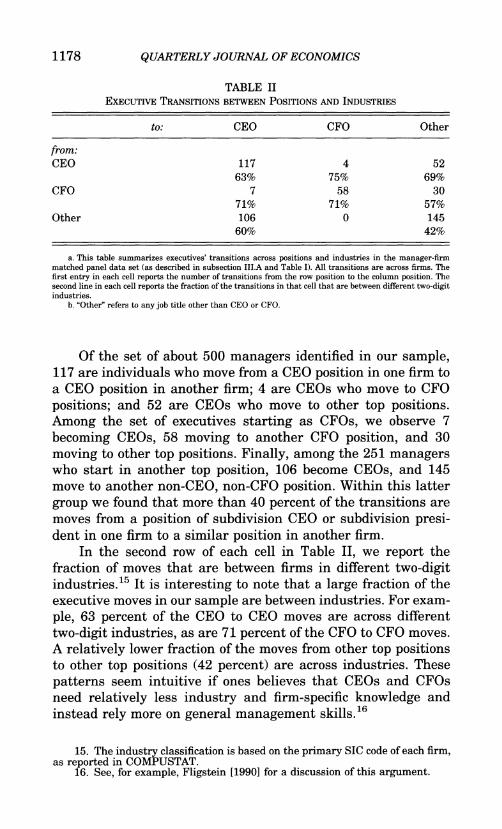
TABLE II Executive Transitions between Positions and Industries
to: CEO CFO Other
from: CEO 117 4 52
63% 75% 69% CFO 7 58 30
71% 71% 57% Other 106 0 145
60% 42%
a. This table summarizes executives' transitions across positions and industries in the manager-firm matched panel data set (as described in subsection III.A and Table I). All transitions are across firms. The first entry in each cell reports the number of transitions from the row position to the column position. The second line in each cell reports the fraction of the transitions in that cell that are between different two-digit industries.
b. "Other" refers to any job title other than CEO or CFO.
Of the set of about 500 managers identified in our sample, 117 are individuals who move from a CEO position in one firm to
a CEO position in another firm; 4 are CEOs who move to CFO
positions; and 52 are CEOs who move to other top positions.
Among the set of executives starting as CFOs, we observe 7
becoming CEOs, 58 moving to another CFO position, and 30
moving to other top positions. Finally, among the 251 managers who start in another top position, 106 become CEOs, and 145
move to another non-CEO, non-CFO position. Within this latter
group we found that more than 40 percent of the transitions are
moves from a position of subdivision CEO or subdivision presi dent in one firm to a similar position in another firm.
In the second row of each cell in Table II, we report the
fraction of moves that are between firms in different two-digit industries.15 It is interesting to note that a large fraction of the
executive moves in our sample are between industries. For exam
ple, 63 percent of the CEO to CEO moves are across different
two-digit industries, as are 71 percent of the CFO to CFO moves.
A relatively lower fraction of the moves from other top positions to other top positions (42 percent) are across industries. These
patterns seem intuitive if ones believes that CEOs and CFOs
need relatively less industry and firm-specific knowledge and
instead rely more on general management skills.16
15. The industry classification is based on the primary SIC code of each firm, as reported in COMPUSTAT.
16. See, for example, Fligstein [1990] for a discussion of this argument.
MANAGING WITH STYLE 1179
IV. Is There Heterogeneity in Executive Practices?
IV.A. Empirical Methodology
The nature of our identification strategy can be most easily
explained with an example. Consider the dividend payout ratio as
the corporate policy of interest. From a benchmark specification we derive residual dividend payouts at the firm-year level after
controlling for any average differences across firms and years as
well as for any firm-year specific shock, such as an earnings
shock, that might affect the dividend payout of a firm. We then
ask how much of the variance in these residual dividend payouts can be attributed to manager-specific effects.
More specifically, for each dependent variable of interest, we
propose to estimate the following regression:
(1) y it = at + y? + ?Xit + \Ceo + ^cfo + ^others + *it,
where yit stands for one of the corporate policy variables, at are
year fixed effects, y? are firm fixed effects, Xit represents a vector
of time-varying firm level controls, and eit is an error term. The
remaining variables in equation (1) are fixed effects for the man
agers that we observe in multiple firms. Because we want to
separately study the effect of CEOs, CFOs, and other top execu
tives on corporate policies, we create three different groups of
manager fixed effects: \Ceo are fixed effects for the group of
managers who are CEOs in the last position we observe them in,
\Cfo are fixed effects for the group of managers who are CFOs in
the last position we observe them in, and ^others are fixed effects
for the group of managers who are neither CEOs nor CFOs in the
last position we observe them in.17 Finally, when estimating
equation (1), we account for serial correlation by allowing for
clustering of the error term at the firm level.18
It is evident from equation (1) that the estimation of the
manager fixed effects is not possible for managers who never
leave a given company during our sample period. Consider, for
example, a specific manager who never switches companies and
advances only through internal promotions, maybe moving from
17. We also repeated all of the analyses below after separating CEO to CEO
moves, CEO to CFO moves, etc. The results were qualitatively similar to the more
aggregated results reported in the paper. 18. In subsection IV.C we propose two alternative estimation methods to deal
with serial correlation issues and better address possible issues regarding the
persistence of the manager fixed effects.

1180 QUARTERLY JOURNAL OF ECONOMICS
a CFO to a CEO position in his/her firm. The effect of this
manager on corporate practices cannot be estimated separately from his firm fixed effect. The manager fixed effect and the firm
fixed effect are perfectly collinear in this case. It would be statis
tically possible to extend our analysis to top managers whom we
observe in one firm but who stay in that firm for only a subset of
the entire sample period. To be conservative in our estimation,
however, we decided to stay away from this approach. Indeed, the
fixed effects for such managers correspond to period-firm-specific
effects, which could be more easily attributed to other unobserv
able time-varying factors. Instead, for manager fixed effects to
matter under our more stringent approach, we require that cor
porate practices have to be correlated across (at least) two firms
when the same manager is present.19 While the discussion above clarifies why our identification
relies solely on outside hires, let us highlight possible implica tions of this sample selection for more general inferences based on
our results. First, it is useful to note that the outside hire of top
executives, and especially of CEOs, is far from exceptional among the large U. S. public firms that we focus on in this analysis.20
Nevertheless, one could reasonably argue that managers who are
recruited from the outside are different from internally promoted ones.21 For example, one might argue that outside managers have
"stronger" or "better" styles on average, as firms are willing to
look outside their organization to find these managers.
Finally, and most importantly, there is no such thing as a
random allocation of top executives to firms. Therefore, we are not
hoping in this section to estimate the causal effect of managers on
firm practices. Instead, our objective is more modest. We want to
assess whether there is any evidence that firm policies systemat
ically change with the identity of the top managers in these firms.
19. For the sake of completeness, we replicate our results under this alter native approach, thereby covering a much larger set of executives. As one might have expected, we find even stronger manager fixed effects.
20. We use the entire Execucomp sample to compute the fraction of CEOs who were hired from the outside rather than internally promoted. We find that
only 48 percent are internally promoted. In a more detailed study, Panino [1997] shows that the prevalence of inside versus outside succession varies a lot by industry.
21. Suggestive evidence for this seems to emerge from a set of papers looking at stock market responses to the announcement of management turnover. For
example, Warner, Watts, and Wruck [1988] document abnormally high returns around outsider succession events, but no significant overall effect.
MANAGING WITH STYLE 1181
TV.B. Results
Tables III and IV report F-tests and adjusted R2 from the
estimation of equation (1) for the different sets of corporate policy variables. For each variable we report in the first row the fit of a
benchmark specification that includes only firm fixed effects, year fixed effects, and time-varying firm controls. The next two rows,
respectively, report the change in adjusted R2 when we consecu
tively add the CEO fixed effects and the fixed effects for all three
groups of executives (CEOs, CFOs, and other top positions). The
second and third rows also report F-statistics from tests of the
joint significance of the different sets of manager fixed effects.
Overall, the findings in Tables III and IV suggest that man
ager-specific effects matter both economically and statistically for
the policy decisions of firms. Including CEOs as well as other
managers' fixed effects increases the adjusted J?2 of the estimated
models significantly. Similarly, we find that the F-tests are large and allow us to reject in most cases the null hypothesis that all
the manager fixed effects are zero. We also see that there are
important differences as to which decision variables seem to be
most affected by manager decisions. Moreover, different types of
manager matters for different decisions; e.g., CFOs matter more
for financial decisions. We now discuss these results in greater details.
Table III reports our results for investment policy (Panel A) and financial policy (Panel B). We start with a discussion of the
investment results. The first variable in this table is capital
expenditures (as a fraction of lagged net property, plant, and
equipment). The benchmark specification includes controls for
firm fixed effects, year fixed effects, cash flow, lagged Tobin's Q, and the lagged logarithm of total assets. The adjusted R2 for this
specification is 91 percent. Even though the fit of this benchmark
model is already very high, the adjusted R2 increases by 3 percent when we include the CEO fixed effects and by more than 5
percent when we include all sets of manager fixed effects. Also, the F-tests are large, leading us to reject the null hypothesis of no
joint effect in all cases.
The next two variables are investment to Tobin's Q and
investment to cash flow sensitivities, respectively. The estimation
method for these two variables differs slightly from the one de
scribed in subsection IV.A. Indeed, the fixed effects of interest
here do not relate to the level of a given variable (in this case,
investment), but rather to the sensitivity of that variable to

1182 QUARTERLY JOURNAL OF ECONOMICS
TABLE III Executive Effects on Investment and Financial Policies
Panel A: Investment policy
F-tests on fixed effects for
CEOs CFOs Other executives Adjusted
N R2
Investment
Investment
Investment
Inv to Q sensitivity Inv to Q sensitivity 17.87 (<.0001, 223) Inv to Q sensitivity 5.33 (<.0001, 221) Inv to CF sensitivity Inv to CF sensitivity Inv to CF sensitivity
N of acquisitions N of acquisitions N of acquisitions
16.74 (<.0001, 198) 19.39 ?.0001, 192) 53.48 (<.0001, 55)
2.00 ?.0001, 205) 0.94 (.7276, 194)
2.01 (<.0001, 204) 1.68 (<.0001, 199)
6631 .91
6631 .94
8.45 ?.0001, 200) 6631 .96
6631 .95
6631 .97
9.40 ?.0001, 58) 20.29 ?.0001, 208) 6631 .98
6631 .97
6631 .98
1.29 (.0760,55) 1.28 (.0058, 199) 6631 .98
6593 .25
6593 .28
1.74 (.0006, 55) 4.08 ?.0001, 203) 6593 .36
Panel B: Financial policy
F-tests on fixed effects for
CEOs CFOs Other executives Adjusted
N R2
Leverage
Leverage 0.99 (.5294,203)
Leverage 0.86 (.9190,199) 1.43 (.0225,54) Interest coverage Interest coverage 0.56 (.99, 193) Interest coverage 0.35 (.99, 192) 13.85 ?.0001, 50) Cash holdings Cash holdings 2.52 ?.0001, 204) Cash holdings 2.48 ?.0001, 201)
Dividends/earnings
Dividends/earnings 5.78 ?.0001, 203)
Dividends/earnings 4.95 ?.0001, 199)
3.68 ?.0001, 54)
1.07 (.3368,54)
6563 .39
6563 .39
1.21 (.0230, 203) 6563 .41
6278 .31
6278 .31
2.61 ?.0001, 192) 6278 .41
6592 .77
6592 .78
2.53 ?.0001, 202) 6592 .80
6580 .65
6580 .71
1.74 ?.0001, 203) 6580 .72
a. Sample is the manager-firm matched panel data set as described in subsection III.A and Table I. Details on the definition and construction of the variables reported in the table are available in the Data
Appendix. b. Reported in the table are the results from fixed effects panel regressions, where standard errors are
clustered at the firm level. For each dependent variable (as reported in column 1), the fixed effects included are row 1: firm and year fixed effects; row 2: firm, year, and CEO fixed effects; row 3: firm, year, CEO, CFO, and other executives fixed effects. Included in the "Investment to Q" and "Investment to cash flow" regres sions are interactions of these fixed effects with lagged Tobin's Q and cash flow, respectively. Also the
"Investment," "Investment to Q," and "Investment to cash flow" regressions include lagged logarithm of total assets, lagged Tobin's Q, and cash flow. The "Number of Acquisitions" regressions include lagged logarithm of total assets and return on assets. Each regression in Panel B contains return on assets, cash flow, and the
lagged logarithm of total assets. c. Reported are the F-tests for the joint significance of the CEO fixed effects (column 2), CFO fixed effects
(column 3), and other executives fixed effects (column 4). For each F-test we report the value of the F-statistic, the p-value, and the number of constraints. For the "Investment to Q" and "Investment to Cash Flow"
regressions, the F-tests are for the joint significance of the interactions between the manager fixed effects and Tobin's Q and cash flow, respectively. Column 5 reports the number of observations, and column 6 the
adjusted R2s for each regression.
MANAGING WITH STYLE 1183
Tobin's Q and cash flow. In practice, for investment to Q sensi
tivity, we start by regressing investment on year fixed effects, cash flow, lagged Tobin' Q, the lagged logarithm of total assets, firm fixed effects, and firm fixed effects interacted with lagged Tobin's Q. We then add to this benchmark specification manager fixed effects as well as manager fixed effects interacted with
lagged Tobin's Q. The estimated coefficients of interest are those on the interaction terms. We proceed in a similar fashion in our
study of investment to cash flow sensitivity. The results indicate
increases in adjusted R2 when including the interaction terms of
manager fixed effects with cash flow and lagged Tobin's Q, espe
cially for investment to Q sensitivity. The adjusted R2 goes up from 95 percent to 98 percent when we allow investment to Q to
be manager specific. The last variable in Panel A is number of acquisitions. For
this variable we observe an increase in adjusted R2 of about 11
percent following the inclusion of the manager fixed effects.
Maybe surprisingly, we find that the fixed effects for the "Other"
managers are very significant and that their inclusion has an
especially large impact on the adjusted R2. In regressions not
reported here we broke down the set of other managers into more
specific job title categories. We found that the subdivision CEOs
and COOs explain most of the increase in adjusted R2 within this
"Other" category. Panel B of Table III focuses on financial policy. Included in all
regressions are firm fixed effects, year fixed effects, the lagged
logarithm of total assets, and the rate of return on assets.22
Overall, the increases in adjusted R2 in this Panel are of a similar
order of magnitude as those found for the investment variables.
The adjusted R2 of the leverage regression increases from 39
percent to 41 percent when we include the manager fixed effects.
The adjusted R2 of the interest coverage regression, an alterna
tive measure of capital structure, increases by as much as 10
percent (from 31 percent to 41 percent). Interestingly, CFOs have
the strongest effect on interest coverage, a key financial indicator.
The adjusted R2 of the cash holdings regression goes up by 3
percent, from 77 percent to 80 percent, when we compare the
benchmark specification with the specification that includes all
manager fixed effects. Finally, managers appear to be important determinants of dividend policy, with an overall increase in ad
22. We also experimented with adding controls for assets uniqueness and tax
advantage from debt in the leverage regressions. The results were unaffected.

TABLE IV Executive Effects on Organizational Strategy and Performance
Panel A: Organizational strategy
F-tests on fixed effects for
CEOs CFOs Other executives N
- ? i
Adjusted R2 ?^
N of diversifying acquis. N of diversifying acquis. N of diversifying acquis. R&D R&D R&D
Advertising
Advertising
Advertising SG&A SG&A SG&A
2.06 ?.0001, 204)
1.23 (.0163,202)
1.86 ?.0001, 145)
2.27 ?.0001, 143)
2.88 ?.0001, 95)
4.03 ?.0001, 95)
33.55 ?.0001, 123)
13.80 ?.0001, 118)
1.74 (.0007,53)
3.60 ?.0001, 45)
0.84 (.6665,21)
0.82 (.7934,42)
3.97 ?.0001, 202)
4.46 ?.0001, 143)
6.10 ?.0001, 80)
0.77 (.9777, 146)
6593 6593 6593 4283 4283 4283 2584 2584 2584 2397 2397 2397
.22 c! 25
I .33 g
.78 P
.79 O
S3 S
.79 O
81 ? .84 g .46 I .83 S .83
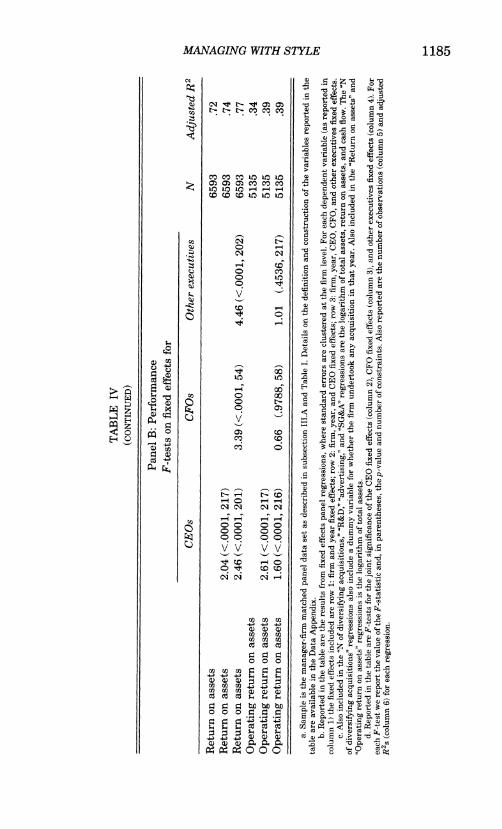
TABLE IV (CONTINUED)
Panel B: Performance
F-tests on fixed effects for
CEOs CFOs Other executives N Adjusted R2
Return on assets
Return on assets
Return on assets
Operating return on assets
Operating return on assets
Operating return on assets
2.04 ?.0001, 217)
2.46 ?.0001, 201)
2.61 ?.0001, 217)
1.60 ?.0001, 216)
3.39 ?.0001, 54)
0.66 (.9788,58)
4.46 ?.0001, 202)
1.01 (.4536,217)
6593 6593 6593 5135 5135 5135
.72
.74
.77
.34
.39
.39
a. Sample is the manager-firm matched panel data set as described in subsection III.A and Table I. Details on the definition and construction of the variables reported in the table are available in the Data Appendix.
b. Reported in the table are the results from fixed effects panel regressions, where standard errors are clustered at the firm level. For each dependent variable (as reported in column 1) the fixed effects included are row 1: firm and year fixed effects; row 2: firm, year, and CEO fixed effects; row 3: firm, year, CEO, CFO, and other executives fixed effects.
c. Also included in the "N of diversifying acquisitions," "R&D," "advertising," and "SG&A" regressions are the logarithm of total assets, return on assets, and cash flow. The "N of diversifying acquisitions" regressions also include a dummy variable for whether the firm undertook any acquisition in that year. Also included in the "Return on assets" and "Operating return on assets" regressions is the logarithm of total assets.
d. Reported in the table are F-tests for the joint significance of the CEO fixed effects (column 2), CFO fixed effects (column 3), and other executives fixed effects (column 4). For each F-test we report the value of the F-statistic and, in parentheses, thep-value and number of constraints. Also reported are the number of observations (column 5) and adjusted ?2s (column 6) for each regression.
I
I Go
S
1186 QUARTERLY JOURNAL OF ECONOMICS
justed R2 of 7 percent. Moreover, we find that dividend policy seems to be more substantially affected by the CEOs than by the
CFOs or other top executives.
Table IV reports our results for the organizational policy variables (Panel A) and for corporate performance (Panel B).
Again, we find that top executives have large effects on the
realization of these variables. The fit of the diversification regres sion improves by 11 percent.23 The adjusted R2s of the R&D and
advertising regressions both increase by 5 percent. Finally, cost
cutting policy, as proxied by the ratio of SG&A to total sales,
appears to systematically depend on the identity of the CEOs.24
In line with a priori intuition we find that CEOs and other top
managers seem to have larger effects on organizational strategy than CFOs do.
Finally, Panel B of Table IV focuses on two different mea
sures of corporate performance. The first measure we consider is
a standard rate of return on assets. Included in the benchmark
specification here are firm fixed effects, year fixed effects, and the
logarithm of total assets. Our results show that accounting per formance varies significantly across top executives. The F-tests
are large for all groups of managers, and the adjusted R2 in
creases by more than 5 percent. One possible concern with this latter finding is that the
systematic differences in rate of return on assets across managers
may not reflect actual differences in performance but rather
differences in aggressiveness of accounting practices or willing ness to "cook the books."25 In order to address this concern, we use
an alternative accounting measure of performance that is less
subject to accounting manipulations and better captures true
operating performance: operating cash flow (as a ratio of total
assets). We find that this measure of operating performance also
varies systematically across top managers. The F-tests on the
CEO fixed effects are jointly significant and the increase in ad
justed R2 is nearly 6 percent. Interestingly, for this measure of
performance, we cannot reject the null hypothesis that the fixed
23. In regressions not reported here we again broke down the set of other
managers into more specific job title categories. We found that the subdivision CEOs and COOs explain most of the increase in adjusted R2.
24. The regressions for advertising expenditures, R&D expenditures, and SG&A were estimated on a smaller sample due to the inconsistent availability of
these variables in COMPUSTAT. 25. In an ongoing project, we are more systematically investigating the
importance of manager fixed effects in accounting practices and how they relate to the results on real variables reported in this paper.

MANAGING WITH STYLE 1187
effects on the group of the CFOs and "Other" executives are all zeros.
rV.C. Robustness of Results
We conduct a series of specification checks to verify the
robustness of the findings reported above. First, we replicate the
analysis above after collapsing the data at the manager/firm level. This provides an alternative way to address possible serial
correlation concerns. More specifically, starting with the firm
year data, we estimate firm-year residuals by regressing the
policy variables of interest on firm fixed effects, year fixed effects, and the time-varying firm controls. We then collapse these an
nual residuals by manager-firm spell. Last, we reestimate the
manager fixed effects in this collapsed data set. We find, in
regressions not reported here, that our results are robust to this
alternative estimation technique.
Second, one might worry that the manager fixed effects iden
tified above do not imply persistence of managerial style across
jobs and firms. For example, consider a manager who happens to
be part of a firm during a period of intense acquisition activity; we
might estimate a positive acquisition fixed effect for that manager even though that effect does not persist in his future firm. This concern is especially warranted for some of the lumpier policy variables covered in our analysis.
We address this concern in the first column of Table V. Here
we use a more parametric specification to analyze the persistence in managerial styles. More specifically, for each policy variable,
we construct manager-firm residuals as described above. We then
regress a manager's average residual in his second firm on his
average residual in the first firm we observe her/him in.26 Re
ported in the first column of Table V are the estimated coefficients
on the first firm residual for each of the corporate variables.
We find a positive and statistically significant relationship between a manager's residual in his last job and his residual in
his first job for all the policy variables, with ?-statistics varying between 4 and 16 and R2 between 5 and 35 percent. Moreover, the
estimated coefficients in these regressions are also economically very significant for most of the variables. For example, a top
manager associated with 1 percent extra leverage in his first job is associated with about 0.5 percent extra leverage in his second
26. Note that we cannot directly perform this more parametric exercise for the investment to Q and investment to cash flow sensitivities.

1188 QUARTERLY JOURNAL OF ECONOMICS
TABLE V Persistence of Manager Effects: Real Data and Placebo Data
Real data Placebo data
Investment 0.05 0.01 (0.02) (0.02) [0.01] [0.00]
N of acquisitions 0.49 - 0.02 (0.05) (0.05) [0.13] [0.00]
Leverage 0.40 0.02 (0.03) (0.05) [0.21] [0.01]
Cash holdings 0.74 0.05 (0.05) (0.07) [0.35] [0.01]
Dividends/earnings 0.80 0.06 (0.04) (0.12) [0.51] [0.02]
N of diversifying acquis. 0.25 0.04 (0.06) (0.05) [0.07] [0.00]
R&D 0.65 0.09 (0.05) (0.05) [0.33] [0.02]
Advertising 0.62 0.11 (0.08) (0.06) [0.02] [0.01]
SG&A 0.14 0.08 (0.01) (0.08) [0.03] [0.02]
Return on assets 0.31 0.02 (0.07) (0.06) [0.40] [0.01]
Operating return on assets 0.18 0.03 (0.03) (0.11) [0.07] [0.00]
a. Sample is the manager-firm matched panel data set as described in subsection III .A and Table I. Details on the definition and construction of the variables reported in the table are available in the Data
Appendix. b. Each entry in this table corresponds to a different regression. c. In column 1 we regress for each of the policy variables a manager's average residual in his second firm
on his average residual in his first firm. In column 2 we regress for each of the policy variables a "manager's average residual" in his second firm three years prior to the manager joining that firm on his true average residual in his first firm. See subsection IV.C for details.
d. The first number in each cell is the estimated coefficient on the first job residual, the second number is the estimated standard error (in parentheses) and the third number is the estimated R (in square brackets).

MANAGING WITH STYLE 1189
job. Moreover, corporate policies for which we find particularly
strong manager fixed effects in Tables III and IV (such as acqui
sitions, diversification, dividend policy, or R&D) also prove to
generate higher R2 and larger coefficients in this more paramet ric setup. These results are consistent with a persistence of the
manager fixed effects across firms.
Third, we want to argue that the manager fixed effects cap ture the active influence of managers on corporate decisions.
There is, however, an alternative interpretation that is poten
tially consistent with our findings, but does not imply an active
influence of managers on their companies. Suppose a model of the
world where managers have no specific skills or styles but boards
mistakenly believe otherwise. A manager may, by coincidence, be
involved in a wave of acquisitions in her or his prior firm, and this
may be wrongly perceived as an "acquisition style" by other
boards. If this leads to the hiring ofthat manager by a firm that
would have gone on an external expansion phase even without
the manager, we might estimate a positive acquisition fixed effect
for that manager. To investigate this alternative interpretation, we analyze the
precise timing of the observed changes in corporate policies. Un
der the story outlined above, we would not expect to find a precise
overlap between the arrival of the new manager and the change in corporate practices. In fact, one might expect that some of the
changes in policies actually precede the arrival of the new man
ager, as the board has already decided to undertake the changes. On the other hand, if managers do play the active role in shaping
corporate policies, the changes in policy will only happen after the
manager is hired.27
Practically, we construct average residuals in corporate pol icies as described above but now assume that each manager in
our data set joins his second firm three years prior to the actual
turnover date and leaves that firm at the time of the actual
turnover date. In doing this, we are careful to censure the data for
the second firms at the actual date of arrival of the new managers in these firms. We then regress these average pre-turnover resid
uals in the second firm on the true average residuals in the first
firm.
Column 2 of Table V presents the results of this exercise. We
27. This test relies on a specific timing assumption. One could still argue that
boards, although they do not need the manager to bring about any changes in
corporate strategy, nevertheless only go ahead with the changes once the new
manager arrives.

1190 QUARTERLY JOURNAL OF ECONOMICS
find that the estimated coefficients in these placebo regressions are economically very small compared with those in column 1.
Most of the estimated coefficients are very close to zero, and all
but two are statistically insignificant.28 These results confirm
that the bulk of the changes in corporate policy happen once the new manager has joined the firm and not prior to his arrival,
suggesting an active role of the managers in implementing these
changes.
IV. D. Magnitude of the Manager Fixed Effects
So far, we have seen that manager-specific effects explain a
significant fraction of the variation in firm policies and outcomes.
Additionally, we would like to assess how big the observed differ
ences between managers are. Therefore, we look at the distribu
tions of the fixed effects estimated above. For example, we can see
how much extra leverage a manager in the upper tail of the
leverage fixed effects distribution contributes, relative to a man
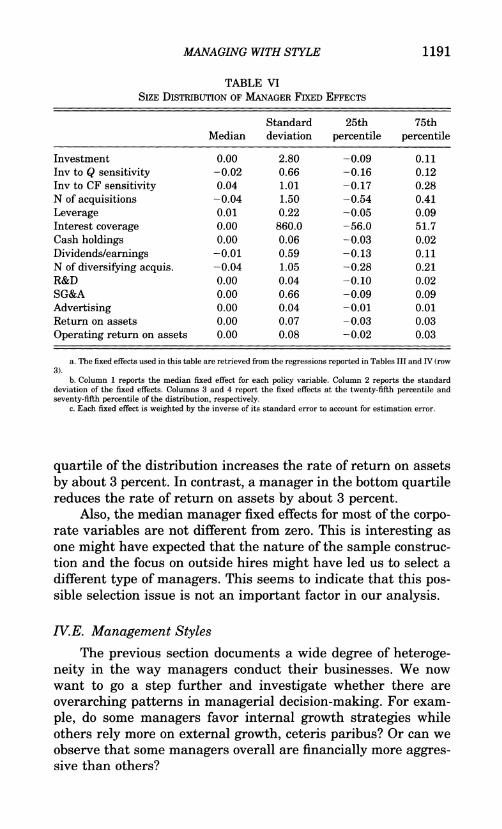
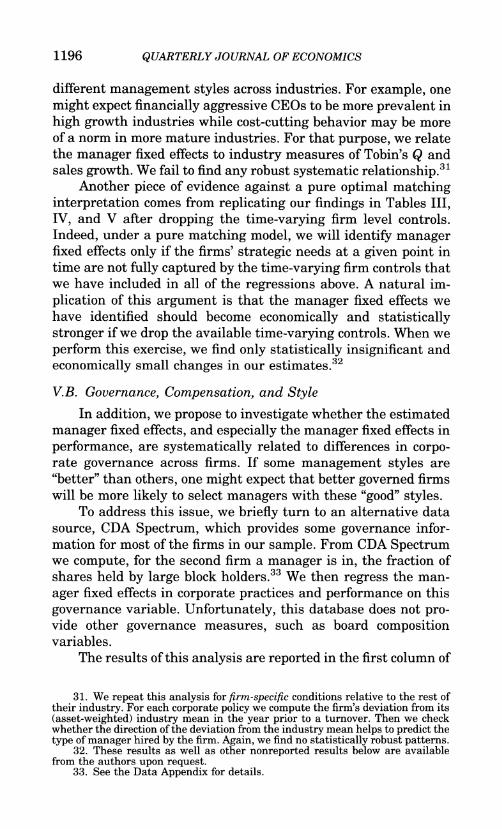
ager who is in the lower tail of that distribution. In Table VI we
report the size distribution of the manager fixed effects for each of
the regressions in Tables III and IV. We show median, standard
deviation, twenty-fifth percentile, and seventy-fifth percentile. When computing these statistics, we weigh each fixed effect by
the inverse of its standard error to account for estimation error.
Overall, Table VI shows that the variation in the size of the
manager fixed effects is economically large. To highlight just a
few examples, row 1 of Table VI shows that the difference be
tween a manager at the twenty-fifth percentile of the distribution
of investment level and one at the seventy-fifth percentile is 0.20.
To give a benchmark, the average ratio of capital expenditures to
assets in our sample is about 0.30. The difference between the
twenty-fifth and seventy-fifth percentile in the leverage distribu
tion is 0.16 (row 5), compared with an average leverage level of
.34 in our sample. For acquisitions, we observe about 0.7 acqui sitions per year for the firms in our sample. Row 4 of Table VI
shows that a manager in the bottom quartile reduces the number
of acquisitions by -0.49, while a manager in the top quartile increases the number of acquisitions by 0.44 per year. Finally, in
the last row of Table VI we see that the variation in corporate
performance fixed effects is also large. A manager in the top
28. We also repeated a similar exercise in the less parametric framework followed in Tables III and IV and obtained similar findings.
MANAGING WITH STYLE 1191
TABLE VI Size Distribution of Manager Fixed Effects
Standard 25th 75th Median deviation percentile percentile
Investment 0.00 2.80 -0.09 0.11 Inv to Q sensitivity -0.02 0.66 -0.16 0.12
Inv to CF sensitivity 0.04 1.01 -0.17 0.28 N of acquisitions -0.04 1.50 -0.54 0.41
Leverage 0.01 0.22 -0.05 0.09 Interest coverage 0.00 860.0 -56.0 51.7 Cash holdings 0.00 0.06 -0.03 0.02
Dividends/earnings -0.01 0.59 -0.13 0.11
N of diversifying acquis. -0.04 1.05 -0.28 0.21
R&D 0.00 0.04 -0.10 0.02 SG&A 0.00 0.66 -0.09 0.09
Advertising 0.00 0.04 -0.01 0.01 Return on assets 0.00 0.07 -0.03 0.03
Operating return on assets 0.00 0.08 -0.02 0.03
a. The fixed effects used in this table are retrieved from the regressions reported in Tables III and IV (row 3).
b. Column 1 reports the median fixed effect for each policy variable. Column 2 reports the standard deviation of the fixed effects. Columns 3 and 4 report the fixed effects at the twenty-fifth percentile and seventy-fifth percentile of the distribution, respectively.
c. Each fixed effect is weighted by the inverse of its standard error to account for estimation error.
quartile of the distribution increases the rate of return on assets
by about 3 percent. In contrast, a manager in the bottom quartile reduces the rate of return on assets by about 3 percent.
Also, the median manager fixed effects for most of the corpo rate variables are not different from zero. This is interesting as
one might have expected that the nature of the sample construc
tion and the focus on outside hires might have led us to select a
different type of managers. This seems to indicate that this pos sible selection issue is not an important factor in our analysis.
rV.E. Management Styles
The previous section documents a wide degree of heteroge
neity in the way managers conduct their businesses. We now
want to go a step further and investigate whether there are
overarching patterns in managerial decision-making. For exam
ple, do some managers favor internal growth strategies while
others rely more on external growth, ceteris paribus? Or can we
observe that some managers overall are financially more aggres sive than others?

1192 QUARTERLY JOURNAL OF ECONOMICS
To answer these questions, we analyze the correlation struc
ture between the manager specific fixed effects which we retrieve
from the set of regressions above. We form a data set that, for
each manager, contains the estimated fixed effects for the various
corporate variables. More precisely, the different variables in this new data set are the manager fixed effects estimated in Tables III
and IV for the specification that includes all groups of managers
(row 3). In practice, we propose to estimate regressions as follows:
(2) F.E.(y)j = a + ?F.E.(z)j+eJ,
where j indexes managers, and y and z are any two corporate
policy variables. Note that the right-hand-side variable in equa tion (2) is an estimated coefficient which is noisy by definition.
This will lead to a downward bias in an OLS estimation of ?. Since we know the precision with which the fixed effects are
measured, we use a GLS estimation technique to account for the
measurement error in the right-hand-side variable. We weigh each observation by the inverse of the standard error on the
independent variable, which we obtain from the first step oq regressions.
The results of this exercise are reported in Table VII. Each
element in this table corresponds to a different regression. The
average R2 for these regressions is about 10 percent; the maxi
mum R2 is about 33 percent, while the minimum R2 is about 0.03
percent. A few interesting patterns seem to emerge from this
table. First, managers seem to differ in their approach toward
external versus internal growth. We see from the last two rows of
column 1 that there is a strong negative correlation between
capital expenditures, which can be interpreted as internal invest
ments, and external growth through acquisitions and diversifica
tion. In a similar vein, managers who follow expansion strategies
through external acquisitions and diversification engage in less
R&D expenditures. Row 7 of Table VII shows that the coefficients
29. We also repeated this analysis using a different technique to account for measurement error in the estimated fixed effect. For each set of fixed effects we
formed averages of the observations by deciles (ranking observations by size), and then regressed the transformed set of fixed effects on each other in the above described manner. This produces qualitatively similar results. Finally, we also conducted a factor analysis for the full set of fixed effects. We were able to
distinguish three different eigenvectors. The factor loadings seem to support the
view that financial aggressiveness and internal versus external growth are two
important dimensions of style.

MANAGING WITH STYLE 1193
TABLE VII Relationship between the Manager Fd d Effects
Cash
Investment Inv to Q Inv to CF holdings Leverage
Return
on
R&D assets
Investment
Inv to Q sensitivity
Inv to CF
sensitivity
Cash holdings
Leverage
R&D
Advertising
N of acquisitions
N of divers, acquis.
SG&A
6.8
(0.92)
0.02
(0.6) -1.10
(1.62) -0.39
(0.55) 0.07
(0.00) 0.01
(0.01) -0.27
(0.11) -0.30
(0.13) -0.22
(0.01)
-0.23
(0.11) -0.79
(1.71) -0.28
(0.59) 0.08
(0.02) 0.02
(0.01) 0.08
(0.10) -0.14
(0.15) -0.30
(0.04)
-0.46
(1.72) -0.63
(0.60) -0.03
(0.01) -0.01
(0.01) 0.23
(0.10) 0.14
(0.14) 0.10
(0.03)
-0.40
(0.17) -0.23
(0.04) -0.01
(0.04) 0.01
(0.00) 0.01
(0.01) 0.54
(0.56)
-0.02
(0.01) 0.00
(0.01) 0.02
(0.01) 0.01
(0.02) 0.06
(0.21)
0.25
(0.15) -0.01
(0.00) -0.01
(0.00) -4.32
(0.90)
0.00
(0.00) 0.03
(0.01)
-0.01
(0.01) -0.12
(0.05) -0.02
(0.02) 0.11
(0.11) 0.31
(0.15) -0.01
(0.00) -0.01
(0.00) -3.36
(0.62)
a. Each entry in this table corresponds to a different regression. b. Each entry reports the coefficient from a weighted regression of the fixed effects from the row variable
on the fixed effects from the column variable. Observations in these regressions are weighted by the inverse of the standard error on the independent variable.
c. Coefficients that are significant at the 10 percent level are highlighted in bold.
from a regression of R&D on either of these variables are -0.01
with standard errors of 0.002. Moreover, capital expenditures and
R&D expenditures are significantly positively correlated.
Another interesting finding is that managers who are more
investment-Q sensitive also appear to be less investment-cash
sensitive. The coefficient on ? in a regression of the investment to
Q fixed effects on the investment to cash flow fixed effects (column 2 and row 3 of Table VII) is -0.23 with a standard error of 0.11.
This suggests that managers may follow one of two strategies: either use the firm's market valuation or use the cash flow gen erated by operations as a benchmark for their investment deci
sions. This result is interesting in light of the current debate on
the investment to cash flow sensitivity in firms. So far, most
research has analyzed differences in investment behavior across
firms along a financial constraint dimension. Our findings sug

1194 QUARTERLY JOURNAL OF ECONOMICS
gest that one might need to be aware of another important di
mension: manager-specific heterogeneity. On the financing side, we observe a negative correlation
between the leverage fixed effects and the cash holding fixed
effects. If cash holding is a proxy for financial slack, this result
supports the idea that managers may differ in the conservatism
or aggressiveness of their financing choices. Everything else
equal, some managers prefer holding relatively less debt and
more cash than other managers do.
Also, from the last row of Table VII, we see that managers with low levels of SG&A over sales favor more internal invest
ment and R&D expenditures, while they engage in significantly fewer acquisitions. Managers with higher levels of SG&A to sales
are also less investment-Q sensitive and more investment-cash
flow sensitive.
Finally, as we already showed in Table IV, there are system atic differences in corporate performances across the managers in
our sample, whether we measure performance as rate of return
on asset or use an operating income measure. In the last column
of Table VII, we see that the fixed effects in return on assets are
systematically related to some managerial fixed effects in corpo rate decisions.30 We find that managers with higher investment
to Q sensitivities have higher return on assets fixed effects. Also,
managers who keep more cash on the balance sheet or have
higher levels of SG&A have lower rates of return on assets. Last,
managers who engage in more acquisitions and more diversifying
acquisitions are also associated with lower performance levels.
These latter findings suggest that not only are there systematic differences in decision-making between managers but that these
differences are systematically correlated with the performance fixed effects.
V. Possible Interpretations of the Manager Fixed Effects
As we discussed in Section II, there are at least two different
interpretations of the observed manager fixed effects. One view is
30. Note that there is a strong positive relationship between the fixed effects in return on assets and operating return on assets. In a regression not reported
here we found that the estimated coefficient in a regression of the return on assets
fixed effects on operating return on assets fixed effects is 0.41, with a standard error of 0.05. The R2 ofthat regression is 24 percent.

MANAGING WITH STYLE 1195
that managers impose their own idiosyncratic style onto the firm
they head. If some styles are less performance-enhancing than
others, some of these managers may cause corporations to adopt
value-reducing policies. An alternative view is that managers differ in their comparative advantage or relative skills and firms
optimally choose managers who are the best match for their
current strategic needs. In this case, there is no such thing as a
"better" or "worse" style but rather different styles that are best
suited to different environments. While it is beyond the scope of
this paper to fully sort out these two alternative interpretations, in the following we provide some evidence suggesting that the
observed managerial fixed effects cannot be reasonably explained
by a pure optimal matching story alone.
V.A. Sorting Based on Firm and Industry-Level Characteristics
A first interesting piece of evidence stems from our results in
the last column of Table VII. Certain manager-specific styles seem to correlate systematically with manager fixed effects in
performance: managers who hold more cash, are less invest
ment-Q sensitive, engage in more M&A activity or spend more on
SG&A, also have lower performance fixed effects. While these
findings are consistent with the view that some styles are better
for performance than others, we need to be cautious about possi ble alternative interpretations. More specifically, these results
could also be consistent with the view that certain styles are
better suited than others to periods of economic distress. Firms
might be hiring "turnaround managers" whenever performance is
particularly poor in order to implement specific policies that are
beneficial in those times. However, this interpretation seems less
convincing when we consider the correlation patterns in the last
column of Table VII. Policies like high SG&A spending, or more
intense M&A and diversification activities, which are negatively correlated with the fixed effects in performance, do not at first
sight coincide with our intuition of turnaround practices. More
over, this interpretation relies on the assumption that managers with particular styles are hired in response to changes in the
economic environment of the firm (e.g., poor performance). This
interpretation, however, seems inconsistent with our finding that
most of the changes in firm policy happen after the manager joins a firm (Table V).
Yet another way to assess the relevance of the matching
interpretation is to ask whether there is any apparent sorting of
1196 QUARTERLY JOURNAL OF ECONOMICS
different management styles across industries. For example, one
might expect financially aggressive CEOs to be more prevalent in
high growth industries while cost-cutting behavior may be more
of a norm in more mature industries. For that purpose, we relate
the manager fixed effects to industry measures of Tobin's Q and
sales growth. We fail to find any robust systematic relationship.31 Another piece of evidence against a pure optimal matching
interpretation comes from replicating our findings in Tables III,
IV, and V after dropping the time-varying firm level controls.
Indeed, under a pure matching model, we will identify manager fixed effects only if the firms' strategic needs at a given point in
time are not fully captured by the time-varying firm controls that we have included in all of the regressions above. A natural im
plication of this argument is that the manager fixed effects we
have identified should become economically and statistically
stronger if we drop the available time-varying controls. When we
perform this exercise, we find only statistically insignificant and
economically small changes in our estimates.32
V.B. Governance, Compensation, and Style
In addition, we propose to investigate whether the estimated
manager fixed effects, and especially the manager fixed effects in
performance, are systematically related to differences in corpo rate governance across firms. If some management styles are
"better" than others, one might expect that better governed firms
will be more likely to select managers with these "good" styles. To address this issue, we briefly turn to an alternative data
source, CDA Spectrum, which provides some governance infor
mation for most of the firms in our sample. From CDA Spectrum we compute, for the second firm a manager is in, the fraction of
shares held by large block holders.33 We then regress the man
ager fixed effects in corporate practices and performance on this
governance variable. Unfortunately, this database does not pro vide other governance measures, such as board composition variables.
The results of this analysis are reported in the first column of
31. We repeat this analysis for firm-specific conditions relative to the rest of their industry. For each corporate policy we compute the firm's deviation from its
(asset-weighted) industry mean in the year prior to a turnover. Then we check whether the direction of the deviation from the industry mean helps to predict the
type of manager hired by the firm. Again, we find no statistically robust patterns. 32. These results as well as other nonreported results below are available
from the authors upon request. 33. See the Data Appendix for details.

MANAGING WITH STYLE 1197
Table VIII. Each cell in this column corresponds to a different
regression where the dependent variables are the fixed effects on
the corporate variables and the independent variable is the gov ernance measure. Most interestingly, we find a positive and sta
tistically significant relationship between the manager fixed ef
fects in return on assets and the fraction of shares held by large block holders.34 Moreover, most of the policy fixed effects that we
found to be significantly related to the manager fixed effects in
performance are also significantly related to governance with the
same sign, although only the relationships for investment to Q
sensitivity and M&A activity are statistically significant at tra
ditional levels.
While we do not want to push these results too far due to the
crudeness of the governance variable, they appear to suggest that
better governed firms select managers with performance-enhanc
ing styles and as such might point toward efficiency implications of the managerial heterogeneity.
Finally, we relate the manager fixed effects to manager com
pensation levels. If the correlation of manager styles with perfor mance is symptomatic of some managerial styles being better
than others, we might expect boards to pay a premium on average for managers with these styles. To perform this analysis, we first
construct manager-specific compensation residuals that are net of
firm fixed effects, year fixed effects, and other time-varying firm
characteristics. More precisely, we estimate compensation regres sions where we regress the logarithm of compensation on firm
fixed effects, year fixed effects, the logarithm of total assets, the
logarithm of total sales, the rate of return on assets, and the
manager's tenure on the job; we also include dummy variables for
whether the manager is a CEO, a CFO, or another top executive.
The two compensation measures we consider are the logarithm of
total compensation (defined as cash salary plus bonus plus the
value of stock option granted in a year) and the logarithm of
salary compensation. From these regressions we compute resid
ual compensation measures for each executive in our sample. We
then regress these residuals on the fixed effects derived in Tables
III and IV. We use the GLS estimation described above to account
for the measurement error in the right-hand-side variables.
The results of this exercise are reported in columns 2 and 3 of
Table VIII. Most importantly, we see that managers with higher
34. Similarly, we find a positive relationship between the governance vari able and the manager fixed effects on operating return on assets.

1198 QUARTERLY JOURNAL OF ECONOMICS
TABLE VIII
Governance, Compensation, and Manager Fixed Effects
Residual compensation Percent shares -
held by Total Salary large block holders compensation compensation
Return on assets 0.012 0.72 2.86
(0.006) (0.24) (0.57) Investment 0.278 0.02 -0.08
(0.252) (0.01) (0.06) Inv to Q sensitivity 0.246 0.08 0.19
(0.053) (0.03) (0.13) Inv to CF sensitivity -0.004 -0.06 -0.06
(0.088) (0.04) (0.07) Cash holdings -0.001 -0.02 -0.26
(0.007) (0.15) (0.29) Leverage -0.018 0.04 -0.01
(0.021) (0.26) (0.18) R&D 0.009 -0.94 -0.33
0.009 -0.94 -0.33
(0.006) (0.08) (0.90) Advertising 0.008 2.18 1.36
(0.007) (0.93) (0.54) N of acquisitions -0.568 0.10 0.00
(0.131) (0.05) (0.03) N of diversifying acquisitions -0.617 0.09 0.03
(0.092) (0.04) (0.05) SG&A -0.027 -0.16 -0.09
(0.093) (0.04) (0.25)
a. Each entry in column 1 corresponds to a different regression. The dependent variable in each of these
regressions is the manager fixed effect on the row variable, as retrieved from Tables III and IV). The
independent variable is the fraction of shares held by 10 percent or more block holders in the second firm we observe the manager in (from CDA Spectrum). The first number in each cell is the estimated coefficient; the second number is the estimated standard error. Each observation is weighted by the inverse of the standard error of the dependent variable.
b. Each entry in columns 2 and 3 corresponds to a different regression. The independent variable in each of these regressions is the manager fixed effect on the row variable, as retrieved from Tables III and IV). The
dependent variable is a manager-level residual from a compensation regression where we control for firm fixed effects, year fixed effects, the logarithm of total assets, the logarithm of total sales, return on assets, tenure on the job, and dummies for whether the manager is a CEO, a CFO, or another top executive (see subsection IV.E for details). The two different compensation measures are the logarithm of total compensa tion (column 2), defined as salary plus bonus plus the Black and Scholes value of stock options grants, and the logarithm of salary compensation (column 3). In the reported regressions, each observation is weighted by the inverse of the standard error of the independent variable to account for estimation error.
return on assets fixed effects receive higher residual total com
pensation as well as higher salary compensation. This relation
ship is statistically significant for both compensation variables. It
is interesting that we find such a strong positive correlation given that we have already controlled for return on assets when com
puting residual compensation to net out the pay-for-performance
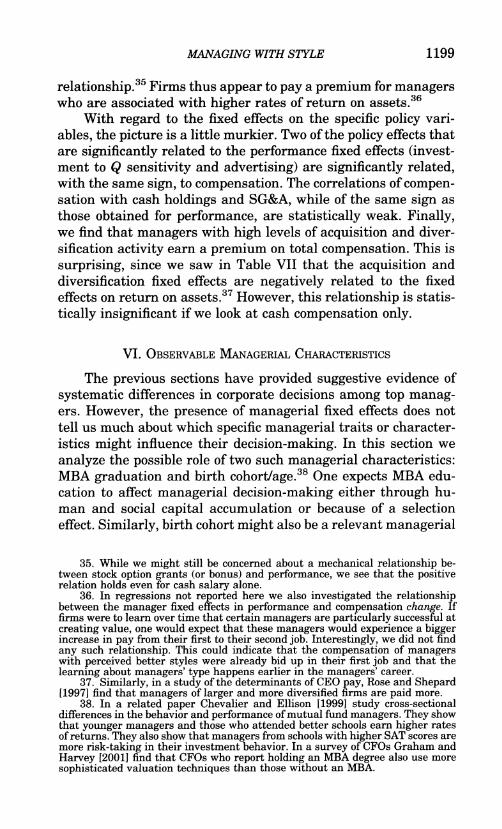
MANAGING WITH STYLE 1199
relationship. Firms thus appear to pay a premium for managers who are associated with higher rates of return on assets.36
With regard to the fixed effects on the specific policy vari
ables, the picture is a little murkier. Two of the policy effects that
are significantly related to the performance fixed effects (invest ment to Q sensitivity and advertising) are significantly related, with the same sign, to compensation. The correlations of compen sation with cash holdings and SG&A, while of the same sign as
those obtained for performance, are statistically weak. Finally, we find that managers with high levels of acquisition and diver
sification activity earn a premium on total compensation. This is
surprising, since we saw in Table VII that the acquisition and
diversification fixed effects are negatively related to the fixed
effects on return on assets.37 However, this relationship is statis
tically insignificant if we look at cash compensation only.
VI. Observable Managerial Characteristics
The previous sections have provided suggestive evidence of
systematic differences in corporate decisions among top manag ers. However, the presence of managerial fixed effects does not
tell us much about which specific managerial traits or character
istics might influence their decision-making. In this section we
analyze the possible role of two such managerial characteristics:
MBA graduation and birth cohort/age.38 One expects MBA edu
cation to affect managerial decision-making either through hu
man and social capital accumulation or because of a selection
effect. Similarly, birth cohort might also be a relevant managerial
35. While we might still be concerned about a mechanical relationship be tween stock option grants (or bonus) and performance, we see that the positive relation holds even for cash salary alone.
36. In regressions not reported here we also investigated the relationship between the manager fixed effects in performance and compensation change. If firms were to learn over time that certain managers are particularly successful at
creating value, one would expect that these managers would experience a bigger increase in pay from their first to their second job. Interestingly, we did not find
any such relationship. This could indicate that the compensation of managers with perceived better styles were already bid up in their first job and that the
learning about managers' type happens earlier in the managers' career.
37. Similarly, in a study of the determinants of CEO pay, Rose and Shepard [1997] find that managers of larger and more diversified firms are paid more.
38. In a related paper Chevalier and Ellison [1999] study cross-sectional differences in the behavior and performance of mutual fund managers. They show that younger managers and those who attended better schools earn higher rates of returns. They also show that managers from schools with higher SAT scores are
more risk-taking in their investment behavior. In a survey of CFOs Graham and
Harvey [2001] find that CFOs who report holding an MBA degree also use more
sophisticated valuation techniques than those without an MBA.
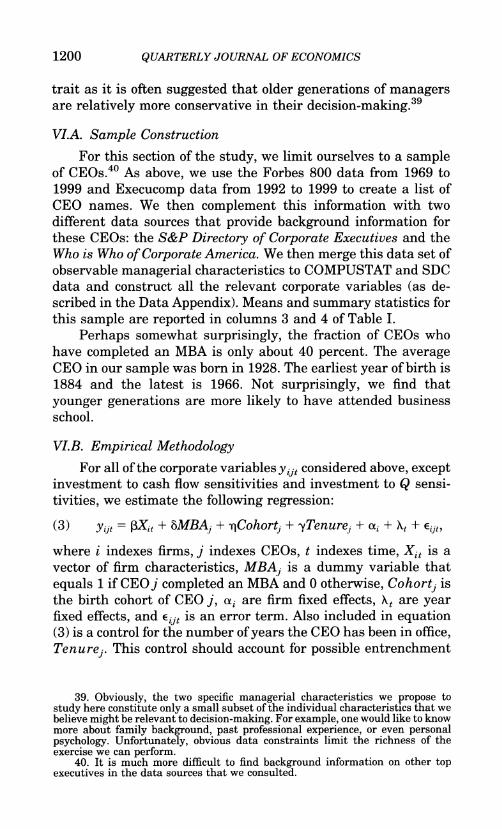
1200 QUARTERLY JOURNAL OF ECONOMICS
trait as it is often suggested that older generations of managers are relatively more conservative in their decision-making.39
V7.A. Sample Construction
For this section of the study, we limit ourselves to a sample of CEOs.40 As above, we use the Forbes 800 data from 1969 to
1999 and Execucomp data from 1992 to 1999 to create a list of
CEO names. We then complement this information with two
different data sources that provide background information for
these CEOs: the S&P Directory of Corporate Executives and the
Who is Who of Corporate America. We then merge this data set of
observable managerial characteristics to COMPUSTAT and SDC
data and construct all the relevant corporate variables (as de
scribed in the Data Appendix). Means and summary statistics for
this sample are reported in columns 3 and 4 of Table I.
Perhaps somewhat surprisingly, the fraction of CEOs who
have completed an MBA is only about 40 percent. The average CEO in our sample was born in 1928. The earliest year of birth is
1884 and the latest is 1966. Not surprisingly, we find that
younger generations are more likely to have attended business
school.
VLB. Empirical Methodology
For all of the corporate variables y ?^ considered above, except investment to cash flow sensitivities and investment to Q sensi
tivities, we estimate the following regression:
(3) yijt =
?Xit + hMBAj + y]Cohortj +
yTenure3 + a? + X, + eijt,
where i indexes firms, j indexes CEOs, t indexes time, Xit is a
vector of firm characteristics, MBAj is a dummy variable that
equals 1 if CEO j' completed an MBA and 0 otherwise, Cohortj is
the birth cohort of CEO j, a? are firm fixed effects, \t are year fixed effects, and eijt is an error term. Also included in equation (3) is a control for the number of years the CEO has been in office,
Tenure j. This control should account for possible entrenchment
39. Obviously, the two specific managerial characteristics we propose to
study here constitute only a small subset of the individual characteristics that we
believe might be relevant to decision-making. For example, one would like to know more about family background, past professional experience, or even personal
psychology. Unfortunately, obvious data constraints limit the richness of the
exercise we can perform. 40. It is much more difficult to find background information on other top
executives in the data sources that we consulted.
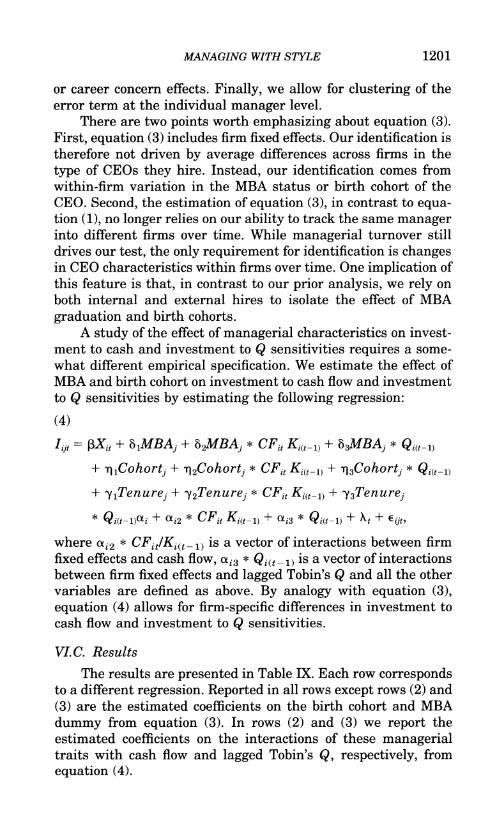
MANAGING WITH STYLE 1201
or career concern effects. Finally, we allow for clustering of the
error term at the individual manager level.
There are two points worth emphasizing about equation (3).
First, equation (3) includes firm fixed effects. Our identification is
therefore not driven by average differences across firms in the
type of CEOs they hire. Instead, our identification comes from
within-firm variation in the MBA status or birth cohort of the
CEO. Second, the estimation of equation (3), in contrast to equa tion (1), no longer relies on our ability to track the same manager into different firms over time. While managerial turnover still
drives our test, the only requirement for identification is changes in CEO characteristics within firms over time. One implication of
this feature is that, in contrast to our prior analysis, we rely on
both internal and external hires to isolate the effect of MBA
graduation and birth cohorts.
A study of the effect of managerial characteristics on invest
ment to cash and investment to Q sensitivities requires a some
what different empirical specification. We estimate the effect of
MBA and birth cohort on investment to cash flow and investment
to Q sensitivities by estimating the following regression:
(4)
Iljt =
?Xit + ^MBAj + b2MBAj * CFit Ki(t_1} + h^MBAj
* Q?(?_1}
+ ^Cohortj +
^Cohortj * CFit Kiit-1} + ^Cohortj
* Qi{t-i)
+ ^{Tenurej + ^{Tenurej * CFit Ki{t_1} + y3Tenurej
* Q?(?-i)Ot? + ai2 * CFit Ki{t_1} + ai3 *
Qi{t?1} + Xt + eijt,
where ai2 * CFitIKi{t_1) is a vector of interactions between firm
fixed effects and cash flow, a?3 * Q^-i) is a vector of interactions
between firm fixed effects and lagged Tobin's Q and all the other
variables are defined as above. By analogy with equation (3),
equation (4) allows for firm-specific differences in investment to
cash flow and investment to Q sensitivities.
VLC. Results
The results are presented in Table IX. Each row corresponds to a different regression. Reported in all rows except rows (2) and
(3) are the estimated coefficients on the birth cohort and MBA
dummy from equation (3). In rows (2) and (3) we report the
estimated coefficients on the interactions of these managerial traits with cash flow and lagged Tobin's Q, respectively, from
equation (4).
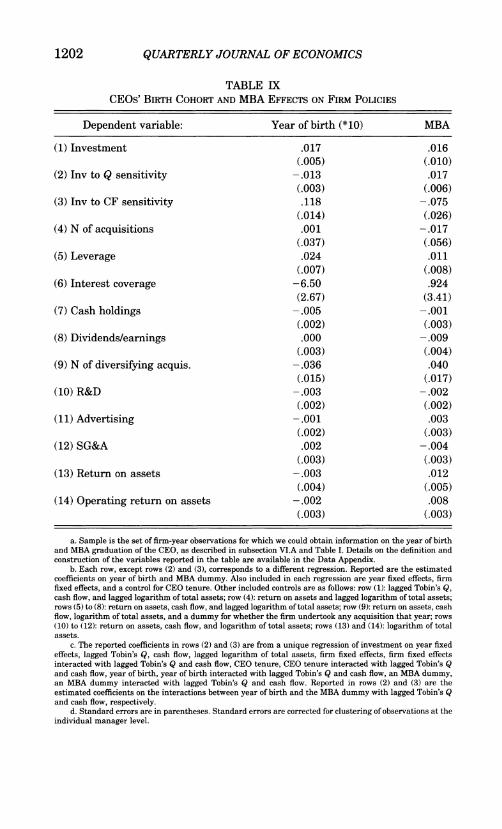
1202 QUARTERLY JOURNAL OF ECONOMICS
TABLE IX CEOs' Birth Cohort and MBA Effects on Firm Policies
Dependent variable: Year of birth (*10) MBA
(1) Investment
(2) Inv to Q sensitivity
(3) Inv to CF sensitivity
(4) N of acquisitions
(5) Leverage
(6) Interest coverage
(7) Cash holdings
(8) Dividends/earnings
(9) N of diversifying acquis.
(10) R&D
(11) Advertising
(12) SG&A
(13) Return on assets
(14) Operating return on assets
.017
(.005) -.013
(.003) .118
(.014) .001
(.037) .024
(.007) -6.50
(2.67) -.005
(.002) .000
(.003) -.036
(.015) -.003
(.002) -.001
(.002) .002
(.003) -.003
(.004) -.002
(.003)
.016
(.010) .017
(.006) -.075
(.026) -.017
(.056) .011
(.008) .924
(3.41) -.001
(.003) -.009
(.004) .040
(.017) -.002
(.002) .003
(.003) -.004
(.003) .012
(.005) .008
(.003)
a. Sample is the set of firm-year observations for which we could obtain information on the year of birth and MBA graduation of the CEO, as described in subsection VIA and Table I. Details on the definition and construction of the variables reported in the table are available in the Data Appendix.
b. Each row, except rows (2) and (3), corresponds to a different regression. Reported are the estimated coefficients on year of birth and MBA dummy. Also included in each regression are year fixed effects, firm fixed effects, and a control for CEO tenure. Other included controls are as follows: row (1): lagged Tobin's Q, cash flow, and lagged logarithm of total assets; row (4): return on assets and lagged logarithm of total assets; rows (5) to (8): return on assets, cash flow, and lagged logarithm of total assets; row (9): return on assets, cash flow, logarithm of total assets, and a dummy for whether the firm undertook any acquisition that year; rows (10) to (12): return on assets, cash flow, and logarithm of total assets; rows (13) and (14): logarithm of total
c. The reported coefficients in rows (2) and (3) are from a unique regression of investment on year fixed
effects, lagged Tobin's Q, cash flow, lagged logarithm of total assets, firm fixed effects, firm fixed effects interacted with lagged Tobin's Q and cash flow, CEO tenure, CEO tenure interacted with lagged Tobin's Q and cash flow, year of birth, year of birth interacted with lagged Tobin's Q and cash flow, an MBA dummy, an MBA dummy interacted with lagged Tobin's Q and cash flow. Reported in rows (2) and (3) are the estimated coefficients on the interactions between year of birth and the MBA dummy with lagged Tobin's Q and cash flow, respectively.
d. Standard errors are in parentheses. Standard errors are corrected for clustering of observations at the individual manager level.

MANAGING WITH STYLE 1203
We start with the investment variables. We find that CEOs
from earlier birth cohorts are associated with lower investment
levels, everything else equal. Each ten-year increase in year of
birth decreases capital expenditures (as a ratio to lagged prop
erty, plant, and equipment) by about 1.7 percentage point. MBA
graduates appear to invest 1.6 percentage point more on average, but this effect is more noisily estimated. Rows (2) and (3) consider
investment to cash flow and investment to Q sensitivities. We
find that MBA graduates on average respond more to Tobin's Q and less to cash flow availability when deciding about capital
expenditures. This pattern is interesting. CEOs with MBA edu
cation appear to follow more closely the "textbook guidelines" when making investment decisions. They are less responsive to
the availability of internal sources of funds but more responsive to the presence of growth opportunities as embodied in Tobin's Q.
We find that older generations of CEOs are less responsive to
Tobin's Q when setting investment level. However, somewhat
more surprisingly, we do not find that younger generations weigh less internal sources of financing when making investment deci
sions. To the contrary, we find that investment to cash sensitiv
ities are larger among younger cohorts. Finally, we find no sig nificant relationship between the two managerial attributes and
acquisition behavior (row (4)). We next consider the financial policy variables. We find that
older generations of CEOs choose lower levels of financial lever
age, everything else equal (row (5)). Each ten-year increase in
CEO year of birth increases financial leverage by about 2.5 per
centage points. The point estimate on the effect of MBA gradua tion on financial leverage is positive but statistically insignifi cant. Consistent with the leverage results, interest coverage (row
(6)) appears higher among CEOs from earlier birth cohorts and
lower (but not significantly so) among MBA graduates. In row (7) we find a significant negative relationship between cash holdings and year of birth. If one regards lower levels of cash holdings as
the sign of a more sophisticated or more aggressive financial
policy, these results indicate that older generations might lack
that kind of sophistication or aggressiveness. The effect of MBA
graduation on cash holdings is economically and statistically
insignificant. While we find no robust relationship between divi
dends over earnings and birth cohort (row (8)), there is a robust
negative correlation between dividend payout and MBA
graduation.
1204 QUARTERLY JOURNAL OF ECONOMICS
Next, we study the organizational strategy variables. CEOs
with MBA degrees, and CEOs from earlier cohorts, have a stron
ger tendency to engage in diversification moves (row (9)). Younger
generations and, to a lesser degree, MBA graduates engage in
less R&D (row (10)). We find no consistent relationship between
advertising expenditures (row (11)) or SG&A (row (12)) and the CEO characteristics.41
In summary, the results in Table IX suggest that the man
ager fixed effects we identify in the first part of the paper can, in
part, be attributed to observable individual characteristics such as education and year of birth. CEOs with MBAs appear to be on
average more aggressive, choosing to engage in a higher level of
capital expenditures, hold more debt, and pay less dividends.
CEOs from older generations appear to be less aggressive on
average, choosing a lower level of capital expenditures, lower
financial leverage, and higher cash holdings.
Finally, we also investigate the effect of MBA status and
birth cohort on accounting performance (rows (13) and (14)). The
most interesting finding is the positive relationship between
MBA graduation and corporate performance. Rates of return on
assets are more than 1 percentage point higher for MBA gradu ates. Similarly, CEOs who hold an MBA degree are associated
with higher operating returns on assets.
VII. Conclusion
The primary objective of this paper is to document systematic behavioral differences in corporate decision-making across man
agers. We develop an empirical framework to analyze the impor tance of a manager dimension in the observed unexplained varia
tion in several corporate practices. We find considerable hetero
geneity across managers. The realizations of all investment,
financing, and other organizational strategy variables appear to
systematically depend on the specific executives in charge. While
the framework we follow does not allow us to estimate the causal
effect of managers on firm policies or performance, it provides a
simple and intuitive approach to deal with many of the first-order
selection problems that such a study might face.
41. This lack of statistical significance may in part reflect the fact that our
sample becomes much smaller in these regressions due to the many missing values in COMPUSTAT.

MANAGING WITH STYLE 1205
We also find that some of the managerial differences in
corporate practices are systematically related to differences in
corporate performance. Moreover, managers with higher perfor mance fixed effects receive higher levels of compensation and are
more likely to be found in firms where ownership is more concen
trated. Finally, we can tie back the differences in behavior across
managers in part to some observable managerial characteristics.
Older generations of managers, on average, are financially more
conservative, while managers who hold an MBA degree follow
more aggressive strategies.
Data Appendix
The corporate variables used in this paper are extracted from
four major data sources: COMPUSTAT, the SDC Platinum
Merger and Acquisition database, Execucomp, and CDA
Spectrum. COMPUSTAT is a data source that reports financial vari
ables for more than 7500 individual corporations established in
the United States (and territories) since 1976. The data are
drawn from annual reports, 10-K filings and 10-Q filings, and
sample large companies with substantial public ownership. SDC Platinum Merger and Acquisition database is a finan
cial data set collected by Thompson Financial. It contains infor
mation on M&A transactions by private and public firms in the
United States from 1979 to the present. Reported for each trans
action are the name and industry of the acquiring and target
firms, as well as other variables about the specifics of the sale.
Standard and Poor's Execucomp data contain information on
the name and total compensation of up to the five highest paid executives for all firms in the S&P 500, S&P MidCap 400, and
S&P SmallCap 600 since 1992. The reported compensation data
cover base salary, bonus, and the value of granted stock options in
the current year. CDA Spectrum collects information on institutional share
holdings from the SEC's 13f filings. The 1978 amendment to the
Security and Exchange Act of 1934 requires all institutional
investors with more than $100 million under management to
report their shareholdings to the SEC. Holdings are reported
quarterly on 13f filings. Institutions fall into five distinct catego ries: banks, insurance companies, mutual funds, independent investment advisors (such as brokerage firms), and others (which
mainly include pension funds and endowments).

1206 QUARTERLY JOURNAL OF ECONOMICS
The specific variables used in the analysis are defined as follows:
Investment is capital expenditures (COMPUSTAT item
128) over net property, plant, and equipment at the begin
ning of the fiscal year (COMPUSTAT item 8). Average Tobin's Q is defined as the market value of assets
divided by the book value of assets (COMPUSTAT item 6), where the market value of assets equals the book value of
assets plus the market value of common equity less the
sum of the book value of common equity (COMPUSTAT item 60) and balance sheet deferred taxes (COMPUSTAT item 74).
Cash flow is defined as the sum of earnings before extraor
dinary items (COMPUSTAT item 18) and depreciation (COMPUSTAT item 14) over net property, plant, and
equipment at the beginning of the fiscal year (COMPU STAT item 8). Leverage is defined as long-term debt (COMPUSTAT item
9) plus debt in current liabilities (COMPUSTAT item 34) over long-term debt plus debt in current liabilities plus the
book value of common equity (COMPUSTAT item 60). Cash holdings is defined as cash and short-term invest
ments (COMPUSTAT item 1) over net property, plant, and
equipment at the beginning of the fiscal year (COMPU STAT item 8). Interest coverage is earnings before depreciation, interest, and tax (COMPUSTAT item 13) over interest expenses
(COMPUSTAT item 15). Dividends over earnings is the ratio of the sum of common
dividends (COMPUSTAT item 21) and preferred dividends (COMPUSTAT item 19) over earnings before depreciation,
interest, and tax (COMPUSTAT item 13). R&D is the ratio of R&D expenditures (COMPUSTAT item 46) over lagged total assets (COMPUSTAT item 6).
Advertising is the ratio of advertising expenditures (COM
PUSTAT item 45) over lagged total assets (COMPUSTAT item 6).
SG&A is the ratio of selling, general, and administrative
expenses (COMPUSTAT item 189) over sales (COMPU
STAT item 12). N of acquisitions is the total number of acquisitions in the
fiscal year. N of diversifying acquisitions is the number of acquisitions
MANAGING WITH STYLE 1207
during the fiscal year in two-digit industries different from
those the acquirer currently operates in.
Return on assets is the ratio of EBITDA (COMPUSTAT item 18) over lagged total assets (COMPUSTAT item 6).
Operating return on assets is the ratio of operating cash
flow (COMPUSTAT item 308) over lagged total assets (COMPUSTAT item 6).
Total compensation is the total value of a manager's com
pensation package for the fiscal year. It is defined as the sum of cash salary, cash bonus, and the Black and Scholes
value of options granted in that year. Percent shares held by large block holders is the fraction of
shares that are owned by block holders with 10 percent or
more of the firm's outstanding shares (based on the last
quarter of each year).
University of Chicago Graduate School of Business, National Bureau of
Economic Research, and Centre for Economic and Policy Research
Massachusetts Institute of Technology Sloan School of Management, National Bureau of Economic Research, and Centre for Economic and
Policy Research
References
Bradley, Michael, Gregg A. Jarrell, and E. Han Kim, "On the Existence of an
Optimal Capital Structure," Journal of Finance, XXXIX (1984), 857-878.
Chevalier, Judith, and Glenn Ellison, "Are Some Mutual Fund Managers Better than Others? Cross-Sectional Patterns in Behavior and Performance," Jour nal of Finance, UN (1999), 875-899.
Fazzari, Steven, R. Glenn Hubbard, and Bruce Petersen, "Financing Constraints and Corporate Investment," Brookings Papers on Economic Activity, I (1988), 141-195.
Fligstein, Neil, The Transformation of Corporate Control (Cambridge, MA: Har vard University Press, 1990).
Graham, John, and Campbell Harvey, "The Theory and Practice of Corporate Finance: Evidence from the Field," Journal of Financial Economics, LX
(2001), 187-243.
Hambrick, Donald C, and Phyllis A. Mason, "Upper Echelons: The Organization as a Reflection of its Top Managers," Academy of Management Review, IX
(1984), 193-206.
Hermalin, Benjamin E., and Michael S. Weisbach, "Endogenously Chosen Boards of Directors and Their Monitoring of the CEO," American Economic Review, LXXXVIII (1998), 96-118.
Kaplan, Steven, and Luigi Zingales, "Do Investment-Cash Flow Sensitivities Provide Useful Measures of Financing Constraints?" Quarterly Journal of Economics, CXII (1997), 169-215.
Lieberman, Marvin, Lawrence Lau, and Mark Williams, "Firm-Level Productivity and Management Influence: A Comparison of U. S. and Japanese Automobile
Producers," Management Science, XXXVI (1990), 1193-1215.
McKay, Peter, and Gordon Phillips, "Is There an Optimal Industry Capital Struc ture?" Working Paper, University of Maryland, 2002.
Malmendier, Ulrike, and Geoffrey T?te, "CEO Overconfidence and Corporate Investment," Working Paper, Stanford University, 2002.
Malmendier, Ulrike, and Geoffrey T?te, "Who Makes Acquisitions? CEO Over
1208 QUARTERLY JOURNAL OF ECONOMICS
confidence and Market's Reaction," Working Paper, Stanford University, 2003.
Parrino, Robert, "CEO Turnover and Outside Succession: A Cross-Section Analy sis," Journal of Financial Economics, XLVI (1997), 165-197.
Rose, Nancy L., and Andrea Shepard, "Firm Diversification and CEO Compensa tion: Managerial Ability or Executive Entrenchment?" RAND Journal of
Economics, XXVIII (1997), 489-514.
Rotemberg Julio J., and Garth Saloner, "Visionaries, Managers, and Strategic Direction," RAND Journal of Economics, XXXI (2000), 693-716.
Smith, Clifford W., and Ross L. Watts, "The Investment Opportunity Set and
Corporate Financing, Dividend and Compensation Policies," Journal of Fi nancial Economics, XXXII (1992), 263-292.
Titman, Sheridan, and Roberto Wessels, "The Determinants of Capital Struc
ture," Journal of Finance, XLIII (1988), 1-19. Van den Steen, Eric, "Organizational Beliefs and Managerial Vision," Massachu
setts Institute of Technology Sloan School of Management Working Paper No.
4224-01, 2001.
Waldman, David, Gabriel G. Ramirez, Robert J. House, and Phanish Puranam, "CEO Leadership and Organizational Performance: The Moderating Effect of
Environmental Uncertainty," Academy of Management Journal, XLIV (2001), 134-143.
Warner, Jerold B., Ross L. Watts, and Karen Wruck, "Stock Prices and Top Management Changes," Journal of Financial Economics, XX (1988), 461-492.
Wasserman, Noam, Nitin Nohria, and Bharat Anand, "When Does Leadership Matter? The Contingent Opportunities View of CEO Leadership," Working Paper, Harvard University, 2002.