Embed Size (px)
Citation preview
City of Cape Coral Investment Review Public Trust Advisors LLC1015 Cultural Park Blvd 201 E. Pine Street, Suite 750Cape Coral, Florida 33990 Orlando, Florida 32801
Quarterly Investment Report for Period Ended March 31, 2019
Investment Management Portfolio Review Page
Economic Summary 1
Short Term Investment Portfolio Review 2
1‐3 Year Investment Portfolio Review 3
1‐5 Year Investment Portfolio Review 4
Asset Allocation Chart 5
City of Cape Coral Investment Review
Economic Update and Yield Curve Analysis
April 2019
Public Trust Advisors 2019 ©
Gross Domestic Product
Source: Bloomberg. See additional footnotes at the end of the presentation.
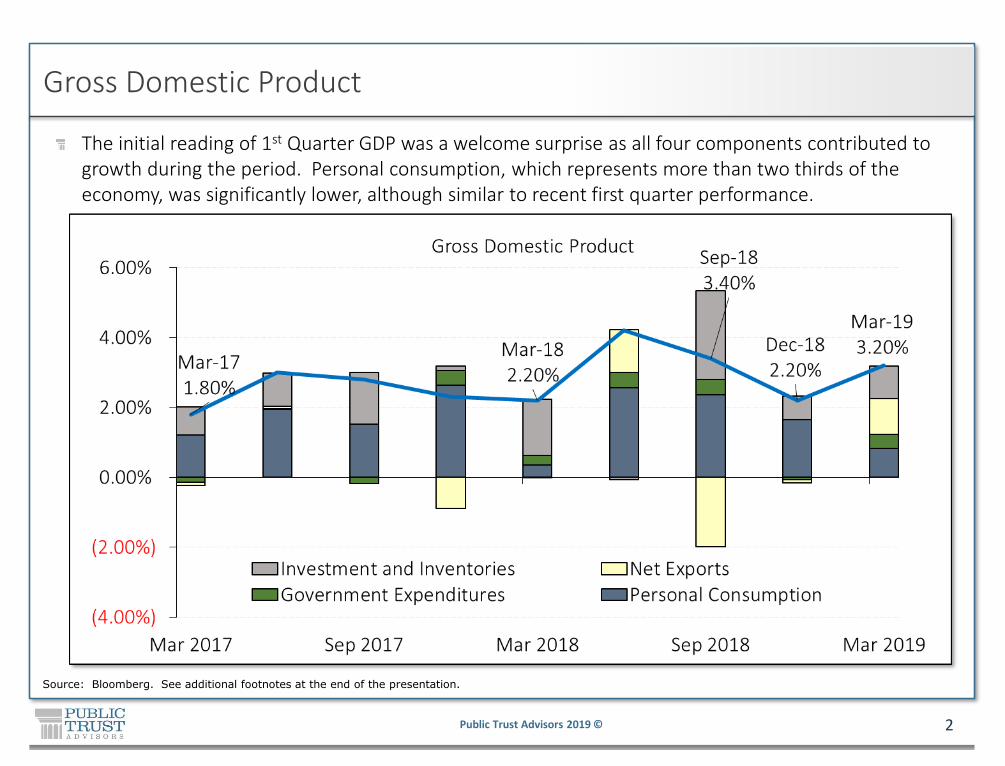
The initial reading of 1st Quarter GDP was a welcome surprise as all four components contributed to growth during the period. Personal consumption, which represents more than two thirds of the economy, was significantly lower, although similar to recent first quarter performance.
2
Public Trust Advisors 2019 ©
FOMC Rate Projections – Sept 2018 vs. Mar 2019 Meeting
Source: Bloomberg. See additional footnotes at the end of the presentation.
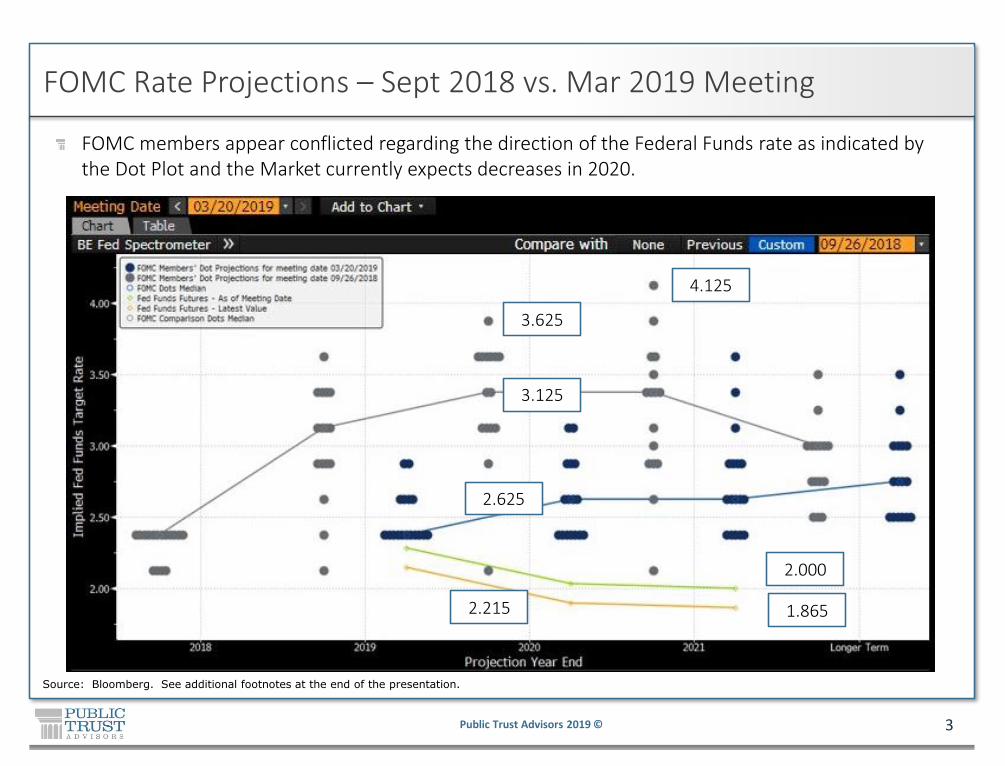
FOMC members appear conflicted regarding the direction of the Federal Funds rate as indicated by the Dot Plot and the Market currently expects decreases in 2020.
3.625
4.125
2.215
2.000
1.865
3.125
2.625
3
Public Trust Advisors 2019 ©
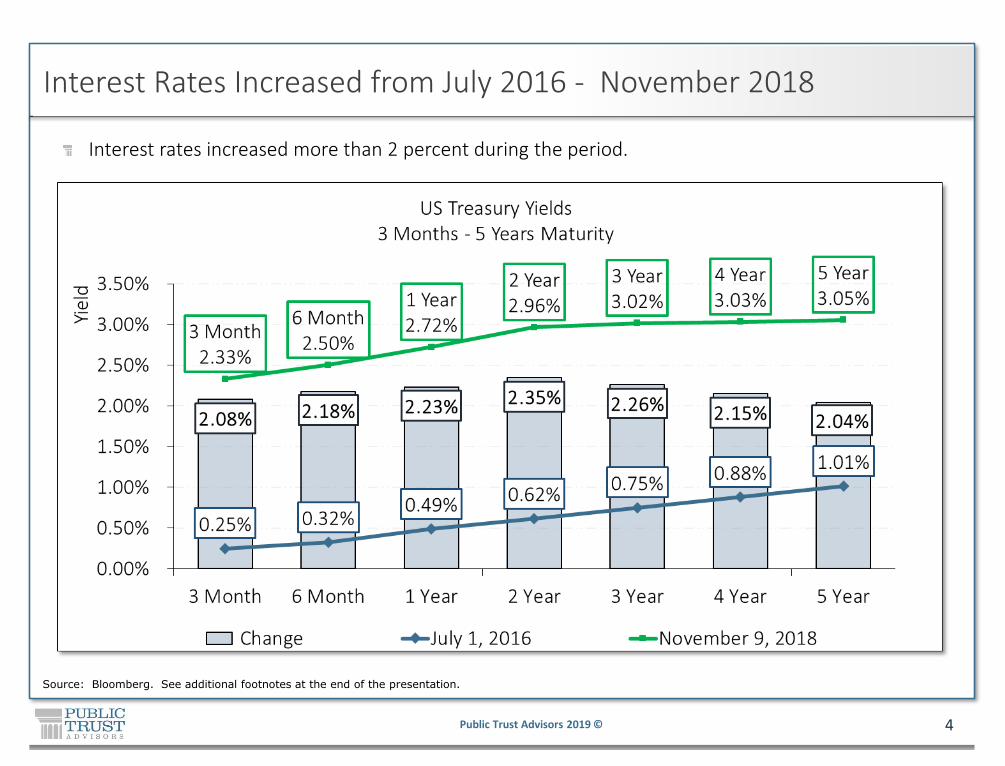
Interest rates increased more than 2 percent during the period.
Source: Bloomberg. See additional footnotes at the end of the presentation.
Interest Rates Increased from July 2016 - November 2018
4
Public Trust Advisors 2019 ©
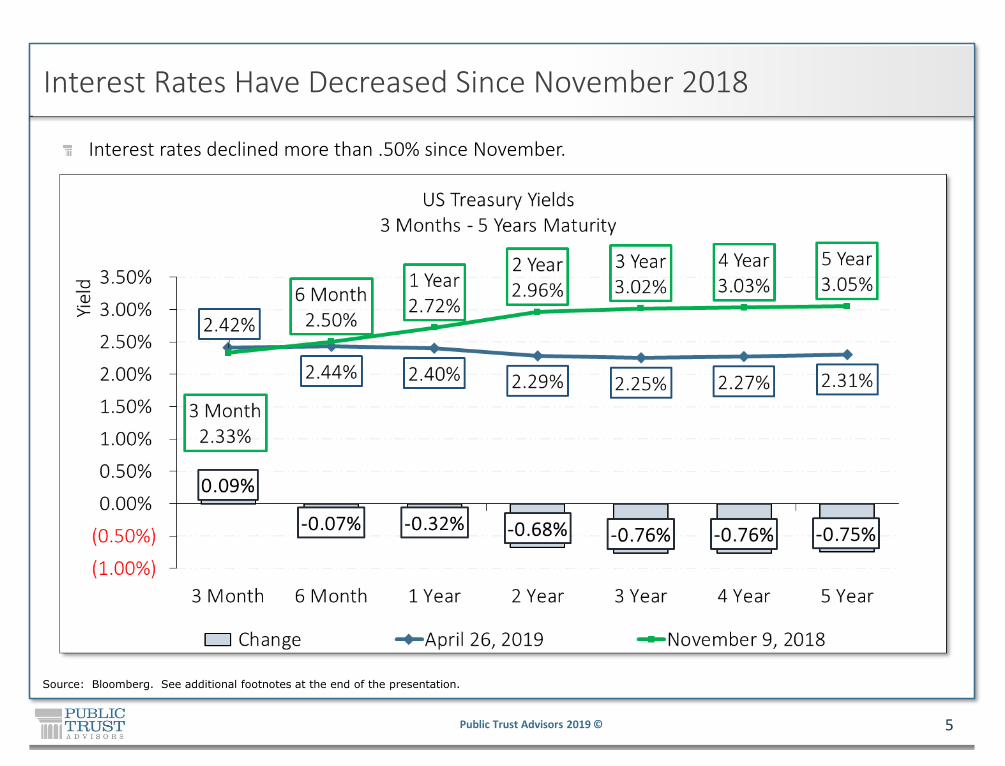
Interest rates declined more than .50% since November.
Source: Bloomberg. See additional footnotes at the end of the presentation.
Interest Rates Have Decreased Since November 2018
5
Public Trust Advisors 2019 ©
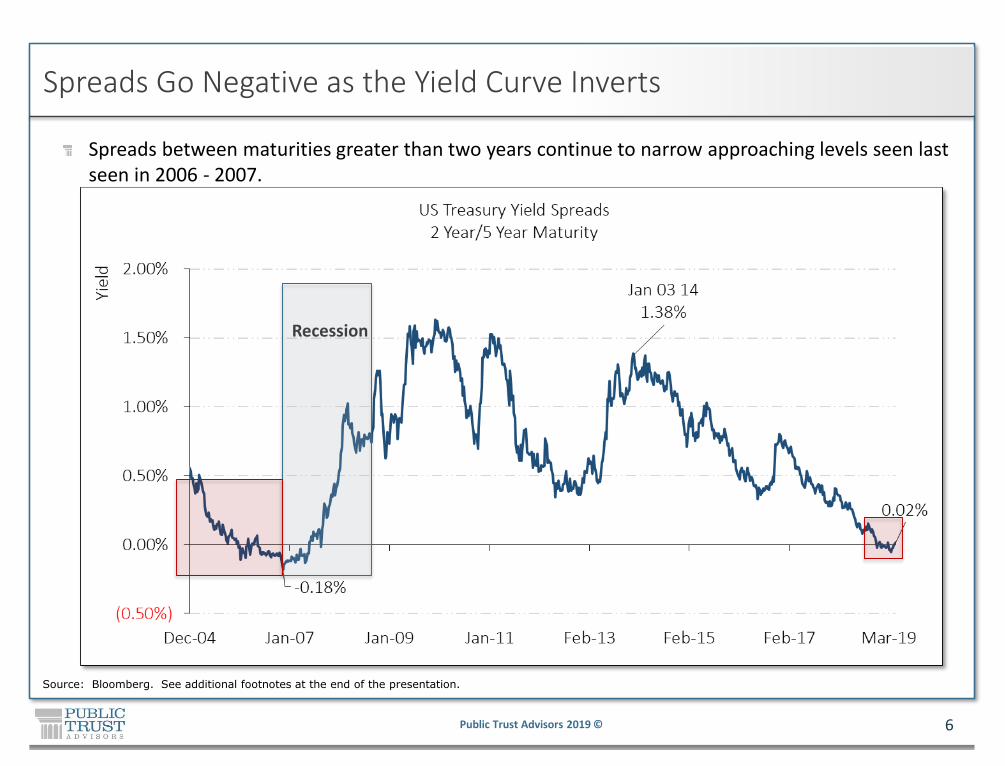
Spreads Go Negative as the Yield Curve Inverts
Spreads between maturities greater than two years continue to narrow approaching levels seen last seen in 2006 - 2007.
Source: Bloomberg. See additional footnotes at the end of the presentation.
Recession
6
Public Trust Advisors 2019 ©
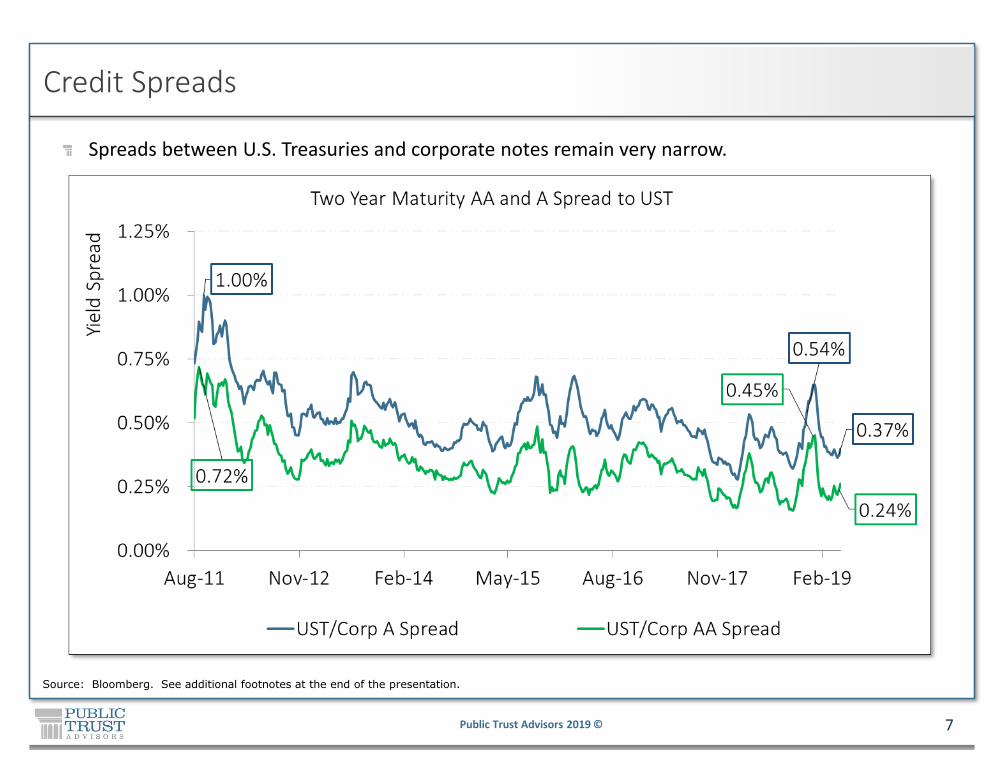
Credit Spreads
Spreads between U.S. Treasuries and corporate notes remain very narrow.
Source: Bloomberg. See additional footnotes at the end of the presentation.
7
Public Trust Advisors 2019 ©
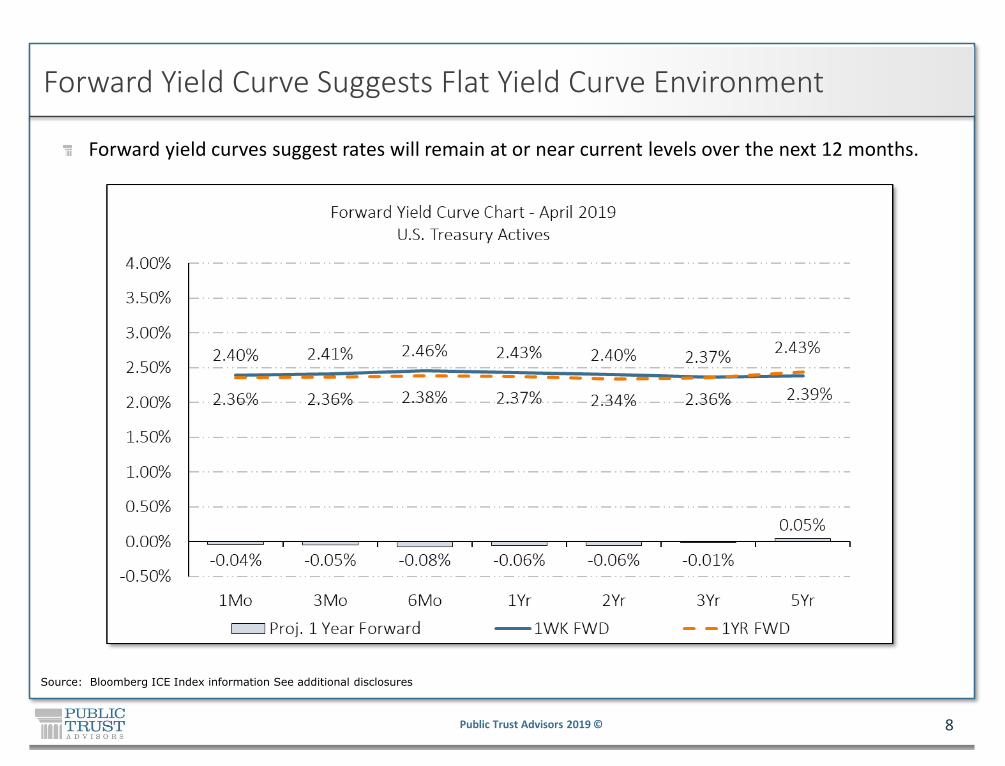
Forward Yield Curve Suggests Flat Yield Curve Environment
Forward yield curves suggest rates will remain at or near current levels over the next 12 months.
Source: Bloomberg ICE Index information See additional disclosures
8
Public Trust Advisors 2019 ©
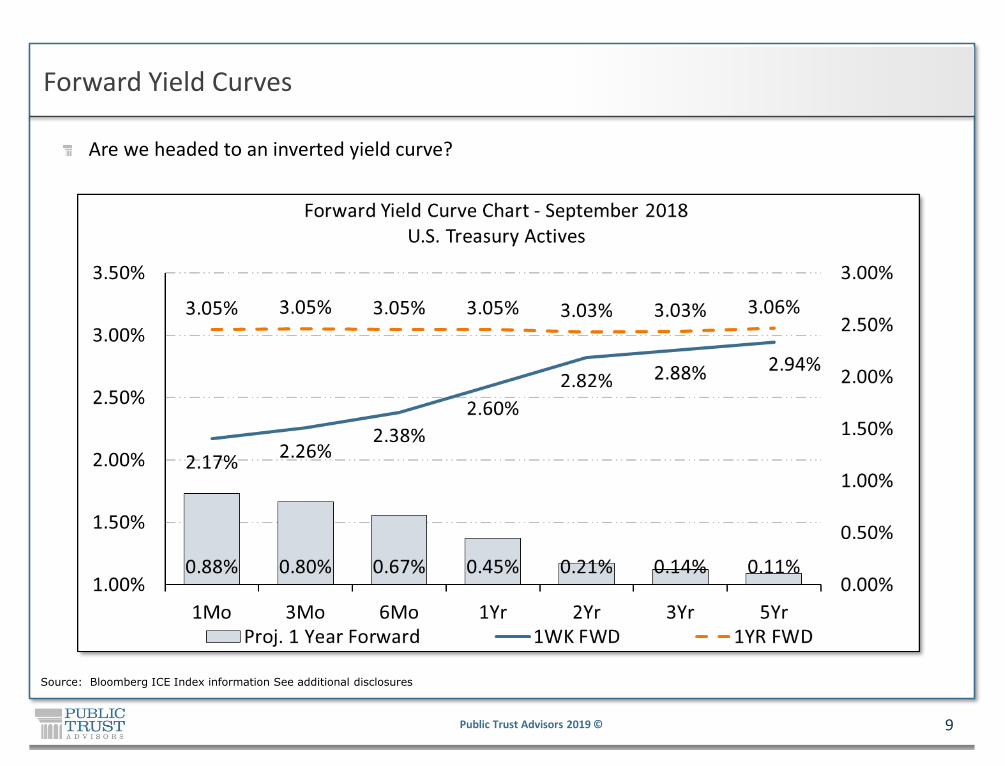
Forward Yield Curves
Are we headed to an inverted yield curve?
Source: Bloomberg ICE Index information See additional disclosures
9

Public Trust Advisors 2019 ©
This presentation is for informational purposes only. All information is assumed to be correct but the accuracy has not been confirmed and therefore is not guaranteed to be correct. Information is obtained from third party sources that may or may not be verified. The information presented should not be used in making any investment decisions and is not a recommendation to buy, sell, implement or change any securities or investment strategy, function or process. Any financial and/or investment decision should be made only after considerable research, consideration and involvement with an experienced professional engaged for the specific purpose. All comments and discussion presented are purely based on opinion and assumptions, not fact, and these assumptions may or may not be correct based on foreseen and unforeseen events. All calculations and results presented and are for discussion purposes only and should not be used for making calculations and/or decisions. The data in this presentation is unaudited.
Performance comparisons will be affected by changes in interest rates. Investment returns fluctuate due to changes in market conditions. Investment involves risk, including the possible loss of principal. The information contained herein has been obtained from sources that we believe to be reliable but its accuracy and completeness are not guaranteed. There is no guarantee that investment strategies will achieve the desired results under all market conditions, and each investor should evaluate its ability to invest long-term, especially during periods of a market downturn. Past performance is not an indicator of future performance or results. Any financial and/or investment decision may incur losses. The materials in the attached are opinions of Public Trust Advisors, LLC and should not be construed as investment advice.
The investment advisor providing these services is Public Trust Advisors, LLC, an investment adviser registered with the U.S. Securities and Exchange Commission (SEC) under the Investment Advisers Act of 1940, as amended. Registration with the SEC does not imply a certain level of skill or training. Public Trust is required to maintain a written disclosure brochure of our background and business experience. If you would like to receive a copy of our current disclosure brochure, privacy policy, or code of ethics please contact us.
Benchmarks are provided for illustrative purposes only. Comparisons to benchmarks have limitations because benchmarks have volatility and other material characteristics that may differ from the portfolio. Also, performance results for benchmarks do not reflect payment of investment management/incentive fees and other fund expenses. Because of these differences, benchmarks should not be relied upon as an accurate measure of comparison.
Disclosures

City of Cape Coral ST Public Trust Advisors LLC
1015 Cultural Park Blvd 201 E. Pine Street, Suite 750
Cape Coral, Florida 33990 Orlando, Florida 32801
Quarterly Investment Report for Period Ended March 31, 2019
Investment Management Portfolio Review Page
Investment Portfolio Summary Comparison 3
Investment Portfolio Maturity Distribution 4
Investment Portfolio Maturity Distribution By Security Type 5
Investment Portfolio Rating Distribution 6
Investment Portfolio Security Distribution - Historical Cost 7
Investment Portfolio Security Distribution - Historical Cost 8
Additional Disclosure 9
Portfolio Holding Details 10
City of Cape Coral ST Summary
City of Cape Coral ST
January 1, 2019
Beginning Balance
March 31, 2019
Ending Balance Portfolio Characteristic
January 1, 2019
Beginning Balance
March 31, 2019
Ending Balance
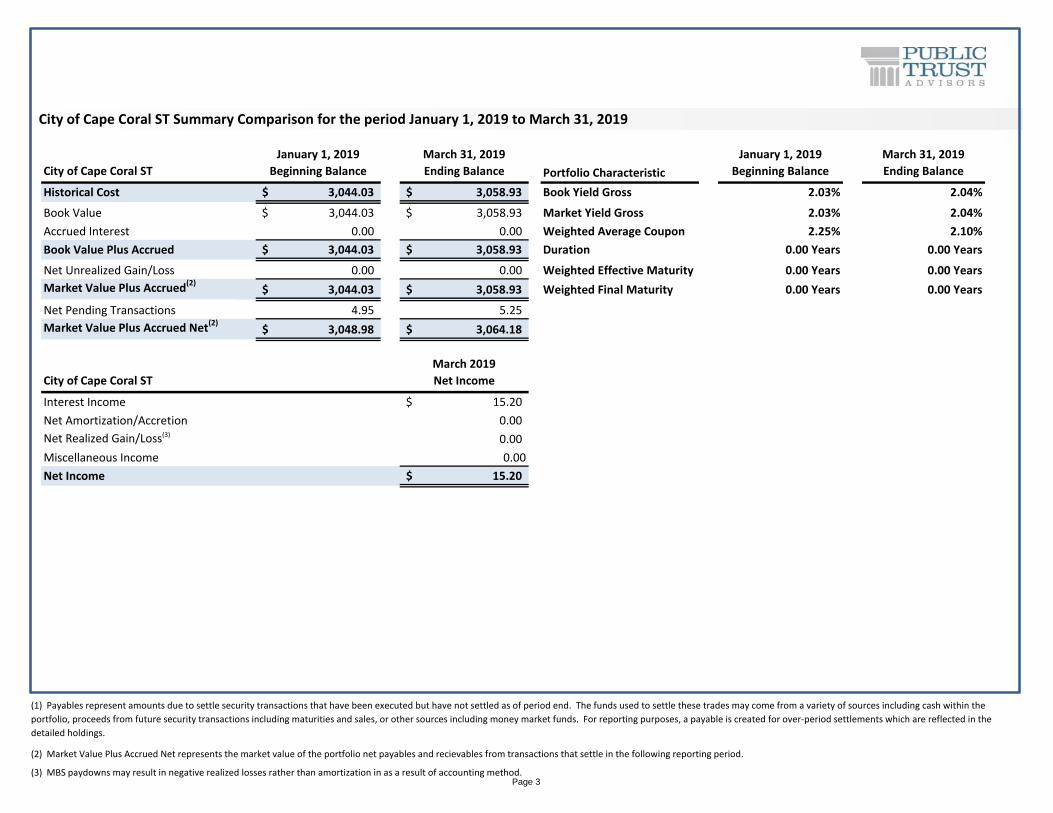
Historical Cost 3,044.03$ 3,058.93$ Book Yield Gross 2.03% 2.04%
Book Value 3,044.03$ 3,058.93$ Market Yield Gross 2.03% 2.04%
Accrued Interest 0.00 0.00 Weighted Average Coupon 2.25% 2.10%
Book Value Plus Accrued 3,044.03$ 3,058.93$ Duration 0.00 Years 0.00 Years
Net Unrealized Gain/Loss 0.00 0.00 Weighted Effective Maturity 0.00 Years 0.00 Years
Market Value Plus Accrued(2)
3,044.03$ 3,058.93$ Weighted Final Maturity 0.00 Years 0.00 Years
Net Pending Transactions 4.95 5.25
Market Value Plus Accrued Net(2)
3,048.98$ 3,064.18$
City of Cape Coral ST
March 2019
Net Income Portfolio Compliance Compliant
Interest Income 15.20$ Security Distribution #REF!
Net Amortization/Accretion 0.00 Maturity Distribution YES
Net Realized Gain/Loss(3) 0.00 Rating Distribution YES
Miscellaneous Income 0.00
Net Income 15.20$
City of Cape Coral ST Summary Comparison for the period January 1, 2019 to March 31, 2019
(1) Payables represent amounts due to settle security transactions that have been executed but have not settled as of period end. The funds used to settle these trades may come from a variety of sources including cash within the
portfolio, proceeds from future security transactions including maturities and sales, or other sources including money market funds. For reporting purposes, a payable is created for over-period settlements which are reflected in the
detailed holdings.
(2) Market Value Plus Accrued Net represents the market value of the portfolio net payables and recievables from transactions that settle in the following reporting period.
(3) MBS paydowns may result in negative realized losses rather than amortization in as a result of accounting method.Page 3
Maturity Distribution
January 1, 2019
Beginning Balance
March 31, 2019
Ending Balance Portfolio Allocation Distribution Change
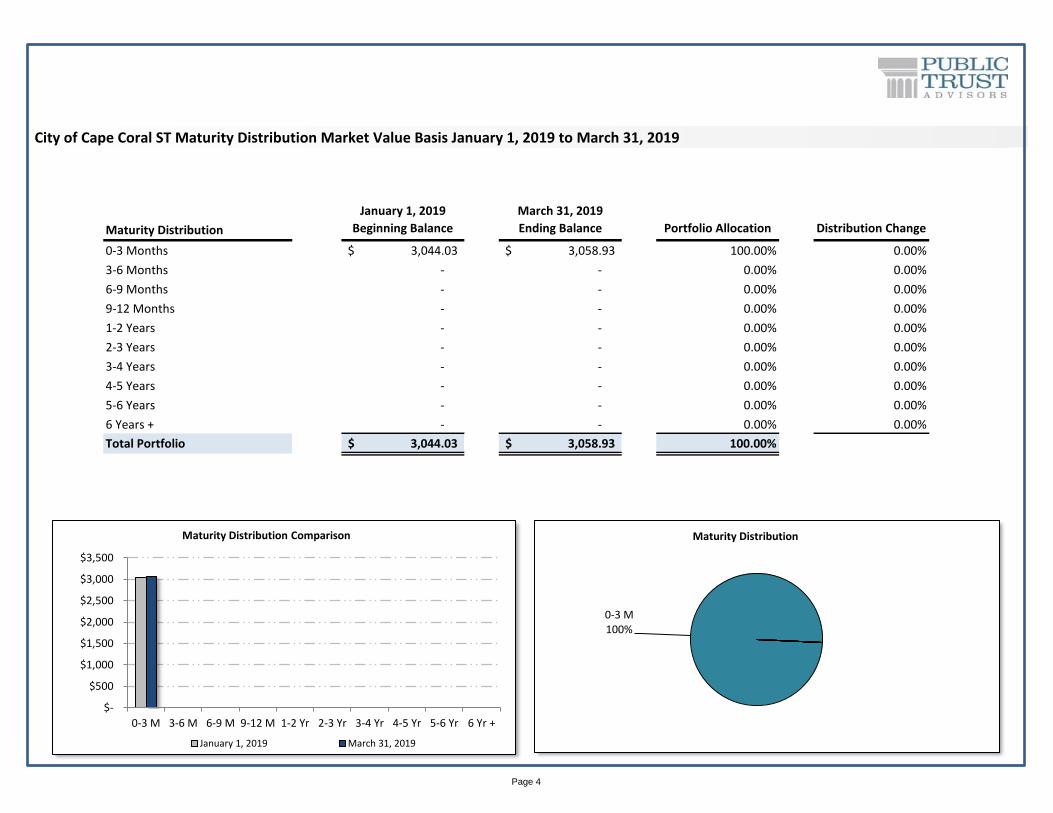
0-3 Months 3,044.03$ 3,058.93$ 100.00% 0.00%
3-6 Months - - 0.00% 0.00%
6-9 Months - - 0.00% 0.00%
9-12 Months - - 0.00% 0.00%
1-2 Years - - 0.00% 0.00%
2-3 Years - - 0.00% 0.00%
3-4 Years - - 0.00% 0.00%
4-5 Years - - 0.00% 0.00%
5-6 Years - - 0.00% 0.00%
6 Years + - - 0.00% 0.00%
Total Portfolio 3,044.03$ 3,058.93$ 100.00%
City of Cape Coral ST Maturity Distribution Market Value Basis January 1, 2019 to March 31, 2019
$-
$500
$1,000
$1,500
$2,000
$2,500
$3,000
$3,500
0-3 M 3-6 M 6-9 M 9-12 M 1-2 Yr 2-3 Yr 3-4 Yr 4-5 Yr 5-6 Yr 6 Yr +
Maturity Distribution Comparison
January 1, 2019 March 31, 2019
0-3 M100%
Maturity Distribution
Page 4
Security Distribution 0-3 Months 3-6 Months 6-9 Months 9-12 Months 1-2 Years 2-3 Years 3-4 Years 4-5 Years Total Portfolio
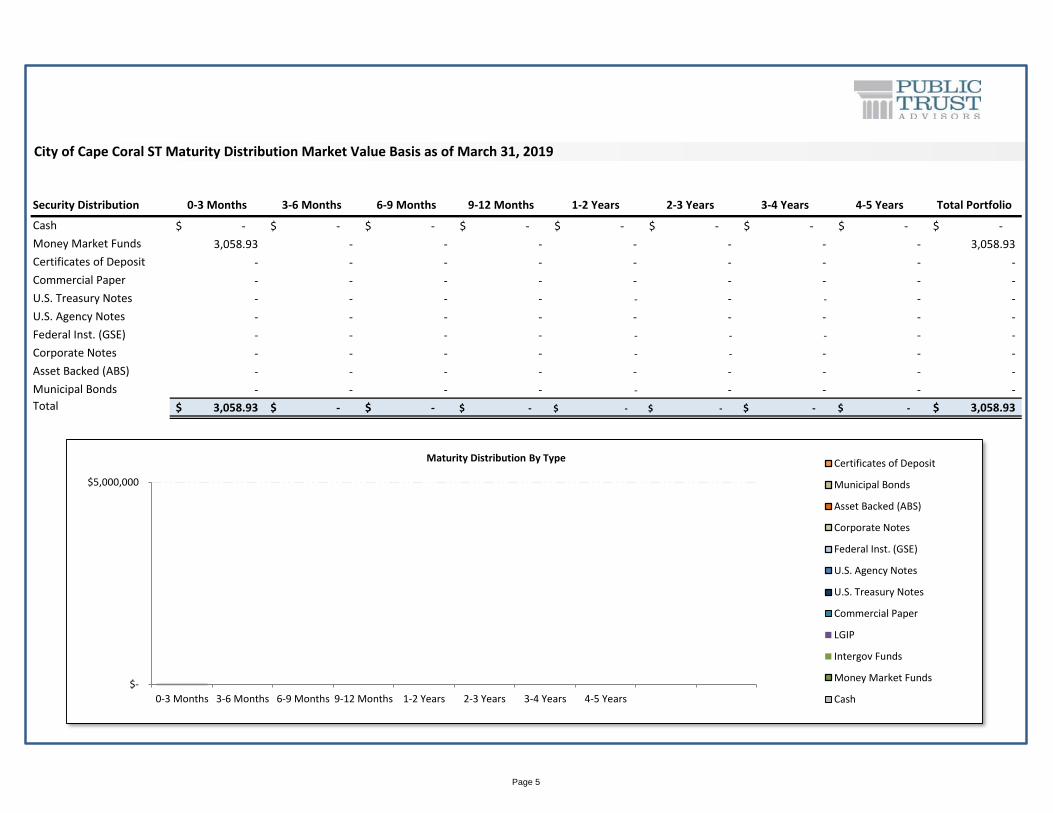
Cash -$ -$ -$ -$ -$ -$ -$ -$ -$
Money Market Funds 3,058.93 - - - - - - - 3,058.93
Certificates of Deposit - - - - - - - - -
Commercial Paper - - - - - - - - -
U.S. Treasury Notes - - - - - - - - -
U.S. Agency Notes - - - - - - - - -
Federal Inst. (GSE) - - - - - - - - -
Corporate Notes - - - - - - - - -
Asset Backed (ABS) - - - - - - - - -
Municipal Bonds - - - - - - - - -
Total 3,058.93$ -$ -$ -$ -$ -$ -$ -$ 3,058.93$
City of Cape Coral ST Maturity Distribution Market Value Basis as of March 31, 2019
$-
$5,000,000
0-3 Months 3-6 Months 6-9 Months 9-12 Months 1-2 Years 2-3 Years 3-4 Years 4-5 Years
Maturity Distribution By Type Certificates of Deposit
Municipal Bonds
Asset Backed (ABS)
Corporate Notes
Federal Inst. (GSE)
U.S. Agency Notes
U.S. Treasury Notes
Commercial Paper
LGIP
Intergov Funds
Money Market Funds
Cash
Page 5
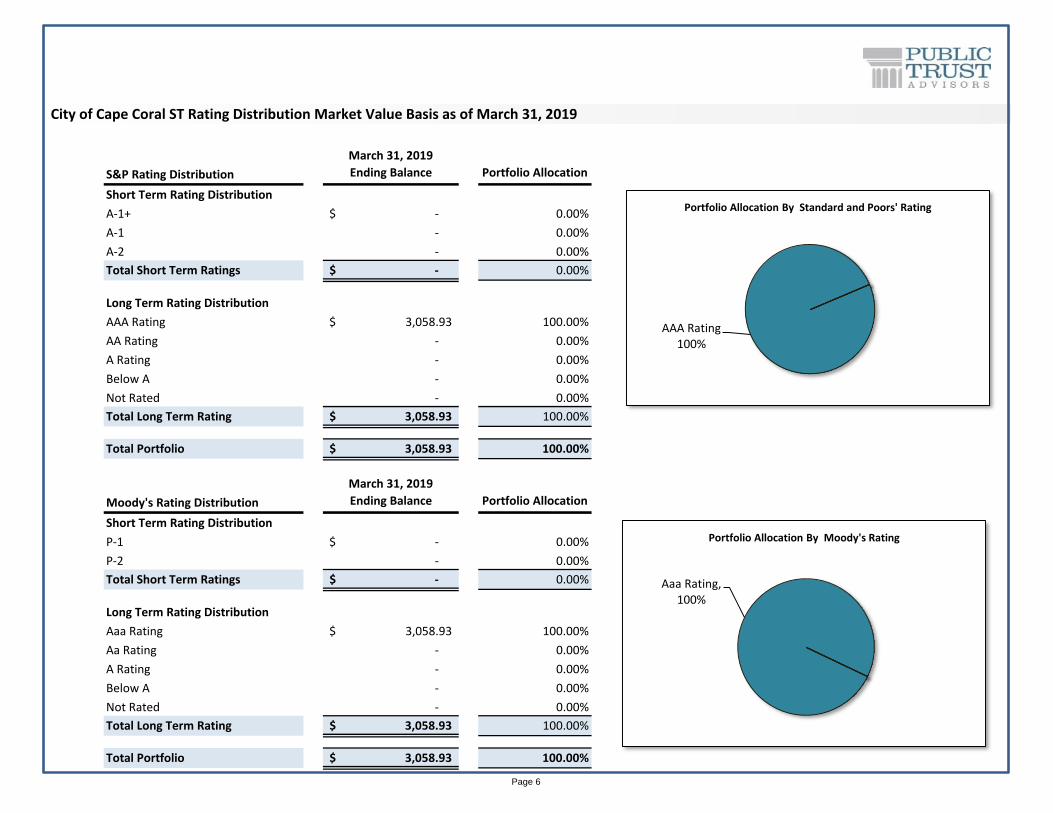
S&P Rating Distribution
March 31, 2019
Ending Balance Portfolio Allocation
Short Term Rating Distribution
A-1+ -$ 0.00%
A-1 - 0.00%
A-2 - 0.00%
Total Short Term Ratings -$ 0.00%
Long Term Rating Distribution
AAA Rating 3,058.93$ 100.00%
AA Rating - 0.00%
A Rating - 0.00%
Below A - 0.00%
Not Rated - 0.00%
Total Long Term Rating 3,058.93$ 100.00%
Total Portfolio 3,058.93$ 100.00%
Moody's Rating Distribution
March 31, 2019
Ending Balance Portfolio Allocation
Short Term Rating Distribution
P-1 -$ 0.00%
P-2 - 0.00%
Total Short Term Ratings -$ 0.00%
Long Term Rating Distribution
Aaa Rating 3,058.93$ 100.00%
Aa Rating - 0.00%
A Rating - 0.00%
Below A - 0.00%
Not Rated - 0.00%
Total Long Term Rating 3,058.93$ 100.00%
Total Portfolio 3,058.93$ 100.00%
City of Cape Coral ST Rating Distribution Market Value Basis as of March 31, 2019
AAA Rating100%
Portfolio Allocation By Standard and Poors' Rating
Aaa Rating, 100%
Portfolio Allocation By Moody's Rating
Page 6
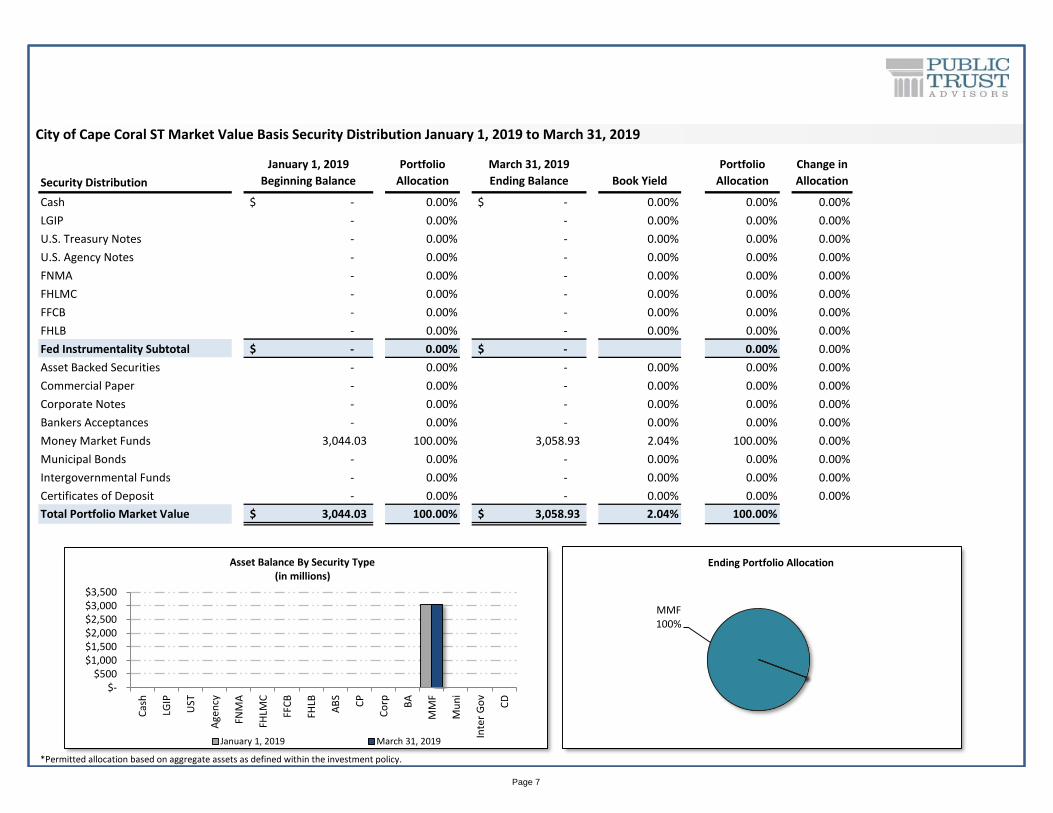
Security Distribution
January 1, 2019
Beginning Balance
Portfolio
Allocation
March 31, 2019
Ending Balance Book Yield
Portfolio
Allocation
Change in
Allocation
Permitted by
Policy* Compliant
Cash -$ 0.00% -$ 0.00% 0.00% 0.00% YES
LGIP - 0.00% - 0.00% 0.00% 0.00% YES
U.S. Treasury Notes - 0.00% - 0.00% 0.00% 0.00% YES
U.S. Agency Notes - 0.00% - 0.00% 0.00% 0.00% YES
FNMA - 0.00% - 0.00% 0.00% 0.00% YES
FHLMC - 0.00% - 0.00% 0.00% 0.00% YES
FFCB - 0.00% - 0.00% 0.00% 0.00% YES
FHLB - 0.00% - 0.00% 0.00% 0.00% YES
Fed Instrumentality Subtotal -$ 0.00% -$ 0.00% 0.00% YES
Asset Backed Securities - 0.00% - 0.00% 0.00% 0.00% YES
Commercial Paper - 0.00% - 0.00% 0.00% 0.00% YES
Corporate Notes - 0.00% - 0.00% 0.00% 0.00% YES
Bankers Acceptances - 0.00% - 0.00% 0.00% 0.00% YES
Money Market Funds 3,044.03 100.00% 3,058.93 2.04% 100.00% 0.00% NO
Municipal Bonds - 0.00% - 0.00% 0.00% 0.00% YES
Intergovernmental Funds - 0.00% - 0.00% 0.00% 0.00% YES
Certificates of Deposit - 0.00% - 0.00% 0.00% 0.00% YES
Total Portfolio Market Value 3,044.03$ 100.00% 3,058.93$ 2.04% 100.00%
*Permitted allocation based on aggregate assets as defined within the investment policy.
City of Cape Coral ST Market Value Basis Security Distribution January 1, 2019 to March 31, 2019
$- $500
$1,000 $1,500 $2,000 $2,500 $3,000 $3,500
Cas
h
LGIP
UST
Age
ncy
FNM
A
FHLM
C
FFC
B
FHLB
AB
S
CP
Co
rp BA
MM
F
Mu
ni
Inte
r G
ov
CD
Asset Balance By Security Type(in millions)
January 1, 2019 March 31, 2019
MMF100%
Ending Portfolio Allocation
Page 7
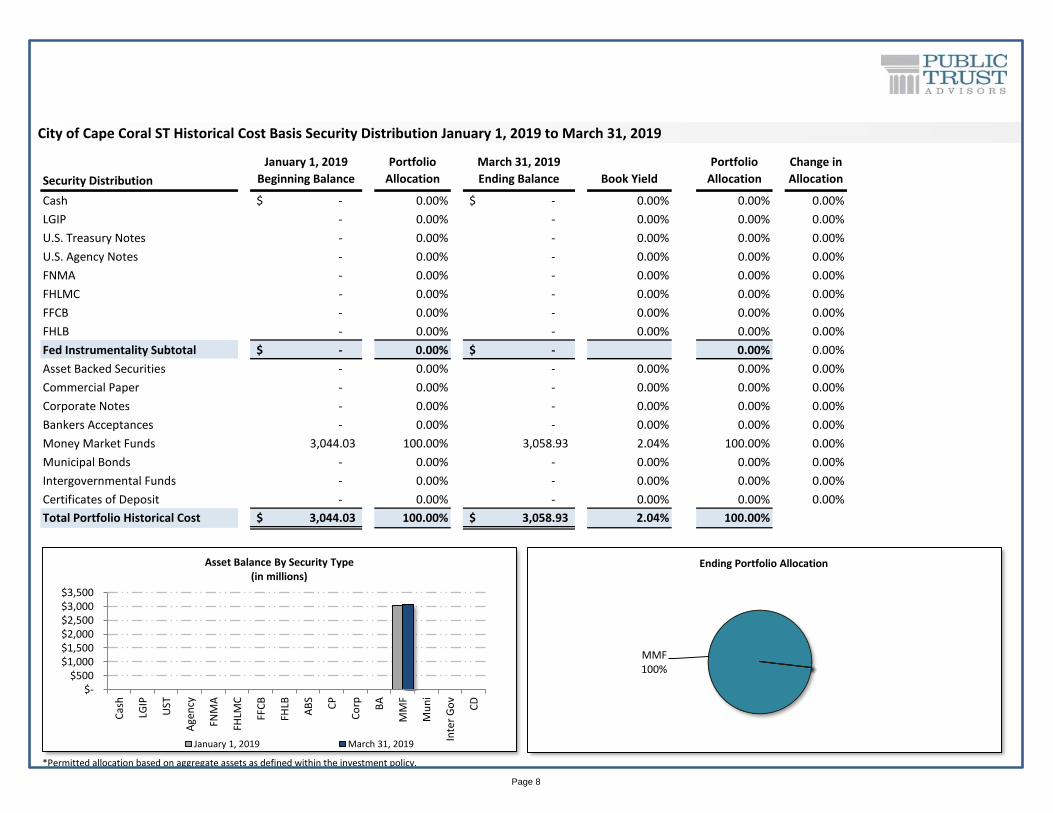
Security Distribution
January 1, 2019
Beginning Balance
Portfolio
Allocation
March 31, 2019
Ending Balance Book Yield
Portfolio
Allocation
Change in
Allocation
Permitted by
Policy* Compliant
Cash -$ 0.00% -$ 0.00% 0.00% 0.00% YES
LGIP - 0.00% - 0.00% 0.00% 0.00% YES
U.S. Treasury Notes - 0.00% - 0.00% 0.00% 0.00% YES
U.S. Agency Notes - 0.00% - 0.00% 0.00% 0.00% YES
FNMA - 0.00% - 0.00% 0.00% 0.00% YES
FHLMC - 0.00% - 0.00% 0.00% 0.00% YES
FFCB - 0.00% - 0.00% 0.00% 0.00% YES
FHLB - 0.00% - 0.00% 0.00% 0.00% YES
Fed Instrumentality Subtotal -$ 0.00% -$ 0.00% 0.00% YES
Asset Backed Securities - 0.00% - 0.00% 0.00% 0.00% YES
Commercial Paper - 0.00% - 0.00% 0.00% 0.00% YES
Corporate Notes - 0.00% - 0.00% 0.00% 0.00% YES
Bankers Acceptances - 0.00% - 0.00% 0.00% 0.00% YES
Money Market Funds 3,044.03 100.00% 3,058.93 2.04% 100.00% 0.00% NO
Municipal Bonds - 0.00% - 0.00% 0.00% 0.00% YES
Intergovernmental Funds - 0.00% - 0.00% 0.00% 0.00% YES
Certificates of Deposit - 0.00% - 0.00% 0.00% 0.00% YES
Total Portfolio Historical Cost 3,044.03$ 100.00% 3,058.93$ 2.04% 100.00%
NOT CORRECT
*Permitted allocation based on aggregate assets as defined within the investment policy.
City of Cape Coral ST Historical Cost Basis Security Distribution January 1, 2019 to March 31, 2019
$- $500
$1,000 $1,500 $2,000 $2,500 $3,000 $3,500
Cas
h
LGIP
UST
Age
ncy
FNM
A
FHLM
C
FFC
B
FHLB
AB
S
CP
Co
rp BA
MM
F
Mu
ni
Inte
r G
ov
CD
Asset Balance By Security Type(in millions)
January 1, 2019 March 31, 2019
MMF100%
Ending Portfolio Allocation
Page 8
Additional Disclosure
This statement is for general information purposes only and is not intended to provide specific advice or recommendations. Please review the contents of this statement carefully. Should you have any questions regarding the information presented, calculation methodology, investment portfolio or security detail, or any other facet of your statement, please feel free to contact us.
Public Trust Advisor’s monthly statement is intended to detail our investment advisory activity as well as the activity of any accounts held by clients in pools that are managed by Public Trust Advisors. The custodian bank maintains the control of assets and executes and settles all investments transactions. The custodian statement is the official record of security and cash holdings transactions. Public Trust Advisors recognizes that clients may use these reports to facilitate record keeping; therefore the custodian bank statement and the Public Trust Advisors statement should be reconciled and differences resolved. Many custodians use a settlement date basis which may result in the need to reconcile due to a timing difference. Please contact your relationship manager or our toll free number 855-395-3954 with questions regarding your account.
Public Trust Advisors does not have the authority to withdraw funds from or deposit funds to the custodian. Our clients retain responsibility for their internal accounting policies; implementing and enforcing internal controls and generating ledger entries or otherwise recording transactions.
Pricing sources from our reporting platform are provided by Clearwater reporting platform and are established by Clearwater’s internal pricing procedures. Clearwater utilizes a hierarchical pricing model which starts with one of the industry’s pricing sources, S&P Capital IQ. Securities with short maturities and infrequent secondary market trades are typically priced via mathematical calculations. The Securities in this investment portfolio, including shares of mutual funds, are not guaranteed or otherwise protected by Public trust Advisors, the FDIC (except for certain non-negotiable certificates of deposit) or any government agency, unless otherwise specifically stated. Investment in fixed income securities involves risks, including the possible loss of the amount invested.
Past performance is not an indication of future performance.
Beginning and Ending Balances based on Market Value plus Accrued Interest on a Trade Date basis.
Public Trust Advisors is an investment advisor registered with the Securities and Exchange Commission, and is required to maintain a written disclosure statement of our background and business experience. If you would like to receive a copy of our current disclosure statement, privacy policy, or code of ethics please contact Service Operations at the address below.
Public Trust Advisors717 17th Street, Suite 1850Denver, CO 80202
Page 9
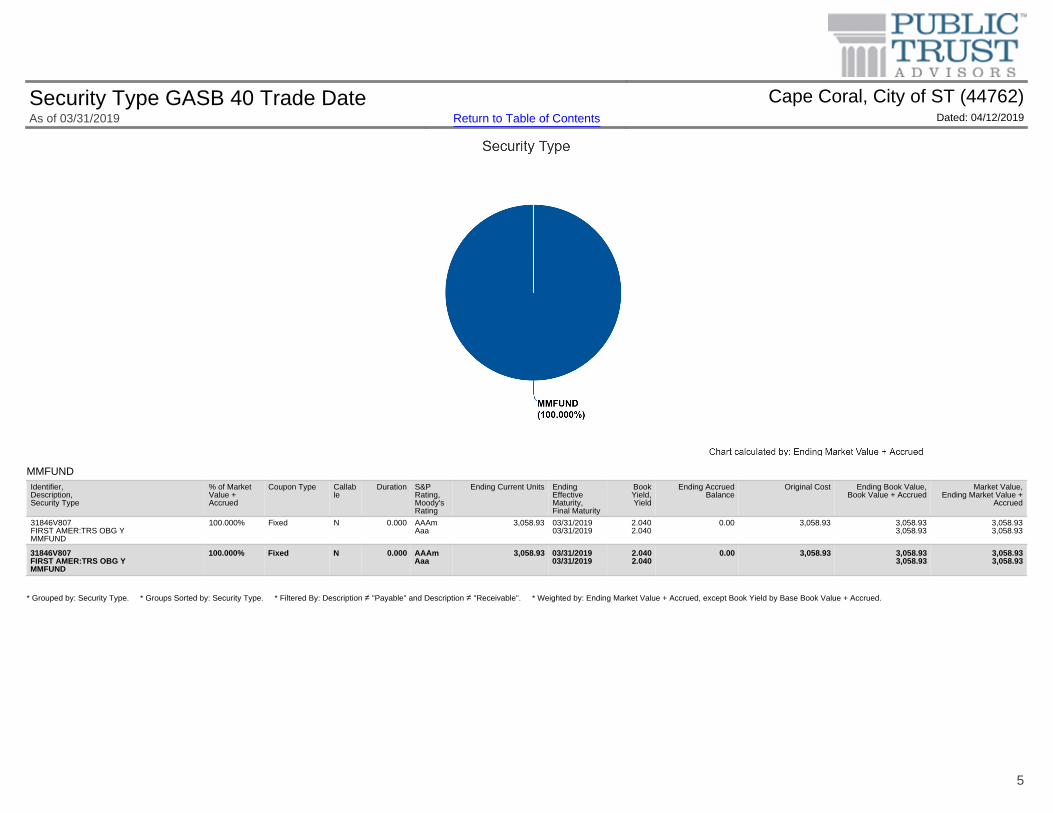
MMFUND
* Grouped by: Security Type. * Groups Sorted by: Security Type. * Filtered By: Description ≠ "Payable" and Description ≠ "Receivable". * Weighted by: Ending Market Value + Accrued, except Book Yield by Base Book Value + Accrued.
Identifier,Description,Security Type
% of MarketValue +Accrued
Coupon Type Callable
Duration S&PRating,Moody'sRating
Ending Current Units EndingEffectiveMaturity,Final Maturity
BookYield,Yield
Ending AccruedBalance
Original Cost Ending Book Value,Book Value + Accrued
Market Value,Ending Market Value +
Accrued
31846V807FIRST AMER:TRS OBG YMMFUND
100.000% Fixed N 0.000 AAAmAaa
3,058.93 03/31/201903/31/2019
2.0402.040
0.00 3,058.93 3,058.933,058.93
3,058.933,058.93
31846V807FIRST AMER:TRS OBG YMMFUND
100.000% Fixed N 0.000 AAAmAaa
3,058.93 03/31/201903/31/2019
2.0402.040
0.00 3,058.93 3,058.933,058.93
3,058.933,058.93
Security Type GASB 40 Trade Date Cape Coral, City of ST (44762)As of 03/31/2019 Return to Table of Contents Dated: 04/12/2019
5
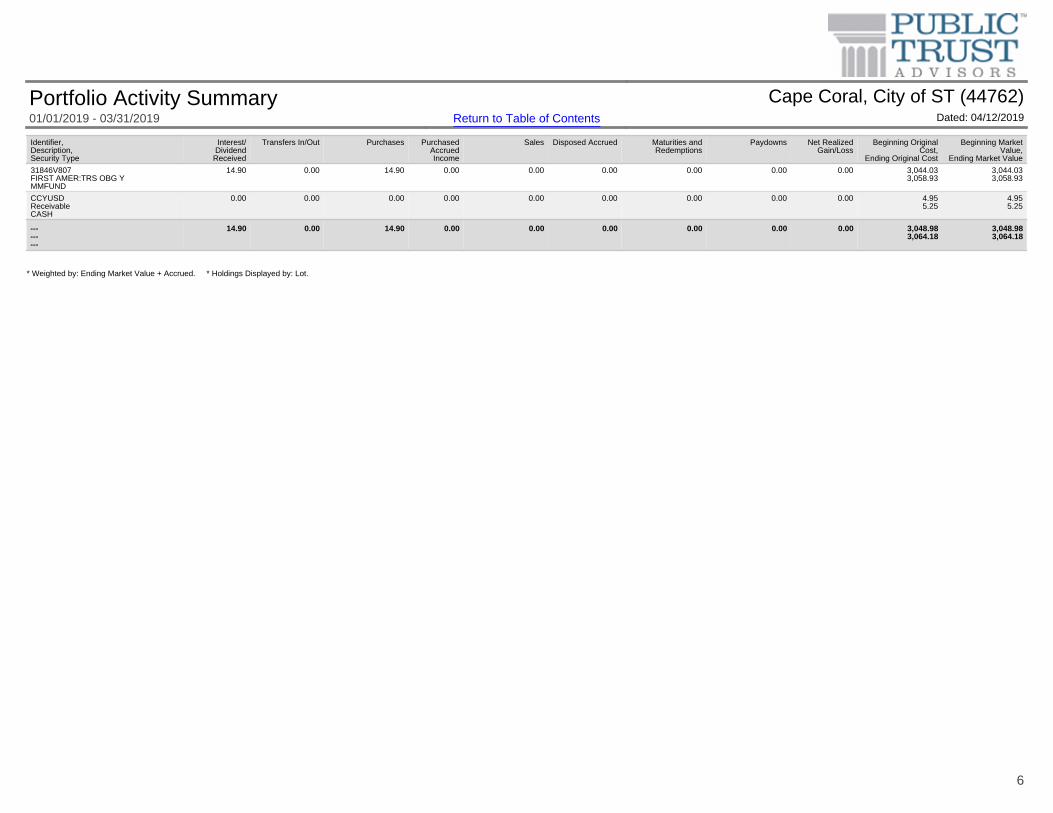
* Weighted by: Ending Market Value + Accrued. * Holdings Displayed by: Lot.
Identifier,Description,Security Type
Interest/Dividend
Received
Transfers In/Out Purchases PurchasedAccruedIncome
Sales Disposed Accrued Maturities andRedemptions
Paydowns Net RealizedGain/Loss
Beginning OriginalCost,
Ending Original Cost
Beginning MarketValue,
Ending Market Value
31846V807FIRST AMER:TRS OBG YMMFUND
14.90 0.00 14.90 0.00 0.00 0.00 0.00 0.00 0.00 3,044.033,058.93
3,044.033,058.93
CCYUSDReceivableCASH
0.00 0.00 0.00 0.00 0.00 0.00 0.00 0.00 0.00 4.955.25
4.955.25
---------
14.90 0.00 14.90 0.00 0.00 0.00 0.00 0.00 0.00 3,048.983,064.18
3,048.983,064.18
Portfolio Activity Summary Cape Coral, City of ST (44762)01/01/2019 - 03/31/2019 Return to Table of Contents Dated: 04/12/2019
6

Additional Disclosure:
The information on this website is for general purposes only and is not intended to provide specific advice or recommendations. All information presented on this website is obtained via electronic data transfer from theCustodian. While this information is reconciled on a daily basis, when available, accuracy is relied upon from the Custodian. Please review the data carefully. Should you have any questions regarding the informationpresented, calculation methodology, investment portfolio or security detail, or any other facet of the data, please feel free to contact us.
This data is intended to detail our investment advisory activity as well as the activity of any client accounts managed by Public Trust Advisors, LLC (Public Trust). The custodian bank maintains the control of assets andexecutes and settles all investment transactions. The custodian statement is the official record of security and cash holdings transactions. Public Trust recognizes that clients may use these reports to facilitate record keeping;therefore it is recommended that the client reconcile this statement with their custodian bank statement. Many custodians use a settlement date basis which may result in the need to reconcile due to a timing difference.Please contact your relationship manager or call our toll free number 855-395-3954 with questions regarding your account.
Public Trust does not have the authority to withdraw funds from or deposit funds to the custodian. Our clients retain responsibility for their internal accounting policies; implementing and enforcing internal controls andgenerating ledger entries or otherwise recording transactions.
Pricing sources from our reporting platform are provided by Clearwater Analytics®. Clearwater utilizes a hierarchical pricing model with multiple options for pricing sources. These options include custodial pricing, S&P CapitalIQ and other sources. Since multiple pricing hierarchies are offered through Clearwater Analytics, and client preferences regarding pricing sources may differ, it is important to verify the specific pricing hierarchy for eachportfolio. Securities with short maturities and infrequent secondary market trades are typically priced via mathematical calculations. The securities in this investment portfolio, including shares of mutual funds, are notguaranteed or otherwise protected by Public Trust, the FDIC (except for certain non-negotiable certificates of deposit) or any government agency, unless otherwise specifically stated. Investing involves risk, including thepossible loss of principal.
Past performance is not an indicator of future performance or results.
Public Trust statements present beginning and ending balances and are based on Market Value plus accrued interest on a Trade Date basis. Customized reports made available to the end user either from Public Trust orthrough the online reporting platform may present information and portfolio analytics using various optional methods including, but not limited to, historical cost, amortized cost, and market value. Custom reports may also differfrom the information received from the custodian as a result of additional formulas and filters created based on end user preferences.
The investment advisor providing these services is Public Trust Advisors, LLC, an investment adviser registered with the U.S. Securities and Exchange Commission (SEC) under the Investment Advisers Act of 1940, asamended. Registration with the SEC does not imply a certain level of skill or training. Public Trust is required to maintain a written disclosure brochure of our background and business experience. If you would like to receive acopy of our current disclosure brochure, privacy policy, or code of ethics please contact us at the address below.
Public Trust Advisors
717 17th St. Suite 1850
Denver, CO 80202
City of Cape Coral 1-3 Year Public Trust Advisors LLC
1015 Cultural Park Blvd 201 E. Pine Street, Suite 750
Cape Coral, Florida 33990 Orlando, Florida 32801
Quarterly Investment Report for Period Ended March 31, 2019
Investment Management Portfolio Review Page
Investment Portfolio Summary Comparison 3
Investment Portfolio Maturity Distribution 4
Investment Portfolio Maturity Distribution By Security Type 5
Investment Portfolio Rating Distribution 6
Investment Portfolio Security Distribution - Market Value 7
Investment Portfolio Security Distribution - Historical Cost 8
Additional Disclosure 9
Portfolio Holding Details 10
City of Cape Coral 1-3 Year Summary
City of Cape Coral 1-3 Year
January 1, 2019
Beginning Balance
March 31, 2019
Ending Balance Portfolio Characteristic
January 1, 2019
Beginning Balance
March 31, 2019
Ending Balance
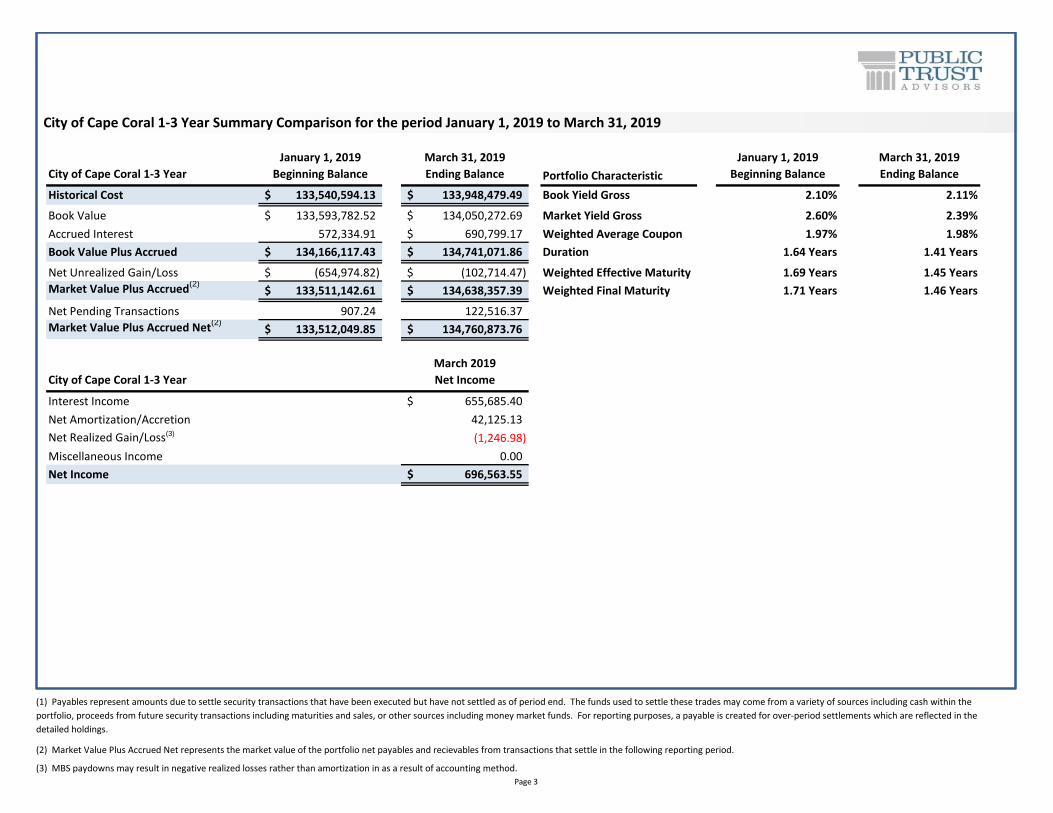
Historical Cost 133,540,594.13$ 133,948,479.49$ Book Yield Gross 2.10% 2.11%
Book Value 133,593,782.52$ 134,050,272.69$ Market Yield Gross 2.60% 2.39%
Accrued Interest 572,334.91 690,799.17$ Weighted Average Coupon 1.97% 1.98%
Book Value Plus Accrued 134,166,117.43$ 134,741,071.86$ Duration 1.64 Years 1.41 Years
Net Unrealized Gain/Loss (654,974.82)$ (102,714.47)$ Weighted Effective Maturity 1.69 Years 1.45 Years
Market Value Plus Accrued(2)133,511,142.61$ 134,638,357.39$ Weighted Final Maturity 1.71 Years 1.46 Years
Net Pending Transactions 907.24 122,516.37
Market Value Plus Accrued Net(2)133,512,049.85$ 134,760,873.76$
City of Cape Coral 1-3 Year
March 2019
Net Income Portfolio Compliance Compliant
Interest Income 655,685.40$ Security Distribution YES
Net Amortization/Accretion 42,125.13 Maturity Distribution YES
Net Realized Gain/Loss(3) (1,246.98) Rating Distribution YES
Miscellaneous Income 0.00
Net Income 696,563.55$
City of Cape Coral 1-3 Year Summary Comparison for the period January 1, 2019 to March 31, 2019
(1) Payables represent amounts due to settle security transactions that have been executed but have not settled as of period end. The funds used to settle these trades may come from a variety of sources including cash within the
portfolio, proceeds from future security transactions including maturities and sales, or other sources including money market funds. For reporting purposes, a payable is created for over-period settlements which are reflected in the
detailed holdings.
(2) Market Value Plus Accrued Net represents the market value of the portfolio net payables and recievables from transactions that settle in the following reporting period.
(3) MBS paydowns may result in negative realized losses rather than amortization in as a result of accounting method.
Page 3
Maturity Distribution
January 1, 2019
Beginning Balance
March 31, 2019
Ending Balance Portfolio Allocation Distribution Change
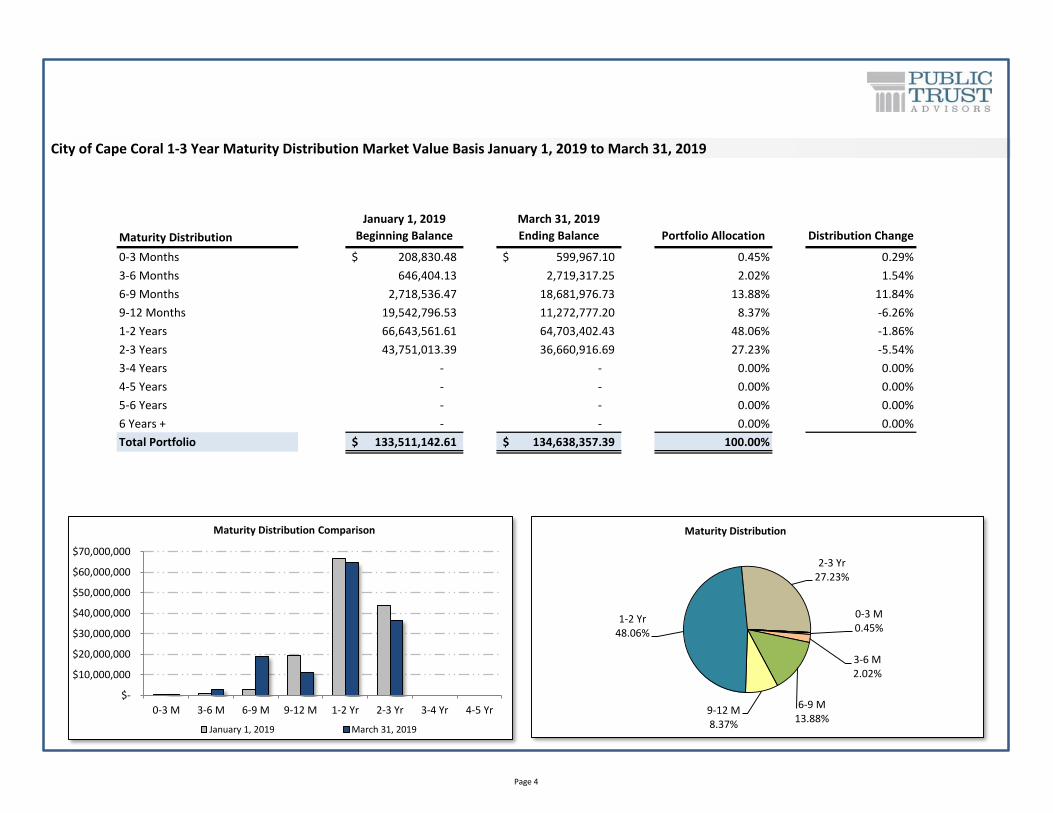
0-3 Months 208,830.48$ 599,967.10$ 0.45% 0.29%
3-6 Months 646,404.13 2,719,317.25 2.02% 1.54%
6-9 Months 2,718,536.47 18,681,976.73 13.88% 11.84%
9-12 Months 19,542,796.53 11,272,777.20 8.37% -6.26%
1-2 Years 66,643,561.61 64,703,402.43 48.06% -1.86%
2-3 Years 43,751,013.39 36,660,916.69 27.23% -5.54%
3-4 Years - - 0.00% 0.00%
4-5 Years - - 0.00% 0.00%
5-6 Years - - 0.00% 0.00%
6 Years + - - 0.00% 0.00%
Total Portfolio 133,511,142.61$ 134,638,357.39$ 100.00%
City of Cape Coral 1-3 Year Maturity Distribution Market Value Basis January 1, 2019 to March 31, 2019
$-
$10,000,000
$20,000,000
$30,000,000
$40,000,000
$50,000,000
$60,000,000
$70,000,000
0-3 M 3-6 M 6-9 M 9-12 M 1-2 Yr 2-3 Yr 3-4 Yr 4-5 Yr
Maturity Distribution Comparison
January 1, 2019 March 31, 2019
0-3 M0.45%
3-6 M2.02%
6-9 M13.88%
9-12 M8.37%
1-2 Yr48.06%
2-3 Yr27.23%
Maturity Distribution
Page 4
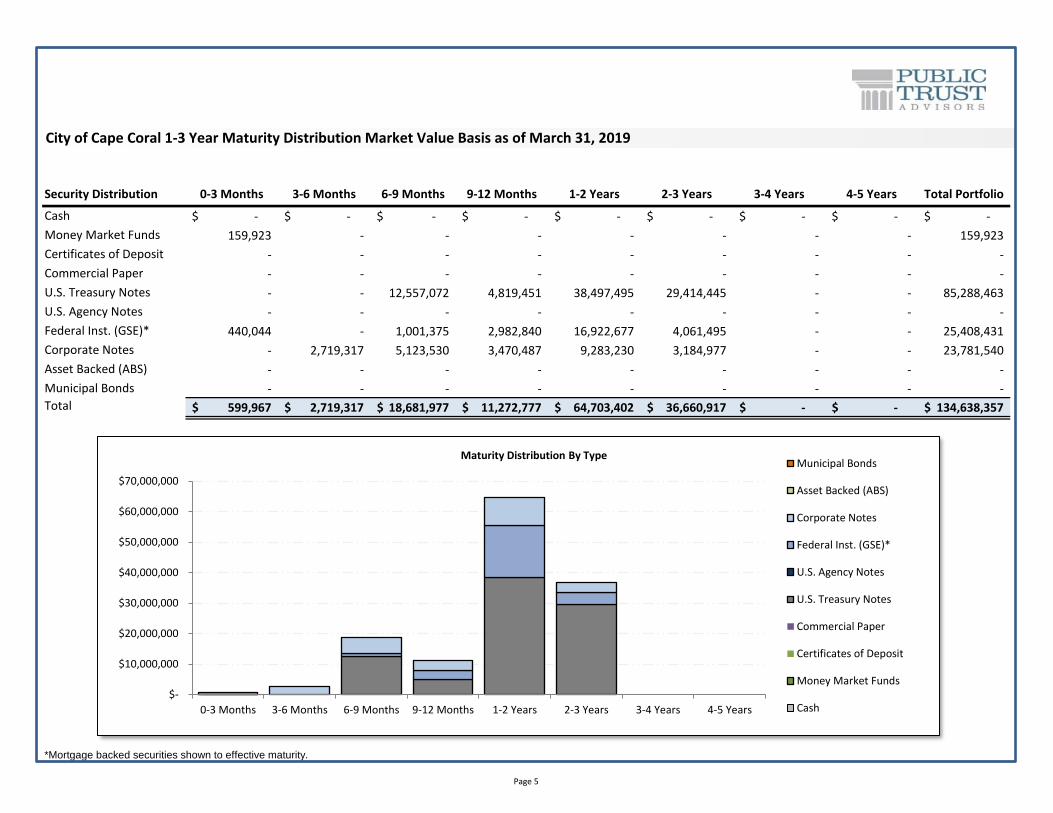
Security Distribution 0-3 Months 3-6 Months 6-9 Months 9-12 Months 1-2 Years 2-3 Years 3-4 Years 4-5 Years Total Portfolio
Cash -$ -$ -$ -$ -$ -$ -$ -$ -$
Money Market Funds 159,923 - - - - - - - 159,923
Certificates of Deposit - - - - - - - - -
Commercial Paper - - - - - - - - -
U.S. Treasury Notes - - 12,557,072 4,819,451 38,497,495 29,414,445 - - 85,288,463
U.S. Agency Notes - - - - - - - - -
Federal Inst. (GSE)* 440,044 - 1,001,375 2,982,840 16,922,677 4,061,495 - - 25,408,431
Corporate Notes - 2,719,317 5,123,530 3,470,487 9,283,230 3,184,977 - - 23,781,540
Asset Backed (ABS) - - - - - - - - -
Municipal Bonds - - - - - - - - -
Total 599,967$ 2,719,317$ 18,681,977$ 11,272,777$ 64,703,402$ 36,660,917$ -$ -$ 134,638,357$
*Mortgage backed securities shown to effective maturity.
City of Cape Coral 1-3 Year Maturity Distribution Market Value Basis as of March 31, 2019
$-
$10,000,000
$20,000,000
$30,000,000
$40,000,000
$50,000,000
$60,000,000
$70,000,000
0-3 Months 3-6 Months 6-9 Months 9-12 Months 1-2 Years 2-3 Years 3-4 Years 4-5 Years
Maturity Distribution By TypeMunicipal Bonds
Asset Backed (ABS)
Corporate Notes
Federal Inst. (GSE)*
U.S. Agency Notes
U.S. Treasury Notes
Commercial Paper
Certificates of Deposit
Money Market Funds
Cash
Page 5
S&P Rating Distribution
March 31, 2019
Ending Balance Portfolio Allocation
Short Term Rating Distribution
A-1+ -$ 0.00%
A-1 - 0.00%
A-2 - 0.00%
Total Short Term Ratings -$ 0.00%
Long Term Rating Distribution
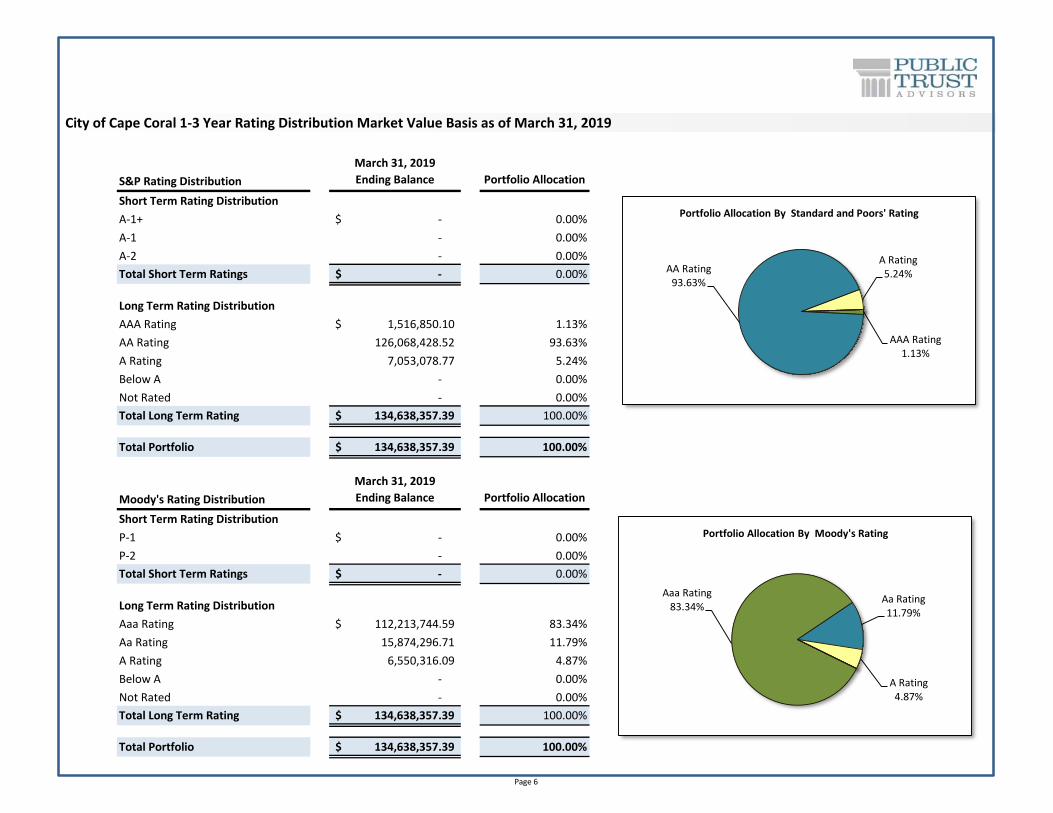
AAA Rating 1,516,850.10$ 1.13%
AA Rating 126,068,428.52 93.63%
A Rating 7,053,078.77 5.24%
Below A - 0.00%
Not Rated - 0.00%
Total Long Term Rating 134,638,357.39$ 100.00%
Total Portfolio 134,638,357.39$ 100.00%
Moody's Rating Distribution
March 31, 2019
Ending Balance Portfolio Allocation
Short Term Rating Distribution
P-1 -$ 0.00%
P-2 - 0.00%
Total Short Term Ratings -$ 0.00%
Long Term Rating Distribution
Aaa Rating 112,213,744.59$ 83.34%
Aa Rating 15,874,296.71 11.79%
A Rating 6,550,316.09 4.87%
Below A - 0.00%
Not Rated - 0.00%
Total Long Term Rating 134,638,357.39$ 100.00%
Total Portfolio 134,638,357.39$ 100.00%
City of Cape Coral 1-3 Year Rating Distribution Market Value Basis as of March 31, 2019
AAA Rating1.13%
AA Rating93.63%
A Rating5.24%
Portfolio Allocation By Standard and Poors' Rating
Aaa Rating83.34%
Aa Rating11.79%
A Rating4.87%
Portfolio Allocation By Moody's Rating
Page 6
Security Distribution
January 1, 2019
Beginning Balance
Portfolio
Allocation
March 31, 2019
Ending Balance Book Yield
Portfolio
Allocation
Change in
Allocation
Permitted by
Policy* Compliant
Cash -$ 0.00% -$ 0.00% 0.00% 0.00% YES
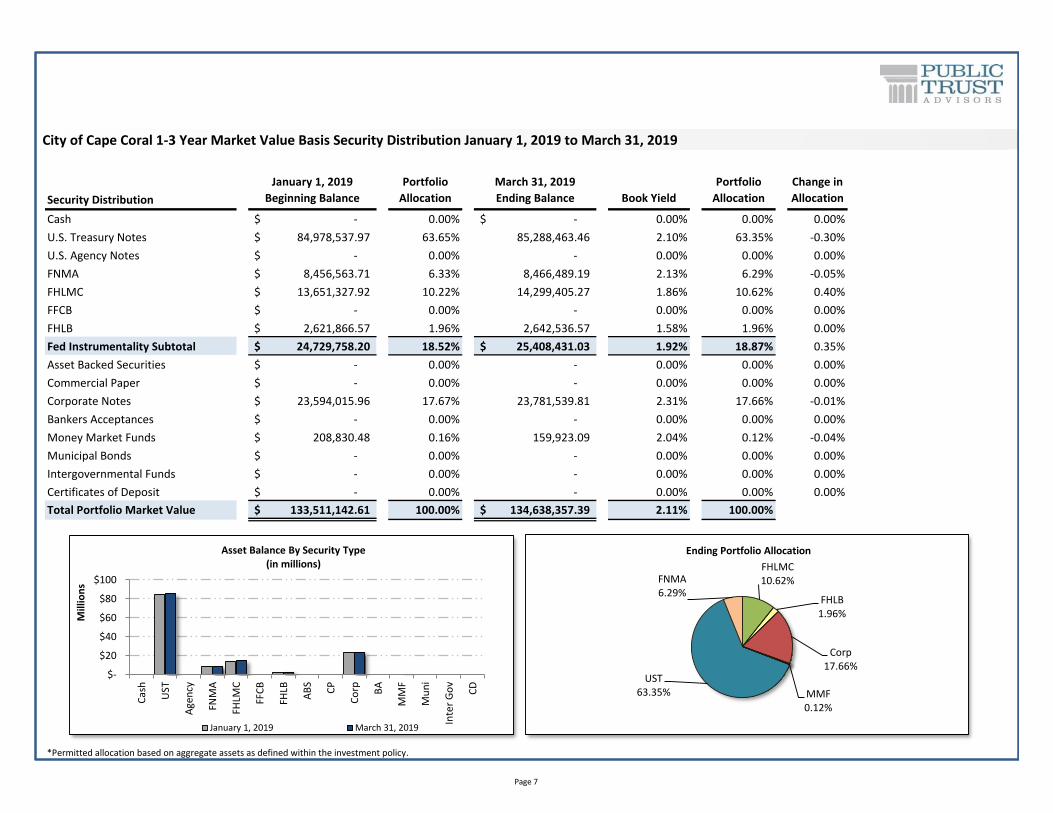
U.S. Treasury Notes 84,978,537.97$ 63.65% 85,288,463.46 2.10% 63.35% -0.30% NO
U.S. Agency Notes -$ 0.00% - 0.00% 0.00% 0.00% YES
FNMA 8,456,563.71$ 6.33% 8,466,489.19 2.13% 6.29% -0.05% NO
FHLMC 13,651,327.92$ 10.22% 14,299,405.27 1.86% 10.62% 0.40% NO
FFCB -$ 0.00% - 0.00% 0.00% 0.00% YES
FHLB 2,621,866.57$ 1.96% 2,642,536.57 1.58% 1.96% 0.00% NO
Fed Instrumentality Subtotal 24,729,758.20$ 18.52% 25,408,431.03$ 1.92% 18.87% 0.35% NO
Asset Backed Securities -$ 0.00% - 0.00% 0.00% 0.00% YES
Commercial Paper -$ 0.00% - 0.00% 0.00% 0.00% YES
Corporate Notes 23,594,015.96$ 17.67% 23,781,539.81 2.31% 17.66% -0.01% NO
Bankers Acceptances -$ 0.00% - 0.00% 0.00% 0.00% YES
Money Market Funds 208,830.48$ 0.16% 159,923.09 2.04% 0.12% -0.04% YES
Municipal Bonds -$ 0.00% - 0.00% 0.00% 0.00% YES
Intergovernmental Funds -$ 0.00% - 0.00% 0.00% 0.00% YES
Certificates of Deposit -$ 0.00% - 0.00% 0.00% 0.00% YES
Total Portfolio Market Value 133,511,142.61$ 100.00% 134,638,357.39$ 2.11% 100.00%
*Permitted allocation based on aggregate assets as defined within the investment policy.
City of Cape Coral 1-3 Year Market Value Basis Security Distribution January 1, 2019 to March 31, 2019
$-
$20
$40
$60
$80
$100
Cas
h
UST
Age
ncy
FNM
A
FHLM
C
FFC
B
FHLB
AB
S
CP
Co
rp BA
MM
F
Mu
ni
Inte
r G
ov
CD
Mill
ion
s
Asset Balance By Security Type(in millions)
January 1, 2019 March 31, 2019
UST63.35%
FNMA6.29%
FHLMC10.62%
FHLB1.96%
Corp17.66%
MMF0.12%
Ending Portfolio Allocation
Page 7
Security Distribution
January 1, 2019
Beginning Balance
Portfolio
Allocation
March 31, 2019
Ending Balance Book Yield
Portfolio
Allocation
Change in
Allocation
Permitted by
Policy* Compliant
Cash -$ 0.00% -$ 0.00% 0.00% 0.00% YES
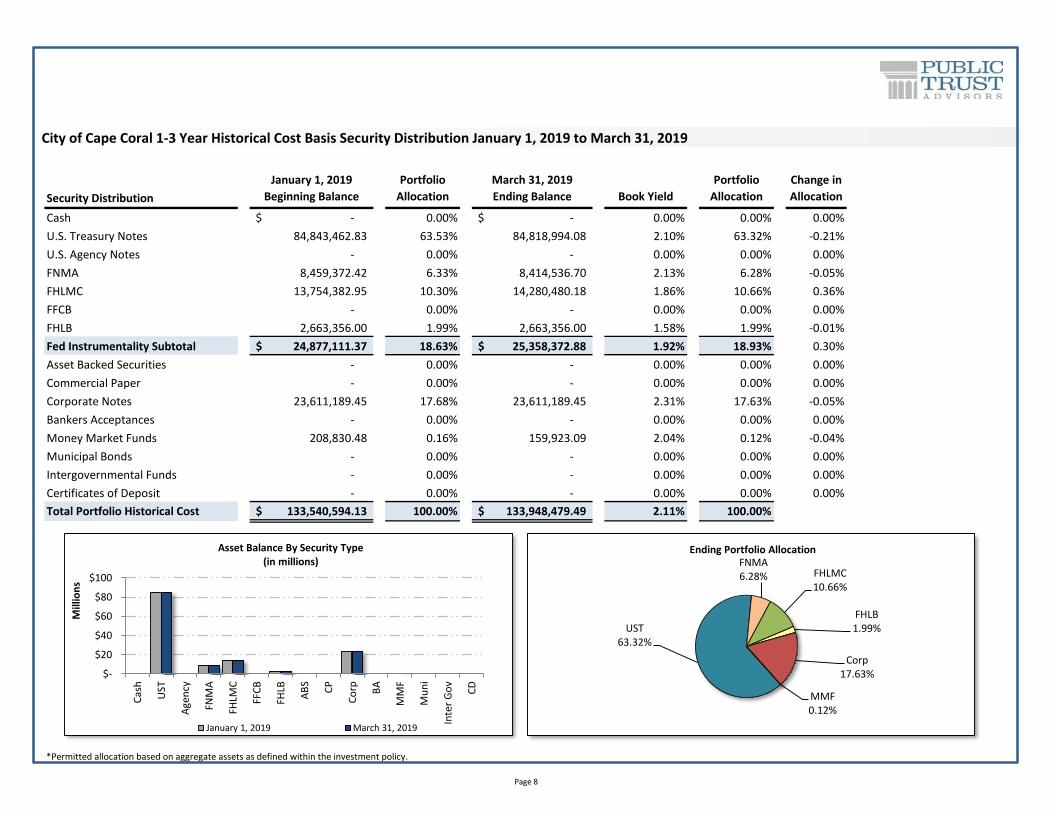
U.S. Treasury Notes 84,843,462.83 63.53% 84,818,994.08 2.10% 63.32% -0.21% NO
U.S. Agency Notes - 0.00% - 0.00% 0.00% 0.00% YES
FNMA 8,459,372.42 6.33% 8,414,536.70 2.13% 6.28% -0.05% NO
FHLMC 13,754,382.95 10.30% 14,280,480.18 1.86% 10.66% 0.36% NO
FFCB - 0.00% - 0.00% 0.00% 0.00% YES
FHLB 2,663,356.00 1.99% 2,663,356.00 1.58% 1.99% -0.01% NO
Fed Instrumentality Subtotal 24,877,111.37$ 18.63% 25,358,372.88$ 1.92% 18.93% 0.30% NO
Asset Backed Securities - 0.00% - 0.00% 0.00% 0.00% YES
Commercial Paper - 0.00% - 0.00% 0.00% 0.00% YES
Corporate Notes 23,611,189.45 17.68% 23,611,189.45 2.31% 17.63% -0.05% NO
Bankers Acceptances - 0.00% - 0.00% 0.00% 0.00% YES
Money Market Funds 208,830.48 0.16% 159,923.09 2.04% 0.12% -0.04% YES
Municipal Bonds - 0.00% - 0.00% 0.00% 0.00% YES
Intergovernmental Funds - 0.00% - 0.00% 0.00% 0.00% YES
Certificates of Deposit - 0.00% - 0.00% 0.00% 0.00% YES
Total Portfolio Historical Cost 133,540,594.13$ 100.00% 133,948,479.49$ 2.11% 100.00%
*Permitted allocation based on aggregate assets as defined within the investment policy.
City of Cape Coral 1-3 Year Historical Cost Basis Security Distribution January 1, 2019 to March 31, 2019
$-
$20
$40
$60
$80
$100
Cas
h
UST
Age
ncy
FNM
A
FHLM
C
FFC
B
FHLB
AB
S
CP
Co
rp BA
MM
F
Mu
ni
Inte
r G
ov
CD
Mill
ion
s
Asset Balance By Security Type(in millions)
January 1, 2019 March 31, 2019
UST63.32%
FNMA6.28% FHLMC
10.66%
FHLB1.99%
Corp17.63%
MMF0.12%
Ending Portfolio Allocation
Page 8
Additional Disclosure
This statement is for general information purposes only and is not intended to provide specific advice or recommendations. Please review the contents of this statement carefully. Should you have any questions regarding the information presented, calculation methodology, investment portfolio or security detail, or any other facet of your statement, please feel free to contact us.
Public Trust Advisor’s monthly statement is intended to detail our investment advisory activity as well as the activity of any accounts held by clients in pools that are managed by Public Trust Advisors. The custodian bank maintains the control of assets and executes and settles all investments transactions. The custodian statement is the official record of security and cash holdings transactions. Public Trust Advisors recognizes that clients may use these reports to facilitate record keeping; therefore the custodian bank statement and the Public Trust Advisors statement should be reconciled and differences resolved. Many custodians use a settlement date basis which may result in the need to reconcile due to a timing difference. Please contact your relationship manager or our toll free number 855-395-3954 with questions regarding your account.
Public Trust Advisors does not have the authority to withdraw funds from or deposit funds to the custodian. Our clients retain responsibility for their internal accounting policies; implementing and enforcing internal controls and generating ledger entries or otherwise recording transactions.
Pricing sources from our reporting platform are provided by Clearwater reporting platform and are established by Clearwater’s internal pricing procedures. Clearwater utilizes a hierarchical pricing model which starts with one of the industry’s pricing sources, S&P Capital IQ. Securities with short maturities and infrequent secondary market trades are typically priced via mathematical calculations. The Securities in this investment portfolio, including shares of mutual funds, are not guaranteed or otherwise protected by Public trust Advisors, the FDIC (except for certain non-negotiable certificates of deposit) or any government agency, unless otherwise specifically stated. Investment in fixed income securities involves risks, including the possible loss of the amount invested.
Past performance is not an indication of future performance.
Beginning and Ending Balances based on Market Value plus Accrued Interest on a Trade Date basis.
Public Trust Advisors is an investment advisor registered with the Securities and Exchange Commission, and is required to maintain a written disclosure statement of our background and business experience. If you would like to receive a copy of our current disclosure statement, privacy policy, or code of ethics please contact Service Operations at the address below.
Public Trust Advisors717 17th Street, Suite 1850Denver, CO 80202
Page 9
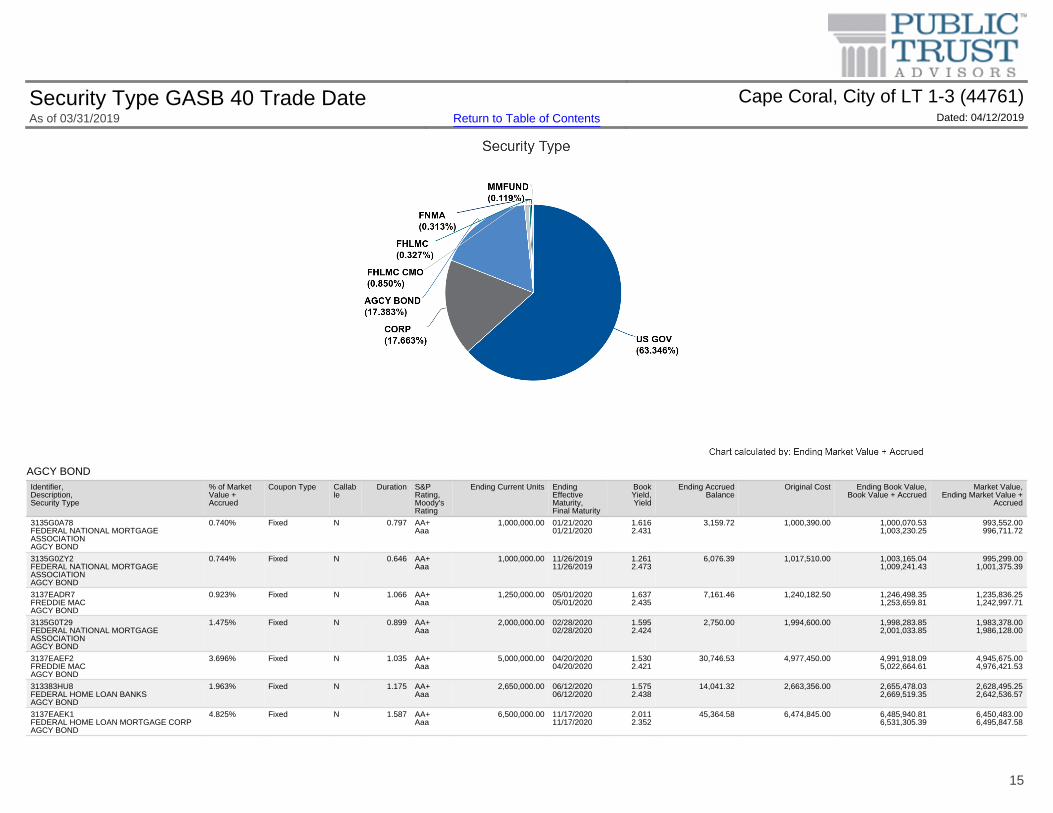
AGCY BONDIdentifier,Description,Security Type
% of MarketValue +Accrued
Coupon Type Callable
Duration S&PRating,Moody'sRating
Ending Current Units EndingEffectiveMaturity,Final Maturity
BookYield,Yield
Ending AccruedBalance
Original Cost Ending Book Value,Book Value + Accrued
Market Value,Ending Market Value +
Accrued
3135G0A78FEDERAL NATIONAL MORTGAGEASSOCIATIONAGCY BOND
0.740% Fixed N 0.797 AA+Aaa
1,000,000.00 01/21/202001/21/2020
1.6162.431
3,159.72 1,000,390.00 1,000,070.531,003,230.25
993,552.00996,711.72
3135G0ZY2FEDERAL NATIONAL MORTGAGEASSOCIATIONAGCY BOND
0.744% Fixed N 0.646 AA+Aaa
1,000,000.00 11/26/201911/26/2019
1.2612.473
6,076.39 1,017,510.00 1,003,165.041,009,241.43
995,299.001,001,375.39
3137EADR7FREDDIE MACAGCY BOND
0.923% Fixed N 1.066 AA+Aaa
1,250,000.00 05/01/202005/01/2020
1.6372.435
7,161.46 1,240,182.50 1,246,498.351,253,659.81
1,235,836.251,242,997.71
3135G0T29FEDERAL NATIONAL MORTGAGEASSOCIATIONAGCY BOND
1.475% Fixed N 0.899 AA+Aaa
2,000,000.00 02/28/202002/28/2020
1.5952.424
2,750.00 1,994,600.00 1,998,283.852,001,033.85
1,983,378.001,986,128.00
3137EAEF2FREDDIE MACAGCY BOND
3.696% Fixed N 1.035 AA+Aaa
5,000,000.00 04/20/202004/20/2020
1.5302.421
30,746.53 4,977,450.00 4,991,918.095,022,664.61
4,945,675.004,976,421.53
313383HU8FEDERAL HOME LOAN BANKSAGCY BOND
1.963% Fixed N 1.175 AA+Aaa
2,650,000.00 06/12/202006/12/2020
1.5752.438
14,041.32 2,663,356.00 2,655,478.032,669,519.35
2,628,495.252,642,536.57
3137EAEK1FEDERAL HOME LOAN MORTGAGE CORPAGCY BOND
4.825% Fixed N 1.587 AA+Aaa
6,500,000.00 11/17/202011/17/2020
2.0112.352
45,364.58 6,474,845.00 6,485,940.816,531,305.39
6,450,483.006,495,847.58
Security Type GASB 40 Trade Date Cape Coral, City of LT 1-3 (44761)As of 03/31/2019 Return to Table of Contents Dated: 04/12/2019
15
CORP
Identifier,Description,Security Type
% of MarketValue +Accrued
Coupon Type Callable
Duration S&PRating,Moody'sRating
Ending Current Units EndingEffectiveMaturity,Final Maturity
BookYield,Yield
Ending AccruedBalance
Original Cost Ending Book Value,Book Value + Accrued
Market Value,Ending Market Value +
Accrued
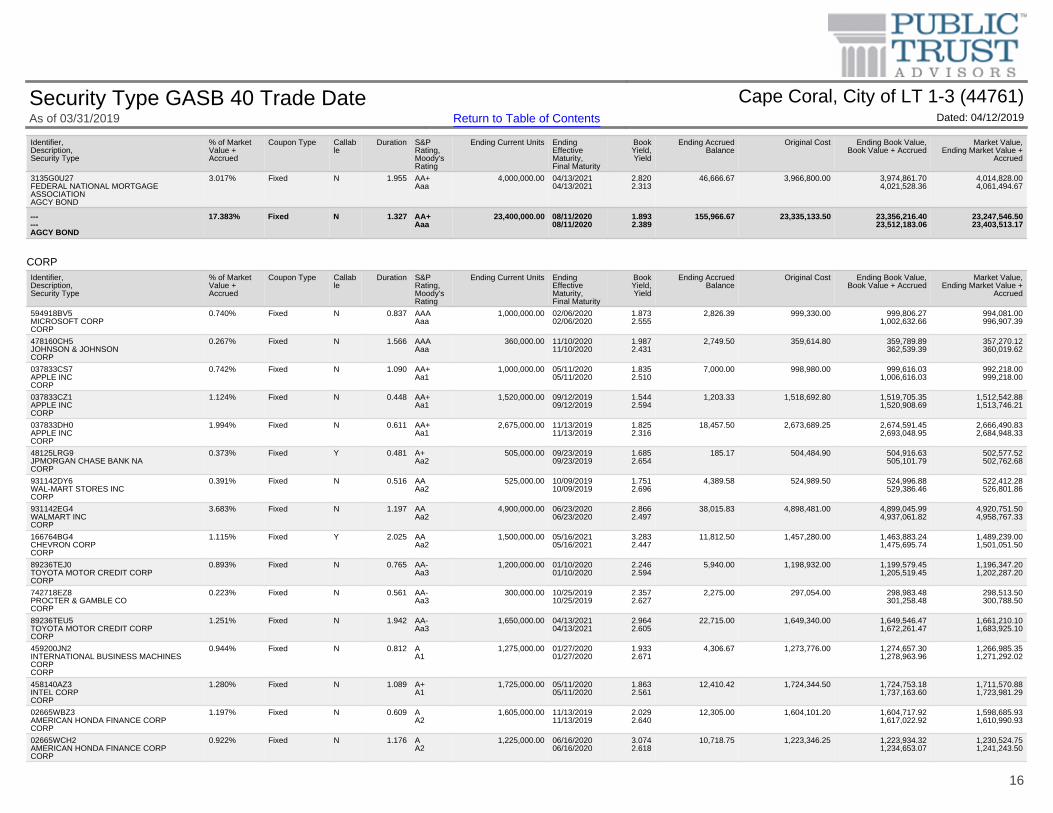
3135G0U27FEDERAL NATIONAL MORTGAGEASSOCIATIONAGCY BOND
3.017% Fixed N 1.955 AA+Aaa
4,000,000.00 04/13/202104/13/2021
2.8202.313
46,666.67 3,966,800.00 3,974,861.704,021,528.36
4,014,828.004,061,494.67
------AGCY BOND
17.383% Fixed N 1.327 AA+Aaa
23,400,000.00 08/11/202008/11/2020
1.8932.389
155,966.67 23,335,133.50 23,356,216.4023,512,183.06
23,247,546.5023,403,513.17
Identifier,Description,Security Type
% of MarketValue +Accrued
Coupon Type Callable
Duration S&PRating,Moody'sRating
Ending Current Units EndingEffectiveMaturity,Final Maturity
BookYield,Yield
Ending AccruedBalance
Original Cost Ending Book Value,Book Value + Accrued
Market Value,Ending Market Value +
Accrued
594918BV5MICROSOFT CORPCORP
0.740% Fixed N 0.837 AAAAaa
1,000,000.00 02/06/202002/06/2020
1.8732.555
2,826.39 999,330.00 999,806.271,002,632.66
994,081.00996,907.39
478160CH5JOHNSON & JOHNSONCORP
0.267% Fixed N 1.566 AAAAaa
360,000.00 11/10/202011/10/2020
1.9872.431
2,749.50 359,614.80 359,789.89362,539.39
357,270.12360,019.62
037833CS7APPLE INCCORP
0.742% Fixed N 1.090 AA+Aa1
1,000,000.00 05/11/202005/11/2020
1.8352.510
7,000.00 998,980.00 999,616.031,006,616.03
992,218.00999,218.00
037833CZ1APPLE INCCORP
1.124% Fixed N 0.448 AA+Aa1
1,520,000.00 09/12/201909/12/2019
1.5442.594
1,203.33 1,518,692.80 1,519,705.351,520,908.69
1,512,542.881,513,746.21
037833DH0APPLE INCCORP
1.994% Fixed N 0.611 AA+Aa1
2,675,000.00 11/13/201911/13/2019
1.8252.316
18,457.50 2,673,689.25 2,674,591.452,693,048.95
2,666,490.832,684,948.33
48125LRG9JPMORGAN CHASE BANK NACORP
0.373% Fixed Y 0.481 A+Aa2
505,000.00 09/23/201909/23/2019
1.6852.654
185.17 504,484.90 504,916.63505,101.79
502,577.52502,762.68
931142DY6WAL-MART STORES INCCORP
0.391% Fixed N 0.516 AAAa2
525,000.00 10/09/201910/09/2019
1.7512.696
4,389.58 524,989.50 524,996.88529,386.46
522,412.28526,801.86
931142EG4WALMART INCCORP
3.683% Fixed N 1.197 AAAa2
4,900,000.00 06/23/202006/23/2020
2.8662.497
38,015.83 4,898,481.00 4,899,045.994,937,061.82
4,920,751.504,958,767.33
166764BG4CHEVRON CORPCORP
1.115% Fixed Y 2.025 AAAa2
1,500,000.00 05/16/202105/16/2021
3.2832.447
11,812.50 1,457,280.00 1,463,883.241,475,695.74
1,489,239.001,501,051.50
89236TEJ0TOYOTA MOTOR CREDIT CORPCORP
0.893% Fixed N 0.765 AA-Aa3
1,200,000.00 01/10/202001/10/2020
2.2462.594
5,940.00 1,198,932.00 1,199,579.451,205,519.45
1,196,347.201,202,287.20
742718EZ8PROCTER & GAMBLE COCORP
0.223% Fixed N 0.561 AA-Aa3
300,000.00 10/25/201910/25/2019
2.3572.627
2,275.00 297,054.00 298,983.48301,258.48
298,513.50300,788.50
89236TEU5TOYOTA MOTOR CREDIT CORPCORP
1.251% Fixed N 1.942 AA-Aa3
1,650,000.00 04/13/202104/13/2021
2.9642.605
22,715.00 1,649,340.00 1,649,546.471,672,261.47
1,661,210.101,683,925.10
459200JN2INTERNATIONAL BUSINESS MACHINESCORPCORP
0.944% Fixed N 0.812 AA1
1,275,000.00 01/27/202001/27/2020
1.9332.671
4,306.67 1,273,776.00 1,274,657.301,278,963.96
1,266,985.351,271,292.02
458140AZ3INTEL CORPCORP
1.280% Fixed N 1.089 A+A1
1,725,000.00 05/11/202005/11/2020
1.8632.561
12,410.42 1,724,344.50 1,724,753.181,737,163.60
1,711,570.881,723,981.29
02665WBZ3AMERICAN HONDA FINANCE CORPCORP
1.197% Fixed N 0.609 AA2
1,605,000.00 11/13/201911/13/2019
2.0292.640
12,305.00 1,604,101.20 1,604,717.921,617,022.92
1,598,685.931,610,990.93
02665WCH2AMERICAN HONDA FINANCE CORPCORP
0.922% Fixed N 1.176 AA2
1,225,000.00 06/16/202006/16/2020
3.0742.618
10,718.75 1,223,346.25 1,223,934.321,234,653.07
1,230,524.751,241,243.50
Security Type GASB 40 Trade Date Cape Coral, City of LT 1-3 (44761)As of 03/31/2019 Return to Table of Contents Dated: 04/12/2019
16
FHLMC
FHLMC CMO
FNMA
MMFUND
Identifier,Description,Security Type
% of MarketValue +Accrued
Coupon Type Callable
Duration S&PRating,Moody'sRating
Ending Current Units EndingEffectiveMaturity,Final Maturity
BookYield,Yield
Ending AccruedBalance
Original Cost Ending Book Value,Book Value + Accrued
Market Value,Ending Market Value +
Accrued
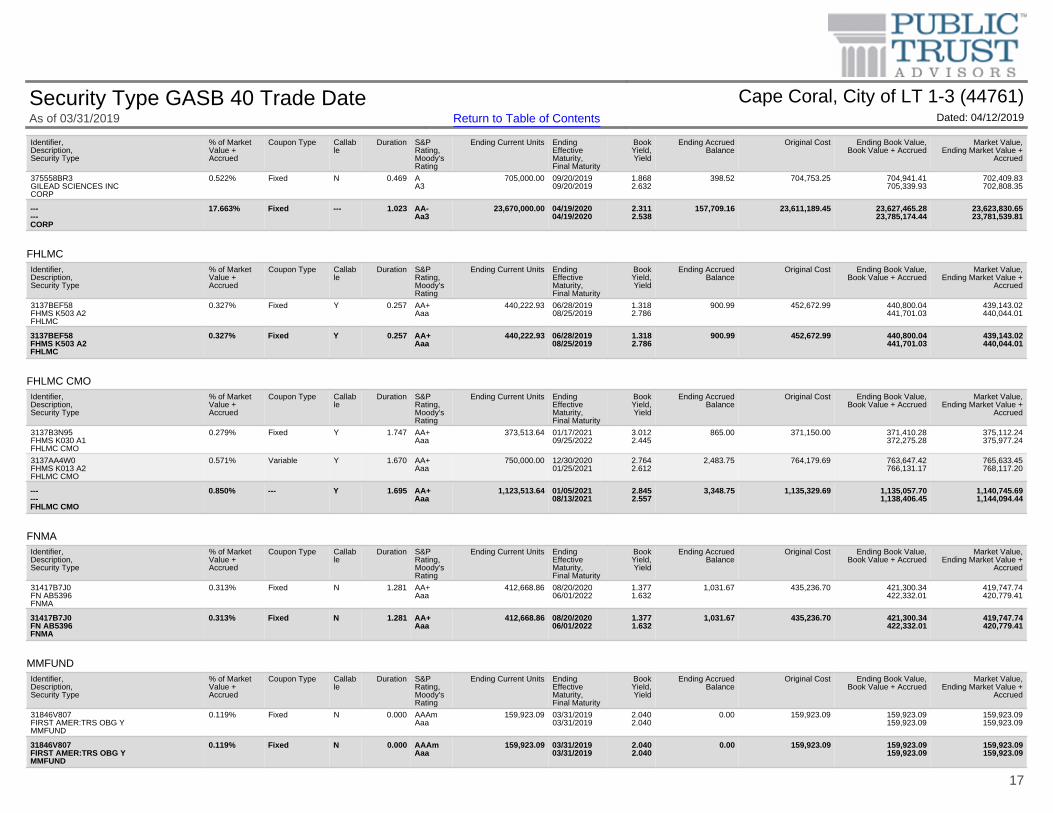
375558BR3GILEAD SCIENCES INCCORP
0.522% Fixed N 0.469 AA3
705,000.00 09/20/201909/20/2019
1.8682.632
398.52 704,753.25 704,941.41705,339.93
702,409.83702,808.35
------CORP
17.663% Fixed --- 1.023 AA-Aa3
23,670,000.00 04/19/202004/19/2020
2.3112.538
157,709.16 23,611,189.45 23,627,465.2823,785,174.44
23,623,830.6523,781,539.81
Identifier,Description,Security Type
% of MarketValue +Accrued
Coupon Type Callable
Duration S&PRating,Moody'sRating
Ending Current Units EndingEffectiveMaturity,Final Maturity
BookYield,Yield
Ending AccruedBalance
Original Cost Ending Book Value,Book Value + Accrued
Market Value,Ending Market Value +
Accrued
3137BEF58FHMS K503 A2FHLMC
0.327% Fixed Y 0.257 AA+Aaa
440,222.93 06/28/201908/25/2019
1.3182.786
900.99 452,672.99 440,800.04441,701.03
439,143.02440,044.01
3137BEF58FHMS K503 A2FHLMC
0.327% Fixed Y 0.257 AA+Aaa
440,222.93 06/28/201908/25/2019
1.3182.786
900.99 452,672.99 440,800.04441,701.03
439,143.02440,044.01
Identifier,Description,Security Type
% of MarketValue +Accrued
Coupon Type Callable
Duration S&PRating,Moody'sRating
Ending Current Units EndingEffectiveMaturity,Final Maturity
BookYield,Yield
Ending AccruedBalance
Original Cost Ending Book Value,Book Value + Accrued
Market Value,Ending Market Value +
Accrued
3137B3N95FHMS K030 A1FHLMC CMO
0.279% Fixed Y 1.747 AA+Aaa
373,513.64 01/17/202109/25/2022
3.0122.445
865.00 371,150.00 371,410.28372,275.28
375,112.24375,977.24
3137AA4W0FHMS K013 A2FHLMC CMO
0.571% Variable Y 1.670 AA+Aaa
750,000.00 12/30/202001/25/2021
2.7642.612
2,483.75 764,179.69 763,647.42766,131.17
765,633.45768,117.20
------FHLMC CMO
0.850% --- Y 1.695 AA+Aaa
1,123,513.64 01/05/202108/13/2021
2.8452.557
3,348.75 1,135,329.69 1,135,057.701,138,406.45
1,140,745.691,144,094.44
Identifier,Description,Security Type
% of MarketValue +Accrued
Coupon Type Callable
Duration S&PRating,Moody'sRating
Ending Current Units EndingEffectiveMaturity,Final Maturity
BookYield,Yield
Ending AccruedBalance
Original Cost Ending Book Value,Book Value + Accrued
Market Value,Ending Market Value +
Accrued
31417B7J0FN AB5396FNMA
0.313% Fixed N 1.281 AA+Aaa
412,668.86 08/20/202006/01/2022
1.3771.632
1,031.67 435,236.70 421,300.34422,332.01
419,747.74420,779.41
31417B7J0FN AB5396FNMA
0.313% Fixed N 1.281 AA+Aaa
412,668.86 08/20/202006/01/2022
1.3771.632
1,031.67 435,236.70 421,300.34422,332.01
419,747.74420,779.41
Identifier,Description,Security Type
% of MarketValue +Accrued
Coupon Type Callable
Duration S&PRating,Moody'sRating
Ending Current Units EndingEffectiveMaturity,Final Maturity
BookYield,Yield
Ending AccruedBalance
Original Cost Ending Book Value,Book Value + Accrued
Market Value,Ending Market Value +
Accrued
31846V807FIRST AMER:TRS OBG YMMFUND
0.119% Fixed N 0.000 AAAmAaa
159,923.09 03/31/201903/31/2019
2.0402.040
0.00 159,923.09 159,923.09159,923.09
159,923.09159,923.09
31846V807FIRST AMER:TRS OBG YMMFUND
0.119% Fixed N 0.000 AAAmAaa
159,923.09 03/31/201903/31/2019
2.0402.040
0.00 159,923.09 159,923.09159,923.09
159,923.09159,923.09
Security Type GASB 40 Trade Date Cape Coral, City of LT 1-3 (44761)As of 03/31/2019 Return to Table of Contents Dated: 04/12/2019
17
US GOVIdentifier,Description,Security Type
% of MarketValue +Accrued
Coupon Type Callable
Duration S&PRating,Moody'sRating
Ending Current Units EndingEffectiveMaturity,Final Maturity
BookYield,Yield
Ending AccruedBalance
Original Cost Ending Book Value,Book Value + Accrued
Market Value,Ending Market Value +
Accrued
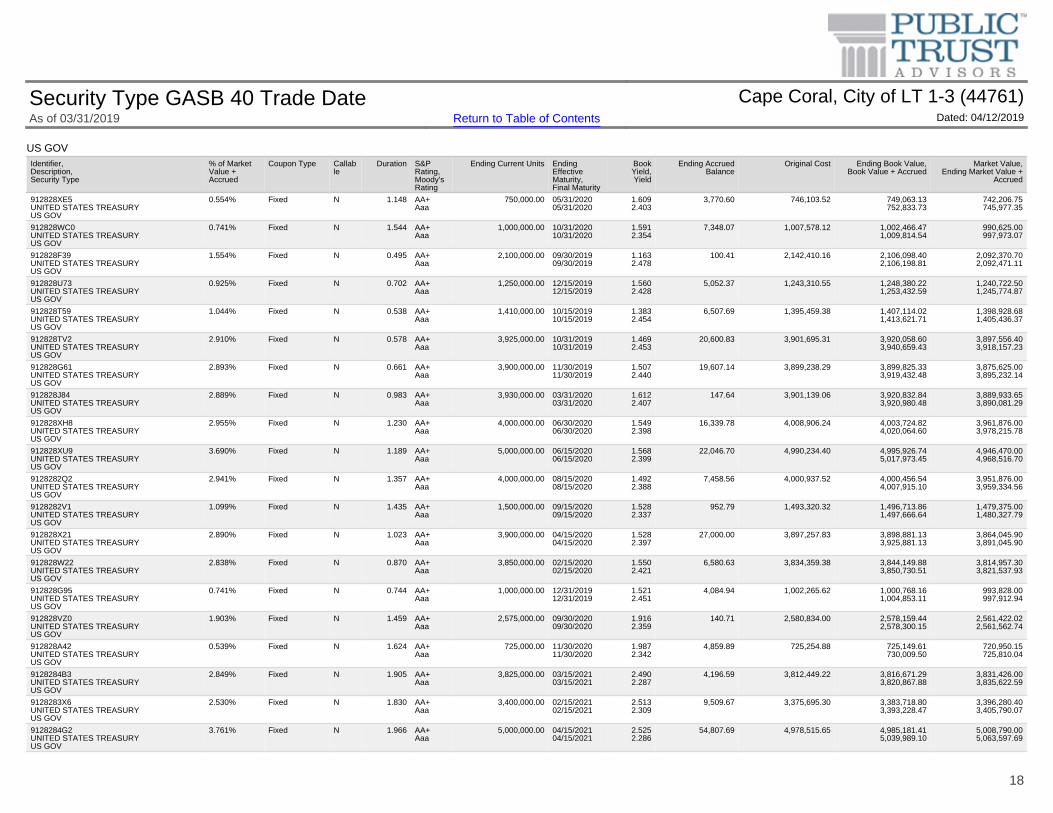
912828XE5UNITED STATES TREASURYUS GOV
0.554% Fixed N 1.148 AA+Aaa
750,000.00 05/31/202005/31/2020
1.6092.403
3,770.60 746,103.52 749,063.13752,833.73
742,206.75745,977.35
912828WC0UNITED STATES TREASURYUS GOV
0.741% Fixed N 1.544 AA+Aaa
1,000,000.00 10/31/202010/31/2020
1.5912.354
7,348.07 1,007,578.12 1,002,466.471,009,814.54
990,625.00997,973.07
912828F39UNITED STATES TREASURYUS GOV
1.554% Fixed N 0.495 AA+Aaa
2,100,000.00 09/30/201909/30/2019
1.1632.478
100.41 2,142,410.16 2,106,098.402,106,198.81
2,092,370.702,092,471.11
912828U73UNITED STATES TREASURYUS GOV
0.925% Fixed N 0.702 AA+Aaa
1,250,000.00 12/15/201912/15/2019
1.5602.428
5,052.37 1,243,310.55 1,248,380.221,253,432.59
1,240,722.501,245,774.87
912828T59UNITED STATES TREASURYUS GOV
1.044% Fixed N 0.538 AA+Aaa
1,410,000.00 10/15/201910/15/2019
1.3832.454
6,507.69 1,395,459.38 1,407,114.021,413,621.71
1,398,928.681,405,436.37
912828TV2UNITED STATES TREASURYUS GOV
2.910% Fixed N 0.578 AA+Aaa
3,925,000.00 10/31/201910/31/2019
1.4692.453
20,600.83 3,901,695.31 3,920,058.603,940,659.43
3,897,556.403,918,157.23
912828G61UNITED STATES TREASURYUS GOV
2.893% Fixed N 0.661 AA+Aaa
3,900,000.00 11/30/201911/30/2019
1.5072.440
19,607.14 3,899,238.29 3,899,825.333,919,432.48
3,875,625.003,895,232.14
912828J84UNITED STATES TREASURYUS GOV
2.889% Fixed N 0.983 AA+Aaa
3,930,000.00 03/31/202003/31/2020
1.6122.407
147.64 3,901,139.06 3,920,832.843,920,980.48
3,889,933.653,890,081.29
912828XH8UNITED STATES TREASURYUS GOV
2.955% Fixed N 1.230 AA+Aaa
4,000,000.00 06/30/202006/30/2020
1.5492.398
16,339.78 4,008,906.24 4,003,724.824,020,064.60
3,961,876.003,978,215.78
912828XU9UNITED STATES TREASURYUS GOV
3.690% Fixed N 1.189 AA+Aaa
5,000,000.00 06/15/202006/15/2020
1.5682.399
22,046.70 4,990,234.40 4,995,926.745,017,973.45
4,946,470.004,968,516.70
9128282Q2UNITED STATES TREASURYUS GOV
2.941% Fixed N 1.357 AA+Aaa
4,000,000.00 08/15/202008/15/2020
1.4922.388
7,458.56 4,000,937.52 4,000,456.544,007,915.10
3,951,876.003,959,334.56
9128282V1UNITED STATES TREASURYUS GOV
1.099% Fixed N 1.435 AA+Aaa
1,500,000.00 09/15/202009/15/2020
1.5282.337
952.79 1,493,320.32 1,496,713.861,497,666.64
1,479,375.001,480,327.79
912828X21UNITED STATES TREASURYUS GOV
2.890% Fixed N 1.023 AA+Aaa
3,900,000.00 04/15/202004/15/2020
1.5282.397
27,000.00 3,897,257.83 3,898,881.133,925,881.13
3,864,045.903,891,045.90
912828W22UNITED STATES TREASURYUS GOV
2.838% Fixed N 0.870 AA+Aaa
3,850,000.00 02/15/202002/15/2020
1.5502.421
6,580.63 3,834,359.38 3,844,149.883,850,730.51
3,814,957.303,821,537.93
912828G95UNITED STATES TREASURYUS GOV
0.741% Fixed N 0.744 AA+Aaa
1,000,000.00 12/31/201912/31/2019
1.5212.451
4,084.94 1,002,265.62 1,000,768.161,004,853.11
993,828.00997,912.94
912828VZ0UNITED STATES TREASURYUS GOV
1.903% Fixed N 1.459 AA+Aaa
2,575,000.00 09/30/202009/30/2020
1.9162.359
140.71 2,580,834.00 2,578,159.442,578,300.15
2,561,422.022,561,562.74
912828A42UNITED STATES TREASURYUS GOV
0.539% Fixed N 1.624 AA+Aaa
725,000.00 11/30/202011/30/2020
1.9872.342
4,859.89 725,254.88 725,149.61730,009.50
720,950.15725,810.04
9128284B3UNITED STATES TREASURYUS GOV
2.849% Fixed N 1.905 AA+Aaa
3,825,000.00 03/15/202103/15/2021
2.4902.287
4,196.59 3,812,449.22 3,816,671.293,820,867.88
3,831,426.003,835,622.59
9128283X6UNITED STATES TREASURYUS GOV
2.530% Fixed N 1.830 AA+Aaa
3,400,000.00 02/15/202102/15/2021
2.5132.309
9,509.67 3,375,695.30 3,383,718.803,393,228.47
3,396,280.403,405,790.07
9128284G2UNITED STATES TREASURYUS GOV
3.761% Fixed N 1.966 AA+Aaa
5,000,000.00 04/15/202104/15/2021
2.5252.286
54,807.69 4,978,515.65 4,985,181.415,039,989.10
5,008,790.005,063,597.69
Security Type GASB 40 Trade Date Cape Coral, City of LT 1-3 (44761)As of 03/31/2019 Return to Table of Contents Dated: 04/12/2019
18
Summary
* Grouped by: Security Type. * Groups Sorted by: Security Type. * Filtered By: Description ≠ "Payable" and Description ≠ "Receivable". * Weighted by: Ending Market Value + Accrued, except Book Yield by Base Book Value + Accrued.
Identifier,Description,Security Type
% of MarketValue +Accrued
Coupon Type Callable
Duration S&PRating,Moody'sRating
Ending Current Units EndingEffectiveMaturity,Final Maturity
BookYield,Yield
Ending AccruedBalance
Original Cost Ending Book Value,Book Value + Accrued
Market Value,Ending Market Value +
Accrued
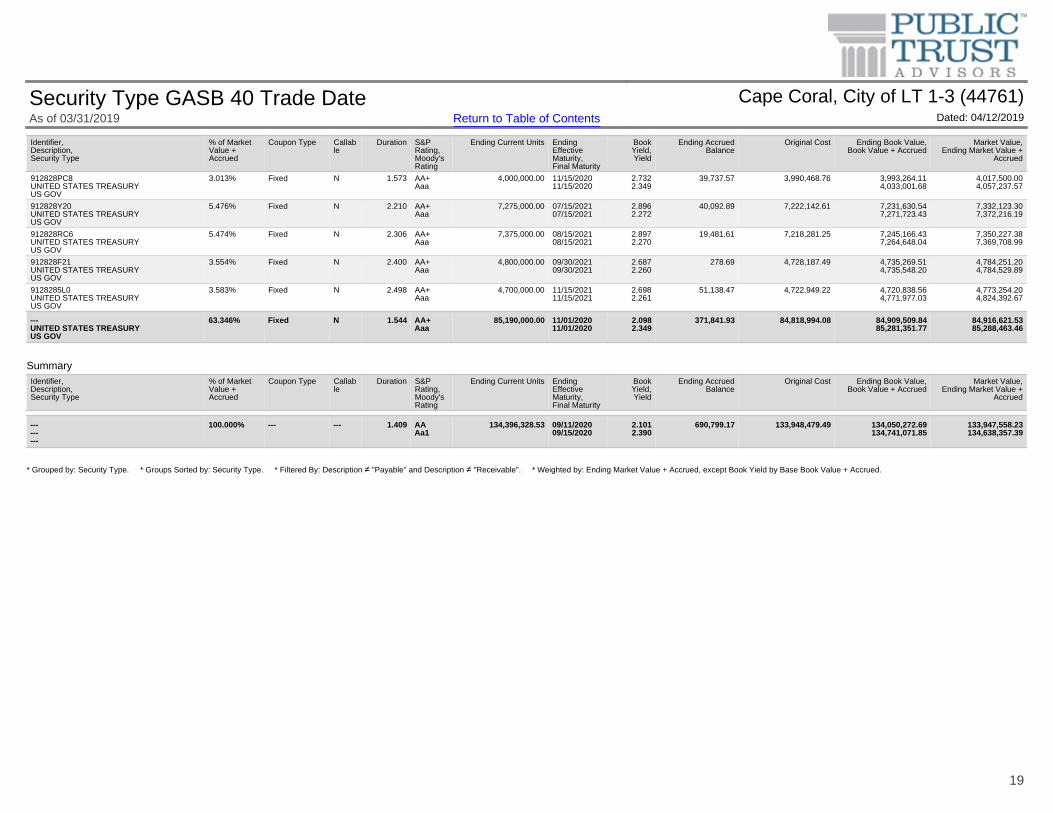
912828PC8UNITED STATES TREASURYUS GOV
3.013% Fixed N 1.573 AA+Aaa
4,000,000.00 11/15/202011/15/2020
2.7322.349
39,737.57 3,990,468.76 3,993,264.114,033,001.68
4,017,500.004,057,237.57
912828Y20UNITED STATES TREASURYUS GOV
5.476% Fixed N 2.210 AA+Aaa
7,275,000.00 07/15/202107/15/2021
2.8962.272
40,092.89 7,222,142.61 7,231,630.547,271,723.43
7,332,123.307,372,216.19
912828RC6UNITED STATES TREASURYUS GOV
5.474% Fixed N 2.306 AA+Aaa
7,375,000.00 08/15/202108/15/2021
2.8972.270
19,481.61 7,218,281.25 7,245,166.437,264,648.04
7,350,227.387,369,708.99
912828F21UNITED STATES TREASURYUS GOV
3.554% Fixed N 2.400 AA+Aaa
4,800,000.00 09/30/202109/30/2021
2.6872.260
278.69 4,728,187.49 4,735,269.514,735,548.20
4,784,251.204,784,529.89
9128285L0UNITED STATES TREASURYUS GOV
3.583% Fixed N 2.498 AA+Aaa
4,700,000.00 11/15/202111/15/2021
2.6982.261
51,138.47 4,722,949.22 4,720,838.564,771,977.03
4,773,254.204,824,392.67
---UNITED STATES TREASURYUS GOV
63.346% Fixed N 1.544 AA+Aaa
85,190,000.00 11/01/202011/01/2020
2.0982.349
371,841.93 84,818,994.08 84,909,509.8485,281,351.77
84,916,621.5385,288,463.46
Identifier,Description,Security Type
% of MarketValue +Accrued
Coupon Type Callable
Duration S&PRating,Moody'sRating
Ending Current Units EndingEffectiveMaturity,Final Maturity
BookYield,Yield
Ending AccruedBalance
Original Cost Ending Book Value,Book Value + Accrued
Market Value,Ending Market Value +
Accrued
---------
100.000% --- --- 1.409 AAAa1
134,396,328.53 09/11/202009/15/2020
2.1012.390
690,799.17 133,948,479.49 134,050,272.69134,741,071.85
133,947,558.23134,638,357.39
Security Type GASB 40 Trade Date Cape Coral, City of LT 1-3 (44761)As of 03/31/2019 Return to Table of Contents Dated: 04/12/2019
19
Identifier,Description,Security Type
Interest/Dividend
Received
Transfers In/Out Purchases PurchasedAccruedIncome
Sales Disposed Accrued Maturities andRedemptions
Paydowns Net RealizedGain/Loss
Beginning OriginalCost,
Ending Original Cost
Beginning MarketValue,
Ending Market Value
31846V807FIRST AMER:TRS OBG YMMFUND
2,374.10 0.00 710,363.06 0.00 -759,270.45 0.00 0.00 0.00 0.00 208,830.48159,923.09
208,830.48159,923.09
CCYUSDReceivableCASH
0.00 0.00 0.00 0.00 0.00 0.00 0.00 0.00 0.00 907.24122,516.37
907.24122,516.37
31417B7J0FN AB5396FNMA
3,308.77 0.00 0.00 0.00 0.00 0.00 0.00 -42,510.90 -937.36 480,072.42435,236.70
458,625.48419,747.74
3135G0A78FEDERAL NATIONAL MORTGAGEASSOCIATIONAGCY BOND
8,125.00 0.00 0.00 0.00 0.00 0.00 0.00 0.00 0.00 1,000,390.001,000,390.00
990,050.00993,552.00
912828XE5UNITED STATES TREASURYUS GOV
0.00 0.00 0.00 0.00 0.00 0.00 0.00 0.00 0.00 746,103.52746,103.52
738,982.50742,206.75
912828WC0UNITED STATES TREASURYUS GOV
0.00 0.00 0.00 0.00 0.00 0.00 0.00 0.00 0.00 1,007,578.121,007,578.12
986,330.00990,625.00
3135G0ZY2FEDERAL NATIONAL MORTGAGEASSOCIATIONAGCY BOND
0.00 0.00 0.00 0.00 0.00 0.00 0.00 0.00 0.00 1,017,510.001,017,510.00
991,950.00995,299.00
912828F39UNITED STATES TREASURYUS GOV
0.00 0.00 0.00 0.00 0.00 0.00 0.00 0.00 0.00 2,142,410.162,142,410.16
2,086,392.002,092,370.70
3137BEF58FHMS K503 A2FHLMC
3,344.12 0.00 0.00 0.00 0.00 0.00 0.00 -207,147.93 -674.13 665,679.33452,672.99
645,079.17439,143.02
48125LRG9JPMORGAN CHASE BANK NACORP
4,166.25 0.00 0.00 0.00 0.00 0.00 0.00 0.00 0.00 504,484.90504,484.90
500,354.00502,577.52
912828U73UNITED STATES TREASURYUS GOV
0.00 0.00 0.00 0.00 0.00 0.00 0.00 0.00 0.00 1,243,310.551,243,310.55
1,235,112.501,240,722.50
912828T59UNITED STATES TREASURYUS GOV
0.00 0.00 0.00 0.00 0.00 0.00 0.00 0.00 0.00 1,395,459.381,395,459.38
1,392,205.801,398,928.68
912828TV2UNITED STATES TREASURYUS GOV
0.00 0.00 0.00 0.00 0.00 0.00 0.00 0.00 0.00 3,901,695.313,901,695.31
3,880,686.753,897,556.40
912828G61UNITED STATES TREASURYUS GOV
0.00 0.00 0.00 0.00 0.00 0.00 0.00 0.00 0.00 3,899,238.293,899,238.29
3,859,791.003,875,625.00
912828J84UNITED STATES TREASURYUS GOV
0.00 0.00 0.00 0.00 0.00 0.00 0.00 0.00 0.00 3,901,139.063,901,139.06
3,872,268.303,889,933.65
459200JN2INTERNATIONAL BUSINESSMACHINES CORPCORP
12,112.50 0.00 0.00 0.00 0.00 0.00 0.00 0.00 0.00 1,273,776.001,273,776.00
1,260,490.501,266,985.35
594918BV5MICROSOFT CORPCORP
9,250.00 0.00 0.00 0.00 0.00 0.00 0.00 0.00 0.00 999,330.00999,330.00
992,740.00994,081.00
3137EADR7FREDDIE MACAGCY BOND
0.00 0.00 0.00 0.00 0.00 0.00 0.00 0.00 0.00 1,240,182.501,240,182.50
1,230,700.001,235,836.25
3135G0T29FEDERAL NATIONAL MORTGAGEASSOCIATIONAGCY BOND
15,000.00 0.00 0.00 0.00 0.00 0.00 0.00 0.00 0.00 1,994,600.001,994,600.00
1,977,240.001,983,378.00
3137EAEF2FREDDIE MACAGCY BOND
0.00 0.00 0.00 0.00 0.00 0.00 0.00 0.00 0.00 4,977,450.004,977,450.00
4,924,300.004,945,675.00
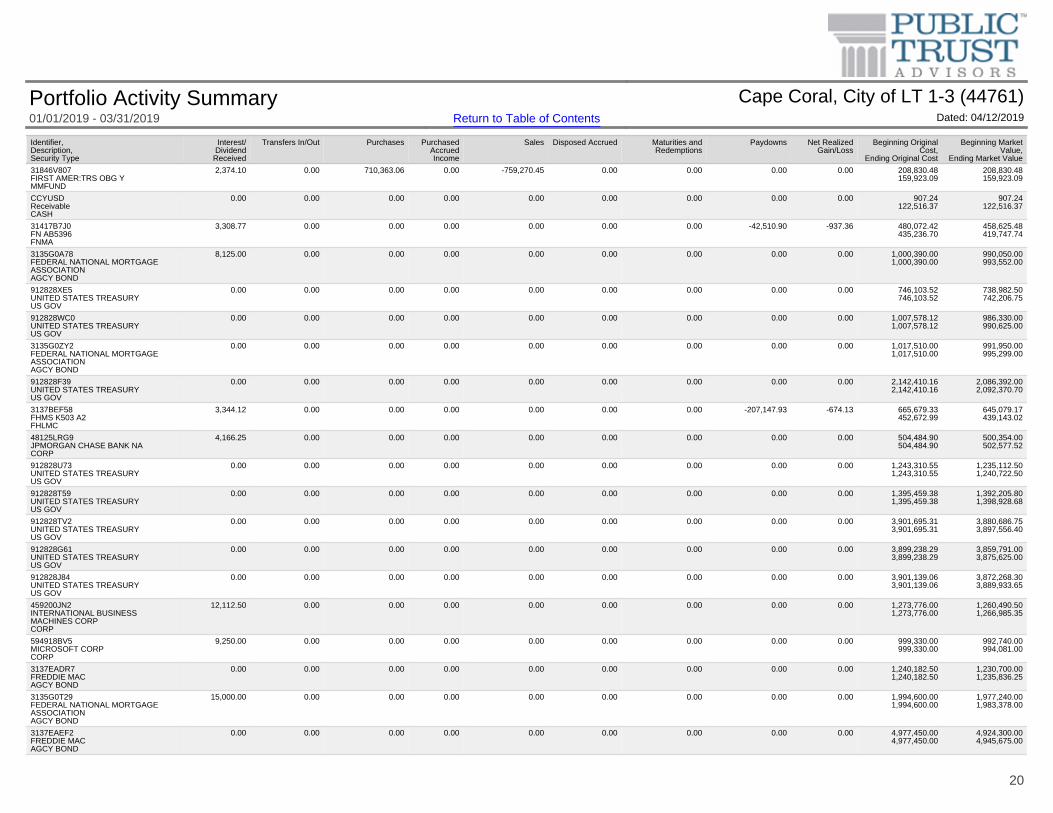
Portfolio Activity Summary Cape Coral, City of LT 1-3 (44761)01/01/2019 - 03/31/2019 Return to Table of Contents Dated: 04/12/2019
20
Identifier,Description,Security Type
Interest/Dividend
Received
Transfers In/Out Purchases PurchasedAccruedIncome
Sales Disposed Accrued Maturities andRedemptions
Paydowns Net RealizedGain/Loss
Beginning OriginalCost,
Ending Original Cost
Beginning MarketValue,
Ending Market Value
037833CS7APPLE INCCORP
0.00 0.00 0.00 0.00 0.00 0.00 0.00 0.00 0.00 998,980.00998,980.00
987,400.00992,218.00
458140AZ3INTEL CORPCORP
0.00 0.00 0.00 0.00 0.00 0.00 0.00 0.00 0.00 1,724,344.501,724,344.50
1,703,868.751,711,570.88
912828XH8UNITED STATES TREASURYUS GOV
0.00 0.00 0.00 0.00 0.00 0.00 0.00 0.00 0.00 4,008,906.244,008,906.24
3,945,920.003,961,876.00
313383HU8FEDERAL HOME LOAN BANKSAGCY BOND
0.00 0.00 0.00 0.00 0.00 0.00 0.00 0.00 0.00 2,663,356.002,663,356.00
2,619,419.002,628,495.25
912828XU9UNITED STATES TREASURYUS GOV
0.00 0.00 0.00 0.00 0.00 0.00 0.00 0.00 0.00 4,990,234.404,990,234.40
4,927,350.004,946,470.00
037833CZ1APPLE INCCORP
11,400.00 0.00 0.00 0.00 0.00 0.00 0.00 0.00 0.00 1,518,692.801,518,692.80
1,506,654.401,512,542.88
9128282Q2UNITED STATES TREASURYUS GOV
30,000.00 0.00 0.00 0.00 0.00 0.00 0.00 0.00 0.00 4,000,937.524,000,937.52
3,934,520.003,951,876.00
9128282V1UNITED STATES TREASURYUS GOV
10,312.50 0.00 0.00 0.00 0.00 0.00 0.00 0.00 0.00 1,493,320.321,493,320.32
1,471,635.001,479,375.00
375558BR3GILEAD SCIENCES INCCORP
6,521.25 0.00 0.00 0.00 0.00 0.00 0.00 0.00 0.00 704,753.25704,753.25
698,697.30702,409.83
912828X21UNITED STATES TREASURYUS GOV
0.00 0.00 0.00 0.00 0.00 0.00 0.00 0.00 0.00 3,897,257.833,897,257.83
3,848,052.003,864,045.90
912828W22UNITED STATES TREASURYUS GOV
26,468.75 0.00 0.00 0.00 0.00 0.00 0.00 0.00 0.00 3,834,359.383,834,359.38
3,796,908.503,814,957.30
912828G95UNITED STATES TREASURYUS GOV
0.00 0.00 0.00 0.00 0.00 0.00 0.00 0.00 0.00 1,002,265.621,002,265.62
990,040.00993,828.00
931142DY6WAL-MART STORES INCCORP
0.00 0.00 0.00 0.00 0.00 0.00 0.00 0.00 0.00 524,989.50524,989.50
521,314.50522,412.28
037833DH0APPLE INCCORP
0.00 0.00 0.00 0.00 0.00 0.00 0.00 0.00 0.00 2,673,689.252,673,689.25
2,653,145.252,666,490.83
478160CH5JOHNSON & JOHNSONCORP
0.00 0.00 0.00 0.00 0.00 0.00 0.00 0.00 0.00 359,614.80359,614.80
354,726.00357,270.12
02665WBZ3AMERICAN HONDA FINANCE CORPCORP
0.00 0.00 0.00 0.00 0.00 0.00 0.00 0.00 0.00 1,604,101.201,604,101.20
1,592,432.851,598,685.93
912828VZ0UNITED STATES TREASURYUS GOV
0.00 0.00 0.00 0.00 0.00 0.00 0.00 0.00 0.00 2,580,834.002,580,834.00
2,552,159.752,561,422.02
3137EAEK1FEDERAL HOME LOAN MORTGAGECORPAGCY BOND
0.00 0.00 0.00 0.00 0.00 0.00 0.00 0.00 0.00 6,474,845.006,474,845.00
6,419,075.006,450,483.00
912828A42UNITED STATES TREASURYUS GOV
0.00 0.00 0.00 0.00 0.00 0.00 0.00 0.00 0.00 725,254.88725,254.88
718,286.50720,950.15
89236TEJ0TOYOTA MOTOR CREDIT CORPCORP
13,200.00 0.00 0.00 0.00 0.00 0.00 0.00 0.00 0.00 1,198,932.001,198,932.00
1,189,128.001,196,347.20
742718EZ8PROCTER & GAMBLE COCORP
0.00 0.00 0.00 0.00 0.00 0.00 0.00 0.00 0.00 297,054.00297,054.00
297,465.00298,513.50
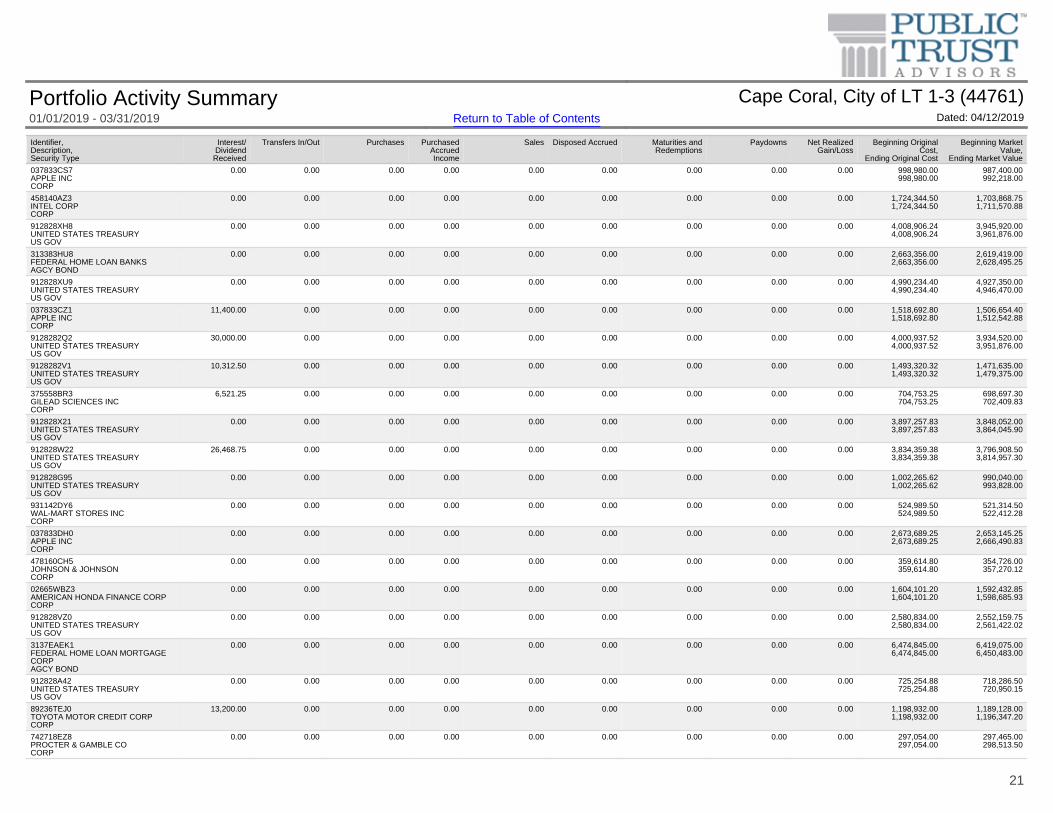
Portfolio Activity Summary Cape Coral, City of LT 1-3 (44761)01/01/2019 - 03/31/2019 Return to Table of Contents Dated: 04/12/2019
21
* Weighted by: Ending Market Value + Accrued. * Holdings Displayed by: Lot.
Identifier,Description,Security Type
Interest/Dividend
Received
Transfers In/Out Purchases PurchasedAccruedIncome
Sales Disposed Accrued Maturities andRedemptions
Paydowns Net RealizedGain/Loss
Beginning OriginalCost,
Ending Original Cost
Beginning MarketValue,
Ending Market Value
9128284B3UNITED STATES TREASURYUS GOV
45,421.88 0.00 0.00 0.00 0.00 0.00 0.00 0.00 0.00 3,812,449.223,812,449.22
3,814,825.503,831,426.00
89236TEU5TOYOTA MOTOR CREDIT CORPCORP
0.00 0.00 0.00 0.00 0.00 0.00 0.00 0.00 0.00 1,649,340.001,649,340.00
1,650,247.501,661,210.10
9128283X6UNITED STATES TREASURYUS GOV
38,250.00 0.00 0.00 0.00 0.00 0.00 0.00 0.00 0.00 3,375,695.303,375,695.30
3,381,538.003,396,280.40
9128284G2UNITED STATES TREASURYUS GOV
0.00 0.00 0.00 0.00 0.00 0.00 0.00 0.00 0.00 4,978,515.654,978,515.65
4,987,500.005,008,790.00
3137B3N95FHMS K030 A1FHLMC CMO
2,714.92 0.00 0.00 0.00 0.00 0.00 0.00 -25,235.82 146.35 396,226.13371,150.00
398,605.91375,112.24
931142EG4WALMART INCCORP
0.00 0.00 0.00 0.00 0.00 0.00 0.00 0.00 0.00 4,898,481.004,898,481.00
4,907,938.004,920,751.50
02665WCH2AMERICAN HONDA FINANCE CORPCORP
0.00 0.00 0.00 0.00 0.00 0.00 0.00 0.00 0.00 1,223,346.251,223,346.25
1,222,378.501,230,524.75
912828PC8UNITED STATES TREASURYUS GOV
0.00 0.00 0.00 0.00 0.00 0.00 0.00 0.00 0.00 3,990,468.763,990,468.76
4,007,360.004,017,500.00
3135G0U27FEDERAL NATIONAL MORTGAGEASSOCIATIONAGCY BOND
0.00 0.00 0.00 0.00 0.00 0.00 0.00 0.00 0.00 3,966,800.003,966,800.00
3,996,720.004,014,828.00
912828Y20UNITED STATES TREASURYUS GOV
95,484.38 0.00 0.00 0.00 0.00 0.00 0.00 0.00 0.00 7,222,142.617,222,142.61
7,300,899.007,332,123.30
912828RC6UNITED STATES TREASURYUS GOV
78,625.00 0.00 0.00 0.00 -24,765.63 -29.35 0.00 0.00 218.15 7,242,750.007,218,281.25
7,332,660.007,350,227.38
166764BG4CHEVRON CORPCORP
0.00 0.00 0.00 0.00 0.00 0.00 0.00 0.00 0.00 1,457,280.001,457,280.00
1,471,050.001,489,239.00
912828F21UNITED STATES TREASURYUS GOV
0.00 0.00 0.00 0.00 0.00 0.00 0.00 0.00 0.00 4,728,187.494,728,187.49
4,754,448.004,784,251.20
9128285L0UNITED STATES TREASURYUS GOV
0.00 0.00 0.00 0.00 0.00 0.00 0.00 0.00 0.00 4,722,949.224,722,949.22
4,752,311.004,773,254.20
3137AA4W0FHMS K013 A2FHLMC CMO
0.00 0.00 764,179.69 -496.75 0.00 0.00 0.00 0.00 0.00 0.00764,179.69
0.00765,633.45
---------
416,079.42 0.00 1,474,542.75 -496.75 -784,036.08 -29.35 0.00 -274,894.65 -1,246.98 133,541,501.37134,070,995.86
132,939,714.94134,070,074.60
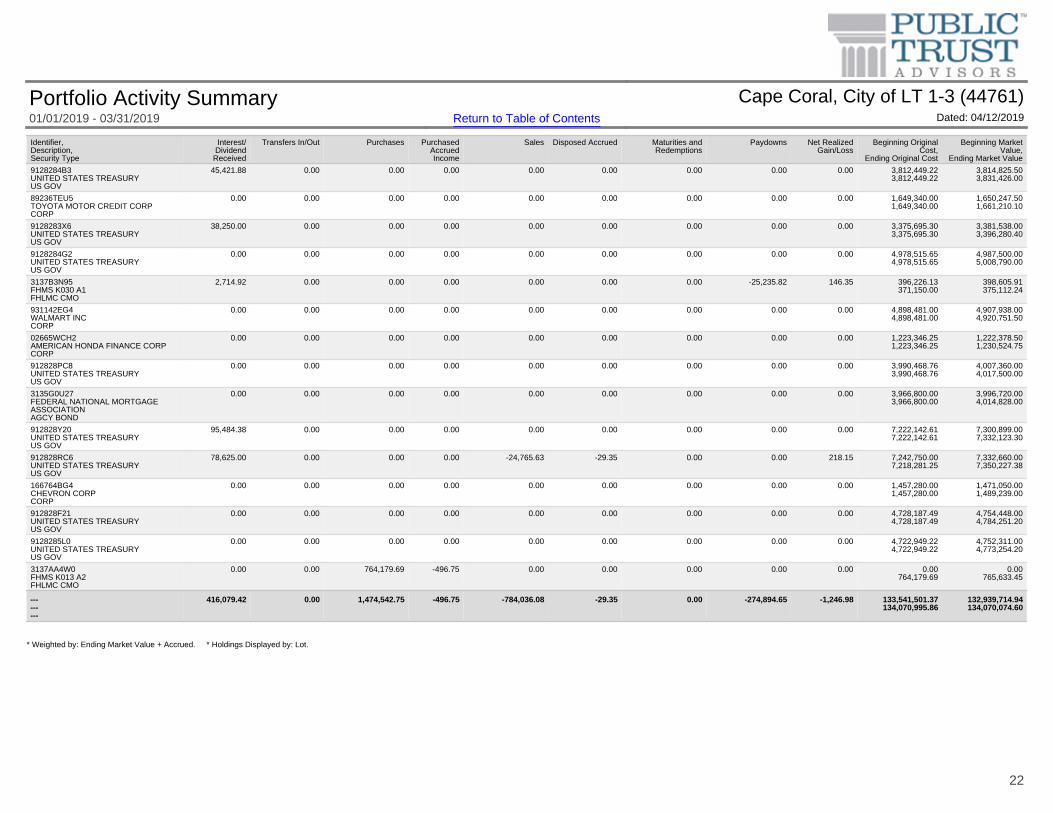
Portfolio Activity Summary Cape Coral, City of LT 1-3 (44761)01/01/2019 - 03/31/2019 Return to Table of Contents Dated: 04/12/2019
22

Additional Disclosure:
The information on this website is for general purposes only and is not intended to provide specific advice or recommendations. All information presented on this website is obtained via electronic data transfer from theCustodian. While this information is reconciled on a daily basis, when available, accuracy is relied upon from the Custodian. Please review the data carefully. Should you have any questions regarding the informationpresented, calculation methodology, investment portfolio or security detail, or any other facet of the data, please feel free to contact us.
This data is intended to detail our investment advisory activity as well as the activity of any client accounts managed by Public Trust Advisors, LLC (Public Trust). The custodian bank maintains the control of assets andexecutes and settles all investment transactions. The custodian statement is the official record of security and cash holdings transactions. Public Trust recognizes that clients may use these reports to facilitate record keeping;therefore it is recommended that the client reconcile this statement with their custodian bank statement. Many custodians use a settlement date basis which may result in the need to reconcile due to a timing difference.Please contact your relationship manager or call our toll free number 855-395-3954 with questions regarding your account.
Public Trust does not have the authority to withdraw funds from or deposit funds to the custodian. Our clients retain responsibility for their internal accounting policies; implementing and enforcing internal controls andgenerating ledger entries or otherwise recording transactions.
Pricing sources from our reporting platform are provided by Clearwater Analytics®. Clearwater utilizes a hierarchical pricing model with multiple options for pricing sources. These options include custodial pricing, S&P CapitalIQ and other sources. Since multiple pricing hierarchies are offered through Clearwater Analytics, and client preferences regarding pricing sources may differ, it is important to verify the specific pricing hierarchy for eachportfolio. Securities with short maturities and infrequent secondary market trades are typically priced via mathematical calculations. The securities in this investment portfolio, including shares of mutual funds, are notguaranteed or otherwise protected by Public Trust, the FDIC (except for certain non-negotiable certificates of deposit) or any government agency, unless otherwise specifically stated. Investing involves risk, including thepossible loss of principal.
Past performance is not an indicator of future performance or results.
Public Trust statements present beginning and ending balances and are based on Market Value plus accrued interest on a Trade Date basis. Customized reports made available to the end user either from Public Trust orthrough the online reporting platform may present information and portfolio analytics using various optional methods including, but not limited to, historical cost, amortized cost, and market value. Custom reports may also differfrom the information received from the custodian as a result of additional formulas and filters created based on end user preferences.
The investment advisor providing these services is Public Trust Advisors, LLC, an investment adviser registered with the U.S. Securities and Exchange Commission (SEC) under the Investment Advisers Act of 1940, asamended. Registration with the SEC does not imply a certain level of skill or training. Public Trust is required to maintain a written disclosure brochure of our background and business experience. If you would like to receive acopy of our current disclosure brochure, privacy policy, or code of ethics please contact us at the address below.
Public Trust Advisors
717 17th St. Suite 1850
Denver, CO 80202
City of Cape Coral 1-5 Year Public Trust Advisors LLC
1015 Cultural Park Blvd 201 E. Pine Street, Suite 750
Cape Coral, Florida 33990 Orlando, Florida 32801
Quarterly Investment Report for Period Ended March 31, 2019
Investment Management Portfolio Review Page
Investment Portfolio Summary Comparison 3
Investment Portfolio Maturity Distribution 4
Investment Portfolio Maturity Distribution By Security Type 5
Investment Portfolio Rating Distribution 6
Investment Portfolio Security Distribution - Market Value 7
Investment Portfolio Security Distribution - Historical Cost 8
Additional Disclosure 9
Portfolio Holding Details 10
City of Cape Coral 1-5 Year Summary
City of Cape Coral 1-5 Year
January 1, 2019
Beginning Balance
March 31, 2019
Ending Balance Portfolio Characteristic
January 1, 2019
Beginning Balance
March 31, 2019
Ending Balance
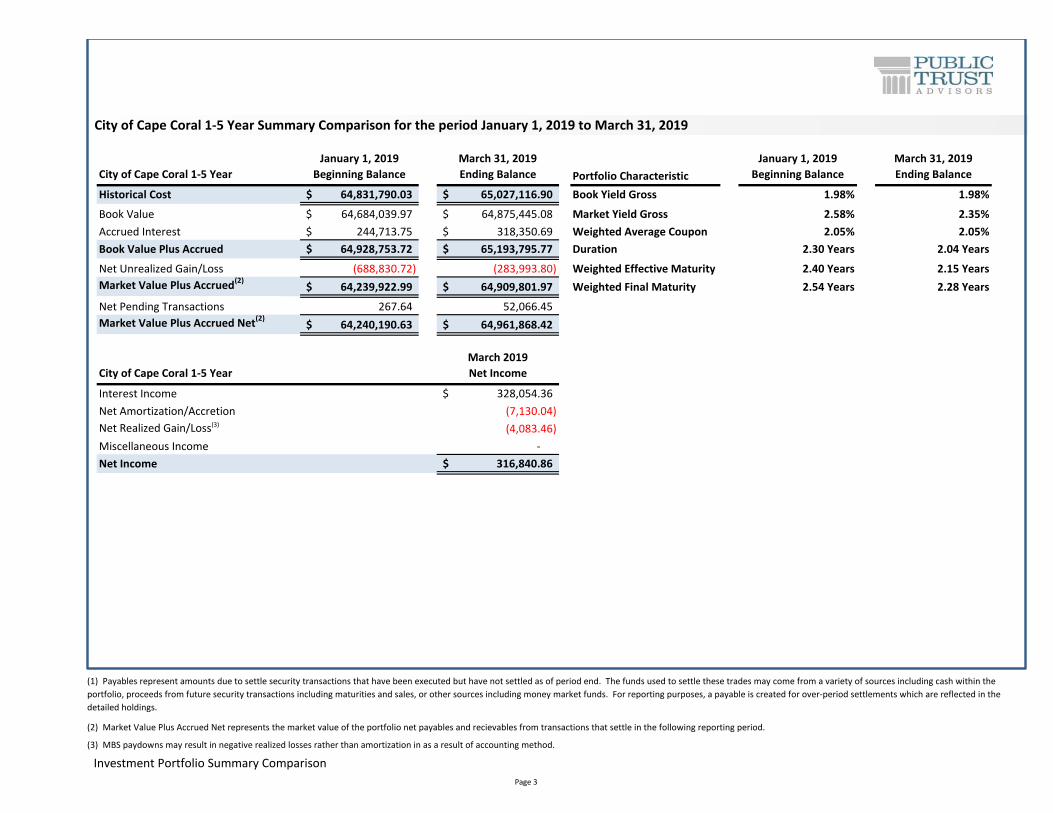
Historical Cost 64,831,790.03$ 65,027,116.90$ Book Yield Gross 1.98% 1.98%
Book Value 64,684,039.97$ 64,875,445.08$ Market Yield Gross 2.58% 2.35%
Accrued Interest 244,713.75$ 318,350.69$ Weighted Average Coupon 2.05% 2.05%
Book Value Plus Accrued 64,928,753.72$ 65,193,795.77$ Duration 2.30 Years 2.04 Years
Net Unrealized Gain/Loss (688,830.72) (283,993.80) Weighted Effective Maturity 2.40 Years 2.15 Years
Market Value Plus Accrued(2)64,239,922.99$ 64,909,801.97$ Weighted Final Maturity 2.54 Years 2.28 Years
Net Pending Transactions 267.64 52,066.45
Market Value Plus Accrued Net(2)64,240,190.63$ 64,961,868.42$
City of Cape Coral 1-5 Year
March 2019
Net Income Portfolio Compliance Compliant
Interest Income 328,054.36$ Security Distribution YES
Net Amortization/Accretion (7,130.04) Maturity Distribution YES
Net Realized Gain/Loss(3) (4,083.46) Rating Distribution YES
Miscellaneous Income -
Net Income 316,840.86$
Investment Portfolio Summary Comparison
City of Cape Coral 1-5 Year Summary Comparison for the period January 1, 2019 to March 31, 2019
(1) Payables represent amounts due to settle security transactions that have been executed but have not settled as of period end. The funds used to settle these trades may come from a variety of sources including cash within the
portfolio, proceeds from future security transactions including maturities and sales, or other sources including money market funds. For reporting purposes, a payable is created for over-period settlements which are reflected in the
detailed holdings.
(2) Market Value Plus Accrued Net represents the market value of the portfolio net payables and recievables from transactions that settle in the following reporting period.
(3) MBS paydowns may result in negative realized losses rather than amortization in as a result of accounting method.
Page 3
Maturity Distribution
January 1, 2019
Beginning Balance
March 31, 2019
Ending Balance Portfolio Allocation Distribution Change
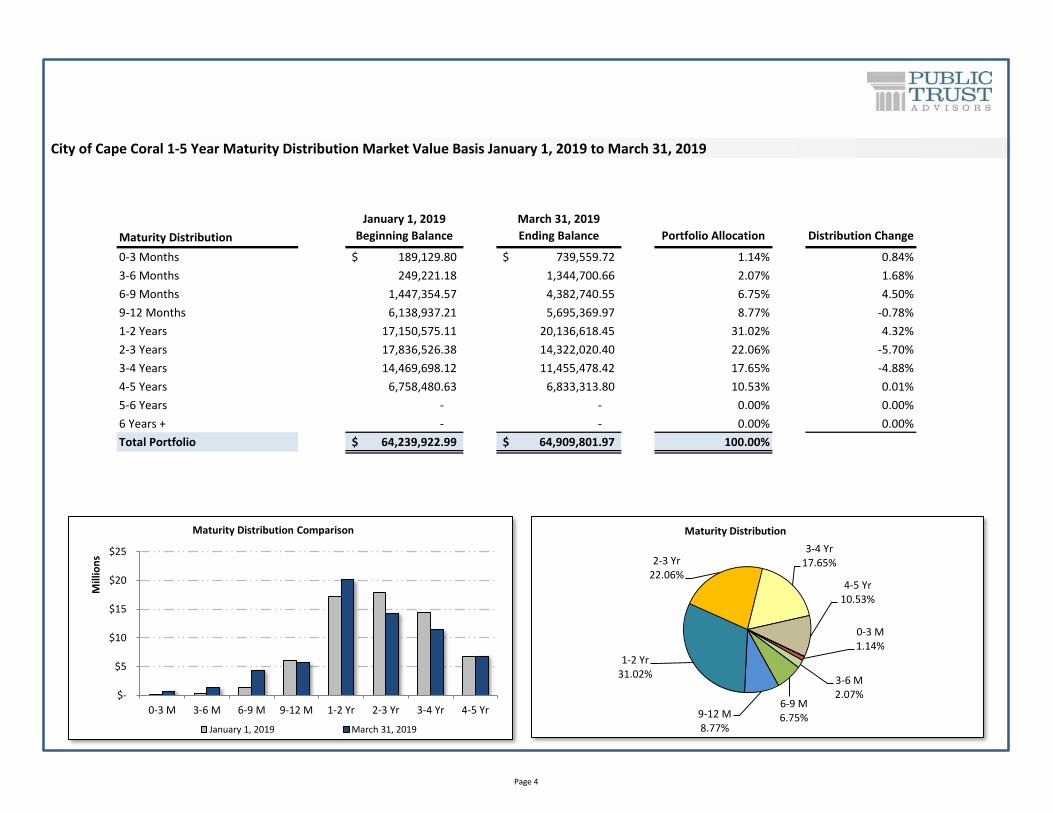
0-3 Months 189,129.80$ 739,559.72$ 1.14% 0.84%
3-6 Months 249,221.18 1,344,700.66 2.07% 1.68%
6-9 Months 1,447,354.57 4,382,740.55 6.75% 4.50%
9-12 Months 6,138,937.21 5,695,369.97 8.77% -0.78%
1-2 Years 17,150,575.11 20,136,618.45 31.02% 4.32%
2-3 Years 17,836,526.38 14,322,020.40 22.06% -5.70%
3-4 Years 14,469,698.12 11,455,478.42 17.65% -4.88%
4-5 Years 6,758,480.63 6,833,313.80 10.53% 0.01%
5-6 Years - - 0.00% 0.00%
6 Years + - - 0.00% 0.00%
Total Portfolio 64,239,922.99$ 64,909,801.97$ 100.00%
City of Cape Coral 1-5 Year Maturity Distribution Market Value Basis January 1, 2019 to March 31, 2019
$-
$5
$10
$15
$20
$25
0-3 M 3-6 M 6-9 M 9-12 M 1-2 Yr 2-3 Yr 3-4 Yr 4-5 Yr
Mill
ion
s
Maturity Distribution Comparison
January 1, 2019 March 31, 2019
0-3 M1.14%
3-6 M2.07%
6-9 M6.75%9-12 M
8.77%
1-2 Yr31.02%
2-3 Yr22.06%
3-4 Yr17.65%
4-5 Yr10.53%
Maturity Distribution
Page 4
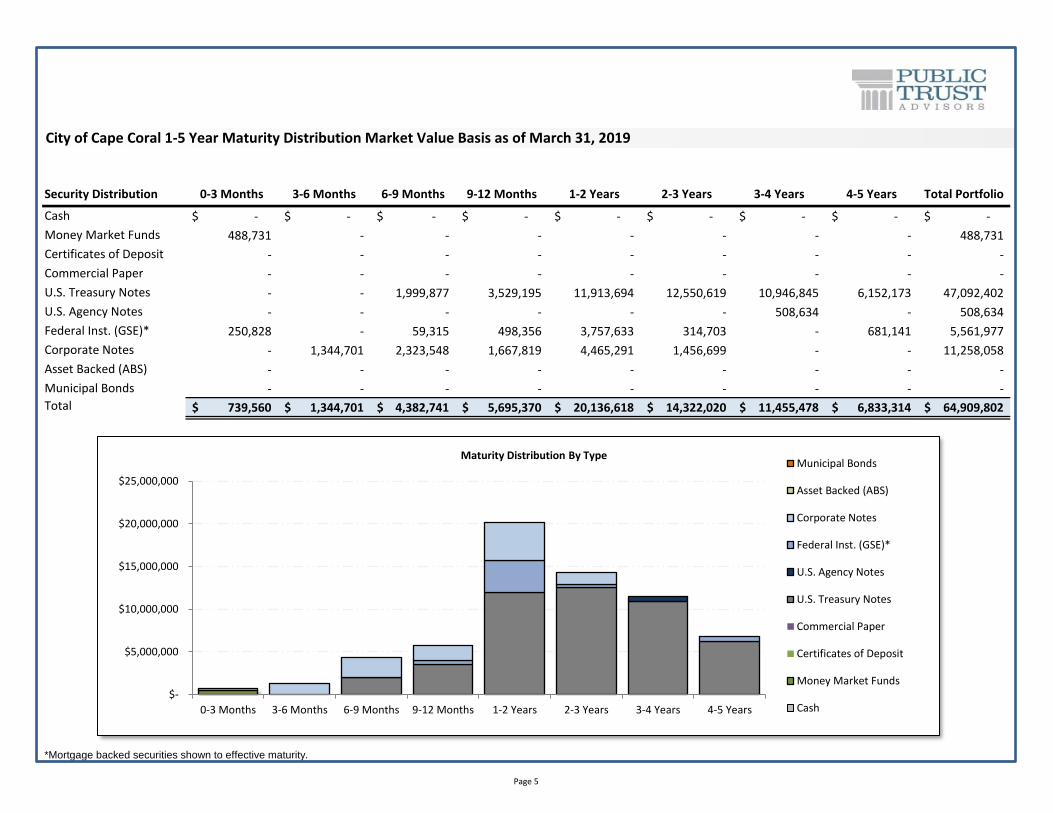
Security Distribution 0-3 Months 3-6 Months 6-9 Months 9-12 Months 1-2 Years 2-3 Years 3-4 Years 4-5 Years Total Portfolio
Cash -$ -$ -$ -$ -$ -$ -$ -$ -$
Money Market Funds 488,731 - - - - - - - 488,731
Certificates of Deposit - - - - - - - - -
Commercial Paper - - - - - - - - -
U.S. Treasury Notes - - 1,999,877 3,529,195 11,913,694 12,550,619 10,946,845 6,152,173 47,092,402
U.S. Agency Notes - - - - - - 508,634 - 508,634
Federal Inst. (GSE)* 250,828 - 59,315 498,356 3,757,633 314,703 - 681,141 5,561,977
Corporate Notes - 1,344,701 2,323,548 1,667,819 4,465,291 1,456,699 - - 11,258,058
Asset Backed (ABS) - - - - - - - - -
Municipal Bonds - - - - - - - - -
Total 739,560$ 1,344,701$ 4,382,741$ 5,695,370$ 20,136,618$ 14,322,020$ 11,455,478$ 6,833,314$ 64,909,802$
*Mortgage backed securities shown to effective maturity.
City of Cape Coral 1-5 Year Maturity Distribution Market Value Basis as of March 31, 2019
$-
$5,000,000
$10,000,000
$15,000,000
$20,000,000
$25,000,000
0-3 Months 3-6 Months 6-9 Months 9-12 Months 1-2 Years 2-3 Years 3-4 Years 4-5 Years
Maturity Distribution By TypeMunicipal Bonds
Asset Backed (ABS)
Corporate Notes
Federal Inst. (GSE)*
U.S. Agency Notes
U.S. Treasury Notes
Commercial Paper
Certificates of Deposit
Money Market Funds
Cash
Page 5
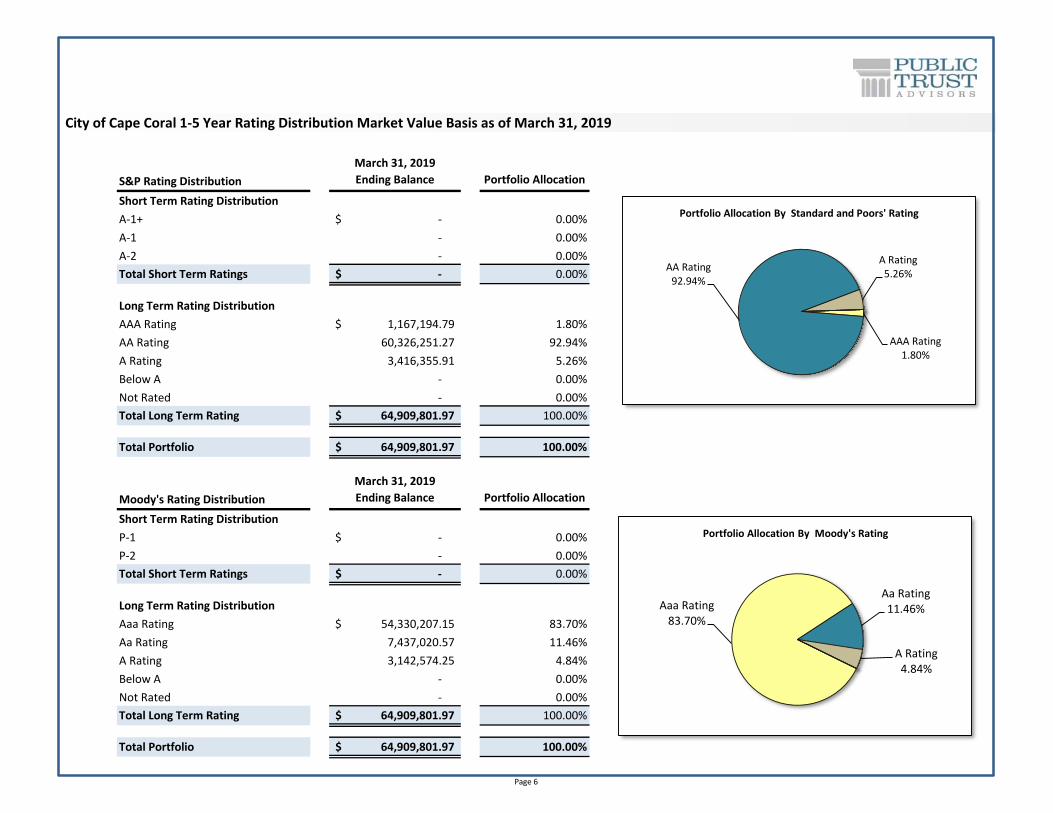
S&P Rating Distribution
March 31, 2019
Ending Balance Portfolio Allocation
Short Term Rating Distribution
A-1+ -$ 0.00%
A-1 - 0.00%
A-2 - 0.00%
Total Short Term Ratings -$ 0.00%
Long Term Rating Distribution
AAA Rating 1,167,194.79$ 1.80%
AA Rating 60,326,251.27 92.94%
A Rating 3,416,355.91 5.26%
Below A - 0.00%
Not Rated - 0.00%
Total Long Term Rating 64,909,801.97$ 100.00%
Total Portfolio 64,909,801.97$ 100.00%
Moody's Rating Distribution
March 31, 2019
Ending Balance Portfolio Allocation
Short Term Rating Distribution
P-1 -$ 0.00%
P-2 - 0.00%
Total Short Term Ratings -$ 0.00%
Long Term Rating Distribution
Aaa Rating 54,330,207.15$ 83.70%
Aa Rating 7,437,020.57 11.46%
A Rating 3,142,574.25 4.84%
Below A - 0.00%
Not Rated - 0.00%
Total Long Term Rating 64,909,801.97$ 100.00%
Total Portfolio 64,909,801.97$ 100.00%
City of Cape Coral 1-5 Year Rating Distribution Market Value Basis as of March 31, 2019
AAA Rating1.80%
AA Rating92.94%
A Rating5.26%
Portfolio Allocation By Standard and Poors' Rating
Aaa Rating83.70%
Aa Rating11.46%
A Rating4.84%
Portfolio Allocation By Moody's Rating
Page 6
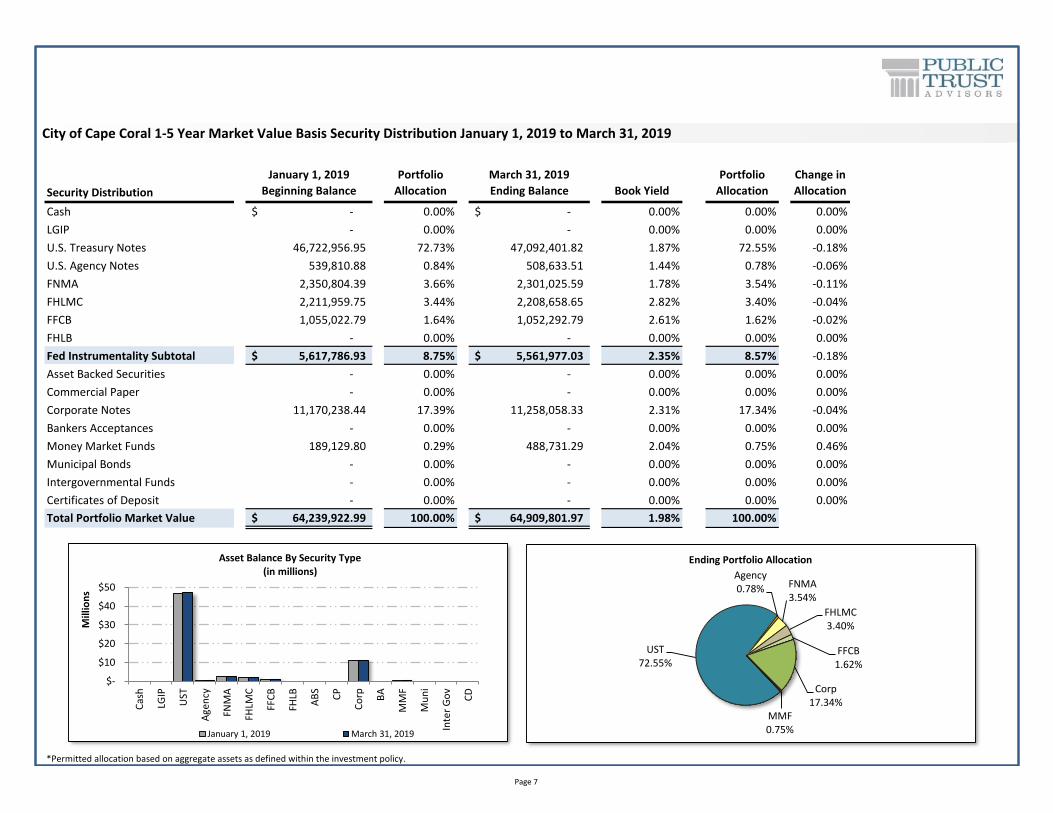
Security Distribution
January 1, 2019
Beginning Balance
Portfolio
Allocation
March 31, 2019
Ending Balance Book Yield
Portfolio
Allocation
Change in
Allocation
Permitted by
Policy* Compliant
Cash -$ 0.00% -$ 0.00% 0.00% 0.00% YES
LGIP - 0.00% - 0.00% 0.00% 0.00% YES
U.S. Treasury Notes 46,722,956.95 72.73% 47,092,401.82 1.87% 72.55% -0.18% NO
U.S. Agency Notes 539,810.88 0.84% 508,633.51 1.44% 0.78% -0.06% YES
FNMA 2,350,804.39 3.66% 2,301,025.59 1.78% 3.54% -0.11% NO
FHLMC 2,211,959.75 3.44% 2,208,658.65 2.82% 3.40% -0.04% NO
FFCB 1,055,022.79 1.64% 1,052,292.79 2.61% 1.62% -0.02% NO
FHLB - 0.00% - 0.00% 0.00% 0.00% YES
Fed Instrumentality Subtotal 5,617,786.93$ 8.75% 5,561,977.03$ 2.35% 8.57% -0.18% NO
Asset Backed Securities - 0.00% - 0.00% 0.00% 0.00% YES
Commercial Paper - 0.00% - 0.00% 0.00% 0.00% YES
Corporate Notes 11,170,238.44 17.39% 11,258,058.33 2.31% 17.34% -0.04% NO
Bankers Acceptances - 0.00% - 0.00% 0.00% 0.00% YES
Money Market Funds 189,129.80 0.29% 488,731.29 2.04% 0.75% 0.46% YES
Municipal Bonds - 0.00% - 0.00% 0.00% 0.00% YES
Intergovernmental Funds - 0.00% - 0.00% 0.00% 0.00% YES
Certificates of Deposit - 0.00% - 0.00% 0.00% 0.00% YES
Total Portfolio Market Value 64,239,922.99$ 100.00% 64,909,801.97$ 1.98% 100.00%
*Permitted allocation based on aggregate assets as defined within the investment policy.
City of Cape Coral 1-5 Year Market Value Basis Security Distribution January 1, 2019 to March 31, 2019
$-
$10
$20
$30
$40
$50
Cas
h
LGIP
UST
Age
ncy
FNM
A
FHLM
C
FFC
B
FHLB
AB
S
CP
Co
rp BA
MM
F
Mu
ni
Inte
r G
ov
CD
Mill
ion
s
Asset Balance By Security Type(in millions)
January 1, 2019 March 31, 2019
UST72.55%
Agency0.78% FNMA
3.54%
FHLMC3.40%
FFCB1.62%
Corp17.34%
MMF0.75%
Ending Portfolio Allocation
Page 7
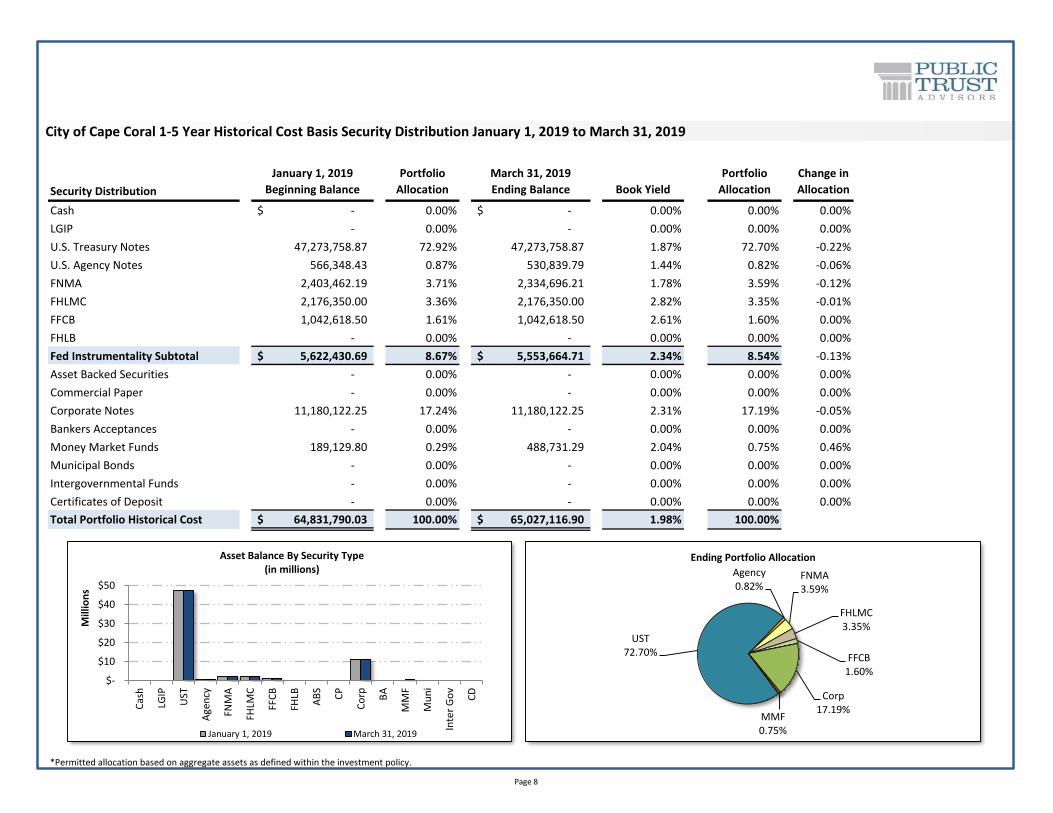
Security Distribution
January 1, 2019
Beginning Balance
Portfolio
Allocation
March 31, 2019
Ending Balance Book Yield
Portfolio
Allocation
Change in
Allocation
Permitted by
Policy*
Complian
t
Cash -$ 0.00% -$ 0.00% 0.00% 0.00% YES
LGIP - 0.00% - 0.00% 0.00% 0.00% YES
U.S. Treasury Notes 47,273,758.87 72.92% 47,273,758.87 1.87% 72.70% -0.22% NO
U.S. Agency Notes 566,348.43 0.87% 530,839.79 1.44% 0.82% -0.06% YES
FNMA 2,403,462.19 3.71% 2,334,696.21 1.78% 3.59% -0.12% NO
FHLMC 2,176,350.00 3.36% 2,176,350.00 2.82% 3.35% -0.01% NO
FFCB 1,042,618.50 1.61% 1,042,618.50 2.61% 1.60% 0.00% NO
FHLB - 0.00% - 0.00% 0.00% 0.00% YES
Fed Instrumentality Subtotal 5,622,430.69$ 8.67% 5,553,664.71$ 2.34% 8.54% -0.13% NO
Asset Backed Securities - 0.00% - 0.00% 0.00% 0.00% YES
Commercial Paper - 0.00% - 0.00% 0.00% 0.00% YES
Corporate Notes 11,180,122.25 17.24% 11,180,122.25 2.31% 17.19% -0.05% NO
Bankers Acceptances - 0.00% - 0.00% 0.00% 0.00% YES
Money Market Funds 189,129.80 0.29% 488,731.29 2.04% 0.75% 0.46% YES
Municipal Bonds - 0.00% - 0.00% 0.00% 0.00% YES
Intergovernmental Funds - 0.00% - 0.00% 0.00% 0.00% YES
Certificates of Deposit - 0.00% - 0.00% 0.00% 0.00% YES
Total Portfolio Historical Cost 64,831,790.03$ 100.00% 65,027,116.90$ 1.98% 100.00%
*Permitted allocation based on aggregate assets as defined within the investment policy.
City of Cape Coral 1-5 Year Historical Cost Basis Security Distribution January 1, 2019 to March 31, 2019
$-
$10
$20
$30
$40
$50
Cas
h
LGIP
UST
Age
ncy
FNM
A
FHLM
C
FFC
B
FHLB
AB
S
CP
Co
rp BA
MM
F
Mu
ni
Inte
r G
ov
CD
Mill
ion
s
Asset Balance By Security Type(in millions)
January 1, 2019 March 31, 2019
UST72.70%
Agency0.82%
FNMA3.59%
FHLMC3.35%
FFCB1.60%
Corp17.19%
MMF0.75%
Ending Portfolio Allocation
Page 8

Additional Disclosure
This statement is for general information purposes only and is not intended to provide specific advice or recommendations. Please review the contents of this statement carefully. Should you have any questions regarding the information presented, calculation methodology, investment portfolio or security detail, or any other facet of your statement, please feel free to contact us.
Public Trust Advisor’s monthly statement is intended to detail our investment advisory activity as well as the activity of any accounts held by clients in pools that are managed by Public Trust Advisors. The custodian bank maintains the control of assets and executes and settles all investments transactions. The custodian statement is the official record of security and cash holdings transactions. Public Trust Advisors recognizes that clients may use these reports to facilitate record keeping; therefore the custodian bank statement and the Public Trust Advisors statement should be reconciled and differences resolved. Many custodians use a settlement date basis which may result in the need to reconcile due to a timing difference. Please contact your relationship manager or our toll free number 855-395-3954 with questions regarding your account.
Public Trust Advisors does not have the authority to withdraw funds from or deposit funds to the custodian. Our clients retain responsibility for their internal accounting policies; implementing and enforcing internal controls and generating ledger entries or otherwise recording transactions.
Pricing sources from our reporting platform are provided by Clearwater reporting platform and are established by Clearwater’s internal pricing procedures. Clearwater utilizes a hierarchical pricing model which starts with one of the industry’s pricing sources, S&P Capital IQ. Securities with short maturities and infrequent secondary market trades are typically priced via mathematical calculations. The Securities in this investment portfolio, including shares of mutual funds, are not guaranteed or otherwise protected by Public trust Advisors, the FDIC (except for certain non-negotiable certificates of deposit) or any government agency, unless otherwise specifically stated. Investment in fixed income securities involves risks, including the possible loss of the amount invested.
Past performance is not an indication of future performance.
Beginning and Ending Balances based on Market Value plus Accrued Interest on a Trade Date basis.
Public Trust Advisors is an investment advisor registered with the Securities and Exchange Commission, and is required to maintain a written disclosure statement of our background and business experience. If you would like to receive a copy of our current disclosure statement, privacy policy, or code of ethics please contact Service Operations at the address below.
Public Trust Advisors717 17th Street, Suite 1850Denver, CO 80202
Page 9
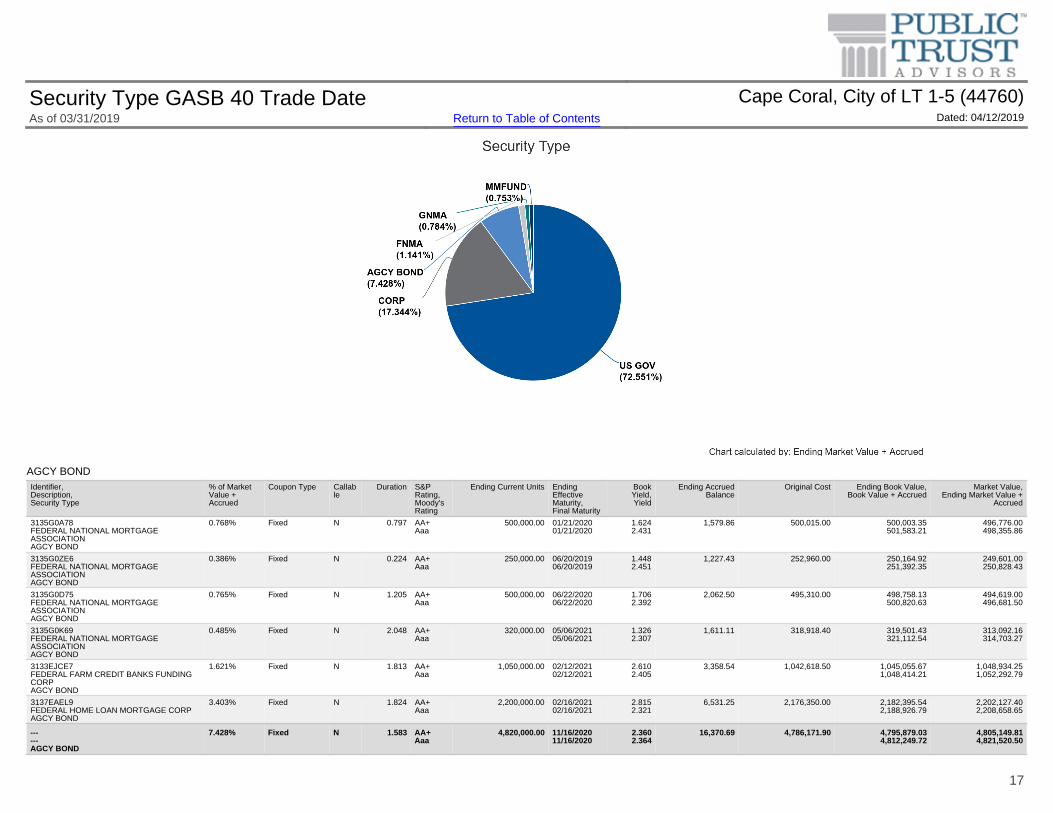
AGCY BONDIdentifier,Description,Security Type
% of MarketValue +Accrued
Coupon Type Callable
Duration S&PRating,Moody'sRating
Ending Current Units EndingEffectiveMaturity,Final Maturity
BookYield,Yield
Ending AccruedBalance
Original Cost Ending Book Value,Book Value + Accrued
Market Value,Ending Market Value +
Accrued
3135G0A78FEDERAL NATIONAL MORTGAGEASSOCIATIONAGCY BOND
0.768% Fixed N 0.797 AA+Aaa
500,000.00 01/21/202001/21/2020
1.6242.431
1,579.86 500,015.00 500,003.35501,583.21
496,776.00498,355.86
3135G0ZE6FEDERAL NATIONAL MORTGAGEASSOCIATIONAGCY BOND
0.386% Fixed N 0.224 AA+Aaa
250,000.00 06/20/201906/20/2019
1.4482.451
1,227.43 252,960.00 250,164.92251,392.35
249,601.00250,828.43
3135G0D75FEDERAL NATIONAL MORTGAGEASSOCIATIONAGCY BOND
0.765% Fixed N 1.205 AA+Aaa
500,000.00 06/22/202006/22/2020
1.7062.392
2,062.50 495,310.00 498,758.13500,820.63
494,619.00496,681.50
3135G0K69FEDERAL NATIONAL MORTGAGEASSOCIATIONAGCY BOND
0.485% Fixed N 2.048 AA+Aaa
320,000.00 05/06/202105/06/2021
1.3262.307
1,611.11 318,918.40 319,501.43321,112.54
313,092.16314,703.27
3133EJCE7FEDERAL FARM CREDIT BANKS FUNDINGCORPAGCY BOND
1.621% Fixed N 1.813 AA+Aaa
1,050,000.00 02/12/202102/12/2021
2.6102.405
3,358.54 1,042,618.50 1,045,055.671,048,414.21
1,048,934.251,052,292.79
3137EAEL9FEDERAL HOME LOAN MORTGAGE CORPAGCY BOND
3.403% Fixed N 1.824 AA+Aaa
2,200,000.00 02/16/202102/16/2021
2.8152.321
6,531.25 2,176,350.00 2,182,395.542,188,926.79
2,202,127.402,208,658.65
------AGCY BOND
7.428% Fixed N 1.583 AA+Aaa
4,820,000.00 11/16/202011/16/2020
2.3602.364
16,370.69 4,786,171.90 4,795,879.034,812,249.72
4,805,149.814,821,520.50
Security Type GASB 40 Trade Date Cape Coral, City of LT 1-5 (44760)As of 03/31/2019 Return to Table of Contents Dated: 04/12/2019
17
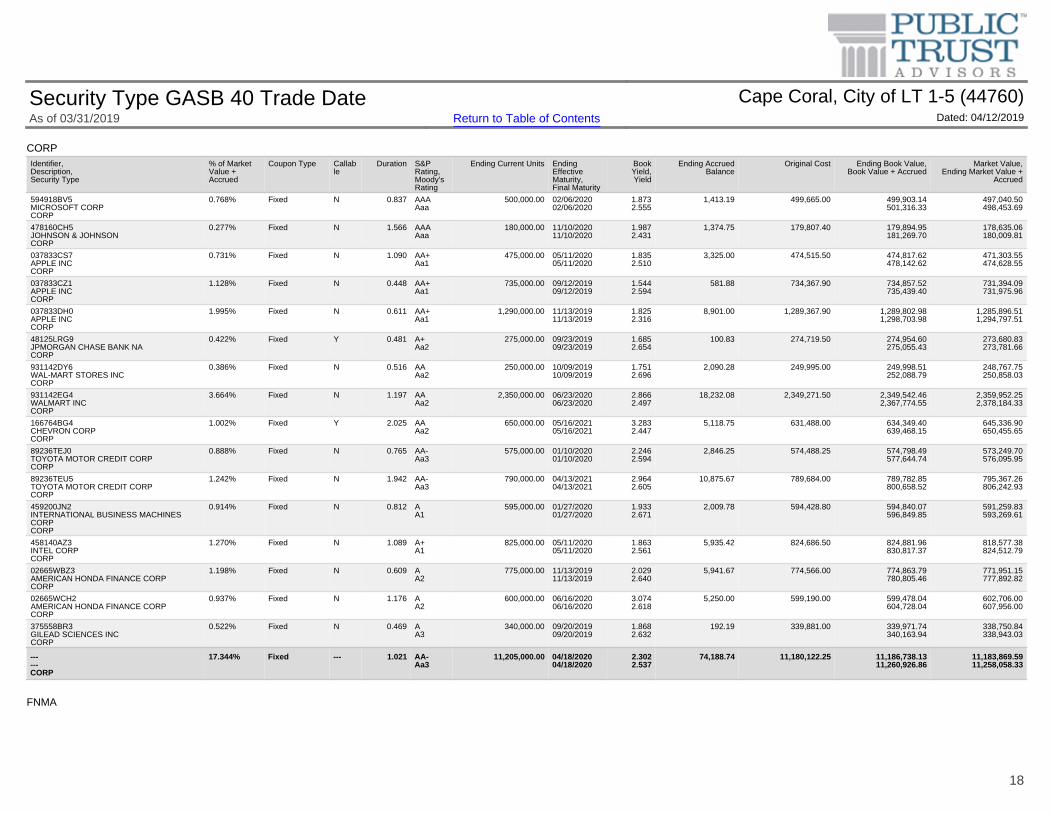
CORP
FNMA
Identifier,Description,Security Type
% of MarketValue +Accrued
Coupon Type Callable
Duration S&PRating,Moody'sRating
Ending Current Units EndingEffectiveMaturity,Final Maturity
BookYield,Yield
Ending AccruedBalance
Original Cost Ending Book Value,Book Value + Accrued
Market Value,Ending Market Value +
Accrued
594918BV5MICROSOFT CORPCORP
0.768% Fixed N 0.837 AAAAaa
500,000.00 02/06/202002/06/2020
1.8732.555
1,413.19 499,665.00 499,903.14501,316.33
497,040.50498,453.69
478160CH5JOHNSON & JOHNSONCORP
0.277% Fixed N 1.566 AAAAaa
180,000.00 11/10/202011/10/2020
1.9872.431
1,374.75 179,807.40 179,894.95181,269.70
178,635.06180,009.81
037833CS7APPLE INCCORP
0.731% Fixed N 1.090 AA+Aa1
475,000.00 05/11/202005/11/2020
1.8352.510
3,325.00 474,515.50 474,817.62478,142.62
471,303.55474,628.55
037833CZ1APPLE INCCORP
1.128% Fixed N 0.448 AA+Aa1
735,000.00 09/12/201909/12/2019
1.5442.594
581.88 734,367.90 734,857.52735,439.40
731,394.09731,975.96
037833DH0APPLE INCCORP
1.995% Fixed N 0.611 AA+Aa1
1,290,000.00 11/13/201911/13/2019
1.8252.316
8,901.00 1,289,367.90 1,289,802.981,298,703.98
1,285,896.511,294,797.51
48125LRG9JPMORGAN CHASE BANK NACORP
0.422% Fixed Y 0.481 A+Aa2
275,000.00 09/23/201909/23/2019
1.6852.654
100.83 274,719.50 274,954.60275,055.43
273,680.83273,781.66
931142DY6WAL-MART STORES INCCORP
0.386% Fixed N 0.516 AAAa2
250,000.00 10/09/201910/09/2019
1.7512.696
2,090.28 249,995.00 249,998.51252,088.79
248,767.75250,858.03
931142EG4WALMART INCCORP
3.664% Fixed N 1.197 AAAa2
2,350,000.00 06/23/202006/23/2020
2.8662.497
18,232.08 2,349,271.50 2,349,542.462,367,774.55
2,359,952.252,378,184.33
166764BG4CHEVRON CORPCORP
1.002% Fixed Y 2.025 AAAa2
650,000.00 05/16/202105/16/2021
3.2832.447
5,118.75 631,488.00 634,349.40639,468.15
645,336.90650,455.65
89236TEJ0TOYOTA MOTOR CREDIT CORPCORP
0.888% Fixed N 0.765 AA-Aa3
575,000.00 01/10/202001/10/2020
2.2462.594
2,846.25 574,488.25 574,798.49577,644.74
573,249.70576,095.95
89236TEU5TOYOTA MOTOR CREDIT CORPCORP
1.242% Fixed N 1.942 AA-Aa3
790,000.00 04/13/202104/13/2021
2.9642.605
10,875.67 789,684.00 789,782.85800,658.52
795,367.26806,242.93
459200JN2INTERNATIONAL BUSINESS MACHINESCORPCORP
0.914% Fixed N 0.812 AA1
595,000.00 01/27/202001/27/2020
1.9332.671
2,009.78 594,428.80 594,840.07596,849.85
591,259.83593,269.61
458140AZ3INTEL CORPCORP
1.270% Fixed N 1.089 A+A1
825,000.00 05/11/202005/11/2020
1.8632.561
5,935.42 824,686.50 824,881.96830,817.37
818,577.38824,512.79
02665WBZ3AMERICAN HONDA FINANCE CORPCORP
1.198% Fixed N 0.609 AA2
775,000.00 11/13/201911/13/2019
2.0292.640
5,941.67 774,566.00 774,863.79780,805.46
771,951.15777,892.82
02665WCH2AMERICAN HONDA FINANCE CORPCORP
0.937% Fixed N 1.176 AA2
600,000.00 06/16/202006/16/2020
3.0742.618
5,250.00 599,190.00 599,478.04604,728.04
602,706.00607,956.00
375558BR3GILEAD SCIENCES INCCORP
0.522% Fixed N 0.469 AA3
340,000.00 09/20/201909/20/2019
1.8682.632
192.19 339,881.00 339,971.74340,163.94
338,750.84338,943.03
------CORP
17.344% Fixed --- 1.021 AA-Aa3
11,205,000.00 04/18/202004/18/2020
2.3022.537
74,188.74 11,180,122.25 11,186,738.1311,260,926.86
11,183,869.5911,258,058.33
Security Type GASB 40 Trade Date Cape Coral, City of LT 1-5 (44760)As of 03/31/2019 Return to Table of Contents Dated: 04/12/2019
18
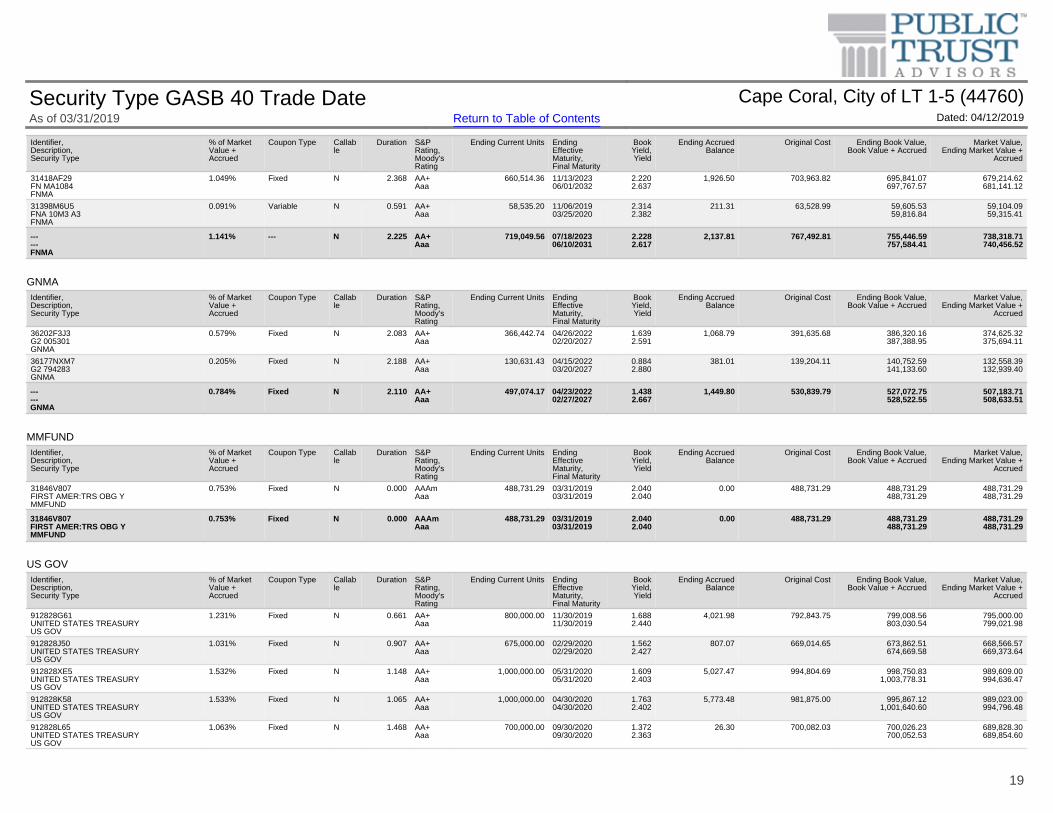
GNMA
MMFUND
US GOV
Identifier,Description,Security Type
% of MarketValue +Accrued
Coupon Type Callable
Duration S&PRating,Moody'sRating
Ending Current Units EndingEffectiveMaturity,Final Maturity
BookYield,Yield
Ending AccruedBalance
Original Cost Ending Book Value,Book Value + Accrued
Market Value,Ending Market Value +
Accrued
31418AF29FN MA1084FNMA
1.049% Fixed N 2.368 AA+Aaa
660,514.36 11/13/202306/01/2032
2.2202.637
1,926.50 703,963.82 695,841.07697,767.57
679,214.62681,141.12
31398M6U5FNA 10M3 A3FNMA
0.091% Variable N 0.591 AA+Aaa
58,535.20 11/06/201903/25/2020
2.3142.382
211.31 63,528.99 59,605.5359,816.84
59,104.0959,315.41
------FNMA
1.141% --- N 2.225 AA+Aaa
719,049.56 07/18/202306/10/2031
2.2282.617
2,137.81 767,492.81 755,446.59757,584.41
738,318.71740,456.52
Identifier,Description,Security Type
% of MarketValue +Accrued
Coupon Type Callable
Duration S&PRating,Moody'sRating
Ending Current Units EndingEffectiveMaturity,Final Maturity
BookYield,Yield
Ending AccruedBalance
Original Cost Ending Book Value,Book Value + Accrued
Market Value,Ending Market Value +
Accrued
36202F3J3G2 005301GNMA
0.579% Fixed N 2.083 AA+Aaa
366,442.74 04/26/202202/20/2027
1.6392.591
1,068.79 391,635.68 386,320.16387,388.95
374,625.32375,694.11
36177NXM7G2 794283GNMA
0.205% Fixed N 2.188 AA+Aaa
130,631.43 04/15/202203/20/2027
0.8842.880
381.01 139,204.11 140,752.59141,133.60
132,558.39132,939.40
------GNMA
0.784% Fixed N 2.110 AA+Aaa
497,074.17 04/23/202202/27/2027
1.4382.667
1,449.80 530,839.79 527,072.75528,522.55
507,183.71508,633.51
Identifier,Description,Security Type
% of MarketValue +Accrued
Coupon Type Callable
Duration S&PRating,Moody'sRating
Ending Current Units EndingEffectiveMaturity,Final Maturity
BookYield,Yield
Ending AccruedBalance
Original Cost Ending Book Value,Book Value + Accrued
Market Value,Ending Market Value +
Accrued
31846V807FIRST AMER:TRS OBG YMMFUND
0.753% Fixed N 0.000 AAAmAaa
488,731.29 03/31/201903/31/2019
2.0402.040
0.00 488,731.29 488,731.29488,731.29
488,731.29488,731.29
31846V807FIRST AMER:TRS OBG YMMFUND
0.753% Fixed N 0.000 AAAmAaa
488,731.29 03/31/201903/31/2019
2.0402.040
0.00 488,731.29 488,731.29488,731.29
488,731.29488,731.29
Identifier,Description,Security Type
% of MarketValue +Accrued
Coupon Type Callable
Duration S&PRating,Moody'sRating
Ending Current Units EndingEffectiveMaturity,Final Maturity
BookYield,Yield
Ending AccruedBalance
Original Cost Ending Book Value,Book Value + Accrued
Market Value,Ending Market Value +
Accrued
912828G61UNITED STATES TREASURYUS GOV
1.231% Fixed N 0.661 AA+Aaa
800,000.00 11/30/201911/30/2019
1.6882.440
4,021.98 792,843.75 799,008.56803,030.54
795,000.00799,021.98
912828J50UNITED STATES TREASURYUS GOV
1.031% Fixed N 0.907 AA+Aaa
675,000.00 02/29/202002/29/2020
1.5622.427
807.07 669,014.65 673,862.51674,669.58
668,566.57669,373.64
912828XE5UNITED STATES TREASURYUS GOV
1.532% Fixed N 1.148 AA+Aaa
1,000,000.00 05/31/202005/31/2020
1.6092.403
5,027.47 994,804.69 998,750.831,003,778.31
989,609.00994,636.47
912828K58UNITED STATES TREASURYUS GOV
1.533% Fixed N 1.065 AA+Aaa
1,000,000.00 04/30/202004/30/2020
1.7632.402
5,773.48 981,875.00 995,867.121,001,640.60
989,023.00994,796.48
912828L65UNITED STATES TREASURYUS GOV
1.063% Fixed N 1.468 AA+Aaa
700,000.00 09/30/202009/30/2020
1.3722.363
26.30 700,082.03 700,026.23700,052.53
689,828.30689,854.60
Security Type GASB 40 Trade Date Cape Coral, City of LT 1-5 (44760)As of 03/31/2019 Return to Table of Contents Dated: 04/12/2019
19
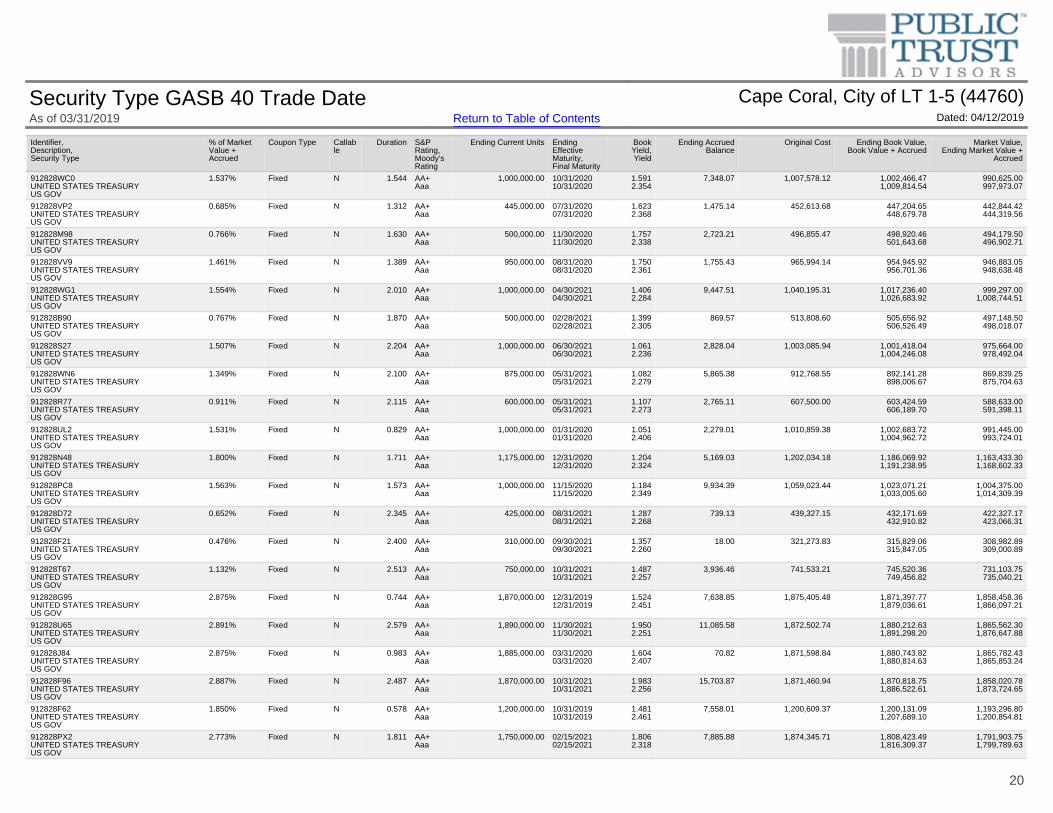
Identifier,Description,Security Type
% of MarketValue +Accrued
Coupon Type Callable
Duration S&PRating,Moody'sRating
Ending Current Units EndingEffectiveMaturity,Final Maturity
BookYield,Yield
Ending AccruedBalance
Original Cost Ending Book Value,Book Value + Accrued
Market Value,Ending Market Value +
Accrued
912828WC0UNITED STATES TREASURYUS GOV
1.537% Fixed N 1.544 AA+Aaa
1,000,000.00 10/31/202010/31/2020
1.5912.354
7,348.07 1,007,578.12 1,002,466.471,009,814.54
990,625.00997,973.07
912828VP2UNITED STATES TREASURYUS GOV
0.685% Fixed N 1.312 AA+Aaa
445,000.00 07/31/202007/31/2020
1.6232.368
1,475.14 452,613.68 447,204.65448,679.78
442,844.42444,319.56
912828M98UNITED STATES TREASURYUS GOV
0.766% Fixed N 1.630 AA+Aaa
500,000.00 11/30/202011/30/2020
1.7572.338
2,723.21 496,855.47 498,920.46501,643.68
494,179.50496,902.71
912828VV9UNITED STATES TREASURYUS GOV
1.461% Fixed N 1.389 AA+Aaa
950,000.00 08/31/202008/31/2020
1.7502.361
1,755.43 965,994.14 954,945.92956,701.36
946,883.05948,638.48
912828WG1UNITED STATES TREASURYUS GOV
1.554% Fixed N 2.010 AA+Aaa
1,000,000.00 04/30/202104/30/2021
1.4062.284
9,447.51 1,040,195.31 1,017,236.401,026,683.92
999,297.001,008,744.51
912828B90UNITED STATES TREASURYUS GOV
0.767% Fixed N 1.870 AA+Aaa
500,000.00 02/28/202102/28/2021
1.3992.305
869.57 513,808.60 505,656.92506,526.49
497,148.50498,018.07
912828S27UNITED STATES TREASURYUS GOV
1.507% Fixed N 2.204 AA+Aaa
1,000,000.00 06/30/202106/30/2021
1.0612.236
2,828.04 1,003,085.94 1,001,418.041,004,246.08
975,664.00978,492.04
912828WN6UNITED STATES TREASURYUS GOV
1.349% Fixed N 2.100 AA+Aaa
875,000.00 05/31/202105/31/2021
1.0822.279
5,865.38 912,768.55 892,141.28898,006.67
869,839.25875,704.63
912828R77UNITED STATES TREASURYUS GOV
0.911% Fixed N 2.115 AA+Aaa
600,000.00 05/31/202105/31/2021
1.1072.273
2,765.11 607,500.00 603,424.59606,189.70
588,633.00591,398.11
912828UL2UNITED STATES TREASURYUS GOV
1.531% Fixed N 0.829 AA+Aaa
1,000,000.00 01/31/202001/31/2020
1.0512.406
2,279.01 1,010,859.38 1,002,683.721,004,962.72
991,445.00993,724.01
912828N48UNITED STATES TREASURYUS GOV
1.800% Fixed N 1.711 AA+Aaa
1,175,000.00 12/31/202012/31/2020
1.2042.324
5,169.03 1,202,034.18 1,186,069.921,191,238.95
1,163,433.301,168,602.33
912828PC8UNITED STATES TREASURYUS GOV
1.563% Fixed N 1.573 AA+Aaa
1,000,000.00 11/15/202011/15/2020
1.1842.349
9,934.39 1,059,023.44 1,023,071.211,033,005.60
1,004,375.001,014,309.39
912828D72UNITED STATES TREASURYUS GOV
0.652% Fixed N 2.345 AA+Aaa
425,000.00 08/31/202108/31/2021
1.2872.268
739.13 439,327.15 432,171.69432,910.82
422,327.17423,066.31
912828F21UNITED STATES TREASURYUS GOV
0.476% Fixed N 2.400 AA+Aaa
310,000.00 09/30/202109/30/2021
1.3572.260
18.00 321,273.83 315,829.06315,847.05
308,982.89309,000.89
912828T67UNITED STATES TREASURYUS GOV
1.132% Fixed N 2.513 AA+Aaa
750,000.00 10/31/202110/31/2021
1.4872.257
3,936.46 741,533.21 745,520.36749,456.82
731,103.75735,040.21
912828G95UNITED STATES TREASURYUS GOV
2.875% Fixed N 0.744 AA+Aaa
1,870,000.00 12/31/201912/31/2019
1.5242.451
7,638.85 1,875,405.48 1,871,397.771,879,036.61
1,858,458.361,866,097.21
912828U65UNITED STATES TREASURYUS GOV
2.891% Fixed N 2.579 AA+Aaa
1,890,000.00 11/30/202111/30/2021
1.9502.251
11,085.58 1,872,502.74 1,880,212.631,891,298.20
1,865,562.301,876,647.88
912828J84UNITED STATES TREASURYUS GOV
2.875% Fixed N 0.983 AA+Aaa
1,885,000.00 03/31/202003/31/2020
1.6042.407
70.82 1,871,598.84 1,880,743.821,880,814.63
1,865,782.431,865,853.24
912828F96UNITED STATES TREASURYUS GOV
2.887% Fixed N 2.487 AA+Aaa
1,870,000.00 10/31/202110/31/2021
1.9832.256
15,703.87 1,871,460.94 1,870,818.751,886,522.61
1,858,020.781,873,724.65
912828F62UNITED STATES TREASURYUS GOV
1.850% Fixed N 0.578 AA+Aaa
1,200,000.00 10/31/201910/31/2019
1.4812.461
7,558.01 1,200,609.37 1,200,131.091,207,689.10
1,193,296.801,200,854.81
912828PX2UNITED STATES TREASURYUS GOV
2.773% Fixed N 1.811 AA+Aaa
1,750,000.00 02/15/202102/15/2021
1.8062.318
7,885.88 1,874,345.71 1,808,423.491,816,309.37
1,791,903.751,799,789.63
Security Type GASB 40 Trade Date Cape Coral, City of LT 1-5 (44760)As of 03/31/2019 Return to Table of Contents Dated: 04/12/2019
20
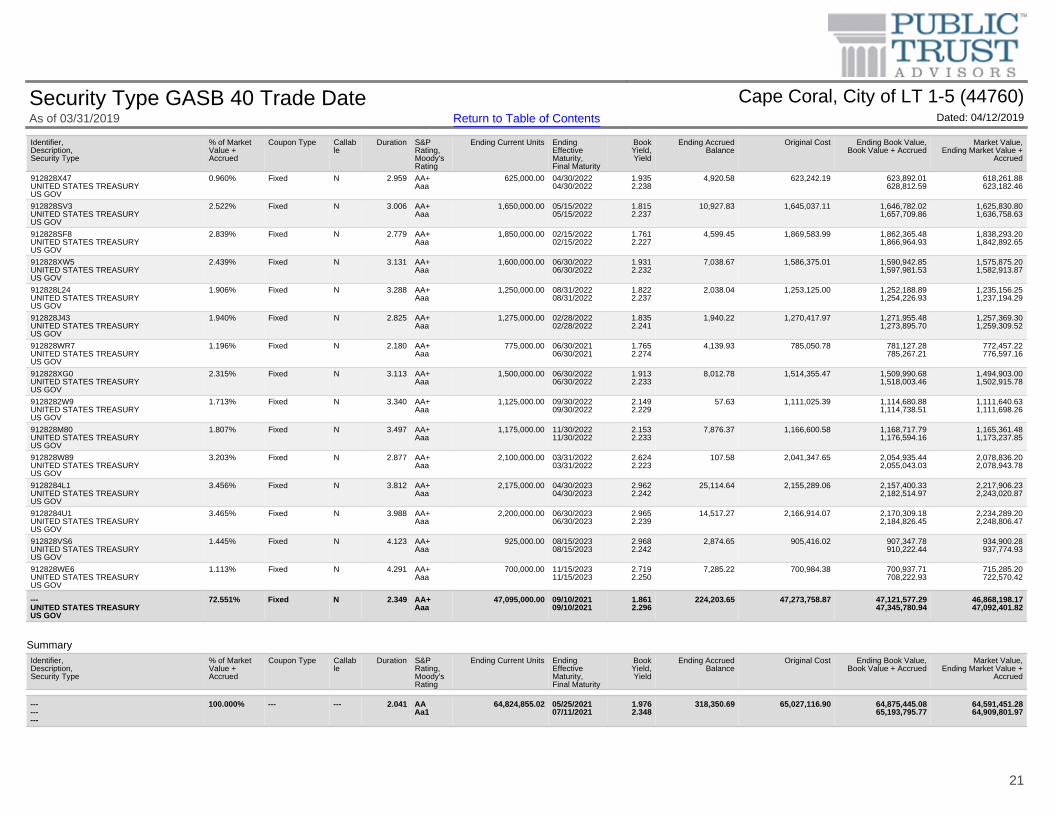
Summary
Identifier,Description,Security Type
% of MarketValue +Accrued
Coupon Type Callable
Duration S&PRating,Moody'sRating
Ending Current Units EndingEffectiveMaturity,Final Maturity
BookYield,Yield
Ending AccruedBalance
Original Cost Ending Book Value,Book Value + Accrued
Market Value,Ending Market Value +
Accrued
912828X47UNITED STATES TREASURYUS GOV
0.960% Fixed N 2.959 AA+Aaa
625,000.00 04/30/202204/30/2022
1.9352.238
4,920.58 623,242.19 623,892.01628,812.59
618,261.88623,182.46
912828SV3UNITED STATES TREASURYUS GOV
2.522% Fixed N 3.006 AA+Aaa
1,650,000.00 05/15/202205/15/2022
1.8152.237
10,927.83 1,645,037.11 1,646,782.021,657,709.86
1,625,830.801,636,758.63
912828SF8UNITED STATES TREASURYUS GOV
2.839% Fixed N 2.779 AA+Aaa
1,850,000.00 02/15/202202/15/2022
1.7612.227
4,599.45 1,869,583.99 1,862,365.481,866,964.93
1,838,293.201,842,892.65
912828XW5UNITED STATES TREASURYUS GOV
2.439% Fixed N 3.131 AA+Aaa
1,600,000.00 06/30/202206/30/2022
1.9312.232
7,038.67 1,586,375.01 1,590,942.851,597,981.53
1,575,875.201,582,913.87
912828L24UNITED STATES TREASURYUS GOV
1.906% Fixed N 3.288 AA+Aaa
1,250,000.00 08/31/202208/31/2022
1.8222.237
2,038.04 1,253,125.00 1,252,188.891,254,226.93
1,235,156.251,237,194.29
912828J43UNITED STATES TREASURYUS GOV
1.940% Fixed N 2.825 AA+Aaa
1,275,000.00 02/28/202202/28/2022
1.8352.241
1,940.22 1,270,417.97 1,271,955.481,273,895.70
1,257,369.301,259,309.52
912828WR7UNITED STATES TREASURYUS GOV
1.196% Fixed N 2.180 AA+Aaa
775,000.00 06/30/202106/30/2021
1.7652.274
4,139.93 785,050.78 781,127.28785,267.21
772,457.22776,597.16
912828XG0UNITED STATES TREASURYUS GOV
2.315% Fixed N 3.113 AA+Aaa
1,500,000.00 06/30/202206/30/2022
1.9132.233
8,012.78 1,514,355.47 1,509,990.681,518,003.46
1,494,903.001,502,915.78
9128282W9UNITED STATES TREASURYUS GOV
1.713% Fixed N 3.340 AA+Aaa
1,125,000.00 09/30/202209/30/2022
2.1492.229
57.63 1,111,025.39 1,114,680.881,114,738.51
1,111,640.631,111,698.26
912828M80UNITED STATES TREASURYUS GOV
1.807% Fixed N 3.497 AA+Aaa
1,175,000.00 11/30/202211/30/2022
2.1532.233
7,876.37 1,166,600.58 1,168,717.791,176,594.16
1,165,361.481,173,237.85
912828W89UNITED STATES TREASURYUS GOV
3.203% Fixed N 2.877 AA+Aaa
2,100,000.00 03/31/202203/31/2022
2.6242.223
107.58 2,041,347.65 2,054,935.442,055,043.03
2,078,836.202,078,943.78
9128284L1UNITED STATES TREASURYUS GOV
3.456% Fixed N 3.812 AA+Aaa
2,175,000.00 04/30/202304/30/2023
2.9622.242
25,114.64 2,155,289.06 2,157,400.332,182,514.97
2,217,906.232,243,020.87
9128284U1UNITED STATES TREASURYUS GOV
3.465% Fixed N 3.988 AA+Aaa
2,200,000.00 06/30/202306/30/2023
2.9652.239
14,517.27 2,166,914.07 2,170,309.182,184,826.45
2,234,289.202,248,806.47
912828VS6UNITED STATES TREASURYUS GOV
1.445% Fixed N 4.123 AA+Aaa
925,000.00 08/15/202308/15/2023
2.9682.242
2,874.65 905,416.02 907,347.78910,222.44
934,900.28937,774.93
912828WE6UNITED STATES TREASURYUS GOV
1.113% Fixed N 4.291 AA+Aaa
700,000.00 11/15/202311/15/2023
2.7192.250
7,285.22 700,984.38 700,937.71708,222.93
715,285.20722,570.42
---UNITED STATES TREASURYUS GOV
72.551% Fixed N 2.349 AA+Aaa
47,095,000.00 09/10/202109/10/2021
1.8612.296
224,203.65 47,273,758.87 47,121,577.2947,345,780.94
46,868,198.1747,092,401.82
Identifier,Description,Security Type
% of MarketValue +Accrued
Coupon Type Callable
Duration S&PRating,Moody'sRating
Ending Current Units EndingEffectiveMaturity,Final Maturity
BookYield,Yield
Ending AccruedBalance
Original Cost Ending Book Value,Book Value + Accrued
Market Value,Ending Market Value +
Accrued
---------
100.000% --- --- 2.041 AAAa1
64,824,855.02 05/25/202107/11/2021
1.9762.348
318,350.69 65,027,116.90 64,875,445.0865,193,795.77
64,591,451.2864,909,801.97
Security Type GASB 40 Trade Date Cape Coral, City of LT 1-5 (44760)As of 03/31/2019 Return to Table of Contents Dated: 04/12/2019
21
* Grouped by: Security Type. * Groups Sorted by: Security Type. * Filtered By: Description ≠ "Payable" and Description ≠ "Receivable". * Weighted by: Ending Market Value + Accrued, except Book Yield by Base Book Value + Accrued.
Security Type GASB 40 Trade Date Cape Coral, City of LT 1-5 (44760)As of 03/31/2019 Return to Table of Contents Dated: 04/12/2019
22
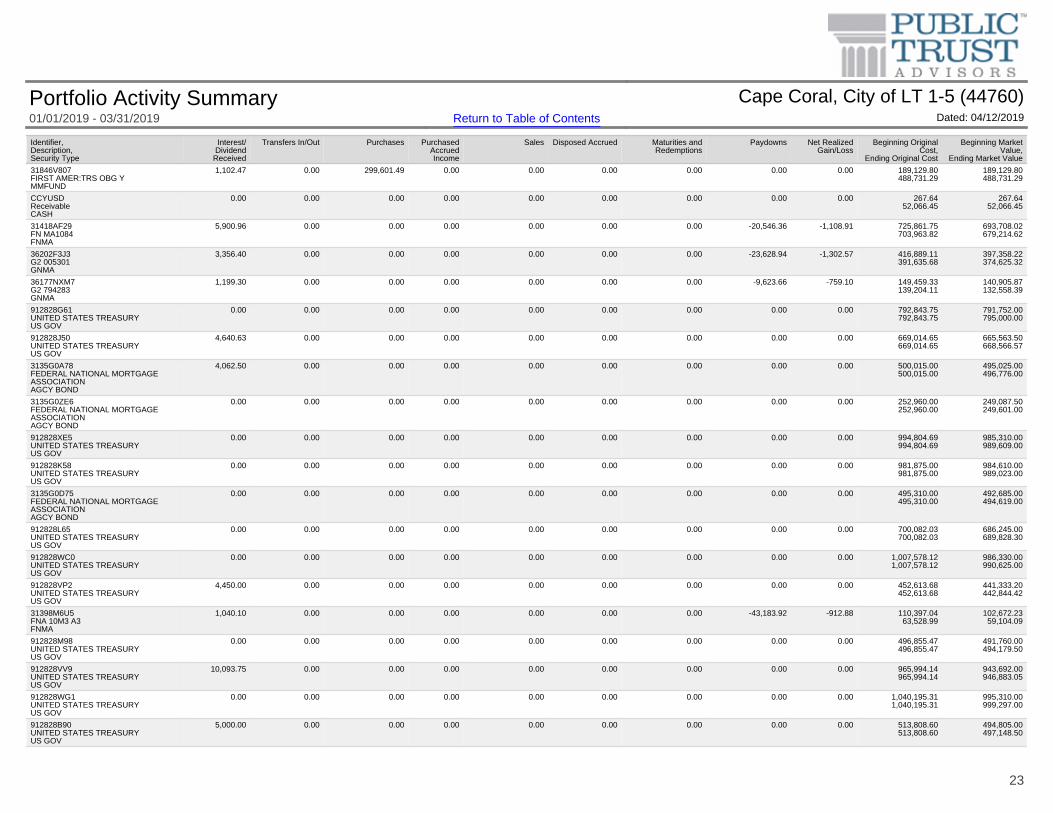
Identifier,Description,Security Type
Interest/Dividend
Received
Transfers In/Out Purchases PurchasedAccruedIncome
Sales Disposed Accrued Maturities andRedemptions
Paydowns Net RealizedGain/Loss
Beginning OriginalCost,
Ending Original Cost
Beginning MarketValue,
Ending Market Value
31846V807FIRST AMER:TRS OBG YMMFUND
1,102.47 0.00 299,601.49 0.00 0.00 0.00 0.00 0.00 0.00 189,129.80488,731.29
189,129.80488,731.29
CCYUSDReceivableCASH
0.00 0.00 0.00 0.00 0.00 0.00 0.00 0.00 0.00 267.6452,066.45
267.6452,066.45
31418AF29FN MA1084FNMA
5,900.96 0.00 0.00 0.00 0.00 0.00 0.00 -20,546.36 -1,108.91 725,861.75703,963.82
693,708.02679,214.62
36202F3J3G2 005301GNMA
3,356.40 0.00 0.00 0.00 0.00 0.00 0.00 -23,628.94 -1,302.57 416,889.11391,635.68
397,358.22374,625.32
36177NXM7G2 794283GNMA
1,199.30 0.00 0.00 0.00 0.00 0.00 0.00 -9,623.66 -759.10 149,459.33139,204.11
140,905.87132,558.39
912828G61UNITED STATES TREASURYUS GOV
0.00 0.00 0.00 0.00 0.00 0.00 0.00 0.00 0.00 792,843.75792,843.75
791,752.00795,000.00
912828J50UNITED STATES TREASURYUS GOV
4,640.63 0.00 0.00 0.00 0.00 0.00 0.00 0.00 0.00 669,014.65669,014.65
665,563.50668,566.57
3135G0A78FEDERAL NATIONAL MORTGAGEASSOCIATIONAGCY BOND
4,062.50 0.00 0.00 0.00 0.00 0.00 0.00 0.00 0.00 500,015.00500,015.00
495,025.00496,776.00
3135G0ZE6FEDERAL NATIONAL MORTGAGEASSOCIATIONAGCY BOND
0.00 0.00 0.00 0.00 0.00 0.00 0.00 0.00 0.00 252,960.00252,960.00
249,087.50249,601.00
912828XE5UNITED STATES TREASURYUS GOV
0.00 0.00 0.00 0.00 0.00 0.00 0.00 0.00 0.00 994,804.69994,804.69
985,310.00989,609.00
912828K58UNITED STATES TREASURYUS GOV
0.00 0.00 0.00 0.00 0.00 0.00 0.00 0.00 0.00 981,875.00981,875.00
984,610.00989,023.00
3135G0D75FEDERAL NATIONAL MORTGAGEASSOCIATIONAGCY BOND
0.00 0.00 0.00 0.00 0.00 0.00 0.00 0.00 0.00 495,310.00495,310.00
492,685.00494,619.00
912828L65UNITED STATES TREASURYUS GOV
0.00 0.00 0.00 0.00 0.00 0.00 0.00 0.00 0.00 700,082.03700,082.03
686,245.00689,828.30
912828WC0UNITED STATES TREASURYUS GOV
0.00 0.00 0.00 0.00 0.00 0.00 0.00 0.00 0.00 1,007,578.121,007,578.12
986,330.00990,625.00
912828VP2UNITED STATES TREASURYUS GOV
4,450.00 0.00 0.00 0.00 0.00 0.00 0.00 0.00 0.00 452,613.68452,613.68
441,333.20442,844.42
31398M6U5FNA 10M3 A3FNMA
1,040.10 0.00 0.00 0.00 0.00 0.00 0.00 -43,183.92 -912.88 110,397.0463,528.99
102,672.2359,104.09
912828M98UNITED STATES TREASURYUS GOV
0.00 0.00 0.00 0.00 0.00 0.00 0.00 0.00 0.00 496,855.47496,855.47
491,760.00494,179.50
912828VV9UNITED STATES TREASURYUS GOV
10,093.75 0.00 0.00 0.00 0.00 0.00 0.00 0.00 0.00 965,994.14965,994.14
943,692.00946,883.05
912828WG1UNITED STATES TREASURYUS GOV
0.00 0.00 0.00 0.00 0.00 0.00 0.00 0.00 0.00 1,040,195.311,040,195.31
995,310.00999,297.00
912828B90UNITED STATES TREASURYUS GOV
5,000.00 0.00 0.00 0.00 0.00 0.00 0.00 0.00 0.00 513,808.60513,808.60
494,805.00497,148.50
Portfolio Activity Summary Cape Coral, City of LT 1-5 (44760)01/01/2019 - 03/31/2019 Return to Table of Contents Dated: 04/12/2019
23

Identifier,Description,Security Type
Interest/Dividend
Received
Transfers In/Out Purchases PurchasedAccruedIncome
Sales Disposed Accrued Maturities andRedemptions
Paydowns Net RealizedGain/Loss
Beginning OriginalCost,
Ending Original Cost
Beginning MarketValue,
Ending Market Value
912828S27UNITED STATES TREASURYUS GOV
0.00 0.00 0.00 0.00 0.00 0.00 0.00 0.00 0.00 1,003,085.941,003,085.94
967,850.00975,664.00
912828WN6UNITED STATES TREASURYUS GOV
0.00 0.00 0.00 0.00 0.00 0.00 0.00 0.00 0.00 912,768.55912,768.55
865,296.25869,839.25
912828R77UNITED STATES TREASURYUS GOV
0.00 0.00 0.00 0.00 0.00 0.00 0.00 0.00 0.00 607,500.00607,500.00
584,580.00588,633.00
912828UL2UNITED STATES TREASURYUS GOV
6,875.00 0.00 0.00 0.00 0.00 0.00 0.00 0.00 0.00 1,010,859.381,010,859.38
986,910.00991,445.00
912828N48UNITED STATES TREASURYUS GOV
0.00 0.00 0.00 0.00 0.00 0.00 0.00 0.00 0.00 1,202,034.181,202,034.18
1,158,244.501,163,433.30
912828PC8UNITED STATES TREASURYUS GOV
0.00 0.00 0.00 0.00 0.00 0.00 0.00 0.00 0.00 1,059,023.441,059,023.44
1,001,840.001,004,375.00
3135G0K69FEDERAL NATIONAL MORTGAGEASSOCIATIONAGCY BOND
0.00 0.00 0.00 0.00 0.00 0.00 0.00 0.00 0.00 318,918.40318,918.40
310,729.60313,092.16
48125LRG9JPMORGAN CHASE BANK NACORP
2,268.75 0.00 0.00 0.00 0.00 0.00 0.00 0.00 0.00 274,719.50274,719.50
272,470.00273,680.83
912828D72UNITED STATES TREASURYUS GOV
4,250.00 0.00 0.00 0.00 0.00 0.00 0.00 0.00 0.00 439,327.15439,327.15
419,721.50422,327.17
912828F21UNITED STATES TREASURYUS GOV
0.00 0.00 0.00 0.00 0.00 0.00 0.00 0.00 0.00 321,273.83321,273.83
307,058.10308,982.89
912828T67UNITED STATES TREASURYUS GOV
0.00 0.00 0.00 0.00 0.00 0.00 0.00 0.00 0.00 741,533.21741,533.21
724,980.00731,103.75
912828G95UNITED STATES TREASURYUS GOV
0.00 0.00 0.00 0.00 0.00 0.00 0.00 0.00 0.00 1,875,405.481,875,405.48
1,851,374.801,858,458.36
912828U65UNITED STATES TREASURYUS GOV
0.00 0.00 0.00 0.00 0.00 0.00 0.00 0.00 0.00 1,872,502.741,872,502.74
1,851,897.601,865,562.30
912828J84UNITED STATES TREASURYUS GOV
0.00 0.00 0.00 0.00 0.00 0.00 0.00 0.00 0.00 1,871,598.841,871,598.84
1,857,309.351,865,782.43
912828F96UNITED STATES TREASURYUS GOV
0.00 0.00 0.00 0.00 0.00 0.00 0.00 0.00 0.00 1,871,460.941,871,460.94
1,845,970.501,858,020.78
912828F62UNITED STATES TREASURYUS GOV
0.00 0.00 0.00 0.00 0.00 0.00 0.00 0.00 0.00 1,200,609.371,200,609.37
1,188,792.001,193,296.80
912828PX2UNITED STATES TREASURYUS GOV
31,718.75 0.00 0.00 0.00 0.00 0.00 0.00 0.00 0.00 1,874,345.711,874,345.71
1,790,477.501,791,903.75
459200JN2INTERNATIONAL BUSINESSMACHINES CORPCORP
5,652.50 0.00 0.00 0.00 0.00 0.00 0.00 0.00 0.00 594,428.80594,428.80
588,228.90591,259.83
594918BV5MICROSOFT CORPCORP
4,625.00 0.00 0.00 0.00 0.00 0.00 0.00 0.00 0.00 499,665.00499,665.00
496,370.00497,040.50
037833CS7APPLE INCCORP
0.00 0.00 0.00 0.00 0.00 0.00 0.00 0.00 0.00 474,515.50474,515.50
469,015.00471,303.55
912828X47UNITED STATES TREASURYUS GOV
0.00 0.00 0.00 0.00 0.00 0.00 0.00 0.00 0.00 623,242.19623,242.19
613,037.50618,261.88
Portfolio Activity Summary Cape Coral, City of LT 1-5 (44760)01/01/2019 - 03/31/2019 Return to Table of Contents Dated: 04/12/2019
24
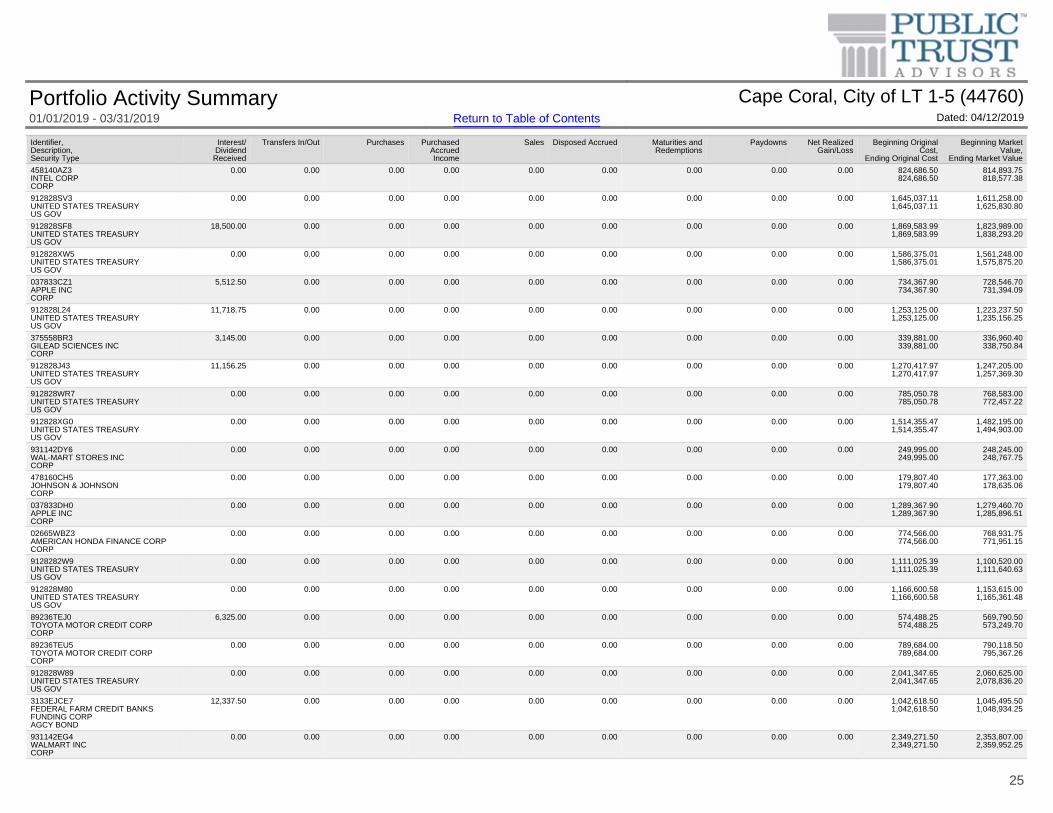
Identifier,Description,Security Type
Interest/Dividend
Received
Transfers In/Out Purchases PurchasedAccruedIncome
Sales Disposed Accrued Maturities andRedemptions
Paydowns Net RealizedGain/Loss
Beginning OriginalCost,
Ending Original Cost
Beginning MarketValue,
Ending Market Value
458140AZ3INTEL CORPCORP
0.00 0.00 0.00 0.00 0.00 0.00 0.00 0.00 0.00 824,686.50824,686.50
814,893.75818,577.38
912828SV3UNITED STATES TREASURYUS GOV
0.00 0.00 0.00 0.00 0.00 0.00 0.00 0.00 0.00 1,645,037.111,645,037.11
1,611,258.001,625,830.80
912828SF8UNITED STATES TREASURYUS GOV
18,500.00 0.00 0.00 0.00 0.00 0.00 0.00 0.00 0.00 1,869,583.991,869,583.99
1,823,989.001,838,293.20
912828XW5UNITED STATES TREASURYUS GOV
0.00 0.00 0.00 0.00 0.00 0.00 0.00 0.00 0.00 1,586,375.011,586,375.01
1,561,248.001,575,875.20
037833CZ1APPLE INCCORP
5,512.50 0.00 0.00 0.00 0.00 0.00 0.00 0.00 0.00 734,367.90734,367.90
728,546.70731,394.09
912828L24UNITED STATES TREASURYUS GOV
11,718.75 0.00 0.00 0.00 0.00 0.00 0.00 0.00 0.00 1,253,125.001,253,125.00
1,223,237.501,235,156.25
375558BR3GILEAD SCIENCES INCCORP
3,145.00 0.00 0.00 0.00 0.00 0.00 0.00 0.00 0.00 339,881.00339,881.00
336,960.40338,750.84
912828J43UNITED STATES TREASURYUS GOV
11,156.25 0.00 0.00 0.00 0.00 0.00 0.00 0.00 0.00 1,270,417.971,270,417.97
1,247,205.001,257,369.30
912828WR7UNITED STATES TREASURYUS GOV
0.00 0.00 0.00 0.00 0.00 0.00 0.00 0.00 0.00 785,050.78785,050.78
768,583.00772,457.22
912828XG0UNITED STATES TREASURYUS GOV
0.00 0.00 0.00 0.00 0.00 0.00 0.00 0.00 0.00 1,514,355.471,514,355.47
1,482,195.001,494,903.00
931142DY6WAL-MART STORES INCCORP
0.00 0.00 0.00 0.00 0.00 0.00 0.00 0.00 0.00 249,995.00249,995.00
248,245.00248,767.75
478160CH5JOHNSON & JOHNSONCORP
0.00 0.00 0.00 0.00 0.00 0.00 0.00 0.00 0.00 179,807.40179,807.40
177,363.00178,635.06
037833DH0APPLE INCCORP
0.00 0.00 0.00 0.00 0.00 0.00 0.00 0.00 0.00 1,289,367.901,289,367.90
1,279,460.701,285,896.51
02665WBZ3AMERICAN HONDA FINANCE CORPCORP
0.00 0.00 0.00 0.00 0.00 0.00 0.00 0.00 0.00 774,566.00774,566.00
768,931.75771,951.15
9128282W9UNITED STATES TREASURYUS GOV
0.00 0.00 0.00 0.00 0.00 0.00 0.00 0.00 0.00 1,111,025.391,111,025.39
1,100,520.001,111,640.63
912828M80UNITED STATES TREASURYUS GOV
0.00 0.00 0.00 0.00 0.00 0.00 0.00 0.00 0.00 1,166,600.581,166,600.58
1,153,615.001,165,361.48
89236TEJ0TOYOTA MOTOR CREDIT CORPCORP
6,325.00 0.00 0.00 0.00 0.00 0.00 0.00 0.00 0.00 574,488.25574,488.25
569,790.50573,249.70
89236TEU5TOYOTA MOTOR CREDIT CORPCORP
0.00 0.00 0.00 0.00 0.00 0.00 0.00 0.00 0.00 789,684.00789,684.00
790,118.50795,367.26
912828W89UNITED STATES TREASURYUS GOV
0.00 0.00 0.00 0.00 0.00 0.00 0.00 0.00 0.00 2,041,347.652,041,347.65
2,060,625.002,078,836.20
3133EJCE7FEDERAL FARM CREDIT BANKSFUNDING CORPAGCY BOND
12,337.50 0.00 0.00 0.00 0.00 0.00 0.00 0.00 0.00 1,042,618.501,042,618.50
1,045,495.501,048,934.25
931142EG4WALMART INCCORP
0.00 0.00 0.00 0.00 0.00 0.00 0.00 0.00 0.00 2,349,271.502,349,271.50
2,353,807.002,359,952.25
Portfolio Activity Summary Cape Coral, City of LT 1-5 (44760)01/01/2019 - 03/31/2019 Return to Table of Contents Dated: 04/12/2019
25
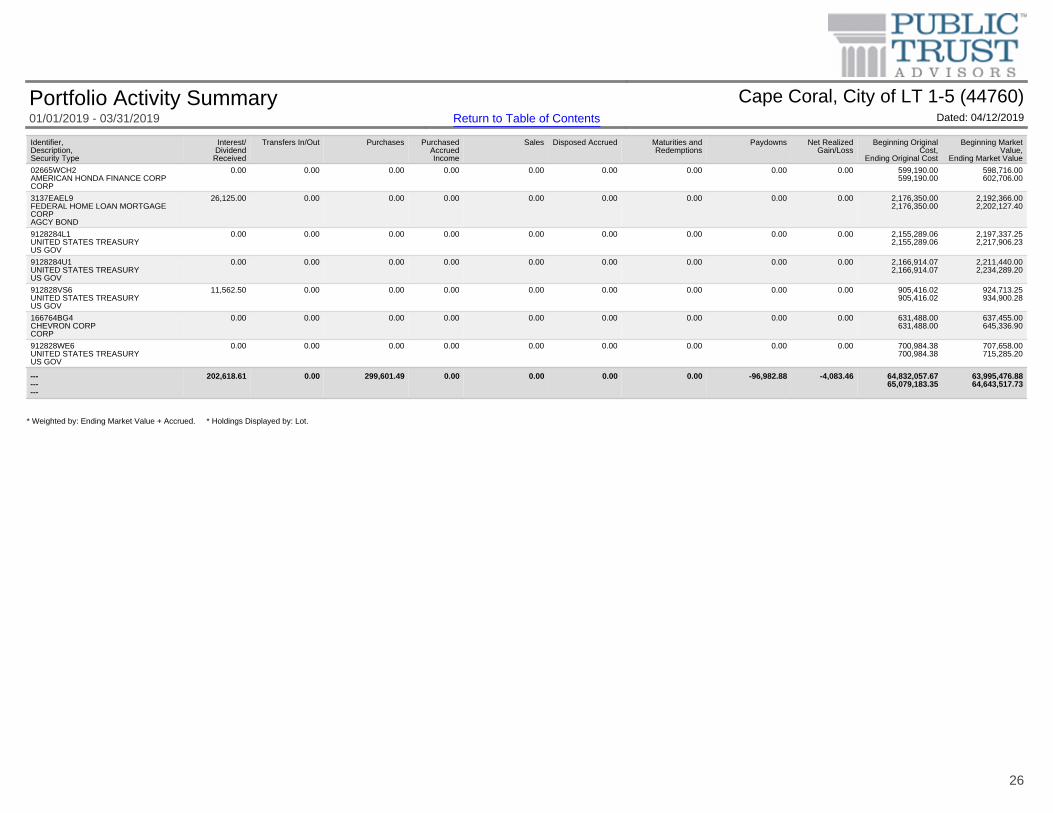
* Weighted by: Ending Market Value + Accrued. * Holdings Displayed by: Lot.
Identifier,Description,Security Type
Interest/Dividend
Received
Transfers In/Out Purchases PurchasedAccruedIncome
Sales Disposed Accrued Maturities andRedemptions
Paydowns Net RealizedGain/Loss
Beginning OriginalCost,
Ending Original Cost
Beginning MarketValue,
Ending Market Value
02665WCH2AMERICAN HONDA FINANCE CORPCORP
0.00 0.00 0.00 0.00 0.00 0.00 0.00 0.00 0.00 599,190.00599,190.00
598,716.00602,706.00
3137EAEL9FEDERAL HOME LOAN MORTGAGECORPAGCY BOND
26,125.00 0.00 0.00 0.00 0.00 0.00 0.00 0.00 0.00 2,176,350.002,176,350.00
2,192,366.002,202,127.40
9128284L1UNITED STATES TREASURYUS GOV
0.00 0.00 0.00 0.00 0.00 0.00 0.00 0.00 0.00 2,155,289.062,155,289.06
2,197,337.252,217,906.23
9128284U1UNITED STATES TREASURYUS GOV
0.00 0.00 0.00 0.00 0.00 0.00 0.00 0.00 0.00 2,166,914.072,166,914.07
2,211,440.002,234,289.20
912828VS6UNITED STATES TREASURYUS GOV
11,562.50 0.00 0.00 0.00 0.00 0.00 0.00 0.00 0.00 905,416.02905,416.02
924,713.25934,900.28
166764BG4CHEVRON CORPCORP
0.00 0.00 0.00 0.00 0.00 0.00 0.00 0.00 0.00 631,488.00631,488.00
637,455.00645,336.90
912828WE6UNITED STATES TREASURYUS GOV
0.00 0.00 0.00 0.00 0.00 0.00 0.00 0.00 0.00 700,984.38700,984.38
707,658.00715,285.20
---------
202,618.61 0.00 299,601.49 0.00 0.00 0.00 0.00 -96,982.88 -4,083.46 64,832,057.6765,079,183.35
63,995,476.8864,643,517.73
Portfolio Activity Summary Cape Coral, City of LT 1-5 (44760)01/01/2019 - 03/31/2019 Return to Table of Contents Dated: 04/12/2019
26
Additional Disclosure:
The information on this website is for general purposes only and is not intended to provide specific advice or recommendations. All information presented on this website is obtained via electronic data transfer from theCustodian. While this information is reconciled on a daily basis, when available, accuracy is relied upon from the Custodian. Please review the data carefully. Should you have any questions regarding the informationpresented, calculation methodology, investment portfolio or security detail, or any other facet of the data, please feel free to contact us.
This data is intended to detail our investment advisory activity as well as the activity of any client accounts managed by Public Trust Advisors, LLC (Public Trust). The custodian bank maintains the control of assets andexecutes and settles all investment transactions. The custodian statement is the official record of security and cash holdings transactions. Public Trust recognizes that clients may use these reports to facilitate record keeping;therefore it is recommended that the client reconcile this statement with their custodian bank statement. Many custodians use a settlement date basis which may result in the need to reconcile due to a timing difference.Please contact your relationship manager or call our toll free number 855-395-3954 with questions regarding your account.
Public Trust does not have the authority to withdraw funds from or deposit funds to the custodian. Our clients retain responsibility for their internal accounting policies; implementing and enforcing internal controls andgenerating ledger entries or otherwise recording transactions.
Pricing sources from our reporting platform are provided by Clearwater Analytics®. Clearwater utilizes a hierarchical pricing model with multiple options for pricing sources. These options include custodial pricing, S&P CapitalIQ and other sources. Since multiple pricing hierarchies are offered through Clearwater Analytics, and client preferences regarding pricing sources may differ, it is important to verify the specific pricing hierarchy for eachportfolio. Securities with short maturities and infrequent secondary market trades are typically priced via mathematical calculations. The securities in this investment portfolio, including shares of mutual funds, are notguaranteed or otherwise protected by Public Trust, the FDIC (except for certain non-negotiable certificates of deposit) or any government agency, unless otherwise specifically stated. Investing involves risk, including thepossible loss of principal.
Past performance is not an indicator of future performance or results.
Public Trust statements present beginning and ending balances and are based on Market Value plus accrued interest on a Trade Date basis. Customized reports made available to the end user either from Public Trust orthrough the online reporting platform may present information and portfolio analytics using various optional methods including, but not limited to, historical cost, amortized cost, and market value. Custom reports may also differfrom the information received from the custodian as a result of additional formulas and filters created based on end user preferences.
The investment advisor providing these services is Public Trust Advisors, LLC, an investment adviser registered with the U.S. Securities and Exchange Commission (SEC) under the Investment Advisers Act of 1940, asamended. Registration with the SEC does not imply a certain level of skill or training. Public Trust is required to maintain a written disclosure brochure of our background and business experience. If you would like to receive acopy of our current disclosure brochure, privacy policy, or code of ethics please contact us at the address below.
Public Trust Advisors
717 17th St. Suite 1850
Denver, CO 80202
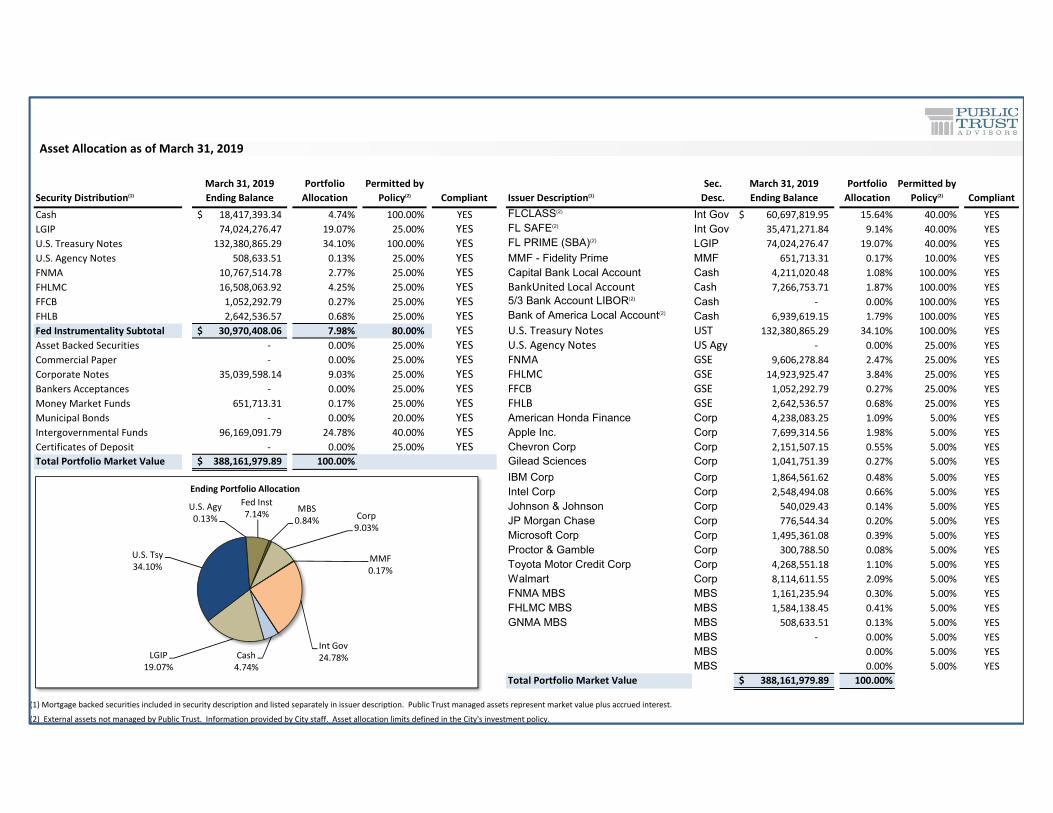
Security Distribution(1)
March 31, 2019Ending Balance
Portfolio Allocation
Permitted by Policy(2) Compliant Issuer Description(1)
Sec. Desc.
March 31, 2019Ending Balance
Portfolio Allocation
Permitted by Policy(2) Compliant
Cash 18,417,393.34$ 4.74% 100.00% YES FLCLASS(2) Int Gov 60,697,819.95$ 15.64% 40.00% YESLGIP 74,024,276.47 19.07% 25.00% YES FL SAFE(2) Int Gov 35,471,271.84 9.14% 40.00% YESU.S. Treasury Notes 132,380,865.29 34.10% 100.00% YES FL PRIME (SBA)(2) LGIP 74,024,276.47 19.07% 40.00% YESU.S. Agency Notes 508,633.51 0.13% 25.00% YES MMF - Fidelity Prime MMF 651,713.31 0.17% 10.00% YESFNMA 10,767,514.78 2.77% 25.00% YES Capital Bank Local Account Cash 4,211,020.48 1.08% 100.00% YESFHLMC 16,508,063.92 4.25% 25.00% YES BankUnited Local Account Cash 7,266,753.71 1.87% 100.00% YESFFCB 1,052,292.79 0.27% 25.00% YES 5/3 Bank Account LIBOR(2) Cash ‐ 0.00% 100.00% YESFHLB 2,642,536.57 0.68% 25.00% YES Bank of America Local Account(2) Cash 6,939,619.15 1.79% 100.00% YESFed Instrumentality Subtotal 30,970,408.06$ 7.98% 80.00% YES U.S. Treasury Notes UST 132,380,865.29 34.10% 100.00% YESAsset Backed Securities ‐ 0.00% 25.00% YES U.S. Agency Notes US Agy ‐ 0.00% 25.00% YESCommercial Paper ‐ 0.00% 25.00% YES FNMA GSE 9,606,278.84 2.47% 25.00% YESCorporate Notes 35,039,598.14 9.03% 25.00% YES FHLMC GSE 14,923,925.47 3.84% 25.00% YESBankers Acceptances ‐ 0.00% 25.00% YES FFCB GSE 1,052,292.79 0.27% 25.00% YESMoney Market Funds 651,713.31 0.17% 25.00% YES FHLB GSE 2,642,536.57 0.68% 25.00% YESMunicipal Bonds ‐ 0.00% 20.00% YES American Honda Finance Corp 4,238,083.25 1.09% 5.00% YESIntergovernmental Funds 96,169,091.79 24.78% 40.00% YES Apple Inc. Corp 7,699,314.56 1.98% 5.00% YESCertificates of Deposit ‐ 0.00% 25.00% YES Chevron Corp Corp 2,151,507.15 0.55% 5.00% YESTotal Portfolio Market Value 388,161,979.89$ 100.00% Gilead Sciences Corp 1,041,751.39 0.27% 5.00% YES
IBM Corp Corp 1,864,561.62 0.48% 5.00% YESIntel Corp Corp 2,548,494.08 0.66% 5.00% YESJohnson & Johnson Corp 540,029.43 0.14% 5.00% YESJP Morgan Chase Corp 776,544.34 0.20% 5.00% YESMicrosoft Corp Corp 1,495,361.08 0.39% 5.00% YESProctor & Gamble Corp 300,788.50 0.08% 5.00% YESToyota Motor Credit Corp Corp 4,268,551.18 1.10% 5.00% YESWalmart Corp 8,114,611.55 2.09% 5.00% YESFNMA MBS MBS 1,161,235.94 0.30% 5.00% YESFHLMC MBS MBS 1,584,138.45 0.41% 5.00% YESGNMA MBS MBS 508,633.51 0.13% 5.00% YES
MBS ‐ 0.00% 5.00% YESMBS 0.00% 5.00% YESMBS 0.00% 5.00% YES
Total Portfolio Market Value 388,161,979.89$ 100.00%
(1) Mortgage backed securities included in security description and listed separately in issuer description. Public Trust managed assets represent market value plus accrued interest.
(2) External assets not managed by Public Trust. Information provided by City staff. Asset allocation limits defined in the City's investment policy.
Asset Allocation as of March 31, 2019
Cash4.74%
LGIP19.07%
U.S. Tsy34.10%
U.S. Agy0.13%
Fed Inst7.14% MBS
0.84% Corp9.03%
MMF0.17%
Int Gov24.78%
Ending Portfolio Allocation


![LEG HYD LV ASM SA SPR RTN 3.625 3.0 3600 SAE-6 15 . F …€¦ · leg hyd lv asm sa spr rtn 3.625 3.0 3600 sae-6 15" . f rd 10" b01 0 l 1 2 of e g e n d total no. ... [380.30] stroke](https://img.pdfslide.us/doc/110x75/5ae8af5a7f8b9a8b2b90518e/leg-hyd-lv-asm-sa-spr-rtn-3625-30-3600-sae-6-15-f-leg-hyd-lv-asm-sa-spr.jpg)