Embed Size (px)
Citation preview

DB-2 - 1
Snap-on Tools In-Depth Business Review
Board of Directors
April 27, 20111 1
Quarterly Financial Review
Third Quarter 2017
Q3-2017 Quarterly Review
© 2017 Snap-on Incorporated
DB-2 - 2
Snap-on Tools In-Depth Business Review
Board of Directors
April 27, 20112 2
Cautionary Statement
These slides should be read in conjunction with comments from the October 19, 2017conference call. The financial statement information included herein is unaudited.
Statements made during the October 19, 2017 conference call and/or information included inthis presentation may contain statements, including earnings projections, that are forward-looking in nature and, accordingly, are subject to risks and uncertainties regarding Snap-on’sexpected results; actual results may differ materially from those described or contemplated inthese forward-looking statements. Factors that may cause actual results to differ materiallyfrom those contained in the forward-looking statements are detailed in the correspondingpress release and Form 8-K and in Snap-on’s recent 1934 Act SEC filings, which areincorporated herein by reference. Snap-on disclaims any responsibility to update any forward-looking statement provided during the October 19, 2017 conference call and/or included in thispresentation, except as required by law.
This presentation includes certain non-GAAP measures of financial performance, which arenot meant to be considered in isolation or as a substitute for their GAAP counterparts.Additional information regarding these non-GAAP measures is included in Snap-on’s October19, 2017 press release and Form 8-K, which can be found on the company’s website athttp://www.snapon.com/sna.
Q3-2017 Quarterly Review
© 2017 Snap-on Incorporated

DB-2 - 3
Snap-on Tools In-Depth Business Review
Board of Directors
April 27, 20113 3

DB-2 - 4
Snap-on Tools In-Depth Business Review
Board of Directors
April 27, 20114 4
Nick Pinchuk
Chairman and Chief Executive Officer
Q3-2017 Quarterly Review
© 2017 Snap-on Incorporated

DB-2 - 5
Snap-on Tools In-Depth Business Review
Board of Directors
April 27, 20115 5
Aldo Pagliari
Senior Vice President and Chief Financial Officer
Q3-2017 Quarterly Review
© 2017 Snap-on Incorporated
DB-2 - 6
Snap-on Tools In-Depth Business Review
Board of Directors
April 27, 20116 6
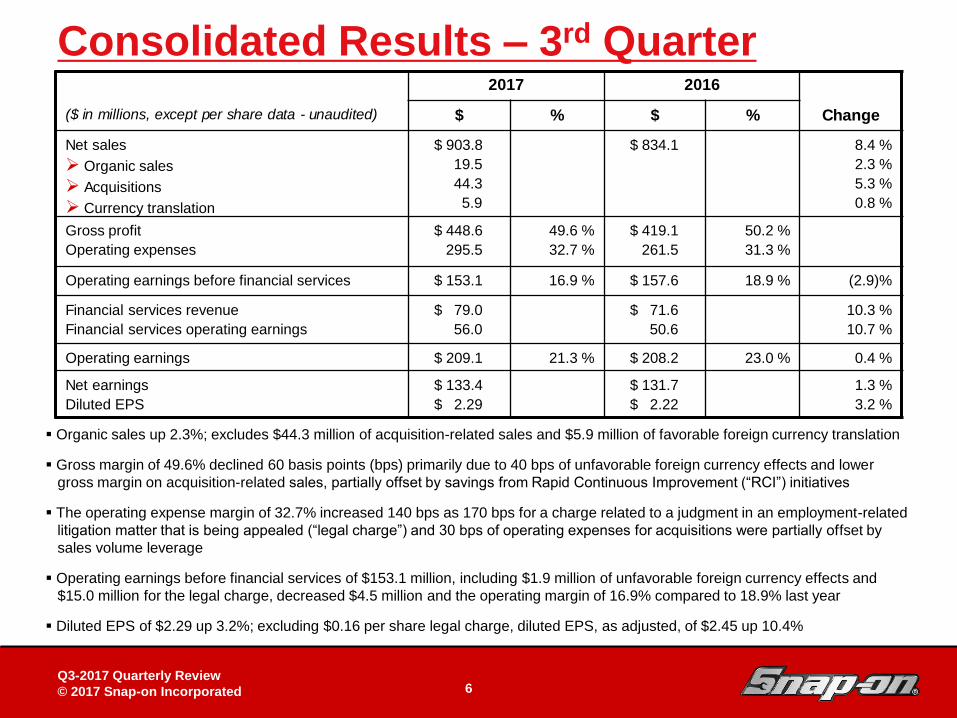
Consolidated Results – 3rd Quarter
Organic sales up 2.3%; excludes $44.3 million of acquisition-related sales and $5.9 million of favorable foreign currency translation
Gross margin of 49.6% declined 60 basis points (bps) primarily due to 40 bps of unfavorable foreign currency effects and lower
gross margin on acquisition-related sales, partially offset by savings from Rapid Continuous Improvement (“RCI”) initiatives
The operating expense margin of 32.7% increased 140 bps as 170 bps for a charge related to a judgment in an employment-related
litigation matter that is being appealed (“legal charge”) and 30 bps of operating expenses for acquisitions were partially offset by
sales volume leverage
Operating earnings before financial services of $153.1 million, including $1.9 million of unfavorable foreign currency effects and
$15.0 million for the legal charge, decreased $4.5 million and the operating margin of 16.9% compared to 18.9% last year
Diluted EPS of $2.29 up 3.2%; excluding $0.16 per share legal charge, diluted EPS, as adjusted, of $2.45 up 10.4%
2017 2016
($ in millions, except per share data - unaudited) $ % $ % Change
Net sales
Organic sales
Acquisitions
Currency translation
$ 903.8
19.5
44.3
5.9
$ 834.1 8.4 %
2.3 %
5.3 %
0.8 %
Gross profit
Operating expenses
$ 448.6
295.5
49.6 %
32.7 %
$ 419.1
261.5
50.2 %
31.3 %
Operating earnings before financial services $ 153.1 16.9 % $ 157.6 18.9 % (2.9)%
Financial services revenue
Financial services operating earnings
$ 79.0
56.0
$ 71.6
50.6
10.3 %
10.7 %
Operating earnings $ 209.1 21.3 % $ 208.2 23.0 % 0.4 %
Net earnings
Diluted EPS
$ 133.4
$ 2.29
$ 131.7
$ 2.22
1.3 %
3.2 %
Q3-2017 Quarterly Review
© 2017 Snap-on Incorporated
DB-2 - 7
Snap-on Tools In-Depth Business Review
Board of Directors
April 27, 20117 7
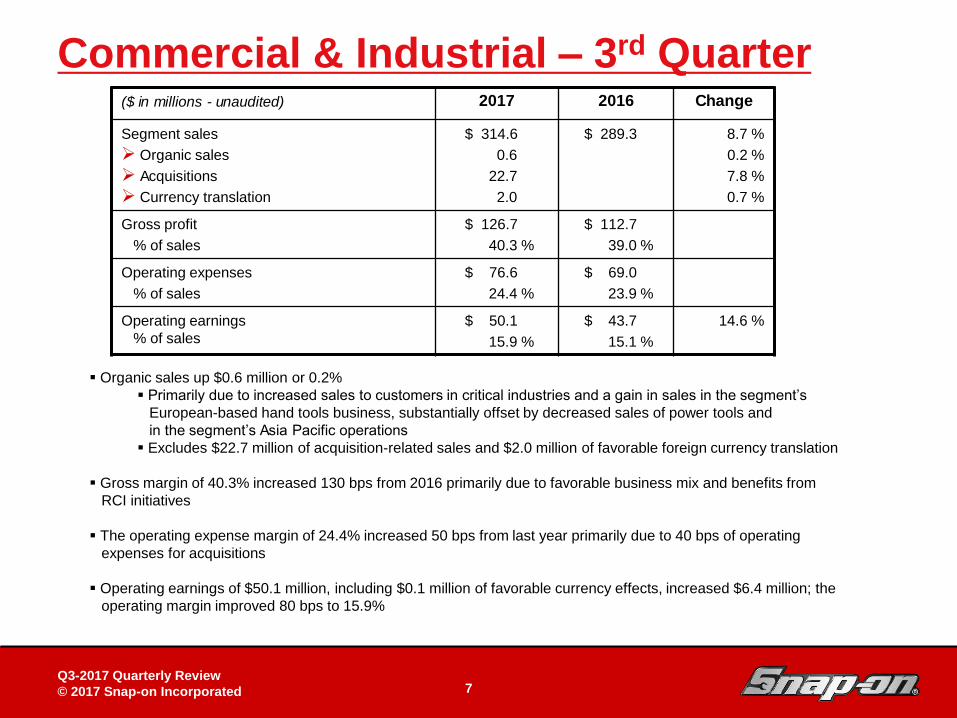
Organic sales up $0.6 million or 0.2%
Primarily due to increased sales to customers in critical industries and a gain in sales in the segment’s
European-based hand tools business, substantially offset by decreased sales of power tools and
in the segment’s Asia Pacific operations
Excludes $22.7 million of acquisition-related sales and $2.0 million of favorable foreign currency translation
Gross margin of 40.3% increased 130 bps from 2016 primarily due to favorable business mix and benefits from
RCI initiatives
The operating expense margin of 24.4% increased 50 bps from last year primarily due to 40 bps of operating
expenses for acquisitions
Operating earnings of $50.1 million, including $0.1 million of favorable currency effects, increased $6.4 million; the
operating margin improved 80 bps to 15.9%
Commercial & Industrial – 3rd Quarter($ in millions - unaudited) 2017 2016 Change
Segment sales
Organic sales
Acquisitions
Currency translation
$ 314.6
0.6
22.7
2.0
$ 289.3 8.7 %
0.2 %
7.8 %
0.7 %
Gross profit
% of sales
$ 126.7
40.3 %
$ 112.7
39.0 %
Operating expenses
% of sales
$ 76.6
24.4 %
$ 69.0
23.9 %
Operating earnings
% of sales
$ 50.1
15.9 %
$ 43.7
15.1 %
14.6 %
Q3-2017 Quarterly Review
© 2017 Snap-on Incorporated
DB-2 - 8
Snap-on Tools In-Depth Business Review
Board of Directors
April 27, 20118 8
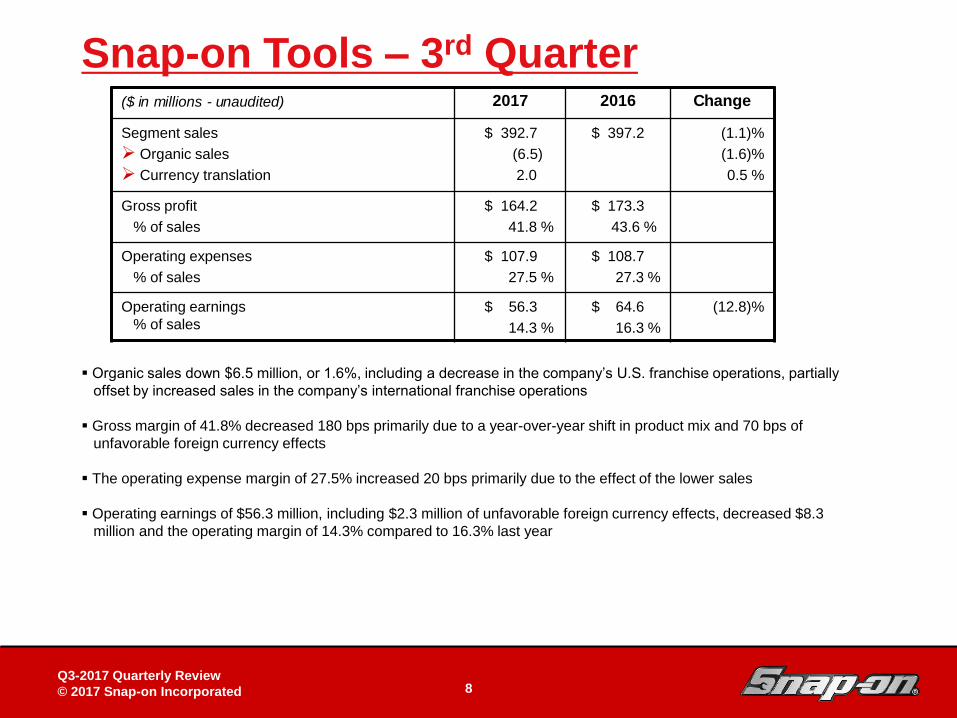
Organic sales down $6.5 million, or 1.6%, including a decrease in the company’s U.S. franchise operations, partially
offset by increased sales in the company’s international franchise operations
Gross margin of 41.8% decreased 180 bps primarily due to a year-over-year shift in product mix and 70 bps of
unfavorable foreign currency effects
The operating expense margin of 27.5% increased 20 bps primarily due to the effect of the lower sales
Operating earnings of $56.3 million, including $2.3 million of unfavorable foreign currency effects, decreased $8.3
million and the operating margin of 14.3% compared to 16.3% last year
Snap-on Tools – 3rd Quarter($ in millions - unaudited) 2017 2016 Change
Segment sales
Organic sales
Currency translation
$ 392.7
(6.5)
2.0
$ 397.2 (1.1)%
(1.6)%
0.5 %
Gross profit
% of sales
$ 164.2
41.8 %
$ 173.3
43.6 %
Operating expenses
% of sales
$ 107.9
27.5 %
$ 108.7
27.3 %
Operating earnings
% of sales
$ 56.3
14.3 %
$ 64.6
16.3 %
(12.8)%
Q3-2017 Quarterly Review
© 2017 Snap-on Incorporated
DB-2 - 9
Snap-on Tools In-Depth Business Review
Board of Directors
April 27, 20119 9
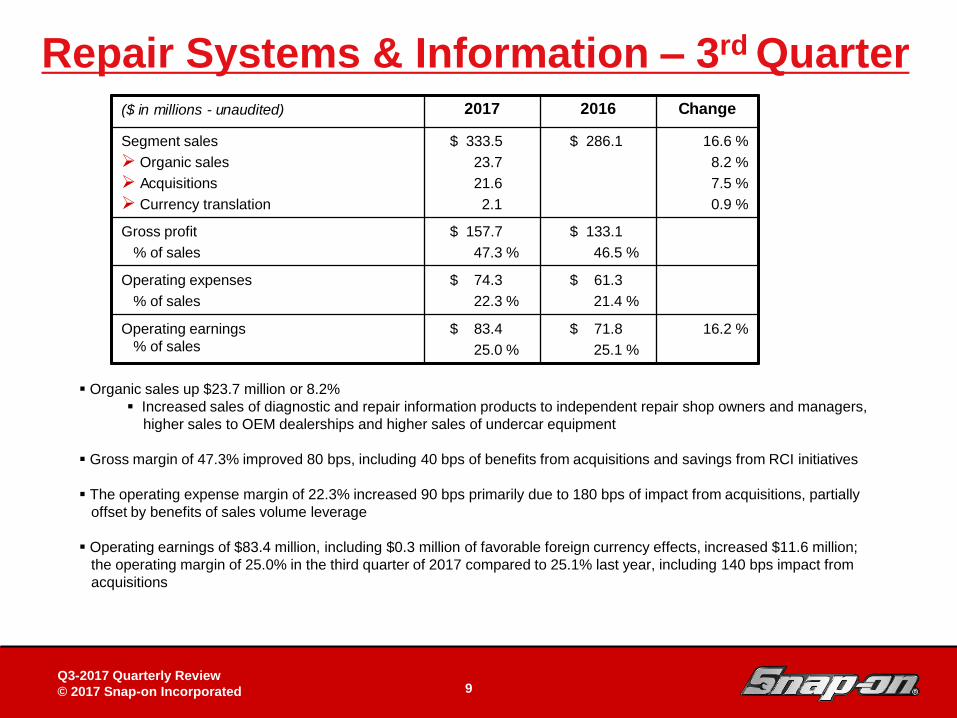
Repair Systems & Information – 3rd Quarter
Organic sales up $23.7 million or 8.2%
Increased sales of diagnostic and repair information products to independent repair shop owners and managers,
higher sales to OEM dealerships and higher sales of undercar equipment
Gross margin of 47.3% improved 80 bps, including 40 bps of benefits from acquisitions and savings from RCI initiatives
The operating expense margin of 22.3% increased 90 bps primarily due to 180 bps of impact from acquisitions, partially
offset by benefits of sales volume leverage
Operating earnings of $83.4 million, including $0.3 million of favorable foreign currency effects, increased $11.6 million;
the operating margin of 25.0% in the third quarter of 2017 compared to 25.1% last year, including 140 bps impact from
acquisitions
($ in millions - unaudited) 2017 2016 Change
Segment sales
Organic sales
Acquisitions
Currency translation
$ 333.5
23.7
21.6
2.1
$ 286.1 16.6 %
8.2 %
7.5 %
0.9 %
Gross profit
% of sales
$ 157.7
47.3 %
$ 133.1
46.5 %
Operating expenses
% of sales
$ 74.3
22.3 %
$ 61.3
21.4 %
Operating earnings
% of sales
$ 83.4
25.0 %
$ 71.8
25.1 %
16.2 %
Q3-2017 Quarterly Review
© 2017 Snap-on Incorporated
DB-2 - 10
Snap-on Tools In-Depth Business Review
Board of Directors
April 27, 201110 10
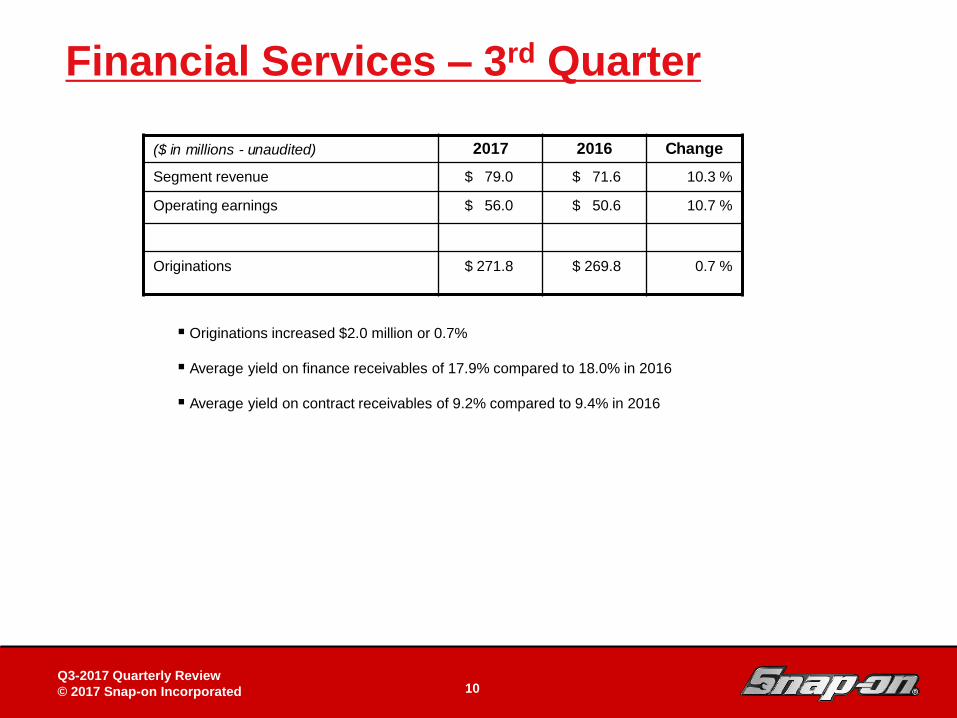
Financial Services – 3rd Quarter
Originations increased $2.0 million or 0.7%
Average yield on finance receivables of 17.9% compared to 18.0% in 2016
Average yield on contract receivables of 9.2% compared to 9.4% in 2016
($ in millions - unaudited) 2017 2016 Change
Segment revenue $ 79.0 $ 71.6 10.3 %
Operating earnings $ 56.0 $ 50.6 10.7 %
Originations $ 271.8 $ 269.8 0.7 %
Q3-2017 Quarterly Review
© 2017 Snap-on Incorporated
DB-2 - 11
Snap-on Tools In-Depth Business Review
Board of Directors
April 27, 201111 11
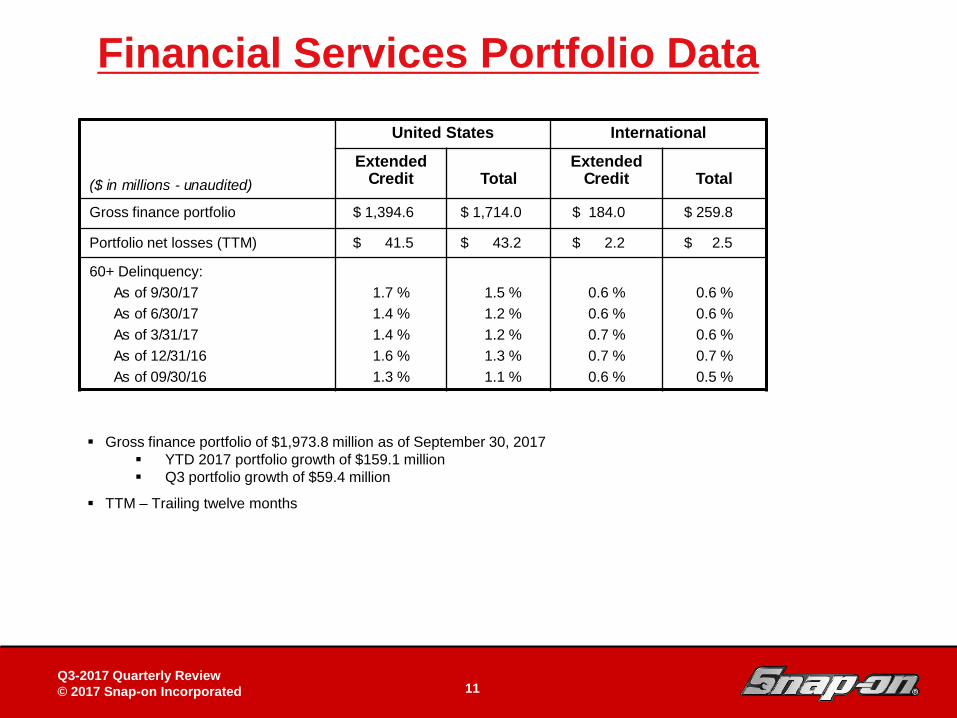
Financial Services Portfolio Data
United States International
($ in millions - unaudited)
Extended Credit Total
ExtendedCredit Total
Gross finance portfolio $ 1,394.6 $ 1,714.0 $ 184.0 $ 259.8
Portfolio net losses (TTM) $ 41.5 $ 43.2 $ 2.2 $ 2.5
60+ Delinquency:
As of 9/30/17
As of 6/30/17
As of 3/31/17
As of 12/31/16
As of 09/30/16
1.7 %
1.4 %
1.4 %
1.6 %
1.3 %
1.5 %
1.2 %
1.2 %
1.3 %
1.1 %
0.6 %
0.6 %
0.7 %
0.7 %
0.6 %
0.6 %
0.6 %
0.6 %
0.7 %
0.5 %
Gross finance portfolio of $1,973.8 million as of September 30, 2017
YTD 2017 portfolio growth of $159.1 million
Q3 portfolio growth of $59.4 million
TTM – Trailing twelve months
Q3-2017 Quarterly Review
© 2017 Snap-on Incorporated
DB-2 - 12
Snap-on Tools In-Depth Business Review
Board of Directors
April 27, 201112 12
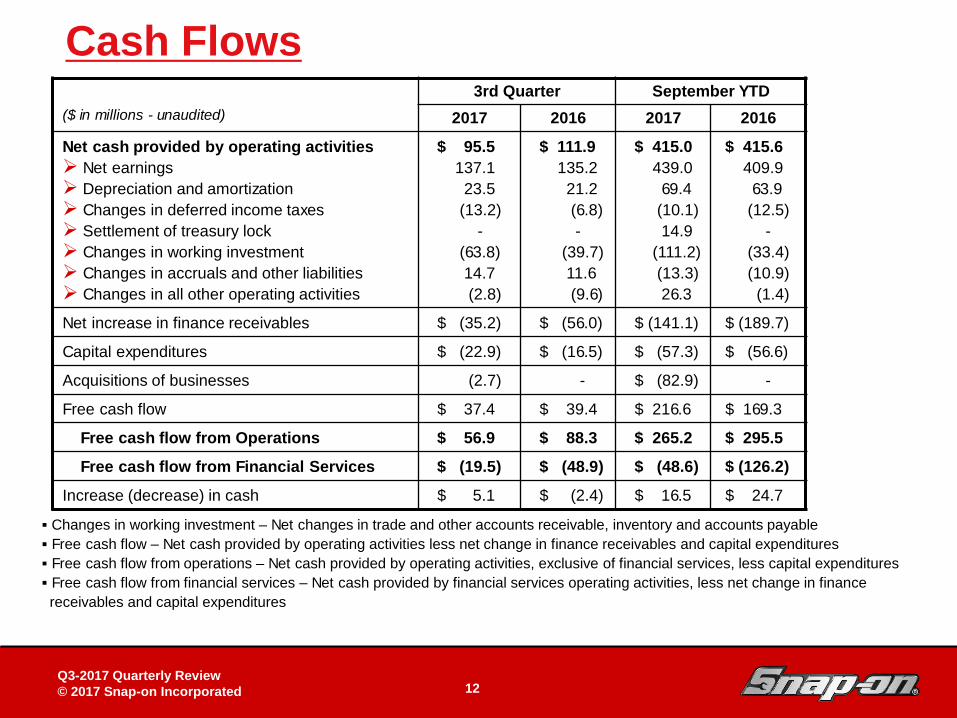
Cash Flows
Changes in working investment – Net changes in trade and other accounts receivable, inventory and accounts payable
Free cash flow – Net cash provided by operating activities less net change in finance receivables and capital expenditures
Free cash flow from operations – Net cash provided by operating activities, exclusive of financial services, less capital expenditures
Free cash flow from financial services – Net cash provided by financial services operating activities, less net change in finance
receivables and capital expenditures
Q3-2017 Quarterly Review
© 2017 Snap-on Incorporated
($ in millions - unaudited)
3rd Quarter September YTD
2017 2016 2017 2016
Net cash provided by operating activities
Net earnings
Depreciation and amortization
Changes in deferred income taxes
Settlement of treasury lock
Changes in working investment
Changes in accruals and other liabilities
Changes in all other operating activities
$ 95.5
137.1
23.5
(13.2)
-
(63.8)
14.7
(2.8)
$ 111.9
135.2
21.2
(6.8)
-
(39.7)
11.6
(9.6)
$ 415.0
439.0
69.4
(10.1)
14.9
(111.2)
(13.3)
26.3
$ 415.6
409.9
63.9
(12.5)
-
(33.4)
(10.9)
(1.4)
Net increase in finance receivables $ (35.2) $ (56.0) $ (141.1) $ (189.7)
Capital expenditures $ (22.9) $ (16.5) $ (57.3) $ (56.6)
Acquisitions of businesses (2.7) - $ (82.9) -
Free cash flow $ 37.4 $ 39.4 $ 216.6 $ 169.3
Free cash flow from Operations $ 56.9 $ 88.3 $ 265.2 $ 295.5
Free cash flow from Financial Services $ (19.5) $ (48.9) $ (48.6) $ (126.2)
Increase (decrease) in cash $ 5.1 $ (2.4) $ 16.5 $ 24.7
DB-2 - 13
Snap-on Tools In-Depth Business Review
Board of Directors
April 27, 201113 13
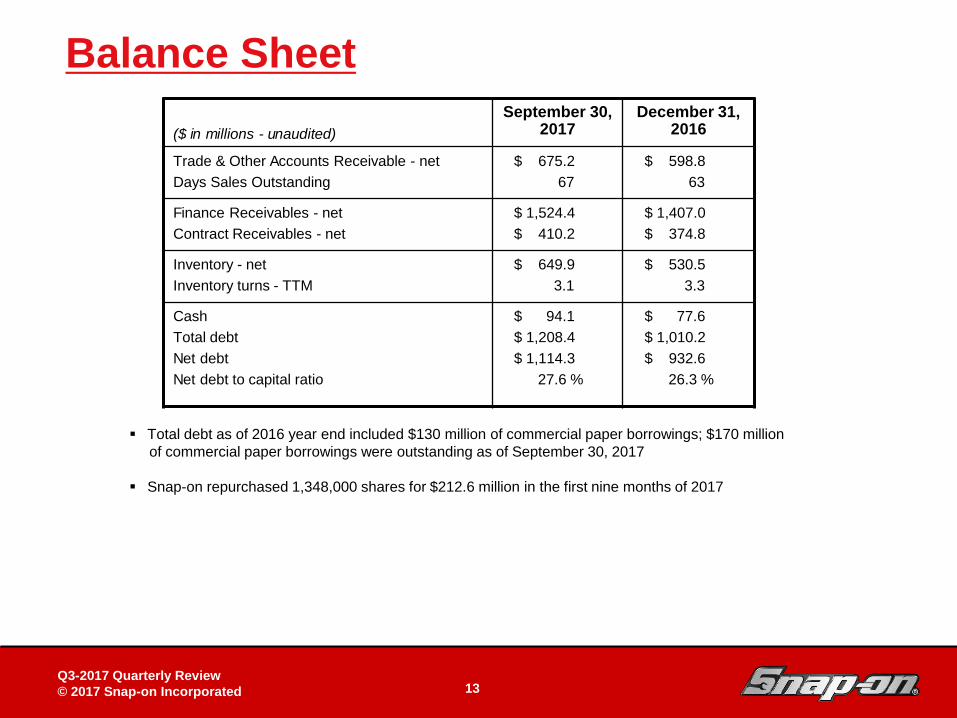
Balance Sheet
Total debt as of 2016 year end included $130 million of commercial paper borrowings; $170 million
of commercial paper borrowings were outstanding as of September 30, 2017
Snap-on repurchased 1,348,000 shares for $212.6 million in the first nine months of 2017
($ in millions - unaudited)
September 30, 2017
December 31, 2016
Trade & Other Accounts Receivable - net
Days Sales Outstanding
$ 675.2
67
$ 598.8
63
Finance Receivables - net
Contract Receivables - net
$ 1,524.4
$ 410.2
$ 1,407.0
$ 374.8
Inventory - net
Inventory turns - TTM
$ 649.9
3.1
$ 530.5
3.3
Cash
Total debt
Net debt
Net debt to capital ratio
$ 94.1
$ 1,208.4
$ 1,114.3
27.6 %
$ 77.6
$ 1,010.2
$ 932.6
26.3 %
Q3-2017 Quarterly Review
© 2017 Snap-on Incorporated
DB-2 - 14
Snap-on Tools In-Depth Business Review
Board of Directors
April 27, 201114 14
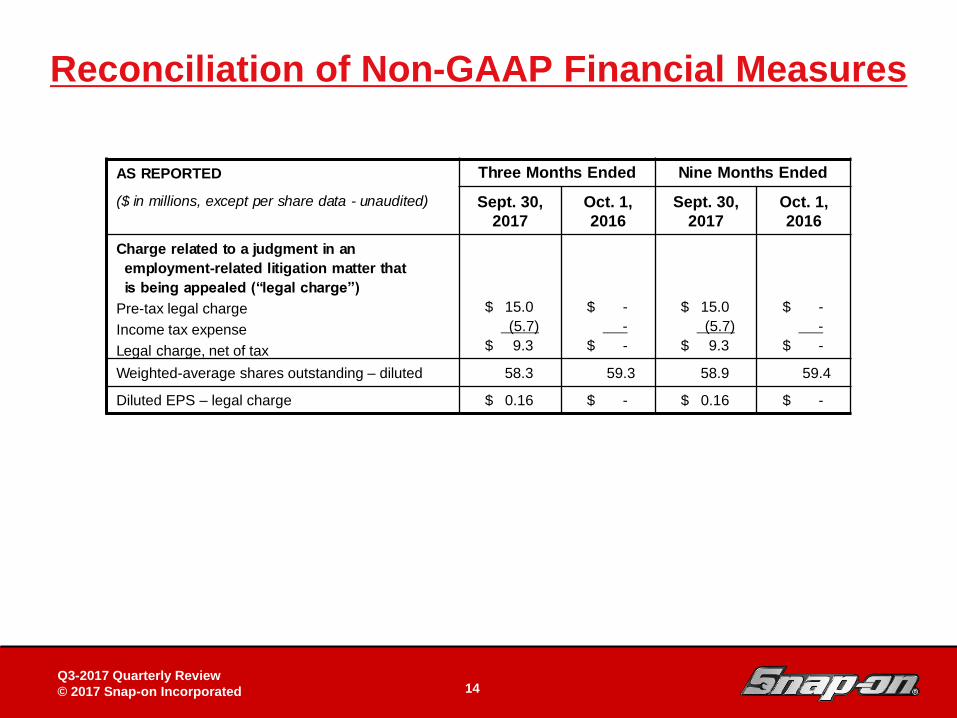
Reconciliation of Non-GAAP Financial Measures
AS REPORTED Three Months Ended Nine Months Ended
($ in millions, except per share data - unaudited) Sept. 30,
2017
Oct. 1,
2016
Sept. 30,
2017
Oct. 1,
2016
Charge related to a judgment in an
employment-related litigation matter that
is being appealed (“legal charge”)
Pre-tax legal charge
Income tax expense
Legal charge, net of tax
$ 15.0
(5.7)
$ 9.3
$ -
-
$ -
$ 15.0
(5.7)
$ 9.3
$ -
-
$ -
Weighted-average shares outstanding – diluted 58.3 59.3 58.9 59.4
Diluted EPS – legal charge $ 0.16 $ - $ 0.16 $ -
Q3-2017 Quarterly Review
© 2017 Snap-on Incorporated
DB-2 - 15
Snap-on Tools In-Depth Business Review
Board of Directors
April 27, 201115 15
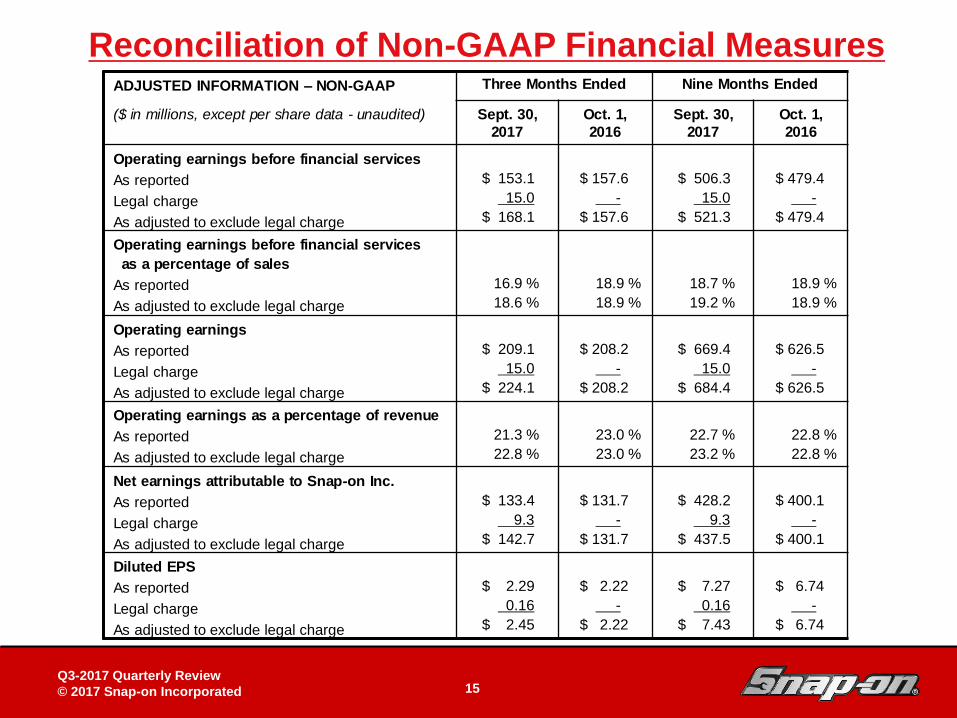
Reconciliation of Non-GAAP Financial MeasuresADJUSTED INFORMATION – NON-GAAP Three Months Ended Nine Months Ended
($ in millions, except per share data - unaudited) Sept. 30,
2017
Oct. 1,
2016
Sept. 30,
2017
Oct. 1,
2016
Operating earnings before financial services
As reported
Legal charge
As adjusted to exclude legal charge
$ 153.1
15.0
$ 168.1
$ 157.6
-
$ 157.6
$ 506.3
15.0
$ 521.3
$ 479.4
-
$ 479.4
Operating earnings before financial services
as a percentage of sales
As reported
As adjusted to exclude legal charge
16.9 %
18.6 %
18.9 %
18.9 %
18.7 %
19.2 %
18.9 %
18.9 %
Operating earnings
As reported
Legal charge
As adjusted to exclude legal charge
$ 209.1
15.0
$ 224.1
$ 208.2
-
$ 208.2
$ 669.4
15.0
$ 684.4
$ 626.5
-
$ 626.5
Operating earnings as a percentage of revenue
As reported
As adjusted to exclude legal charge
21.3 %
22.8 %
23.0 %
23.0 %
22.7 %
23.2 %
22.8 %
22.8 %
Net earnings attributable to Snap-on Inc.
As reported
Legal charge
As adjusted to exclude legal charge
$ 133.4
9.3
$ 142.7
$ 131.7
-
$ 131.7
$ 428.2
9.3
$ 437.5
$ 400.1
-
$ 400.1
Diluted EPS
As reported
Legal charge
As adjusted to exclude legal charge
$ 2.29
0.16
$ 2.45
$ 2.22
-
$ 2.22
$ 7.27
0.16
$ 7.43
$ 6.74
-
$ 6.74
Q3-2017 Quarterly Review
© 2017 Snap-on Incorporated