Embed Size (px)
Citation preview
"A colorful past, a bright future"
Quarterly Financial Report
Third Quarter 2015
City of Vancouver Third Quarter 2015 Financial Report 1
Third Quarter 2015 Financial Report (This report contains un-audited financial information as of October 12, 2015)
Table of Contents
Section Page
I. Executive Summary 1 II. Economic Report 2 III. Financial Results 13 IV. Outstanding Debt 26 V. Investments 26 VI. Interfund Loans 28
Attachments
A Expenditure Summary by Fund 29 B Revenue Summary by Fund 31 C Outstanding Debt 33 D Investment Portfolio Tables 36
- - - - - For additional information on the City’s financial performance please contact Natasha Ramras in the City’s Financial & Management Services Department at 360-487-8484.
City of Vancouver Third Quarter 2015 Financial Report 2
I. Executive Summary
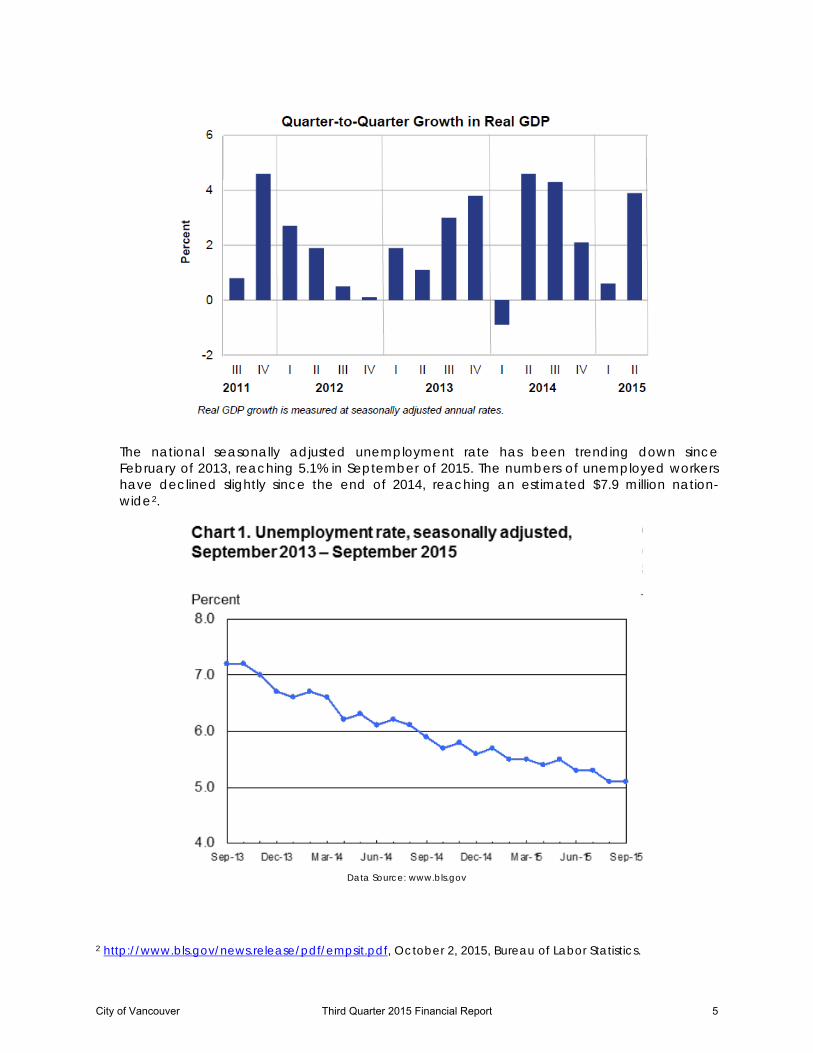
The national economy remained strong in the third quarter of 2015, but The U.S. Gross Domestic Product grew during the second quarter of the year at a revised rate of 3.9%, significantly higher than initially estimated. Most recent data indicates strong continued personal consumption expenditures, nonresidential fixed investment, exports, state and local government spending. The national unemployment rate continued to decline through September of 2015, reaching 5.1%, significantly below the 7.4% rate experienced at the end of 2013.
City of Vancouver General Fund revenues through the third quarter of 2015 totaled $96.1 million, or 72% of the forecast for the year, exceeding last year’s September’s collections by $1.8 million. Tax revenues received in 2015 exceed those through the third quarter of 2014 by approximately $3.5 million, mostly due to stronger sales and utility tax collections, offset by lower than forecasted revenues in taxes on privately owned utilities. If the trend continues through the end of the year, General Fund will collect approximately $4.0 to $4.5 million more than forecasted for the year. Expenditures in the General Fund totaled $97.6 million, or 71% of the budget for the year, running a little higher than anticipated. In 2014 during a comparable period of time 67% of the budget, or $89.1 million was spent. Current 2015 budget anticipates utilizing approximately $3.7 million of the General Fund reserve to cover the expenditures in the fund. With revenues coming in higher than forecasted, it is likely that the revenues might be sufficient to cover the expenditures for the year and the fund balance in the General fund will likely not need to be utilized to fund operations in 2015.
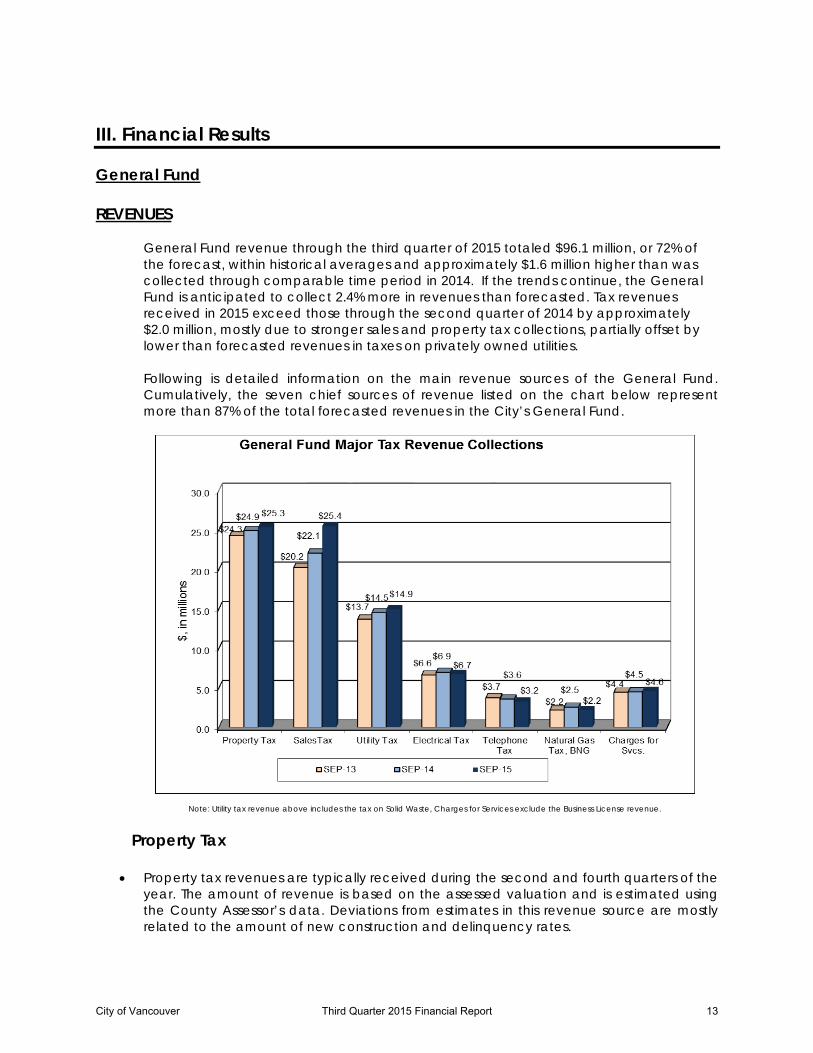
Following is detailed information on the main revenue sources of the General Fund. Cumulatively, the seven major sources of revenue listed on the chart below represent more than 87% of the total forecasted revenues in the City’s General Fund.
City of Vancouver Third Quarter 2015 Financial Report 3
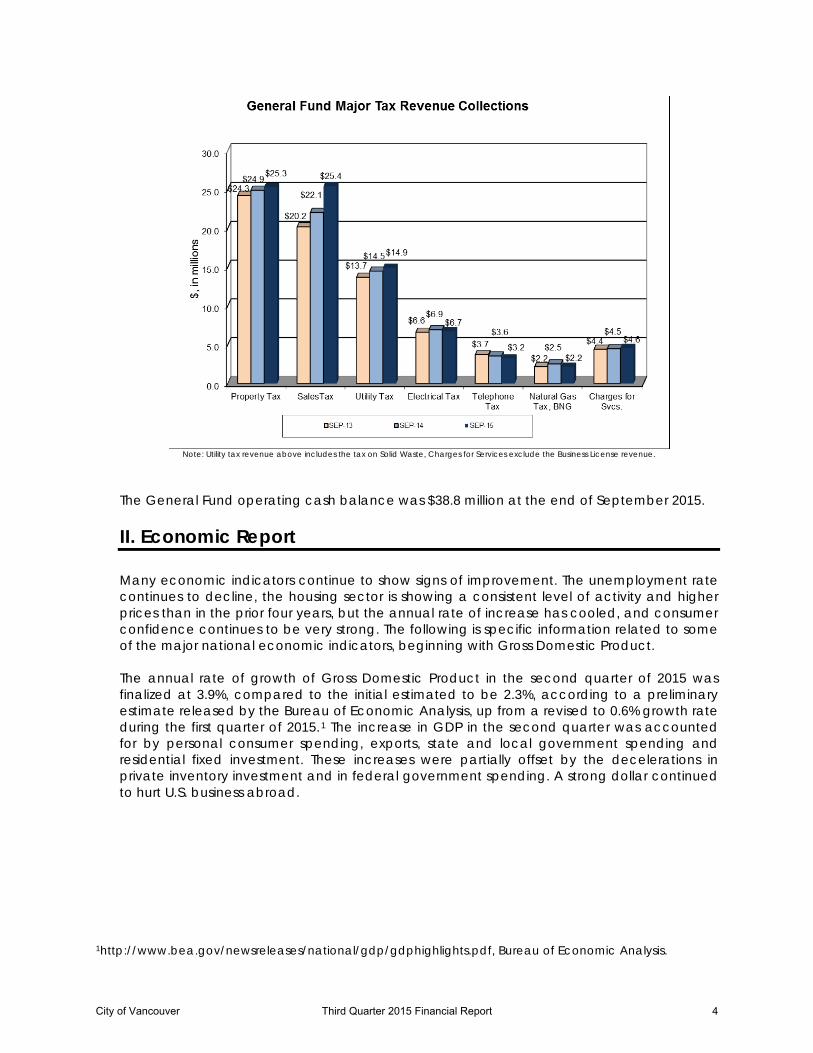
Note: Utility tax revenue above includes the tax on Solid Waste, Charges for Services exclude the Business License revenue.
The General Fund operating cash balance was $38.8 million at the end of September 2015. II. Economic Report Many economic indicators continue to show signs of improvement. The unemployment rate continues to decline, the housing sector is showing a consistent level of activity and higher prices than in the prior four years, but the annual rate of increase has cooled, and consumer confidence continues to be very strong. The following is specific information related to some of the major national economic indicators, beginning with Gross Domestic Product. The annual rate of growth of Gross Domestic Product in the second quarter of 2015 was finalized at 3.9%, compared to the initial estimated to be 2.3%, according to a preliminary estimate released by the Bureau of Economic Analysis, up from a revised to 0.6% growth rate during the first quarter of 2015.1 The increase in GDP in the second quarter was accounted for by personal consumer spending, exports, state and local government spending and residential fixed investment. These increases were partially offset by the decelerations in private inventory investment and in federal government spending. A strong dollar continued to hurt U.S. business abroad.
1http://www.bea.gov/newsreleases/national/gdp/gdphighlights.pdf, Bureau of Economic Analysis.
City of Vancouver Third Quarter 2015 Financial Report 4
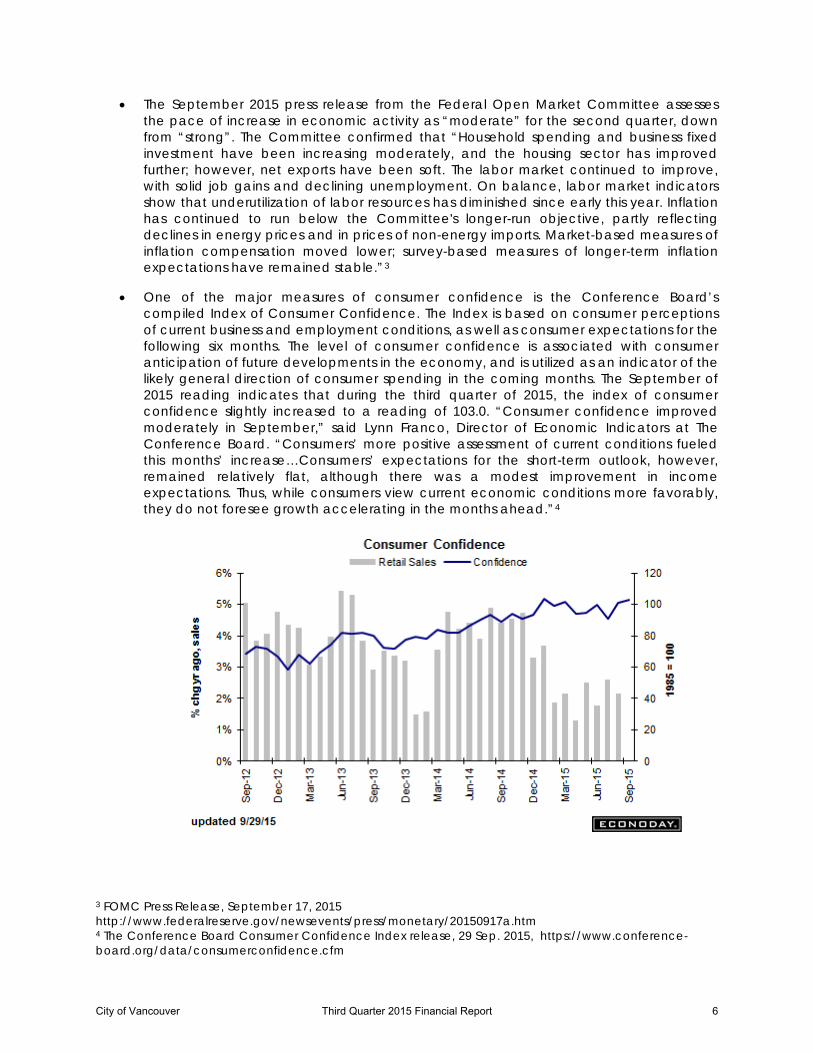
The national seasonally adjusted unemployment rate has been trending down since February of 2013, reaching 5.1% in September of 2015. The numbers of unemployed workers have declined slightly since the end of 2014, reaching an estimated $7.9 million nation-wide2.
Data Source: www.bls.gov
2 http://www.bls.gov/news.release/pdf/empsit.pdf, October 2, 2015, Bureau of Labor Statistics.
City of Vancouver Third Quarter 2015 Financial Report 5
• The September 2015 press release from the Federal Open Market Committee assesses the pace of increase in economic activity as “moderate” for the second quarter, down from “strong”. The Committee confirmed that “Household spending and business fixed investment have been increasing moderately, and the housing sector has improved further; however, net exports have been soft. The labor market continued to improve, with solid job gains and declining unemployment. On balance, labor market indicators show that underutilization of labor resources has diminished since early this year. Inflation has continued to run below the Committee's longer-run objective, partly reflecting declines in energy prices and in prices of non-energy imports. Market-based measures of inflation compensation moved lower; survey-based measures of longer-term inflation expectations have remained stable.”3
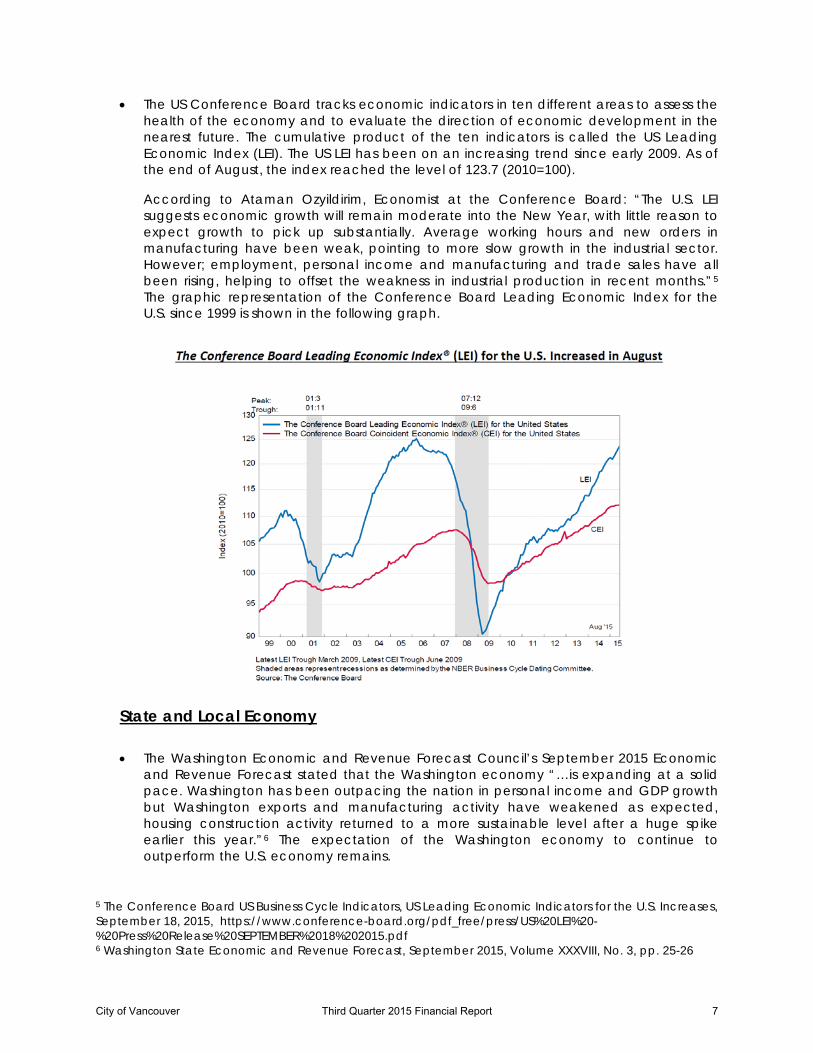
• One of the major measures of consumer confidence is the Conference Board’s compiled Index of Consumer Confidence. The Index is based on consumer perceptions of current business and employment conditions, as well as consumer expectations for the following six months. The level of consumer confidence is associated with consumer anticipation of future developments in the economy, and is utilized as an indicator of the likely general direction of consumer spending in the coming months. The September of 2015 reading indicates that during the third quarter of 2015, the index of consumer confidence slightly increased to a reading of 103.0. “Consumer confidence improved moderately in September,” said Lynn Franco, Director of Economic Indicators at The Conference Board. “Consumers’ more positive assessment of current conditions fueled this months’ increase…Consumers’ expectations for the short-term outlook, however, remained relatively flat, although there was a modest improvement in income expectations. Thus, while consumers view current economic conditions more favorably, they do not foresee growth accelerating in the months ahead.”4
3 FOMC Press Release, September 17, 2015 http://www.federalreserve.gov/newsevents/press/monetary/20150917a.htm 4 The Conference Board Consumer Confidence Index release, 29 Sep. 2015, https://www.conference-board.org/data/consumerconfidence.cfm
City of Vancouver Third Quarter 2015 Financial Report 6
• The US Conference Board tracks economic indicators in ten different areas to assess the health of the economy and to evaluate the direction of economic development in the nearest future. The cumulative product of the ten indicators is called the US Leading Economic Index (LEI). The US LEI has been on an increasing trend since early 2009. As of the end of August, the index reached the level of 123.7 (2010=100).
According to Ataman Ozyildirim, Economist at the Conference Board: “The U.S. LEI suggests economic growth will remain moderate into the New Year, with little reason to expect growth to pick up substantially. Average working hours and new orders in manufacturing have been weak, pointing to more slow growth in the industrial sector. However; employment, personal income and manufacturing and trade sales have all been rising, helping to offset the weakness in industrial production in recent months.”5 The graphic representation of the Conference Board Leading Economic Index for the U.S. since 1999 is shown in the following graph.
State and Local Economy • The Washington Economic and Revenue Forecast Council’s September 2015 Economic
and Revenue Forecast stated that the Washington economy “…is expanding at a solid pace. Washington has been outpacing the nation in personal income and GDP growth but Washington exports and manufacturing activity have weakened as expected, housing construction activity returned to a more sustainable level after a huge spike earlier this year.”6 The expectation of the Washington economy to continue to outperform the U.S. economy remains.
5 The Conference Board US Business Cycle Indicators, US Leading Economic Indicators for the U.S. Increases, September 18, 2015, https://www.conference-board.org/pdf_free/press/US%20LEI%20-%20Press%20Release%20SEPTEMBER%2018%202015.pdf 6 Washington State Economic and Revenue Forecast, September 2015, Volume XXXVIII, No. 3, pp. 25-26
City of Vancouver Third Quarter 2015 Financial Report 7
• State revenue collections have been revised upwards by less than 1.0% to account for the new revenue resulting from the 2015 special legislative sessions. The outlook for the remainder of the year is for weaker baseline revenues due to a moderation in the residential building activity and lower personal income growth expectations.7
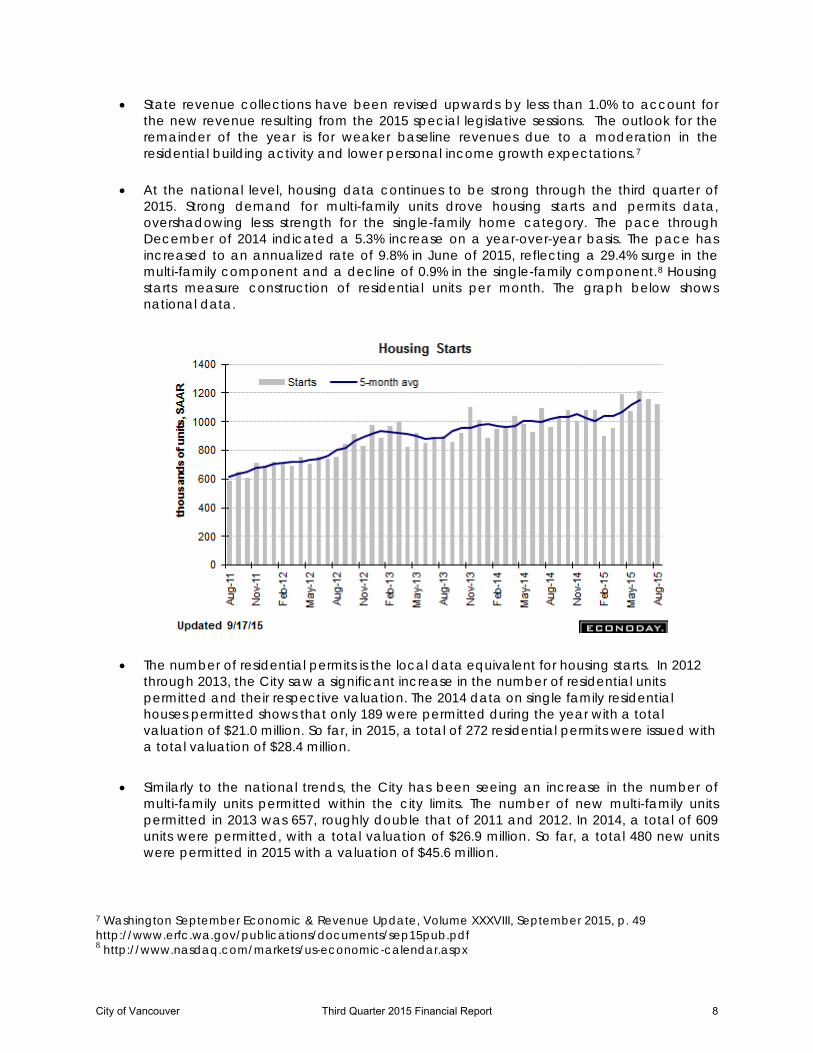
• At the national level, housing data continues to be strong through the third quarter of
2015. Strong demand for multi-family units drove housing starts and permits data, overshadowing less strength for the single-family home category. The pace through December of 2014 indicated a 5.3% increase on a year-over-year basis. The pace has increased to an annualized rate of 9.8% in June of 2015, reflecting a 29.4% surge in the multi-family component and a decline of 0.9% in the single-family component.8 Housing starts measure construction of residential units per month. The graph below shows national data.
• The number of residential permits is the local data equivalent for housing starts. In 2012 through 2013, the City saw a significant increase in the number of residential units permitted and their respective valuation. The 2014 data on single family residential houses permitted shows that only 189 were permitted during the year with a total valuation of $21.0 million. So far, in 2015, a total of 272 residential permits were issued with a total valuation of $28.4 million.
• Similarly to the national trends, the City has been seeing an increase in the number of multi-family units permitted within the city limits. The number of new multi-family units permitted in 2013 was 657, roughly double that of 2011 and 2012. In 2014, a total of 609 units were permitted, with a total valuation of $26.9 million. So far, a total 480 new units were permitted in 2015 with a valuation of $45.6 million.
7 Washington September Economic & Revenue Update, Volume XXXVIII, September 2015, p. 49 http://www.erfc.wa.gov/publications/documents/sep15pub.pdf 8 http://www.nasdaq.com/markets/us-economic-calendar.aspx
City of Vancouver Third Quarter 2015 Financial Report 8
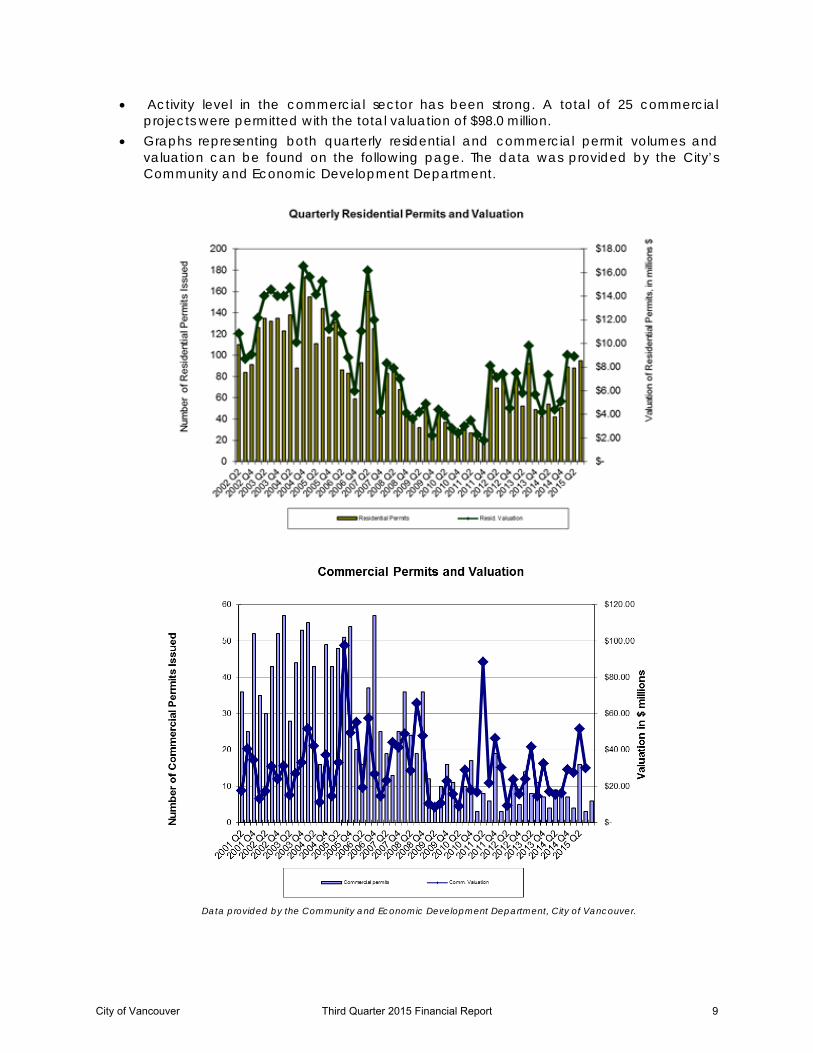
• Activity level in the commercial sector has been strong. A total of 25 commercial projects were permitted with the total valuation of $98.0 million.
• Graphs representing both quarterly residential and commercial permit volumes and valuation can be found on the following page. The data was provided by the City’s Community and Economic Development Department.
Data provided by the Community and Economic Development Department, City of Vancouver.
City of Vancouver Third Quarter 2015 Financial Report 9
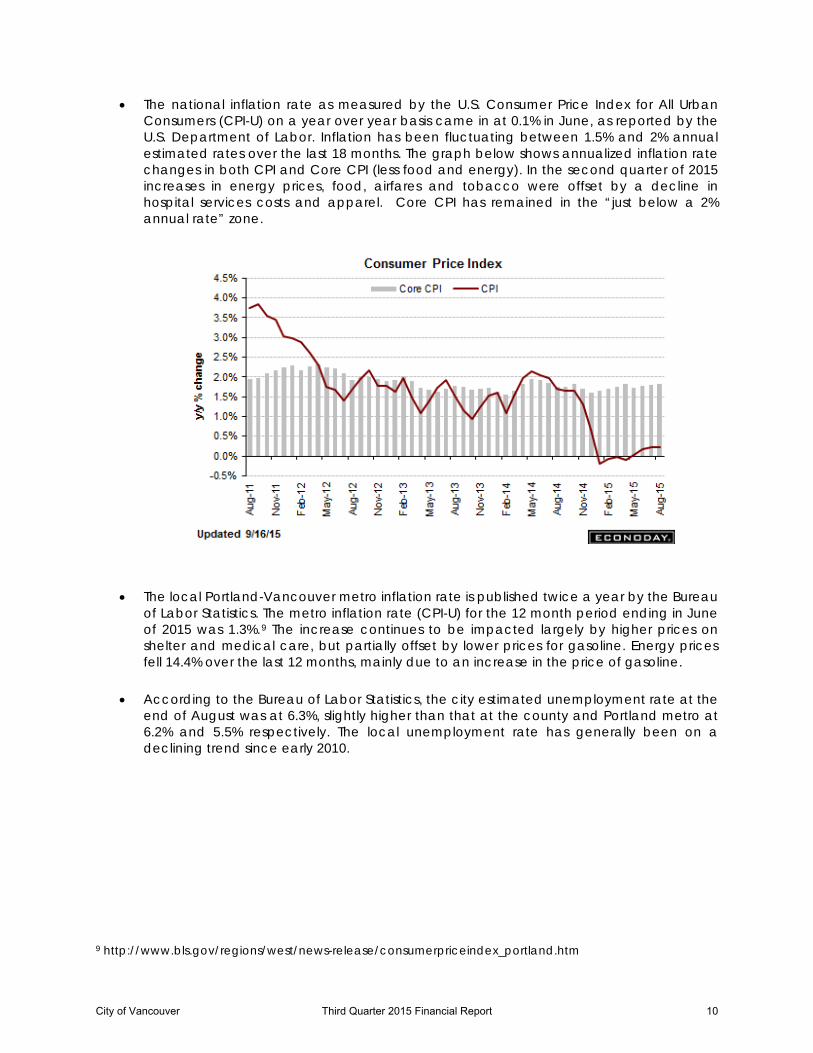
• The national inflation rate as measured by the U.S. Consumer Price Index for All Urban Consumers (CPI-U) on a year over year basis came in at 0.1% in June, as reported by the U.S. Department of Labor. Inflation has been fluctuating between 1.5% and 2% annual estimated rates over the last 18 months. The graph below shows annualized inflation rate changes in both CPI and Core CPI (less food and energy). In the second quarter of 2015 increases in energy prices, food, airfares and tobacco were offset by a decline in hospital services costs and apparel. Core CPI has remained in the “just below a 2% annual rate” zone.
• The local Portland-Vancouver metro inflation rate is published twice a year by the Bureau
of Labor Statistics. The metro inflation rate (CPI-U) for the 12 month period ending in June of 2015 was 1.3%.9 The increase continues to be impacted largely by higher prices on shelter and medical care, but partially offset by lower prices for gasoline. Energy prices fell 14.4% over the last 12 months, mainly due to an increase in the price of gasoline.
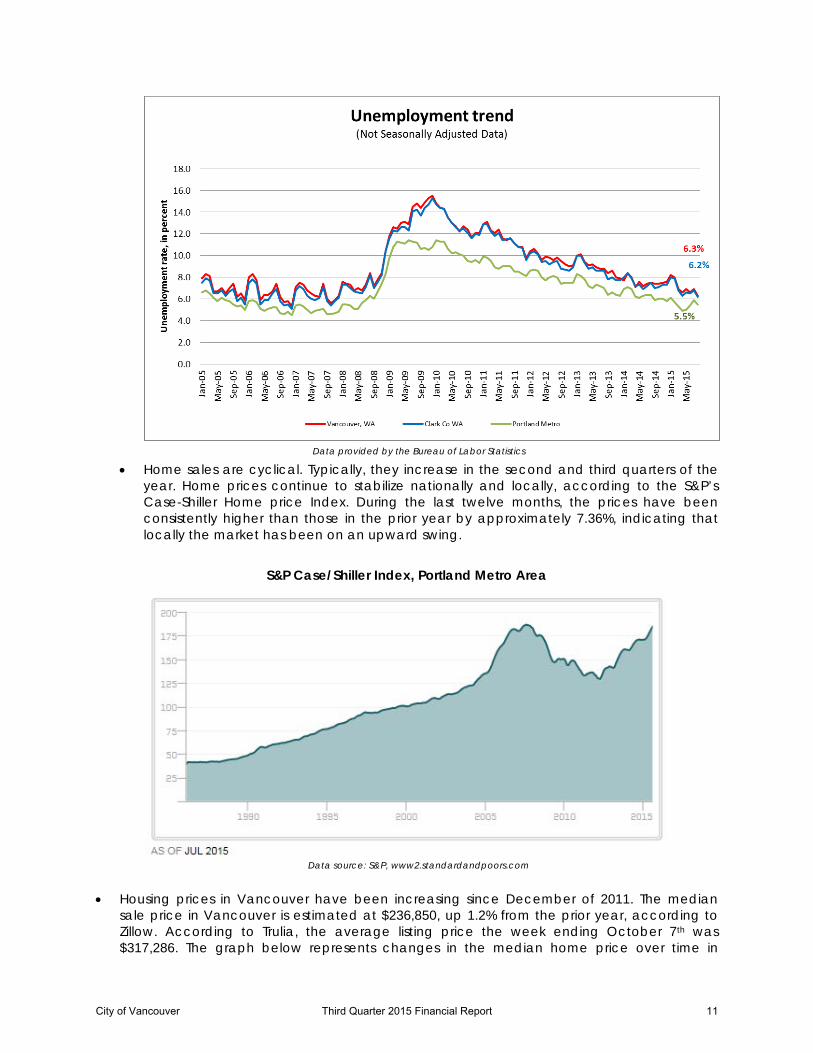
• According to the Bureau of Labor Statistics, the city estimated unemployment rate at the end of August was at 6.3%, slightly higher than that at the county and Portland metro at 6.2% and 5.5% respectively. The local unemployment rate has generally been on a declining trend since early 2010.
9 http://www.bls.gov/regions/west/news-release/consumerpriceindex_portland.htm
City of Vancouver Third Quarter 2015 Financial Report 10
Data provided by the Bureau of Labor Statistics
• Home sales are cyclical. Typically, they increase in the second and third quarters of the year. Home prices continue to stabilize nationally and locally, according to the S&P’s Case-Shiller Home price Index. During the last twelve months, the prices have been consistently higher than those in the prior year by approximately 7.36%, indicating that locally the market has been on an upward swing.
S&P Case/Shiller Index, Portland Metro Area
Data source: S&P, www2.standardandpoors.com
• Housing prices in Vancouver have been increasing since December of 2011. The median sale price in Vancouver is estimated at $236,850, up 1.2% from the prior year, according to Zillow. According to Trulia, the average listing price the week ending October 7th was $317,286. The graph below represents changes in the median home price over time in
City of Vancouver Third Quarter 2015 Financial Report 11
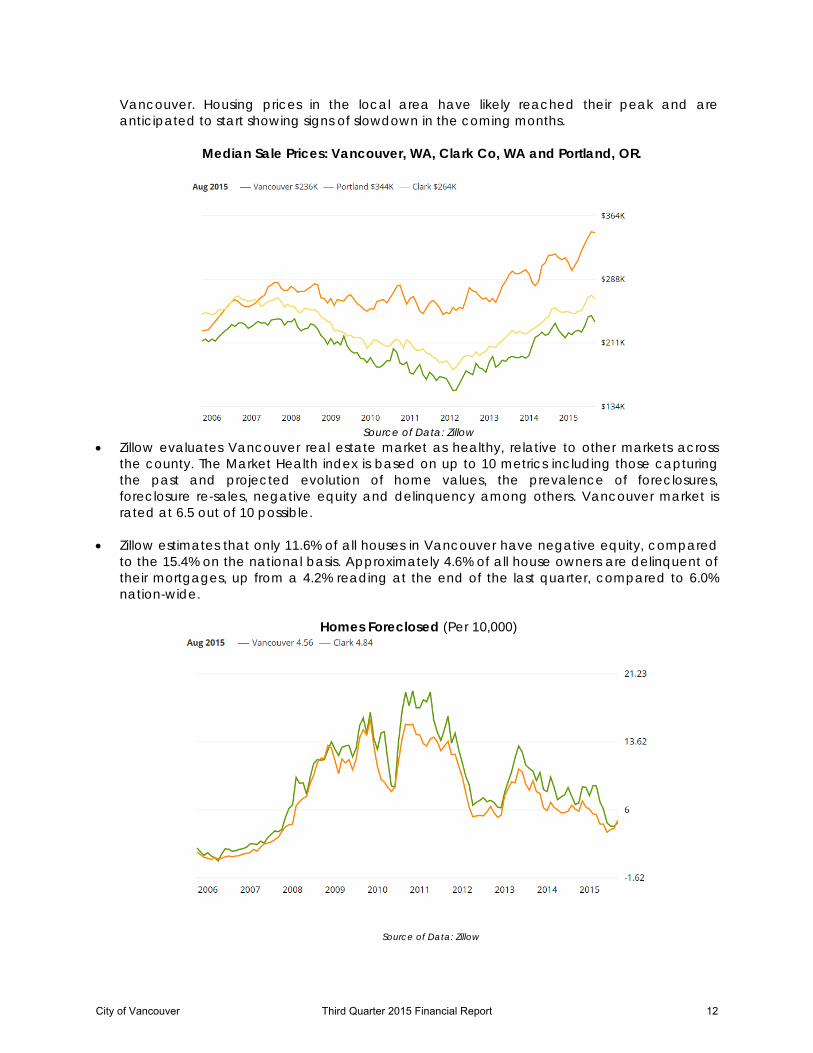
Vancouver. Housing prices in the local area have likely reached their peak and are anticipated to start showing signs of slowdown in the coming months.
Median Sale Prices: Vancouver, WA, Clark Co, WA and Portland, OR.
Source of Data: Zillow
• Zillow evaluates Vancouver real estate market as healthy, relative to other markets across the county. The Market Health index is based on up to 10 metrics including those capturing the past and projected evolution of home values, the prevalence of foreclosures, foreclosure re-sales, negative equity and delinquency among others. Vancouver market is rated at 6.5 out of 10 possible.
• Zillow estimates that only 11.6% of all houses in Vancouver have negative equity, compared
to the 15.4% on the national basis. Approximately 4.6% of all house owners are delinquent of their mortgages, up from a 4.2% reading at the end of the last quarter, compared to 6.0% nation-wide.
Homes Foreclosed (Per 10,000)
Source of Data: Zillow
City of Vancouver Third Quarter 2015 Financial Report 12
III. Financial Results General Fund REVENUES
General Fund revenue through the third quarter of 2015 totaled $96.1 million, or 72% of the forecast, within historical averages and approximately $1.6 million higher than was collected through comparable time period in 2014. If the trends continue, the General Fund is anticipated to collect 2.4% more in revenues than forecasted. Tax revenues received in 2015 exceed those through the second quarter of 2014 by approximately $2.0 million, mostly due to stronger sales and property tax collections, partially offset by lower than forecasted revenues in taxes on privately owned utilities. Following is detailed information on the main revenue sources of the General Fund. Cumulatively, the seven chief sources of revenue listed on the chart below represent more than 87% of the total forecasted revenues in the City’s General Fund.
Note: Utility tax revenue above includes the tax on Solid Waste, Charges for Services exclude the Business License revenue.
Property Tax
• Property tax revenues are typically received during the second and fourth quarters of the
year. The amount of revenue is based on the assessed valuation and is estimated using the County Assessor’s data. Deviations from estimates in this revenue source are mostly related to the amount of new construction and delinquency rates.
City of Vancouver Third Quarter 2015 Financial Report 13
• By Council action, there was a 1.0% property tax levy increase for 2015 taxes. The total City of Vancouver levy rate in 2015 is $2.7996 per $1,000 of assessed value, which is applied to a total taxable value of approximately $15.8 billion.
• The City experienced a 23.5% combined reduction in assessed valuation between 2009
and 2012. The reduction in assessed valuation resulted in an increase of the City’s property tax levy rate, but did not have any impact on the revenues. The City’s assessed valuation for 2014 has increased by 8.3%, and another 10.4% for 2015. With the recent increases in assessed valuation, the City has reached that in 2008, but remains 6.4% below the highest assessed valuation experienced in 2009.
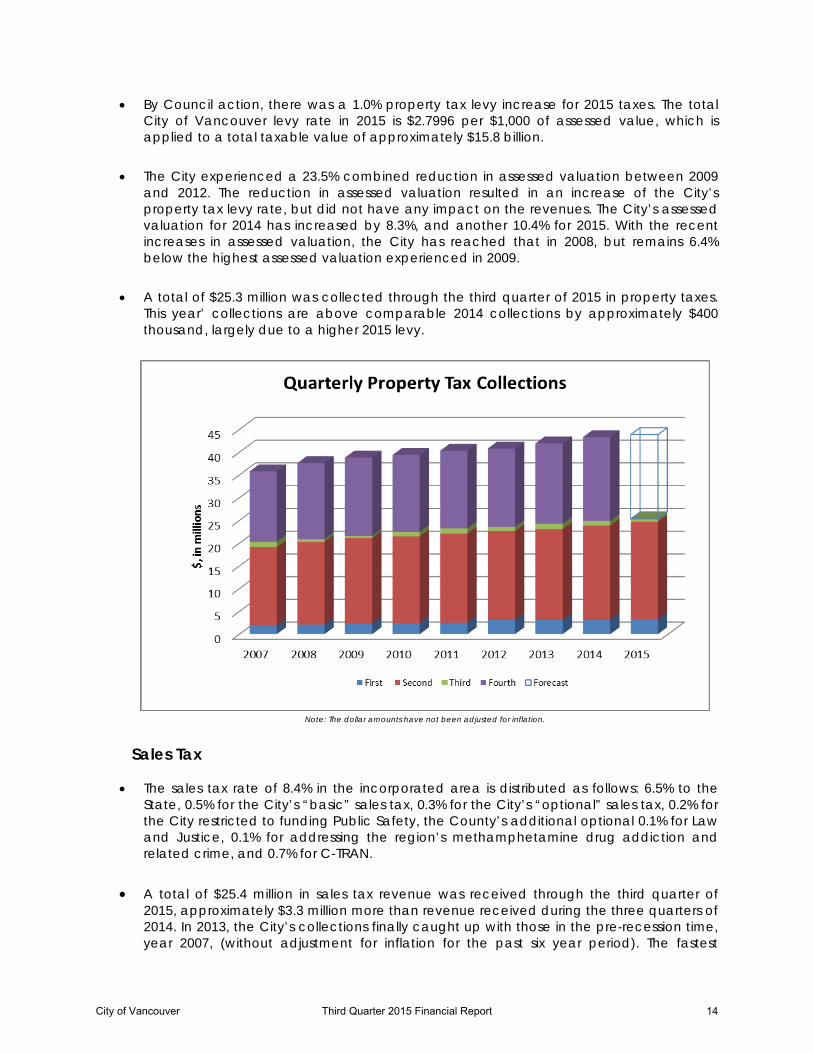
• A total of $25.3 million was collected through the third quarter of 2015 in property taxes.
This year’ collections are above comparable 2014 collections by approximately $400 thousand, largely due to a higher 2015 levy.
Note: The dollar amounts have not been adjusted for inflation.
Sales Tax
• The sales tax rate of 8.4% in the incorporated area is distributed as follows: 6.5% to the State, 0.5% for the City’s “basic” sales tax, 0.3% for the City’s “optional” sales tax, 0.2% for the City restricted to funding Public Safety, the County’s additional optional 0.1% for Law and Justice, 0.1% for addressing the region’s methamphetamine drug addiction and related crime, and 0.7% for C-TRAN.
• A total of $25.4 million in sales tax revenue was received through the third quarter of
2015, approximately $3.3 million more than revenue received during the three quarters of 2014. In 2013, the City’s collections finally caught up with those in the pre-recession time, year 2007, (without adjustment for inflation for the past six year period). The fastest
City of Vancouver Third Quarter 2015 Financial Report 14
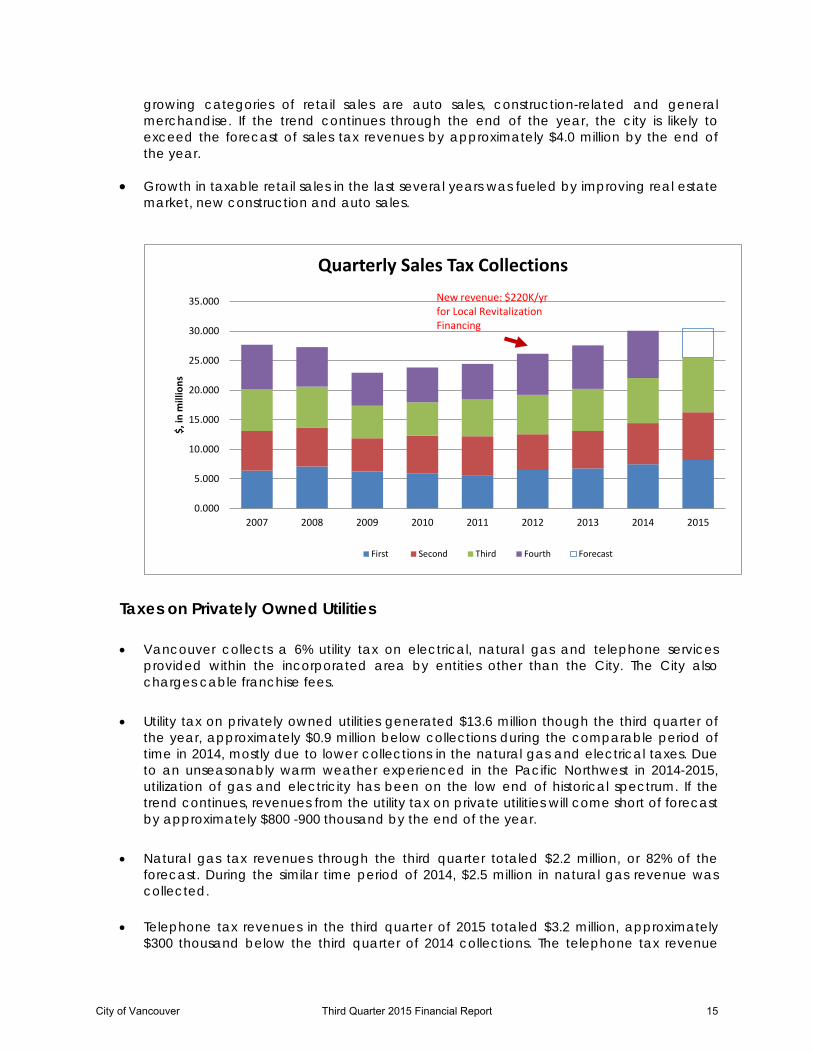
growing categories of retail sales are auto sales, construction-related and general merchandise. If the trend continues through the end of the year, the city is likely to exceed the forecast of sales tax revenues by approximately $4.0 million by the end of the year.
• Growth in taxable retail sales in the last several years was fueled by improving real estate
market, new construction and auto sales.
0.000
5.000
10.000
15.000
20.000
25.000
30.000
35.000
2007 2008 2009 2010 2011 2012 2013 2014 2015
$, in
mill
ions
Quarterly Sales Tax Collections
First Second Third Fourth Forecast
New revenue: $220K/yrfor Local Revitalization Financing
Taxes on Privately Owned Utilities • Vancouver collects a 6% utility tax on electrical, natural gas and telephone services
provided within the incorporated area by entities other than the City. The City also charges cable franchise fees.
• Utility tax on privately owned utilities generated $13.6 million though the third quarter of
the year, approximately $0.9 million below collections during the comparable period of time in 2014, mostly due to lower collections in the natural gas and electrical taxes. Due to an unseasonably warm weather experienced in the Pacific Northwest in 2014-2015, utilization of gas and electricity has been on the low end of historical spectrum. If the trend continues, revenues from the utility tax on private utilities will come short of forecast by approximately $800 -900 thousand by the end of the year.
• Natural gas tax revenues through the third quarter totaled $2.2 million, or 82% of the
forecast. During the similar time period of 2014, $2.5 million in natural gas revenue was collected.
• Telephone tax revenues in the third quarter of 2015 totaled $3.2 million, approximately $300 thousand below the third quarter of 2014 collections. The telephone tax revenue
City of Vancouver Third Quarter 2015 Financial Report 15
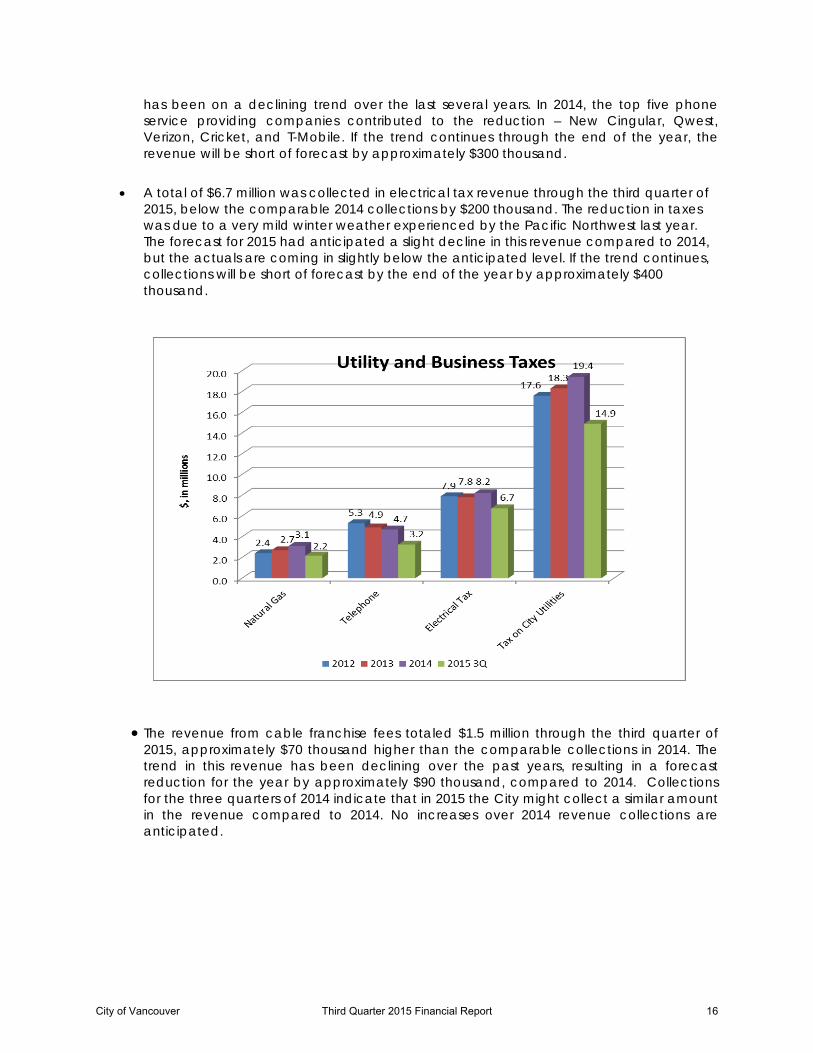
has been on a declining trend over the last several years. In 2014, the top five phone service providing companies contributed to the reduction – New Cingular, Qwest, Verizon, Cricket, and T-Mobile. If the trend continues through the end of the year, the revenue will be short of forecast by approximately $300 thousand.
• A total of $6.7 million was collected in electrical tax revenue through the third quarter of
2015, below the comparable 2014 collections by $200 thousand. The reduction in taxes was due to a very mild winter weather experienced by the Pacific Northwest last year. The forecast for 2015 had anticipated a slight decline in this revenue compared to 2014, but the actuals are coming in slightly below the anticipated level. If the trend continues, collections will be short of forecast by the end of the year by approximately $400 thousand.
• The revenue from cable franchise fees totaled $1.5 million through the third quarter of 2015, approximately $70 thousand higher than the comparable collections in 2014. The trend in this revenue has been declining over the past years, resulting in a forecast reduction for the year by approximately $90 thousand, compared to 2014. Collections for the three quarters of 2014 indicate that in 2015 the City might collect a similar amount in the revenue compared to 2014. No increases over 2014 revenue collections are anticipated.
City of Vancouver Third Quarter 2015 Financial Report 16
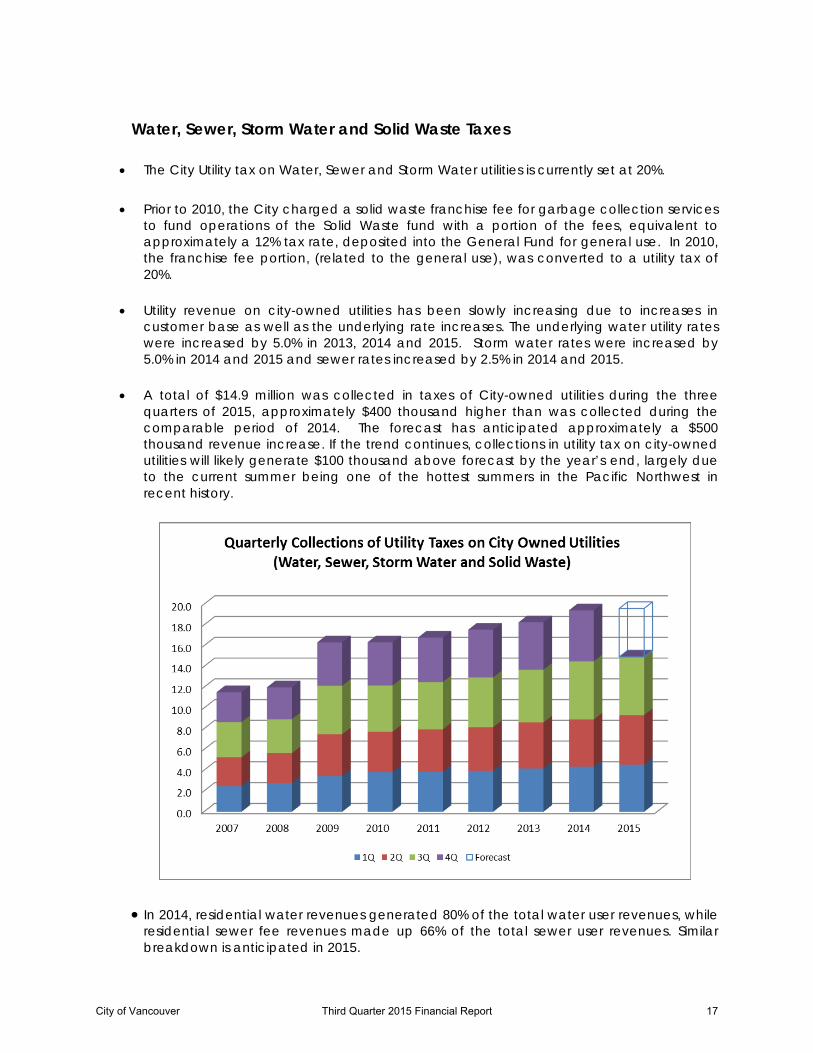
Water, Sewer, Storm Water and Solid Waste Taxes
• The City Utility tax on Water, Sewer and Storm Water utilities is currently set at 20%. • Prior to 2010, the City charged a solid waste franchise fee for garbage collection services
to fund operations of the Solid Waste fund with a portion of the fees, equivalent to approximately a 12% tax rate, deposited into the General Fund for general use. In 2010, the franchise fee portion, (related to the general use), was converted to a utility tax of 20%.
• Utility revenue on city-owned utilities has been slowly increasing due to increases in customer base as well as the underlying rate increases. The underlying water utility rates were increased by 5.0% in 2013, 2014 and 2015. Storm water rates were increased by 5.0% in 2014 and 2015 and sewer rates increased by 2.5% in 2014 and 2015.
• A total of $14.9 million was collected in taxes of City-owned utilities during the three quarters of 2015, approximately $400 thousand higher than was collected during the comparable period of 2014. The forecast has anticipated approximately a $500 thousand revenue increase. If the trend continues, collections in utility tax on city-owned utilities will likely generate $100 thousand above forecast by the year’s end, largely due to the current summer being one of the hottest summers in the Pacific Northwest in recent history.
• In 2014, residential water revenues generated 80% of the total water user revenues, while residential sewer fee revenues made up 66% of the total sewer user revenues. Similar breakdown is anticipated in 2015.
City of Vancouver Third Quarter 2015 Financial Report 17
Grant & Entitlement Revenues • The City anticipates receiving $2.0 million in grants in 2015. The largest grants include a
grant in Vancouver Police Department (VPD) for replacement of the records management system, and the remainder of the COPS grant, funding 10 positions in VPD. There are large grants in the Community and Economic Development departments that have been underspent by the end of 2014 but the supporting appropriation was carried forward into the 2015-2016 biennium. Grants are frequently reimbursing the City for the expenditures incurred, so most of the revenue comes in the second through last quarters of the year.
• Through the end of the third quarter, the City received $959 thousand in grant reimbursements, approximately 47% of the forecast for the year.
Charges for Goods and Services The largest program areas that generate fee revenue are the Development Review Services and Recreation programs. The forecast for the year anticipates $5.0 million to be received in these two categories. Land Use and Other Planning Permits
• During 2008, 2009 and 2010, the City experienced a significant decrease in both, the number of single family residential permits issued and in their valuation. The collections over 2011 through 2013 remained relatively flat. Year 2014 saw a significant $200 thousand annual increase in land use fees. The trend continues into 2015.
• The 2015 planning permit fee collections reached $688 thousand, approximately $140 thousand higher than revenues received during comparable period of 2014. The forecast anticipated a normalization of permitting activity to the 2013 levels, but the activity only strengthened. Planning fees should generate another $140 thousand through the end of the year, beating forecast by almost $400 thousand and beating last year collections by $200 thousand by the year end.
Recreation Program Fees
A total of $3.4 million in recreation fees was collected through the third quarter of 2015, comparable to last year’s collections over the same time period. It appears that the activity in 2015 continues at the level experienced over the last three years.
The forecast for the year has anticipated an increase in recreation revenue of $450 thousand in 2015 over 2014. It is highly likely that increase will not happen and recreation revenues will fall short of forecast by approximately $400 to $500 thousand by the end of the year.
City of Vancouver Third Quarter 2015 Financial Report 18
EXPENDITURES
• General Fund expenditures in the third quarter of 2015 were $97.6 million, or 71% of the budget, a little high by historical measures. One of the main changes in the 2015-2016 budget in the General Fund was the creation of a separate fund for internal services departments – Finance, Human Resources, Information Technology and General Services. These departments are recovering the cost of providing services in their areas from all funds and departments of the City. As a result, the budget in the General Fund has been reduced in proportionality to the indirect cost plan revenue paid by non-General Fund departments of the city. Because of this change, comparison with prior year’s information is meaningful by department, but not in total in the General Fund.
• By the end of September, General Fund departments spent 69.3% of their budgets for the year. Historically, the norm has been in the 67%-68% range.
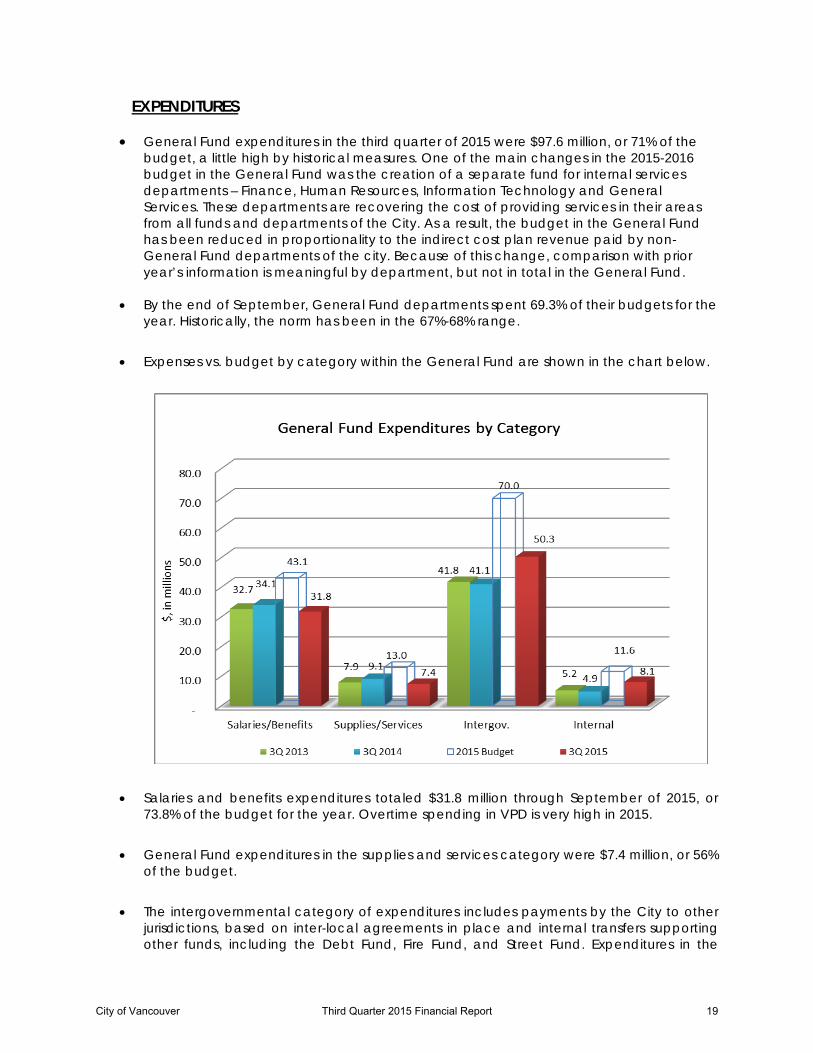
• Expenses vs. budget by category within the General Fund are shown in the chart below.
• Salaries and benefits expenditures totaled $31.8 million through September of 2015, or 73.8% of the budget for the year. Overtime spending in VPD is very high in 2015.
• General Fund expenditures in the supplies and services category were $7.4 million, or 56% of the budget.
• The intergovernmental category of expenditures includes payments by the City to other jurisdictions, based on inter-local agreements in place and internal transfers supporting other funds, including the Debt Fund, Fire Fund, and Street Fund. Expenditures in the
City of Vancouver Third Quarter 2015 Financial Report 19
Intergovernmental category reached $50.3 million through the third quarter of 2015, $9.2 million higher than in 2014, due to the timing of the General Fund transfer to the Fire Fund and the Internal Services Fund.
• Internal expenditures are $3.2 million greater than those in 2014. Beginning in 2015, the cost of the internal services departments, (such as IT, HR, Finance and General Services), is proportionately reflected in the respective budgets of the direct service providing departments.
Cash Balance
• The General Fund operating cash balance was $38.8 million at the end of the third quarter 2015. This is $4.9 million lower than the cash balance at the end of September 2014. The balance includes set asides for the carried-forward appropriation items.
• The General Fund emergency reserve was $10.7 million at the end of September 2015, compared to $10.5 million in September 2014. Council updated the financial policy related to the emergency reserve balance in 2012. In previous years, the balance was based on 7.0% of the prior year’s General Fund revenues. The new policy requires the emergency reserve balance to equal 7.0% of actual external revenues in the preceding fiscal year for the General, Street, and Fire Funds. These funds are intended to be used only for extraordinary events, such as natural disasters.
Fund Balance • The cash balance represents a snapshot on a particular date, while the fund balance
factors in revenues that are anticipated to be received by the end of the year and expenditures that are anticipated to happen through the end of the year.
• The total fund balance in the General Fund at the end of 2014 was $61.6 million. A portion of the fund balance estimated at $0.2 million represents the long term notes receivable and capital assets held for resale. The remaining balance is composed of the Restricted, Committed, Assigned and Unassigned balances. The Restricted balance of $0.2 million represents the grant revenue received in advance of expenditures in VPD. The Committed balance of $43.1 million represents reserves in accordance with the City Financial Policies: the City Emergency reserve of $10.5 million, Revenue Stabilization reserve of $3.4 million, reserve restricted for capital purposes of $0.9 million and the working capital of $28.3 million. The working capital is required to ensure sufficient cash flow in the fund. The balance pays for the ongoing operations of the General Fund when the incoming seasonal revenues are not sufficient to cover the expenses and eliminate the need for short-term borrowing. The Assigned reserve of $4.2 million represents funding of 50% of accrued compensated absences. The remaining portion of the balance of $13.9 million is anticipated to be unassigned at the end of 2014.
City of Vancouver Third Quarter 2015 Financial Report 20
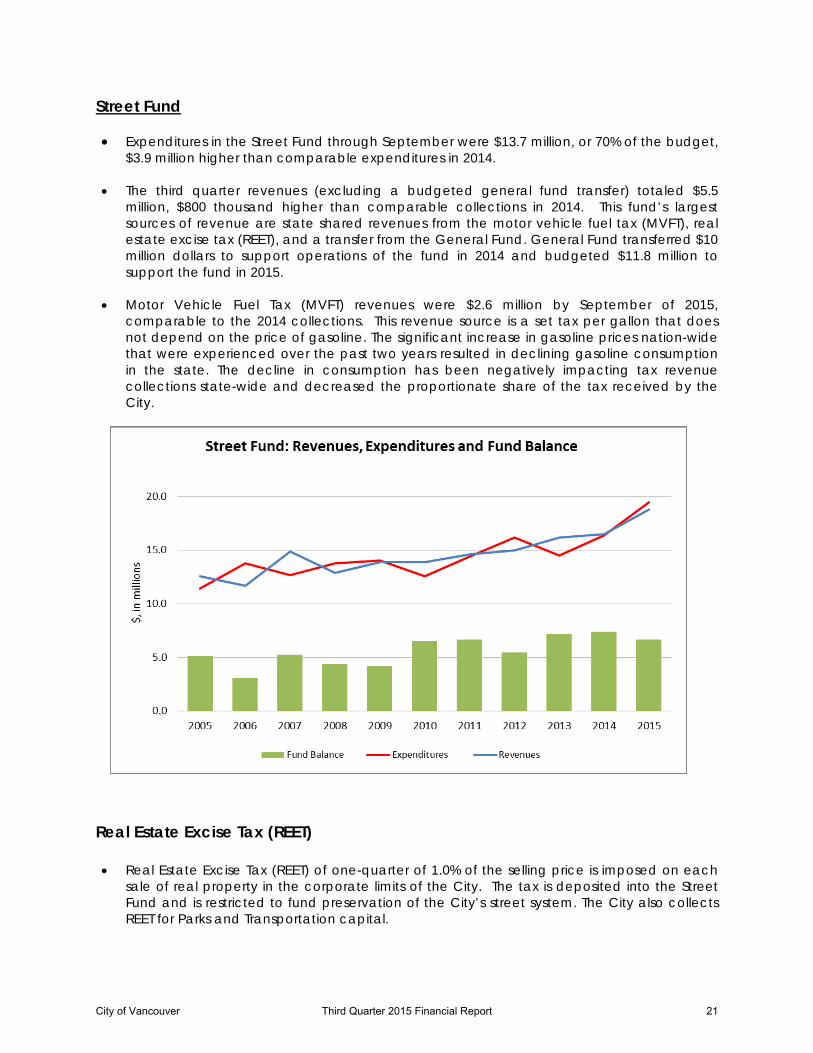
Street Fund • Expenditures in the Street Fund through September were $13.7 million, or 70% of the budget,
$3.9 million higher than comparable expenditures in 2014. • The third quarter revenues (excluding a budgeted general fund transfer) totaled $5.5
million, $800 thousand higher than comparable collections in 2014. This fund’s largest sources of revenue are state shared revenues from the motor vehicle fuel tax (MVFT), real estate excise tax (REET), and a transfer from the General Fund. General Fund transferred $10 million dollars to support operations of the fund in 2014 and budgeted $11.8 million to support the fund in 2015.
• Motor Vehicle Fuel Tax (MVFT) revenues were $2.6 million by September of 2015,
comparable to the 2014 collections. This revenue source is a set tax per gallon that does not depend on the price of gasoline. The significant increase in gasoline prices nation-wide that were experienced over the past two years resulted in declining gasoline consumption in the state. The decline in consumption has been negatively impacting tax revenue collections state-wide and decreased the proportionate share of the tax received by the City.
Real Estate Excise Tax (REET)
• Real Estate Excise Tax (REET) of one-quarter of 1.0% of the selling price is imposed on each sale of real property in the corporate limits of the City. The tax is deposited into the Street Fund and is restricted to fund preservation of the City’s street system. The City also collects REET for Parks and Transportation capital.
City of Vancouver Third Quarter 2015 Financial Report 21
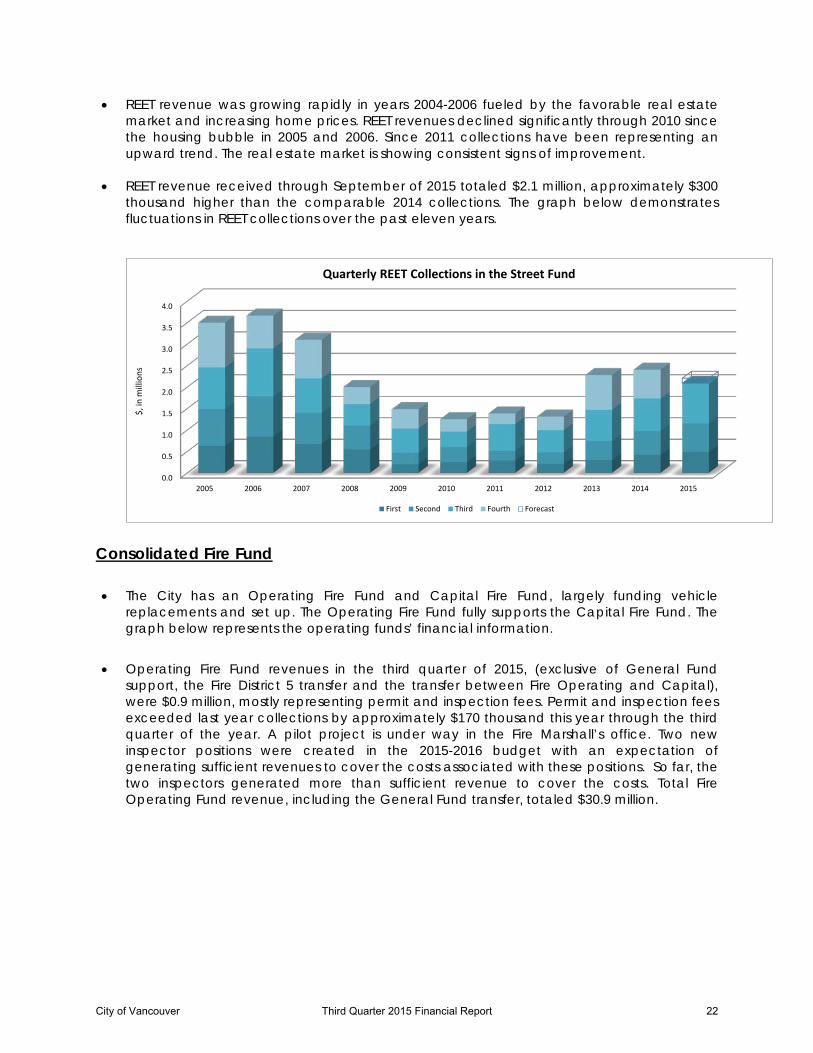
• REET revenue was growing rapidly in years 2004-2006 fueled by the favorable real estate market and increasing home prices. REET revenues declined significantly through 2010 since the housing bubble in 2005 and 2006. Since 2011 collections have been representing an upward trend. The real estate market is showing consistent signs of improvement.
• REET revenue received through September of 2015 totaled $2.1 million, approximately $300
thousand higher than the comparable 2014 collections. The graph below demonstrates fluctuations in REET collections over the past eleven years.
0.0
0.5
1.0
1.5
2.0
2.5
3.0
3.5
4.0
2005 2006 2007 2008 2009 2010 2011 2012 2013 2014 2015
Quarterly REET Collections in the Street Fund
First Second Third Fourth Forecast
$, in
mill
ions
Consolidated Fire Fund
• The City has an Operating Fire Fund and Capital Fire Fund, largely funding vehicle replacements and set up. The Operating Fire Fund fully supports the Capital Fire Fund. The graph below represents the operating funds’ financial information.
• Operating Fire Fund revenues in the third quarter of 2015, (exclusive of General Fund support, the Fire District 5 transfer and the transfer between Fire Operating and Capital), were $0.9 million, mostly representing permit and inspection fees. Permit and inspection fees exceeded last year collections by approximately $170 thousand this year through the third quarter of the year. A pilot project is under way in the Fire Marshall’s office. Two new inspector positions were created in the 2015-2016 budget with an expectation of generating sufficient revenues to cover the costs associated with these positions. So far, the two inspectors generated more than sufficient revenue to cover the costs. Total Fire Operating Fund revenue, including the General Fund transfer, totaled $30.9 million.
City of Vancouver Third Quarter 2015 Financial Report 22
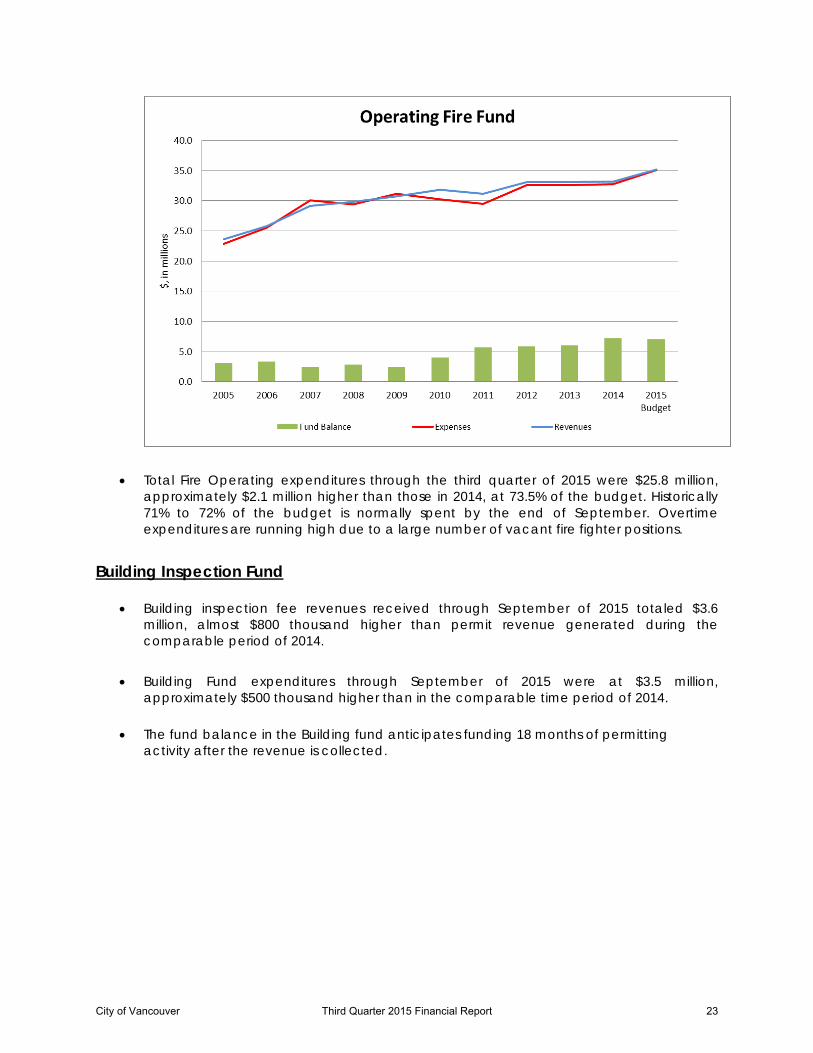
• Total Fire Operating expenditures through the third quarter of 2015 were $25.8 million, approximately $2.1 million higher than those in 2014, at 73.5% of the budget. Historically 71% to 72% of the budget is normally spent by the end of September. Overtime expenditures are running high due to a large number of vacant fire fighter positions.
Building Inspection Fund
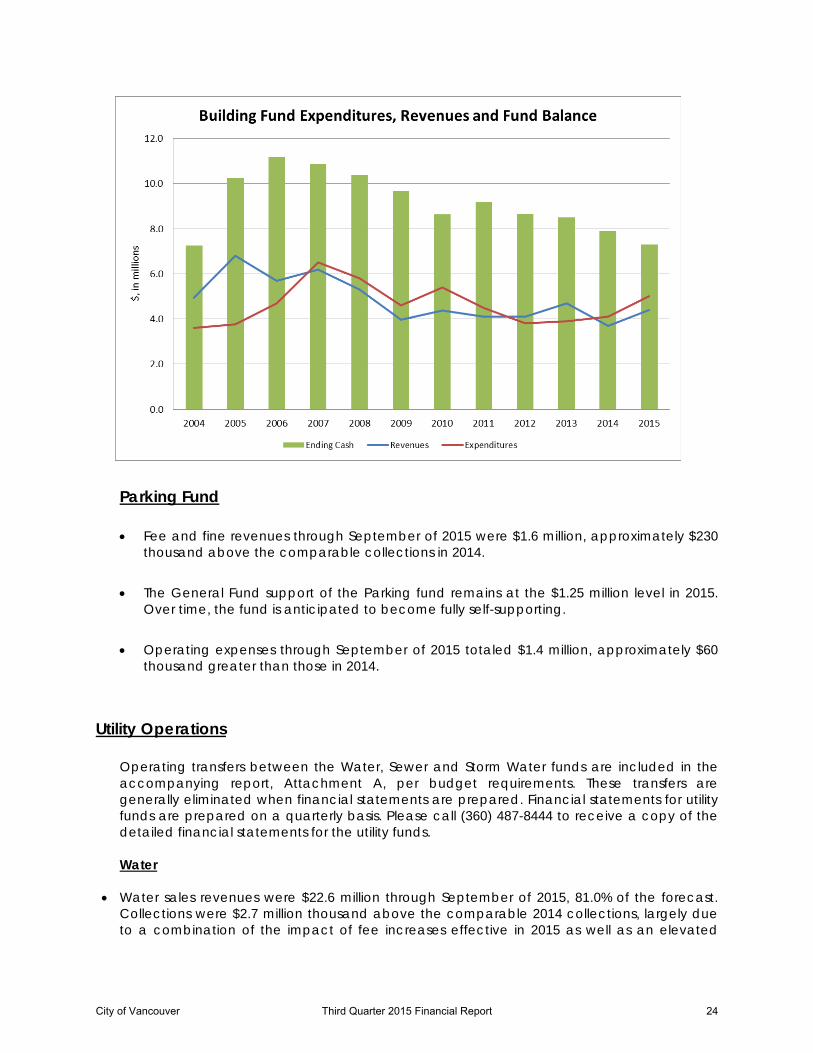
• Building inspection fee revenues received through September of 2015 totaled $3.6 million, almost $800 thousand higher than permit revenue generated during the comparable period of 2014.
• Building Fund expenditures through September of 2015 were at $3.5 million,
approximately $500 thousand higher than in the comparable time period of 2014.
• The fund balance in the Building fund anticipates funding 18 months of permitting activity after the revenue is collected.
City of Vancouver Third Quarter 2015 Financial Report 23
Parking Fund
• Fee and fine revenues through September of 2015 were $1.6 million, approximately $230 thousand above the comparable collections in 2014.
• The General Fund support of the Parking fund remains at the $1.25 million level in 2015. Over time, the fund is anticipated to become fully self-supporting.
• Operating expenses through September of 2015 totaled $1.4 million, approximately $60
thousand greater than those in 2014.
Utility Operations Operating transfers between the Water, Sewer and Storm Water funds are included in the accompanying report, Attachment A, per budget requirements. These transfers are generally eliminated when financial statements are prepared. Financial statements for utility funds are prepared on a quarterly basis. Please call (360) 487-8444 to receive a copy of the detailed financial statements for the utility funds. Water
• Water sales revenues were $22.6 million through September of 2015, 81.0% of the forecast. Collections were $2.7 million thousand above the comparable 2014 collections, largely due to a combination of the impact of fee increases effective in 2015 as well as an elevated
City of Vancouver Third Quarter 2015 Financial Report 24
water usage caused by hotter than average summer weather this year. There was a 5.0% increase in rates effective in 2014 and an additional 5.0% increase in 2015.
• Expenditures in the Water fund through September of 2015 totaled $21.8 million, or 52% of the
budget.
Sewer
• Sewer charge revenues in the Sewer Fund were $29.5 million through September 2015, approximately $0.7 million above the 2014 comparable revenues. Sewer rates were increased by 9% in 2011, 6.5% in 2012, 2.5% in 2013 and 2014 and 2% in 2015.
• Sewer fund has been borrowing from the Water fund to support operations. The support of
the Sewer Fund by the Water fund has been decreasing in the last several years; the fund borrowed $1.2 million in 2014, but is anticipating the need to borrow $4.0 million in 2015.
• Sewer expenditures through September of 2015 totaled $26.9 million, slightly below
spending during the comparable period of 2014. Storm Water
• A total of $9.7 million in storm water fee revenue was received by the third quarter of 2015, approximately $800 thousand higher than revenues from a comparable period of 2014. The Storm Water rates were increased by 5% in 2013, 2014 and 2015.
• Overall, the expenditures in the Storm Water fund through September of 2015 were $7.8 million, or 59.1% of the budget, higher than those in 2014 by approximately $500 thousand.
City of Vancouver Third Quarter 2015 Financial Report 25
IV. Outstanding Debt
• At the end of the third quarter of 2015, the City had about $100.7 million of general obligation (G.O.) debt outstanding and approximately $31.0 million of revenue bond debt outstanding. General obligation debt is backed by the full faith and credit of the City and by general taxes. Revenue bond debt is supported by a pledge of specific revenues. All of the City’s revenue bond debt is supported by the City’s water and sewer utilities. The weighted average interest rate for the City’s general obligation debt is 3.52% while the average interest rate for the City’s revenue bond debt is 3.97%.
A complete list of the City’s outstanding debt is included in Attachment C.
V. Investments
Market Conditions • Information received since the Federal Open Market Committee met in July suggests that
economic activity is expanding at a moderate pace. Household spending and business fixed investment have been increasing moderately, and the housing sector has improved further; however, net exports have been soft. The labor market continued to improve, with solid job gains and declining unemployment. On balance, labor market indicators show that underutilization of labor resources has diminished since early this year. Inflation has continued to run below the Committee's longer-run objective, partly reflecting declines in energy prices and in prices of non-energy imports. Market-based measures of inflation compensation moved lower; survey-based measures of longer-term inflation expectations have remained stable.
• To support continued progress toward maximum employment and price stability, the Committee reaffirmed on September 17, 2015 its view that the current 0 to 1/4 percent target range for the federal funds rate remains appropriate. In determining how long to maintain this target range, the Committee will assess progress--both realized and expected--toward its objectives of maximum employment and 2 percent inflation. This assessment will take into account a wide range of information, including measures of labor market conditions, indicators of inflation pressures and inflation expectations, and readings on financial and international developments. The Committee anticipates that it will be appropriate to raise the target range for the federal funds rate when it has seen some further improvement in the labor market and is reasonably confident that inflation will move back to its 2 percent objective over the medium term.
• The overall yield curve increased during the third quarter of 2015. The yield on the three-month Treasury has decreased ending at 0.005% at the end of the third quarter. The six-month Treasury yield has increased to 0.117%. The yield on the two-year Treasury has maintained at 0.64%. The thirty-year Treasury yield decreased, ending the third quarter at 2.87% from 3.11%. Market risk of the City’s portfolio is low. Investment purchase maturities have been kept at less than one year and are due to the Federal Reserve’s statement of continued low overnight rates into late-2015 early 2016. The investment maturities are expected to meet the cash flow needs of the city and it is unlikely that an investment would have to be liquidated before maturity to meet the city cash needs.
City of Vancouver Third Quarter 2015 Financial Report 26
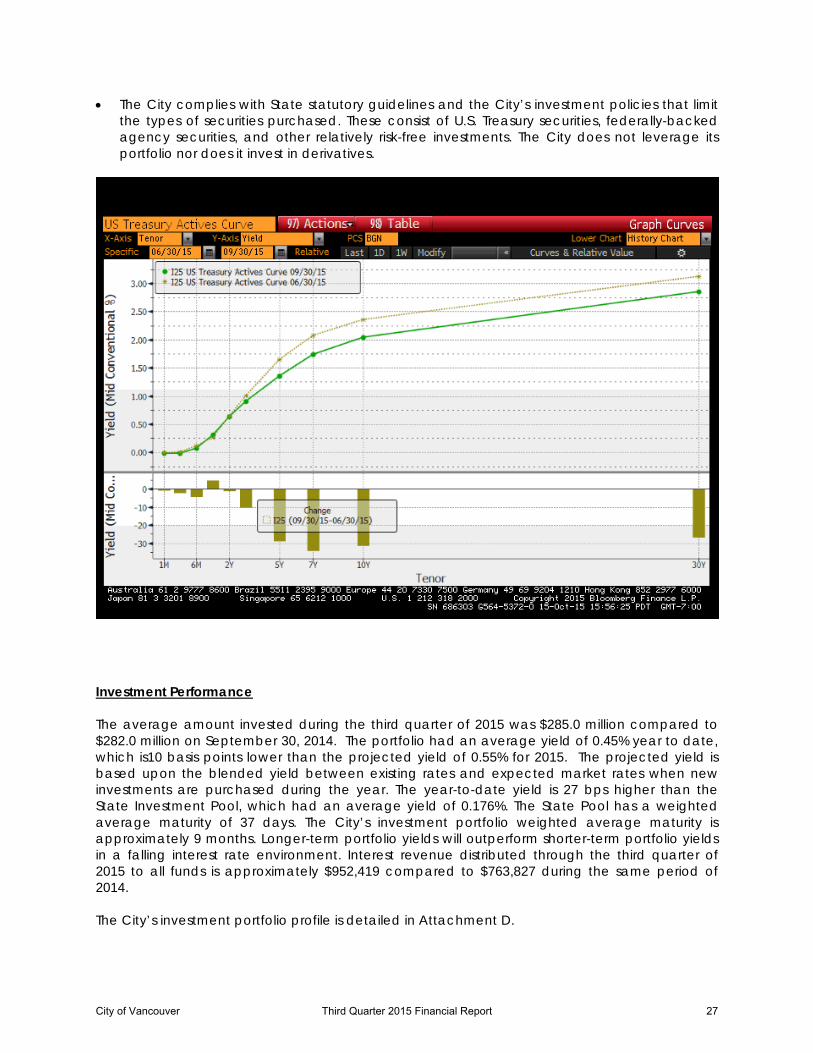
• The City complies with State statutory guidelines and the City’s investment policies that limit the types of securities purchased. These consist of U.S. Treasury securities, federally-backed agency securities, and other relatively risk-free investments. The City does not leverage its portfolio nor does it invest in derivatives.
Investment Performance The average amount invested during the third quarter of 2015 was $285.0 million compared to $282.0 million on September 30, 2014. The portfolio had an average yield of 0.45% year to date, which is10 basis points lower than the projected yield of 0.55% for 2015. The projected yield is based upon the blended yield between existing rates and expected market rates when new investments are purchased during the year. The year-to-date yield is 27 bps higher than the State Investment Pool, which had an average yield of 0.176%. The State Pool has a weighted average maturity of 37 days. The City’s investment portfolio weighted average maturity is approximately 9 months. Longer-term portfolio yields will outperform shorter-term portfolio yields in a falling interest rate environment. Interest revenue distributed through the third quarter of 2015 to all funds is approximately $952,419 compared to $763,827 during the same period of 2014. The City’s investment portfolio profile is detailed in Attachment D.
City of Vancouver Third Quarter 2015 Financial Report 27
VI. Interfund Loans
In 2003, Council passed an ordinance giving the City Treasurer the authority to make interfund loans to meet the short term liquidity and cash flow needs of the City’s various funds. The ordinance requires the City Treasurer to provide a quarterly report to City Council showing the amount of all interfund loans outstanding and the repayment plan for those loans. Through the third quarter of 2015, no funds were on interfund loans.
City of Vancouver Third Quarter 2015 Financial Report 28
Attachment A A A A B A
Quarterly Expense Summary ADJ-14 SEP-14 JUL-15 SEP-152014 2014 2015 2015 %
Actuals September Budget September of BudgetGENERAL FUNDCity Council 502,486 348,526 69% 600,338 358,945 59.8%City Manager's Office 2,520,791 1,791,286 71% 2,669,604 1,811,899 67.9% Legal Services 3,996,081 2,766,912 69% 4,683,295 3,067,057 65.5%Community Economic Development 4,524,665 3,311,894 73% 6,185,212 4,023,718 65.1%Parks Administration 749,735 559,434 75% 954,407 635,474 66.6%Parks, Trails, & Natural Resources 2,910,587 409,368 14% 1,198,115 611,027 51.0%Recreation Services 5,716,035 4,348,619 76% 6,867,164 5,004,441 72.9% Police 35,136,837 24,607,751 70% 39,141,662 27,557,046 70.4%Transportation 633,729 465,499 73% 75,000 28,132 37.5%Grounds Maintenance 2,827,743 2,033,546 72% 3,402,331 2,410,773 70.9%Facilities Maintenance 3,307,052 1,842,731 56% 3,708,119 2,665,316 71.9%Financial and Mgmt Services 4,192,714 3,088,326 74% - (2,761) General Services 411,089 289,141 70% - (69) Information Technology 3,518,528 2,649,553 75% - (173) Human Resources 1,198,944 852,849 71% - (459)
Subtotal Non-Gen. Governmental 72,147,015 49,365,435 68% 69,485,247 48,170,366 69.3%General Governmental
Child Justice Center Support 333,864 222,576 67% 345,537 252,540 73.1%City Cable Programming 460,596 345,447 75% 460,596 345,447 75.0%Fire District #6 17,437 17,437 100% 17,640 18,157 102.9%Emergency Mgmt (CRESA) 140,758 140,758 100% 144,464 107,433 74.4%Air Pollution Control Authority 53,356 53,356 100% 56,166 53,885 95.9%Humane Society 226,386 147,441 65% 278,908 164,011 58.8%Animal Control 243,743 168,745 69% 236,243 206,165 87.3%Alcoholism Support 35,544 14,681 41% 29,577 18,417 62.3%Regional Transp Council - - n/a 21,300 21,300 100.0%Election Support 182,675 - 0% 350,000 - 0.0%AWC, Chamber of Commerce Memberships 82,237 82,237 100% 85,733 73,629 85.9%Opportunity Reserve 137,244 86,111 63% 243,941 138,113 56.6%Miscellaneous 5,096,702 245,315 5% 979,539 501,239 51.2%Public Defender 714,676 577,890 81% 1,322,630 879,675 66.5%County Jail Costs 3,934,134 2,032,127 52% 4,457,345 1,904,601 42.7%County Corrections Costs 1,299,551 798,946 61% 1,141,900 841,794 73.7%County District Court Costs 903,924 417,525 46% 1,240,632 474,133 38.2%General Obligation Debt Payment 6,892,169 944,440 14% 6,995,887 831,341 11.9%General Govt Support 40,964,483 33,451,192 82% 49,853,245 42,578,406 85.4%
Subtotal General Govermental 61,719,478 39,746,224 64% 68,261,283 49,410,285 72.4%Total General Fund 133,866,493 89,111,659 67% 137,746,530 97,580,650 71%
SPECIAL REVENUE FUNDSStreet 16,836,378 9,794,509 58% 19,500,114 13,653,661 70.0%Fire Operating Fund 32,818,755 23,731,702 72% 35,108,940 25,788,399 73.5%Fire Capital Fund 908,202 384,264 42% 2,409,059 277,861 11.5%AMR Compliance Fund (New) - 753,867 284,698 37.8%Drug Enforcement and Investigative Funds 81,459 52,194 64% 323,685 52,333 16.2%Community Development Block Grant 1,713,037 1,227,524 72% 4,034,502 3,440,739 85.3%Tourism 872,934 564,557 65% 2,711,210 665,256 24.5%Criminal Justice/LLEBG 126,730 - 0% 226,816 (77) 0.0%Real Estate Excise Tax - I 1,965,718 519,087 26% 3,406,694 502,697 14.8%Transportation Special Revenue 2,116,927 647,932 31% 2,228,680 636,743 28.6%Parks & Recreation Special Revenue 45,088 29,375 65% 26,071 24,129 92.6%Parks Construction - Residual REET 34,308 15,095 44% 89,877 32,355 36.0%Downtown Initiatives 93,102 75,528 81% 401,676 81,214 20.2%VNHR Properties 100,453 97,589 97% 249,894 78,053 31.2%Senior Messenger 254,888 192,754 76% 319,820 189,454 59.2%
% of Final
City of Vancouver Third Quarter 2015 Financial Report 29
2014 2014 2015 2015 % Actuals September Budget September of Budget % of Final
TIF Funds 1,968,172 338,149 17% 4,593,722 757,582 16.5%PIF Funds 1,162,750 89,441 8% 2,080,778 559,722 26.9%
DEBT SERVICE FUNDSG O Debt Service Fund 11,850,517 2,218,332 19% 40,243,555 26,596,190 66.1%L I D Debt Fund 458,167 458,167 n/a 107,000 153,082 143.1%
CAPITAL FUNDS2011 Bond Capital Fund - Waterfront 228,785 113,813 50% 445,074 43,627 9.8%Transportation Capital Fund 6,745,219 4,095,728 61% 28,313,732 10,051,376 35.5%Fire Acquisition Fund - - n/a 4,380,000 2,103,057 48.0%Capital Improvement Fund 700,357 296,199 42% 7,068,000 1,415,384 20.0%VNHR Property Capital 997 997 100% 8,004,854 511,865 6.4%2015 Bond Capital Fund - VNHR (New) - - 5,156,529 595,199 11.5%Parks Construction Fund (Capital Projects only 3,197,673 279,659 9% 13,450,391 1,254,351 9.3%City Tree Reserve Fund 6,318 417 7% 19,237 4,569 23.8%Drainage Construction Fund 988,111 777,584 79% 959,507 322,968 33.7%Systems Development Reserves 1,100,000 1,100,000 100% 2,500,000 - 0.0%Water Construction Fund 7,802,090 7,094,946 91% 21,174,031 7,642,966 36.1%Utility Customer Assistance 15,709 12,573 80% 35,000 17,588 50.3%Water Revenue Bond Debt Service Fund 85,123 606,514 713% 643,574 620,017 96.3%Sewer Revenue Bond Debt Service Fund 2,208,819 9,764,592 442% 10,774,586 9,984,715 92.7%Sewer System Development 1,200,000 1,200,000 100% 2,500,000 - 0.0%Sewer Construction Fund 856,241 174,220 20% 7,151,214 496,339 6.9%
ENTERPRISE FUNDSStorm Water 11,287,864 7,267,598 64% 13,175,741 7,790,275 59.1%Water 29,544,969 19,750,912 67% 41,962,779 21,817,585 52.0%Sewer 45,556,229 27,162,767 60% 46,120,774 26,931,476 58.4%Building Inspection 4,189,595 3,004,329 72% 5,037,154 3,529,660 70.1%Solid Waste 2,352,590 1,436,684 61% 3,006,956 1,440,320 47.9%Parking 2,902,377 1,382,721 48% 3,503,350 1,441,006 41.1%Tennis Center 1,076,443 791,264 74% 1,232,041 828,178 67.2%Airpark 631,450 295,502 47% 1,102,267 317,471 28.8%Utility Customer Assistance 15,709 12,573 80% 35,000 17,588 50.3%
INTERNAL SERVICE FUNDSFacilities Asset Mgmt & Replacement Reserve - - 0% 4,721,736 1,500,185 31.8%Equipment Services Operations Fund 5,010,721 3,649,683 73% 5,772,658 3,578,521 62.0%Equipment ER&R Capital 1,501,203 1,139,588 76% 2,158,234 1,336,030 61.9%Technology ER&R 2,939,024 2,177,898 74% 1,297,349 790,990 61.0%Risk Fund 5,418,316 2,525,251 47% 4,276,979 2,393,786 56.0%Internal Administrative Services Fund (New) - - Finance - - 5,339,942 3,550,634 66.5% Information Technology - - 6,445,860 3,938,448 61.1% Human Resources - - 1,873,037 1,295,063 69.1% General Services - - 334,598 159,795 47.8%Benefits Fund 14,584,536 11,037,023 76% 12,830,028 8,859,863 69.1%Self Insured Health Insurance (New) - - 6,772,631 3,720,604 54.9%Print Shop & Mail Services 172,753 118,786 69% 235,906 148,298 62.9%
AGENCY FUNDSSWAT Team 172,819 135,945 79% 182,845 144,273 78.9%Police Pension 923,385 717,231 78% 989,413 449,837 45.5%Fire Pension 1,430,425 1,075,799 75% 1,799,238 910,852 50.6%Cable TV 1,086,578 1,122,043 103% 1,277,479 962,853 75.4%
Notes1. This report contains the unaudited results through the end of September 2015.2. Operating transfers between funds are included within this report.3. Proprietary funds only include operating revenues and exclude non-cash adjustments.
City of Vancouver Third Quarter 2015 Financial Report 30
Attachment B SEP-15 SEP-15Quarterly Revenue Summary 2014 2014 % of 2015 2015 % of
Actual September YE Actual Forecast September BudgetGENERAL FUND Tax Revenue
Property Tax 43,344,456 24,909,001 57% 43,862,543 25,344,572 58%Sales Tax 30,052,170 22,057,898 73% 30,489,436 25,441,874 83%Electrical Tax 8,168,161 6,941,390 85% 8,063,037 6,741,825 84%Natural Gas 3,400,739 2,533,654 75% 2,656,426 2,174,283 82%Telephone 4,672,282 3,558,143 76% 4,572,738 3,249,711 71%Cable Franchise Fee 1,892,519 1,403,839 74% 1,807,303 1,475,109 82%Water/Sewer/Storm Water 15,316,069 11,344,244 74% 15,736,243 12,042,274 77%Solid Waste Utility Tax 3,755,438 3,153,777 84% 3,862,095 2,887,381 75%Gambling and Leasehold Taxes 630,085 385,423 61% 612,403 384,287 63%
Subtotal Tax Revenue 111,231,919 76,287,369 69% 111,662,224 79,741,316 71%Business Licenses 851,489 649,879 76% 912,464 777,012 85%Grants & Entitlements 1,526,260 557,110 37% 2,027,188 959,681 47%State Shared Revenues 2,883,948 2,462,893 85% 2,961,392 2,716,743 92%Parks Contract with Clark County 59,845 34,789 58% - 50,286 Charges for Services
Planning Permits 831,119 548,354 66% 425,593 688,488 162%Recreation Program Fees 4,112,593 3,368,567 82% 4,552,311 3,350,987 74%Interfund Service Charges 7,553,700 5,684,711 75% 3,240,973 2,748,356 85%Other Charges & Services 801,809 570,305 71% 685,051 562,115 82%
Subtotal Charges for Services 13,299,222 10,171,937 76% 8,903,928 7,349,946 83%District Court 1,841,392 1,424,487 77% 1,659,372 1,215,256 73%Miscellaneous 712,648 431,823 61% 1,905,856 765,729 40%Lease Revenue (short and long-term) 3,249,652 1,921,327 59% 3,228,755 2,460,878 76%Operating Transfers 550,353 308,790 56% 780,157 49,332 6%
Total General Fund 136,206,727 94,250,403 69% 134,041,335 96,086,179 72%
SPECIAL REVENUE FUNDSStreet Fund
Real Estate Excise Tax 2,403,493 1,728,877 72% 2,203,355 2,083,711 95%Motor Vehicle Fuel Tax 3,410,953 2,503,568 73% 3,490,789 2,585,797 74%Permits and Misc. 745,722 467,551 63% 1,259,410 861,486 68%Operating Transfers 9,987,907 7,428,092 74% 11,838,428 8,838,726 75%
Total Street Fund 16,548,074 12,128,088 73% 18,791,982 14,369,720 76%Operating Fire Fund
Service Charges-Fire Dist. #5 7,784,190 3,904,205 50% 8,322,836 4,045,746 49%Grant Revenue 1,450,493 295,047 20% 57,939 62,011 107%Permit/Other Fees and Misc 960,782 713,292 74% 946,352 883,743 93%Operating Transfers 23,113,786 22,272,058 96% 25,886,091 25,886,091 100%
Total Operating Fire Fund 33,309,251 27,184,602 82% 35,213,218 30,877,591 88% Fire Equipment Fund 2,772,948 1,384,515 50% 1,117,777 878,483 79%
AMR Compliance Fund (New) 14 - 0% 688,327 567,370 82%
Other Special Revenue FundsDrug Enforcement 239,969 177,353 74% 335,000 148,901 44%Community Development Block Grant 1,570,030 904,890 58% 3,912,321 3,355,771 86%Tourism 1,743,967 1,196,858 69% 1,484,336 1,433,593 97%Criminal Justice/LLEBG 234,598 172,914 74% 295,578 176,499 60%Real Estate Excise Tax - I 2,279,745 1,629,212 71% 2,190,154 1,965,042 90%Parks & Recreation Special Revenue Fund 68,510 12,621 18% 20,000 18,736 94%Downtown Initiatives 162,422 121,870 75% 162,344 129,610 80%VNHR Properties 188,746 141,496 75% 240,505 148,369 62%Senior Messenger 304,535 228,080 75% 250,000 222,100 89%TIF Funds 941,481 768,244 82% 531,692 501,155 94%PIF Funds 1,431,114 1,278,167 89% 655,000 1,281,751 196%Miscellaneous Special Revenue Funds 318,110 236,647 74% 262,000 338,360 129%
DEBT SERVICE FUNDSG O Debt Service Fund 11,854,562 2,218,332 19% 40,187,855 26,604,381 66%L I D Fund 587,431 727,830 124% 8,000 10,975 137%
CAPITAL FUNDS2011 Bond Capital Fund - Waterfront 18,437 12,930 70% - 15,252 n/a2015 Bond Capital Fund - VNHR - - 5,180,944 5,106,743 99%Transportation Capital Fund 11,073,464 6,987,726 63% 27,650,660 6,352,237 23%Capital Improvement Fund 6,621,303 3,249,817 49% 5,480,500 384,144 7%VNHR Property Capital 281,141 1,200 0% 7,915,105 507,988 6%Parks Construction Fund (Capital Projects only) 3,956,902 213,417 5% 13,438,987 695,556 5%City Tree Reserve Fund 16,076 (2,082) -13% 81,348 20,351 25%Drainage Construction Fund 849,432 504,490 59% 1,166,877 299,505 26%Water/Sewer Capital Reserves 12,026 8,473 70% 10,000 10,001 100%Systems Development Reserves 2,103,128 1,566,305 74% 1,506,000 2,507,129 166%Water Construction Fund 1,435,513 1,187,179 83% 16,720,102 459,355 3%SCIP Fund 805,027 672,598 84% 615,000 562,042 91%Utility Customer Assistance 11,437 4,236 37% 41,000 7,014 17%
City of Vancouver Third Quarter 2015 Financial Report 31
Attachment B SEP-15 SEP-15Quarterly Revenue Summary 2014 2014 % of 2015 2015 % of
Actual September YE Actual Forecast September BudgetWater Revenue Bond Debt Service Fund 645,942 530,354 82% 643,572 532,555 83%Sewer Revenue Bond Debt Service Fund 10,819,027 8,817,954 82% 10,789,584 8,849,969 82%Debt Service Reserves 7,208 5,036 70% 6,000 6,115 102%Sewer Utility Fund 41,059,579 30,694,513 75% 44,132,857 31,647,947 72%Sewer System Development 2,130,461 1,630,689 77% 2,053,000 2,447,980 119%Sewer Construction Fund 1,449,132 1,356 0% 6,644,000 194,509 3%ENTERPRISE FUNDSStorm Water
Storm Drainage Fees 11,661,770 8,484,421 73% 11,994,129 9,042,557 75%Private Capital Contributions 347,885 139,615 40% 150,000 340,696 227%Miscellaneous 284,692 213,619 75% 100,000 269,136 269%
Total Storm Water Fund 12,294,347 8,837,655 188% 12,244,129 9,652,389 79%Water
Water SalesResidential 21,195,019 15,919,958 75% 22,243,659 17,965,095 81%Commercial 4,580,210 3,335,106 73% 4,718,647 3,786,178 80%Governmental 821,042 620,910 76% 875,916 806,350 92%
Subtotal Water Sales 26,596,271 19,875,974 75% 27,838,222 22,557,622 81%Private Capital Contributions 2,613,959 1,799,628 69% 2,500,000 1,984,560 79%Interfund Transfers 2,908,437 469,043 16% 2,814,746 4,760 0%Indirect Cost Plan Revenue 1,275,294 917,482 72% 1,398,068 1,202,749 86%Miscellaneous 2,152,919 1,588,828 74% 1,755,567 1,614,623 92%
Total Water Fund 35,546,880 24,650,955 36,306,603 27,364,315 75%Sewer
Sewer ChargeResidential 25,603,987 19,174,414 75% 25,815,692 19,511,694 76%Commercial, Industrial 11,705,089 8,662,390 74% 12,154,634 9,029,520 74%Governmental 1,214,558 900,178 74% 1,388,053 927,103 67%
Subtotal Sewer Charges 38,523,634 28,736,982 75% 39,358,379 29,468,317 75%Private Capital Contributions 956,163 471,460 49% 600,000 1,801,167 300%Interfund Transfers 1,200,000 1,200,000 100% 3,981,178 - 0%Miscellaneous 379,783 286,072 75% 193,300 378,463 196%
Total Sewer Fund 41,059,579 30,694,513 75% 44,132,857 31,647,947 72%Building Inspection
Permits 2,881,245 2,233,311 78% 3,412,211 2,895,315 85%Miscellaneous 155,631 116,341 75% 151,020 121,798 81%Interfund Services 647,824 485,868 75% 805,832 604,374 75%
Total Building Fund 3,684,700 2,835,520 77% 4,369,063 3,621,488 83%Solid Waste
Solid Waste Utility Tax 1,421,536 1,066,152 75% 1,680,000 822,051 49%Service Charges-Recycling 838,822 501,697 60% 900,000 334,455 37%Miscellaneous 73,327 29,315 40% 30,000 39,854 133%
Total Solid Waste Fund 2,333,685 1,597,164 68% 2,610,000 1,196,360 46%Parking
Parking Fines 442,011 327,594 74% 578,000 389,795 67%Parking Meters & Lots 1,418,557 1,055,819 74% 1,707,560 1,184,633 69%Miscellaneous Adjustments (61,581) (9,923) 16% (9,500) 25,813 n/aOperating Transfers 1,245,540 - 0% 1,245,540 605 0%
Total Parking Fund 3,044,526 1,373,490 45% 3,521,600 1,600,846 45%Tennis Center
Membership Fees 841,874 641,168 76% 908,223 614,097 68%Instruction Fees 2,431 1,732 71% 2,400 2,517 105%Miscellaneous 17,857 12,707 71% 49,333 16,629 34%Operating Transfers 189,864 86,148 45% 343,077 171,170 50%
Total Tennis Center Fund 1,052,026 741,755 71% 1,303,033 804,413 62%Other Enterprise Funds
Pearson Airfield 713,165 537,276 75% 734,780 520,313 71%Utility Customer Assistance 11,437 4,236 37% 41,000 7,014 17%
INTERNAL SERVICE FUNDSFacilities Asset Mgmt & Replacement Reserve Fund 1,832,604 1,372,043 75% 1,820,000 1,380,794 76%Equipment Services Operations Fund 4,461,647 3,293,446 74% 4,985,076 3,774,779 76%Equipment Services Capital Fund 2,880,158 2,077,857 72% 2,890,263 2,378,705 82%Computer Repair & Replacement 7,461,199 2,044,352 27% 2,667,556 1,926,064 72%Self-Insured Worker's Comp & Liability Fund 4,228,666 3,018,851 71% 3,567,982 2,910,049 82%Internal Administrative Services Fund 600,088 - 0% 16,320,601 12,878,704 79%Benefits Fund 14,658,247 10,600,408 72% 11,507,985 7,227,245 63%Self-Insured Health Insurance Fund - - 7,919,367 6,965,945 88%Mail Services Fund 177,863 130,841 74% 193,234 187,235 97%
AGENCY FUNDSSWAT Team 179,407 105,858 59% 209,898 139,856 67%Police Pension 1,081,764 811,658 75% 1,082,468 816,905 75%Fire Pension 1,976,417 1,531,107 77% 1,981,000 1,523,411 77%Cable TV 1,330,532 699,876 53% 1,254,935 729,447 58%Notes1. This report was prepared using the methodology prescribed under the basis of budgeting.2. Operating transfers between funds are included within this report.3. The Water, Sewer and Storm Water funds are adopted as one legal fund but are shown separately for informational purposes. Private capital contributions, adjustments for doubtful accounts and interfund transfers are included in this report and are categorized as "Misc." revenue.
City of Vancouver Third Quarter 2015 Financial Report 32
City of VancouverOutstanding Debt - General Obligation BondsThrough Third Quarter 2015
True FinalIssue Original Issue Amount Interest MaturityDate Purpose Amount Outstanding Cost (TIC) Date
Oct-02 To partially refund 1993, 1996, 1997, 1999, & 2000 LTGO issues, and issue $1.6 million for the Oracle HR/Payroll Management System Implementation
39,365,000 11,520,000 4.08% 12/1/2018
Jul-05 To construct & equip the East Precinct Police facility, and to partially refund the 98A and 98B LTGO bonds.
18,090,000 6,845,000 4.07% 12/1/2026
Oct-06 To fund multiple transportation projects and to fund the Marshall Community Center remodel
14,785,000 1,425,000 4.25% 12/1/2025
Jun-08 To fund West Police Precinct, Fire Station 810 and Police Evidence
14,570,000 1,750,000 4.51% 12/1/2027
Jun-09 To fund multiple Transportation Projects
12,970,000 10,195,000 4.03% 12/1/2028
Dec-10 To fund the new City Hall and partially refund the 2001 LTGO bond issue
13,410,000 10,340,000 4.50% 12/1/2035
Jun-11 To fund Transportation Projects for the Waterfront Access Project
10,515,000 9,625,000 3.93% 12/1/2035
Jan-12 To partially refund the 2003 LTGO bond issue for the Firstenburg Community Center
15,945,000 15,255,000 3.26% 12/1/2029
Dec-12 To partially refund the 2002 LTGO & Refunding bond issue for VancouverCenter, West Coast Bank, and Street Improvements
9,515,000 9,420,000 2.36% 12/1/2025
Jun-15 To fund the West Barracks rennovations (Vancouver Heritage Bonds)
1,296,500 1,296,500 4.33% 12/1/2028
City of Vancouver Third Quarter 2015 Financial Report 33
Jun-15 To fund the West Barracks rennovations and to partially refund the 2005 LTGO, 2006 LTGO, and the 2008 LTGO issued for the East Police Precinct, West Police Precinct, Evidence Building, Fire Station 810, Transportation Projects, and the Marshall CC remodel.
23,100,000 23,100,000 2.72% 12/1/2034
Total Outstanding General Obligation Bonds 100,771,500$
City of Vancouver Third Quarter 2015 Financial Report 34
City of VancouverOutstanding Debt - Revenue BondsThrough Third Quarter 2015
True FinalIssue Original Issue Amount Interest MaturityDate Purpose Amount Outstanding Cost (TIC) Date
Feb-04 Partially refund the 1999 Water/Sewer Revenue Bonds
26,250,000 14,875,000 3.998% 6/1/2020
Apr-05 Partially refund the 1997 Water/Sewer Revenue Bonds
42,520,000 13,625,000 4.037% 6/1/2018
Jun-08 Refund the 1998 Water/Sewer Revenue Bonds
20,230,000 2,845,000 3.551% 12/1/2016
31,345,000$
City of Vancouver Third Quarter 2015 Financial Report 35
City of VancouverInvestment Activity
Second Quarter of 2015(Dollars in thousands)
As of Percent of As of Percent of6/30/2015 Portfolio 9/30/2015 Portfolio
State Investment Pool 90,293 31.9% 90,169 31.3%Clark County Investment Pool 10,113 3.6% 4,532 1.6%U.S. Agencies 156,052 55.2% 169,034 58.7%Corporate Bonds (Pension Fund) 1,000 0.4% 1,042 0.4%Municipal Bonds 18,967 6.7% 17,144 6.0%Zero Coupon 6,194 2.2% 6,203 2.2%
Total by Investment Type 282,618$ 100.0% 288,124$ 100.0%
As of Percent of As of Percent of6/30/2015 Portfolio Cumulative 9/30/2015 Portfolio Cumulative
Overnight 104,241 36.9% 36.9% 94,701 32.9% 32.9%One Month - 0.0% 36.9% - 0.0% 32.9%Two to Six Months 16,275 5.8% 42.6% 28,593 9.9% 42.8%Six Months to One Year 27,833 9.8% 52.5% 35,815 12.4% 55.2%One to Five Years 134,270 47.5% 100.0% 129,015 44.8% 100.0%
Total by Length of Maturity 282,618$ 100.0% 288,124$ 100.0%
9 Months 9 Months
City of Vancouver Third Quarter 2015 Financial Report 36
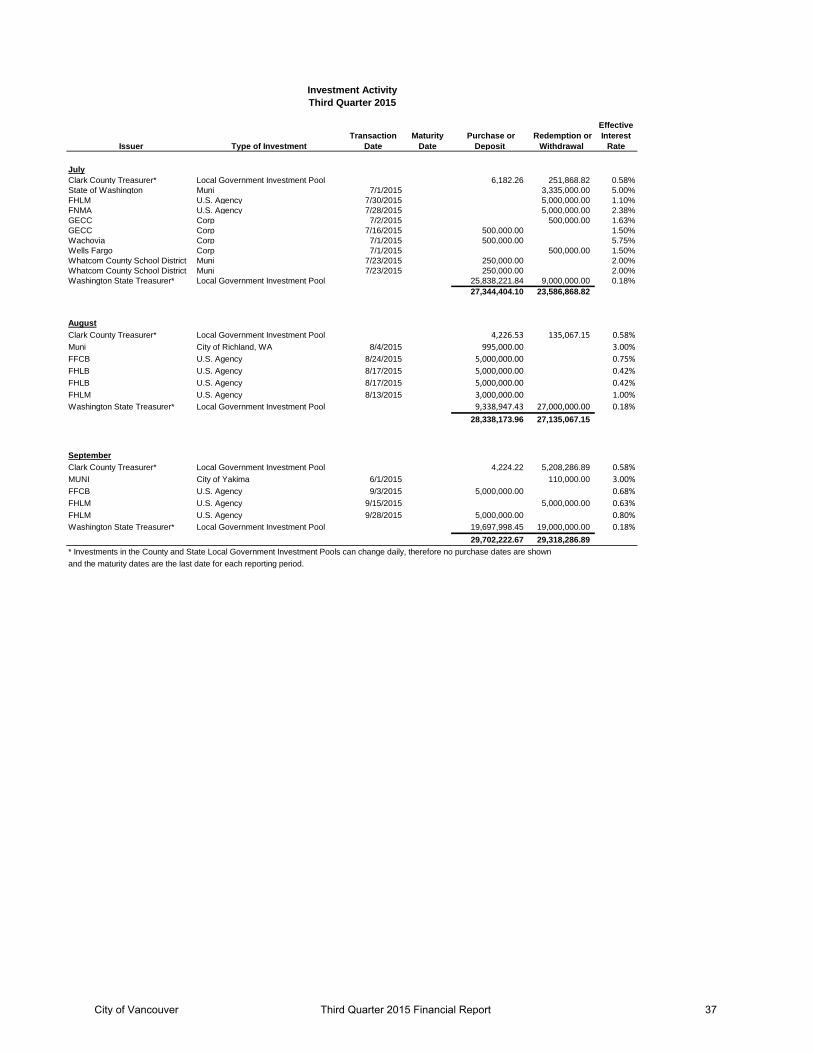
Investment ActivityThird Quarter 2015
Issuer Type of InvestmentTransaction
DateMaturity
Date Purchase or
Deposit Redemption or
Withdrawal
Effective Interest
Rate
JulyClark County Treasurer* Local Government Investment Pool 6,182.26 251,868.82 0.58%State of Washington Muni 7/1/2015 3,335,000.00 5.00%FHLM U.S. Agency 7/30/2015 5,000,000.00 1.10%FNMA U.S. Agency 7/28/2015 5,000,000.00 2.38%GECC Corp 7/2/2015 500,000.00 1.63%GECC Corp 7/16/2015 500,000.00 1.50%Wachovia Corp 7/1/2015 500,000.00 5.75%Wells Fargo Corp 7/1/2015 500,000.00 1.50%Whatcom County School District Muni 7/23/2015 250,000.00 2.00%Whatcom County School District Muni 7/23/2015 250,000.00 2.00%Washington State Treasurer* Local Government Investment Pool 25,838,221.84 9,000,000.00 0.18%
27,344,404.10 23,586,868.82
AugustClark County Treasurer* Local Government Investment Pool 4,226.53 135,067.15 0.58%Muni City of Richland, WA 8/4/2015 995,000.00 3.00%FFCB U.S. Agency 8/24/2015 5,000,000.00 0.75%FHLB U.S. Agency 8/17/2015 5,000,000.00 0.42%FHLB U.S. Agency 8/17/2015 5,000,000.00 0.42%FHLM U.S. Agency 8/13/2015 3,000,000.00 1.00%Washington State Treasurer* Local Government Investment Pool 9,338,947.43 27,000,000.00 0.18%
28,338,173.96 27,135,067.15
SeptemberClark County Treasurer* Local Government Investment Pool 4,224.22 5,208,286.89 0.58%MUNI City of Yakima 6/1/2015 110,000.00 3.00%FFCB U.S. Agency 9/3/2015 5,000,000.00 0.68%FHLM U.S. Agency 9/15/2015 5,000,000.00 0.63%FHLM U.S. Agency 9/28/2015 5,000,000.00 0.80%Washington State Treasurer* Local Government Investment Pool 19,697,998.45 19,000,000.00 0.18%
29,702,222.67 29,318,286.89 * Investments in the County and State Local Government Investment Pools can change daily, therefore no purchase dates are shownand the maturity dates are the last date for each reporting period.
City of Vancouver Third Quarter 2015 Financial Report 37
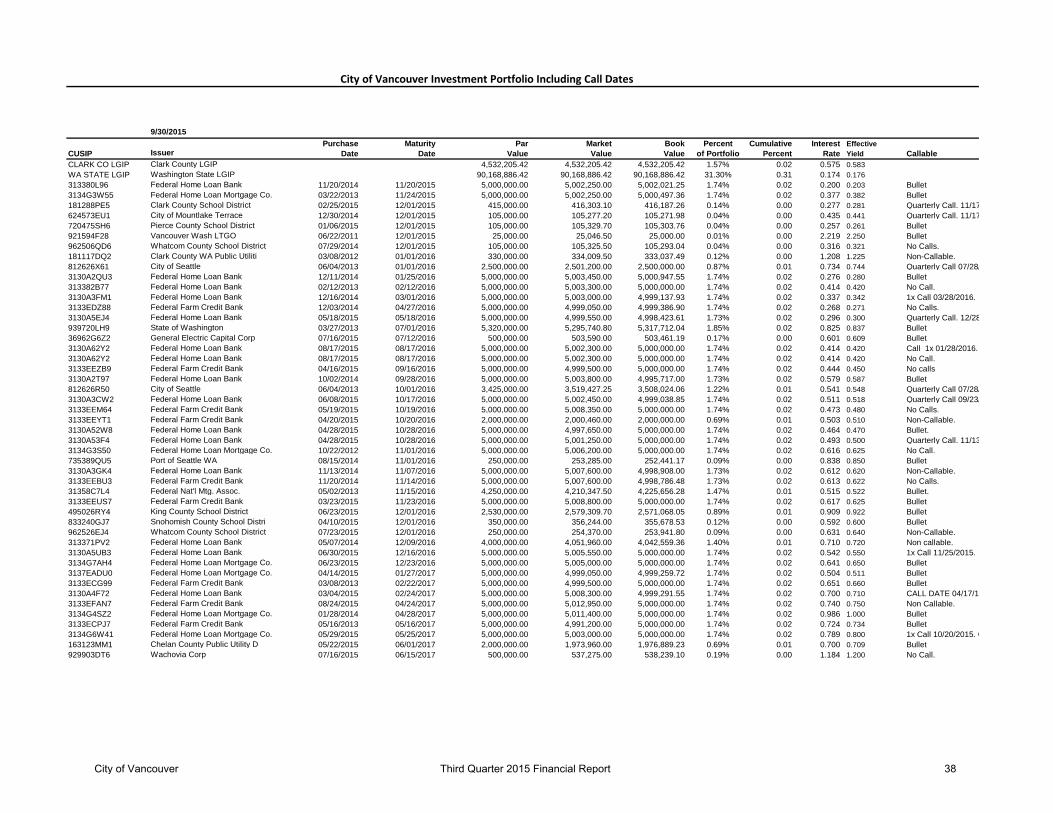
City of Vancouver Investment Portfolio Including Call Dates
9/30/2015Purchase Maturity Par Market Book Percent Cumulative Interest Effective
CUSIP Issuer Date Date Value Value Value of Portfolio Percent Rate Yield CallableCLARK CO LGIP Clark County LGIP 4,532,205.42 4,532,205.42 4,532,205.42 1.57% 0.02 0.575 0.583WA STATE LGIP Washington State LGIP 90,168,886.42 90,168,886.42 90,168,886.42 31.30% 0.31 0.174 0.176313380L96 Federal Home Loan Bank 11/20/2014 11/20/2015 5,000,000.00 5,002,250.00 5,002,021.25 1.74% 0.02 0.200 0.203 Bullet3134G3W55 Federal Home Loan Mortgage Co. 03/22/2013 11/24/2015 5,000,000.00 5,002,250.00 5,000,497.36 1.74% 0.02 0.377 0.382 Bullet181288PE5 Clark County School District 02/25/2015 12/01/2015 415,000.00 416,303.10 416,187.26 0.14% 0.00 0.277 0.281 Quarterly Call. 11/17624573EU1 City of Mountlake Terrace 12/30/2014 12/01/2015 105,000.00 105,277.20 105,271.98 0.04% 0.00 0.435 0.441 Quarterly Call. 11/17720475SH6 Pierce County School District 01/06/2015 12/01/2015 105,000.00 105,329.70 105,303.76 0.04% 0.00 0.257 0.261 Bullet921594F28 Vancouver Wash LTGO 06/22/2011 12/01/2015 25,000.00 25,046.50 25,000.00 0.01% 0.00 2.219 2.250 Bullet962506QD6 Whatcom County School District 07/29/2014 12/01/2015 105,000.00 105,325.50 105,293.04 0.04% 0.00 0.316 0.321 No Calls.181117DQ2 Clark County WA Public Utiliti 03/08/2012 01/01/2016 330,000.00 334,009.50 333,037.49 0.12% 0.00 1.208 1.225 Non-Callable.812626X61 City of Seattle 06/04/2013 01/01/2016 2,500,000.00 2,501,200.00 2,500,000.00 0.87% 0.01 0.734 0.744 Quarterly Call 07/28/3130A2QU3 Federal Home Loan Bank 12/11/2014 01/25/2016 5,000,000.00 5,003,450.00 5,000,947.55 1.74% 0.02 0.276 0.280 Bullet313382B77 Federal Home Loan Bank 02/12/2013 02/12/2016 5,000,000.00 5,003,300.00 5,000,000.00 1.74% 0.02 0.414 0.420 No Call.3130A3FM1 Federal Home Loan Bank 12/16/2014 03/01/2016 5,000,000.00 5,003,000.00 4,999,137.93 1.74% 0.02 0.337 0.342 1x Call 03/28/2016.3133EDZ88 Federal Farm Credit Bank 12/03/2014 04/27/2016 5,000,000.00 4,999,050.00 4,999,386.90 1.74% 0.02 0.268 0.271 No Calls.3130A5EJ4 Federal Home Loan Bank 05/18/2015 05/18/2016 5,000,000.00 4,999,550.00 4,998,423.61 1.73% 0.02 0.296 0.300 Quarterly Call. 12/28939720LH9 State of Washington 03/27/2013 07/01/2016 5,320,000.00 5,295,740.80 5,317,712.04 1.85% 0.02 0.825 0.837 Bullet36962G6Z2 General Electric Capital Corp 07/16/2015 07/12/2016 500,000.00 503,590.00 503,461.19 0.17% 0.00 0.601 0.609 Bullet3130A62Y2 Federal Home Loan Bank 08/17/2015 08/17/2016 5,000,000.00 5,002,300.00 5,000,000.00 1.74% 0.02 0.414 0.420 Call 1x 01/28/2016.3130A62Y2 Federal Home Loan Bank 08/17/2015 08/17/2016 5,000,000.00 5,002,300.00 5,000,000.00 1.74% 0.02 0.414 0.420 No Call.3133EEZB9 Federal Farm Credit Bank 04/16/2015 09/16/2016 5,000,000.00 4,999,500.00 5,000,000.00 1.74% 0.02 0.444 0.450 No calls3130A2T97 Federal Home Loan Bank 10/02/2014 09/28/2016 5,000,000.00 5,003,800.00 4,995,717.00 1.73% 0.02 0.579 0.587 Bullet812626R50 City of Seattle 06/04/2013 10/01/2016 3,425,000.00 3,519,427.25 3,508,024.06 1.22% 0.01 0.541 0.548 Quarterly Call 07/28/3130A3CW2 Federal Home Loan Bank 06/08/2015 10/17/2016 5,000,000.00 5,002,450.00 4,999,038.85 1.74% 0.02 0.511 0.518 Quarterly Call 09/23/3133EEM64 Federal Farm Credit Bank 05/19/2015 10/19/2016 5,000,000.00 5,008,350.00 5,000,000.00 1.74% 0.02 0.473 0.480 No Calls.3133EEYT1 Federal Farm Credit Bank 04/20/2015 10/20/2016 2,000,000.00 2,000,460.00 2,000,000.00 0.69% 0.01 0.503 0.510 Non-Callable.3130A52W8 Federal Home Loan Bank 04/28/2015 10/28/2016 5,000,000.00 4,997,650.00 5,000,000.00 1.74% 0.02 0.464 0.470 Bullet.3130A53F4 Federal Home Loan Bank 04/28/2015 10/28/2016 5,000,000.00 5,001,250.00 5,000,000.00 1.74% 0.02 0.493 0.500 Quarterly Call. 11/133134G3S50 Federal Home Loan Mortgage Co. 10/22/2012 11/01/2016 5,000,000.00 5,006,200.00 5,000,000.00 1.74% 0.02 0.616 0.625 No Call.735389QU5 Port of Seattle WA 08/15/2014 11/01/2016 250,000.00 253,285.00 252,441.17 0.09% 0.00 0.838 0.850 Bullet3130A3GK4 Federal Home Loan Bank 11/13/2014 11/07/2016 5,000,000.00 5,007,600.00 4,998,908.00 1.73% 0.02 0.612 0.620 Non-Callable.3133EEBU3 Federal Farm Credit Bank 11/20/2014 11/14/2016 5,000,000.00 5,007,600.00 4,998,786.48 1.73% 0.02 0.613 0.622 No Calls.31358C7L4 Federal Nat'l Mtg. Assoc. 05/02/2013 11/15/2016 4,250,000.00 4,210,347.50 4,225,656.28 1.47% 0.01 0.515 0.522 Bullet.3133EEUS7 Federal Farm Credit Bank 03/23/2015 11/23/2016 5,000,000.00 5,008,800.00 5,000,000.00 1.74% 0.02 0.617 0.625 Bullet495026RY4 King County School District 06/23/2015 12/01/2016 2,530,000.00 2,579,309.70 2,571,068.05 0.89% 0.01 0.909 0.922 Bullet833240GJ7 Snohomish County School Distri 04/10/2015 12/01/2016 350,000.00 356,244.00 355,678.53 0.12% 0.00 0.592 0.600 Bullet962526EJ4 Whatcom County School District 07/23/2015 12/01/2016 250,000.00 254,370.00 253,941.80 0.09% 0.00 0.631 0.640 Non-Callable.313371PV2 Federal Home Loan Bank 05/07/2014 12/09/2016 4,000,000.00 4,051,960.00 4,042,559.36 1.40% 0.01 0.710 0.720 Non callable.3130A5UB3 Federal Home Loan Bank 06/30/2015 12/16/2016 5,000,000.00 5,005,550.00 5,000,000.00 1.74% 0.02 0.542 0.550 1x Call 11/25/2015.3134G7AH4 Federal Home Loan Mortgage Co. 06/23/2015 12/23/2016 5,000,000.00 5,005,000.00 5,000,000.00 1.74% 0.02 0.641 0.650 Bullet3137EADU0 Federal Home Loan Mortgage Co. 04/14/2015 01/27/2017 5,000,000.00 4,999,050.00 4,999,259.72 1.74% 0.02 0.504 0.511 Bullet3133ECG99 Federal Farm Credit Bank 03/08/2013 02/22/2017 5,000,000.00 4,999,500.00 5,000,000.00 1.74% 0.02 0.651 0.660 Bullet3130A4F72 Federal Home Loan Bank 03/04/2015 02/24/2017 5,000,000.00 5,008,300.00 4,999,291.55 1.74% 0.02 0.700 0.710 CALL DATE 04/17/133133EFAN7 Federal Farm Credit Bank 08/24/2015 04/24/2017 5,000,000.00 5,012,950.00 5,000,000.00 1.74% 0.02 0.740 0.750 Non Callable.3134G4SZ2 Federal Home Loan Mortgage Co. 01/28/2014 04/28/2017 5,000,000.00 5,011,400.00 5,000,000.00 1.74% 0.02 0.986 1.000 Bullet3133ECPJ7 Federal Farm Credit Bank 05/16/2013 05/16/2017 5,000,000.00 4,991,200.00 5,000,000.00 1.74% 0.02 0.724 0.734 Bullet3134G6W41 Federal Home Loan Mortgage Co. 05/29/2015 05/25/2017 5,000,000.00 5,003,000.00 5,000,000.00 1.74% 0.02 0.789 0.800 1x Call 10/20/2015. C 163123MM1 Chelan County Public Utility D 05/22/2015 06/01/2017 2,000,000.00 1,973,960.00 1,976,889.23 0.69% 0.01 0.700 0.709 Bullet929903DT6 Wachovia Corp 07/16/2015 06/15/2017 500,000.00 537,275.00 538,239.10 0.19% 0.00 1.184 1.200 No Call.
City of Vancouver Third Quarter 2015 Financial Report 38