Embed Size (px)
Citation preview

QUARTERLY
ECONOMIC
REVIEW
JUNE 2017
RESERVE BANK OF ZIMBABWE

2
CONTENTS
1. OVERVIEW ....................................................................................................... 5
2. INTERNATIONAL ECONOMIC DEVELOPMENTS ................................ 6
INTERNATIONAL COMMODITY PRICE DEVELOPMENTS ............... 7
MERCHANDISE TRADE DEVELOPMENTS ............................................. 8
3. DOMESTIC ECONOMIC DEVELOPMENTS ............................................. 9
REAL SECTOR DEVELOPMENTS .............................................................. 9
AGRICULTURE .............................................................................................10
MINING ...........................................................................................................13
INFLATION DEVELOPMENTS ..................................................................18
4. MONETARY DEVELOPMENTS, INTEREST RATES AND FINANCIAL
MARKETS .......................................................................................................20
5. STOCK MARKET DEVELOPMENTS ........................................................21
6. PAYMENT, CLEARING AND SETTLEMENT ACTIVITIES ................22
7. FISCAL DEVELOPMENTS ..........................................................................26
3
List of Figures
Figure 1: Brent Crude Oil Prices US$/Barrel: January to June 2017 ............................................. 7
Figure 2: Base Metal Prices (US$/tonne) : January 2016 to June 2017 ......................................... 8
Figure 3: Precious Minerals Prices: January to June 2017 ............................................................. 8
Figure 4: Second Quarter 2017 Merchandise Trade Developments (US$ millions) ...................... 9
Figure 5: Real GDP Growth (%): 2009-2016 and 2017 Projection ................................................ 9
Figure 6: Quarterly Milk Output (million litres) in Jan –June 2016 and 2017 ............................. 13
Figure 7: Gold deliveries to FPR: Q2 2016 vs Q2 2017 ............................................................... 14
Figure 8: Developments in Average International Platinum Prices: Q2 2016-2017 .................... 14
Figure 9: ZCDC Performance in Q2 2016 and 2017 .................................................................... 15
Figure 10: Chrome ore Exports and Average Prices realized ....................................................... 15
Figure 11: HCF (tonnes) Exports & Average international prices realised (US$/tonne) ............. 16
Figure 12: Energy Produced and Sent Out (GWh): 2016 – 2017 ................................................. 18
Figure 13: Annual Inflation Profile (%)........................................................................................ 18
Figure 14: Quarterly Annualized Inflation Profile 2017 ............................................................... 19
Figure 15: Annual Broad Money Supply Growth Rates and Levels ............................................ 20
Figure 16: Sectoral Distribution of Credit .................................................................................... 20
Figure 17: Market Capitalization .................................................................................................. 21
Figure 18: Zimbabwe Stock Exchange Indices ............................................................................ 21
Figure 19: Market Turnover Value ............................................................................................... 22
Figure 20 : RTGS Values and Volumes ....................................................................................... 23
Figure 21: SWIFT Cross Border Transactions ............................................................................. 24
Figure 22: Over the Counter Cash Withdrawals ........................................................................... 24
Figure 23: Values of Retail Transactions...................................................................................... 24
Figure 24 : Volumes of Retail Transactions ................................................................................. 25
Figure 25: Total Collateral ............................................................................................................ 25
Figure 26: Quarterly Revenue Head Performance in Q2: 2016 vs 2017 & Q2 2017 Target ........ 26
Figure 27: Contribution of Revenue Heads to Total Revenue in Q2 2017 ................................... 27
Figure 28: Expenditure Head Performance Jan-May: 2016 vs 2017 ............................................ 27
4
List of Tables
Table 1: Global Economic Growth & Outlook (%) ........................................................................ 6
Table 2: International Commodity Prices ....................................................................................... 7
Table 3: Area planted to selected key crops (Ha) ......................................................................... 10
Table 4: Cumulative First Half Tobacco Sales: 2016 and 2017 Tobacco Selling Season ............ 11
Table 5: Cattle slaughtered in the formal sector ........................................................................... 12
Table 6: Quarterly Pig Slaughters in 2016 ................................................................................... 12
Table 7: Quarterly Mining Production Statistics .......................................................................... 13
Table 8: Volume of Manufacturing Indices .................................................................................. 16
Table 9: Electricity output (GWh)- 2017 Q2 ................................................................................ 17
Table 10: Regional Annual Inflation Trends ................................................................................ 19
Table 11: Consolidated Transactional Activities .......................................................................... 23
Table 12: Payment Systems Access Points and Devices .............................................................. 26

1. OVERVIEW
The International Monetary Fund in July 2017 still
projected the global economy to grow by 3.5% in
2017, up from 3.1% in 2016, despite higher than
anticipated growth in the first quarter of 2017.
Global growth is, however, expected to strengthen
to 3.6% in 2018.
The domestic economy is projected to register a
positive growth of 3.7% in 2017, underpinned by
strong performance in the agriculture and mining
sectors. The economy is also responding
positively to Government related interventions to
increase domestic production and exports. As a
result some companies in the food processing and
packaging sub-sectors are operating at above 70%
of capacity and exports have risen by 14% since
the introduction of the export incentive scheme.
Resultantly, during the second quarter of 2017,
merchandise exports increased by 22.5% to
US$611.6 million, from US$499.2 million
realized in the same period in 2016. Compared to
the first quarter of 2017, exports were, however,
lower by 15.4% in the second quarter of 2017,
largely on account of declines in tobacco and
diamond exports.
Total merchandise imports for the second quarter
of 2017 amounted to US$1,366.5 million,
representing a 14.4% increase from US$1,194.4
million realized over the comparative quarter in
2016. Merchandise imports for the second quarter
of 2017 were also 7.5% higher compared to the
first quarter.
1 Under the multiple currency system, broad money is
defined as total bank deposits less interbank deposits and
also includes Bond notes and coins issued.
Broad money supply1 recorded an increase of
10.40% in the second quarter of 2017, from
US$5 879.93 million in March 2017 to US$6
491.67 million. This compares to a growth of
4.39% recorded in the second quarter of 2016.
During the quarter ended 30th June 2017, the
Zimbabwe Stock Exchange (ZSE) recovered from
the previous quarter loss. Trading activity was
largely dominated by wealth preserving counters,
such as British American Tobacco Zimbabwe
(B.A.T.), CBZ Holdings Limited, Delta
Corporation and Econet Wireless Zimbabwe.
In line with the trading activity on the ZSE during
the quarter under review, the industrial index
surged by 41.03%, from 138.96 points as at 31st
March, to 195.97 points at the end of the second
quarter of 2017, while the mining index grew by
19.18% to close at 69.79 points. As a result, the
local bourse capitalization increased by US$1.82
billion or 47.11%, from US$3.90 billion in the
previous quarter to US$5.70 billion on 30th June
2017.
Reflecting increased use of plastic money, the
value of transactions processed through the
National Payment Systems in the second quarter
ending 30th June 2017 increased by 21% to
US$21.69 billion from US$17.91 billion recorded
in the previous quarter ending 31st March 2017. In
tandem, the volumes increased by 52% to 203.7
million from 133.8 million during the same
period.

6
2. INTERNATIONAL ECONOMIC
DEVELOPMENTS
The global economy is projected to continue
strengthening in 2017, as the growth outturn
realised in the first quarter was higher than the
earlier projections released in April. The IMF has,
however, maintained the global growth projection
at the same level as the April projection of 3.5%
in 2017, compared to 3.1% in 2016.
Economic activity in both advanced economies
and emerging and developing economies is
projected to accelerate to 2% and 4.6%,
respectively, in 2017. Continued recovery in
global economic activity is largely attributed to
the sustained rebound in Europe, where political
risk has diminished as well as strengthening of
growth in Mexico, Brazil, Japan and China,
among others. The Chinese and Japanese growth
projections have been revised upwards mainly on
account of strong growth momentum realised in
the last quarter of 2016 and the first quarter of
2017. The Chinese and Japanese economies are
now projected to grow by 6.7% and 1.3%,
representing, a 0.1 percentage point difference
from the April projections.
The U.S. growth projections for 2017, however,
have been revised downwards from 2.3% to 2.1%
on account of weak growth outturn in the first
quarter of the year and due to the assumption that
fiscal policy will be less expansionary going
forward than previously anticipated.
In Sub-Saharan Africa, the outlook remains
challenging. Although economic growth is still
positive, it remains relatively low compared to the
previous years. The increase in growth from 1.3%
in 2016, to 2.7% in 2017, is attributed to improved
agricultural output due to good rains in some
countries. The outlook for the region may,
however, be weighed down by political
uncertainty and weak consumer and business
confidence in South Africa and low international
commodity prices.
Table 1 shows global economic growth
developments for selected regions and countries.
Table 1: Global Economic Growth & Outlook (%)
Actuals Projections
2015 2016 2017 2018
World
Output
3.2 3.1 3.5 3.6
Advanced
Economies
2.1 1.7 2.0 1.9
US 2.6 1.6 2.1 2.1
Eurozone
2.0
1.8
1.9
1.7
Japan 0.5 1.0 1.3 0.6
Emerging
Market &
Developing
Economies
4.0 4.3 4.6 4.8
China 6.9 6.7 6.7 6.4
India 7.6 7.1 7.2 7.7
Sub-
Saharan
Africa
3.4 1.3 2.7 3.5
Latin
America &
Caribbean
0.0 -1.0 1.1 2.0
Source: IMF World Economic Outlook Update (April
2017 and July Update).

7
INTERNATIONAL COMMODITY PRICE
DEVELOPMENTS
International commodity prices for platinum, base
metals and crude oil softened in the second quarter
of 2017, with notable quarterly losses recorded in
nickel and crude oil prices. Gold prices, however,
firmed during the period under review as shown
in Table 2.
Table 2: International Commodity Prices
Gold Platinum Copper Nickel Brent
crude oil
us$/oz us$/oz us$/ton us$/tonn us$/bar
2017 Q1
Average 1,220.8 980.83 5,824.86 10,291.72 54.92
Apr-17 1,265.8 961.68 5,710.32 9,688.53 53.66
May-17 1,245.9 930.10 5,595.92 9,176.19 51.12
Jun-17 1,260.5 931.48 5,679.57 8,889.32 47.60
2017 Q2
Average 1,257.4 941.08 5,661.94 9,251.35 50.79
%
Change
(2017Q1-Q2)
3.0 -4.1 -2.8 -10.1 -7.5
Source: Bloomberg, BBC, Kitco 2017
Brent Crude Oil
During the second quarter, brent crude oil prices
were subdued on renewed fears of a global glut
amid high global inventories, particularly in the
US, as shale oil production continued to offset
OPEC’s efforts to curb global supplies. In
addition, investors’ doubts about OPEC's ability
to implement agreed production cuts weighed
down on oil prices during the period under review.
Against this backdrop, brent crude oil slumped by
7.5% to US$50.79/barrel in the second quarter of
2017.
Figure 1 shows the monthly evolution of crude oil
prices for the period January to June 2017.
Figure 1: Brent Crude Oil Prices US$/Barrel:
January to June 2017
Source: Bloomberg, 2017
Base Metals
Base metals prices eased during the second
quarter underpinned by slowing housing prices,
soft data on imports and demand growth in China.
These developments dampened base metals
demand prospects in the Asian giant economy
which is the world’s largest base metals
consumer. In particular, nickel prices have been
on an overall downward trend since Indonesia
relaxed its export ban on ores. Resultantly, copper
and nickel prices retreated by 2.8% and 10.1% to
US$5,661.94/tonne and US$9,251.35/tonne,
respectively, as shown in Figure 2.
0.00
10.00
20.00
30.00
40.00
50.00
60.00
JAN
UA
RY
FE
BR
UA
RY
MA
RC
H
AP
RIL
MA
Y
JUN
E

8
Figure 2: Base Metal Prices (US$/tonne) : January
2016 to June 2017
Source: Bloomberg, 2017
Gold prices were firmer during the second quarter
mainly on account of a weak U.S. dollar amid
rising uncertainties over US relations with Russia
and North Korea. This development boosted
investment demand for gold, leading to a 3.0%
increase in prices from a quarterly average of
US$1,220.83/oz to US$1,257.44/oz in the second
quarter.
On the other hand, platinum prices declined by
4.1% from US$980.83/oz in the previous quarter
to US$941.08/oz on weak industrial demand from
the automobile industry. Figure 3 shows
developments in gold and platinum prices.
Figure 3: Precious Minerals Prices: January to
June 2017
Source: Bloomberg, 2017
MERCHANDISE TRADE
DEVELOPMENTS
Total merchandise trade during the second quarter
of 2017 stood at US$1,978.1 million, representing
16.8% increase from US$1,693.6 million
recorded in the corresponding quarter in 2016. On
a quarter on quarter basis, total merchandise trade,
however, eased by 0.8%, from US$1,993.3
million in the first quarter to US$1,978.1 million
in the second quarter of 2017.
Over the period April to June 2017, merchandise
exports increased by 22.5%, from US$499.2
million realized in 2016 to US$611.6 million in
2017. Compared to the first quarter of 2017,
exports declined by 15.4% in the second quarter
of 2017, largely on account of declines in tobacco
and diamonds exports.
Total merchandise imports for the second quarter
of 2017 amounted to US$1,366.5 million,
representing a 14.4% increase from US$1,194.4
0
2000
4000
6000
8000
10000
12000
0
1000
2000
3000
4000
5000
6000
7000
Copper Nickel (RHS)
0
200
400
600
800
1,000
1,200
1,400
Gold Platinum

9
million realized over the comparative quarter in
2016. Merchandise imports for the second quarter
of 2017 were also, 7.5% higher compared to the
first quarter of 2017. The increases were driven by
marked increases in the importation of
telecommunications base stations, aviation fuel,
medicines and machinery. Electricity and food
(maize, rice and wheat) imports in the second
quarter were, however, lower than in the
preceding period.
Figure 4: Second Quarter 2017 Merchandise Trade
Developments (US$ millions)
Source: ZIMSTAT, 2017
Gold, nickel ores & concentrates, ferrochrome,
flue-cured tobacco, chrome ores & concentrates,
cane sugar, diamonds and platinum dominated the
country’s exports, contributing about 80% of
export earnings for the period April to June 2017.
Major Merchandise Export Destinations
The country’s exports for the second quarter of
2017 were mainly destined for South Africa,
Mozambique, United Arab Emirates, Zambia,
Kenya and Belgium. Notably, South Africa
continue to dominate the country’s export markets
absorbing about 70.6% of the country’s total
merchandise exports during the second quarter of
2017, followed by Mozambique, at 12.1%. The
country’s major exports to South Africa includes
platinum group of metals (PGMs), gold and
nickel, among others. Exports to the other
destinations in the world constituted about 1% of
the total exports in the second quarter of 2017.
3. DOMESTIC ECONOMIC
DEVELOPMENTS
REAL SECTOR DEVELOPMENTS
The economy is projected to register a positive
real growth of 3.7% in 2017, largely driven by
strong performance in the agriculture and mining
sectors. The manufacturing sector is also expected
to register some positive performance in 2017, on
the back of increased capacity utilization by some
sub-sectors benefitting from the import
substitution interventions.
Figure 5 shows developments in real GDP for the
period 2009 to 2017.
Figure 5: Real GDP Growth (%): 2009-2016 and
2017 Projection
Source: Zimstat, MoFED and RBZ 2017
499
1194
612
1367
0
400
800
1200
1600
Exports Imports
US$
2016 2017
5.4
15.416.3
13.6
5.3
2.81.4
0.7
3.7
0.0
2.0
4.0
6.0
8.0
10.0
12.0
14.0
16.0
18.0
2009 2010 2011 2012 2013 2014 2015 2016 2017

10
The economy is expected to benefit from
investments in various infrastructural projects
already being implemented in power, irrigation,
rail and road transport and housing, in the short to
medium term.
AGRICULTURE
The agriculture sector is expected to benefit from
the promulgation of Statutory Instrument 79 of
2017, which is aimed to strengthen the Command
Agriculture Scheme legislative framework. The
Statutory Instrument seeks to reduce credit
default, improve deliveries and enforce discipline
among beneficiaries of the Command Agriculture
Program. If fully implemented, the legislation will
ensure the sustainability of the Command
Agriculture Program and improve farmer’s loan
repayment perceptions, particularly for small
scale farmers.
Table 3 shows the area under various crops in the
two comparable seasons.
Table 3: Area planted to selected key crops (Ha)
Crop 2015/16 2016/17 Change (%)
Maize 511 816 2 155 526 321
Sorghum 36 305 182 012 401
Pearl Millet 22 539 82 663 267
Finger Millet 17 613 24 107 37
Irish Potato 438 354 476 088 9
Groundnut 73 709 139 503 89
Sweet Potato 203 697 513 070 152
Sugar Beans 12 742 15 356 21
Cowpeas 14 026 35 895 156
Cucurbits 33 700 69 487 106
Cotton 32 885 126 995 286
Soya bean 47 832 35 744 -25
Source: Ministry of Agriculture, 2017
Tobacco
The projected output for tobacco in 2017 has been
revised downwards, from the initial 215 million
kilograms to around 190 million kilograms, due to
the excessive rains received during the season that
adversely affected the crop quality and quantity.
The situation was further exacerbated by the
following challenges:
• Shortage of curing fuel (coal and
firewood);
• Poor curing, grading and storage facilities
especially for small scale farmers; and
• Labour shortages, particularly during the
harvesting period.

11
Cumulative tobacco sales, as at 30th June 2017
amounted to 170.4 million kilograms, which was
2.3% lower than the cumulative total of 174 501
593 kilograms sold during the same period in
2016. The value of tobacco sold was worth
US$501.6 million as at the end of the second
quarter of 2017, compared to US$512.5 million
during the same period in 2016. Table 4 shows the
tobacco sales outturn as at 30th June 2017.
Table 4: Cumulative First Half Tobacco Sales:
2016 and 2017 Tobacco Selling Season
2016 2017
Variance
(%)
Total Quantity Sold
(million Kgs)
174.50 170.44 -2.33
Total Value (US$
million)
512.53 501.59 -2.14
Average Price
(US$)/Kg
294 294 0
Source: TIMB, 2017
Maize
Maize output is estimated at 2.155 million tonnes
in 2017, compared to 0.511 million tonnes
produced in 2016. Maize deliveries to GMB
commenced in April 2017, with more than
100 000 tonnes of maize having been delivered as
at 30th June 2017, with larger volumes of maize
expected to be delivered in the third quarter of
2017. The high volumes of maize are expected to
reduce grain imports and save the country the
scarce foreign currency resources.
Maize production benefited from the good rainfall
season, as well as improved financing under
Command Agriculture, which enhanced access to
inputs and tillage, resulting in higher productivity
by beneficiary farmers.
Cotton
Cotton output, which was initially projected at
125 000 tonnes in 2017, was, however, revised
downwards to 75 000 tonnes, due to challenges
related to excessive rains and the resultant
diseases and pest prevalence during the growing
season. Seed cotton sales as at 30th June 2017
stood at 20.35 million kilograms, compared to
0.25 million kilograms during the same period in
2016. About 70% of the cotton intake so far this
year
was recorded from the traditional cotton
producing areas of Gokwe North and South as
well as Mbire districts.
Wheat
The total area planted under wheat in 2017
increased to 42 731 hectares, compared to 14 220
hectares in 2016, largely due to improved
financing for the crop under the current Command
Agriculture initiative, which availed crop inputs
for about 30 731 hectares. The remainder of the
planted area of around 12 000 hectares was
contracted by private players and traditional
wheat producers. Wheat output is projected to
surpass 170 000 tonnes in 2017, up from the
61 715 tonnes produced in 2016.
Livestock
According to the Ministry of Agriculture,
Mechanization and Irrigation Development, the
condition of livestock has improved considerably
compared to the previous season on account of
improved grazing and water availability. There is,
however, a slight decline in livestock population
in 2017 owing to forced offtake in the previous
season due to drought. There was, therefore, a
general decline in slaughtering across all livestock
classes in the first half of 2017, as farmers are
restocking.

12
Cattle
Cattle population decreased marginally by 0.69%
from 5.53 million head in 2016 to 5.49 million
head in 2017, due to the impact of two consecutive
drought seasons. The average calving rate has also
declined from 46% to 45% during the same
period, which could have a negative impact on
herd rebuilding. Diseases such as lumpy skin and
foot-rot, which are associated with heavy rains,
also affected cattle production in the first half of
the year.
Resultantly, a total of 67 813 cattle were
slaughtered in the formal sector during the second
quarter of 2017, compared to 71 518 cattle that
were slaughtered during the same period in 2016.
Table 5 shows the total number of cattle
slaughtered in the first and fourth quarters of 2016
and the first quarter of 2017.
Table 5: Cattle slaughtered in the formal sector
Cattle 2016 2017 %
Change
Q1 67 331 60 768 -9.7
Q2 71 518 67 813 -5.2
Total 138 849 128 581 -7.4
Source: Ministry of Agriculture and Irrigation
Development
The bulk of the slaughters were done at private
abattoirs, with about 7.1% of the slaughters done
by the state owned Cold Storage Company, a trend
that has persisted since opening up of the meat
processing industry.
Pigs
During the second quarter of 2017, pig slaughters
declined by 4.9% to 39 826, from 41 874
slaughters during the same period last year, owing
to retentions of parent stock by farmers.
Table 6 shows pig slaughters for the first two
quarters of 2017 compared to same period in
2016.
Table 6: Quarterly Pig Slaughters in 2016
Pigs 2016 2017 %
Change
Q1 41137 38002 -7.6
Q2 41874 39826 -4.9
Total 83011 77828 -6.2
Source: Ministry of Agriculture, 2017
Poultry
Poultry growth prospects which had improved on
account of increased availability of stock feeds,
following higher grain output during the season,
have, however, dampened. This is, in large part,
attributable to an outbreak of the highly
contagious and pathogenic avian flu, which
affected some countries in the SADC region since
June 2017, including South Africa, DRC and
Zimbabwe.
The flu outbreak has affected one of the main
chicken breeding farms in the country leading to
massive culling of part of the concern’s breeding
stock and table egg production unit. The outbreak
has already resulted in restricted movement of
poultry products across borders in the region,
exacerbating the shortage of day old chicks as
imports of fertilised eggs from South Africa were
banned. Further, alternative sources of hatching

13
eggs from outside the SADC region attract a 40%
import duty. These developments could result in
low meat and egg output as the year progresses,
which is likely to cause an increase in the price of
affected products.
Dairy
A total of 14.48 million litres of milk was
produced in the second quarter of 2017, which
was, however, 7.1% less than the 15.59 million
litres produced in the previous quarter. The lower
output levels were attributed to the heavy rains
received in 2016/17 rain season, which adversely
affected animal health and milk production.
Consequently, milk production for the first half of
2017 was 1.91% lower than the 31.80 million
litres produced during the same period in 2016, as
shown in Figure 6.
Figure 6: Quarterly Milk Output (million litres) in
Jan –June 2016 and 2017
Source: Dairy Services, 2017
MINING
Most of the key minerals registered positive
performance in the second quarter of 2017,
compared to the same period in 2016, pointing to
the high possibility of achieving more than the
projected growth rate of 5.1% for the sector in
2017. Table 7 shows annual production statistics
for selected minerals in 2016 and projections for
2017.
Table 7: Quarterly Mining Production Statistics
Q2
2016
Q2 2017 Jan-
June
2016
Jan-Jun
2017
Gold (kg) 5,255 5,784 10,360 10,828
Chrome
(tonnes)
82,269 330,057 215,922 684,137
Coal
(tonnes)
529,809 909,124 1,284,128 1,303,199
Nickel
(tonnes)
4,227 4,551 9,101 8,560
Platinum
(kg)
3,647 3,693 7,968 7,244
Palladium
(kg)
2,940 3,047 6,403 5,996
Diamonds
(Carats)
480,876 820,752 1,084,826 1,388,037
Source: MOFED, RBZ, Ministry of Mines, Chamber of
Mines, 2017
Gold
Gold output stood at 5 784 kg in second quarter of
2017, up 10% from 5 255 kg produced during the
same period in 2016, largely driven by small scale
producers, whose output recorded a 31% increase
compared to the previous period. Although large
scale producers contributed 49% of Q2 output,
their actual output was 5% lower than in the same
period 2016. Small scale and artisanal miners
output contributed 44% of total production during
Q2, 2017.
Cumulatively, gold output for the first half of
2017 was 10 828 kg, 4.5% more than the 10 360
kg produced in the comparable period in 2016.
Interventions by the Central Bank, through a
US$40 million Gold Support Facility are expected
0
1
2
3
4
5
6
Jan Feb Mar Apr May Jun
2016 2017

14
to boost deliveries from small scale gold miners,
particularly in the last half of the year. Figure 7
compares gold deliveries in the second quarter of
2016 and 2017.
Figure 7: Gold deliveries to FPR: Q2 2016 vs
Q2 2017
Source: FPR, 2017
Platinum
Platinum output, at 3 693 kg in Q2 2017, was
1.2% more than production realized in the
comparable period of 2016, benefiting largely
from production ramp up at Zimplats’ open pit
and Bimha redevelopment, as other players
remained at 100% capacity utilization levels.
Platinum production, however, continues to be
hamstrung by subdued international platinum
prices, which declined to about US$941 per ounce
in Q2 2017, from US$1,005 per ounce in the
comparable period in 2016, as shown in Figure 8.
Figure 8: Developments in Average
International Platinum Prices: Q2 2016-2017
Source: Chamber of Mines of Zimbabwe
Cumulative platinum output stood at 7,244 kg, 9%
lower than 7,968 kg produced during the same
period in 2016.
Diamond
A total of 820 752 diamond carats were produced
in the second quarter of 2017, compared to 480
876 carats in the comparable period of 2016,
largely benefitting from increased activity by the
producers. Zimbabwe Consolidated Diamond
Company (ZCDC) increased output by 87.3%
while Murowa registered a 24.6% increase
compared to the same period of last year.
Diamond production benefited from the
resolution of legal wrangles and the concomitant
resumption of operations on new concessions at
Chiadzwa diamond fields. Production was further
enhanced by the capitalization of ZCDC by
Government.
Large
Scale
Small
ScaleTotal
Q2 2016 5645.99 3981.69 9627.68
Q2 2017 5374.30 4626.30 10000.60
0.00
1000.00
2000.00
3000.00
4000.00
5000.00
6000.00
7000.00
8000.00
9000.00
10000.00
11000.00
kg
1005 980.55 940.61
0
200
400
600
800
1000
1200
0
500
1000
1500
2000
2500
3000
3500
4000
Q2 2016 Q1 2017 Q2 2017
Platinum (Kg) Average Price (US$/Ounce)

15
Figure 9: ZCDC Performance in Q2 2016 and 2017
Source: Ministry of Mines, ZCDC, 2017
Cumulative diamond output, at 1 388 082 carats
for the period January to June 2017, was 28%
more than in the comparable period in 2016. The
huge increase points to the high possibility of
surpassing the projected output of 1.9 million in
2017.
Nickel
Nickel output stood at 4,551 tonnes in the period
under review, 8% more than the 4,227 tonnes
realized in the comparable period of 2016. Nickel
production benefitted from increased activities in
the PGMs sector, as well as the ramp up in
primary production following the completion of
scheduled maintenance of plant & equipment.
Coal
Coal output stood at 909 124 tonnes in the second
quarter of 2017, compared to 529 809 tonnes
realized during the same period in 2016. The
improved recovery in coal performance in the
second quarter of 2017 was spurred by the
implementation of turnaround strategies at
Hwange Colliery and Zambezi Gas as well as the
recovery in coal prices. The anticipated
resumption of underground mining at Hwange
Colliery operations in the third quarter of 2017 is
expected to increase output level in 2017. Coal
offtake, however, remains constrained by the low
economic activities amid company closures,
mainly in the manufacturing industries.
Chrome Ore
Of the chrome ore mined during the period under
review, 118 797 tonnes was exported in raw form
at an average price of US$162.21 per tonne, whilst
78 428 tonnes was exported as a beneficiated
product, high carbon Ferrochrome (HCF), at an
average price of US$1 088.22 per tonne. This
compares favorably with the same period in 2016
in which 35 289 tonnes was exported as raw at an
average price of US$74.30 per tonne and 32 788
tonnes of HCF at an average price of US$671.65
per tonne, as shown in Figure 10 and 11.
Figure 10: Chrome ore Exports and Average Prices
realized
Source: COMZ & MMCZ, 2017
224,000
98,000
52,000
196,090 227,405 238,547
-
100,000
200,000
300,000
April May JuneYr. 2016 Yr. 2017
-
50.00
100.00
150.00
200.00
250.00
-
20,000
40,000
60,000
80,000
100,000
120,000
140,000
160,000
180,000
200,000
Q42015
Q12016
Q22016
Q32016
Q42016
Q12017
Q22017
Chrome ore Average Price (US$/tonne)
16
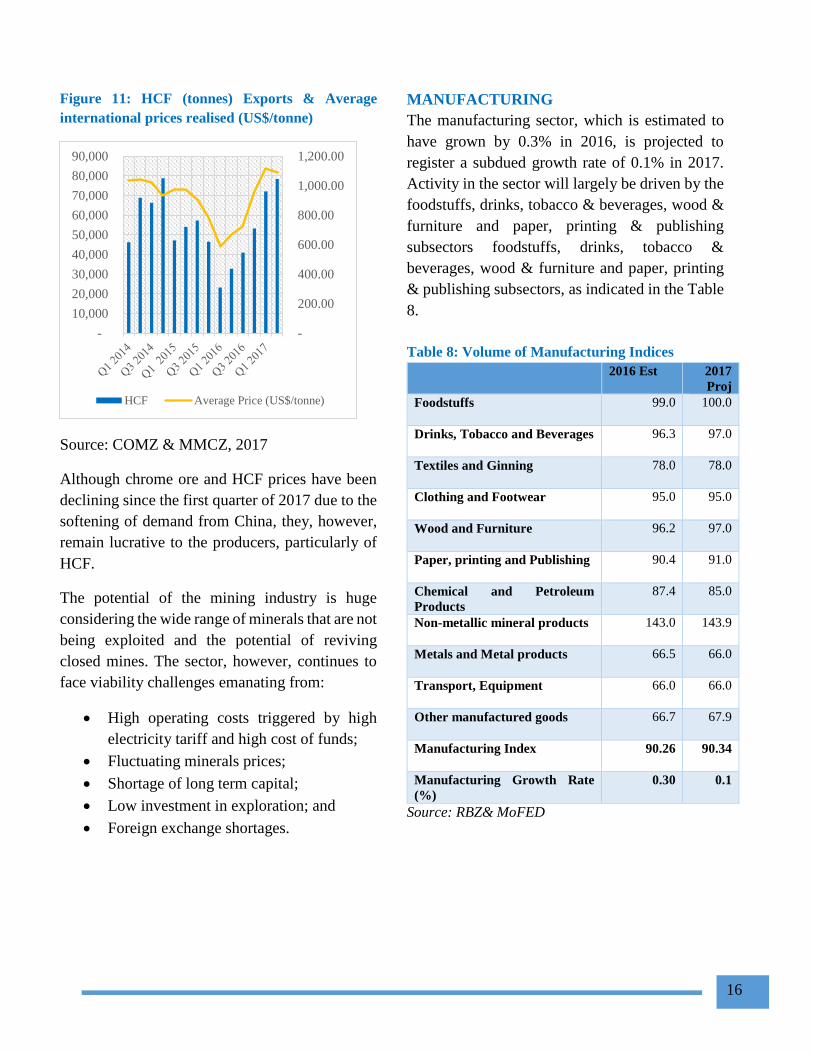
Figure 11: HCF (tonnes) Exports & Average
international prices realised (US$/tonne)
Source: COMZ & MMCZ, 2017
Although chrome ore and HCF prices have been
declining since the first quarter of 2017 due to the
softening of demand from China, they, however,
remain lucrative to the producers, particularly of
HCF.
The potential of the mining industry is huge
considering the wide range of minerals that are not
being exploited and the potential of reviving
closed mines. The sector, however, continues to
face viability challenges emanating from:
High operating costs triggered by high
electricity tariff and high cost of funds;
Fluctuating minerals prices;
Shortage of long term capital;
Low investment in exploration; and
Foreign exchange shortages.
MANUFACTURING
The manufacturing sector, which is estimated to
have grown by 0.3% in 2016, is projected to
register a subdued growth rate of 0.1% in 2017.
Activity in the sector will largely be driven by the
foodstuffs, drinks, tobacco & beverages, wood &
furniture and paper, printing & publishing
subsectors foodstuffs, drinks, tobacco &
beverages, wood & furniture and paper, printing
& publishing subsectors, as indicated in the Table
8.
Table 8: Volume of Manufacturing Indices
2016 Est 2017
Proj
Foodstuffs 99.0 100.0
Drinks, Tobacco and Beverages 96.3 97.0
Textiles and Ginning 78.0 78.0
Clothing and Footwear 95.0 95.0
Wood and Furniture 96.2 97.0
Paper, printing and Publishing 90.4 91.0
Chemical and Petroleum
Products
87.4 85.0
Non-metallic mineral products 143.0 143.9
Metals and Metal products 66.5 66.0
Transport, Equipment 66.0 66.0
Other manufactured goods 66.7 67.9
Manufacturing Index 90.26 90.34
Manufacturing Growth Rate
(%)
0.30 0.1
Source: RBZ& MoFED
-
200.00
400.00
600.00
800.00
1,000.00
1,200.00
-
10,000
20,000
30,000
40,000
50,000
60,000
70,000
80,000
90,000
HCF Average Price (US$/tonne)

17
Despite the challenging operating environment,
efforts by Government towards import
substitution and support for export development
continue to enhance manufacturing activities in
the economy. This was complemented by strong
agriculture performance during the 2016/17
agricultural season, which significantly reduced
the country’s import dependency on food, thereby
conserving the country’s foreign currency.
The prevailing operating environment for
manufacturers continues to be improved by
additional measures such as the National
Competitiveness Commission (NCC),
Government’s Rapid Results Project, the Local
Content Requirements Framework, as well as the
reviving of IDC industrial financing role. These
interventions are expected to enhance the local
manufacturers’ competitiveness and productivity.
During the period under review, some subsectors,
especially the dairy and beverages reported
positive volume outturn attributable to improved
consumer spending. This also followed a good
agricultural season and various initiatives by the
RBZ to promote growth in the economy. Further,
the sub-sectors also benefitted from investments
made by companies in 2016, including line
extensions, rationalisations, as well as the positive
impact of SI64 of 2016.
The commissioning of the Tokwe Mukorsi Dam
has secured water supply for sugar cane growers
in the Lowveld, and this will significantly
improve the production and supply of sugar to the
country and export market and also impact
positively on livelihoods in that region.
ELECTRICITY
Electricity generated by major power stations in
the second quarter of 2017 amounted to 3
536.3GWh, down 4.3% from the 3 639.1GWh
produced during the same period in 2016. The
slight decline in electricity generation to June
2017 compared to 2016 was due to reduced
throughput from Hwange thermal power station
which has been facing challenges of constant
breakdowns and coal supply shortfalls.
Challenges at Munyati, however, continue to
weigh down overall output.
Table 9 shows output from major power stations
and Independent Power Producers,(IPP),during in
the second quarter of 2017.
Table 9: Electricity output (GWh)- 2017 Q2
Station April May June
Kariba 295.1 350.1 310.0
Hwange 268.5 265.8 283.3
Bulawayo - 0.2 2.3
Munyati - - -
Harare 11.3 1.9 1.5
IIP 17.7 12.9 9.0
Total 592.6 630.9 605.9
Source: ZPC, ZERA 2017
Power generation, in 2017 benefited from
improved availability of water as dam levels rose
significantly at Kariba. Figure 12 compares the
electricity generation by month in 2016 and 2017.

18
Figure 12: Energy Produced and Sent Out (GWh):
2016 – 2017
Source: ZPC 2017
During the first half of the year, the Independent
Power Producers contributed about 136.00GWh
into the national grid, with Pungwe B hydro power
station accounting for about 42% of this output.
Electricity supply in the country is expected to
stabilise with the completion of the expansion of
the Kariba South Station. The first unit of the
installation is due for commissioning in December
2017, with the second unit to follow suit in March
2018. Upon completion, the Kariba South
expansion project is expected to add 300MW into
the national grid.
INFLATION DEVELOPMENTS
During the second quarter of 2017, annual
headline inflation rate accelerated to a peak of
0.75% in May 2017, before decelerating to 0.31%
in June 2017. Before that, inflation had
progressively accelerated from -0.7% in January
2017 to 0.21% in March 2017. Despite the dip in
June, the average annual inflation rate was higher
in the second quarter than in the first quarter of
2017.
Figure 13: Annual Inflation Profile (%)
Source: Zimstat, 2017
Annual Food Inflation
The year-on-year food inflation accelerated from
an average of 0.7% in the first quarter of 2017 to
an average of 1.7% in the second quarter. There
were significant price increases in the bread and
cereals category, reflecting rising wheat prices
and reduced global supplies of wheat, against high
demand for both wheat and rice. Meat prices also
increased due to a decrease in supply, as farmers
focus on restocking their herds.
Annual Non-Food Inflation
Although remaining in the negative, annual non-
food inflation also accelerated from an average of
-0.53% in the first quarter of 2017 to -0.03% in the
second quarter of 2017. Non-food inflation
continued to be driven by increases in the prices
of furniture, household equipment and
maintenance; education; miscellaneous goods and
Jan Feb Mar Apr May Jun Jul Aug Sept Oct Nov Dec
2016 691 543 571 573 608 568 609 661 596 592 536 536
2017 534 544 629 592 630 605
0.050.0
100.0150.0200.0250.0300.0350.0400.0450.0500.0550.0600.0650.0700.0750.0
Elec
tric
ity
Gen
erat
ed (
GW
h)
-5
-4
-3
-2
-1
0
1
2
Food Non-Food Headline

19
services and communication; as well as recreation
and culture.
Regional Inflation Developments
Zimbabwe’s annual inflation, at 0.3%, remains the
lowest in the SADC region, as shown in Table 10
below.
Table 10: Regional Annual Inflation Trends
2016 Dec 2017 Mar 2017 Jun
Zim -0.9 0.2 0.3
SA 6.8 6.1 5.1
Bot 3 3.5 3.5
Moz 25.3 20.9 18.1
Tan 5 6.4 5.4
Zam 7.5 6.7 6.8
Mal 20 15.8 11.3
USA 2.1 2.4 1.6
Source: ZIMSTAT, 2017
Inflation Outlook
Quarterly annualized inflation decelerated from
3.4% in March 2017 to -0.6% in June 2017. This
trend, if sustained, partly points to dampening of
inflationary pressures in the economy, in the short
to medium term.
Figure 14: Quarterly Annualized Inflation
Profile 2017
Source: RBZ January 2017
Inflation pressures will be dampened by the
positive supply impact of a good agricultural
season, as well as the recent decline in
international oil prices. The continued firming of
the South Africa rand against the United States
dollar, however, would have a counter-effect of
pushing up domestic prices in the short to medium
term. Overall, annual inflation is expected to
continue in low positive territory in the outlook
period, driven by both domestic and external
factors.
-4.0%
-3.0%
-2.0%
-1.0%
0.0%
1.0%
2.0%
3.0%
4.0%
Sep
-15
Oct
-15
Nov
-15
Dec
-15
Jan-1
6F
eb-1
6M
ar-1
6A
pr-
16
May
-16
Jun
-16
Jul-
16
Aug
-16
Sep
-16
Oct
-16
Nov
-16
Dec
-16
Jan-1
7F
eb-1
7M
ar-1
7
Apr-
17
May
-17
Jun
-17
20
4. MONETARY DEVELOPMENTS,
INTEREST RATES AND FINANCIAL
MARKETS
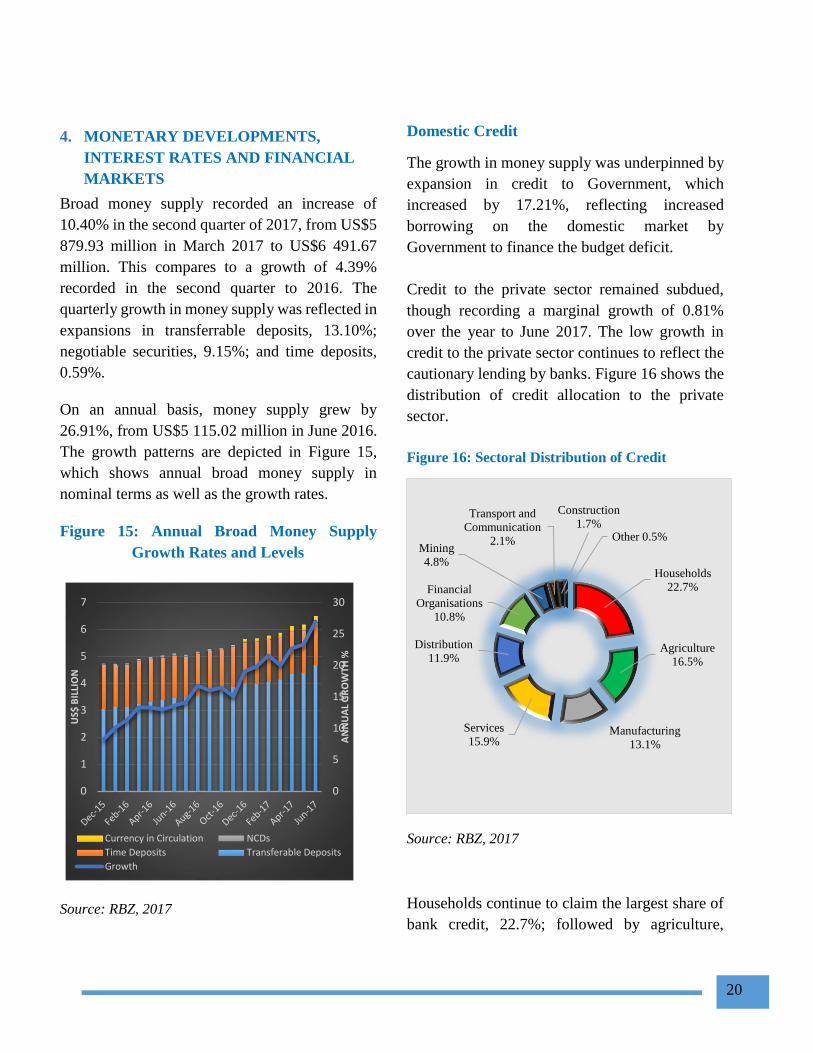
Broad money supply recorded an increase of
10.40% in the second quarter of 2017, from US$5
879.93 million in March 2017 to US$6 491.67
million. This compares to a growth of 4.39%
recorded in the second quarter to 2016. The
quarterly growth in money supply was reflected in
expansions in transferrable deposits, 13.10%;
negotiable securities, 9.15%; and time deposits,
0.59%.
On an annual basis, money supply grew by
26.91%, from US$5 115.02 million in June 2016.
The growth patterns are depicted in Figure 15,
which shows annual broad money supply in
nominal terms as well as the growth rates.
Figure 15: Annual Broad Money Supply
Growth Rates and Levels
Source: RBZ, 2017
Domestic Credit
The growth in money supply was underpinned by
expansion in credit to Government, which
increased by 17.21%, reflecting increased
borrowing on the domestic market by
Government to finance the budget deficit.
Credit to the private sector remained subdued,
though recording a marginal growth of 0.81%
over the year to June 2017. The low growth in
credit to the private sector continues to reflect the
cautionary lending by banks. Figure 16 shows the
distribution of credit allocation to the private
sector.
Figure 16: Sectoral Distribution of Credit
Source: RBZ, 2017
Households continue to claim the largest share of
bank credit, 22.7%; followed by agriculture,
0
5
10
15
20
25
30
0
1
2
3
4
5
6
7
AN
NU
AL
GR
OW
TH %
US$
BIL
LIO
N
Currency in Circulation NCDs
Time Deposits Transferable Deposits
Growth
Households
22.7%
Agriculture
16.5%
Manufacturing
13.1%
Services
15.9%
Distribution
11.9%
Financial
Organisations
10.8%
Mining
4.8%
Transport and
Communication
2.1%
Construction
1.7%Other 0.5%

21
16.5%; services, 15.9%; and manufacturing,
13.1%. Credit to households, however, also
includes amounts advanced towards financing of
small to medium enterprises (SMEs), as most of
them borrow largely through their individual
accounts.
Interest Rates
During the quarter under review, nominal lending
rates quoted by most banks ranged between 6%
and 12%. The range was in line with the Central
Bank’s call to stimulate the economy through low
borrowing costs. Deposit rates, however,
remained low. Average interest rates on 60-day
and 90-day deposits have remained below 6%.
5. STOCK MARKET DEVELOPMENTS
During the quarter ended 30th June 2017, the
Zimbabwe Stock Exchange (ZSE) recovered from
the previous quarter loss. Trading activity was
largely dominated by wealth preserving counters,
such as British American Tobacco Zimbabwe
(B.A.T.), CBZ Holdings Limited, Delta
Corporation and Econet Wireless Zimbabwe.
Resultantly, the local bourse capitalization
increased by US$1.82 billion or 47.11% of the
previous quarter value to US$5.70 billion on 30th
June 2017. On a year-on-year basis, the ZSE
registered a 104.79% growth in capitalization,
from US$2.78 billion as at 30th June 2016.
Figure 17: Market Capitalization
Source: Zimbabwe Stock Exchange, 2017
Industrial Index
In line with the trading activity on the ZSE during
the quarter under review, the industrial index
increased by 41.03%, from 138.96 points as at 31st
March, to 195.97 points at the end of the second
quarter of 2017. On a year on year basis, the
industrial index gained 94.93 points, from 101.04
points in 2016, as show in Figure 18.
Figure 18: Zimbabwe Stock Exchange Indices
Source: Zimbabwe Stock Exchange, 2017
2,000
2,500
3,000
3,500
4,000
4,500
5,000
5,500
6,000
6,500
30-J
un-1
6
31-J
ul-
16
31-A
ug-1
6
30-S
ep-1
6
31-O
ct-1
6
30-N
ov-1
6
31-D
ec-1
6
31-J
an-1
7
28-F
eb-1
7
31-M
ar-1
7
30-A
pr-
17
31-M
ay-1
7
30-J
un-1
7
US
$ M
illi
on
s
0
10
20
30
40
50
60
70
80
90
100
70
90
110
130
150
170
190
210
Jun
-16
Jul-
16
Aug
-16
Sep
-16
Oct
-16
Nov
-16
Dec
-16
Jan-1
7
Feb
-17
Mar
-17
Apr-
17
May
-17
Jun
-17
Min
ing
Ind
ust
rial
Industrial Index Mining Index

22
Mining Index
Despite the dampened investor sentiment in the
resources cluster in the first quarter of 2017,
during the quarter under review, there was
renewed investor interest in RioZim and Hwange
Colliery Company. The investor interest was
buoyed by positive growth prospects of the
mining companies. Improved investor demand for
Hwange Colliery Company shares was
underpinned by the resuscitation of operations
after increasing its installed capacity. As a result,
the mining index grew by 19.18% to close at 69.79
points.
Market Turnover
As a consequence of improved trading activity on
the ZSE due to investors’ rebalancing of their
portfolios, both the turnover volume and value
increased by 112.78% and 44.13% to 557.8
million shares and US$67.8 million, respectively.
As such, a number of block trades were registered,
where 213.9 million ZPI shares, 37.3 million RTG
shares, 35.9 million Econet shares and 32.2
million General Beltings shares exchanged hands
at 1.1 cents, 1 cent, 24 cents and 1.1 cents,
respectively.
Foreign investor participation on the ZSE,
however, continued to decline, registering net
outflows of US$15.4 million and US$13.6 million
in the quarters ended 31st March 2017 and 30th
June 2017, respectively.
Figure 19: Market Turnover Value
Source: Zimbabwe Stock Exchange, 2017
6. PAYMENT, CLEARING AND
SETTLEMENT ACTIVITIES
The value of transactions processed through the
National Payment Systems in the second quarter
ending 30th June 2017 increased by 21% to
US$21.69 billion from US$17.91 billion recorded
in the previous quarter ending 31 March 2017.
The volumes increased by 52% to 203.7 million
from 133.8 million during the same period. The
RTGS, Cash, POS, Internet and Mobile payment
streams recorded increases in both values and
volumes for the current quarter whilst cheque and
ATMs registered decreases when compared to
quarter ending 31 March 2017.
Table 11 provides the statistical information on
various payment streams for the second quarter
ending 30 June 2017:
0
2
4
6
8
10
12
30
-Jun
-16
31
-Jul-
16
31
-Aug
-16
30
-Sep
-16
31
-Oct
-16
30
-Nov
-16
31
-Dec
-16
31
-Jan
-17
28
-Feb
-17
31
-Mar
-17
30
-Apr-
17
31
-May
-17
30
-Jun
-17
US
$ M
illi
on
s
23
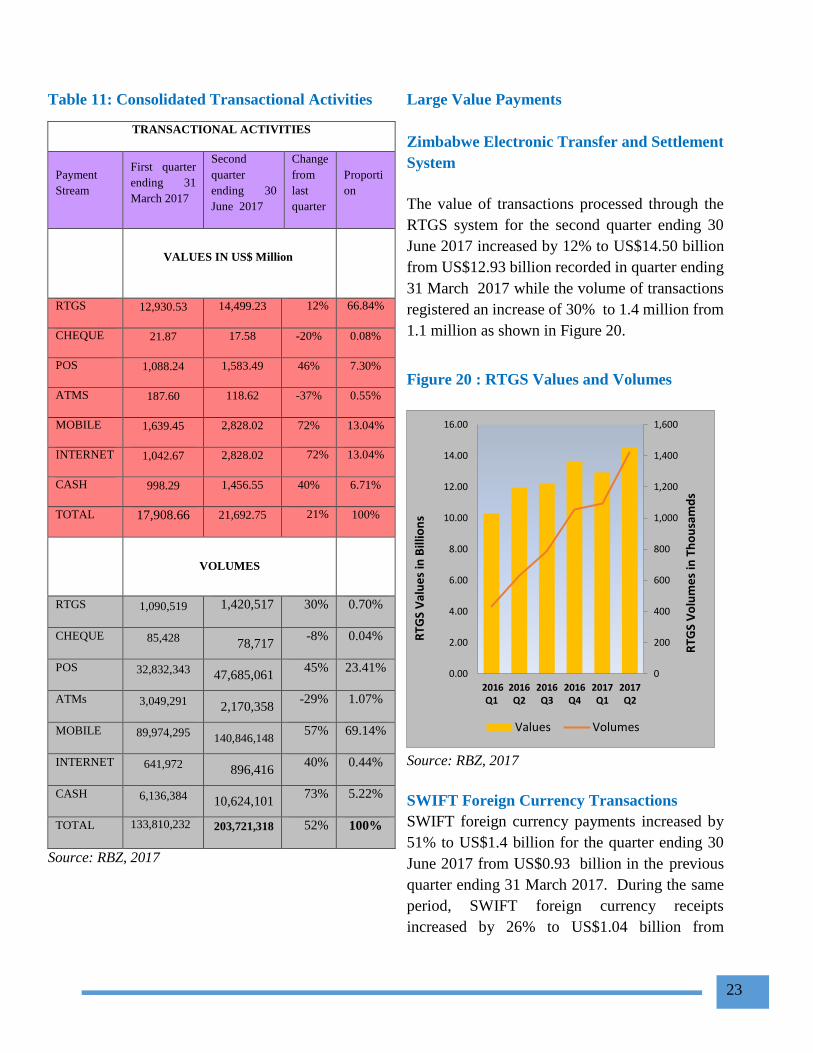
Table 11: Consolidated Transactional Activities
TRANSACTIONAL ACTIVITIES
Payment
Stream
First quarter
ending 31
March 2017
Second
quarter
ending 30
June 2017
Change
from
last
quarter
Proporti
on
VALUES IN US$ Million
RTGS 12,930.53 14,499.23 12% 66.84%
CHEQUE 21.87 17.58 -20% 0.08%
POS 1,088.24 1,583.49 46% 7.30%
ATMS 187.60 118.62 -37% 0.55%
MOBILE 1,639.45 2,828.02 72% 13.04%
INTERNET 1,042.67 2,828.02 72% 13.04%
CASH 998.29 1,456.55 40% 6.71%
TOTAL 17,908.66 21,692.75 21% 100%
VOLUMES
RTGS 1,090,519 1,420,517 30% 0.70%
CHEQUE 85,428 78,717
-8% 0.04%
POS 32,832,343 47,685,061 45% 23.41%
ATMs 3,049,291 2,170,358 -29% 1.07%
MOBILE 89,974,295 140,846,148
57% 69.14%
INTERNET 641,972 896,416
40% 0.44%
CASH 6,136,384 10,624,101 73% 5.22%
TOTAL 133,810,232 203,721,318 52% 100%
Source: RBZ, 2017
Large Value Payments
Zimbabwe Electronic Transfer and Settlement
System
The value of transactions processed through the
RTGS system for the second quarter ending 30
June 2017 increased by 12% to US$14.50 billion
from US$12.93 billion recorded in quarter ending
31 March 2017 while the volume of transactions
registered an increase of 30% to 1.4 million from
1.1 million as shown in Figure 20.
Figure 20 : RTGS Values and Volumes
Source: RBZ, 2017
SWIFT Foreign Currency Transactions
SWIFT foreign currency payments increased by
51% to US$1.4 billion for the quarter ending 30
June 2017 from US$0.93 billion in the previous
quarter ending 31 March 2017. During the same
period, SWIFT foreign currency receipts
increased by 26% to US$1.04 billion from
0
200
400
600
800
1,000
1,200
1,400
1,600
0.00
2.00
4.00
6.00
8.00
10.00
12.00
14.00
16.00
2016Q1
2016Q2
2016Q3
2016Q4
2017Q1
2017Q2
RTG
S V
alu
es
in B
illio
ns
RTG
S V
olu
me
s in
Th
ou
sam
ds
Values Volumes

24
US$0.82 billion as shown in Figure 24 below. The
net foreign currency outflows amounted to
US$365.64 million from US$106.84 million
during the period under review.
Figure 21 shows trends in SWIFT foreign
currency transactions.
Figure 21: SWIFT Cross Border Transactions
Source: RBZ, 2017
Over the Counter Cash Withdrawals
The value of cash withdrawals increased by 19%
fromUS$0.998 billion during the quarter ending
31 March 2017 to US$1.19 billion recorded in
quarter ending 30 June 2017. The corresponding
volumes increased by 73% from 6.14 million to
10.62 million, as shown in Figure 22.
Figure 22: Over the Counter Cash Withdrawals
Source: RBZ, 2017
Retail Payments
Figures 23 and 24 show the trends in the values
and volumes of retail transactions from quarter
ending 31 March 2016 to quarter ending 30 June
2017.
Figure 23: Values of Retail Transactions
Source: RBZ, 2017
20
25
30
35
40
45
50
55
0.50
0.60
0.70
0.80
0.90
1.00
1.10
1.20
1.30
1.40
1.50
Quarterending
Dec 2015
Quarterending
Mar 2016
QuarterendingJune2016
QuarterendingSept2016
Quarterending
Dec 2016
Quarterending
Mar 2017
QuarterendingJune2017
Vo
lum
es
in T
ho
usa
nd
s
Va
lue i
n U
S$
B
(SWIFT) Cross Border
QuarterlyTransactions
Value of Receipts
Value of Payments
Volumes of Payments
0.00
0.50
1.00
1.50
2.00
2.50
3.00
2016Q1
2016Q2
2016Q3
2016Q4
2017Q1
2017Q2
0.0
2.0
4.0
6.0
8.0
10.0
12.0
US$
BIL
LIO
NS
MIL
LIO
NS
Volumes Values
0
500
1,000
1,500
2,000
2,500
3,000
3,500
2016 Q1 2016 Q2 2016 Q3 2016 Q4 2017 Q1 2017 Q2
US$
Mill
ion
s
CHEQUE POS ATMS
MOBILE INTERNET CASH
25
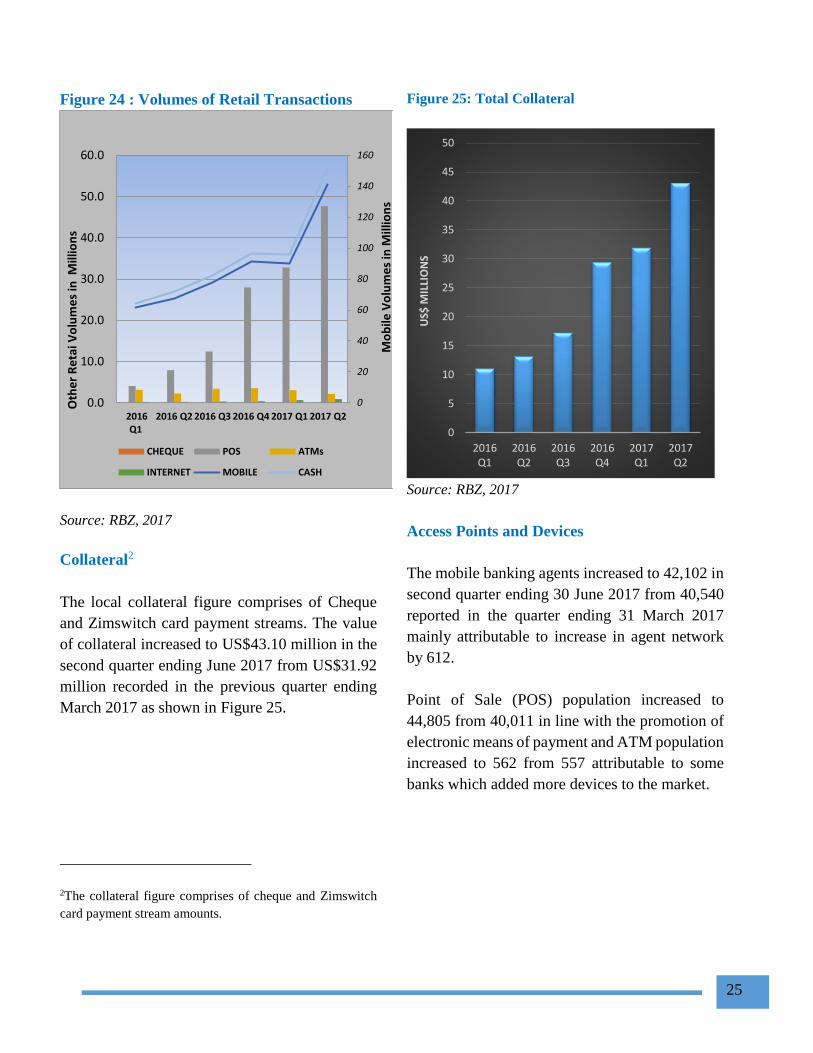
Figure 24 : Volumes of Retail Transactions
Source: RBZ, 2017
Collateral2
The local collateral figure comprises of Cheque
and Zimswitch card payment streams. The value
of collateral increased to US$43.10 million in the
second quarter ending June 2017 from US$31.92
million recorded in the previous quarter ending
March 2017 as shown in Figure 25.
2The collateral figure comprises of cheque and Zimswitch
card payment stream amounts.
Figure 25: Total Collateral
Source: RBZ, 2017
Access Points and Devices
The mobile banking agents increased to 42,102 in
second quarter ending 30 June 2017 from 40,540
reported in the quarter ending 31 March 2017
mainly attributable to increase in agent network
by 612.
Point of Sale (POS) population increased to
44,805 from 40,011 in line with the promotion of
electronic means of payment and ATM population
increased to 562 from 557 attributable to some
banks which added more devices to the market.
0
20
40
60
80
100
120
140
160
0.0
10.0
20.0
30.0
40.0
50.0
60.0
2016Q1
2016 Q2 2016 Q3 2016 Q4 2017 Q1 2017 Q2
Mo
bile
Vo
lum
es
in M
illio
ns
Oth
er
Re
tai V
olu
me
s in
Mill
ion
s
CHEQUE POS ATMs
INTERNET MOBILE CASH
0
5
10
15
20
25
30
35
40
45
50
2016Q1
2016Q2
2016Q3
2016Q4
2017Q1
2017Q2
US$
MIL
LIO
NS

26
There were 3.35 million active mobile financial
services subscribers registered in the period under
review from 3.21 registered in the previous
quarter. Table 12 shows statistics for access points
and devices for the fourth quarter of 2016, and for
the first and second quarters of 2017.
Table 12: Payment Systems Access Points and
Devices
PAYMENT SYSTEMS ACCESS POINTS
Q3 2016 Q4 2016 Q1 2017
Mobile
Banking
Agents
40,590 40,540 42,102
ATMs 569 557 562
POS 32,629 40,011 44,805
PAYMENT SYSTEMS ACCESS DEVICES
Debit Cards 3,127,153 3,359,455 3,780,389
Credit Cards 16,030 16,945 17,510
Prepaid
Cards 43,288 46,593 52,384
Active
Mobile
Banking
Subscribers
3,279,049 3,214,001 3,353,916
Internet
Banking
Subscribers
168,339 177,920 205,104
Source: RBZ, 2017
7. FISCAL DEVELOPMENTS
Government Revenue
Cumulative revenue collections stood at
US$918.0 million in Q2 of 2017, about 0.3%
below the quarterly target of US$920.5 million,
weighed down by non-tax and other indirect tax
revenue heads, as well as by the net effect of the
increase in VAT refunds, as shown in Figure 26.
Figure 26: Quarterly Revenue Head
Performance in Q2: 2016 vs 2017 & Q2 2017
Target
Source: MoFED, 2017
Cumulative collections, however, surpassed the
US$884 million realised during the comparable
period in 2016 by 4%, largely on account of tax
on income and profits, as well as excise and
custom duty which performed better during the
second quarter of 2017. VAT, other indirect taxes
and non-tax revenue were, however, below levels
realized during the same period in 2016, pulled
down by the slowdown in economic activity.
Tax on income and profits continued to be the
major driver of revenue, contributing 38.8% of
0.0
50.0
100.0
150.0
200.0
250.0
300.0
350.0
400.0
Tax onIncome
and profits
Customsduties
Exciseduties
ValueAdded Tax
(VAT)
Q2 2016 Q2 2017 Q2 2017 Targets
27
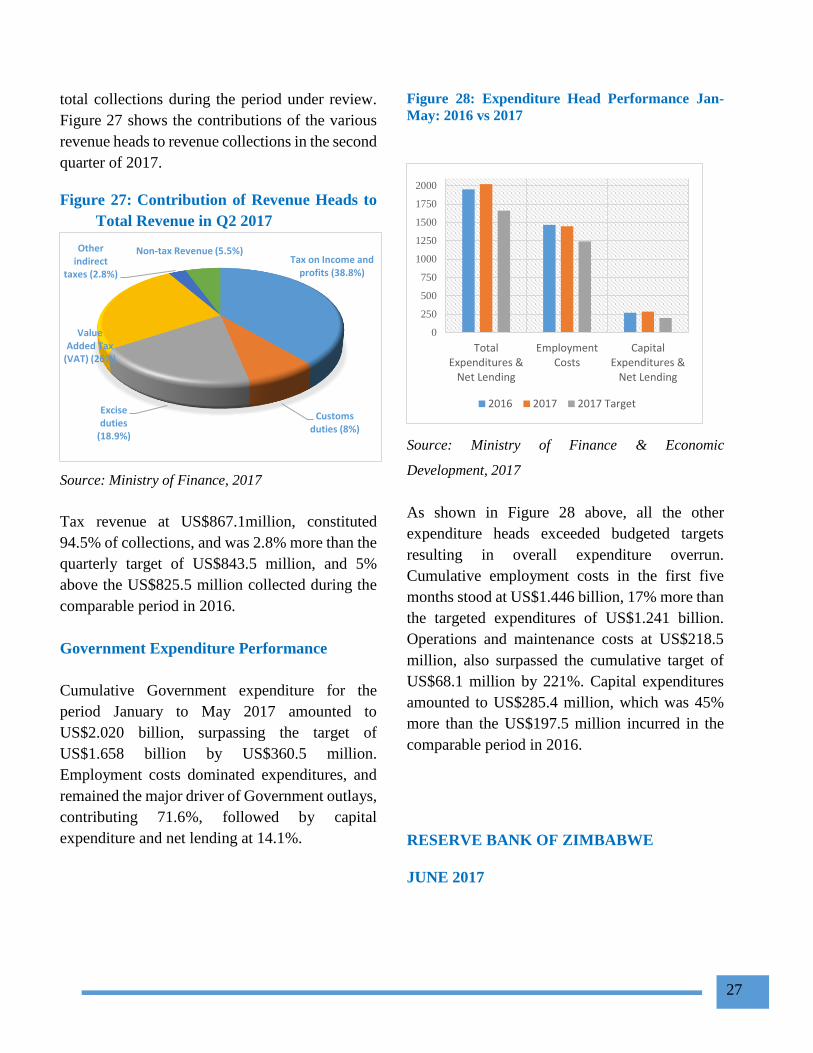
total collections during the period under review.
Figure 27 shows the contributions of the various
revenue heads to revenue collections in the second
quarter of 2017.
Figure 27: Contribution of Revenue Heads to
Total Revenue in Q2 2017
Source: Ministry of Finance, 2017
Tax revenue at US$867.1million, constituted
94.5% of collections, and was 2.8% more than the
quarterly target of US$843.5 million, and 5%
above the US$825.5 million collected during the
comparable period in 2016.
Government Expenditure Performance
Cumulative Government expenditure for the
period January to May 2017 amounted to
US$2.020 billion, surpassing the target of
US$1.658 billion by US$360.5 million.
Employment costs dominated expenditures, and
remained the major driver of Government outlays,
contributing 71.6%, followed by capital
expenditure and net lending at 14.1%.
Figure 28: Expenditure Head Performance Jan-
May: 2016 vs 2017
Source: Ministry of Finance & Economic
Development, 2017
As shown in Figure 28 above, all the other
expenditure heads exceeded budgeted targets
resulting in overall expenditure overrun.
Cumulative employment costs in the first five
months stood at US$1.446 billion, 17% more than
the targeted expenditures of US$1.241 billion.
Operations and maintenance costs at US$218.5
million, also surpassed the cumulative target of
US$68.1 million by 221%. Capital expenditures
amounted to US$285.4 million, which was 45%
more than the US$197.5 million incurred in the
comparable period in 2016.
RESERVE BANK OF ZIMBABWE
JUNE 2017
Tax on Income and profits (38.8%)
Customs duties (8%)
Excise duties
(18.9%)
Value Added Tax
(VAT) (26%)
Other indirect
taxes (2.8%)
Non-tax Revenue (5.5%)
0
250
500
750
1000
1250
1500
1750
2000
TotalExpenditures &
Net Lending
EmploymentCosts
CapitalExpenditures &
Net Lending
2016 2017 2017 Target
STATISTICAL TABLES
1. Depository Corporation Survey S1
2. Central Bank Survey S2
3. Other Depository Corporation Survey S3
4. Liabilities and Assets of the Central Bank
4.1.Reserve Bank: Liabilities S4
4.2.Reserve Bank: Assets S5
5. Other Depository Corporation
5.1.Other Depository Asset S6
5.2.Other Depository Liabilities S7
6. Commercial Banks
6.1.Commercial Banks: Assets S8
6.2.Commercial Banks: Liabilities S9
7. Building Societies
7.1.Building Societies: Assets S10
7.2.Building Societies: Liabilities S11
8. Sectoral Analysis of Commercial Banks
8.1.Sectoral Analysis of Commercial Banks’ Loans and Advances S12
8.2.Sectoral Analysis of Commercial Bank’s Deposits S13
9. National Payment Systems
9.1.Values of Transactions S14
9.2.Volumes of Transactions S14
10. Interest Rates, Security Yields and Prices
10.1. Lending Rates S15
10.2. Deposit Rates S15
11. Stock Exchange Indices S16
12. Inflation
12.1. Monthly Inflation S17
12.2. Quarterly Inflation S18
12.3. Annual Inflation S19

29
13. Balance of Payments
13.1. Cross Border Payments S20
13.2. Cross Border Receipts S21
14. External Sector
14.1. External Debt Outstanding By Debtor S22
14.2. External Debt Outstanding by Source S23
15. National Accounts
15.1. Real Gross Domestic and National Product per Capita at Market Prices S24
15.2. Gross Domestic Product at Factor Cost by Industry S25
15.3. Expenditure on Gross Domestic Product S26
15.4. Mineral Production S27
15.5. Electricity Produced and Distributed S28
15.6. Volume of Manufacturing Index S29

Jun-16 Jul-16 Aug-16 Sep-16 Oct-16 Nov-16 Dec-16 Jan-17 Feb-17 Mar-17 Apr-17 May-17 Jun-17
Net Foreign Assets -502,899.96 -393,113.03 -371,494.66 -365,714.85 -564,842.79 -636,688.80 -555,620.67 -584,011.92 -574,374.12 -559,959.05 -513,244.32 -567,873.40 -574,972.81
Central Bank(net) -473,442.49 -379,979.17 -390,409.11 -383,854.74 -545,842.19 -591,305.32 -573,721.83 -583,214.44 -588,800.77 -585,362.68 -597,983.99 -624,117.95 -572,451.17
Foreign Assets 393,393.91 383,799.11 354,937.59 343,840.92 416,996.33 364,866.78 410,827.76 449,211.75 445,565.06 419,948.30 406,334.53 380,372.91 414,622.73
Foreign Liabilities -866,836.39 -763,778.28 -745,346.70 -727,695.66 -962,838.52 -956,172.09 -984,549.60 -1,032,426.19 -1,034,365.82 -1,005,310.99 -1,004,318.51 -1,004,490.86 -987,073.90
Other Depository Corporations(net) -29,457.47 -13,133.86 18,914.44 18,139.89 -19,000.60 -45,383.48 18,101.16 -797.49 14,426.64 25,403.64 84,739.67 56,244.55 -2,521.64
Foreign Assets 278,419.49 283,718.30 309,754.41 295,146.25 278,185.36 244,421.21 297,836.79 270,935.31 290,763.66 275,104.70 338,839.86 302,736.47 260,090.51
Foreign Liabilities -307,876.96 -296,852.16 -290,839.97 -277,006.36 -297,185.96 -289,804.69 -279,735.63 -271,732.80 -276,337.02 -249,701.07 -254,100.19 -246,491.92 -262,612.14
Net Domestic Assets (NDA) 5,617,915.82 5,457,438.42 5,552,228.17 5,642,801.47 5,877,742.21 6,056,699.56 6,193,901.69 6,247,448.43 6,346,016.00 6,439,892.69 6,630,026.96 6,768,155.75 7,066,644.43
Domestic Claims 6,989,689.04 6,895,453.88 6,978,485.30 7,059,099.99 7,180,307.48 7,554,069.08 7,669,496.22 7,645,349.84 7,784,284.88 7,922,221.15 8,181,305.42 8,453,437.89 8,775,537.48
Claims on Central Government(net) 3,192,583.42 3,134,575.48 3,227,067.12 3,299,875.31 3,381,436.05 3,679,166.52 3,747,719.59 3,862,282.83 4,003,963.78 4,034,942.83 4,316,258.18 4,466,829.20 4,729,355.59
Claims on Central Government 3,305,953.61 3,267,213.20 3,373,077.05 3,445,300.69 3,516,314.57 3,824,753.66 3,908,493.46 3,941,069.39 4,084,363.34 4,147,553.19 4,414,769.52 4,564,175.79 4,843,590.52
Central Bank 1,865,005.08 1,790,569.21 1,929,962.12 1,954,616.32 1,970,042.75 2,306,454.54 2,337,460.53 2,270,648.89 2,355,433.48 2,337,736.94 2,444,902.59 2,578,541.58 2,781,509.70
ODCs 1,440,948.54 1,476,643.99 1,443,114.93 1,490,684.38 1,546,271.82 1,518,299.12 1,571,032.92 1,670,420.50 1,728,929.86 1,809,816.25 1,969,866.92 1,985,634.21 2,062,080.82
Less Liabilities to Central Government -113,370.19 -132,637.72 -146,009.93 -145,425.39 -134,878.53 -145,587.14 -160,773.86 -78,786.57 -80,399.57 -112,610.37 -98,511.34 -97,346.59 -114,234.93
Claims on Other Sectors 3,797,105.62 3,760,878.40 3,751,418.18 3,759,224.68 3,798,871.43 3,874,902.55 3,921,776.63 3,783,067.01 3,780,321.10 3,887,278.32 3,865,047.24 3,986,608.69 4,046,181.88
Other Financial Corporations 122,525.52 134,294.30 130,939.44 132,282.45 124,852.98 128,782.67 119,157.29 117,123.94 79,035.53 80,256.74 82,515.74 96,671.25 150,004.30
State and Local Government 40,448.43 48,803.79 47,676.40 43,554.41 41,728.47 37,784.82 34,237.41 35,909.11 35,006.53 34,312.18 34,732.93 36,595.52 35,573.02
Public Non Financial Corporations 222,439.82 257,749.06 257,736.50 234,348.95 248,965.26 244,277.53 240,007.21 246,102.41 274,898.12 268,976.36 302,761.14 334,495.68 337,668.92
Private Sector 3,411,691.85 3,320,031.24 3,315,065.84 3,349,038.87 3,383,324.72 3,464,057.53 3,528,374.72 3,383,931.55 3,391,380.92 3,503,733.03 3,445,037.42 3,518,846.25 3,522,935.65
Central Bank 24,517.65 29,223.55 25,871.86 28,360.51 28,496.47 28,190.50 31,268.19 28,547.39 34,327.69 34,209.32 31,152.87 32,571.62 33,352.46
ODCs 3,387,174.20 3,290,807.69 3,289,193.98 3,320,678.35 3,354,828.25 3,435,867.03 3,497,106.53 3,355,384.15 3,357,053.23 3,469,523.72 3,413,884.55 3,486,274.63 3,489,583.19
Other Items(Net) 1,371,773.23 1,438,015.46 1,426,257.14 1,416,298.52 1,302,565.27 1,497,369.51 1,475,594.53 1,397,901.41 1,438,268.87 1,482,328.45 1,551,278.46 1,685,282.14 1,708,893.05
Shares and Other Equity 808,263.47 832,720.12 846,025.31 887,795.24 915,505.55 935,291.08 1,470,571.26 1,471,378.30 1,481,807.04 1,505,125.81 1,501,542.86 1,530,318.89 1,547,498.82
Liabilities to Other Financial Corporations 50,664.77 49,419.92 44,517.02 39,463.26 31,567.03 32,045.66 52,038.47 44,373.98 46,621.66 45,153.65 45,155.62 45,511.27 49,869.95
Restricted Deposits 151,173.32 149,999.92 149,845.80 153,471.12 166,495.73 180,899.67 60,499.79 66,478.53 66,737.97 67,789.29 68,133.12 84,939.87 84,617.96
Other Items(net) 361,671.67 405,875.51 385,869.01 335,568.90 188,996.96 349,133.11 -107,514.99 -184,329.41 -156,897.79 -135,740.30 -63,553.13 24,512.12 26,906.32
Broad Money-M3 5,115,015.85 5,064,325.38 5,180,733.50 5,277,086.62 5,312,899.41 5,420,010.76 5,638,281.02 5,663,436.51 5,771,641.88 5,879,933.65 6,116,782.64 6,200,282.35 6,491,671.62
Securities Other than Shares Included in Broad Money 80,952.14 71,791.03 80,840.29 74,118.29 73,356.67 43,862.17 62,894.35 50,562.02 59,329.24 60,161.15 63,292.20 61,392.93 65,667.46
Broad Money-M2 5,034,063.72 4,992,534.36 5,099,893.22 5,202,968.33 5,239,542.75 5,376,148.60 5,575,386.66 5,612,874.49 5,712,312.64 5,819,772.50 6,053,490.44 6,138,889.42 6,426,004.16
Other Deposits 1,569,208.72 1,517,709.33 1,553,347.70 1,534,910.45 1,508,943.19 1,467,582.00 1,471,657.19 1,544,945.66 1,552,644.56 1,529,856.98 1,530,705.58 1,558,418.08 1,538,865.52
Narrow Money-M1 3,464,854.99 3,474,825.02 3,546,545.52 3,668,057.88 3,730,599.56 3,908,566.59 4,103,729.48 4,067,928.83 4,159,668.08 4,289,915.52 4,522,784.87 4,580,471.34 4,887,138.64
Transferable Deposits 3,456,750.65 3,466,614.21 3,537,772.31 3,658,634.63 3,720,917.62 3,889,717.47 4,033,558.66 3,985,443.09 4,046,287.46 4,147,742.43 4,369,406.07 4,404,701.40 4,690,977.34
Currency Outside Depository Corporations 8,104.35 8,210.82 8,773.21 9,423.25 9,681.93 18,849.12 70,170.81 82,485.74 113,380.62 142,173.09 153,378.80 175,769.94 196,161.30
Source: Reserve Bank of Zimbawe,2017
Note:
(i) Depository corporations survey - formerly Monetary Survey.
(ii) Broad money redefined using IMF's Monetary and Financial Statistics Manual of 2000. Major changes include exclusion of Government deposits held by banks from broad money.
(iii) Transferable deposits made up of demand and savings deposits.
(iv) NCDs are also referred to as securities included in broad money.
(v) All classes of time deposits, short and long term are classified as time deposits, which are also termed other deposits.
(vi) Credit to the private sector now excludes claims on other financial corporations, as well as claims on state and local government (local authorities)
(vii) Depository corporations made up of the Central Bank and other depository corporations
(viii) Other depository corporations (ODCs) - Commercial banks, merchant banks, building societies and POSB.
TABLE 1: DEPOSITORY CORPORATIONS SURVEY (US$ '000)

S2
Jun-16 Jul-16 Aug-16 Sep-16 Oct-16 Nov-16 Dec-16 Jan-17 Feb-17 Mar-17 Apr-17 May-17 Jun-17
Net Foreign Assets -473,442.49 -379,979.17 -390,409.11 -383,854.74 -545,842.19 -591,305.32 -573,721.83 -583,214.44 -588,800.77 -585,362.68 -597,983.99 -624,117.95 -572,451.17
Claims on Non Residents 393,393.91 383,799.11 354,937.59 343,840.92 416,996.33 364,866.78 410,827.76 449,211.75 445,565.06 419,948.30 406,334.53 380,372.91 414,622.73
Official Reserves Assets 293,946.47 285,543.05 255,805.98 244,677.43 316,461.39 266,511.75 309,331.78 350,427.48 346,696.05 320,526.53 306,195.43 280,743.61 311,434.24
Other Foreign Assets 99,447.43 98,256.06 99,131.61 99,163.49 100,534.95 98,355.02 101,495.99 98,784.27 98,869.01 99,421.78 100,139.10 99,629.30 103,188.49
Less Liabilities to Non Residents 866,836.39 763,778.28 745,346.70 727,695.66 962,838.52 956,172.09 984,549.60 1,032,426.19 1,034,365.82 1,005,310.99 1,004,318.51 1,004,490.86 987,073.90
Short Term Liabilities 450,321.22 349,757.38 351,510.63 331,152.07 482,116.69 481,842.04 515,365.90 558,302.10 560,678.78 528,171.18 523,978.67 523,548.11 502,610.47
Other Foreign Liabilities 416,515.17 414,020.90 393,836.06 396,543.59 480,721.84 474,330.06 469,183.69 474,124.08 473,687.04 477,139.81 480,339.84 480,942.76 484,463.43
Net Domestic Assets (NDA) 1,483,098.69 1,431,538.49 1,528,966.57 1,582,075.13 1,651,349.30 1,910,944.27 2,046,457.01 2,082,987.44 2,193,388.18 2,189,787.86 2,257,730.24 2,349,466.00 2,521,330.28
Domestic Claims 1,937,013.69 1,909,144.81 2,028,462.52 2,036,657.48 2,070,285.42 2,396,766.46 2,420,011.99 2,449,800.81 2,551,097.25 2,545,403.08 2,683,243.81 2,852,123.09 3,029,056.93
Net Claims on Central Government 1,777,241.09 1,708,832.27 1,830,889.20 1,852,931.02 1,878,215.64 2,207,020.45 2,218,852.08 2,244,839.79 2,330,293.56 2,312,027.68 2,422,539.02 2,556,298.97 2,740,989.57
Claims on Central Government 1,865,005.08 1,790,569.21 1,929,962.12 1,954,616.32 1,970,042.75 2,306,454.54 2,337,460.53 2,270,562.63 2,355,433.48 2,337,736.94 2,444,816.34 2,578,541.58 2,781,509.70
Of which: Securities Other than Shares 283,077.80 279,010.40 283,933.50 260,822.30 259,945.20 250,270.16 566,328.08 577,431.69 562,535.65 551,741.20 533,407.34 537,150.63 620,541.15
Less Liabilities to Central Government 87,763.98 81,736.94 99,072.93 101,685.30 91,827.11 99,434.09 118,608.45 25,722.84 25,139.92 25,709.26 22,277.32 22,242.61 338,860.92
Of which: Deposits 87,763.98 81,736.94 99,072.93 101,685.30 91,827.11 99,434.09 118,608.45 25,722.84 25,139.92 25,709.26 22,277.32 22,242.61 40,520.14
Claims on Other Sectors 159,772.59 200,312.54 197,573.32 183,726.46 192,069.78 189,746.01 201,159.91 206,874.76 243,242.69 235,375.40 262,618.54 297,824.11 290,067.36
Other Financial Corporations 11,717.92 14,072.39 14,485.45 14,842.27 18,107.69 18,890.01 16,515.86 16,900.44 18,434.72 18,570.34 18,972.27 19,413.25 17,924.43
State and Local Government 0.00 0.00 0.00 0.00 0.00 0.00 0.00 0.00 0.00 0.00 0.00 0.00 0.00
Public Non Financial Corporations 123,537.02 157,016.59 157,216.02 140,523.67 145,465.62 142,665.50 153,375.86 161,426.93 190,480.28 182,595.75 212,493.40 245,839.24 238,790.47
Private Sector 24,517.65 29,223.55 25,871.86 28,360.51 28,496.47 28,190.50 31,268.19 28,547.39 34,327.69 34,209.32 31,152.87 32,571.62 33,352.46
Claims on Other Depository Corporations 223,418.95 224,948.10 203,523.49 199,637.85 145,431.17 164,922.74 140,331.70 110,720.51 93,514.18 104,865.33 85,479.27 50,810.90 52,540.42
Other Liabilities to ODCs 273,601.27 276,345.66 277,697.37 277,611.11 278,881.87 280,278.62 268,568.70 269,925.53 255,446.41 242,394.50 294,200.81 305,898.38 307,589.96
Other Items(Net) 403,732.68 426,208.76 425,322.07 376,609.09 285,485.42 370,466.32 245,317.99 209,608.36 218,215.84 220,086.04 218,792.03 249,569.60 254,677.12
Monetary Base Incl. foreign currency clearing balances
Monetary Base 1,009,656.20 1,051,559.32 1,138,557.47 1,198,220.39 1,105,507.11 1,319,638.96 1,472,735.17 1,499,773.00 1,604,587.41 1,604,425.18 1,659,746.25 1,725,348.05 1,948,879.10
Bond Coins 9,719.25 9,831.18 10,353.40 11,050.36 11,102.75 13,404.37 13,783.33 13,852.69 13,845.13 20,385.15 23,268.86 25,819.61 27,667.47
Bond Notes 0.00 0.00 0.00 0.00 0.00 10,009.77 72,950.55 88,839.10 118,836.70 134,347.60 140,801.34 163,388.94 175,855.75
Liabilities to ODCs 996,320.43 1,032,687.85 1,123,924.45 1,183,078.55 1,093,687.18 1,292,654.09 1,385,011.22 1,395,502.07 1,467,941.59 1,446,635.59 1,492,786.16 1,520,837.74 1,728,301.19
Reserve Deposits 0.00 0.00 0.00 0.00 0.00 0.00 0.00 0.00 0.00 0.00 0.00 0.00 0.00
Other 996,320.43 1,032,687.85 1,123,924.45 1,183,078.55 1,093,687.18 1,292,654.09 1,385,011.22 1,395,502.07 1,467,941.59 1,446,635.59 1,492,786.16 1,520,837.74 1,728,301.19
Private Deposits 3,616.52 9,040.29 4,279.62 4,091.49 717.18 3,570.71 990.07 1,579.14 3,963.99 3,056.83 2,889.89 15,301.76 17,054.69
Source: Reserve Bank of Zimbawe,2017
Note:
(i) Depository corporations survey - formerly Monetary Survey.
(ii) Broad money redefined using IMF's Monetary and Financial Statistics Manual of 2000. Major changes include exclusion of Government deposits held by banks from broad money.
(iii) Transferable deposits made up of demand and savings deposits.
(iv) NCDs are also referred to as securities included in broad money.
(v) All classes of time deposits, short and long term are classified as time deposits, which are also termed other deposits.
(vi) Credit to the private sector now excludes claims on other financial corporations, as well as claims on state and local government (local authorities)
(vii) Depository corporations made up of the Central Bank and other depository corporations
(viii) Other depository corporations (ODCs) - Commercial banks, merchant banks, building societies and POSB.
TABLE 1: DEPOSITORY CORPORATIONS SURVEY (US$ '000)
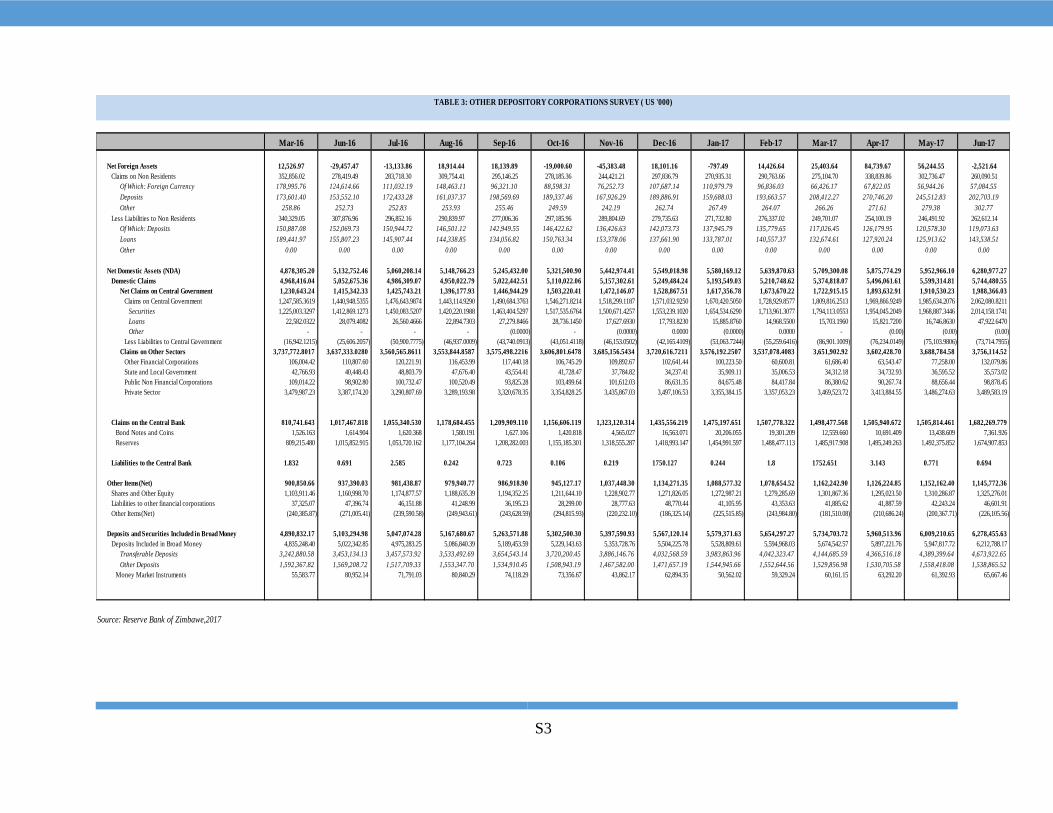
S3
Mar-16 Jun-16 Jul-16 Aug-16 Sep-16 Oct-16 Nov-16 Dec-16 Jan-17 Feb-17 Mar-17 Apr-17 May-17 Jun-17
Net Foreign Assets 12,526.97 -29,457.47 -13,133.86 18,914.44 18,139.89 -19,000.60 -45,383.48 18,101.16 -797.49 14,426.64 25,403.64 84,739.67 56,244.55 -2,521.64
Claims on Non Residents 352,856.02 278,419.49 283,718.30 309,754.41 295,146.25 278,185.36 244,421.21 297,836.79 270,935.31 290,763.66 275,104.70 338,839.86 302,736.47 260,090.51
Of Which: Foreign Currency 178,995.76 124,614.66 111,032.19 148,463.11 96,321.10 88,598.31 76,252.73 107,687.14 110,979.79 96,836.03 66,426.17 67,822.05 56,944.26 57,084.55
Deposits 173,601.40 153,552.10 172,433.28 161,037.37 198,569.69 189,337.46 167,926.29 189,886.91 159,688.03 193,663.57 208,412.27 270,746.20 245,512.83 202,703.19
Other 258.86 252.73 252.83 253.93 255.46 249.59 242.19 262.74 267.49 264.07 266.26 271.61 279.38 302.77
Less Liabilities to Non Residents 340,329.05 307,876.96 296,852.16 290,839.97 277,006.36 297,185.96 289,804.69 279,735.63 271,732.80 276,337.02 249,701.07 254,100.19 246,491.92 262,612.14
Of Which: Deposits 150,887.08 152,069.73 150,944.72 146,501.12 142,949.55 146,422.62 136,426.63 142,073.73 137,945.79 135,779.65 117,026.45 126,179.95 120,578.30 119,073.63
Loans 189,441.97 155,807.23 145,907.44 144,338.85 134,056.82 150,763.34 153,378.06 137,661.90 133,787.01 140,557.37 132,674.61 127,920.24 125,913.62 143,538.51
Other 0.00 0.00 0.00 0.00 0.00 0.00 0.00 0.00 0.00 0.00 0.00 0.00 0.00 0.00
Net Domestic Assets (NDA) 4,878,305.20 5,132,752.46 5,060,208.14 5,148,766.23 5,245,432.00 5,321,500.90 5,442,974.41 5,549,018.98 5,580,169.12 5,639,870.63 5,709,300.08 5,875,774.29 5,952,966.10 6,280,977.27
Domestic Claims 4,968,416.04 5,052,675.36 4,986,309.07 4,950,022.79 5,022,442.51 5,110,022.06 5,157,302.61 5,249,484.24 5,193,549.03 5,210,748.62 5,374,818.07 5,496,061.61 5,599,314.81 5,744,480.55
Net Claims on Central Government 1,230,643.24 1,415,342.33 1,425,743.21 1,396,177.93 1,446,944.29 1,503,220.41 1,472,146.07 1,528,867.51 1,617,356.78 1,673,670.22 1,722,915.15 1,893,632.91 1,910,530.23 1,988,366.03
Claims on Central Government 1,247,585.3619 1,440,948.5355 1,476,643.9874 1,443,114.9290 1,490,684.3763 1,546,271.8214 1,518,299.1187 1,571,032.9250 1,670,420.5050 1,728,929.8577 1,809,816.2513 1,969,866.9249 1,985,634.2076 2,062,080.8211
Securities 1,225,003.3297 1,412,869.1273 1,450,083.5207 1,420,220.1988 1,463,404.5297 1,517,535.6764 1,500,671.4257 1,553,239.1020 1,654,534.6290 1,713,961.3077 1,794,113.0553 1,954,045.2049 1,968,887.3446 2,014,158.1741
Loans 22,582.0322 28,079.4082 26,560.4666 22,894.7303 27,279.8466 28,736.1450 17,627.6930 17,793.8230 15,885.8760 14,968.5500 15,703.1960 15,821.7200 16,746.8630 47,922.6470
Other - - - - (0.0000) - (0.0000) 0.0000 (0.0000) 0.0000 - (0.00) (0.00) (0.00)
Less Liabilities to Central Government (16,942.1215) (25,606.2057) (50,900.7775) (46,937.0009) (43,740.0913) (43,051.4118) (46,153.0502) (42,165.4109) (53,063.7244) (55,259.6416) (86,901.1009) (76,234.0149) (75,103.9806) (73,714.7955)
Claims on Other Sectors 3,737,772.8017 3,637,333.0280 3,560,565.8611 3,553,844.8587 3,575,498.2216 3,606,801.6478 3,685,156.5434 3,720,616.7211 3,576,192.2507 3,537,078.4083 3,651,902.92 3,602,428.70 3,688,784.58 3,756,114.52
Other Financial Corporations 106,004.42 110,807.60 120,221.91 116,453.99 117,440.18 106,745.29 109,892.67 102,641.44 100,223.50 60,600.81 61,686.40 63,543.47 77,258.00 132,079.86
State and Local Government 42,766.93 40,448.43 48,803.79 47,676.40 43,554.41 41,728.47 37,784.82 34,237.41 35,909.11 35,006.53 34,312.18 34,732.93 36,595.52 35,573.02
Public Non Financial Corporations 109,014.22 98,902.80 100,732.47 100,520.49 93,825.28 103,499.64 101,612.03 86,631.35 84,675.48 84,417.84 86,380.62 90,267.74 88,656.44 98,878.45
Private Sector 3,479,987.23 3,387,174.20 3,290,807.69 3,289,193.98 3,320,678.35 3,354,828.25 3,435,867.03 3,497,106.53 3,355,384.15 3,357,053.23 3,469,523.72 3,413,884.55 3,486,274.63 3,489,583.19
Claims on the Central Bank 810,741.643 1,017,467.818 1,055,340.530 1,178,684.455 1,209,909.110 1,156,606.119 1,323,120.314 1,435,556.219 1,475,197.651 1,507,778.322 1,498,477.568 1,505,940.672 1,505,814.461 1,682,269.779
Bond Notes and Coins 1,526.163 1,614.904 1,620.368 1,580.191 1,627.106 1,420.818 4,565.027 16,563.071 20,206.055 19,301.209 12,559.660 10,691.409 13,438.609 7,361.926
Reserves 809,215.480 1,015,852.915 1,053,720.162 1,177,104.264 1,208,282.003 1,155,185.301 1,318,555.287 1,418,993.147 1,454,991.597 1,488,477.113 1,485,917.908 1,495,249.263 1,492,375.852 1,674,907.853
Liabilities to the Central Bank 1.832 0.691 2.585 0.242 0.723 0.106 0.219 1750.127 0.244 1.8 1752.651 3.143 0.771 0.694
Other Items(Net) 900,850.66 937,390.03 981,438.87 979,940.77 986,918.90 945,127.17 1,037,448.30 1,134,271.35 1,088,577.32 1,078,654.52 1,162,242.90 1,126,224.85 1,152,162.40 1,145,772.36
Shares and Other Equity 1,103,911.46 1,160,998.70 1,174,877.57 1,188,635.39 1,194,352.25 1,211,644.10 1,228,902.77 1,271,826.05 1,272,987.21 1,279,285.69 1,301,867.36 1,295,023.50 1,310,286.87 1,325,276.01
Liabilities to other financial corporations 37,325.07 47,396.74 46,151.88 41,248.99 36,195.23 28,299.00 28,777.63 48,770.44 41,105.95 43,353.63 41,885.62 41,887.59 42,243.24 46,601.91
Other Items(Net) (240,385.87) (271,005.41) (239,590.58) (249,943.61) (243,628.59) (294,815.93) (220,232.10) (186,325.14) (225,515.85) (243,984.80) (181,510.08) (210,686.24) (200,367.71) (226,105.56)
Deposits and Securities Included in Broad Money 4,890,832.17 5,103,294.98 5,047,074.28 5,167,680.67 5,263,571.88 5,302,500.30 5,397,590.93 5,567,120.14 5,579,371.63 5,654,297.27 5,734,703.72 5,960,513.96 6,009,210.65 6,278,455.63
Deposits Included in Broad Money 4,835,248.40 5,022,342.85 4,975,283.25 5,086,840.39 5,189,453.59 5,229,143.63 5,353,728.76 5,504,225.78 5,528,809.61 5,594,968.03 5,674,542.57 5,897,221.76 5,947,817.72 6,212,788.17
Transferable Deposits 3,242,880.58 3,453,134.13 3,457,573.92 3,533,492.69 3,654,543.14 3,720,200.45 3,886,146.76 4,032,568.59 3,983,863.96 4,042,323.47 4,144,685.59 4,366,516.18 4,389,399.64 4,673,922.65
Other Deposits 1,592,367.82 1,569,208.72 1,517,709.33 1,553,347.70 1,534,910.45 1,508,943.19 1,467,582.00 1,471,657.19 1,544,945.66 1,552,644.56 1,529,856.98 1,530,705.58 1,558,418.08 1,538,865.52
Money Market Instruments 55,583.77 80,952.14 71,791.03 80,840.29 74,118.29 73,356.67 43,862.17 62,894.35 50,562.02 59,329.24 60,161.15 63,292.20 61,392.93 65,667.46
Source: Reserve Bank of Zimbawe,2017
TABLE 3: OTHER DEPOSITORY CORPORATIONS SURVEY ( US '000)

S4
Capital
and
Foreign general
End of
Bond Notes in
Circulation Bond Coins in Circulation Bond Notes and Bankers Deposits Other Deposits Govt. Deposits Total Deposits Liabilities reserve Other Liabilities TOTAL
coins* issued
2016
Jan 0.0 8,573.9 8,573.9 678,906.5 365,275.8 88,539.8 729,295.0 966,343.3 -365,824.0 988,783.2 1,103,194.1
Feb 0.0 8,895.6 8,895.6 713,682.3 400,857.1 91,222.2 767,047.4 960,578.3 -359,703.3 982,597.2 1,098,173.6
Mar 0.0 9,138.3 9,138.3 784,713.3 415,786.0 92,031.3 838,589.9 917,005.6 -358,093.9 969,818.4 1,056,308.3
Apr 0.0 9,308.7 9,308.7 830,998.4 427,210.1 99,365.7 895,843.6 923,538.9 -362,530.5 984,007.8 1,118,366.5
May 0.0 9,502.1 9,502.1 945,135.9 426,855.8 98,842.5 1,008,007.4 921,164.5 -359,082.4 971,556.2 1,201,525.9
Jun 0.0 9,719.3 9,719.3 996,320.4 428,391.1 87,764.0 1,048,208.5 866,836.4 -352,735.2 993,766.5 1,220,631.3
Jul 0.0 9,831.2 9,831.2 1,032,687.8 435,385.9 81,736.9 1,083,969.4 763,778.3 -342,157.5 987,265.6 2,502,687.0
Aug 0.0 10,353.4 10,353.4 1,123,924.4 431,822.8 99,072.9 1,187,782.7 745,346.7 -342,610.1 987,291.8 2,588,164.5
Sep 0.0 11,050.4 11,050.4 1,183,078.5 435,173.7 101,685.3 1,249,256.4 727,695.7 -306,557.0 898,553.1 2,579,998.5
Oct 0.0 11,102.8 11,102.8 1,093,687.2 446,094.8 91,827.1 1,631,609.1 962,838.5 -296,138.5 789,118.8 3,098,530.6
Nov 10,009.8 13,404.4 23,414.1 1,292,654.1 464,749.0 99,434.1 1,856,837.2 956,172.1 -293,611.7 857,051.0 3,399,862.7
Dec 72,950.6 13,783.3 86,733.9 1,385,011.2 330,058.6 118,608.5 1,833,678.2 984,549.6 198,745.2 351,752.4 3,455,459.3
2017
Jan 88,839.1 13,852.7 102,691.8 1,395,502.1 337,983.2 25,722.8 1,759,208.1 1,032,426.2 198,391.1 318,547.9 3,411,265.1
Feb 118,836.7 13,845.1 132,681.8 1,467,941.6 326,148.4 25,139.9 1,819,229.9 1,034,365.8 202,521.4 318,261.8 3,507,060.7
Mar 134,347.6 20,385.1 154,732.8 1,446,635.6 313,240.6 25,709.3 1,785,585.5 1,005,311.0 203,258.5 324,197.0 3,473,084.6
Apr 140,801.3 23,268.9 164,070.2 1,492,786.2 365,223.8 22,277.3 1,880,287.3 1,004,318.5 206,519.4 316,670.1 3,571,865.4
May 163,388.9 25,819.6 189,208.5 1,520,837.7 406,140.0 22,242.6 1,949,220.4 1,004,490.9 220,032.0 327,350.5 3,690,302.3
Jun 175,855.8 27,667.5 203,523.2 1,728,301.2 409,262.6 40,520.1 2,178,083.9 987,073.9 222,222.8 319,689.6 3,910,593.5
Source: Reserve Bank of Zimbabwe, 2017*Bond coins first issued in December 2014
* Bond Notes issued on 28 November 2016
US$ Thousands
Deposits
TABLE 1.1: RESERVE BANK - LIABILITIES
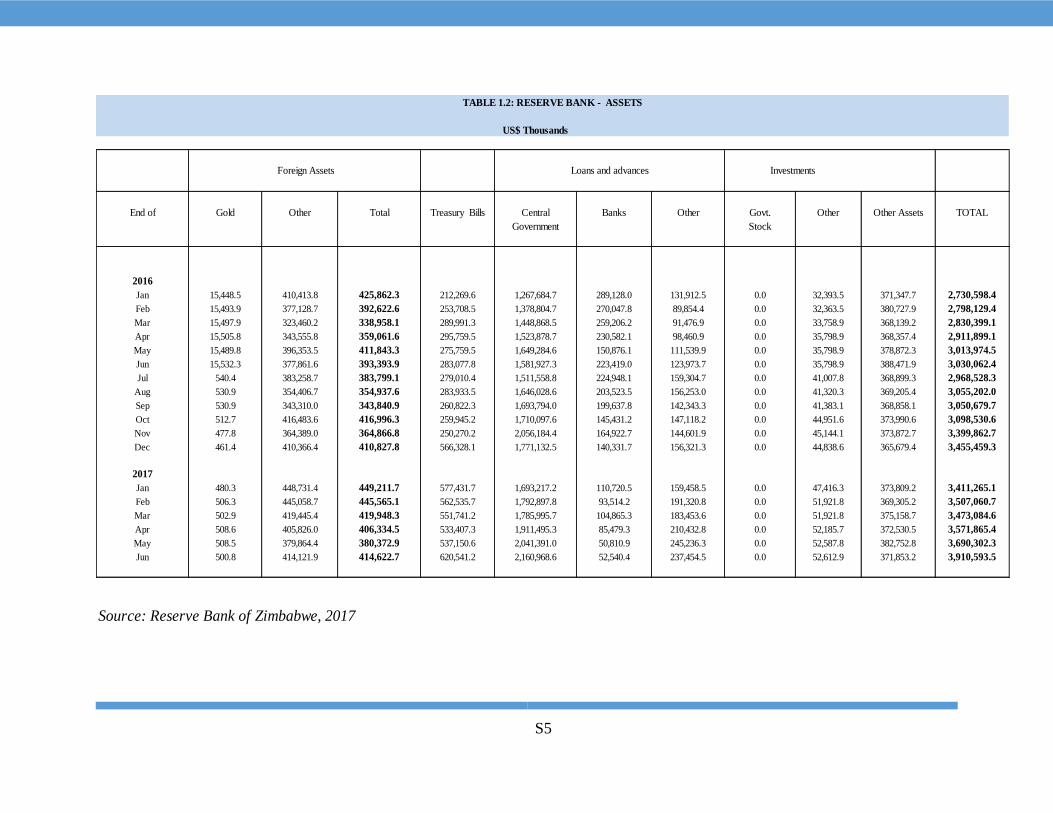
S5
US$ Thousands
End of Gold Other Total Treasury Bills Central Banks Other Govt. Other Other Assets TOTAL
Government Stock
2016
Jan 15,448.5 410,413.8 425,862.3 212,269.6 1,267,684.7 289,128.0 131,912.5 0.0 32,393.5 371,347.7 2,730,598.4
Feb 15,493.9 377,128.7 392,622.6 253,708.5 1,378,804.7 270,047.8 89,854.4 0.0 32,363.5 380,727.9 2,798,129.4
Mar 15,497.9 323,460.2 338,958.1 289,991.3 1,448,868.5 259,206.2 91,476.9 0.0 33,758.9 368,139.2 2,830,399.1
Apr 15,505.8 343,555.8 359,061.6 295,759.5 1,523,878.7 230,582.1 98,460.9 0.0 35,798.9 368,357.4 2,911,899.1
May 15,489.8 396,353.5 411,843.3 275,759.5 1,649,284.6 150,876.1 111,539.9 0.0 35,798.9 378,872.3 3,013,974.5
Jun 15,532.3 377,861.6 393,393.9 283,077.8 1,581,927.3 223,419.0 123,973.7 0.0 35,798.9 388,471.9 3,030,062.4
Jul 540.4 383,258.7 383,799.1 279,010.4 1,511,558.8 224,948.1 159,304.7 0.0 41,007.8 368,899.3 2,968,528.3
Aug 530.9 354,406.7 354,937.6 283,933.5 1,646,028.6 203,523.5 156,253.0 0.0 41,320.3 369,205.4 3,055,202.0
Sep 530.9 343,310.0 343,840.9 260,822.3 1,693,794.0 199,637.8 142,343.3 0.0 41,383.1 368,858.1 3,050,679.7
Oct 512.7 416,483.6 416,996.3 259,945.2 1,710,097.6 145,431.2 147,118.2 0.0 44,951.6 373,990.6 3,098,530.6
Nov 477.8 364,389.0 364,866.8 250,270.2 2,056,184.4 164,922.7 144,601.9 0.0 45,144.1 373,872.7 3,399,862.7
Dec 461.4 410,366.4 410,827.8 566,328.1 1,771,132.5 140,331.7 156,321.3 0.0 44,838.6 365,679.4 3,455,459.3
2017
Jan 480.3 448,731.4 449,211.7 577,431.7 1,693,217.2 110,720.5 159,458.5 0.0 47,416.3 373,809.2 3,411,265.1
Feb 506.3 445,058.7 445,565.1 562,535.7 1,792,897.8 93,514.2 191,320.8 0.0 51,921.8 369,305.2 3,507,060.7
Mar 502.9 419,445.4 419,948.3 551,741.2 1,785,995.7 104,865.3 183,453.6 0.0 51,921.8 375,158.7 3,473,084.6
Apr 508.6 405,826.0 406,334.5 533,407.3 1,911,495.3 85,479.3 210,432.8 0.0 52,185.7 372,530.5 3,571,865.4
May 508.5 379,864.4 380,372.9 537,150.6 2,041,391.0 50,810.9 245,236.3 0.0 52,587.8 382,752.8 3,690,302.3
Jun 500.8 414,121.9 414,622.7 620,541.2 2,160,968.6 52,540.4 237,454.5 0.0 52,612.9 371,853.2 3,910,593.5
Source: Reserve Bank of Zimbabwe, 2017
TABLE 1.2: RESERVE BANK - ASSETS
Foreign Assets Loans and advances Investments

S6
Foreign TOTAL
End of Notes
Bond & Balances Balances with Balances Other Claims
Notes & Coin with Other Depository with on Government1
Local Governemt Public Enterprises Other2
Government Local Public Other Institutional Units3
Other cliams Contigent Assets Other Assets Non Financial
Coins RBZ Corporations Foreign Banks Non-residents Securities securities Government Enterprises Assets
2016
Jan 1.22 193.28 734.58 294.53 116.1 25.0 1,147.0 28.8 5.2 19.1 28.5 15.6 63.6 3,547.4 110.2 582.8 412.8 545.1 7,870.8
Feb 1.44 160.35 763.47 287.06 102.8 25.0 1,228.9 29.2 5.2 19.0 25.0 15.8 61.1 3,472.0 100.5 477.1 427.3 547.6 7,748.9
Mar 1.53 179.00 809.22 286.42 148.6 25.0 1,225.0 28.5 5.1 16.4 22.6 14.2 103.9 3,510.6 59.3 471.0 428.0 552.9 7,887.2
Apr 1.55 146.02 818.74 323.00 111.8 25.0 1,322.7 27.6 5.1 15.8 25.1 15.0 102.4 3,453.7 66.7 413.7 445.5 552.2 7,871.5
May 1.53 100.12 973.06 281.55 91.0 25.0 1,354.1 26.8 5.0 16.6 12.3 14.7 101.1 3,433.4 61.0 397.0 440.2 564.1 7,898.5
Jun 1.61 124.61 1,015.85 287.98 128.5 25.0 1,412.9 25.9 0.0 16.4 28.1 14.6 98.9 3,414.9 66.9 407.7 431.5 578.8 8,080.1
Jul 1.62 111.03 1,053.72 242.57 147.4 25.0 1,450.1 33.4 0.0 16.2 26.6 15.4 100.7 3,320.9 74.2 393.1 416.7 592.4 8,021.1
Aug 1.58 148.46 1,177.10 235.02 136.0 25.0 1,420.2 32.3 0.0 11.3 22.9 15.4 100.5 3,326.8 67.8 390.2 445.0 598.3 8,153.9
Sep 1.63 96.32 1,208.28 310.75 173.6 25.0 1,463.4 29.0 5.4 3.2 27.3 14.5 88.4 3,349.0 86.1 382.3 448.6 606.6 8,319.5
Oct 1.42 88.60 1,155.19 322.05 162.3 27.0 1,517.5 26.3 15.4 3.9 28.7 15.5 88.1 3,389.7 68.2 397.2 427.7 609.0 8,343.8
Nov 4.57 76.25 1,318.56 318.52 140.9 27.0 1,500.7 22.3 15.5 4.6 17.6 15.4 86.1 3,469.5 71.9 350.5 419.0 618.2 8,477.2
Dec 16.56 107.69 1,418.99 378.23 162.9 27.0 1,553.2 21.0 15.3 4.9 17.8 13.2 71.3 3,265.0 330.1 376.7 408.8 626.0 8,814.8
2017
Jan 20.21 110.98 1,454.99 239.82 132.7 27.0 1,654.5 20.8 15.4 3.6 15.9 15.1 69.2 3,394.7 57.5 395.7 383.4 630.4 8,642.1
Feb 19.30 96.84 1,488.48 251.83 145.1 48.6 1,714.0 20.1 15.5 3.2 15.0 14.9 68.9 3,177.9 236.8 398.5 400.0 631.1 8,746.0
Mar 12.56 66.43 1,485.92 260.51 154.9 53.5 1,794.1 18.7 15.7 3.8 15.7 15.7 70.7 3,460.5 67.2 422.4 442.5 635.1 8,995.8
Apr 10.69 67.82 1,495.25 249.41 219.3 51.4 1,954.0 17.8 15.8 3.6 15.8 16.9 74.5 3,449.5 24.6 489.1 398.8 644.6 9,199.0
May 13.44 56.94 1,492.38 272.47 170.2 75.3 1,968.9 20.3 15.7 33.6 16.7 16.3 72.9 3,447.8 82.4 486.1 421.7 644.4 9,307.6
Jun 7.36 57.08 1,674.91 350.26 92.1 110.6 2,014.2 19.0 16.0 35.0 47.9 16.5 82.9 3,494.3 92.8 533.5 408.9 649.6 9,702.8
Source:Reserve Bank of Zimbabwe,2017
Notes
1.Government securities includes treasuary bills and bonds
2.Includes bankers acceptances, discounted bills and negotiable certificates of deposits.
3.Includes households, other financial corporations,
TABLE 5.1: - OTHER DEPOSITORY CORPORATIONS -ASSETS
US$ millions
Debt Securities Loans and Advances

S7
Debt Securities Foreign Liabilities Capital Contigent Other Total
and Liablities Liablities
End of Demand Savings Time Deposits Total Deposits Other Depository Government Total RBZ Other Depository Other Finacial Reserves
from the public Corporations Corporations Corporations
2016
Jan 2,487.3 650.3 1,536.5 4,674.2 388.1 26.4 5,088.7 44.9 356.5 0.0 125.0 86.0 1,189.0 582.8 397.8 7,870.76
Feb 2,466.2 669.7 1,552.9 4,688.8 375.0 20.4 5,084.1 50.3 341.1 0.0 171.7 36.4 1,196.7 477.1 391.3 7,748.89
Mar 2,566.3 676.8 1,592.4 4,835.5 371.0 16.9 5,223.5 55.6 340.1 0.0 181.1 37.3 1,185.3 471.0 393.5 7,887.24
Apr 2,629.9 695.1 1,568.6 4,893.7 332.4 18.5 5,244.6 80.1 322.6 0.0 194.0 36.9 1,188.4 413.7 391.2 7,871.55
May 2,698.3 690.6 1,559.5 4,948.4 309.8 19.5 5,277.7 71.6 336.1 0.0 143.5 36.8 1,238.7 397.0 397.2 7,898.54
June 2,792.4 660.9 1,569.2 5,022.5 401.4 25.6 5,449.5 81.0 307.7 0.0 159.4 47.4 1,243.5 407.7 384.0 8,080.12
July 2,734.8 722.9 1,517.7 4,975.5 435.1 50.9 5,461.5 71.8 296.6 0.0 129.6 46.2 1,256.6 393.1 365.6 8,021.06
Aug 2,894.5 639.2 1,553.3 5,087.1 412.3 46.9 5,546.3 80.8 290.6 0.0 127.6 41.2 1,271.0 390.2 406.1 8,153.92
Sep 2,974.8 679.9 1,534.9 5,189.6 479.7 43.7 5,713.0 74.1 276.8 0.0 151.7 36.2 1,276.8 382.3 408.4 8,319.46
Oct 3,115.2 605.1 1,508.9 5,229.3 433.8 43.1 5,706.1 73.4 297.0 0.0 162.4 28.3 1,293.5 397.2 385.9 8,343.79
Nov 3,245.5 640.8 1,467.6 5,353.9 471.9 46.2 5,872.0 43.9 289.7 0.0 142.2 28.8 1,313.4 350.5 436.9 8,477.19
Dec 3,329.8 702.9 1,471.7 5,504.4 510.9 42.2 6,057.4 62.9 279.6 1.8 191.5 48.8 1,384.1 376.7 412.1 8,814.81
2017
Jan 3,263.8 720.5 1,544.9 5,529.3 429.8 53.1 6,012.2 50.6 271.2 0.0 104.5 41.1 1,360.2 395.7 406.6 8,642.14
Feb 3,325.9 722.0 1,552.6 5,600.5 426.0 55.3 6,081.7 59.3 270.8 0.0 126.1 43.4 1,365.8 398.5 400.4 8,746.02
Mar 3,429.2 715.7 1,529.9 5,674.7 461.0 86.9 6,222.6 60.2 249.6 1.8 134.9 41.9 1,426.8 422.4 435.7 8,995.81
Apr 3,555.8 813.7 1,530.7 5,900.2 450.9 76.2 6,427.3 63.3 251.1 0.0 117.4 41.9 1,382.2 489.1 426.7 9,199.00
May 3,593.7 798.7 1,558.4 5,950.8 454.6 75.1 6,480.5 61.4 243.5 0.0 95.2 42.2 1,448.6 486.1 450.1 9,307.64
Jun 3,851.4 825.6 1,538.9 6,215.9 497.6 73.7 6,787.2 65.7 259.5 0.0 108.9 46.6 1,455.9 533.5 445.6 9,702.82
Source:Reserve Bank of Zimbabwe,2017
TABLE 5.2 : OTHER DEPOSITORY CORPORATIONS - LIABILITIES
US$millions
Deposits Amounts Owing to
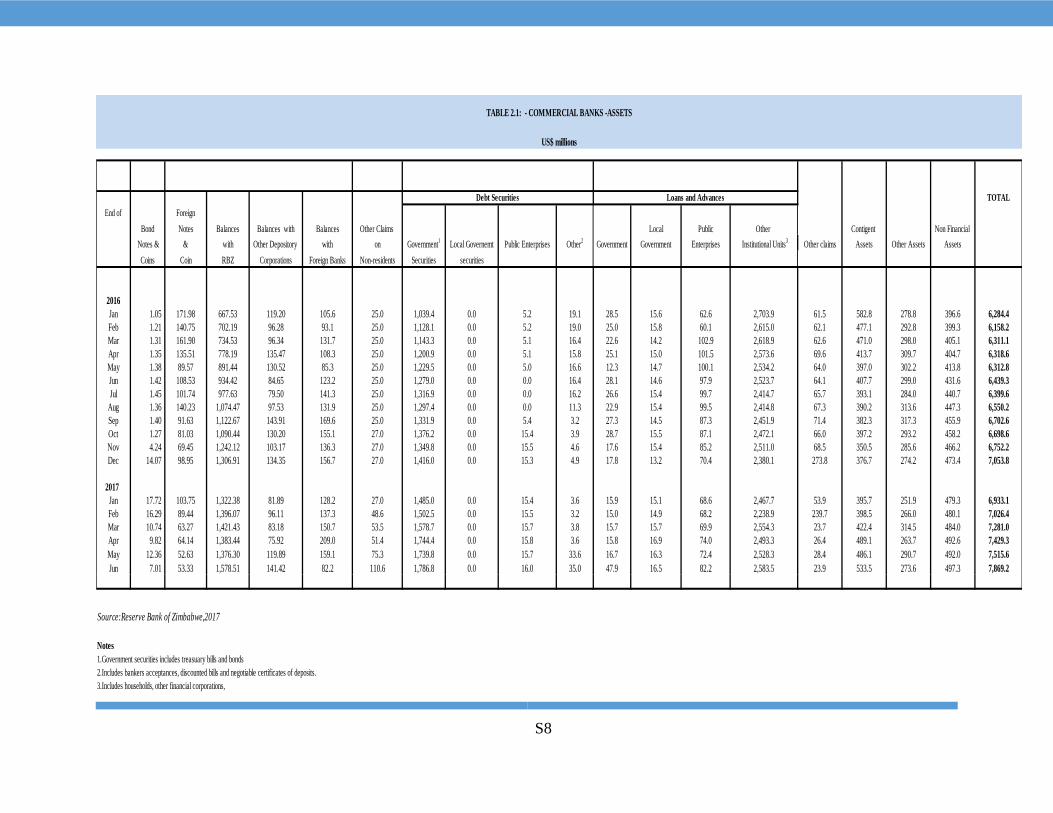
S8
TOTAL
End of Foreign
Bond Notes Balances Balances with Balances Other Claims Local Public Other Contigent Non Financial
Notes & & with Other Depository with on Government1
Local Governemt Public Enterprises Other2
Government Government Enterprises Institutional Units3
Other claims Assets Other Assets Assets
Coins Coin RBZ Corporations Foreign Banks Non-residents Securities securities
2016
Jan 1.05 171.98 667.53 119.20 105.6 25.0 1,039.4 0.0 5.2 19.1 28.5 15.6 62.6 2,703.9 61.5 582.8 278.8 396.6 6,284.4
Feb 1.21 140.75 702.19 96.28 93.1 25.0 1,128.1 0.0 5.2 19.0 25.0 15.8 60.1 2,615.0 62.1 477.1 292.8 399.3 6,158.2
Mar 1.31 161.90 734.53 96.34 131.7 25.0 1,143.3 0.0 5.1 16.4 22.6 14.2 102.9 2,618.9 62.6 471.0 298.0 405.1 6,311.1
Apr 1.35 135.51 778.19 135.47 108.3 25.0 1,200.9 0.0 5.1 15.8 25.1 15.0 101.5 2,573.6 69.6 413.7 309.7 404.7 6,318.6
May 1.38 89.57 891.44 130.52 85.3 25.0 1,229.5 0.0 5.0 16.6 12.3 14.7 100.1 2,534.2 64.0 397.0 302.2 413.8 6,312.8
Jun 1.42 108.53 934.42 84.65 123.2 25.0 1,279.0 0.0 0.0 16.4 28.1 14.6 97.9 2,523.7 64.1 407.7 299.0 431.6 6,439.3
Jul 1.45 101.74 977.63 79.50 141.3 25.0 1,316.9 0.0 0.0 16.2 26.6 15.4 99.7 2,414.7 65.7 393.1 284.0 440.7 6,399.6
Aug 1.36 140.23 1,074.47 97.53 131.9 25.0 1,297.4 0.0 0.0 11.3 22.9 15.4 99.5 2,414.8 67.3 390.2 313.6 447.3 6,550.2
Sep 1.40 91.63 1,122.67 143.91 169.6 25.0 1,331.9 0.0 5.4 3.2 27.3 14.5 87.3 2,451.9 71.4 382.3 317.3 455.9 6,702.6
Oct 1.27 81.03 1,090.44 130.20 155.1 27.0 1,376.2 0.0 15.4 3.9 28.7 15.5 87.1 2,472.1 66.0 397.2 293.2 458.2 6,698.6
Nov 4.24 69.45 1,242.12 103.17 136.3 27.0 1,349.8 0.0 15.5 4.6 17.6 15.4 85.2 2,511.0 68.5 350.5 285.6 466.2 6,752.2
Dec 14.07 98.95 1,306.91 134.35 156.7 27.0 1,416.0 0.0 15.3 4.9 17.8 13.2 70.4 2,380.1 273.8 376.7 274.2 473.4 7,053.8
2017
Jan 17.72 103.75 1,322.38 81.89 128.2 27.0 1,485.0 0.0 15.4 3.6 15.9 15.1 68.6 2,467.7 53.9 395.7 251.9 479.3 6,933.1
Feb 16.29 89.44 1,396.07 96.11 137.3 48.6 1,502.5 0.0 15.5 3.2 15.0 14.9 68.2 2,238.9 239.7 398.5 266.0 480.1 7,026.4
Mar 10.74 63.27 1,421.43 83.18 150.7 53.5 1,578.7 0.0 15.7 3.8 15.7 15.7 69.9 2,554.3 23.7 422.4 314.5 484.0 7,281.0
Apr 9.82 64.14 1,383.44 75.92 209.0 51.4 1,744.4 0.0 15.8 3.6 15.8 16.9 74.0 2,493.3 26.4 489.1 263.7 492.6 7,429.3
May 12.36 52.63 1,376.30 119.89 159.1 75.3 1,739.8 0.0 15.7 33.6 16.7 16.3 72.4 2,528.3 28.4 486.1 290.7 492.0 7,515.6
Jun 7.01 53.33 1,578.51 141.42 82.2 110.6 1,786.8 0.0 16.0 35.0 47.9 16.5 82.2 2,583.5 23.9 533.5 273.6 497.3 7,869.2
Source:Reserve Bank of Zimbabwe,2017
Notes
1.Government securities includes treasuary bills and bonds
2.Includes bankers acceptances, discounted bills and negotiable certificates of deposits.
3.Includes households, other financial corporations,
Debt Securities Loans and Advances
TABLE 2.1: - COMMERCIAL BANKS -ASSETS
US$ millions
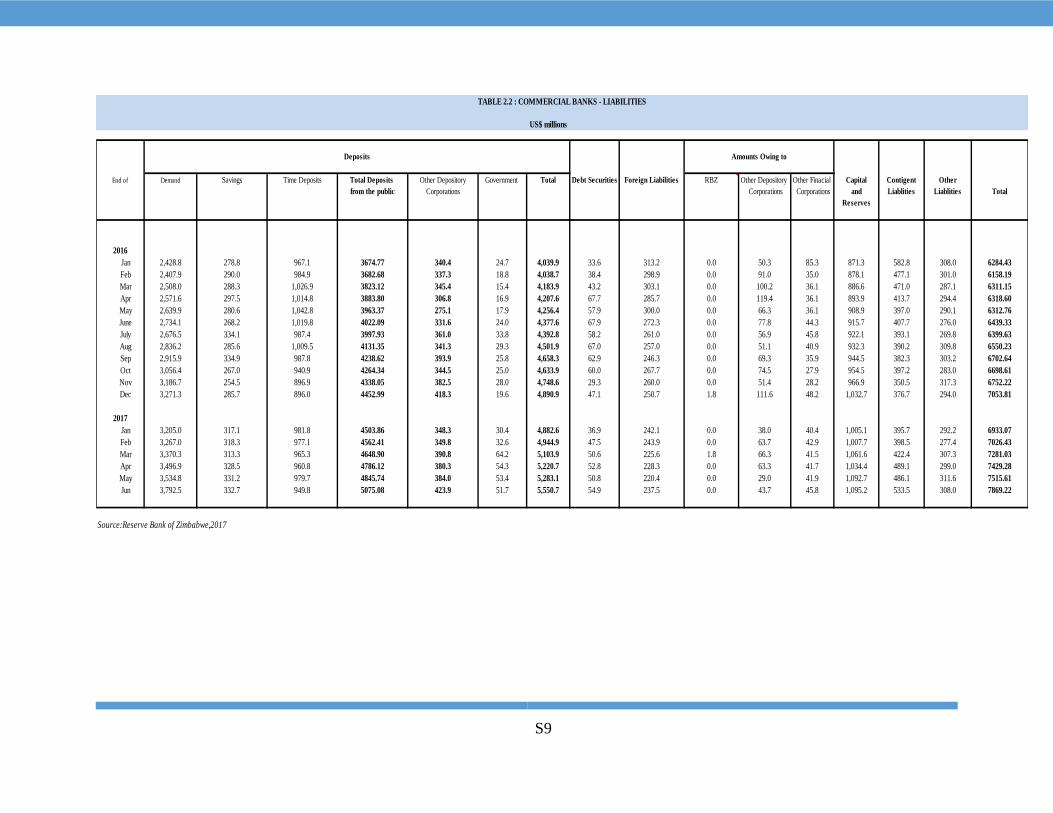
S9
US$ millions
End of Demand Savings Time Deposits Total Deposits Other Depository Government Total Debt Securities Foreign Liabilities RBZ Other Depository Other Finacial Capital Contigent Other
from the public Corporations Corporations Corporations and Liablities Liablities Total
Reserves
2016
Jan 2,428.8 278.8 967.1 3674.77 340.4 24.7 4,039.9 33.6 313.2 0.0 50.3 85.3 871.3 582.8 308.0 6284.43
Feb 2,407.9 290.0 984.9 3682.68 337.3 18.8 4,038.7 38.4 298.9 0.0 91.0 35.0 878.1 477.1 301.0 6158.19
Mar 2,508.0 288.3 1,026.9 3823.12 345.4 15.4 4,183.9 43.2 303.1 0.0 100.2 36.1 886.6 471.0 287.1 6311.15
Apr 2,571.6 297.5 1,014.8 3883.80 306.8 16.9 4,207.6 67.7 285.7 0.0 119.4 36.1 893.9 413.7 294.4 6318.60
May 2,639.9 280.6 1,042.8 3963.37 275.1 17.9 4,256.4 57.9 300.0 0.0 66.3 36.1 908.9 397.0 290.1 6312.76
June 2,734.1 268.2 1,019.8 4022.09 331.6 24.0 4,377.6 67.9 272.3 0.0 77.8 44.3 915.7 407.7 276.0 6439.33
July 2,676.5 334.1 987.4 3997.93 361.0 33.8 4,392.8 58.2 261.0 0.0 56.9 45.8 922.1 393.1 269.8 6399.63
Aug 2,836.2 285.6 1,009.5 4131.35 341.3 29.3 4,501.9 67.0 257.0 0.0 51.1 40.9 932.3 390.2 309.8 6550.23
Sep 2,915.9 334.9 987.8 4238.62 393.9 25.8 4,658.3 62.9 246.3 0.0 69.3 35.9 944.5 382.3 303.2 6702.64
Oct 3,056.4 267.0 940.9 4264.34 344.5 25.0 4,633.9 60.0 267.7 0.0 74.5 27.9 954.5 397.2 283.0 6698.61
Nov 3,186.7 254.5 896.9 4338.05 382.5 28.0 4,748.6 29.3 260.0 0.0 51.4 28.2 966.9 350.5 317.3 6752.22
Dec 3,271.3 285.7 896.0 4452.99 418.3 19.6 4,890.9 47.1 250.7 1.8 111.6 48.2 1,032.7 376.7 294.0 7053.81
2017
Jan 3,205.0 317.1 981.8 4503.86 348.3 30.4 4,882.6 36.9 242.1 0.0 38.0 40.4 1,005.1 395.7 292.2 6933.07
Feb 3,267.0 318.3 977.1 4562.41 349.8 32.6 4,944.9 47.5 243.9 0.0 63.7 42.9 1,007.7 398.5 277.4 7026.43
Mar 3,370.3 313.3 965.3 4648.90 390.8 64.2 5,103.9 50.6 225.6 1.8 66.3 41.5 1,061.6 422.4 307.3 7281.03
Apr 3,496.9 328.5 960.8 4786.12 380.3 54.3 5,220.7 52.8 228.3 0.0 63.3 41.7 1,034.4 489.1 299.0 7429.28
May 3,534.8 331.2 979.7 4845.74 384.0 53.4 5,283.1 50.8 220.4 0.0 29.0 41.9 1,092.7 486.1 311.6 7515.61
Jun 3,792.5 332.7 949.8 5075.08 423.9 51.7 5,550.7 54.9 237.5 0.0 43.7 45.8 1,095.2 533.5 308.0 7869.22
Source:Reserve Bank of Zimbabwe,2017
TABLE 2.2 : COMMERCIAL BANKS - LIABILITIES
Deposits Amounts Owing to
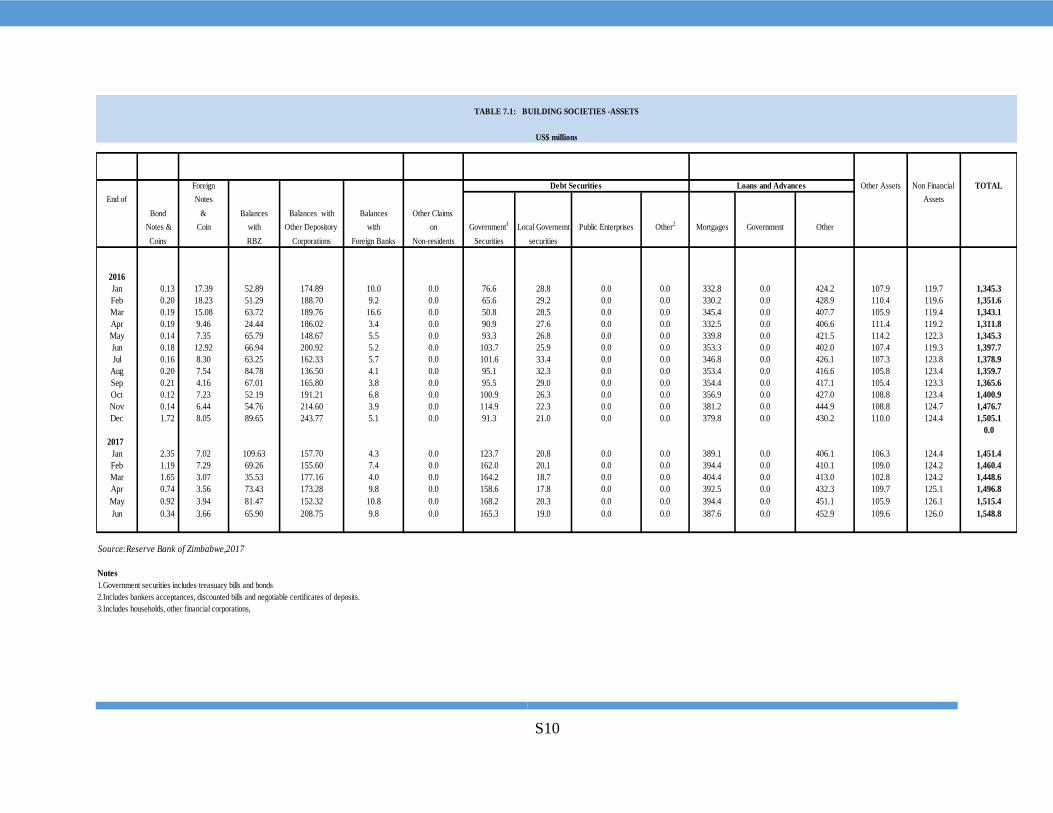
S10
Foreign Other Assets Non Financial TOTAL
End of Notes Assets
Bond & Balances Balances with Balances Other Claims
Notes & Coin with Other Depository with on Government1
Local Governemt Public Enterprises Other2
Mortgages Government Other
Coins RBZ Corporations Foreign Banks Non-residents Securities securities
2016
Jan 0.13 17.39 52.89 174.89 10.0 0.0 76.6 28.8 0.0 0.0 332.8 0.0 424.2 107.9 119.7 1,345.3
Feb 0.20 18.23 51.29 188.70 9.2 0.0 65.6 29.2 0.0 0.0 330.2 0.0 428.9 110.4 119.6 1,351.6
Mar 0.19 15.08 63.72 189.76 16.6 0.0 50.8 28.5 0.0 0.0 345.4 0.0 407.7 105.9 119.4 1,343.1
Apr 0.19 9.46 24.44 186.02 3.4 0.0 90.9 27.6 0.0 0.0 332.5 0.0 406.6 111.4 119.2 1,311.8
May 0.14 7.35 65.79 148.67 5.5 0.0 93.3 26.8 0.0 0.0 339.8 0.0 421.5 114.2 122.3 1,345.3
Jun 0.18 12.92 66.94 200.92 5.2 0.0 103.7 25.9 0.0 0.0 353.3 0.0 402.0 107.4 119.3 1,397.7
Jul 0.16 8.30 63.25 162.33 5.7 0.0 101.6 33.4 0.0 0.0 346.8 0.0 426.1 107.3 123.8 1,378.9
Aug 0.20 7.54 84.78 136.50 4.1 0.0 95.1 32.3 0.0 0.0 353.4 0.0 416.6 105.8 123.4 1,359.7
Sep 0.21 4.16 67.01 165.80 3.8 0.0 95.5 29.0 0.0 0.0 354.4 0.0 417.1 105.4 123.3 1,365.6
Oct 0.12 7.23 52.19 191.21 6.8 0.0 100.9 26.3 0.0 0.0 356.9 0.0 427.0 108.8 123.4 1,400.9
Nov 0.14 6.44 54.76 214.60 3.9 0.0 114.9 22.3 0.0 0.0 381.2 0.0 444.9 108.8 124.7 1,476.7
Dec 1.72 8.05 89.65 243.77 5.1 0.0 91.3 21.0 0.0 0.0 379.8 0.0 430.2 110.0 124.4 1,505.1
0.0
2017
Jan 2.35 7.02 109.63 157.70 4.3 0.0 123.7 20.8 0.0 0.0 389.1 0.0 406.1 106.3 124.4 1,451.4
Feb 1.19 7.29 69.26 155.60 7.4 0.0 162.0 20.1 0.0 0.0 394.4 0.0 410.1 109.0 124.2 1,460.4
Mar 1.65 3.07 35.53 177.16 4.0 0.0 164.2 18.7 0.0 0.0 404.4 0.0 413.0 102.8 124.2 1,448.6
Apr 0.74 3.56 73.43 173.28 9.8 0.0 158.6 17.8 0.0 0.0 392.5 0.0 432.3 109.7 125.1 1,496.8
May 0.92 3.94 81.47 152.32 10.8 0.0 168.2 20.3 0.0 0.0 394.4 0.0 451.1 105.9 126.1 1,515.4
Jun 0.34 3.66 65.90 208.75 9.8 0.0 165.3 19.0 0.0 0.0 387.6 0.0 452.9 109.6 126.0 1,548.8
Source:Reserve Bank of Zimbabwe,2017
Notes
1.Government securities includes treasuary bills and bonds
2.Includes bankers acceptances, discounted bills and negotiable certificates of deposits.
3.Includes households, other financial corporations,
TABLE 7.1: BUILDING SOCIETIES -ASSETS
US$ millions
Debt Securities Loans and Advances
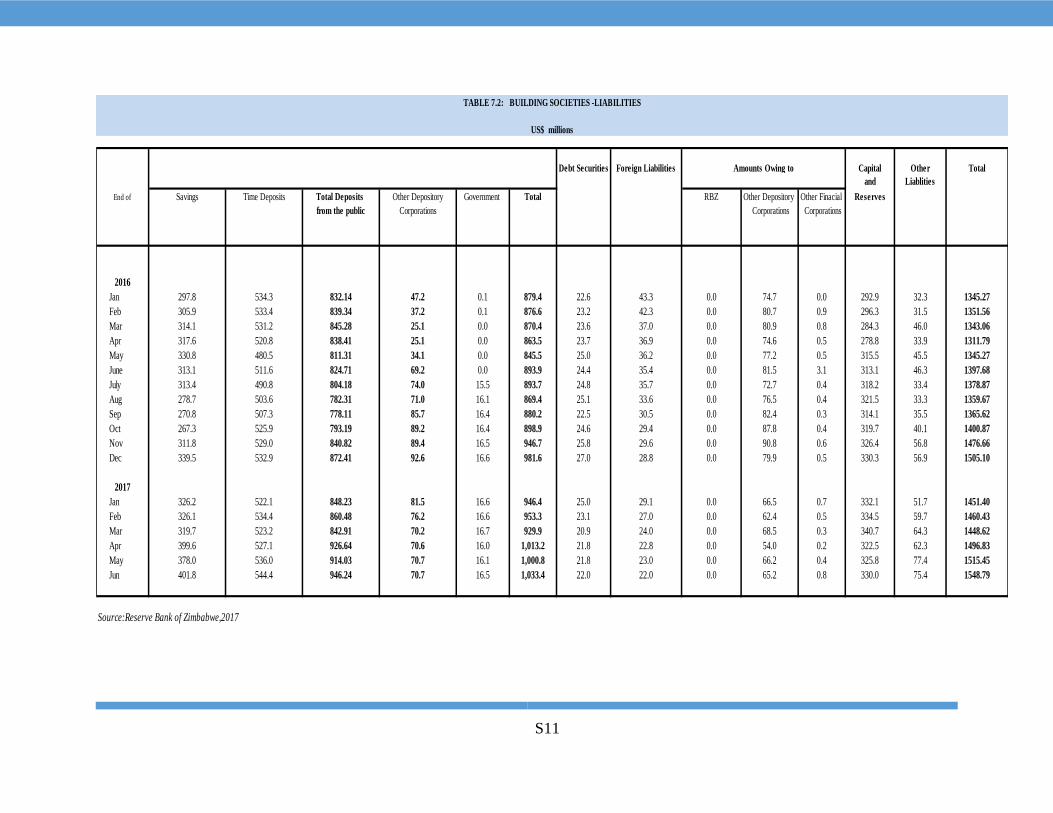
S11
Debt Securities Foreign Liabilities Capital Other Total
and Liablities
End of Savings Time Deposits Total Deposits Other Depository Government Total RBZ Other Depository Other Finacial Reserves
from the public Corporations Corporations Corporations
2016
Jan 297.8 534.3 832.14 47.2 0.1 879.4 22.6 43.3 0.0 74.7 0.0 292.9 32.3 1345.27
Feb 305.9 533.4 839.34 37.2 0.1 876.6 23.2 42.3 0.0 80.7 0.9 296.3 31.5 1351.56
Mar 314.1 531.2 845.28 25.1 0.0 870.4 23.6 37.0 0.0 80.9 0.8 284.3 46.0 1343.06
Apr 317.6 520.8 838.41 25.1 0.0 863.5 23.7 36.9 0.0 74.6 0.5 278.8 33.9 1311.79
May 330.8 480.5 811.31 34.1 0.0 845.5 25.0 36.2 0.0 77.2 0.5 315.5 45.5 1345.27
June 313.1 511.6 824.71 69.2 0.0 893.9 24.4 35.4 0.0 81.5 3.1 313.1 46.3 1397.68
July 313.4 490.8 804.18 74.0 15.5 893.7 24.8 35.7 0.0 72.7 0.4 318.2 33.4 1378.87
Aug 278.7 503.6 782.31 71.0 16.1 869.4 25.1 33.6 0.0 76.5 0.4 321.5 33.3 1359.67
Sep 270.8 507.3 778.11 85.7 16.4 880.2 22.5 30.5 0.0 82.4 0.3 314.1 35.5 1365.62
Oct 267.3 525.9 793.19 89.2 16.4 898.9 24.6 29.4 0.0 87.8 0.4 319.7 40.1 1400.87
Nov 311.8 529.0 840.82 89.4 16.5 946.7 25.8 29.6 0.0 90.8 0.6 326.4 56.8 1476.66
Dec 339.5 532.9 872.41 92.6 16.6 981.6 27.0 28.8 0.0 79.9 0.5 330.3 56.9 1505.10
2017
Jan 326.2 522.1 848.23 81.5 16.6 946.4 25.0 29.1 0.0 66.5 0.7 332.1 51.7 1451.40
Feb 326.1 534.4 860.48 76.2 16.6 953.3 23.1 27.0 0.0 62.4 0.5 334.5 59.7 1460.43
Mar 319.7 523.2 842.91 70.2 16.7 929.9 20.9 24.0 0.0 68.5 0.3 340.7 64.3 1448.62
Apr 399.6 527.1 926.64 70.6 16.0 1,013.2 21.8 22.8 0.0 54.0 0.2 322.5 62.3 1496.83
May 378.0 536.0 914.03 70.7 16.1 1,000.8 21.8 23.0 0.0 66.2 0.4 325.8 77.4 1515.45
Jun 401.8 544.4 946.24 70.7 16.5 1,033.4 22.0 22.0 0.0 65.2 0.8 330.0 75.4 1548.79
Source:Reserve Bank of Zimbabwe,2017
TABLE 7.2: BUILDING SOCIETIES -LIABILITIES
US$ millions
Amounts Owing to

S12
A GR IC U LTU R E C ON S TR U C TION C OM M U N IC A TION D IS TR IB U TION F IN A N C IA L F IN A N C IA L M A N U F A C TU R IN G M IN IN G S ER V IC ES TR A N S P OR T IN D IV ID U A LSC ON GLOM ER A TES
TOTA L
End of IN V ES TM EN T OR GA N IS A TION S
2009 110,230.4 12,406.6 10,948.3 151,169.9 345.0 32,093.2 116,375.5 36,259.7 35,593.3 12,726.1 23,212.5 1,016.1 542,376.7
2010 238,969.8 24,075.5 15,855.7 225,277.0 384.6 72,693.1 218,621.4 71,729.9 112,325.2 22,015.6 86,980.6 1,122.1 1,090,050.4
2011 366,827.1 36,043.9 24,836.9 323,322,2 3,720.8 87,963.3 310,488.5 75,310.4 191,534.5 55,295.7 180,205.0 4,726.2 1,660,274.6
2012 444,341.0 32,622.8 37,353.2 428,782.2 8,513.2 31,513.9 414,044.9 148,927.9 233,864.4 33,116.1 288,628.5 9,370.9 2,111,078.9
2013 533,165.2 42,285.1 17,617.9 435,613.1 5,047.0 62,165.8 389,181.2 115,404.6 379,809.3 37,409.1 369,838.8 18,252.9 2,405,790.0
2014 565,840.1 46,298.5 42,604.8 437,975.3 47,805.8 88,485.5 478,895.5 220,501.3 481,497.5 43,449.8 543,038.5 5,957.7 3,002,529.6
2015 590,610.6 30,958.8 44,706.5 366,799.2 13,354.6 87,897.5 450,208.5 163,452.9 475,424.5 40,154.3 518,998.3 527.5 2,783,093.0
2016
Jan 577,684.4 35,033.6 35,535.9 379,618.2 13,329.2 68,325.8 476,677.0 158,150.5 410,992.6 40,295.6 535,379.3 380.2 2,731,402.2
Feb 539,562.8 35,885.1 37,857.4 374,835.1 13,285.9 63,301.8 473,970.3 155,889.4 415,520.6 40,862.5 531,789.5 365.3 2,683,125.7
Mar 586,349.7 39,180.5 41,037.5 371,809.6 13,397.9 63,061.4 444,769.1 156,209.2 402,900.5 44,606.7 588,882.7 410.7 2,752,615.5
Apr 527,545.8 46,612.5 40,624.2 379,572.0 13,428.1 69,469.7 437,795.4 142,682.1 421,335.6 43,921.4 645,037.3 9,410.0 2,777,434.0
May 522,239.8 40,194.4 38,496.8 358,042.5 13,280.8 65,381.2 439,295.5 145,180.0 401,304.1 41,908.5 651,719.3 9,579.0 2,726,621.9
Jun 510,016.8 39,316.9 36,866.1 361,138.1 12,764.5 68,850.3 433,145.3 143,595.6 476,484.5 42,179.6 650,071.4 9,739.2 2,784,168.3
Jul 501,744.6 43,266.6 12,746.6 287,960.5 11,403.0 64,344.7 423,354.4 141,639.6 489,050.6 40,059.9 652,366.8 9,804.6 2,677,741.9
Aug 498,489.6 43,265.5 26,005.4 295,108.0 11,957.4 69,959.8 423,824.7 139,556.7 458,763.3 44,237.3 636,726.8 10,497.1 2,658,391.5
Sep 487,504.2 42,900.7 20,644.2 338,165.8 11,960.4 154,582.0 409,891.0 142,259.6 400,059.8 40,609.7 636,000.8 11,273.3 2,695,851.6
Oct 513,303.7 44,348.8 23,814.1 333,709.5 11,968.6 70,984.3 418,465.3 152,571.6 456,867.4 45,511.4 637,546.1 11,122.2 2,720,213.0
Nov 526,709.8 42,580.2 22,481.4 338,556.1 11,358.7 72,491.9 413,849.2 152,092.3 464,279.4 42,762.1 641,080.5 10,545.5 2,738,787.0
Dec 436,452.3 41,297.5 19,541.4 311,503.1 11,668.9 327,576.0 377,945.5 134,516.0 415,801.6 36,867.2 613,022.6 10,287.7 2,736,479.6
2017
Jan 448,344.7 41,732.8 22,069.3 264,734.2 12,019.3 270,117.2 350,757.1 144,447.3 394,945.0 40,975.0 591,245.7 11,489.3 2,592,877.1
Feb 436,206.2 40,112.3 24,467.5 269,358.3 12,146.8 272,314.8 361,416.8 143,990.4 373,445.1 40,250.7 568,686.3 11,227.9 2,553,623.0
Mar 425,496.8 54,688.4 25,533.4 275,500.1 12,241.8 290,985.3 349,722.5 159,101.0 359,672.5 37,864.1 572,233.3 13,047.7 2,576,086.9
Apr 426,696.6 43,836.6 18,145.2 340,025.3 12,219.1 271,824.0 360,945.8 134,101.0 350,475.1 42,208.4 571,000.5 12,492.9 2,583,970.5
May 428,874.0 43,427.0 16,689.0 322,695.4 12,252.6 269,976.3 360,929.9 117,479.9 354,102.7 41,337.5 569,798.9 11,923.7 2,549,487.0
Jun 431,677.5 45,018.0 16,989.2 311,641.4 14,435.6 266,917.5 343,590.2 126,542.8 417,469.8 37,849.5 595,749.5 12,001.6 2,619,882.5
Source:Reserve Bank of Zimbabwe,2017
TABLE 8.1: Sectoral Analysis of Commerical Banks' Loans and Advances
US$ Thousands

S13
AGRICULTURE CONSTRUCTION COMMUNICATION DISTRIBUTION FINANCIAL FINANCIAL MANUFACTURING MINING SERVICES TRANSPORT INDIVIDUALS CONGLOMERATES TOTAL
End of INVESTMENT ORGANISATIONS
2009 61,792.7 6,467.2 35,365.8 81,470.7 45,127.5 68,001.8 111,397.9 30,218.3 480,954.6 14,728.8 180,117.5 3,415.5 1,119,058.5
2010 113,727.1 13,189.9 52,087.1 195,080.2 84,886.8 146,548.7 144,660.9 67,916.4 504,291.2 17,349.7 300,489.1 5,962.4 1,646,189.5
2011 120,665.7 35,860.2 107,439.2 295,439.3 94,854.2 277,933.7 267,305.3 69,436.0 518,311.2 24,462.2 444,051.7 15,849.9 2,271,608.5
2012 96,098.4 50,492.7 126,343.5 379,068.0 198,323.3 509,241.6 280,975.4 95,457.1 582,286.2 41,852.2 538,135.2 26,491.3 2,924,764.8
2013 94,346.3 52,722.4 141,401.4 338,625.9 223,223.8 754,145.4 339,305.6 99,583.3 754,116.1 41,527.2 440,197.9 97,771.1 3,376,966.4
2014 147,242.4 60,358.1 118,725.7 328,729.5 325,746.6 950,304.9 290,329.3 118,977.8 964,815.0 47,574.3 638,061.1 92,040.8 4,082,906.3
2015 196,092.9 88,273.0 102,636.9 518,411.4 336,909.2 864,491.7 307,845.0 63,337.5 1,163,771.1 57,410.5 639,985.6 66,435.7 4,405,600.5
2016
Jan 231,827.3 101,724.1 93,544.2 517,089.2 325,203.1 977,272.1 345,812.2 62,026.3 1,083,702.7 61,755.6 618,080.1 58,808.7 4,476,845.6
Feb 226,568.3 105,747.9 97,684.4 525,070.9 339,839.0 896,869.2 326,026.0 59,381.3 1,047,904.6 63,248.3 634,478.3 63,017.8 4,385,835.9
Mar 243,546.9 102,238.4 116,471.1 582,943.5 362,058.8 879,340.8 368,689.6 60,514.0 402,900.5 62,839.4 642,779.4 61,037.6 4,556,027.1
Apr 243,151.6 102,234.0 112,219.5 569,660.7 360,299.5 907,855.6 335,068.6 71,721.0 1,156,122.6 63,858.0 628,901.1 61,087.0 4,612,179.4
May 236,180.5 97,008.6 120,726.3 593,284.9 371,034.5 923,580.9 356,500.9 99,176.4 1,107,956.8 61,396.5 607,501.4 64,066.3 4,638,413.9
Jun 218,386.8 103,914.2 134,181.8 596,904.8 362,400.2 973,333.3 316,490.8 58,856.9 1,128,688.7 72,063.3 601,813.8 61,833.2 4,628,867.8
Jul 207,280.2 99,727.9 138,781.2 616,359.8 348,779.7 1,035,697.0 370,456.9 63,986.1 1,114,413.7 65,391.9 622,329.2 69,058.9 4,752,262.6
Aug 233,004.5 97,248.8 153,590.8 578,487.3 365,366.8 997,123.0 356,522.0 64,413.7 1,227,979.0 67,005.8 621,307.8 73,076.2 4,835,125.8
Sep 236,724.3 101,117.1 155,483.5 597,290.0 346,375.9 1,046,195.2 366,312.8 57,885.0 1,365,673.5 73,805.9 595,219.8 70,669.7 5,012,752.7
Oct 239,373.9 107,235.7 160,641.2 593,362.2 344,681.9 988,274.7 363,815.8 63,998.0 1,384,083.2 76,834.0 593,827.7 73,608.8 4,989,737.2
Nov 318,652.7 107,089.5 189,581.3 501,506.5 329,147.3 992,135.7 411,467.8 150,691.6 1,337,295.6 79,405.2 591,639.0 71,016.3 5,079,628.6
Dec 258,814.9 110,009.2 202,260.4 590,595.6 348,457.0 1,020,795.0 382,615.8 81,542.7 1,466,867.2 82,186.5 592,932.5 76,874.9 5,213,951.8
2017
Jan 236,437.3 108,552.5 230,965.4 618,213.5 339,580.3 1,002,775.4 382,746.3 86,115.0 1,393,941.2 82,670.8 589,549.9 85,602.3 5,157,150.0
Feb 254,463.9 112,294.4 226,877.9 613,080.1 312,948.5 997,181.2 393,542.8 121,798.7 1,402,647.6 91,521.7 604,325.0 84,653.3 5,215,335.3
Mar 299,519.0 118,530.1 232,990.6 626,986.6 308,297.9 1,049,255.7 402,864.2 170,835.1 1,400,323.5 102,287.7 610,024.4 91,046.0 5,412,960.9
Apr 281,219.8 117,174.3 235,093.5 687,962.2 307,711.4 1,013,362.6 400,018.9 190,005.8 1,432,953.1 110,258.7 650,595.9 102,681.0 5,529,037.2
May 301,531.2 113,685.5 220,541.8 679,781.4 320,878.2 1,019,941.1 417,418.5 175,383.4 1,454,718.3 108,366.5 667,019.7 71,770.2 5,551,035.8
Jun 295,920.4 109,938.0 248,436.3 712,648.0 334,368.7 1,121,023.5 408,604.0 185,262.3 1,521,876.3 107,327.1 697,997.7 74,195.4 5,817,597.8
Source:Reserve Bank of Zimbabwe,2017
TABLE 8.2: Sectoral Analysis of Commercial Banks' Deposits
US$ Thousands

S14
End of ZETSS CHEQ UE PO S ATM MO BILE INTERNET End of ZETSS CHEQ UE PO S ATM MO BILE INTERNET
2016 2016
Jan 3,385.87 11.10 137.39 331.52 388.89 167.68 Jan 132.26 24.62 1,328.93 1,104.45 19,956.07 49.89
Feb 3,448.15 11.86 138.75 312.12 389.26 167.93 Feb 148.42 30.26 1,289.46 1,067.13 19,793.73 54.57
Mar 3,460.22 11.26 142.08 288.82 417.13 255.93 Mar 152.47 29.65 1,455.70 962.91 21,731.49 61.86
Apr 3,564.32 9.65 180.12 247.60 427.29 168.31 Apr 161.73 24.97 1,962.64 841.34 21,086.57 59.85
May 3,869.19 10.83 214.79 203.25 479.93 217.91 May 199.26 29.11 2,779.90 675.85 23,292.99 83.15
Jun 3,870.19 10.27 203.90 131.40 465.10 174.10 Jun 268.19 33.50 3,203.80 741.94 23,321.17 87.96
Jul 3,911.78 9.19 240.04 166.30 491.22 218.04 Jul 242.37 31.08 3,946.34 1,052.84 24,538.83 102.75
Aug 3,928.66 7.92 238.03 165.92 535.39 230.62 Aug 253.94 27.77 4,038.12 1,156.38 26,009.65 109.49
Sep 4,382.93 10.48 237.25 167.66 533.91 215.92 Sep 288.52 32.49 4,421.91 1,188.53 27,299.97 99.96
Oct 4,127.64 7.99 322.79 112.49 524.46 216.05 Oct 296.00 29.19 6,247.39 1,106.36 29,801.73 117.90
Nov 4,624.70 6.90 363.40 84.50 537.20 229.90 Nov 353.00 30.60 8,691.20 1086,9 28,542.10 128.80
Dec 4,882.61 5.62 479.86 71.92 626.08 265.12 Dec 405.38 24.23 13,042.06 1,347.98 33,211.84 155.86
Annual
Total47,456.27 113.06 2,898.40 2,283.51 5,815.85 2,527.50
Annual
Total 2,901.53 347.45 52,407.46 11,245.68 298,586.15 1,112.04
2017 2017
Jan 4,052.71 7.48 368.71 70.42 495.55 318.91 Jan 350.02 26.67 12,756.29 1,173.56 27,550.09 190.96
Feb 4,246.60 7.00 327.30 58.40 472.30 324.10 Feb 326.30 27.80 8,952.00 953.50 26,820.10 207.00
Mar 4,629.80 7.40 392.20 58.80 671.60 399.70 Mar 414.20 31.00 11,124.00 944.30 35,604.10 244.10
Apr 4,178.80 4.80 466.90 39.30 792.50 337.60 Apr 363.70 21.60 13,595.50 652.90 40,089.00 231.00
May 4,974.00 6.50 557.80 44.70 939.90 618.70 May 531.80 27.80 16,623.40 820.60 47,019.10 323.30
Jun 5,346.45 6.28 558.85 34.63 1,095.55 500.28 Jun 524.99 29.31 17,466.16 696.87 53,738.12 342.14
Source:Reserve Bank of Zimbabwe,2017
TABLE 9.1 : ZETSS AND RETAIL PAYMENTS TRANSACTIONAL ACTIVITY
Values of Transactions (US$ in millions)
TABLE 9.2 : ZETSS AND RETAIL PAYMENTS TRANSACTIONAL ACTIVITY
Volumes of Transactions (in thousands)
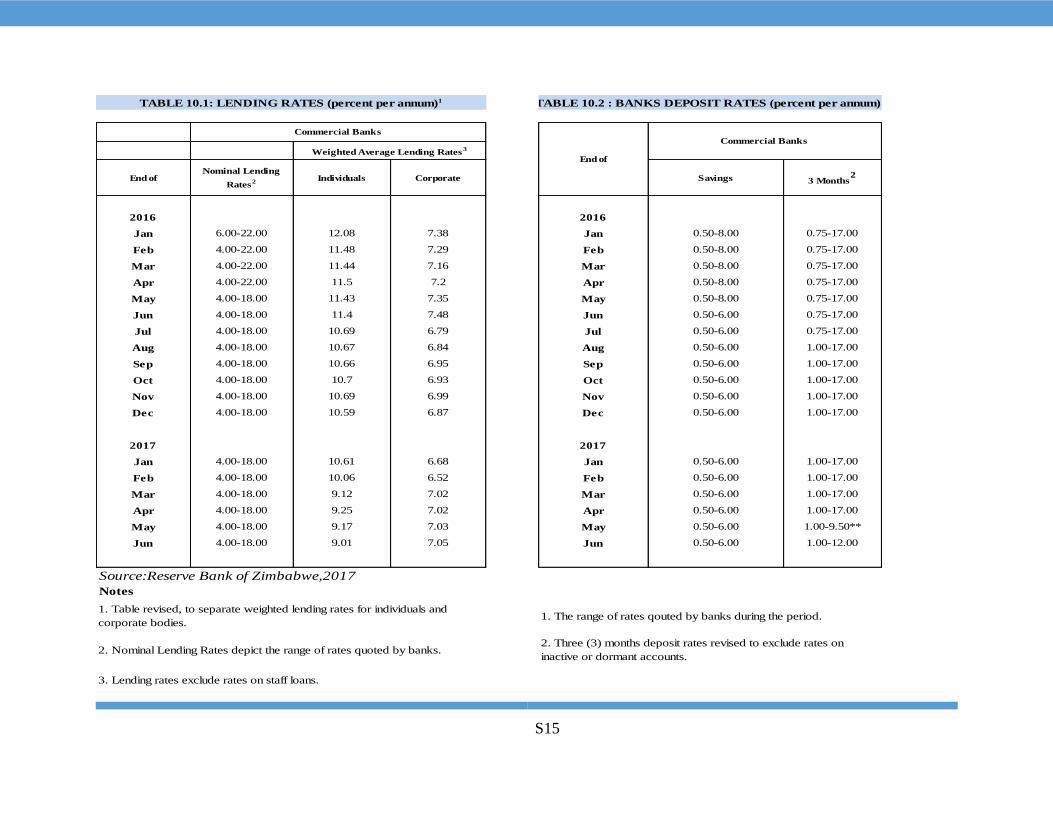
S15
End ofNominal Lending
Rates2 Individuals Corporate Savings 3 Months
2
2016 2016
Jan 6.00-22.00 12.08 7.38 Jan 0.50-8.00 0.75-17.00
Feb 4.00-22.00 11.48 7.29 Feb 0.50-8.00 0.75-17.00
Mar 4.00-22.00 11.44 7.16 Mar 0.50-8.00 0.75-17.00
Apr 4.00-22.00 11.5 7.2 Apr 0.50-8.00 0.75-17.00
May 4.00-18.00 11.43 7.35 May 0.50-8.00 0.75-17.00
Jun 4.00-18.00 11.4 7.48 Jun 0.50-6.00 0.75-17.00
Jul 4.00-18.00 10.69 6.79 Jul 0.50-6.00 0.75-17.00
Aug 4.00-18.00 10.67 6.84 Aug 0.50-6.00 1.00-17.00
Sep 4.00-18.00 10.66 6.95 Sep 0.50-6.00 1.00-17.00
Oct 4.00-18.00 10.7 6.93 Oct 0.50-6.00 1.00-17.00
Nov 4.00-18.00 10.69 6.99 Nov 0.50-6.00 1.00-17.00
Dec 4.00-18.00 10.59 6.87 Dec 0.50-6.00 1.00-17.00
2017 2017
Jan 4.00-18.00 10.61 6.68 Jan 0.50-6.00 1.00-17.00
Feb 4.00-18.00 10.06 6.52 Feb 0.50-6.00 1.00-17.00
Mar 4.00-18.00 9.12 7.02 Mar 0.50-6.00 1.00-17.00
Apr 4.00-18.00 9.25 7.02 Apr 0.50-6.00 1.00-17.00
May 4.00-18.00 9.17 7.03 May 0.50-6.00 1.00-9.50**
Jun 4.00-18.00 9.01 7.05 Jun 0.50-6.00 1.00-12.00
Source:Reserve Bank of Zimbabwe,2017
Notes
3. Lending rates exclude rates on staff loans.
TABLE 10.2 : BANKS DEPOSIT RATES (percent per annum)1
1. The range of rates qouted by banks during the period.
2. Three (3) months deposit rates revised to exclude rates on
inactive or dormant accounts.
TABLE 10.1: LENDING RATES (percent per annum)1
1. Table revised, to separate weighted lending rates for individuals and
corporate bodies.
2. Nominal Lending Rates depict the range of rates quoted by banks.
Weighted Average Lending Rates3
Commercial BanksCommercial Banks
End of

S16
End of Industrial Mining Volume of Shares Market Turnover Market Capitalisation
2016
Jan 103.04 19.53 61,882,767 10,399,904.0 2,790.40
Feb 99.4 19.14 95,020,938 15,556,983.0 2,692.30
Mar 97.17 19.53 97,601,725 16,428,571.0 2,645.06
Apr 105.79 20.16 187,848,946 14,026,917.0 2,862.61
May 104.7 25.54 99,055,230 13,868,486.0 2,881.34
Jun 101.04 24.70 88,525,472.0 18,064,624.0 2,780.90
Jul 98.84 25.72 57,222,624.0 11,838,626.0 2,772.04
Aug 99.47 26.32 41,264,438.0 7,075,762.0 2,734.33
Sep 98.96 26.61 68,329,516.0 13,049,388.8 2,725.13
Oct 120.80 33.80 177,384,684.0 22,649,152.2 3,328.30
Nov 137.08 57.38 233,749,377.0 23,460,016.0 3,804.60
Dec 144.53 58.51 292,538,969.0 25,996,903.3 4,007.96
2017
Jan 140.24 56.31 8.6 31,616,982.0 3,903.70
Feb 135.31 56.47 11.5 85,314,995.0 3,770.00
Mar 138.96 58.56 26.9 145,238,255.0 3,871.20
Apr 142.96 66.33 11,204,422.2 75,857,712.0 4,182,796,106.00
May 162.34 69.63 16,829,770.0 170,830,515.0 4,740,101,598.00
Jun 195.97 69.79 39,747,342.2 311,145,262.0 5,695,198,739.00
Source: Zimbabwe Stock Exchange (ZSE),2017
Indices US$ Millions
TABLE 11: ZIMBABWE STOCK MARKET STATISTICS

S17
FOOD
INFLATION ALL
ALCOHOLIC
BEVERAGES CLOTHING HSING, WATER, FURNITURE HEALTH TRANSPORT COMMUNICATION RECREATION & EDUCATION
RESTAURANTS
& MISC.
TOTAL
NON FOOD & ITEMS
& TOBACCO FOOTWEAR
ELECTRICTY,
GAS AND CULTURE HOTELS GOODS &
FOOD NON
ALCOHOLIC
BEVERAGES
& OTHER EQUIPMENT SERVICES
FUELS
WEIGHTS 4.38 6.05 17.74 9.91 2.16 9.76 3.41 2.1 5.67 1.38 3.91 66.47 33.53 100
2014 0.1 0.0 0.0 -0.2 0.1 0.1 0.0 0.0 0.4 -0.1 -0.2 -0.2 -0.2 -0.1
2015 -0.4 -0.2 0.2 -0.1 -0.1 -0.3 0.0 0.1 0.0 -0.1 -0.3 -0.1 -0.2 -0.1
2016
Jan 0.05 -0.02 -0.04 -0.30 -0.15 -0.37 0.00 -0.18 0.00 -0.16 -0.29 -0.13 0.13 -0.05
Feb -0.14 0.00 -0.12 -0.19 -0.17 -0.37 -0.13 -0.01 0.00 -0.17 0.06 -0.14 -0.03 -0.10
Mar -0.15 -0.17 -1.03 -0.73 -0.13 -0.30 0.42 -0.04 3.36 -0.62 -0.60 -0.11 -0.13 -0.12
Apr 0.03 -0.14 -0.02 -0.32 0.00 0.07 -0.08 -0.02 -0.01 -0.09 -0.35 -0.08 -0.51 -0.21
May -0.29 -0.22 0.12 -0.11 -0.18 -0.11 -1.61 0.06 0.00 0.02 -0.33 -0.12 -0.49 -0.24
Jun 0.07 -0.21 0.58 0.03 0.15 -0.08 -0.01 -0.23 2.65 0.31 0.09 0.44 -0.35 0.19
Jul 0.01 -0.15 0.04 0.05 -0.15 -0.03 -0.36 0.09 0.00 0.04 -0.30 -0.03 -0.52 -0.19
Aug -0.06 -0.22 0.00 -0.03 -0.02 -0.13 -0.02 -0.10 0.00 0.01 0.13 -0.04 -0.31 -0.13
Sep 0.10 -0.03 -1.11 -0.27 -0.03 -0.08 -0.09 -0.26 0.00 0.01 0.10 -0.34 -0.06 -0.26
Oct -0.05 -0.24 -0.13 0.06 -0.03 -0.06 0.00 -0.01 0.00 -0.06 0.17 -0.05 0.40 0.09
Nov -0.06 -0.09 0.00 0.10 -0.07 0.33 0.00 0.18 -2.46 -0.01 0.14 -0.22 0.54 0.02
Dec -0.06 0.09 -0.59 0.46 0.09 -0.27 0.00 0.29 0.00 0.16 0.34 -0.09 0.38 0.06
2017
Jan 0.00 -0.15 0.10 0.34 -0.15 -0.75 0.44 0.27 0.00 0.29 0.08 -0.03 0.80 0.23
Feb -0.09 -0.14 0.13 0.70 -0.03 0.11 0.00 -0.04 0.00 0.18 0.52 0.17 1.56 0.61
Mar 0.15 0.03 -0.07 0.64 0.11 0.21 -0.02 0.18 0.00 0.01 0.36 0.15 -0.21 0.03
Apr -0.11 0.02 0.04 0.06 -0.04 0.00 0.05 0.02 2.02 0.34 -0.07 0.25 -0.36 0.05
May 0.13 0.09 -0.01 0.02 0.13 0.04 0.00 -0.21 0.00 -0.39 -0.09 0.01 0.07 0.03
Jun 0.21 0.03 -0.82 0.38 -0.03 -0.18 0.00 0.18 0.00 0.29 0.33 -0.14 -0.45 -0.24
Source :ZIMSTATS, 2017
NON-FOOD INFLATION
TABLE 12.1 : MONTHLY INFLATION -- PERCENTAGE CHANGE IN CONSUMER PRICE INDEX
( DECEMBER 2012 = 100)

S18
FOOD
INFLATION ALL
ALCOHOLIC
BEVERAGES CLOTHING HSING, WATER, FURNITURE HEALTH TRANSPORT COMMUNICATION RECREATION & EDUCATION
RESTAURANT
S & MISC. TOTAL NON FOOD & ITEMS
& TOBACCO FOOTWEAR ELECTRICTY, GAS AND CULTURE HOTELS GOODS &
FOOD NON
ALCOHOLIC
BEVERAGES
& OTHER EQUIPMENT SERVICES
FUELS
WEIGHTS 4.38 6.05 17.74 9.91 2.16 9.76 3.41 2.10 5.67 1.38 3.91 66.47 33.53 100.00
2014 0.2 0.0 -0.1 -0.5 0.2 0.3 -0.1 -0.1 2.2 -0.3 -0.6 0.1 -0.6 -0.1
2015 -1.0 -0.6 0.1 -0.6 0.5 -0.8 -0.2 -0.1 2.8 -0.3 -0.2 0.0 -0.7 -0.2
2016
Jan -0.5 -0.4 0.1 -0.6 -0.2 -0.7 -0.3 -0.1 2.8 -0.3 -0.6 0.0 0.0 0.0
Feb -0.5 -0.2 0.0 -0.6 -0.4 -1.0 -0.2 -0.1 0.0 -0.3 -0.6 -0.3 -0.1 -0.3
Mar -0.2 -0.2 -1.2 -1.2 -0.4 -1.0 0.3 -0.2 3.4 -0.9 -0.9 -0.4 0.0 -0.3
Apr -0.3 -0.3 -1.2 -1.2 -0.3 -0.6 0.2 -0.1 3.3 -0.8 -1.0 -0.3 -0.7 -0.4
May -0.4 -0.5 -0.9 -1.2 -0.3 -0.3 -1.3 0.0 3.4 -0.7 -1.3 -0.3 -1.1 -0.6
Jun -0.2 -0.6 0.7 -0.4 0.0 -0.1 -1.7 -0.2 2.6 0.2 -0.6 0.2 -1.3 -0.3
Jul -0.2 -0.6 0.7 0.0 -0.2 -0.2 -2.0 -0.1 2.7 0.4 -0.5 0.3 -1.4 -0.2
Aug 0.0 -0.6 0.6 0.1 0.0 -0.2 -0.4 -0.3 2.7 0.4 -0.1 0.4 -1.2 -0.1
Sep 0.1 -0.4 -1.1 -0.3 -0.2 -0.2 -0.5 -0.3 0.0 0.1 -0.1 -0.4 -0.9 -0.6
Oct 0.0 -0.5 -1.2 -0.2 -0.1 -0.3 -0.1 -0.4 0.0 0.0 0.4 -0.4 0.0 -0.3
Nov 0.1 -0.4 -1.2 -0.1 -0.1 0.2 -0.1 -0.1 -2.5 -0.1 0.4 -0.6 0.9 -0.1
Dec 0.0 -0.2 -0.7 0.6 0.0 0.0 0.0 0.5 -2.5 0.1 0.6 -0.4 1.3 0.2
2017
Jan 0.0 -0.1 -0.5 0.9 -0.1 -0.7 0.4 0.7 -2.5 0.4 0.6 -0.3 1.7 0.3
Feb -0.1 -0.2 -0.4 1.5 -0.1 -0.9 0.4 0.5 0.0 0.6 0.9 0.1 2.8 0.9
Mar 0.1 -0.3 0.2 1.7 -0.1 -0.4 0.4 0.4 0.0 0.5 1.0 0.3 2.2 0.9
Apr -0.1 -0.1 0.1 1.4 0.0 0.3 0.0 0.2 2.0 0.5 0.8 0.6 1.0 0.7
May 0.2 0.2 0.0 0.7 0.2 0.3 0.0 0.0 2.0 0.0 0.2 0.4 -0.5 0.1
Jun 0.2 0.1 -0.8 0.5 0.1 -0.1 0.0 0.0 2.0 0.2 0.2 0.1 -0.7 -0.2
Source :ZIMSTATS, 2017
TABLE 12.2 : QUARTERLY INFLATION -- PERCENTAGE CHANGE IN CONSUMER PRICE INDEX
( DECEMBER 2012 = 100)
NON-FOOD INFLATION

S19
FOOD INFLATION ALL
ALCOHOLIC
BEVERAGES
CLOTHING HSING, WATER, FURNITURE HEALTH TRANSPORT COMMUNIC
ATION
RECREATION & EDUCATION RESTAURAN
TS &
MISC. TOTAL
NON
FOOD & ITEMS
& TOBACCO FOOTWEAR ELECTRICTY,
GAS
AND CULTURE HOTELS GOODS & FOOD NON ALCOHOLIC
BEVERAGES
& OTHER EQUIPMENT SERVICES
FUELS
WEIGHTS 4.38 6.05 17.74 9.91 2.16 9.76 3.41 2.1 5.67 1.38 3.91 66.47 33.53 100
2014 2.1 -0.5 1.1 -2.2 0.7 0.6 -4.4 -0.9 18.4 1.2 -1.9 1.4 -3.2 -0.1
2015 -0.9 -2.4 -4.3 -2.9 0.6 -3.2 -14.2 -0.9 11.1 0.4 -0.4 -1.9 -3.7 -2.5
2016
Jan -0.8 -2.4 -4.4 -3.3 0.4 -2.7 -0.9 -1.1 11.2 0.8 -1.0 -1.3 -4.0 -2.2
Feb -1.2 -2.1 -4.4 -3.4 0.2 -2.6 -1.0 0.2 11.2 1.0 -1.17 -1.4 -4.0 -2.2
Mar -1.4 -2.0 -5.4 -4.0 0.1 -2.9 -0.6 -1.0 14.9 0.2 -1.86 -1.4 -4.1 -2.3
Apr -1.4 -1.4 -2.1 -3.9 0.2 -2.7 -0.5 -0.9 14.2 -0.3 -2.17 -0.5 -4.0 -1.6
May -1.5 -1.2 -2.2 -3.8 -0.1 -2.6 -2.1 -0.8 14.2 -0.2 -2.07 -0.5 -4.1 -1.7
Jun -1.8 -1.4 -1.6 -3.7 0.2 -2.7 -2.1 -0.9 17.2 0.2 -2.09 -0.1 -4.0 -1.4
Jul -1.7 -1.6 -1.0 -2.8 -0.1 -2.7 -2.4 -0.7 9.1 0.3 -2.4 -0.6 -3.8 -1.6
Aug -1.5 -1.8 -1.0 -2.7 -0.1 -2.5 -2.4 -0.5 9.1 0.4 -2.21 -0.5 -3.3 -1.4
Sep -1.4 -1.8 -1.5 -2.5 -0.1 -2.2 -2.1 -0.8 9.1 -0.8 -1.82 -0.6 -2.9 -1.3
Oct -1.0 -1.7 -1.5 -2.1 -0.8 -1.8 -2.1 -0.7 9.1 -0.7 -1.77 -0.5 -2.0 -1.0
Nov -0.8 -1.6 -1.5 -1.8 -0.8 -1.4 -1.9 -0.4 3.5 -0.7 -1.62 -0.9 -1.5 -1.1
Dec -0.4 -1.4 -2.3 -1.3 -0.7 -1.4 -1.9 -0.2 3.5 -0.5 -0.99 -0.9 -1.0 -0.9
2017
Jan -0.47 -1.52 -2.16 -0.62 -0.68 -1.76 -1.44 0.20 3.49 -0.02 -0.6 -0.82 -0.30 -0.65
Feb -0.42 -1.66 -1.91 0.26 -0.53 -1.29 -1.31 0.18 3.49 0.24 -0.05 -0.51 1.29 0.06
Mar -0.13 -1.45 -0.95 1.64 -0.30 -0.79 -1.74 0.40 0.12 0.87 0.92 -0.25 1.21 0.21
Apr -0.26 -1.29 -0.89 2.03 -0.33 -0.86 -1.61 0.44 2.16 1.30 1.21 0.08 1.35 0.48
May 0.15 -0.98 -1.01 2.16 -0.01 -0.71 0.00 0.17 2.16 0.88 1.46 0.21 1.92 0.75
Jun 0.29 -0.74 -2.39 2.52 -0.19 -0.81 0.00 0.59 -0.48 0.86 1.70 -0.37 1.82 0.31
Source :ZIMSTATS, 2017
TABLE 12.3 : ANNUAL INFLATION -- PERCENTAGE CHANGE IN CONSUMER PRICE INDEX
( DECEMBER 2012 = 100)
NON-FOOD INFLATION
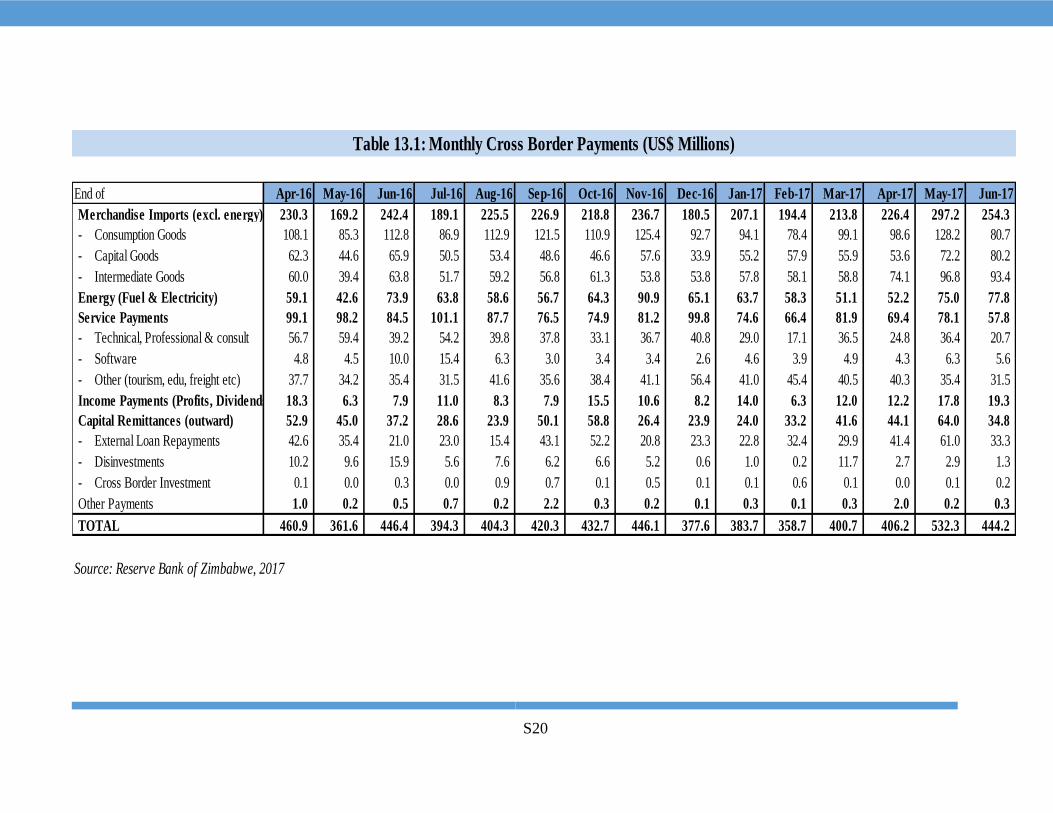
S20
End of Apr-16 May-16 Jun-16 Jul-16 Aug-16 Sep-16 Oct-16 Nov-16 Dec-16 Jan-17 Feb-17 Mar-17 Apr-17 May-17 Jun-17
Merchandise Imports (excl. energy) 230.3 169.2 242.4 189.1 225.5 226.9 218.8 236.7 180.5 207.1 194.4 213.8 226.4 297.2 254.3
- Consumption Goods 108.1 85.3 112.8 86.9 112.9 121.5 110.9 125.4 92.7 94.1 78.4 99.1 98.6 128.2 80.7
- Capital Goods 62.3 44.6 65.9 50.5 53.4 48.6 46.6 57.6 33.9 55.2 57.9 55.9 53.6 72.2 80.2
- Intermediate Goods 60.0 39.4 63.8 51.7 59.2 56.8 61.3 53.8 53.8 57.8 58.1 58.8 74.1 96.8 93.4
Energy (Fuel & Electricity) 59.1 42.6 73.9 63.8 58.6 56.7 64.3 90.9 65.1 63.7 58.3 51.1 52.2 75.0 77.8
Service Payments 99.1 98.2 84.5 101.1 87.7 76.5 74.9 81.2 99.8 74.6 66.4 81.9 69.4 78.1 57.8
- Technical, Professional & consult 56.7 59.4 39.2 54.2 39.8 37.8 33.1 36.7 40.8 29.0 17.1 36.5 24.8 36.4 20.7
- Software 4.8 4.5 10.0 15.4 6.3 3.0 3.4 3.4 2.6 4.6 3.9 4.9 4.3 6.3 5.6
- Other (tourism, edu, freight etc) 37.7 34.2 35.4 31.5 41.6 35.6 38.4 41.1 56.4 41.0 45.4 40.5 40.3 35.4 31.5
Income Payments (Profits, Dividends) 18.3 6.3 7.9 11.0 8.3 7.9 15.5 10.6 8.2 14.0 6.3 12.0 12.2 17.8 19.3
Capital Remittances (outward) 52.9 45.0 37.2 28.6 23.9 50.1 58.8 26.4 23.9 24.0 33.2 41.6 44.1 64.0 34.8
- External Loan Repayments 42.6 35.4 21.0 23.0 15.4 43.1 52.2 20.8 23.3 22.8 32.4 29.9 41.4 61.0 33.3
- Disinvestments 10.2 9.6 15.9 5.6 7.6 6.2 6.6 5.2 0.6 1.0 0.2 11.7 2.7 2.9 1.3
- Cross Border Investment 0.1 0.0 0.3 0.0 0.9 0.7 0.1 0.5 0.1 0.1 0.6 0.1 0.0 0.1 0.2
Other Payments 1.0 0.2 0.5 0.7 0.2 2.2 0.3 0.2 0.1 0.3 0.1 0.3 2.0 0.2 0.3
TOTAL 460.9 361.6 446.4 394.3 404.3 420.3 432.7 446.1 377.6 383.7 358.7 400.7 406.2 532.3 444.2
Source: Reserve Bank of Zimbabwe, 2017
Table 13.1: Monthly Cross Border Payments (US$ Millions)

S21
Agriculture Horticulture Manufacturing Mining Tobacco Tourism Transport & Other Services Total
End of Telecom
Jan-16 10.4 1.9 12.0 149.9 121.6 0.0 15.3 3.4 314.5
Feb-16 15.4 2.2 11.3 64.6 42.5 4.9 20.6 1.9 163.4
Mar-16 15.5 2.2 10.5 202.9 29.9 4.7 23.0 7.9 296.6
Apr-16 7.9 2.9 7.2 69.2 84.3 9.9 12.3 0.2 193.9
May-16 9.2 2.3 13.0 206.9 21.9 14.5 20.2 0.2 288.2
Jun-16 6.9 1.7 9.2 101.4 18.4 13.2 18.4 4.0 173.2
Jul-16 8.6 2.1 9.1 258.2 6.8 13.1 12.4 2.3 312.6
Aug-16 15.3 4.8 8.2 187.6 10.2 16.1 21.4 1.0 264.6
Sep-16 13.8 5.8 8.6 151.5 9.7 19.1 19.8 3.1 231.4
Oct-16 6.5 3.9 9.5 179.1 50.2 18.2 17.0 2.4 286.8
Nov-16 10.6 3.1 7.3 113.0 66.1 7.9 14.6 4.2 226.8
Dec-16 7.9 1.3 6.3 112.2 46.1 16.5 11.3 2.4 204.1
Jan-17 4.8 0.6 6.5 170.6 94.0 7.2 16.0 2.8 302.5
Feb-17 7.5 1.1 8.8 189.4 77.9 7.6 13.0 1.8 307.1
Mar-17 9.8 1.9 11.3 223.4 36.7 9.6 14.5 5.3 312.5
Apr-17 10.8 0.9 9.2 194.1 12.4 10.5 12.8 6.2 256.9
May-17 12.1 2.4 8.3 183.9 15.4 10.7 12.2 1.6 246.6
Jun-17 19.8 4.4 11.7 224.8 31.4 12.0 10.2 6.2 320.5
Jul-17 15.6 5.2 9.2 167.6 48.4 11.6 5.4 1.2 264.2
Source: Reserve Bank of Zimbabwe, 2017
Table 13.2: Monthly Cross Border Receipts (US$Millions)

S22
(US$ millions)
End Period 2000 2001 2002 2003 2004 2005 2006 2007 2008 2009 2010 2011 2012 2013 2014 2015 2016
Long-Term External Debt 3,227 3,255 3,327 3,644 3,927 3,805 3,965 4,032 4,464 4,951 5,175 6,096 6,607 7,370 8,444 8,426 8,656
Government 2,249 2,328 2,376 2,617 2,844 2,895 3,024 3,054 3,464 4,037 4,095 4,638 4,929 5,012 4,522 5,293 5,365
Bilateral Creditors 1,050 1,115 1,107 1,255 1,455 1,438 1,520 1,520 1,863 2,308 2,325 2,597 2,694 2,928 2,445 3,310 3,479
Multilateral Creditors 1,199 1,213 1,269 1,362 1,389 1,457 1,504 1,524 1,592 1,729 1,770 2,041 2,235 2,084 2,078 1,982 1,886
Private Creditors 0 0 0 0 0 0 0 10 10 0 0 0 0 0 0 0 0
Public Enterprises 534 568 616 698 714 709 766 790 825 857 938 1,092 1,198 1,356 1,661 1,220 1,370
Bilateral Creditors 301 315 351 403 442 439 464 474 497 453 238 711 703 858 1,155 760 779
Multilateral Creditors 233 253 265 295 272 270 302 316 327 403 700 382 495 498 506 460 591
Private Creditors 0 0 0 0 0 0 0 0 0 0 0 0 0 0 0 0 0
Monetary Authorities 292 292 279 288 291 144 130 137 140 140 138 127 125 125 120 110 0
Multilateral Creditors - IMF 292 292 279 288 291 144 130 137 140 140 138 127 125 125 120 110 0
Private 152 67 56 41 78 57 45 51 35 57 142 366 480 1,002 2,261 1,913 1,920
Short-Term External Debt 298 167 183 169 144 173 281 387 226 1,198 1,382 1,289 890 1,564 2,394 2,258 2,304
Supplier's Credits 42 13 26 51 69 107 122 178 41 193 286 134 30 0 0 0 0
Reserve Bank 642 642 618 614 614 587 587 573
Private 256 154 157 118 75 66 159 209 185 363 454 537 246 950 1,807 1,671 1,731
Total External Debt 3,525 3,422 3,510 3,812 4,071 3,978 4,246 4,419 4,690 6,149 6,557 7,385 7,497 8,934 10,838 10,684 10,960
Source: Ministry of Finance & Economic Development, 2017; & Reserve Bank of Zimbabwe, 2017
TABLE 14.1: ZIMBABWE: EXTERNAL DEBT OUTSTANDING BY DEBTOR (INCLUDING ALL ARREARS)

S23
End of 2001 2002 2003 2004 2005 2006 2007 2008 2009 2010 2011 2012 2013 2014 2015 2016
(US$ millions)
Total Medium to Long-Term External Debt 3,255 3,327 3,644 3,927 3,805 3,965 4,032 4,464 5,091 5,313 6,096 6,607 7,370 8,444 8,426 8,656
Public and Publicly Guaranteed Debt 3,188 3,271 3,603 3,849 3,748 3,920 3,981 4,429 5,676 5,813 6,345 6,742 6,982 6,768 7,100 7,308
Bilateral Creditors 1,430 1,458 1,658 1,897 1,877 1,984 1,994 2,360 2,761 2,563 3,307 3,397 3,786 3,479 3,960 3,479
Multilateral Creditors 1,758 1,813 1,945 1,952 1,871 1,936 1,976 2,059 2,272 2,608 2,423 2,730 2,582 2,704 2,553 1,886
Private Creditors 0 0 0 0 0 0 10 10 0 0 0 0 0 0 0 0
Private Non-Guaranteed Long term 67 56 41 78 57 45 51 35 57 142 366 480 1,002 2,261 1,913 1,920
Short-Term External Debt 167 183 169 144 173 281 387 226 1198 1382 1,286 891 1,564 2,394 2,258 2,304
Public and Publicly Guaranteed Debt 13 26 51 69 107 122 178 41 193 286 134 30 0 0 0 0
Reserve Bank - - - - - - - - 642 642 615 615 614 587 587 573
Private 154 157 118 75 66 159 209 185 363 454 537 246 950 1,807 1,671 1,731
Total External Debt 3,422 3,510 3,812 4,071 3,978 4,246 4,419 4,690 6,289 6,695 7,382 7,498 8,934 10,838 10,684 10,960
Gross Domestic Product 10,887 6,715 5,037 4,299 2,918 6,645 4,000 3,175 8157 9457 10,956 12,472 12,973 14,068 13,891 14,160
External Debt / GDP 31.4% 52.3% 75.7% 94.7% 136.3% 63.9% 110.5% 147.7% 77.1% 70.8% 67.4% 60.1% 68.9% 77.0% 76.9% 77.4%
Source: Ministry of Finance & Economic Development, 2017 ; Reserve Bank of Zimbabwe, 2017
TABLE 14.2: External Debt Outstanding by Source
(US$ millions)
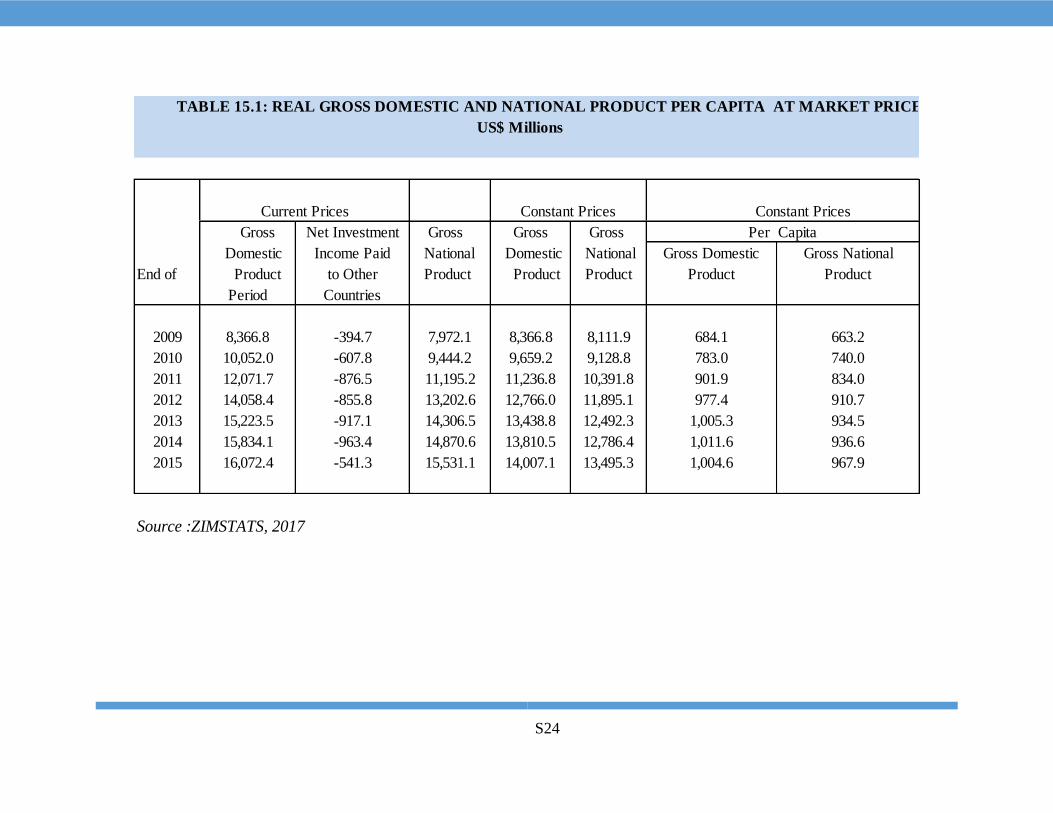
S24
US$ Millions
Gross Net Investment Gross Gross Gross
Domestic Income Paid National Domestic National Gross Domestic Gross National
End of Product to Other Product Product Product Product Product
Period Countries
2009 8,366.8 -394.7 7,972.1 8,366.8 8,111.9 684.1 663.2
2010 10,052.0 -607.8 9,444.2 9,659.2 9,128.8 783.0 740.0
2011 12,071.7 -876.5 11,195.2 11,236.8 10,391.8 901.9 834.0
2012 14,058.4 -855.8 13,202.6 12,766.0 11,895.1 977.4 910.7
2013 15,223.5 -917.1 14,306.5 13,438.8 12,492.3 1,005.3 934.5
2014 15,834.1 -963.4 14,870.6 13,810.5 12,786.4 1,011.6 936.6
2015 16,072.4 -541.3 15,531.1 14,007.1 13,495.3 1,004.6 967.9
Source :ZIMSTATS, 2017
Current Prices Constant Prices Constant Prices
Per Capita
TABLE 15.1: REAL GROSS DOMESTIC AND NATIONAL PRODUCT PER CAPITA AT MARKET PRICES

S25
Agriculture Mining Electricity Finance Distribution Transport Public
Hunting and and Manufacturing and Construction and Real Hotels and and Administration Domestic Other
End of Fishing Quarrying Water Insurance Estate Restaurants Communication Education Health Services Services Total
2009 1,038.4 560.8 1,066.2 278.5 136.7 571.6 110.5 1,207.1 1,080.1 323.6 301.2 68.6 35.2 342.8 7,099.1
2010 1,157.2 802.4 1,108.8 358.8 182.2 618.8 126.3 1,375.8 1,137.0 540.4 656.8 130.3 38.4 390.2 8,587.7
2011 1,222.1 1,006.3 1,293.5 436.4 288.5 703.6 193.2 1,397.2 1,320.1 910.5 948.3 205.6 40.6 453.4 10,369.0
2012 1,376.8 1,063.6 1,419.8 448.3 376.2 942.6 302.9 1,601.3 1,333.5 1,272.2 1,326.5 279.4 40.2 416.4 12,132.4
2013 1,364.0 1,186.5 1,457.0 492.1 398.6 1,072.5 340.5 1,909.1 1,374.0 1,300.7 1,523.6 313.5 43.0 399.9 13,098.5
2014 1,704.9 1,157.0 1,450.0 546.5 426.0 893.4 385.0 1,926.7 1,477.7 1,447.5 1,684.2 348.2 44.7 403.6 13,809.3
2015 1,653.8 1,089.4 1,402.0 533.2 426.3 881.6 417.1 1,979.0 1,498.0 1,495.5 1,834.5 395.0 47.0 413.0 13,972.4
Source :ZIMSTATS, 2017
2 . Includes domestic services and allowance for imputed banking service charges .
TABLE 15.2 : GROSS DOMESTIC PRODUCT AT FACTOR COST BY INDUSTRY
US$ Millions
(at current prices )
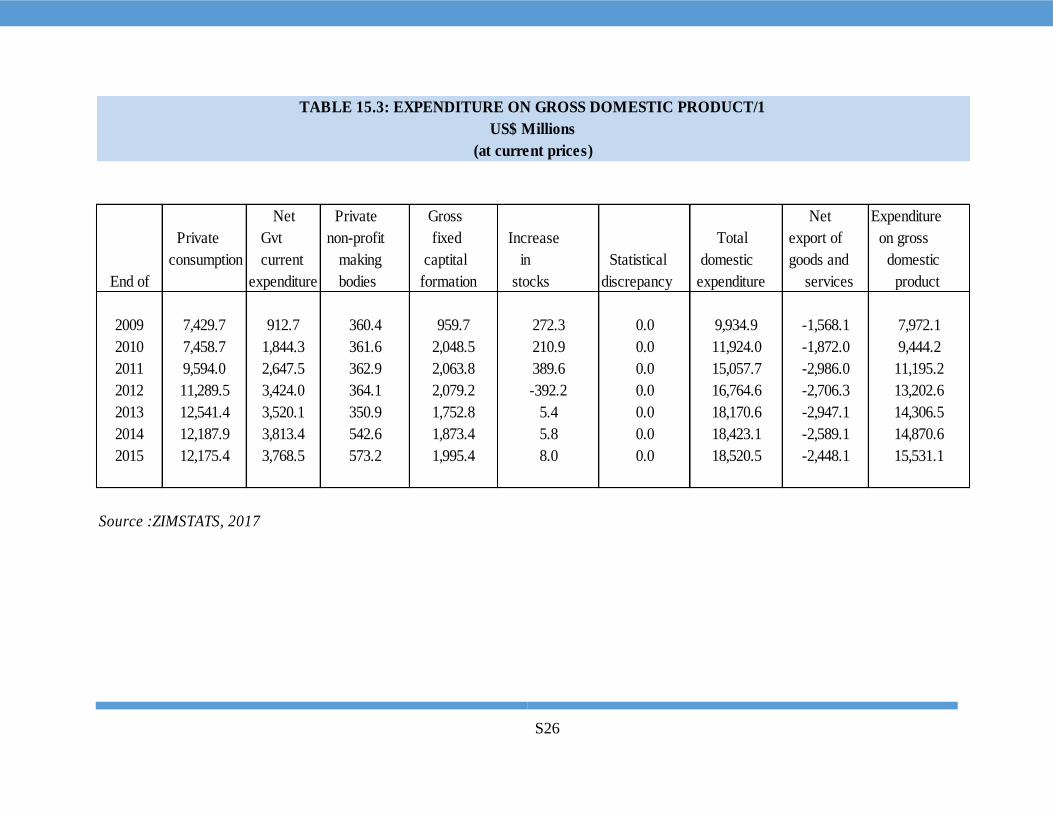
S26
Net Private Gross Net Expenditure
Private Gvt non-profit fixed Increase Total export of on gross
consumption current making captital in Statistical domestic goods and domestic
End of expenditure bodies formation stocks discrepancy expenditure services product
2009 7,429.7 912.7 360.4 959.7 272.3 0.0 9,934.9 -1,568.1 7,972.1
2010 7,458.7 1,844.3 361.6 2,048.5 210.9 0.0 11,924.0 -1,872.0 9,444.2
2011 9,594.0 2,647.5 362.9 2,063.8 389.6 0.0 15,057.7 -2,986.0 11,195.2
2012 11,289.5 3,424.0 364.1 2,079.2 -392.2 0.0 16,764.6 -2,706.3 13,202.6
2013 12,541.4 3,520.1 350.9 1,752.8 5.4 0.0 18,170.6 -2,947.1 14,306.5
2014 12,187.9 3,813.4 542.6 1,873.4 5.8 0.0 18,423.1 -2,589.1 14,870.6
2015 12,175.4 3,768.5 573.2 1,995.4 8.0 0.0 18,520.5 -2,448.1 15,531.1
Source :ZIMSTATS, 2017
(at current prices)
US$ Millions
TABLE 15.3: EXPENDITURE ON GROSS DOMESTIC PRODUCT/1
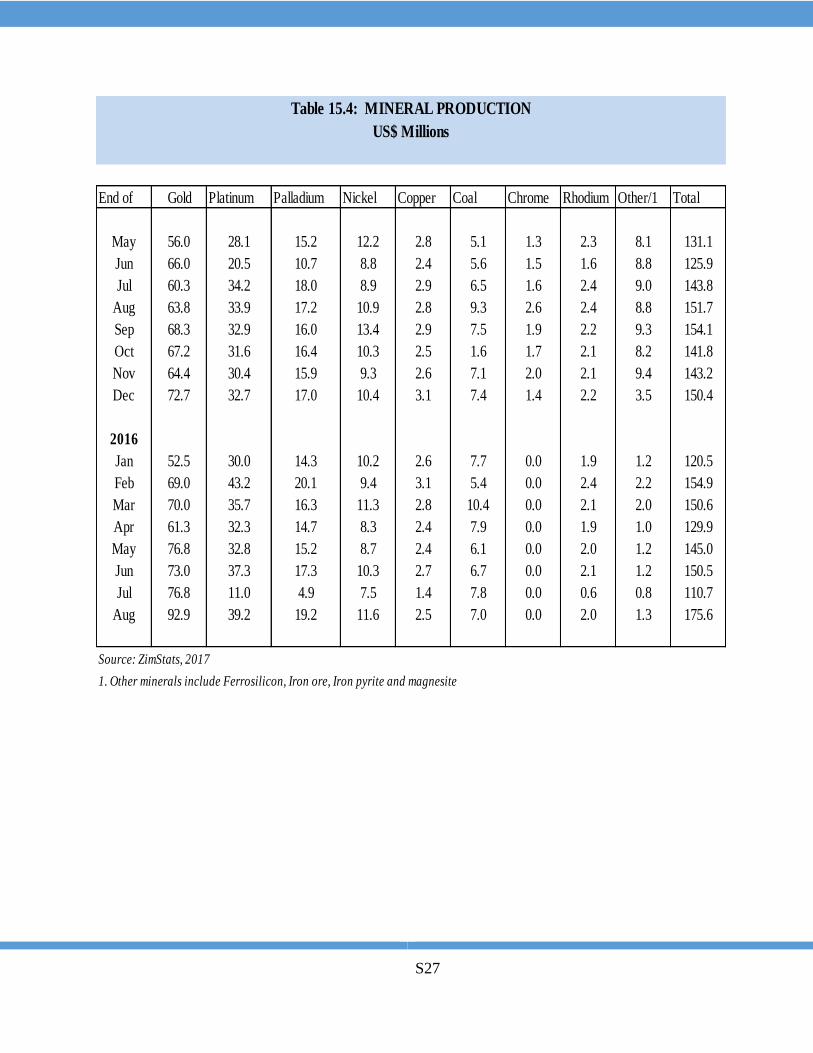
S27
End of Gold Platinum Palladium Nickel Copper Coal Chrome Rhodium Other/1 Total
May 56.0 28.1 15.2 12.2 2.8 5.1 1.3 2.3 8.1 131.1
Jun 66.0 20.5 10.7 8.8 2.4 5.6 1.5 1.6 8.8 125.9
Jul 60.3 34.2 18.0 8.9 2.9 6.5 1.6 2.4 9.0 143.8
Aug 63.8 33.9 17.2 10.9 2.8 9.3 2.6 2.4 8.8 151.7
Sep 68.3 32.9 16.0 13.4 2.9 7.5 1.9 2.2 9.3 154.1
Oct 67.2 31.6 16.4 10.3 2.5 1.6 1.7 2.1 8.2 141.8
Nov 64.4 30.4 15.9 9.3 2.6 7.1 2.0 2.1 9.4 143.2
Dec 72.7 32.7 17.0 10.4 3.1 7.4 1.4 2.2 3.5 150.4
2016
Jan 52.5 30.0 14.3 10.2 2.6 7.7 0.0 1.9 1.2 120.5
Feb 69.0 43.2 20.1 9.4 3.1 5.4 0.0 2.4 2.2 154.9
Mar 70.0 35.7 16.3 11.3 2.8 10.4 0.0 2.1 2.0 150.6
Apr 61.3 32.3 14.7 8.3 2.4 7.9 0.0 1.9 1.0 129.9
May 76.8 32.8 15.2 8.7 2.4 6.1 0.0 2.0 1.2 145.0
Jun 73.0 37.3 17.3 10.3 2.7 6.7 0.0 2.1 1.2 150.5
Jul 76.8 11.0 4.9 7.5 1.4 7.8 0.0 0.6 0.8 110.7
Aug 92.9 39.2 19.2 11.6 2.5 7.0 0.0 2.0 1.3 175.6
Source: ZimStats, 2017
1. Other minerals include Ferrosilicon, Iron ore, Iron pyrite and magnesite
Table 15.4: MINERAL PRODUCTION
US$ Millions

S28
End of
By Hwange
Power station
By Kariba
Power
Station
By Other
Power StationIPPs
Total from
Zimbabwe
2015
Jan 322.2 418.5 49.7 2.6 792.9
Feb 202.0 376.2 44.2 2.6 625.0
Mar 228.6 463.8 50.5 2.6 745.5
Apr 254.7 446.6 42.3 10.8 754.4
May 262.3 492.8 51.3 6.3 812.7
Jun 395.1 465.0 47.5 3.9 911.5
Jul 470.1 470.0 58.4 3.3 1001.8
Aug 369.4 491.7 50.0 2.4 913.5
Sep 357.2 341.0 51.5 2.4 752.1
Oct 339.9 360.1 45.2 1.9 747.1
Nov 382.5 303.6 45.4 2.4 733.9
Dec 361.9 309.9 47.2 1.8 720.8
2016
Jan 367.3 281.5 38.5 3.8 691.1
Feb 284.7 209.6 44.4 5.0 543.7
Mar 313.1 211.7 35.2 11.5 571.5
Apr 312.1 205.1 43.5 12.7 573.6
May 292.5 248.3 40.8 7.5 608.7
Jun 279.3 238.5 31.7 6.1 568.8
Jul 342.2 273.9 3737.0 18.2 609.1
Aug 279.3 242.8 30.3 46.3 661.6
Sep 290.9 234.4 24.7 46.8 596.8
Source: ZIMSTATS, 2017
Table 15.5: Electricity Energy Produced and Distributed
Interconnected System
Generation Sent Out

S29
(2009=100)
Food-stuffs
(including
stockfeeds)
Drink and
Tobacco
Textiles
including
ginning
Clothing
and
Footwear
Wood and
Furniture
Paper,
Printing and
Publishing
Chemical and
Petroleum
Products
Non-metalic
Mineral Products
Metals and
Metal Products
Transport and
Transport
Equipment
Other
Manufacturing
Groups
All
Manufacturing
Groups
Weight 252 118 28 79 24 68 172 46 103 20 89 1000
2014:Jan 86.0 65.7 47.6 82.7 89.2 99.9 90.4 110.7 63.9 60.9 43.6 78.6
Feb 92.8 88.8 64.7 87.1 94.4 115.0 98.7 122.3 76.6 67.5 56.8 89.6
Mar 87.6 83.2 61.3 93.6 86.0 104.2 92.0 108.8 69.7 60.9 48.5 83.8
Apr 93.6 92.7 53.5 92.7 98.6 100.0 92.9 108.5 73.7 65.0 47.3 86.6
May 94.5 87.6 66.8 82.4 83.8 95.0 82.6 114.4 65.3 56.5 56.8 83.5
Jun 98.9 97.9 93.6 88.0 89.7 108.3 94.0 138.5 68.0 58.1 63.3 92.0
Jul 103.9 115.8 124.7 61.0 103.2 92.9 90.4 147.6 69.5 59.2 66.7 93.7
Aug 95.6 113.6 116.1 64.4 101.6 92.0 88.8 142.3 70.1 58.0 65.6 90.7
Sep 117.4 124.7 114.8 85.2 102.6 97.2 88.0 154.0 69.4 60.5 72.4 100.5
Oct 119.5 95.5 99.2 89.9 143.0 79.3 89.3 142.3 74.8 65.0 59.5 96.4
Nov 98.1 109.4 84.4 96.5 163.7 101.1 87.2 153.6 78.3 67.7 97.2 98.6
Dec 105.7 107.9 72.4 81.7 92.5 97.6 89.3 132.0 65.9 58.2 63.1 91.8
2015:Jan 97.3 109.0 67.1 79.1 84.3 97.4 89.7 135.0 66.1 58.6 64.8 89.6
Feb 121.3 121.7 75.3 97.9 179.0 107.3 97.5 153.2 73.5 65.6 74.0 105.7
Mar 105.4 110.3 67.8 91.0 145.7 96.3 85.6 141.0 67.0 59.6 68.0 94.1
Apr 101.4 114.7 69.2 88.4 152.4 99.5 84.9 146.5 70.1 61.5 69.2 94.5
May 104.4 110.9 67.2 85.6 160.2 95.7 82.9 141.1 68.2 59.9 67.0 93.4
Jun 102.4 113.7 67.7 91.2 171.3 97.3 84.1 145.7 70.7 62.5 69.8 95.1
Jul 109.8 105.2 87.6 82.8 146.5 87.4 80.6 149.6 64.5 56.9 82.8 94.5
Aug 113.4 101.1 81.3 85.2 133.1 102.1 94.0 151.7 57.2 57.8 86.2 97.6
Sep 113.7 106.4 89.2 86.8 134.7 101.1 89.0 145.5 64.4 59.3 80.2 97.7
Oct 116.3 104.9 88.9 82.8 142.4 101.9 103.3 154.7 63.8 57.2 81.1 101.0
Nov 109.5 98.3 88.8 86.3 150.3 101.4 120.0 146.8 59.3 59.1 78.2 100.7
Dec 116.2 101.5 84.1 81.6 127.8 99.1 81.5 141.9 45.2 57.3 87.6 94.1
Source:ZIMSTATS ,2017
TABLE 15.6: VOLUME OF MANUFACTURING INDEX (VMI)

S30