Embed Size (px)
Citation preview
Quarter Ending December 31, 2015
©2015 Charles Schwab & Co., Inc. (Member SIPC). All rights reserved. (0216-0843)

The Schwab Self-Directed Brokerage Account Indicators™
Key Schwab Observations for the Fourth Quarter 2015:Asset Balance Summary
The market largely disappointed investors in 2015, with the S&P 500 closing at 2,044 and finishing the year down less than 1% from where it started. The S&P posted declines in earnings for three quarters in a row for the first time in six years. However, in a vote of confidence in the American economy, the Federal Reserve raised short-term interest rates by .25% for the first time since the financial crisis.
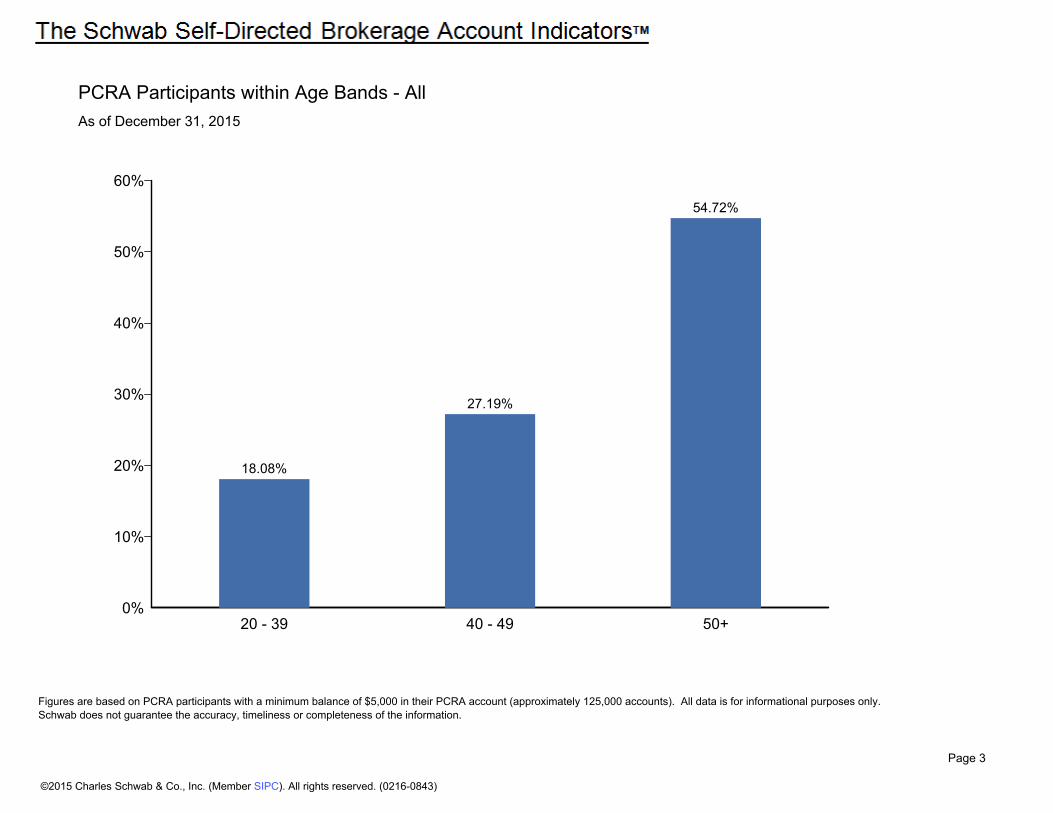
Due to the market volatility, the average participant account balance in the Schwab Personal Choice Retirement Account® (PCRA) was down by 4.9% to $193K from Q4 2014, and down 1.5% from last quarter. Trading volumes were down from last year by 44.3% and 19.3% from Q3. On average, participants held 9 positions in their PCRA, the same as last year. Over half of the participants are aged 50 and over, which has grown by 1.8% since last year.
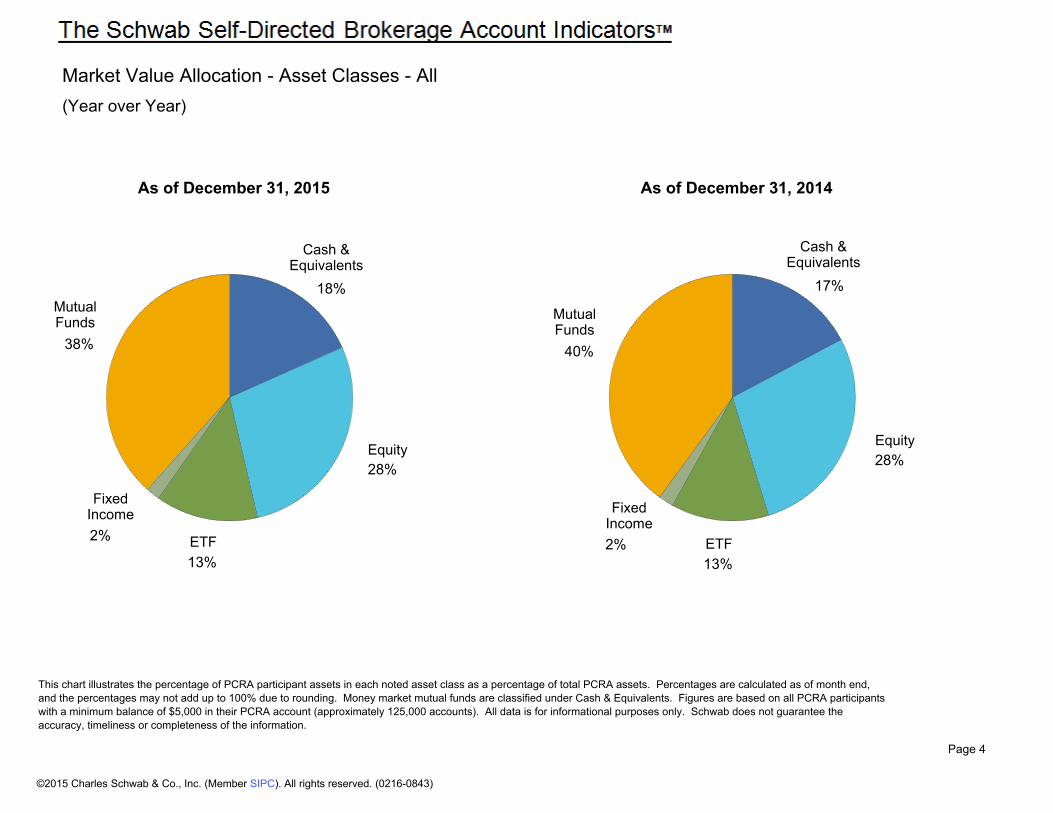
Investing Behavior and General Investing Characteristics Asset Allocation Mutual Funds held the majority of participant assets to the tune of 38%, while Equities were the second largest holding at 28% with Cash & Equivalents coming in at 18%. During the year, the participant holdings remained relatively unchanged, with a small shift of 1% from Cash Equivalents to Mutual Funds.
Equities There were several minor 1% shifts in participant Equity Sector Holdings over the course of the year, including Energy, Consumer Staples, Health Care and Materials sectors. The three largest equity sector holdings remained unchanged from last year. They were Information Technology at 28%, and Consumer Discretionary and Financials, both at 14%. The Healthcare and Industrials sectors followed at 11% and 10% respectively.
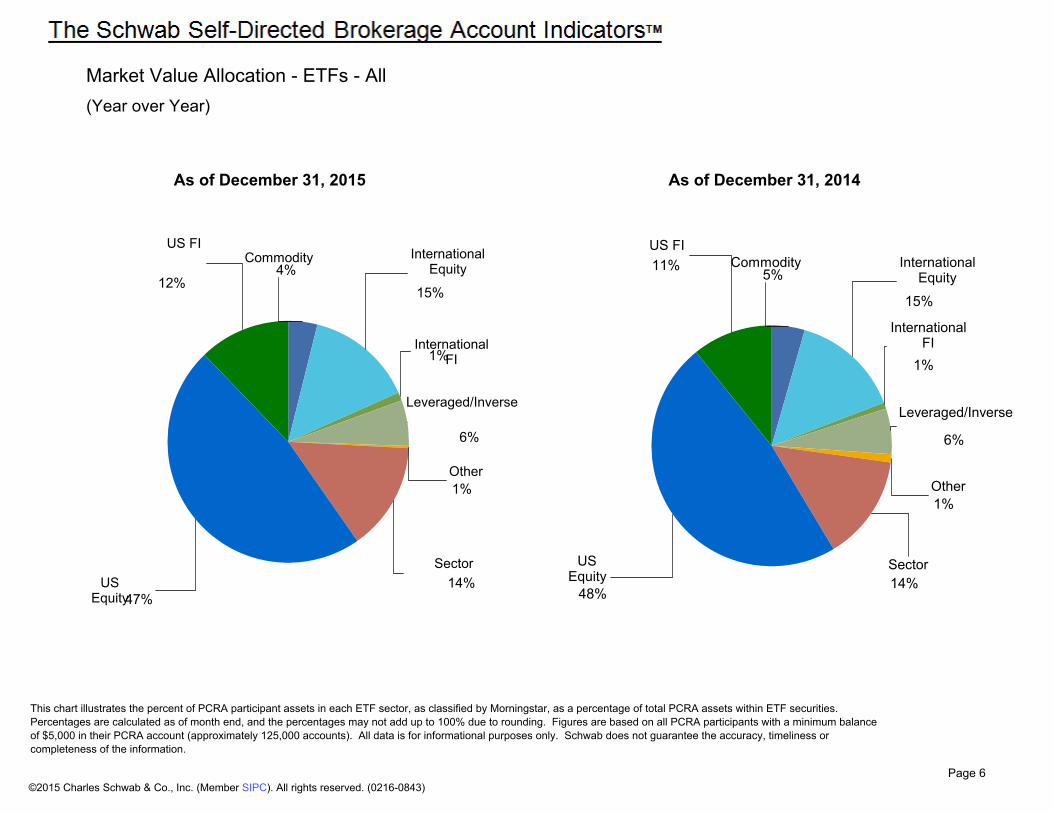
Exchange-Traded Funds (ETFs) Participants shed 1% of their Commodity holdings to 4%. U.S. Equity ETFs, comprised of Large Caps, Mid Caps and Small Caps, continue to be the top ETF holdings in participant accounts at 47%, down 1% from Q4 of 2014, followed by International Equity ETFs at 15%, Sector ETFs at 14% and U.S. Fixed Income at 12%.
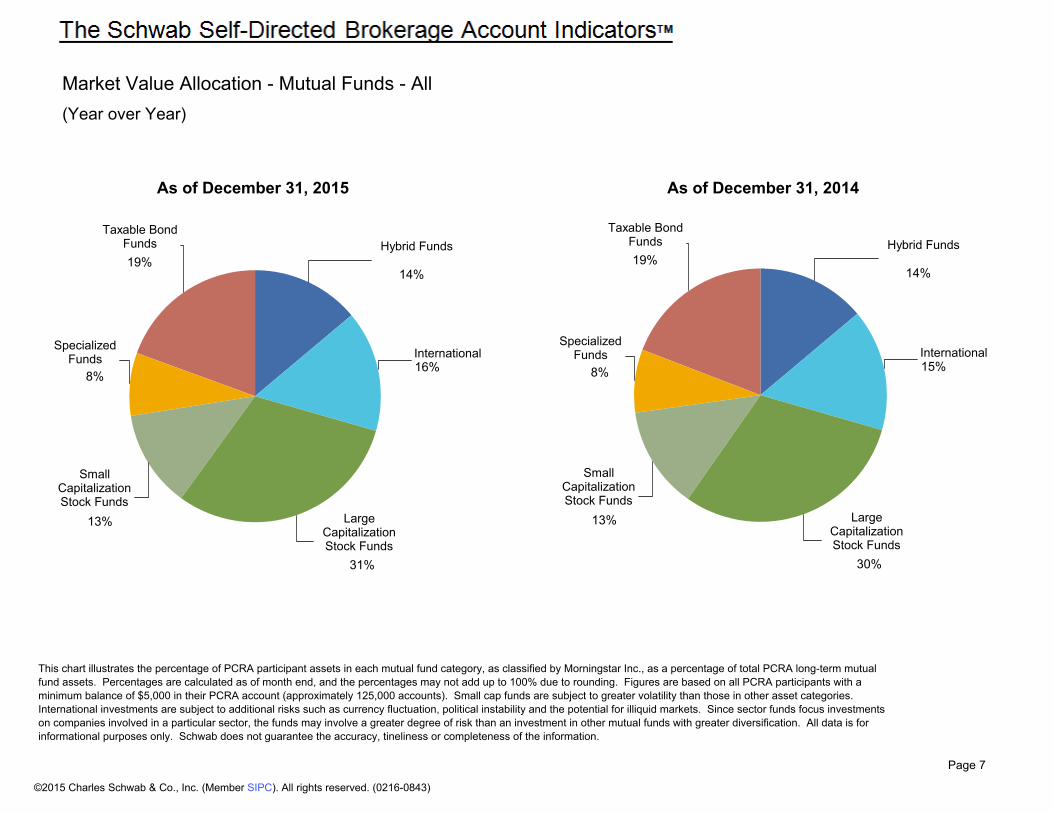
Mutual Funds International Funds and Large Capitalization Stock Funds had a 1% increase in participant mutual fund holdings, while all the other funds remained the same. Large Capitalization Stock Funds had the largest holdings at 31%, followed by Taxable Bond Funds at 19% and International at 16%.
Asset Flows Net asset flows into ETFs (up 42%), Equities (up 39.8%), Mutual Funds (up 13.3%) and Fixed Income (up 7.5%) captured the majority of net asset flows for the quarter. The largest concentration of net asset flows for the individual sectors were Exchange Traded Funds, Mutual Funds-Hybrid Funds, and Energy Equities, capturing over 63% of total net asset flows.
PAST PERFORMANCE CANNOT GUARANTEE FUTURE RESULTS. The information above is for general informational purposes only and is not intended as a solicitation of any security or instrument; nor is it intended as an individualized recommendation or personalized investment advice.
©2015 Charles Schwab & Co., Inc. (Member SIPC). All rights reserved. (0216-0843)
An industry-leading benchmark on retirement plan participant investment activity within self-directed brokerage accounts
Table of Contents:
PCRA Participant Profile Information 2
PCRA Participant within Age Bands 3
Market Value Allocation - Asset Classes 4
Market Value Allocation - Equity Sectors 5
Market Value Allocation - ETF Sectors 6
Net Asset Flow - Asset Classes 8
Net Asset Flow - All Investment Categories 9
Key Schwab Observations for Quarter Ending December 31, 2015
Market Value Allocation - Mutual Funds 7
©2015 Charles Schwab & Co., Inc. (Member SIPC). All rights reserved. (0216-0843)

PCRA Participants Profile Information - All
**None of the information constitutes a recommendation by Schwab or a solicitation of an offer to buy or sell any securities. Prospectuses containing more information including management fees and expenses are available at Schwab. Please always read the prospectus carefully before investing or sending money. Small cap funds are subject to greater volatility than those in other asset categories. International investments are subject to additional risks such as currency fluctuation, political instability and the potential for illiquid markets. Since sector funds focus investments on companies involved in a particular sector, the funds may involve a greater degree of risk than an investment in other mutual funds with greater diversification.
Figures are based on Schwab's full PCRA participant population with a minimum balance of $5,000 in their PCRA account (approximately 125,000 accounts). All data is for informational purposes only. Schwab does not guarantee the accuracy, timeliness or completeness of the information.
Page 2
50Average Age
Average PCRA Account Balance $193,978
Average Positions (per Account)
Equity 4.04Mutual Funds 2.82Cash 1.27ETF 1.17Fixed Income 0.17
9.47TOTAL
Average Trades in Quarter (per Account)
Mutual Funds 1.73
Equity 1.32
ETF 0.65
Fixed Income 0.01
TOTAL 3.71
Top 10 Equity Holdings** % of Equity Assets
APPLE INC 10.63%
FACEBOOK INC CLASS 2.25%
BERKSHIRE HATHAWAY CLASS 2.10%
GENERAL ELECTRIC CO 1.57%
AMAZON COM INC 1.51%
BANK OF AMERICA CORP 1.37%
WALT DISNEY CO 1.23%
MICROSOFT CORP 1.19%
ALPHABET INC CLASS 1.08%
NETFLIX INC 1.07%
Top 10 Mutual Fund Holdings** % of MF Assets
SCHWAB S&P 500 INDEX FD 2.87%
SCHWAB TOTAL STOCK MKT INDEX 1.49%
PIMCO INCM CL D 0.89%
METROPOLITAN WEST TOTAL RETURN 0.78%
VANGUARD 500 INDEX FD INVEST 0.78%
OAKMARK INTL FD CLASS I 0.70%
PARNASSUS CORE EQTY FD INV 0.68%
FIDELITY CONTRA FUND 0.66%
DOUBLELINE TOTAL RETURN BD FD 0.66%
VANGUARD TOTAL STOCK MKT INDEX 0.65%
Top 10 ETF Holdings** % of ETF Assets
SPDR S&P 500 ETF 4.91%
VANGUARD TOTAL STOCK MARKET 3.82%
POWERSHARES QQQ TRUST SRS 1 3.22%
SCHWAB US LARGE CAP ETF 3.18%
SCHWAB US BROAD MARKET ETF 2.86%
SCHWAB US SMALL CAP ETF 2.02%
SCHWAB INTERNATIONAL EQUITY 1.88%
SPDR GOLD SHARES ETF 1.86%
SCHWAB US LARGE CAP VALUE 1.74%
VANGUARD REIT ETF 1.51%
©2015 Charles Schwab & Co., Inc. (Member SIPC). All rights reserved. (0216-0843)
Figures are based on PCRA participants with a minimum balance of $5,000 in their PCRA account (approximately 125,000 accounts). All data is for informational purposes only. Schwab does not guarantee the accuracy, timeliness or completeness of the information.
Page 3
0%
10%
20%
30%
40%
50%
60%
20 - 39 40 - 49 50+
18.08%
27.19%
54.72%
PCRA Participants within Age Bands - AllAs of December 31, 2015
©2015 Charles Schwab & Co., Inc. (Member SIPC). All rights reserved. (0216-0843)
This chart illustrates the percentage of PCRA participant assets in each noted asset class as a percentage of total PCRA assets. Percentages are calculated as of month end, and the percentages may not add up to 100% due to rounding. Money market mutual funds are classified under Cash & Equivalents. Figures are based on all PCRA participants with a minimum balance of $5,000 in their PCRA account (approximately 125,000 accounts). All data is for informational purposes only. Schwab does not guarantee the accuracy, timeliness or completeness of the information.
Page 4
Market Value Allocation - Asset Classes - All(Year over Year)
18%
Cash &Equivalents
28%Equity
13%ETF2%
FixedIncome
38%
MutualFunds
As of December 31, 2015
17%
Cash &Equivalents
28%Equity
13%ETF2%
FixedIncome
40%
MutualFunds
As of December 31, 2014
©2015 Charles Schwab & Co., Inc. (Member SIPC). All rights reserved. (0216-0843)

This chart illustrates the percentage of PCRA participant assets in each equity sector, as classified by Standard & Poor's, as a percentage of total PCRA assets within equity securities. Percentages are calculated as of month end, and the percentages may not add up to 100% due to rounding. Figures are based on all PCRA participants with a minimum balance of $5,000 in their PCRA account (approximately 125,000 accounts). All data is for informational purposes only. Schwab does not guarantee the accuracy, timeliness or completeness of the information.
Page 5
(Year over Year)
Market Value Allocation - Equity Sectors - All
14%
ConsumerDiscretionary
7%
ConsumerStaples
7%Energy
14%Financials
11%
HealthCare10%
Industrials
28%
InformationTechnology
3%
Materials
5%Other 2%
TelecommunicationServices
2%Utilities
As of December 31, 2015
12%
ConsumerDiscretionary
6%
ConsumerStaples
8%Energy
14%Financials
10%
HealthCare
10%Industrials
28%
InformationTechnology
4%
Materials
5%Other 2%
TelecommunicationServices
2%Utilities
As of December 31, 2014
©2015 Charles Schwab & Co., Inc. (Member SIPC). All rights reserved. (0216-0843)
This chart illustrates the percent of PCRA participant assets in each ETF sector, as classified by Morningstar, as a percentage of total PCRA assets within ETF securities. Percentages are calculated as of month end, and the percentages may not add up to 100% due to rounding. Figures are based on all PCRA participants with a minimum balance of $5,000 in their PCRA account (approximately 125,000 accounts). All data is for informational purposes only. Schwab does not guarantee the accuracy, timeliness or completeness of the information.
Page 6
(Year over Year)
Market Value Allocation - ETFs - All
As of December 31, 2015
4%Commodity
15%
InternationalEquity
1%International
FI
6%
Leveraged/Inverse
1%Other
14%Sector
47%US
Equity
12%
US FI
As of December 31, 2014
5%Commodity
15%
InternationalEquity
1%
InternationalFI
6%
Leveraged/Inverse
1%Other
14%Sector
48%
USEquity
11%US FI
©2015 Charles Schwab & Co., Inc. (Member SIPC). All rights reserved. (0216-0843)
This chart illustrates the percentage of PCRA participant assets in each mutual fund category, as classified by Morningstar Inc., as a percentage of total PCRA long-term mutual fund assets. Percentages are calculated as of month end, and the percentages may not add up to 100% due to rounding. Figures are based on all PCRA participants with a minimum balance of $5,000 in their PCRA account (approximately 125,000 accounts). Small cap funds are subject to greater volatility than those in other asset categories. International investments are subject to additional risks such as currency fluctuation, political instability and the potential for illiquid markets. Since sector funds focus investments on companies involved in a particular sector, the funds may involve a greater degree of risk than an investment in other mutual funds with greater diversification. All data is for informational purposes only. Schwab does not guarantee the accuracy, tineliness or completeness of the information.
Page 7
(Year over Year)
Market Value Allocation - Mutual Funds - All
As of December 31, 2015
14%
Hybrid Funds
16%International
31%
LargeCapitalizationStock Funds
13%
SmallCapitalizationStock Funds
8%
SpecializedFunds
19%
Taxable BondFunds
As of December 31, 2014
14%
Hybrid Funds
15%International
30%
LargeCapitalizationStock Funds
13%
SmallCapitalizationStock Funds
8%
SpecializedFunds
19%
Taxable BondFunds
©2015 Charles Schwab & Co., Inc. (Member SIPC). All rights reserved. (0216-0843)
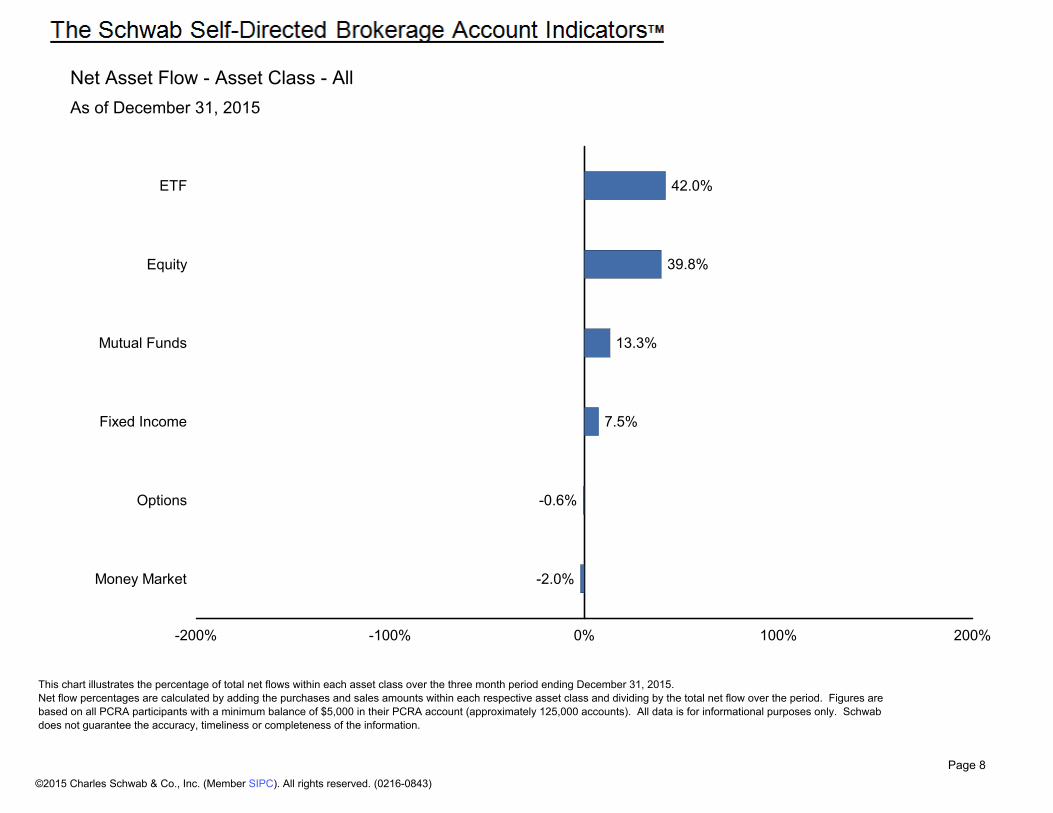
This chart illustrates the percentage of total net flows within each asset class over the three month period ending December 31, 2015.Net flow percentages are calculated by adding the purchases and sales amounts within each respective asset class and dividing by the total net flow over the period. Figures are based on all PCRA participants with a minimum balance of $5,000 in their PCRA account (approximately 125,000 accounts). All data is for informational purposes only. Schwab does not guarantee the accuracy, timeliness or completeness of the information.
Page 8
As of December 31, 2015
Net Asset Flow - Asset Class - All
-200% -100% 0% 100% 200%
ETF
Equity
Mutual Funds
Fixed Income
Options
Money Market
42.0%
39.8%
13.3%
7.5%
-0.6%
-2.0%
©2015 Charles Schwab & Co., Inc. (Member SIPC). All rights reserved. (0216-0843)

This chart illustrates the percentage of total net flows within each investment category, as classified by Standard & Poor's and Morningstar Inc., over the three month period ending December 31, 2015.Net flow percentages are calculated by adding the purchases and sales amounts within each respective investment category and dividing by the total net flows over the period. Figures are based on all PCRA participants with a minimum balance of $5,000 in their PCRA account (approximately 125,000 accounts). Small cap funds are subject to greater volatility than those in other asset categories. International investments are subject to additional risks such as currency fluctuation, political instability and the potential for illiquid markets. Since sector funds focus investments on companies involved in a particular sector, the funds may involve a greater degree of risk than an investment in other mutual funds with greater diversification. Data is for informational purposes only. Schwab does not guarantee the accuracy, timeliness or completeness of the information.
Page 9
As of December 31, 2015
Net Asset Flow - All Categories - All
-200% -100% 0% 100% 200%
32.5%20.1%
11.0%9.9%
6.6%5.5%4.9%3.8%3.7%2.5%2.4%2.3%2.1%2.1%2.0%1.2%1.1%1.1%0.3%0.3%0.2%0.2%0.2%0.1%0.0%
-0.3%-6.4%
-9.2%
ETF - US Equity
Mutual Funds - Hybrid Funds
Equity - Energy
Equity - Consumer Discretionary
Equity - Information Technology
Mutual Funds - International
Equity - Financials
ETF - Leveraged/Inverse
Mutual Funds - Specialized Funds
ETF - US FI
Equity - Other
ETF - International Equity
ETF - Sector
Equity - Materials
Equity - Health Care
Equity - Consumer Staples
Equity - Telecommunication Services
Equity - Industrials
ETF - Asset Allocation
ETF - Commodity
ETF - International FI
ETF - Other
Mutual Funds - Small Capitalization Stock Funds
Mutual Funds - Tax-Free Bond Funds
ETF - Currency
Equity - Utilities
Mutual Funds - Large Capitalization Stock Funds
Mutual Funds - Taxable Bond Funds
©2015 Charles Schwab & Co., Inc. (Member SIPC). All rights reserved. (0216-0843)
Disclosures
Investors should consider carefully information contained in the prospectus, including investment objectives, risks, charges, and
expenses. You can request a prospectus by calling 800-435-4000. Please read the prospectus carefully before investing.
Money Market funds are neither insured nor guaranteed by the Federal Deposit Insurance Corporation or any other government agency.
Although the funds see to preserve the value of your investment at $1.00 per share, it is possible to lose money by investing in the fund.
Investment returns will fluctuate and are subject to the market volatility, so that an investor's shares, when redeemed or sold, may be worth more or less than their original cost. Unlike mutual funds, shares of ETFs are not individually redeemable directly with the ETF. Share are bought and sold at market price, which may be higher or lower than the net asset value (NAV).
Page 10©2015 Charles Schwab & Co., Inc. (Member SIPC). All rights reserved. (0216-0843)