Embed Size (px)
Citation preview

Quarter and Annual Report
Cooperative Agreement No: 620-A-00-03-00144-00 Section B
Author(s):
A.G.O. Dixon and G. Tarawali
Project Title:
Cassava Enterprise Development Project (CEDP)
Recipient: International Institute of Tropical Agriculture (IITA)
USAID CTO: Nduku Okaro, Agricultural Development Officer (SO 12)
Reporting Period: July – September 2008
October 2007 – September 2008
Date: November 2008
2
Cassava Enterprise Development Project July to September 2008 Quarterly Progress Report
& Annual Progress Report (October 2007 – September 2008) Activity Summary Implementing Partner: International Institute of Tropical Agriculture (IITA) Activity Name: Cassava Enterprise Development Project (CEDP) Activity Objective 1. Reduce the impact of the cassava mosaic disease in selected communities 2. Increase the productivity of cassava, and 3. Develop and expand postharvest processing and marketing outlets for cassava
products in the South-South and South East States of Nigeria USAID/Nigeria SO 12: Improved Livelihoods in Selected Areas Life of Activity: Five (5) Years Total Estimated Contract/Agreement Amount: US$ 2,917,353 Obligations to Date: US$ 2,539,540 (as at June 2008) Accrued Expenditure this Quarter: US$ 66,936 Activity Cumulative Accrued Expenditure to Date: US$ 2,606,476 Estimated Expenditure Next Quarter: US$51,781

3
Cassava Enterprise Development Project Targets for 2007/2008
Indicators This Year Target This Year Actual This Quarter Target This Quarter Actual
Explanation for
Variance or why not
reported this quarter
Strategic Objective (SO) 12: Improved Livelihoods in Selected Areas
Indicator 1a: Income from selected commodities and products
$13,414,812 (N1,582,947,829)
$5,372,997.6 (N634,013,716.8)
$3,157,475.72 (N372,582,134.96)
$1,795,991.15 (N211,926,955.79)
Project activities reduced due to funding shortfall caused by delay in release of fund from donor (SPDC) & high inflation rate.
Indicator 1b: Income from selected services
- $89,243.97 (N10,530,788.2) -
$30,001.93 (N3,540,227.22)
Derived from the mobile grater enterprises. Direct income is made by operators.
Indicator 1c: Income from indirect services
- $4,367,577.23 N515,374,113.6
-
$1,930,357.35 N227,782,167.8
This is income generated by indirect clients who patronised the processing centers.
Total Income (a+b+c) $9,829,818.80 or (N1,159,918,618)
$3,756,350.43 or (N443,249,350.7)
This is the net income generated by all the enterprises for the quarter.The target for the quarter was exceeded by 18.9%.
IR12.1: Increased Market-Driven Employment Opportunities
IR 12.1.1: Job Creation 2472
11,847
990 4539
Some enterprises especially the SMEs such as Vessa Foods expanded their production and that involved more hands. Some farm activities hired more hands and above all data collection was intensified during the quarter.
IR12.2: Increased Agricultural Productivity and Marketing IR 12.2.1: Sales of agricultural commodities/products
$13,414,812. (N1,582,947,829)
$8,575,743.78 (N978,583,979.8)
$7,314,215.33 (N863,077,409.15)
$2,155,538.49 (N254,353,542)
Decline is caused by shortfall in funds
IR 12.2.1b: Sales from selected services $91,090.94
(N10,748,730.92) $33,335.47 (N3,933,585.8)
Total service charge for grating with mobile graters.
IR 12.2.1c: Sales from indirect service users
$6,040,503.35 N712,779,417
$2,168,940.85 or (N255,935,020)
Non-members of CEDP use these facilities to process and sell.
Total Sales (a+b+c) $14,707,338.07 or (N1,735,465,892.26)
$$4,357,814.81
(N514,222,147.58)
The total sales generated in all the enterprises for the quarter (direct and indirect) exceeded target.
IR 12 .2.2: Area under sustainable management (ha)
771 979.6 247 383
Target exceeded from plantings made in Bayelsa, Delta, Anambra, Enugu and

4
Ebonyi States. IR 12.2.3: Productivity of selected commodities/products
Nil – overall target of 25t/ha already met.
–
Nil 25.6t/ha
The project overall target (24t/ha) has been exceeded due to the use of improved varieties and management practices by CEDP farmerss. This will be verified further in the FY 08 harvest.
IR 12.2.4: Clients adopting improved technologies
74,633
87,898
35,816 22,661
Target for the Quarter not met for same reason of short-fall in funds but yearly target was achieved. Note that subsequently we intend to get beneficiaries of our stems, who make sales from their multiplication plots to record number of persons who bought their stems for this purpose.
IR 12.2.5: Number of Technologies introduced 12 12 12 27
Target met. Many more technologies were introduced as the project grew by the year.
IR 12.3: Increased Commercial viability of micro, small, and medium enterprises IR12.3.3: Enterprises benefiting from Business Development Services (BDS)
349 2663 88 100
An improved data tracking method has been adopted in this service. Unlike in the past, all consultations and visits for advice on cassava enterprise development and management were captured in addition to the Peer Learning Workshops).
IR12.3.4: Sustainable Producer Associations 175 88 15 3
Over 200 associations exist at different levels of sustainability. Efforts are being made to ensure that the existing groups & associations meet the criteria for classification as sustainable. New ones will come on board in the next quarter
Exchange Rate: USD1.00 = N 118

5
Cassava Enterprise Development Project
July to September 2008 Quarterly Progress Report and Annual Progress Report (October 2007 – September 2008)
I. Background
The Cassava Enterprise Development Project is implemented through the International
Institute of Tropical Agriculture in support of Nigeria’s Presidential Cassava Initiative.
Total anticipated funds of US$11.5 million are provided under a Public-Private
Partnership (PPP) between the USAID and the Shell Petroleum Development Company
(SPDC) to support the development of the cassava sector over a period of five (5) years.
Objective
The objective of the Project is to increase economic opportunities through
sustainable and competitive cassava production, marketing and agro-enterprise
development in selected communities of the South-South and South-East States of
Nigeria through:
i. Reduction of the impact of the cassava mosaic disease (CMD) in selected
communities in the South-South and South East-States,
ii. Increased productivity of cassava, and
iii. Development and expansion of postharvest processing and marketing outlets
for cassava products.
The Project’s activities contribute to Strategic Objective 12 that emphasises Improved
Livelihoods in Selected Areas with the following key intermediate results (IR):
1. Increased Market-Driven Employment Opportunities,
2. Increased Agricultural Productivity and Marketing, and
3. Increased Commercial Viability of micro, small, and medium enterprises
(MSMEs).
6
II. Progress
This report is an annual/quarterly report covering activities on the project activities from
July to September 2008 and the last three quarters (October 2007 to June 2008). These
activities include among others:
♦ Income from selected commodities and products ♦ Job creation ♦ Sales of agricultural commodities/products ♦ Area under sustainable management ♦ Clients adopting improved technologies ♦ Hectares of primary, secondary, and tertiary improved cassava planting material
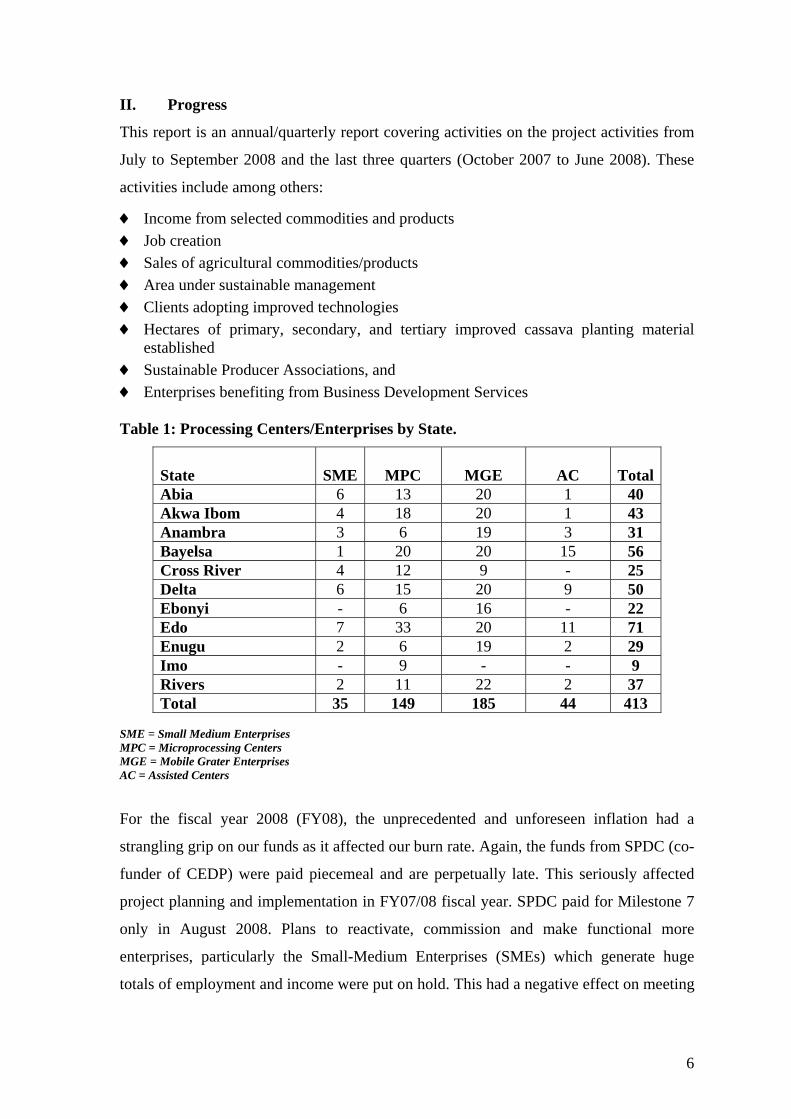
established ♦ Sustainable Producer Associations, and ♦ Enterprises benefiting from Business Development Services Table 1: Processing Centers/Enterprises by State.
State SME MPC MGE AC
TotalAbia 6 13 20 1 40 Akwa Ibom 4 18 20 1 43 Anambra 3 6 19 3 31 Bayelsa 1 20 20 15 56 Cross River 4 12 9 - 25 Delta 6 15 20 9 50 Ebonyi - 6 16 - 22 Edo 7 33 20 11 71 Enugu 2 6 19 2 29 Imo - 9 - - 9 Rivers 2 11 22 2 37 Total 35 149 185 44 413
SME = Small Medium Enterprises MPC = Microprocessing Centers MGE = Mobile Grater Enterprises AC = Assisted Centers
For the fiscal year 2008 (FY08), the unprecedented and unforeseen inflation had a
strangling grip on our funds as it affected our burn rate. Again, the funds from SPDC (co-
funder of CEDP) were paid piecemeal and are perpetually late. This seriously affected
project planning and implementation in FY07/08 fiscal year. SPDC paid for Milestone 7
only in August 2008. Plans to reactivate, commission and make functional more
enterprises, particularly the Small-Medium Enterprises (SMEs) which generate huge
totals of employment and income were put on hold. This had a negative effect on meeting

7
our targets especially on Income Generation. Activities were minimized and staff strength
seriously reduced, leading to under-reporting in some cases.
However, one new enterprise (MPC) came into operation in the year. This is in Delta
State (Cross Victory Industries, Abraka, Ethiope East) thus increasing the number in the
State from 49 to 50 and the overall to 413.
SO12 Indicator 1: Income from selected commodities and products
Table 2a: Income (N) from all cassava enterprises and services
State SME MPC MG AC Fresh Roots Cassava Stems Total Income
Abia 740,146.00 462,884.55 172,395.00 - 4,880,128.00 - 6,255,553.55 Akwa Ibom 980,320.00 504,954.85 626,463.00 - 44,129,049.60 - 46,240,787.45 Anambra - 485,823.41 9,288.00 - 14,840,000.00 294,262.50 15,629,373.91 Bayelsa - 721,353.90 1,209,068.82 1,179,606.00 14,755,200.00 243,200.00 18,108,428.72 Cross River 60,332,368.80 120,294.18 110,636.10 - - - 60,563,299.08 Delta 3,230,040.00 1,592,690.60 447,651.00 749,647.00 15,900,000.00 311,125.00 22,231,153.60 Ebonyi - 38,399.94 11,043.00 - 2,146,500.00 181,212.50 2,377,155.44 Edo 13,015,200.00 3,404,250.00 586,800.00 582,727.50 7,773,151.20 - 25,362,128.70 Enugu 567,600.00 23,807.50 35,145.00 79,210.00 16,695,000.00 234,412.50 17,635,175.00 Imo - 40,788.70 - - - - 40,788.70
Rivers 479,600.00 91,047.00 331,737.30 120,954.56 - - 1,023,338.86
Total Income 79,345,274.80 7,486,294.63 3,540,227.22 2,712,145.06 121,119,028.80 1,264,212.50 215,467,183.01
Table 2b: Net Income (N) generated by and accruing directly to various cassava enterprises
in the States
State SME MPC AC Fresh Roots Cassava Stems Total Income
Abia 740,146.00 462,884.55 - 4,880,128.00 - 6,083,158.55 Akwa Ibom 980,320.00 504,954.85 - 44,129,049.60 - 45,614,324.45 Anambra - 485,823.41 - 14,840,000.00 294,262.50 15,620,085.91 Bayelsa - 721,353.90 1,179,606.00 14,755,200.00 243,200.00 16,899,359.90 Cross River 60,332,368.80 120,294.18 - - - 60,452,662.98 Delta 3,230,040.00 1,592,690.60 749,647.00 15,900,000.00 311,125.00 21,783,502.60 Ebonyi - 38,399.94 - 2,146,500.00 181,212.50 2,366,112.44 Edo 13,015,200.00 3,404,250.00 582,727.50 7,773,151.20 - 24,775,328.70 Enugu 567,600.00 23,807.50 79,210.00 16,695,000.00 234,412.50 17,600,030.00 Imo - 40,788.70 - - - 40,788.70
Rivers 479,600.00 91,047.00 120,954.56 - - 691,601.56
Total Income 79,345,274.80 7,486,294.63 2,712,145.06 121,119,028.80 1,264,212.50 211,926,955.79

8
Table 2c: Net Income and Sales (N) generated by mobile graters enterprise services
State Sales Income Abia 191,550.00 172,395.00 Akwa Ibom 696,070.00 626,463.00 Anambra 10,320.00 9,288.00 Bayelsa 1,343,409.80 1,209,068.82 Cross River 122,929.00 110,636.10 Delta 497,390.00 447,651.00 Ebonyi 12,270.00 11,043.00 Edo 652,000.00 586,800.00 Enugu 39,050.00 35,145.00 Rivers 368,597.00 331,737.30 Total Income 3,933,585.80 3,540,227.22
Some of the groups that benefited from our improved CMD resistant cassava varieties
commenced harvesting in the quarter. Harvest is as usual, in piece meal. Working on the
premise that these varieties yield, on average, 25.6t /ha, and that 1 tonne of cassava fresh
root sells for between N7500 and N8000, their income from this enterprise is here
calculated based on the number of hectares established.
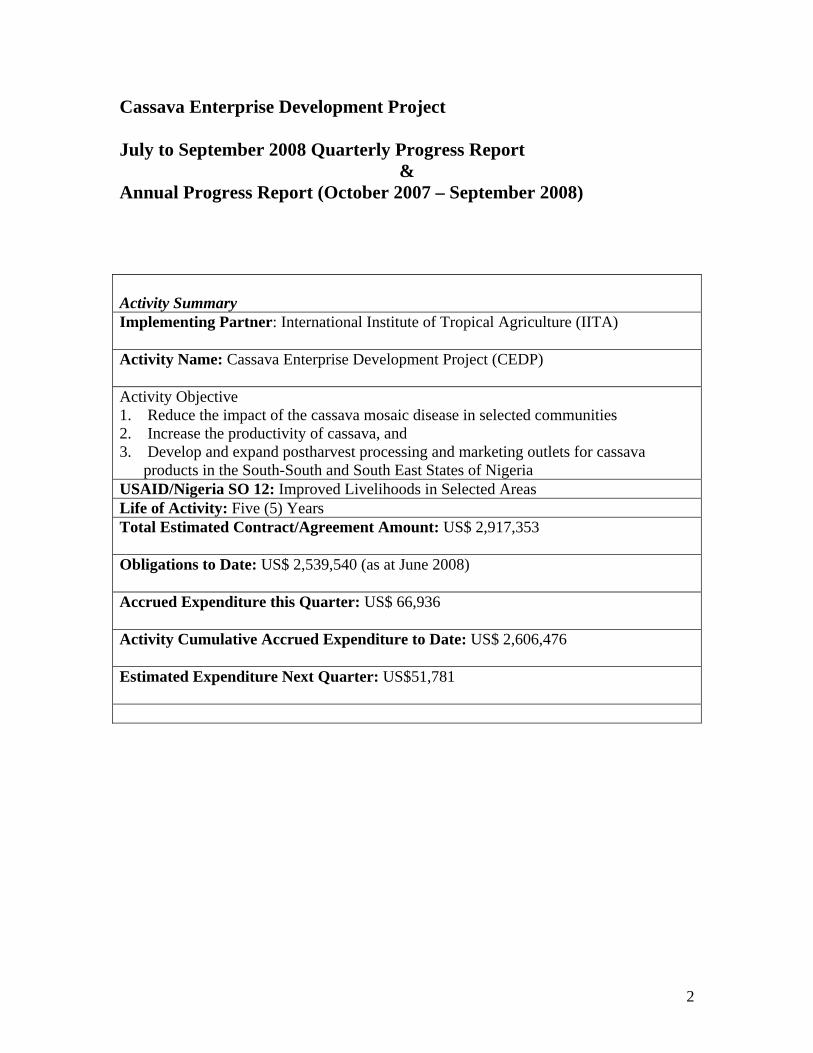
Figure 1: Percentage contribution of enterprises to gross income for the quarter, July-September, 2008.
37%
56%
1%
3%1% 2%
SMEMPCMGACFresh RootsCassava Stems

9
Cassava fresh roots generated the highest proportion (56%) of income for the quarter.
This was followed by the Small-Medium Enterprises (SME) with 37%. When the
contributions of the SME is weighed against the exclusion of the values from fresh roots
(CR) and cassava stems (CS) income, it contributed about 85% in the quarter. This is a
drop of about 4% from the last quarter though with an increased income from
(N67,059,472 to N90,165,085). The Mobile Graters (MG) and Cassava Stem (CS)
enterprises generated income to the tune of N4,604,627.22 (N3,540,227.22 +
N1,064,600)or US$39,023.96
Total Gross Margin for various Cassava Enterprises
Based on the results of a survey, variable costs account for about 11% in MPCs and ACs,
12% for SMEs, 10% for MGEs, 20% for cassava roots, and 5% for cassava stem. These
estimates will need to be reviewed owing to current changes in prices. The Total Gross
Margin from CEDP- assisted cassava enterprises for this quarter is calculated by
subtracting the percentage variable cost1 from the total income. Therefore, the Total
Gross Margin from all CEDP- assisted centers and farms is N215,473,183.01 or
$1,826,043.92, i.e., (N258287127.8 less N42,813,944.79):
The total variable cost component is calculated as follows:
1. MPCs and ACs = 0.11 × (N8,411,567+3,047,354)= N1,260,481.31
2. SMEs = 0.12 × N90,165,085 = N10,813,810.2 3. MGEs =0.10 × N3,933,585.8 = N393,358.58
4. CR = 0.2 × N 151,398,786 = N 30,279,757.2
5. CS = 0.05 x N 1,330,750 = N 66,537.5
Thus the total variable cost amounts to N42,813,944.79 or US$362,830.04
1 A survey of 25 MPCs shows that variable costs account for about 11% of total cost; for SME, 12% is the factor based on the total variable cost ratio from Widows’ Mite enterprise only.
10
IR 12.1: Increased Market-Driven Employment Opportunities
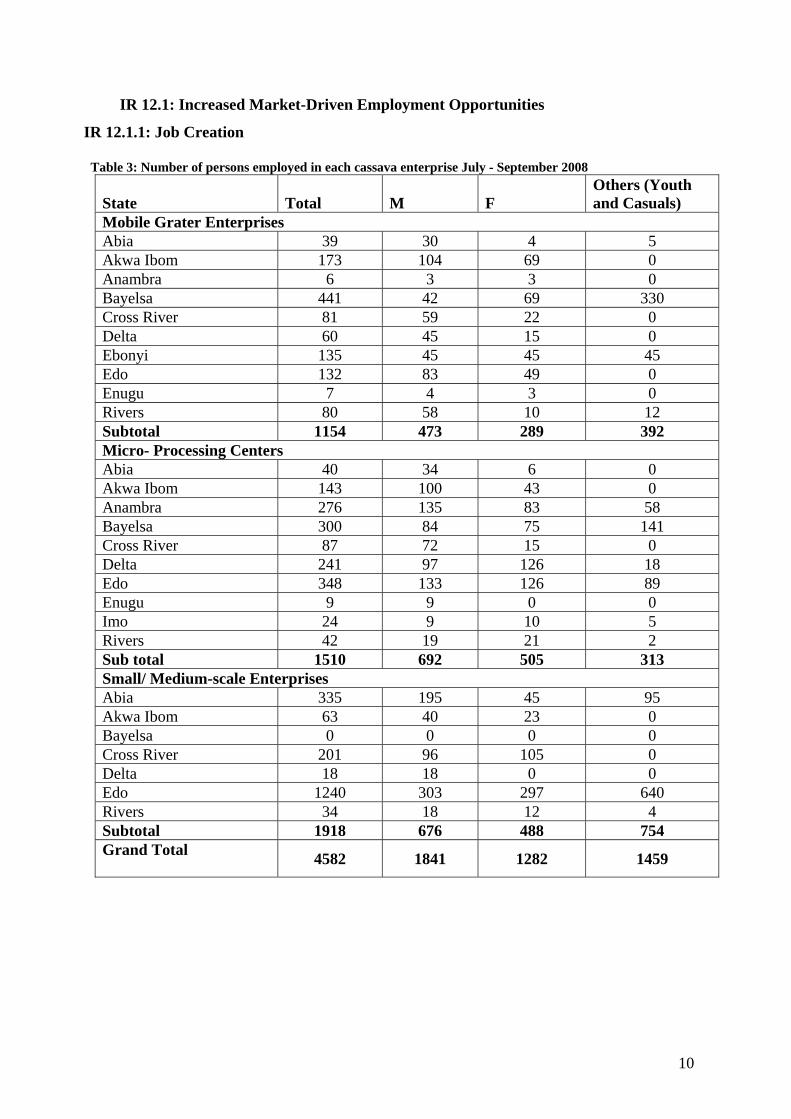
IR 12.1.1: Job Creation Table 3: Number of persons employed in each cassava enterprise July - September 2008
State Total M F Others (Youth and Casuals)
Mobile Grater Enterprises Abia 39 30 4 5 Akwa Ibom 173 104 69 0 Anambra 6 3 3 0 Bayelsa 441 42 69 330 Cross River 81 59 22 0 Delta 60 45 15 0 Ebonyi 135 45 45 45 Edo 132 83 49 0 Enugu 7 4 3 0 Rivers 80 58 10 12 Subtotal 1154 473 289 392 Micro- Processing Centers Abia 40 34 6 0 Akwa Ibom 143 100 43 0 Anambra 276 135 83 58 Bayelsa 300 84 75 141 Cross River 87 72 15 0 Delta 241 97 126 18 Edo 348 133 126 89 Enugu 9 9 0 0 Imo 24 9 10 5 Rivers 42 19 21 2 Sub total 1510 692 505 313 Small/ Medium-scale Enterprises Abia 335 195 45 95 Akwa Ibom 63 40 23 0 Bayelsa 0 0 0 0 Cross River 201 96 105 0 Delta 18 18 0 0 Edo 1240 303 297 640 Rivers 34 18 12 4 Subtotal 1918 676 488 754 Grand Total 4582 1841 1282 1459

11
Figure 2: Employment pattern across enterprises
Figure 3: Distribution of employment across quarters – FY08
In the current quarter, a total of 4582 persons were employed for various activities in
various enterprises expressing a 12.02% increase over the last quarter (4090 - 4582), with
males dominating (42%) when segregated by gender. The dominance by men could be
attributed to the nature of the activities prominent in the period which demand higher
energy and strength vis-à-vis harvesting and other activities. As from next quarter, the
youth will be disaggregated by gender in line with the recommendation of MEMS Data

12
Quality Assessment (DQA). Pertinently, the SMEs still dominate in job creation amongst
the cassava enterprises.
The trend is absolutely normal as activities increase from the first quarter (dry season)
and hit the peak in the wet season.
IR 12.2: Increased Agricultural Productivity and Marketing
IR 12.2.1: Sales of agricultural commodities/products
Table 4a. Sales (N) from agricultural commodities/products from enterprises
functional in the last quarter
State SME MPC AC Fresh root Cassava Stems Total Income Abia 841,075.00 520,095.00 - 6,100,160.00 - 7,461,330 Akwa Ibom 1,114,000.00 567,365.00 - 55,161,312.00 - 56,842,677 Anambra - 545,869.00 - 18,550,000.00 309,750.00 19,405,619 Bayelsa - 810,510.00 1,325,400.00 18,444,000.00 256,000.00 20,835,910 Cross River 68,559,510.00 135,162.00 - - - 68,694,672 Delta 3,670,500.00 1,789,540.00 842,300.00 19,875,000.00 327,500.00 26,504,840 Ebonyi - 43,146.00 - 2,683,125.00 190,750.00 2,917,021 Edo 14,790,000.00 3,825,000.00 654,750.00 9,716,439.00 - 28,986,189 Enugu 645,000.00 26,750.00 89,000.00 20,868,750.00 246,750.00 21,876,250 Imo - 45,830.00 - - - 45,830 Rivers 545,000.00 102,300.00 135,904.00 - - 783,204 Total Income 90,165,085 8,411,567 3,047,354 151,398,786 1,330,750 254,353,542
A total of N254,353,542 or US$2,155,538.49 was realized from sales through SMEs,
MPCs, ACs, and farm products (Table 4a). It is exciting to note that many beneficiaries
Male41%
Female25%
Others(youth)34%

13
of CMD improved stems are selling to other farmers and making some good money from
these stems. A bundle sells for between N350 and N400. See success story on page 25.
The cassava mash is grated for persons who are not members of CEDP-assisted
enterprises and amounted to 1798.6t from MGEs. Thirty percent of total cassava mash
output was estimated to belong to non-members (539.6t). The wet output processed by
these enterprises for their clients will be converted to other produce, basically gari and
fufu. These products are either consumed at home by various clients or sold in the market.
Whichever way, either expenditureis saved or income generated for these clients. For this
quarter, N255,935,020 or US$2,168,942.7 was estimated as gross sales (Table 4b). The
impact and benefit of the Project’s enterprises are being greatly enjoyed by non-direct
partners along the value addition chain. An assessment of spillover is scheduled to be
carried out later in the year. Income for this quarter using a variable cost of 11% is
N227,782,167.8 or US$1,930,357.35.
.
Table 4b. Sales (N) from outputs (tons) from service enterprises (indirect) functional in the last quarter
State Wet cassava mash (t) Estimated output (t) Estimated sales (N)
MG MPC Total output (t)
Gari Fufu Gari Fufu Abia 126.41 266.55 392.96 58.944 343.84 2,829,312.0 24,068,800.00 Akwa Ibom 22.70 17.26 39.96 5.994 34.965 287,712.0 2,447,550.00 Anambra 11.8 26.45 38.25 5.7375 33.46875 275,400.0 2,342,812.50 Bayelsa 500 260 760 114 665 5,472,000.0 46,550,000.00 Edo 521.6 581.33 1102.93 165.4395 965.0638 7,941,096.0 67,554,462.50 Rivers 368.60 238.2 606.8 91.02 530.95 4,368,960.0 37,166,500.00 Enugu 30.02 11.9 41.92 6.288 36.68 301,824.0 2,567,600.00 Ebonyi 0.26 4.60 4.86 0.729 4.2525 34,992.0 297,675.00 Imo 4.45 2.22 6.67 1.0005 5.83625 48,024.0 408,537.50 Delta 142.55 418.41 560.96 84.144 490.84 4,038,912.0 34,358,800.00 Cross River 70.24 113.46 183.7 27.555 160.7375 1,322,640.0 11,251,625.00 Total 1798.63 1940.38 3739.01 560.8515 3271.634 26,920,920.0 229,014,100.00
Total sales: (Gari+Fufu) N255,935,020.00 or $2,168,942.7
Methodology/calculation of the indirect sales
While the MGEs and the MPCs produce mainly produce wet output (cassava mash), the
SMEs product dry output (cassava flour). The wet output processed by the enterprises for
their clients will be converted to other produce, basically gari and fufu.

14
Factors considered in the calculations:
Gari
4k of cassava mash (wet output) yield 1k of gari
25k of gari, on average, sells for N1, 200, i.e., N48, 000/tonne
Fufu
1kg of cassava mash (wet output) yields 3.5 sizeable wraps of fufu (local)
1 wrap of fufu, on average, sells for N20.00, i.e., 1 tonne of cassava mash will yield
N70,000.
A survey with the clients and MGE and MPC operators revealed that 60% of the mash
goes to gari and 25% to fufu, while 15% goes to minor products.
In the 4th quarter, the MGEs and the MPCs collectively generated 3739.01t of cassava
mash as output. Working on the premise of 60% for gari and 25% for fufu, it then means
that 2,243.41t would have gone to gari, 947.75t to fufu, and about 547.85t to other uses.
At the ratio of 4:1, it means that from 2243.41t, a yield of 560.85t of gari was realised
and at N48, 000.00/t the MGEs and MPCs assisted in generating gari products worth
N26,920,920.00 (N48,000 × 560.85t). For fufu, at 3.5 wraps from 1kg mash, 3,271.63
wraps were made from 934.75t of mash yielding a cash income of about
N229,014,100.00. Thus the twin enterprises– MGs and MPCs – indirectly generated
products (gari and fufu) for sales worth N255,935,020.00 or US$2,168,942.7.
IR 12 .2.2: Area under sustainable management
This is the total land area farmed in targeted States, using at least one improved practice
introduced by CEDP. With respect to cassava, improved practices include the use of
improved CMD resistant cassava varieties, the application of fertilizer and herbicide,
intercropping of cassava with melon, sweetpotato, bambara nut, groundnut, cowpea,
soybean, mucuna or pueraria spp., rotation with other crops or fallow, strip farming, and
so on. The area under sustainable management is the summation of area planted to CMD
resistant varieties in the various States. This includes all distributions by CEDP to
farmers, including secondary and tertiary multiplications.

15
Table 5: Stem distribution to groups, individuals and partners
State No. of bundles supplied Ha Anambra 8125 97.5 Bayelsa *3350 67 Delta 5000 100 Ebonyi 675 13.5 Enugu 5250 105 Total 22,400 383 *Direct distribution via Bayelsa ADP
Due to the short-fall in funds, we devised a cost saving approach to stem distribution.This
included directing requests from interested farmers to previous beneficiaries of our
improved varieties and also encouraging others to come to our offices and fields to pick up
their stems (See last quartelyr report). However, Bayelsa ADP got about 4000 bundles of
stems from CEDP for distribution to farmers. About 11,000 cassava stems were exchanged
for planting in July and August. This quantity is expected to have planted about 373 ha.
This exceeds the target for the quarter by 51%. This is one of the project’s strong points
and this is evidenced by the fact that there is massive cultivation of CMD varieties all
around the Niger Delta States and the requests are unlimited. Pertinently, these varieties
sell like hot cakes in many markets.
CMD Improved varieties in Nworie Market, Ebonyi State. A bundle sells for N350-N400
IR 12.2.3: Productivity of selected commodities/products
The yield of CMD resistant cassava varieties averaged about 25.6t/ha, (an increase of 9%
in yield) over the target, while the local varieties in farmers’ fields averaged about 12t/ha
considering the 2007 planting season data. We intend to carry out another survey in FY08
to ascertain the stability of these varieties.

16
IR 12.2.4: Clients using improved technologies
Table 6: Clients using improved technologies State MG MPC SME AC
Abia 1816 5879 432 - Anambra 59 922 - - Ebonyi 55 - - - Enugu 849 293 70 - Imo - 49 - - Bayelsa 5314 2908 - 4015
Total 8093 10051 502 4015 22661
There was a slight shortfall of about 13.2% of clients making use of CEDP cassava
processing facilities when compared with the last quarter (35816-22661 individuals). The
shortfall is attributable to the fact that data were not available in some centers. In the
fiscal year performance however, we exceeded our target by 18% (74633 -87898). In
general the MPC and MGs attracted the largest percentage (85%) of patronage (44% and
36% respectively). About 85% of clients using our technologies are female and youths
(55% women and 30% youths) while 15% are male.This is excluding farmers that bought
the improved cassava stems from our earlier beneficiaries that were not recorded.
Figure 4a: Number of clients using technologies in the enterprises in 4th quarter.

17
Figure 4b: Number of clients using improved technologies during the Fiscal Year - FY08
Figure 4b shows that in this fiscal year (FY08), a total of 87,898 clients were attracted to
our technologies, with this quarter contributing 26%. This is above the yearly target of
74,633. The Quarterly achievement (22,661) was slightly lower than the Quarterly target
(35,816). This is dominated by patronage to our processing technologies and improved
cassava varieties. More people are still showing interest even at their own cost and some
sacrifice of tmie and effort to acquire our technologies. While some replicate our
technologies others pilfer them. For instance, a farmer, Mr D. Unuegbu at Achala, Awka
North LGA of Anambra State, reported that his10ha farm was so lush that people in the
area started pilfering his stems. He lost about 75% of his stems to pilfering.
IR 12.2.5: Number of technologies introduced
This is a count of how many agricultural technologies have been introduced, including
equipment, machinery, practise, inputs (such as seed) or methods used in the planting,
cultivation, harvesting, sorting, processing/transforming, or packaging of agricultural
commodities. Spread of post and preharvest technologies introduced by the Project is a
continuous activity.
In the outgoing year, FY08, our technologies moved up from 12 to 27. The technologies
are listed in Table 7.

18
Table 7: Technologies introduced in Project area. Improved technologies Class of technology
Automated gari fryer Postharvest Cabinet dryer Postharvest Cassava chipper Postharvest Cassava peeler Postharvest Community fryer Postharvest Flash dryer Postharvest Food recipes Postharvest Grater Postharvest Millers Postharvest Mobile grater Postharvest MPC building design Postharvest Packaging of finished products Postharvest Pressers Postharvest Rotary dryer Postharvest Sanitation of processing center Postharvest Sealer Postharvest Sifter Postharvest Tunnel dryer Postharvest Backpack grass slasher Agronomy Cassava harvester Agronomy Cassava planter Agronomy Cassava variety Agronomy Chain saw Agronomy Herbicide Agronomy Power tiller Agronomy Stem cutter Agronomy Rapid multiplication Agronomy
IR 12.3: Increased commercial viability of micro, small, and medium enterprises
IR 12.3.1: Enterprises benefiting from Business Development Services
Business Development Services (BDS) training includes product development,
information and mobilization, advice on building construction, machinery installation,
and enterprise trainings, including business advice given to processors during visits. The
trainings include starting a new Cassava Business, Enterprise Management, Book and
Record Keeping and Marketing, Equipment and General Factory Maintenance and
Hygiene, Product Diversification and Development and Peer Learning meetings.
Only one formal training was conducted directly by CEDP as a result of the funding
problem. However, some consultations were held ranging from setting up cassava
enterprises to product development. These consultations include the following:

19
Chima Nwakanma Okoro (08036879788) with 5 others consulted on
establishment of SME or Cassava Flour packaging outfit. They visited Kaka
Confectionaries (Abia) and Widow’s Mite (Akwa Ibom).
Kenneth Ajarho (08037657990) came with a group of 4 for advice on establishing
a 30ha cassava farm in Okirik.
Five top management staff of TRANSCORP led by Dr Jide Adedeji (07034328483),
the Chief Technology Officer, Transcorp Agribusiness, also consulted on the
establishment of an SME and possibly an Ethanol plant.
Mrs Chioma Ihueze (08054829349), a beneficiary of CEDP product development
training trained 12 widows in Umuahia, These trainings were organised by a Faith
Based Organization ( FBO) known as Catholic Women Association, Umuahia.
In Delta State, 71 students of Obasuyi College were trained on Cassava Product
Development.
IR 12.3.2: Sustainable Producer Associations
CEDP currently has over 200 associations at different levels of classification for
sustainability. In last quarter ,3 were identified while yet another 3 have been confirmed
sustainable in this quarter.
Table 8. Sustainable Associations in Project States State Associations
Edo 1. Sparkling Cassava Processing Coop., Opp Agbede Market, Agbede, Etsako West LGA – 08057301431 2. Oboarelu Coop Farmers, Ekpoma Esan West LGA – 08037373380
Imo Christain Child Care Group Umuoba Uratta, Owerri North LGA

20
Figure 5: Comparison of performance in Sustainable Producer Associations FY07 and FY08
In the year being reported, a total of 88 sustainable groups have been certified, leaving a
balance of 89 (50%). This is largely due to our funding problems as can be verified from
our performance in the immediate past year (FY07). With available funds now, more of
these groups and associations will be identified, organized and strengthened to meet the
sustainability criteria.
III. Problems and Opportunities
For the FY08, the Project’s problems have persisted. Most distressing and disturbing is
the funding situation, which made most of the aspirations and targets of the Project
difficult to meet. This funding crisis was basically because of the inability of SPDC and
other stakeholders to pay their outstanding contributions on time.
1. Generally, the usual internal rancour in the MPCs seems to be dying down.
2. Youth restiveness, political problems, and militant disturbances still linger in parts of
the Project area.
3. Poor infrastructure in the Niger Delta Region. For instance the road between Calabar
and Ikom is split into 2 at exactly 30 km to Ikom from Calabar for a distance of about
325m and a depth of about 45m. The road has been in this condition for almost 8
months. The villagers had made a local bridge with wood, logs, ropes and nails. They

21
collect between N2000 and N4000 to allow any vehicle across this bridge.
Scary and Creepy Scenes but has not deterred our quest to achieve
4. Irregular and unreliable power supply in Project areas increases the cost of production
in SMEs and some MPCs that use diesel engines.
5. The galloping rate of inflation, especially the ever–increasing prices of petroleum
products, makes the cost of implementing Project activities and data collection
completely outrageous. This has not improved over the two previous quarters and is
having d drastic effect on our burn rate.
IV. Success Stories
IV.1a Godillogo founds Gold in Gari As stated in last quarter report, gari has stolen the show in Godilogo Farms (Obudu).
This is as a result of the windfall they got from UNICEF in the year (last quarter) to
supply gari to refugees from Bakassi peninsula who were settled in Obudu. They make as
much as N1, 000,000 every week from gari and all activities are now directed to gari
production.
IV.1b Improved flash dryer
Some cassava entrepreneurs had before now complained that the flash dryer (a major
piece of equipment in the processing of cassava) available in the country had low
capacity and was not energy efficient. To tackle this problem, a 9-man flash dryer team
of engineers and fabricator was selected within a short time from research institutes and
the academia to design, fabricate, and install a new flash dryer for cassava flour.

22
Six months after its inception, the team was able to produce a more efficient and cost-
effective flash dryer. Results showed the modified dryer has doubled its capacity from
250 kg/hour of dried cassava to 500 kg/hour and the flour produced is of better quality.
For instance, the final product of flour has a moisture content of 4.48-6.59%, ash content
of 1.42-1.48%, protein content of 0.51-0.69%. It is white and there is consistency in the
particle size distribution. This achievement is a breakthrough as this flash dryer problem
had almost crippled Nigeria’s efforts in making the cassava industry more competitive.
This good example of effective Private-Public-Partnership (PPP)was a sound initiative; it
increases the projects strength and emphasises its ability to meet challenges.
The dryer was commissioned on 23 August 2008 at the Godiliogo Farms. The event was
Technical Sketch of the Flash Dryer
witnessed by the following: the Acting Governor of Cross River State, Mr Frank Ada
represented by Barrister Fidelis Ugbo, the Chairman of the Obanliku LGA, Dr Godwin
Amaki, the Honourable Minister of RMRDC, represented by Professor A.P. Onwuola,
Director General, RMRDC, the DG of IITA, represented by Dr G. Tarawali, Project
Manager, CEDP and Officer-in-Charge of IITA-Onne Station, prominent
scientists/researchers, notably Dr (Chief) A.G.O. Dixon of IITA and members of the
press.

23
Dignitories at the commissioning
CEDP Project Manager, during his speech and (right) the commissioning
IV.II:
USAID Nigeria Mission Director visits CEDP site ( Ugep, Cross River State)
USAID Mission Director’s Visit to Ugep, Cross River State
The new USAID Mission Director Ms Sharon L. Crome visited one of the Micro
Processing Centres at Ugep, Yakur LGA, Cross River State on 3 September 2008, in
addition to visiting other USAID-sponsored projects, such as Ghain, and EDPA in the
State. The Ugep MPC, along the Calabar-Ikom Road, started the production of gari on 1

24
October 2007. It was built by the Ntabe Farmers Cooperative, with support from IITA
through the USAID/Shell funds. The Cooperative has a membership of 25 adult farmers
(15 women and 10 men).
The MPC is run as a business where members in the community bring their cassava for
processing to gari (peeling, grating, and frying) and pay for these services. The
Cooperative also pool their financial resources to buy cassava tubers which they process
and sell during market days. In this way, this processing facility has touched the lives of
the people in the community by its outstanding contribution towards alleviating the food
security problem in the State. It has also provided income for the members of the
Cooperative and created employment for 6 persons, (3 peelers, 2 operators and 1
supervisor).
During the visit to the Ugep Centre, the Mission Director was astonished at what she
found. She was full of praise for the project and the group. In her words: "This is a
perfect success story that I must tell Washington. I have read so many good reports of
late about this Project, but I don’t think it equaled my impression on this field visit. I am
highly impressed that lives are being touched. I am surprised that a group could be this
coherent and active. Keep up with your spirit”.
The Mission Director was further impressed by the fact that two gari merchants came all
the way from Akwa Ibom State to buy gari from the Ugep Centre. Talking to the Mission
Director, the merchants explained that, in addition to being cheaper, gari from the CEDP
centres is of better quality. Also the high competition for the product in Akwa Ibom
(another CEDP Project State), had forced them to go to Cross River State.
This Processing Center, like the others, is really doing very well and is showing
indications of sustainability. The cooperative have acquired a piece of land on a major
route to the farms in the area. They intend to put up a similar processing center there to
catch the farmers close to the farm gate. In additon, the demand for their product is so
huge that they hardly meet all these requests from far and wide despite increasing the
number of fryers. The Centre has recently bought a motor cycle for the operators to assist
them in executing their activities (see below).

25
Ugep (Cross River State) MPC operator pose on the center’s motorcycle
IV.III Happy Ladies make more money Beneficiaries of our improved cassava stems are now making brilliant businesses out of
them. They sell each bundle of these varieties for between N350-N400. For instance
Happy Ladies Multipurpose Cooperative Society in Ozoro, Delta State, sold to their
registered members at N200 per bundle and N350 per bundle to non-members. This
group
Some Executive members of Happy Ladies Multipurpose Cooperative Society in
Ozoro, Delta State, chatting with the Project Manager and the Station Manager
garnered about N72,000 from stem sales alone. A 7 ha field was established for this
group in 2005 to feed their MPC. Now they have expanded to a 15 ha sole cassava field.
In addition to the cassava processing enterprises Cassava Stem Enterprises contributed to

26
activities that yielded income now being reported. Income from the functional enterprises
that have final products (SMEs, MPCs, ACs only), reporting income in the quarter
amounts to N258,287,127.80 or US$2,188,813.96, This is an improvement of about
142.7% over the 3rd quarter.
IV.IV. Ex-CEDP trainees train new beneficiaries Some private individuals and NGOs who were trained by CEDP on product development
and postharvest technologies were involved in some trainings and exhibitions in Abia
State (see page 19).
IV.V. Other success stories in previous Quarters
October – December 2007
AQUADA Development Cooperation exported 11t of Gari flour to USA
Odourles fufu flour is like gold in Canada, USA and UK
Jon Tudy Foods exported a container load of High Quality Gari (2700bags of
10kg each) to USA.
Awards to our clients in various exhibitions are limitless. In Bayelsa, Rev.
Maxwell Adausi, Chief Enoch Afaria and Chief Eric Isampou got awards. In
Abia, Francis Nwaogu and Monday Chigbu were all award winners, courtesy of
farming/processing experiences from the project.
January – March 2008
• The Agidas MPC at Odi, Bayelsa State, received commendation and an 8 hp
engine from the Federal Ministry of Agriculture and Rural Development on
March 2008. This was in recognition of the good work been done by the centre.
• The Common Fund for Commodities (CFC) an inter-governmental financial
institution under the European Union, lauded CEDP. On 15 April 2008, the CFC
Technical Partners commissioned the extension of the CEDP model to 3 West
African countries (Sierra Leone, Republic of Benin, and Nigeria).
• An MPC in Rukpoku, Rivers State, owned by Mrs Emili Emiri has
metamorphosized into an SME. Mrs Emiri has made so much money from her
MPC that she bought a rotary dryer and other equipment. Now she produces
odourless fufu flour.

27
• CEDP in collaboration with Ekha Agro Farms Limited, Ogun State, built the
largest glucose syrup factory in Africa. This has saved Nigeria $15 million per
annum on importation.
• The CEDP Project Manager, Dr G. Tarawali, was presented a merit award by the
Rural Widows and Orphans Foundation inc. of Imo State on 26 January 2008.
This was in recognition of his services towards empowering the rural widows and
orphans in Nigeria through the supply of cassava germplasm and processing
equipment.
April – June 2008
• The Okpodu SME, Cross River State, was officially handed over to the Cross River State Government and is getting ready to commence production.
• Francisca Nwaogu won 1st Prize for an Individual Farmer with IITA CMD
variety-TME 419
• Elder Monday Chigbu won the 2nd Prize for an Individual Farmer with Odorless
Fufu. Both awards were given during the Exhibition of Agricultural Products on
the Occasion of the Launching of the Year 2008 Cropping Season in Abia State
held on 29 June, 2008 at Umuahia South LGA Head Quarters, Apumiri, Ubakala,
Umuahia, Abia State.
IV. Next quarter’s tasks
Most of the activities that were penciled down for this quarter could not be held because
of shortfall in funds. Depending on the availability of funds, this programme will be
carried out in subsequent quarters and includes the following:
1. Recall staff recentlydisengaged to restore normal activities in Project States
2. Continue work in upgrading and completing unfinished Processing Centers/Facilities.
3. As a matter of urgency commission all the outstanding and completed Processing
Centers especially the SMEs, so as to commence production.
4. Facilitate procurement and fabrication of postharvest equipment for MGEs,
Intervention Centers, MPCs, and SMEs for partners who can afford to buy these
machines.

28
5. Continue the multiplication and distribution of the 10 officially released CMD
cassava resistant varieties in collaboration with partners in the CEDP States.
6. Conduct more on-farm trainings, especially on cassava production, processing, and
enterprise development.
7. Facilitate the Cassava Stakeholders Meeting meant to disseminate CEDP results in
the Project areas and beyond.
8. Step-up the publicity of CEDP activities.
9. Conduct an impact assessment study in consultation with a wide range of
stakeholders.
10. Adopt an exit strateg,y including soliciting funds to windup CEDP activities and
develop a proposal to extend CEDP to the Middle-Belt region (Benue, Kogi and
Nassarawa States)

29
Appendices
Appendix I Sales from various processing enterprises from July to September 2008
State Enterprise LGA July August September Abia MG Ikuwano 10,040 12,720 0 Abia MG Isiala Ngwa N 3770 2250 0 Abia MG Obingwa 25,950 34000 0 Abia MG Obingwa 25200 12100 0 Abia MG Umunneochi 2650 3940 0 Abia MG Isiala Ngwa South 4430 12850 0 Abia MG Isiukwuato 1560 4150 0 Abia MG Umunneochi 6090 6790 0 Abia MG Bende 4900 5700 0 Abia MG Ohafia 8580 7080 0 Abia MG Umuahia South 5450 4500 0 Abia MPC Umuahia North 5140 1090 0 Abia MPC Umuahia South 6500 2750 2310 Abia MPC Umuahia North 8760 9820 0 Abia MPC Osisioma 36520 28,300 7360 Abia MPC Isiala Ngwa North 6080 2,750 480 Abia MPC Umuahia South 9500 8560 0 Abia MPC Umuahia North 14770 40055 0 Abia MPC Ikwuano 8550 16050 0 Abia MPC Ohafia 40000 36000 0 Abia MPC Bende 14,600 24090 0 Abia MPC Arochukwu 9190 0 0 Abia MPC Umuahia North 31150 43505 0 Abia SME Arochukwu 57220 53320 22160 Abia SME Umuahia North 19870 19490 0 Abia SME Arochukwu 16,000 11,700 0 Akwa Ibom MGs Ika 11,150 10,520 9,720 Akwa Ibom MGs Ibiono 10,650 11,140 10,220 Akwa Ibom MGs Ikono 13,100 12,350 11,300 Akwa Ibom MGs Itu 12,220 10,770 8,900 Akwa Ibom MGs Mkpat Enin 9,110 10,100 9,300 Akwa Ibom MGs Ibiono 10,830 9,970 10,120 Akwa Ibom MGs Nsit Ubom 9,670 10,200 9,560 Akwa Ibom MGs Uyo 11,600 12,320 11,820 Akwa Ibom MGs Ini 9,400 11,350 10,800 Akwa Ibom MGs Nsit Atai 15,200 13,700 11,980 Akwa Ibom MGs Iquo Okon Masodi 11,200 10,550 8,200 Akwa Ibom MGs Rev. Fr. Offiong 10,600 9,600 10,150 Akwa Ibom MGs Elder Eka 9,160 10,200 10,600 Akwa Ibom MGs Nelson Akpan 13,120 13,450 12,200 Akwa Ibom MGs Princess Nkoyo Bassey 12,200 12,600 11,450 Akwa Ibom MGs Mr. Edet .A. Offiong 12,640 11,850 10,700 Akwa Ibom MGs Grace Etim Duncan 11,310 10,570 10,400 Akwa Ibom MGs Namnso Etop 14,460 14,700 13,440 Akwa Ibom MGs Prince Enefiok 13,800 14,200 13,800 Akwa Ibom MGs Eneanwan Ita 11,250 11,560 10,920 Akwa Ibom MPCs Nsit Ubium 14,200 13,700 13,250 Akwa Ibom MPCs Mkpat Enin 12,450 12,350 10,500 Akwa Ibom MPCs Ini 0 0 7820

30
Akwa Ibom MPCs Ibesikpo Asutan 13,100 13,550 11,780 Akwa Ibom MPCs Nsit Ibom 11,300 12,150 10,710 Akwa Ibom MPCs Uyo 10,550 11,370 12,140 Akwa Ibom MPCs Itu 8,920 9,800 10,200 Akwa Ibom MPCs Uruan 14,600 14,230 13,650 Akwa Ibom MPCs Okobo 16,220 15,600 14,330 Akwa Ibom MPCs Ukanafun 9,880 10,200 8,760 Akwa Ibom MPCs Eket 11,700 11,320 9,400 Akwa Ibom MPCs Etinan 13,350 14,100 12,950 Akwa Ibom MPCs Abak 10,710 11,220 12,120 Akwa Ibom MPCs Uyo 14,400 14,540 14,300 Akwa Ibom MPCs Ikot Eyo(Bore Hole) 7,400 6,100 5,600 Akwa Ibom MPCs Mkpat Enin 9,650 10,300 10,180 Akwa Ibom SMEs Abak 91,150 89,500 86,150 Akwa Ibom SMEs Uyo 73,000 82,150 77,600 Anambra MG Awka North 19600 20400 0 Anambra MG Njikoka 20,400 20400 0 Anambra MG Idemili South 20,000 19600 0 Anambra MG Orumba North 20,800 20,400 0 Anambra MG Njikoka 0 3000 0 Anambra MG Oyi 2500 2000 0 Anambra MG 0 19600 0 Anambra MPC Ihiala 4,810 3150 0 Anambra MPC Orumba North 31,000 34000 0 Anambra MPC Orumba South 32,100 13250 0 Anambra MPC Idemili 9,700 10100 0 Anambra MPC Ihiala 4,810 3150 0 Anambra MPC Orumba North 31,000 34000 0 Anambra MPC Orumba South 32,100 13250 0 Anambra MPC Idemili 9,700 10100 0 Bayelsa AC Ogbia 10,800 13200 7400 Bayelsa AC Ogbia 11500 22300 12200 Bayelsa AC Ogbia 8900 8100 4300 Bayelsa AC Yenagoa 5900 6300 4500 Bayelsa AC Sagbama 24,800 51600 24,800 Bayelsa AC Sagbama 8300 8700 6800 Bayelsa AC Sagbama 6800 10100 7200 Bayelsa AC Kolokuma/Opokuma 7700 17100 6500 Bayelsa AC Southern Ijaw 26200 32500 28200 Bayelsa AC Southern Ijaw 6800 8500 4900 Bayelsa AC Sagbama 57000 61,900 24200 Bayelsa AC Sagbama 21900 11200 19000 Bayelsa AC Yenagoa 14,200 0 0 Bayelsa AC Sagbama 42,300 37200 16500 Bayelsa AC Yenagoa 9900 8600 4300 Bayelsa MG Southern Ijaw 9100 9900 5000 Bayelsa MG Southern Ijaw 12400 30400 15100 Bayelsa MG Southern Ijaw 7600 11200 4700 Bayelsa MG Southern Ijaw 8000 7000 6000 Bayelsa MG Sagbama 24,200 75200 51000 Bayelsa MG Sagbama 8000 7800 4300 Bayelsa MG Yenagoa 5600 8100 4900 Bayelsa MG Yenagoa 7500 7400 4500 Bayelsa MG Yenagoa 15300 13800 7200

31
Bayelsa MG Yenagoa 11400 9500 8700 Bayelsa MG Ogbia 7900 8800 6600 Bayelsa MG Southern Ijaw 8900 5500 7200 Bayelsa MG Southern Ijaw 6700 5900 5300 Bayelsa MG Southern Ijaw 12400 10500 8000 Bayelsa MG Southern Ijaw 17600 24000 14200 Bayelsa MG Southern Ijaw 14400 19200 11200 Bayelsa MG Yenagoa 9500 10100 7500 Bayelsa MG Yenagoa 7600 7000 4700 Bayelsa MG Southern Ijaw 17800 24700 12300 Bayelsa MG Kolokuma/Opokuma 8800 14100 7000 Bayelsa MPC Ogbia 39,600 53,800 26500 Bayelsa MPC Sagbama 27,200 26700 17,900 Bayelsa MPC Yenagoa 8,300 11,200 5100 Bayelsa MPC Yenagoa 6,400 9200 4600 Bayelsa MPC Ogbia 8,000 11900 9400 Bayelsa MPC Nembe 6,300 5200 4700 Bayelsa MPC Yenagoa 7,500 6300 5600 Bayelsa MPC Sagbama 9,600 11000 9000 Bayelsa MPC Ogbia 11,700 12560 7500 Bayelsa MPC Yenagoa 7,000 6600 8100 Bayelsa MPC Yenagoa 10,100 16700 9300 Bayelsa MPC Yenagoa 12,200 14500 8700 Bayelsa MPC Southern Ijaw 7,200 8500 4300 Bayelsa MPC Kolokuma/Opokuma 14,500 34100 17500 Cross River MG Biase 2,100 2700 3111 Cross River MG Yakurr 3,625 3,150 4,200 Cross River MG Abi 2,000 2000 3180 Cross River MG Abi 2310 2300 3,250 Cross River MG Abi 3600 3,350 2,540 Cross River MG Abi 3,510 3,200 4,100 Cross River MG Odukpani 5870 4819 5,000 Cross River MG Akamkpa 2,110 3,210 3,420 Cross River MG Ogoja 4,127 4,300 3,000 Cross River MPC Obubra 6,120 4,100.00 4,890 Cross River MPC Bekwara 4190 3,568.00 3,290 Cross River MPC Boki 2,980 3,870.00 4,111 Cross River MPC Boki 6,730 4,610.00 5,000 Cross River MPC Odukpani 3,901 3,910.00 4,100 Cross River MPC Ikom 2,670 4,290.00 2,580 Cross River MPC Boki 0 0 1,650 Cross River MPC 0 0 0 2,109 Cross River MPC Yakurr 7,290 6,321 7,500 Delta AC Okpe 12000 20,000 18000 Delta AC Ughelli North 15000 20000 24,000 Delta AC Isoko North 6000 8500 9000 Delta AC Ughelli South 30000 36000 24000 Delta AC Ndokwa West 7500 9000 9750 Delta AC Oshimili South 3500 4300 3100 Delta AC Oshimili South 3600 4500 5000 Delta AC Ughelli North 6600 7000 8500 Delta AC Ethiope West 20000 22700 25750 Delta AC Ughelli South 60000 135000 150000 Delta AC Okpe 2050 5180 6200

32
Delta AC Ughelli North 3000 2500 2400 Delta MG Isoko North 1600 2100 3300 Delta MG Ndokwa west 5400 6200 5800 Delta MG Oshimili South 4200 6050 3900 Delta MG Ughelli North LGA 12,500 19,930 11,000 Delta MG Aniocha North 7500 6000 4500 Delta MG Aniocha South 5800 5000 6400 Delta MG Isoko North 3985 3290 4000 Delta MG Isoko South 3000 3600 4500 Delta MG Isoko South 2015 1930 1650 Delta MG Ughelli North 8250 10,000 24000 Delta MG Oshimili North 3900 5600 3400 Delta MG Isoko South 6000 6300 7500 Delta MPC Isoko North 19000 18000 22000 Delta MPC Bomadi 0 0 5000 Delta MPC Isoko North 5950 5540 9160 Delta MPC Isoko North 0 2500 4500 Delta MPC Sapele 112500 112,500 150000 Delta MPC Ethiope East 1500 2500 3000 Delta MPC Sapele 0 3000 3500 Delta MPC Ughelli North 8000 9000 8500 Delta MPC Ethiope West 7500 8000 8000 Delta MPC Ethiope East 0 31760 100440 Delta MPC Oshimili South 0 69000 60000 Delta SME Sapele 850000 425000 425000 Ebonyi MG Ngbo West 0 4000 0 Ebonyi MPC Edda East 16,000 0 0 Ebonyi MPC Ezzamgbo 13460 13686 0 Edo AC Ikpoba0Okha 12500 13000 12750 Edo AC Orhionmwon 10000 15000 18000 Edo AC Orhionmnmwon 15000 15750 16500
Edo AC Evbonogbon Camp 34 community(NCF) 15000 14850 14500
Edo AC Umoghun0Zuagbor 19450 19000 19750 Edo AC Ughoton community(NCF) 10000 11000 11500 Edo AC Ekewan community(NCF) 15100 15600 15900 Edo AC Owan0East 10000 10500 11000 Edo AC Etsako0East 11750 12000 11500 Edo AC Etsako central 11200 8500 13000 Edo AC Esan South0East 15000 14500 15550 Edo AC Esan South0East 1000 1250 1500 Edo AC Igueben 15400 16400 15900 Edo AC Egor 15350 15850 16100 Edo AC Oredo 17000 17250 18000 Edo MG Etsako West 30000 20000 25000 Edo MG Etsako West 15000 20000 28000 Edo MG Etsako West 18000 24000 22000 Edo MG Owan East 20000 15000 22000 Edo MG Etsako West 20000 23,000 21000 Edo MG Etsako West 23000 15000 17000 Edo MG Ughoton community (NCF) 13250 13000 12750 Edo MG Ekewan community (NCF) 5900 6000 6400 Edo MG Evbonogbon Camp 34 6400 6500 6700 Edo MG Ogba community (NCF) 14250 14000 12850

33
Edo MG Obaszagbon0Nugu 10400 10000 10700 Edo MG Umoghun0Zuagbor 176200 10750 12000 Edo MPC ESAN WST 4750 4850 5250 Edo MPC Ikpoba0Okha 180000 180000 88500 Edo MPC Etsako Central 15000 16500 15600 Edo MPC Orhiomwon 90000 120000 135000 Edo MPC Esan West 0 0 22500 Edo MPC Ikpoba0Okha 45000 0 0
Edo SME Ikoba Okha 2,362,500
5,437,500 5,625,000
Enugu MG Oji River 4110 12160 0 Enugu MG Nsukka 0 4240 0 Enugu MPC Nsukka 6970 7620 0 Enugu MPC Enugu East 1880 3300 4430 Enugu MPC Enugu North 7950 11300 4530 Enugu MPC 0 20000 14000 Enugu SME Nsukka 0 70000 109000 Imo MPC Ohaji 1200 1350 0 Imo MPC Ideato South 0 2110 910 Imo MPC Orsu 0 31280 6880 Rivers AC Eleme 25630 0 0 Rivers AC Eleme 2850 8080 5030 Rivers AC 3000 3350 2500 Rivers MG Ahoda East 0 9200 7800 Rivers MG Etche 5050 1800 1500 Rivers MG Gokana 6760 8650 4890 Rivers MG Eleme 2535 2110 2910 Rivers MG Isiokpo 28000 30000 20000 Rivers MG Kaani 1 KHALGA 0 3340 3270 Rivers MG kwawa KHALGA 23980 27420 0 Rivers MG K0Dere 5550 2990 0 Rivers MG Eleme 0 0 7375 Rivers MG Eleme 5150 7200 4300 Rivers MG Etche 5445 5500 5000 Rivers MG Etche 0 0 6150 Rivers MPC Abua 15900 12000 4000

34
Appendix II
Number of persons employed for the quarter July – September 2008
Employment Data July, '08 August, '08 Sept '08 State LGA Community Status M F O M F O M F O Abia Ikuwano Ariam-Alala MG 1 0 0 1 0 0 1 0 0 Abia Isiala Ngwa S Mgbokonta MG 1 0 0 1 0 0 0 0 0 Abia Obingwa Ossa-Ukwu MG 1 0 1 1 2 2 1 2 2 Abia Obingwa Owo Ahia-afor MG 1 0 0 1 0 0 1 0 0 Abia Umunneochi Obinolu, Ngodo MG 1 0 0 1 0 0 1 0 0 Abia Isiala Ngwa South Amairi, Umuoba MG 1 0 0 1 0 0 1 0 0 Abia Isiukwuato Umudiya, Amaeke Ovim MG 1 0 0 1 0 0 1 0 0 Abia Umunneochi Umumeze Amuda, Isuochi MG 1 0 0 1 0 0 0 0 0 Abia Bende Ikot Ugo-Okopedi, Itumbazo MG 1 0 0 1 0 0 1 0 0 Abia Ohafia Amaekpu MG 1 0 0 1 0 0 0 0 0 Abia Umuahia South Ogbodiukwu, Umuahia MG 1 0 0 1 0 0 1 0 0 Abia Umuahia North Uhabiri Ossah MPC 1 0 0 1 0 0 0 0 0 Abia Umuahia South Umuabali MPC 1 0 0 1 0 0 0 0 0 Abia Osisioma Osisioma MPC 1 0 0 1 0 0 1 0 0 Abia Umuahia South Ohiya MPC 2 0 0 2 0 0 2 0 0 Abia Umuahia North Umukabia Umuagbom MPC 1 0 1 1 0 1 1 0 1 Abia Umuahia South Umuobutu, Old Umuahia MPC 2 0 0 2 0 0 2 0 0 Abia Ikwuano Nchara-Oloko MPC 2 0 0 2 0 0 2 0 0 Abia Ohafia Amurie, Nkporo, O MPC 2 0 0 1 0 0 1 0 0 Abia Bende Okafia MPC 2 1 0 2 1 0 2 1 0 Abia Umuahia North Azueke Ndume MPC 1 0 0 1 0 0 1 0 0 Abia Obingwa Owo Ahia-afor MPC 1 1 0 1 1 0 1 1 0 Abia Umuahia South Old Umuahia SME 4 2 4 4 2 4 0 0 0 Abia Arochukwu Achara-Ihechiowa SME 2 2 0 2 2 0 2 2 0 Abia Umuahia North Umuahia SME 1 0 0 1 0 0 1 0 0 Anambra Orumba North Ndiloegbe-nachi, Ndiopalaeze MG 1 1 0 1 1 0 1 1 0 Anambra Ihiala Okohia-Ihiala MPC 1 1 0 1 1 0 1 1 0 Anambra Orumba North Umunze MPC 0 0 0 2 1 0 0 0 0 Anambra Orumba South Norfijia-Umuawayi-Umueji MPC 0 0 0 1 0 0 1 0 0 Anambra Idemili Obosi MPC 1 0 0 1 0 0 0 0 0 Anambra Oyi Umuefi-Eziagu, Nteje MPC 0 0 0 0 0 0 1 0 0 Anambra Ihiala Umuhu-Okija MPC 1 1 0 1 1 0 0 0 0 Anambra Ihiala Okohia-Ihiala MPC 21 10 12 21 10 12 18 10 6 Anambra Orumba North Umunze MPC 25 20 12 18 15 12 20 12 4 Ebonyi Abakaliki Ebia Umuhu MG 1 1 0 1 1 0 1 1 0 Ebonyi Ohaukwu Ndiegwu MG 1 1 0 1 1 0 1 1 0 Ebonyi Afikpo Mgbom MG 1 1 0 1 1 0 1 1 0 Ebonyi Ohaozara Ogwu Uburu MG 1 1 0 1 1 0 1 1 0 Ebonyi Ezza Amanna MG 1 1 0 1 1 0 1 1 0 Ebonyi Ngbo West Umuogudu Akpu MG 1 1 0 1 1 0 1 1 0 Ebonyi Ngbo West Egwegwo MG 1 1 0 1 1 0 1 1 0 Ebonyi Ngbo West Ndaburuebenyi MG 1 1 0 1 1 0 1 1 0 Ebonyi Ngbo West Ndaburuebenyi MG 1 1 0 1 1 0 1 1 0 Ebonyi Ikwo Onuebonyi MG 1 1 0 1 1 0 1 1 0 Ebonyi Ohaukwu Umuebe-Amovu MG 1 1 0 1 1 0 1 1 0 Ebonyi Ishielu Ezillo MG 1 1 0 1 1 0 1 1 0 Ebonyi Ngbo Central Ndiagu Aleke MG 1 1 0 1 1 0 1 1 0 Ebonyi Ngbo East Ngbo Court Area MG 1 1 0 1 1 0 1 1 0 Ebonyi Ngbo East Ngbo Court Area MG 1 1 0 1 1 0 1 1 0

35
Enugu Uzo Uwani Nimbo MG 1 3 0 0 0 0 0 0 0 Enugu Oji River Agbaleinyi MG 1 0 0 1 0 0 1 0 0 Enugu Uzo-uwani Adani MPC 2 0 0 0 0 0 0 0 0 Enugu Nsukka Obimo MPC 1 0 0 1 0 0 1 0 0 Enugu Enugu East Alulu Nike-Uno MPC 1 0 0 0 0 0 0 0 0 Enugu Enugu North Akpuoga Nike MPC 1 0 0 1 0 0 1 0 0 Enugu Uzo-uwani Adani SME 2 2 5 2 2 5 2 2 5
Imo Ideato South Ugochinyere Okohia Women group MPC 1 1 0 1 1 0 1 1 0
Imo ORSU Amaraihe Cooperative Soc. MPC 2 3 4 0 0 0 0 0 0 A'Ibom Ika Urua Inyang MGs 2 1 0 2 1 0 2 1 0 A'Ibom Ibiono Mbiabiam MGs 1 1 0 2 1 0 2 1 0 A'Ibom Ikono Nnung Ukim MGs 2 1 0 2 1 0 2 1 0 A'Ibom Itu Ekit Itam 2 MGs 2 1 0 2 1 0 2 1 0 A'Ibom Mkpat Enin Asong MGs 0 2 0 2 1 0 2 1 0 A'Ibom Ibiono Afia MGs 0 2 0 2 1 0 1 2 0 A'Ibom Nsit Ubom Obotim MGs 2 1 0 2 1 0 2 1 0 A'Ibom Uyo Nnung Asang MGs 2 1 0 2 1 0 2 1 0 A'Ibom Ini Ibam Edet MGs 2 1 0 2 1 0 2 1 0 A'Ibom Nsit Atai Ndang Nsit MGs 2 1 0 2 1 0 1 2 0
A'Ibom Iquo Okon Masodi Urue Offong-Oruko(10 Iita Fe 5866) MGs 1 1 0 2 1 0 2 1 0
A'Ibom Rev. Fr. Offiong
Uruan(04 Iita Fe 5864) MGs 2 1 0 2 1 0 1 2 0 A'Ibom Elder Eka Uyo(02 Iita Fe 5864) MGs 2 1 0 2 1 0 2 1 0 A'Ibom Nelson Akpan Etinan(01 Iita Fe 5859) MGs 1 1 0 2 1 0 1 2 0
A'Ibom Princess Nkoyo Bassey Oron(05 Iita Fe 5061) MGs 0 2 0 2 1 0 2 1 0
A'Ibom Mr. Edet .A. Offiong Onna(03 Iita Fe 5862) MGs 2 1 0 2 1 0 2 1 0 A'Ibom Grace Etim Duncan Udung Uko(06 Iita Fe 5867) MGs 2 1 0 2 1 0 1 2 0 A'Ibom Namnso Etop Ibesikpo(07 Iita Fe 5860) MGs 2 1 0 2 1 0 2 1 0 A'Ibom Prince Enefiok Uruan(08 Iita Fe 5863) MGs 0 2 0 2 1 0 1 2 0 A'Ibom Eneanwan Ita Mbo(09 Iita Fe 5869) MGs 2 1 0 2 1 0 3 0 0 A'Ibom Nsit Ubium Ikot Eyo MPCs 2 1 0 3 0 0 2 1 0 A'Ibom Mkpat Enin Ikot Obio Nso MPCs 2 1 0 2 2 0 3 1 0 A'Ibom Ini Ogu Itu MPCs 3 1 0 3 1 0 3 1 0 A'Ibom Ibesikpo Asutan Okop Ndua Erong MPCs 3 1 0 2 1 0 2 2 0 A'Ibom Nsit Ibom Afia Nsit Urua Nko MPCs 3 0 0 1 2 0 3 0 0 A'Ibom Uyo Nwaniba Road MPCs 3 0 0 1 1 0 3 0 0 A'Ibom Itu Aka Itam MPCs 3 0 0 1 1 0 2 1 0 A'Ibom Uruan Mbiaya MPCs 1 1 0 2 1 0 1 2 0 A'Ibom Okobo Okopedi MPCs 2 1 0 2 1 0 2 1 0 A'Ibom Ukanafun Ikot Antia Afaha Obo MPCs 2 1 0 2 0 0 2 1 0 A'Ibom Eket Mkpok Village MPCs 2 0 0 2 1 0 1 2 0 A'Ibom Etinan Awa Ntong MPCs 2 0 0 2 1 0 2 1 0 A'Ibom Abak Onuk Ukpom MPCs 1 2 0 2 1 0 3 1 0 A'Ibom Uyo Barracks Road End MPCs 2 1 0 2 1 0 2 1 0 A'Ibom Ikot Eyo(Bore Hole) MPCs 3 0 0 2 1 0 2 1 0 A'Ibom Mkpat Enin Ikot Ekong MPCs 2 0 0 2 0 0 0 2 0 A'Ibom Abak Ikot Etukudo SMEs 8 27 0 8 31 0 8 31 0
A'Ibom Uyo #6 Phenson Street, Abak Road Housing SMEs 4 8 0 5 10 0 7 16 0
Bayelsa Ogbia Emeyal II AC 3 10 7 3 10 7 3 10 7 Bayelsa Ogbia Yiba-ama AC 2 0 1 2 0 1 2 0 1 Bayelsa Ogbia Otuasega AC 1 0 1 1 0 1 1 0 1 Bayelsa Ogbia Emeyal 11 AC 1 0 0 1 0 0 1 0 0

36
Bayelsa Yenagoa Ogu AC 1 0 0 1 0 0 1 0 0 Bayelsa Sagbama Isoni AC 2 0 2 2 0 2 2 0 2 Bayelsa Sagbama Ebedebiri AC 1 0 0 1 0 0 1 0 0 Bayelsa Sagbama Toru-orua AC 1 0 0 1 0 0 1 0 0 Bayelsa KolokumaOpokuma Orubiri AC 1 0 1 1 0 1 1 0 1 Bayelsa Southern Ijaw Azama AC 1 0 0 1 0 0 1 0 0 Bayelsa Southern Ijaw Oporoma AC 1 0 0 1 0 0 1 0 0 Bayelsa Sagbama 0ssiama AC 1 1 2 1 1 2 1 1 2 Bayelsa Sagbama Akkeddei AC 1 0 1 1 0 1 1 0 1 Bayelsa Yenagoa Edepie AC 1 3 1 1 3 1 1 3 1 Bayelsa Yenagoa Agudama AC 0 1 0 0 1 0 0 1 0 Bayelsa Southern Ijaw Olugbobiri MG 1 0 6 1 0 6 1 0 6 Bayelsa Southern Ijaw Kassama MG 0 0 10 0 0 10 0 0 10 Bayelsa Southern Ijaw Igeibiri MG 1 0 9 1 0 9 1 0 9 Bayelsa Southern Ijaw Amassoma MG 0 0 5 0 0 5 0 0 5 Bayelsa Sagbama Egbopuloama MG 4 8 25 4 8 25 4 8 25 Bayelsa Sagbama Odoni MG 0 0 6 0 0 6 0 0 6 Bayelsa Yenagoa Akaba MG 0 0 9 0 0 9 0 0 9 Bayelsa Yenagoa Yenaka MG 0 2 8 0 2 8 0 2 8 Bayelsa Yenagoa Bumoundi-gbene MG 0 8 7 0 8 7 0 8 7 Bayelsa Yenagoa Ikibiri MG 2 0 8 2 0 8 2 0 8 Bayelsa Ogbia Epebu MG 0 0 2 0 0 2 0 0 2 Bayelsa Southern Ijaw Ikebiri MG 0 0 2 0 0 2 0 0 2 Bayelsa Southern Ijaw ukubie MG 3 4 3 3 4 3 3 4 3 Bayelsa Southern Ijaw Angiama MG 1 0 1 1 0 1 1 0 1 Bayelsa Southern Ijaw Emete MG 0 0 2 0 0 2 0 0 2 Bayelsa Southern Ijaw Ekowe MG 0 0 2 0 0 2 0 0 2 Bayelsa Yenagoa Obunagha MG 1 0 1 1 0 1 1 0 1 Bayelsa Yenagoa Famgbe MG 1 0 1 1 0 1 1 0 1 Bayelsa Yenagoa Otuan MG 0 0 3 0 0 3 0 0 3 Bayelsa KolokumaOpokuma Ayakoroma MG 0 1 0 0 1 0 0 1 0 Bayelsa Ogbia Elebele MPC 1 3 1 1 3 1 1 3 1 Bayelsa Sagbama Sagbama MPC 1 0 5 1 0 5 1 0 5 Bayelsa Yenagoa Nedugo-Agbia MPC 1 1 1 1 1 1 1 1 1 Bayelsa Yenagoa Obogoro MPC 1 0 1 1 0 1 1 0 1 Bayelsa Ogbia Anyama MPC 0 0 1 0 0 1 0 0 1 Bayelsa Brass Brass MPC 1 0 0 1 0 0 1 0 0 Bayelsa Nembe Alagoa-Tereke MPC 0 0 2 0 0 2 0 0 2 Bayelsa Yenagoa Azikoro MPC 0 0 2 0 0 2 0 0 2 Bayelsa Sagbama Elemebiri MPC 0 0 1 0 0 1 0 0 1 Bayelsa Ogbia Otuokpoti MPC 0 1 2 0 1 2 0 1 2 Bayelsa Yenagoa Biseni MPC 0 0 2 0 0 2 0 0 2 Bayelsa Yenagoa Yenegwe MPC 0 0 4 1 0 4 1 0 4 Bayelsa Yenagoa Yenaka MPC 0 0 3 0 0 3 0 0 3 Bayelsa Southern Ijaw Okubie MPC 1 2 2 1 2 2 1 2 2 Bayelsa KolokumaOpokuma Odi MPC 0 0 2 0 0 2 0 0 2 Bayelsa Sagbama Tungbo MPC 0 3 2 0 3 2 0 3 2 Edo Ikpoba-Okha Igboekpen AC 3 1 0 3 1 0 3 1 0 Edo Orhionmwon Ikobi Village AC 1 0 0 1 0 0 1 0 0 Edo Orhionmnmwon Ugo Village AC 1 0 3 1 0 3 1 0 3 Edo Ovia South Ekiadolor AC 3 0 0 3 0 0 3 0 0 Edo Evbonogbon Camp 34 community(NCF) AC 0 5 0 0 5 0 0 5 0 Edo Umoghun-Zuagbor AC 0 5 0 0 5 0 0 5 0 Edo Ughoton community(NCF) AC 0 5 0 0 5 0 0 5 0

37
Edo Ekewan community(NCF) AC 0 5 0 0 5 0 0 5 0 Edo Owan-East Evbiamen AC 2 1 0 2 1 0 2 1 0 Edo Etsako-East AC 2 0 0 2 0 0 2 0 0 Edo Etsako central AC 3 2 0 3 2 0 3 2 0 Edo Esan South-East AC 1 0 0 1 0 0 1 0 0 Edo Esan South-East AC 1 2 0 1 2 0 1 2 0 Edo Igueben AC 2 3 0 2 3 0 2 3 0 Edo Egor AC 2 0 0 2 0 0 2 0 0 Edo Oredo AC 2 1 0 2 1 0 2 1 0 Edo ESAN WST WARRAKE MPC 2 0 0 2 0 0 2 0 0 Edo Ikpoba-Okha Oghoghobi MPC 6 5 11 6 5 11 6 5 13 Edo Etsako Central Fugar MPC 2 0 4 2 0 4 2 0 4 Edo Orhiomwon Iguelaba MPC 6 4 9 6 4 9 6 4 9 Edo Esan West Ekpoma MPC 0 0 0 0 0 0 1 3 0 Edo Ikpoba-Okha Benin-City MPC 5 2 2 5 2 2 5 2 2 Edo Ovia South Ofunwengbe Village MG 0 1 0 0 1 0 0 1 0 Edo Etsako West Iyanmo Village MG 2 0 0 2 0 0 2 0 0 Edo Etsako West Igbei Village MG 1 0 0 1 0 0 1 0 0 Edo Etsako West Iddato Village MG 1 1 0 2 0 0 2 0 0 Edo Owan East Ebuleken-Ivbiaro MG 1 1 0 1 1 0 1 1 0 Edo Owan East Ogute Village MG 1 1 0 1 1 0 1 1 0 Edo Etsako West Nsegu Village MG 3 0 0 3 0 0 3 0 0 Edo Etsako West Aviele Village MG 2 0 0 2 0 0 2 0 0 Edo Ughoton community(NCF) MG 3 2 0 3 2 0 3 2 0 Edo Ekewan community(NCF) MG 3 2 0 3 2 0 3 2 0 Edo Evbonogbon Camp 34 community(NCF) MG 1 4 0 1 4 0 1 4 0 Edo Ogba community (NCF) MG 5 0 0 5 0 0 5 0 0 Edo Obaszagbon-Nugu MG 0 5 0 0 5 0 0 5 0 Edo Umoghun-Zuagbor MG 4 1 0 4 1 0 4 1 0 Edo IKPOBA OKHA Vessa Cassava International Ltd. SME 101 99 200 101 99 220 101 99 220 Delta Okpe Okpe AC 1 1 0 1 1 0 1 1 0 Delta Ughelli North Ughelli North AC 1 1 0 1 1 0 1 1 0 Delta Isoko North Isoko North AC 1 1 0 1 1 0 1 1 0 Delta Ughelli South Ughelli South AC 2 1 0 2 1 0 2 1 0 Delta Ndokwa West Ndokwa West AC 1 0 0 1 0 0 1 0 0 Delta Oshimili South Oshimili South AC 1 0 0 1 0 0 1 0 0 Delta Oshimili South Oshimili South AC 1 0 0 1 0 0 1 0 0 Delta Ughelli North Ughelli North AC 0 1 0 0 1 0 0 1 0 Delta Ethiope West Ethiope West AC 1 1 0 1 1 0 1 1 0 Delta Ughelli South Ughelli South AC 4 11 0 4 11 0 4 13 0 Delta Okpe Okpe AC 1 0 0 1 0 0 1 0 0 Delta Isoko North Isoko North MG 1 0 0 1 0 0 1 0 0 Delta Ndokwa west Ndokwa west MG 1 0 0 1 0 0 1 0 0 Delta Aniocha North Aniocha North MG 1 0 0 1 0 0 1 0 0 Delta Oshimili South Oshimili South MG 0 1 0 0 1 0 0 1 0 Delta Ughelli North LGA Ughelli North LGA MG 2 1 0 2 1 0 2 1 0 Delta Aniocha North Aniocha North MG 1 0 0 1 0 0 1 0 0 Delta Aniocha South Aniocha South MG 2 0 0 2 0 0 2 0 0 Delta Patani Patani MG 1 0 0 1 0 0 1 0 0 Delta Isoko North Isoko North MG 2 0 0 2 0 0 2 0 0 Delta Isoko South Isoko South MG 0 2 0 0 2 0 0 2 0 Delta Isoko South Isoko South MG 1 0 0 1 0 0 1 0 0 Delta Ughelli North Ughelli North MG 2 0 0 2 0 0 2 0 0 Delta Oshimili North Oshimili North MG 0 1 0 0 1 0 0 1 0

38
Delta Isoko South Isoko South MG 1 0 0 1 0 0 1 0 0 Delta Isoko North Isoko North MPC 1 1 0 1 1 0 1 1 0 Delta Bomadi Bomadi MPC 0 0 0 0 0 0 1 1 0 Delta Isoko North Isoko North MPC 2 0 0 2 0 0 2 0 0 Delta Isoko North Isoko North MPC 1 1 0 1 1 0 1 1 0 Delta Sapele Sapele MPC 2 1 0 2 1 0 2 1 0 Delta Ethiope East Ethiope East MPC 1 1 0 1 1 0 1 1 0 Delta Ughelli North Ughelli North MPC 2 0 0 2 0 0 2 0 0 Delta Ethiope West Ethiope West MPC 1 0 0 1 0 0 1 0 0 Delta Oshimili South Oshimili South MPC 4 12 6 4 12 6 4 12 6 Delta Ethiop East Ethiop East MPC 4 8 0 4 8 0 4 8 0 Delta Sapele Sapele SME 6 0 0 6 0 0 6 0 0 C'River Biase Aparavuni MG 2 1 0 3 0 0 2 1 0 C'River Yakurr Ugep MG 3 0 0 2 1 0 3 0 0 C'River Abi Agbara MG 2 1 0 3 0 0 3 0 0 C'River Abi Anong MG 2 1 0 2 1 0 2 1 0 C'River Abi Itigidi MG 2 1 0 2 1 0 2 1 0 C'River Abi Ekureku MG 2 1 0 2 1 0 2 1 0 C'River Odukpani Okoyong MG 2 1 0 2 1 0 2 1 0 C'River Akamkpa Oban MG 2 1 0 2 1 0 2 1 0 C'River Ogoja Mbube MG 2 1 0 2 1 0 2 1 0 C'River Obubra Iyamoyong MPC 2 0 0 2 0 0 2 0 0 C'River Bekwara Ukpah MPC 2 2 0 2 2 0 2 2 0 C'River Boki Bamba MPC 2 1 0 2 1 0 2 1 0 C'River Boki Kanyang MPC 2 0 0 2 0 0 2 0 0 C'River Odukpani Okurikang MPC 3 0 0 3 0 0 3 0 0 C'River Ikom Okuni MPC 3 0 0 3 0 0 3 0 0 C'River Akpabuyo MPC 2 0 0 2 0 0 2 0 0 C'River Boki Ebbaken-Boje MPC 2 1 0 2 1 0 2 1 0 C'River - MPC 2 0 0 2 0 0 2 0 0 C'River Yakurr Ugep MPC 2 0 0 2 0 0 2 0 0 C'River Biase Ehom MPC 2 1 0 2 1 0 2 1 0 C'River Calabar FTZ Obubra SME 11 2 0 11 3 0 11 9 0 C'River Obanliku Beebi SME 7 11 0 7 14 0 7 18 0 C'River Yala Ijegu SME 9 16 0 9 11 0 9 12 0 C'River Yala SME 5 3 0 5 3 0 5 3 0 River Eleme Eleme AC 1 0 0 0 0 0 0 0 0 River Eleme Eleme AC 1 1 0 1 1 0 1 1 2 River AC 1 0 0 1 0 0 1 0 0 River Ahoda East Ahoda East MG 1 0 0 1 0 0 1 0 0 River Gokana Gokana MG 1 0 0 2 1 0 0 0 0 River Eleme Eleme MG 1 0 0 1 0 0 0 0 0 River Kaani 1 KHALGA Kaani 1 KHALGA MG 0 0 0 0 0 0 2 2 4 River Borobara Tai Borobara Tai MG 1 1 0 1 1 0 1 0 2 River K-Dere K-Dere MG 1 0 0 1 0 0 1 0 0 River Eleme Eleme MG 2 0 0 2 0 0 2 0 0 River Etche Etche MG 2 0 0 2 0 0 2 0 0 River Ikwerre Ikwerre MPC 1 0 0 1 0 0 1 0 0 River Omuma Omuma MG 1 3 0 1 3 0 1 3 0 River Ahoada Ahoada SME 6 4 0 6 4 0 6 4 4

39
Appendix III
Number of clients patronising the Enterprises
No of Clients State LGA Community Status July August September Abia Ikuwano Ariam-Alala MG 64 103 85 Abia Isiala Ngwa S Mgbokonta MG 14 13 0 Abia Obingwa Ossa-Ukwu MG 49 41 29 Abia Obingwa Owo Ahia-afor MG 18 215 16 Abia Umunneochi Obinolu, Ngodo MG 9 12 5 Abia Isiala Ngwa South Amairi, Umuoba MG 76 121 102 Abia Isiukwuato Umudiya, Amaeke Ovim MG 27 26 8 Abia Umunneochi Umumeze Amuda, Isuochi MG 221 161 Abia Bende Ikot Ugo-Okopedi, Itumbazo MG 48 123 59 Abia Ohafia Amaekpu MG 23 46 Abia Umuahia South Ogbodiukwu, Umuahia MG 29 43 30 Abia Umuahia North Uhabiri Ossah MPC 6 28 Abia Umuahia South Umuabali MPC 24 18 Abia Osisioma Osisioma MPC 410 336 152 Abia Umuahia South Ohiya MPC 99 117 23 Abia Umuahia North Umukabia Umuagbom MPC 398 367 454 Abia Umuahia South Umuobutu, Old Umuahia MPC 323 262 108 Abia Ikwuano Nchara-Oloko MPC 219 211 219 Abia Ohafia Amurie, Nkporo, O MPC 55 51 37 Abia Bende Okafia MPC 393 414 589 Abia Umuahia North Azueke Ndume MPC 17 22 45 Abia Obingwa Owo Ahia-afor MPC 6 6 70 Abia Umuahia South Old Umuahia SME 196 204 0 Abia Arochukwu Achara-Ihechiowa SME 132 132 127 Abia Umuahia North Umuahia SME 18 15 8 Anambra Ihiala Okohia-Ihiala MPC 31 16 6 Anambra Orumba North Umunze MPC 0 276 0 Anambra Orumba South Norfijia-Umuawayi-Umueji MPC 0 177 197 Anambra Idemili Obosi MPC 96 102 0 Anambra Oyi Umuefi-Eziagu, Nteje MPC 0 0 17 Anambra Ihiala Umuhu-Okija MPC 2 2 2 Ebonyi Ngbo West Umuogudu Akpu MG 20 15 0 Ebonyi Ngbo West Egwegwo MG 20 0 0 Enugu Uzo-uwani Adani IC 110 0 0 Enugu Oji River Agbaleinyi MG 248 331 155 Enugu Nsukka Obimo MPC 21 5 1 Enugu Enugu North Akpuoga Nike MPC 64 114 88 Enugu Uzo-uwani Adani SME 64 4 2 Imo Ideato South Umuofeke, Okohia MPC 14 13 3 Imo ORSU Ubahaeze, Awo-Idemili MPC 19 0 0 Bayelsa Ogbia Yiba-ama AC 76 127 96 Bayelsa Ogbia Otuasega AC 141 201 104 Bayelsa Ogbia Emeyal 11 AC 57 66 39 Bayelsa Yenagoa Ogu AC 43 65 48 Bayelsa Sagbama Isoni AC 76 185 117 Bayelsa Sagbama Ebedebiri AC 53 94 79 Bayelsa Sagbama Toru-orua AC 45 102 61 Bayelsa Kolokuma/Opokuma Orubiri AC 55 127 98 Bayelsa Southern Ijaw Azama AC 197 200 153 Bayelsa Southern Ijaw Oporoma AC 54 97 67 Bayelsa Sagbama 0ssiama AC 121 204 153 Bayelsa Sagbama Akkeddei AC 109 198 130

40
Bayelsa Yenagoa Agudama AC 67 59 51 Bayelsa Southern Ijaw Olugbobiri MG 87 129 45 Bayelsa Southern Ijaw Kassama MG 120 235 134 Bayelsa Southern Ijaw Igeibiri MG 67 143 187 Bayelsa Southern Ijaw Amassoma MG 54 87 67 Bayelsa Sagbama Egbopuloama MG 198 211 112 Bayelsa Sagbama Odoni MG 65 98 64 Bayelsa Yenagoa Akaba MG 43 76 54 Bayelsa Yenagoa Yenaka MG 37 81 43 Bayelsa Yenagoa Bumoundi-g MG 76 105 87 Bayelsa Yenagoa Ikibiri MG 78 131 83 Bayelsa Ogbia Epebu MG 62 87 79 Bayelsa Southern Ijaw Ikebiri MG 55 67 57 Bayelsa Southern Ijaw ukubie MG 34 48 28 Bayelsa Southern Ijaw Angiama MG 91 102 57 Bayelsa Southern Ijaw Emete MG 52 91 80 Bayelsa Southern Ijaw Ekowe MG 55 64 70 Bayelsa Yenagoa Obunagha MG 67 91 85 Bayelsa Yenagoa Famgbe MG 56 69 49 Bayelsa Southern Ijaw Otuan MG 155 172 102 Bayelsa Kolokuma/Opokuma Ayakoroma MG 61 121 110 Bayelsa Ogbia Elebele MPC 234 288 187 Bayelsa Sagbama Sagbama MPC 176 169 106 Bayelsa Yenagoa Nedugo-Agbia MPC 45 54 22 Bayelsa Yenagoa Obogoro MPC 98 108 45 Bayelsa Ogbia Anyama MPC 55 86 47 Bayelsa Nembe Alagoa-Tereke MPC 33 39 19 Bayelsa Yenagoa Azikoro MPC 66 63 45 Bayelsa Sagbama Elemebiri MPC 98 124 64 Bayelsa Yenagoa Biseni MPC 68 97 59 Bayelsa Yenagoa Yenaka MPC 97 131 64 Bayelsa Southern Ijaw Okubie MPC 41 48 32
Appendix IV
Groups/Farmers, Farm size and Quantity of Cassava Stems Sold
State LGA Community Name of Farm/Farmer/Group Farm
size(ha)
Qty of stems sold
Anambra Ihiala Umuhu-Okija Jubilee Nnewi Farmers Multipurpose Coop. Soc. Ltd. 35 350
Anambra Orumba South
Norfijia-Umuawayi-Umueji
Mr. Ernest Ikechukwu Nwabuike (08034244230) 9 125
Anambra Ihiala Okohia-Ihiala Immaculate CWO Okohia-Ihiala-(Rev.F. Cletus ) 43.5 410
Ebonyi Edda East Owutu Cassava Initiatives for Rural Women & youths/Ngozi Okorie (08080271678) 7.5 420
Ebonyi Ezzamgbo Amike-Izhia Friendship Multipurpose Coop. Soc./Alhaji Bello Amadi(08037717653) 6 125
Enugu Uzo-uwani Adani The Ezienyi Farmer's Multi-purpose Coop Society Ltd 25 155
Enugu Nsukka Okutu Okutu Multi-purpose Farmer's Coop Union 25 230 Enugu Enugu East Alulu Nike-Uno Judoan Umunne Elite Farmers 20 320 Enugu Uzo-Uwani Adani Ugomentus 35 400
Bayelsa Sagbama Egbopuloama Greater Evangelism Worlg Crusade Farmers coop. 4.5 55
Bayelsa Sagbama Sagbama The Adausi group (Sagbama) farmers 41 120

41
cooperative society Ltd Bayelsa Yenagoa Nedugo-Agbia Kemebigha farmers coop. society Ltd 5.3 60
Bayelsa Yenagoa Obogoro Ogbo-esuevie casava farmers association 4 85
Bayelsa Ogbia Anyama Anyama farmers coop.society Ltd 6.8 70 Bayelsa Brass Brass Brass farmers coop.society Ltd 4.1 40
Bayelsa Nembe Alagoa-Tereke Pada farmers multipurpose coop. society Ltd 3.5 50
Bayelsa Yenagoa Azikoro Ovievie farmers coop. society ltd 3.5 25 Bayelsa Sagbama Elemebiri Ebiakpo farmers coop.society Ltd 4 35
Bayelsa Ogbia Otuokpoti Cassava crop devt( Otuokpoti) farmers coop.soc.Ltd 4 40
Bayelsa Yenagoa Yenegwe KGA Agro services company ltd 3.5 40 Bayelsa Sagbama 0ssiama Aladei Multi purpose Coop. 2.8 20 Delta Isoko North Ozoro Happy Ladies multipurpose Coop Soc. 15 360 Delta Isoko North Otor-Iyede Ewoma Iyede Women's Farmers Coop. Soc 35 250
Delta Ughelli North Edjekota
Drena Farms* 15 300
Delta Oshimili South
Aniogor-ejeme John Tudy Farms 35 180
Appendix V Students of Obasuyi College – Delta State
Trained on Product Development JULY 3, 2008
S/N NAME GENDER 1 Sedi Alasa M 2 Osaghae ayo M 3 Mathew ukpe M 4 P.O Itua F 5 I.O Legogie M 6 Veronica Onomute F 7 Charles Legogie M 8 Deacon ojo M 9 Godspower Akpoirere M
10 F.O Ojeaga F 11 C.O Ejanorhaze M 12 R.Obakpolor M 13 M. okosun F 14 Gladys Atikui F 15 Vero Ukpamen F 16 Gloria Aghimah F 17 Chairty Eboigbe F 18 Bnenda Abdulahi F 19 Rakoczi Etchie D M 20 Obediah Aron M 21 Sunday Anetor M 22 Emillie Anetor F 23 Ogu Sunday M 24 Jim Owei M 25 S.E Ogbeide M
42
26 George Ojugbeli M 27 R.Akpofurere F 28 John Osagie M 29 Williams Ejedegba M 30 Micheal E. Ojo M 31 Nosa Obanor M 32 Patience OKOSUN F 33 2nd Comm.& Student M 34 Pa Nagbonma M 35 Patrick Odighi M 36 Nicholas Idahosa M 37 Francis Alonge M 38 B. Odighi F 39 Vic Ogbawe F 40 Dorw onogieru F 41 Grace Odighi F 42 Blessing Osaru F 43 Joy Osagiede F 44 Iroghama okoyom F 45 Isreall Obuseh M 46 Chucks Odiqwe M 47 Comfort Enogieru F 48 Monday Obianugba M 49 Monday Augustine M 50 Joy Ayomonica F 51 Faith Taire F 52 Franklyn Obi M 53 Ijeomah Doris F 54 Helen Agbonam F 55 Omor Okojie F 56 Okonkwo Hyginus M 57 Glory Agbenro F 58 Helen Sirumi F 59 Joy Emmanuel M 60 Ngozi Chimsonu F 61 Osifo Lawrence M 62 Igba Louis M 63 Chibuzor Kingsly M 64 Osaretin Odighi M 65 Chibuzor Isioma F 66 Osare Goodluck M 67 Osazuwa Osametin M 68 Otuwho Joy F 69 Nwose Franca F 70 Oseretin Nelson M 71 Igiede Osayade M

43
Appendix VI Umuahia Women FBO Trained by Mrs. Ihueze on Product Development 10 August, 2008
S/No Name of participant Gender Location 1 Grace Meribe F Umuahia South LGA 2 Mrs Evelyn E. Ezeria F Umuahia South LGA 3 Mrs Ednah Ogbonna F Umuahia South LGA 4 Lady Dorothy Nwala F Umuahia South LGA 5 Comfort Sampson F Umuahia South LGA 6 E. Ekenta F Umuahia South LGA 7 Faith Kamalu F Umuahia South LGA 8 Blessing Nwogu F Umuahia South LGA 9 Amaechi Okere F Umuahia South LGA
10 Uluma Onwubido F Umuahia South LGA 11 Udealisi Udoka F Umuahia South LGA 12 Mercy Okoronkwo F Umuahia South LGA 13 Marcilliana Umezumuke F Umuahia South LGA