Embed Size (px)
Citation preview
Quantum chemical study of the structure and properties of
isotopically pure lead chalcogenides
O Kh Poleshchuk1,2
, N B Egorov
1, D V Akimov
1, I I Zherin
1 and N A Zhuravlev
1
1National Research Tomsk Polytechnic University, 30 Lenina ave., Tomsk, 634050,
Russia 2 Tomsk State Pedagogical University, 60 Kievskaya street, Tomsk, 634061, Russia,
E-mail: [email protected]
Abstract. In the present work the theoretical methods B3LYP/SDD, GGA and BP86/TZ2P
were used for quantum-chemical calculations of lead chalcogenides. It is shown that these
levels of theory are applicable for assessment of their geometric parameters, Raman and IR
spectra and thermodynamic characteristics. It is shown that there are correlations between the
experimental and calculated characteristics of lead sulphide, selenide and telluride. The
influence of different isotopes of lead, sulphur, selenium and tellurium on the thermodynamic
parameters and the Raman spectra for the lead chalcogenides is shown.
1. Introduction
Lead chalcogenides compounds of PbS, PbSe, PbTe are narrow band-gap semiconductors used in
infrared detectors, thermoelectric devices and photoresistors. In spite of the fact that the electronic and
optical properties of lead chalcogenides were studied long ago and are rather well known, in these
materials they continue to reveal interesting properties. For example, PbSe semiconductors display
unusually high temperatures of continuous emission that are of great interest for engineering infra-red
lasers that work at room temperatures [1]. Data from recent research indicates that elements of high-
sensitivity receivers in the distant infra-red range (20–200 microns) based on lead alloy chalcogenides
can successfully compete with germanium and silicon [2]. Unlike those elements, lead chalcogenides
possess considerable radiation resistance caused by their high density, stabilizing Fermi's level.
Moreover lead chalcogenides are interesting as objects of research, namely studying the influence of
isotope composition of semi-conductor materials on their physical properties. Recently interesting
results in this direction were obtained in papers [3, 4].
Several attempts have been made to develop theoretical settlement models using various
approaches, in order to accurately reproduce the properties of lead chalcogenides. Previously,
geometrical, spectral and thermodynamic characteristics of sulphur and lead were calculated by
density functional method using various values of functionals and basic conditions, such as B3LYP
(GAUSSIAN), BP86 (ADF), GGA (FLAPW) [5].
The purpose of this work is the analysis of applicability of the theory of a functional of density to
an assessment of frequency shifts in Raman spectra and thermodynamic characteristics of
chalcogenides with various isotope compositions of lead, selenium and tellurium, and also an
elementary cell PbS, PbSе and PbTe.
REES-2015 IOP PublishingIOP Conf. Series: Materials Science and Engineering 112 (2016) 012022 doi:10.1088/1757-899X/112/1/012022
Content from this work may be used under the terms of the Creative Commons Attribution 3.0 licence. Any further distributionof this work must maintain attribution to the author(s) and the title of the work, journal citation and DOI.
Published under licence by IOP Publishing Ltd 1
2. Experimental part
For carrying out quantum and chemical calculations we used the standard software package
GAUSSIAN’03W [6]. Calculations were carried out using a hybrid method of a functional of density
of B3LYP, with an exchange functional to Becke В3 and a correlation functional Lee, Wang and Parr
(LYP) [7, 8]. This method is now generally accepted to be the best for describing thermodynamic
properties and vibrational spectra [9]. As a basic condition we used the SDD pseudopotential for an
atom of lead and the D95 double-dzeta as the basis for other atoms [10]. Calculated geometries of the
molecules were fully optimized; the absence of imaginary vibration frequencies confirmed the
stationary character of the structures. Energy calculations were corrected for zero-point vibrational
energy and reduced to normal conditions (298.15К, 1 atm) using thermal corrections to enthalpy and
free energy. We have also calculated the ADF'2004 (Amsterdam density functional) program [11]. The
OPTX exchange functional was used in combination with the PBE correlation functional using an all
electron triple- + polarization basis set of Slater orbitals (BP86/TZ2P+) [12]. To estimate the
enthalpy of formation the semi-empirical method PM3 was used [13].
All the above-stated calculations were carried out for compounds of PbS, PbSе and PbTe in the
gaseous phase. The calculations of electronic structure and characteristics of PbSb, PbSe and PbTe,
were in the crystalline state through the full-potential linear augmented plane wave method (code
WIEN2k [14]) with the generalized gradient approximation of exchange and correlation potential [15],
and full structural optimization. The density of electronic conditions was calculated by the method of
tetrahedrons [16]. In this case cubic monosulphide, monoselenide and monotelluride of lead PbS,
PbSe, PbTe (the B1 type, spatial group № 225, Fm-3m) with atomic coordinates: Pb (0; 0; 0) and S,
Se, Te (1/2; 1/2; 1/2) were used for calculations.
3. Results and discussion
To assess the "quality" of the calculations it is necessary to rely on some physico-chemical properties
of similar compounds, for which sufficiently accurate experimental values are known. As
experimental values, we used the bond lengths of compounds of lead, the frequency of stretching and
deformation vibrations in the IR spectra of two- and four-coordinated lead compounds, as well as the
band gap of crystalline halides, and the entropy and enthalpy of formation and dissociation energies of
compounds of lead in the gas phase (Table 1).
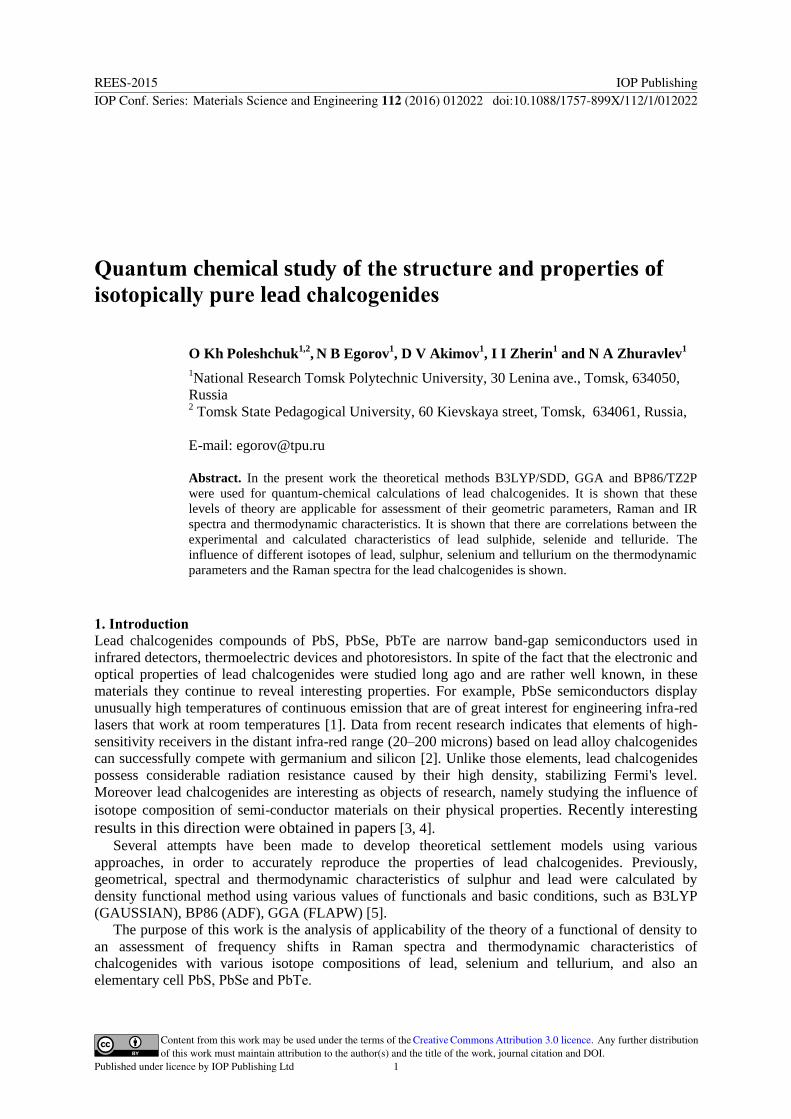
From the results of the calculation it follows that the valent angles of Hal-Pb-Hal optimized in the
GAUSSIAN program are close to the experimental values [10] (about 98–100 °), and the bond lengths
of Pb-Hal (Hal=F, Cl, Br, I, Me) Pb (II) and Pb (IV) compounds have a good correlation ratio (fig. 1).
Table 1. The calculated and experimental [12] enthalpy of formation (kJ/mol), entropy (J/molK),
dissociation energy (kJ/mol) of lead halides
Compound H, PM3 H, exp. S, calc. S, exp. -D, calc. -D, exp.
PbF2
PbCl2
PbBr2
PbI2
PbF4
PbCl4
PbBr4
PbI4
-375
-166
-119
-18
-617
-259
-109
56
-435.14
-174.05
-104.39
-3.18
-1133.45
-552.41
-456.36
-224.47
293
318
346
362
345
399
445
477
292.66
317.19
339.39
359.55
333.52
381.65
426.20
466.26
484
388
353
315
341
260
229
200
388
304
262
209
327
252
199
164
REES-2015 IOP PublishingIOP Conf. Series: Materials Science and Engineering 112 (2016) 012022 doi:10.1088/1757-899X/112/1/012022
2
Figure 1. The relationship between
experimental bond lengths of
compounds of Pb (II) and Pb (IV) and
those calculated by the B3LYP/SDD
method.
Figure 2. The relationship between
experimental IR-frequencies of lead
halides and those calculated by the
B3LYP/SDD method.
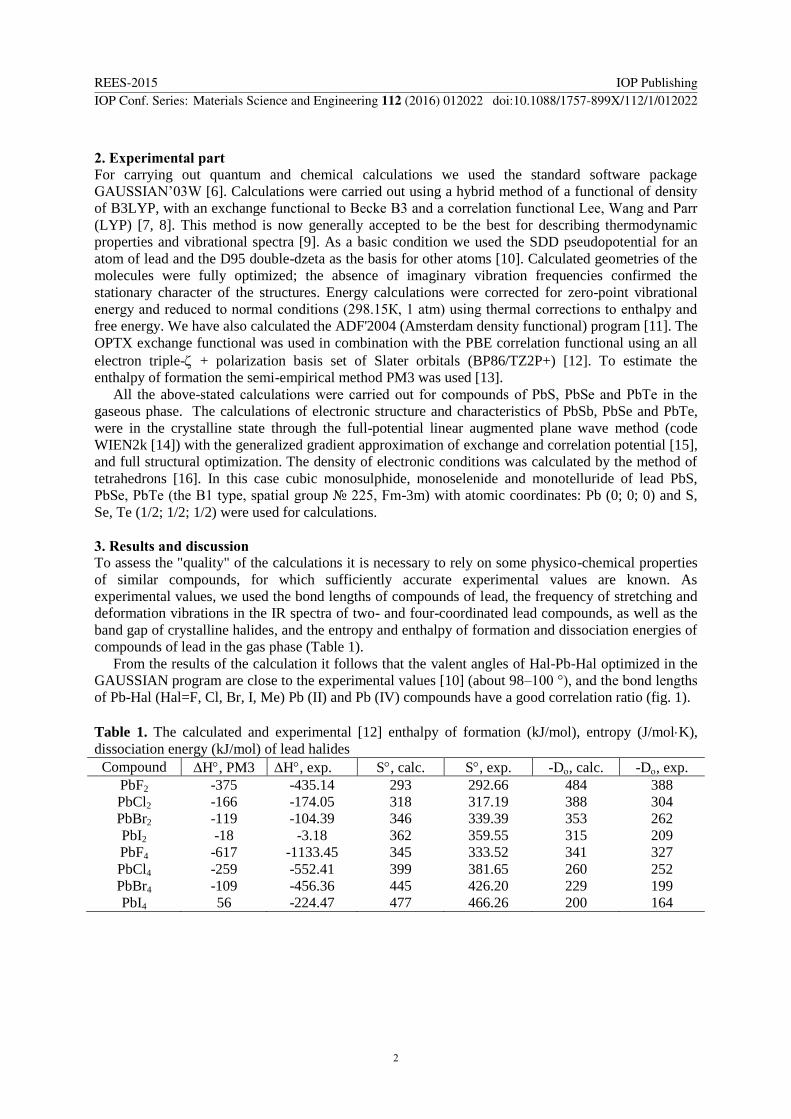
Figure 3. The relationship between experimental IR-frequencies of lead halides and those
calculated by the ADF method.
In addition, the frequencies calculated by the two methods of IR and Raman spectra of lead halides
are close to the experimental values (Fig. 2, 3) with a coefficient of correlation of 0.998 and a standard
deviation of 9 %.
We observed quite reliable linear correlation (1–8), which showed that the calculations for lead
halides by the PM3 and B3LYP/SDD methods correctly describe not only the geometry, but also the
thermodynamic parameters such as enthalpies (ΔH) and entropies (S) of formation, and the
dissociation energies (D0). The dissociation energy of the lead compounds was determined as the
difference between the energy of the compound and the energies of their constituent atoms, as
amended by the enthalpy of formation.
The calculated dissociation energy was related to the number of bonds, compared with the
experimental average binding energy of lead-halogen [15]. It should be noted that if the entropy falls
on the curve for compounds Pb (II) and Pb (IV), then the relationship between the calculated and
experimental enthalpies of formation and dissociation energies are observed separately for the
coordination of various lead compounds on the basis of the two methods of calculation GAUSSIAN
and ADF programs:
GAUSSIAN: S (exp.) = -23 + 0.914S (calc.) r = 0.996; s = 5; n = 8 (1)
ADF: S (exp.) = 10.6 + 0.97S (calc.) r = 0.998; s = 4; n = 7 (2)
REES-2015 IOP PublishingIOP Conf. Series: Materials Science and Engineering 112 (2016) 012022 doi:10.1088/1757-899X/112/1/012022
3
For Pb(II):
PM3: ΔH (exp.) = 29 +1.23 ΔH (calc.) r = 0.999; s = 12; n = 4 (3)
GAUSSIAN: D (exp.) = -108 +1.04 D (calc.) r = 0.993; s = 11; n = 4 (4)
ADF: D (exp.) = -44 +1.54 D (calc.) r = 0.990; s = 13; n = 4 (5)
For Pb(IV):
PM3: ΔH (exp.) = -289 +1,35 ΔH (calc.) r = 0.997; s = 35; n = 4 (6)
GAUSSIAN: D (exp.) = -62 +1.14 D (calc.) r = 0.992; s = 11; n = 4 (7)
ADF: D (exp.) = -28 +0.83 D (calc.) r = 0.986; s = 14; n = 4 (8)
Here and below, r - correlation coefficient, s - standard deviation, n - number of compounds.
The values of the energy distance between the occupied and unoccupied molecular orbitals
ΔE(B3MO-HCMO) calculated by both methods agree well with the band gap in crystalline chloride,
bromide and iodide of lead [17], with a coefficient of correlation 0.999 and a standard deviation of
0.02 eV.
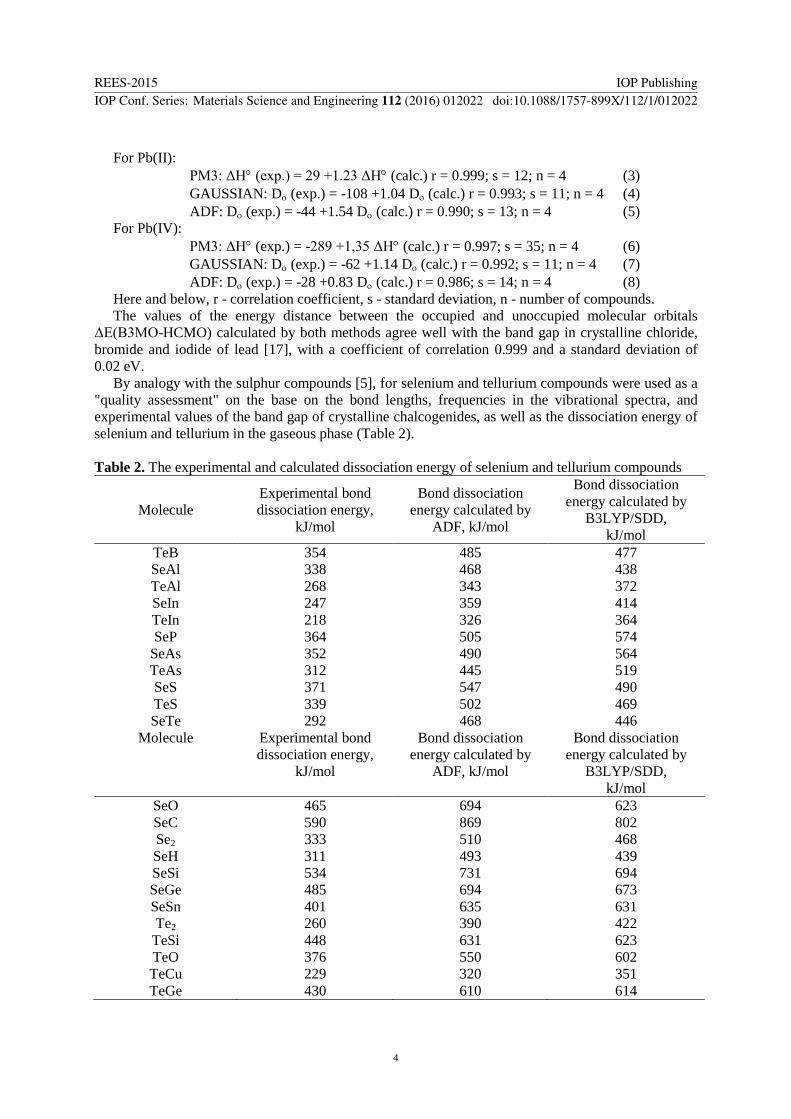
By analogy with the sulphur compounds [5], for selenium and tellurium compounds were used as a
"quality assessment" on the base on the bond lengths, frequencies in the vibrational spectra, and
experimental values of the band gap of crystalline chalcogenides, as well as the dissociation energy of
selenium and tellurium in the gaseous phase (Table 2).
Table 2. The experimental and calculated dissociation energy of selenium and tellurium compounds
Molecule
Experimental bond
dissociation energy,
kJ/mol
Bond dissociation
energy calculated by
ADF, kJ/mol
Bond dissociation
energy calculated by
B3LYP/SDD,
kJ/mol
TeB
SeAl
TeAl
SeIn
TeIn
SeP
SeAs
TeAs
SeS
TeS
SeTe
Molecule
354
338
268
247
218
364
352
312
371
339
292
Experimental bond
dissociation energy,
kJ/mol
485
468
343
359
326
505
490
445
547
502
468
Bond dissociation
energy calculated by
ADF, kJ/mol
477
438
372
414
364
574
564
519
490
469
446
Bond dissociation
energy calculated by
B3LYP/SDD,
kJ/mol
SeO
SeC
Se2
SeH
SeSi
SeGe
SeSn
Te2
TeSi
TeO
TeCu
TeGe
465
590
333
311
534
485
401
260
448
376
229
430
694
869
510
493
731
694
635
390
631
550
320
610
623
802
468
439
694
673
631
422
623
602
351
614
REES-2015 IOP PublishingIOP Conf. Series: Materials Science and Engineering 112 (2016) 012022 doi:10.1088/1757-899X/112/1/012022
4
On the other hand, the results of the calculations imply that bond lengths optimized by the
B3LYP/SDD method for the compounds of selenium and tellurium are proportional to the
experimental values [17], and there is a good correlation between them:
For selenium compounds
R(exp.) = 0.957 R(calc.) r = 0.995; s = 0.04; n = 18 (9)
For tellurium compounds
R(exp.) = 0.969 R(calc.) r = 0.993; s = 0.04; n = 10 (10)
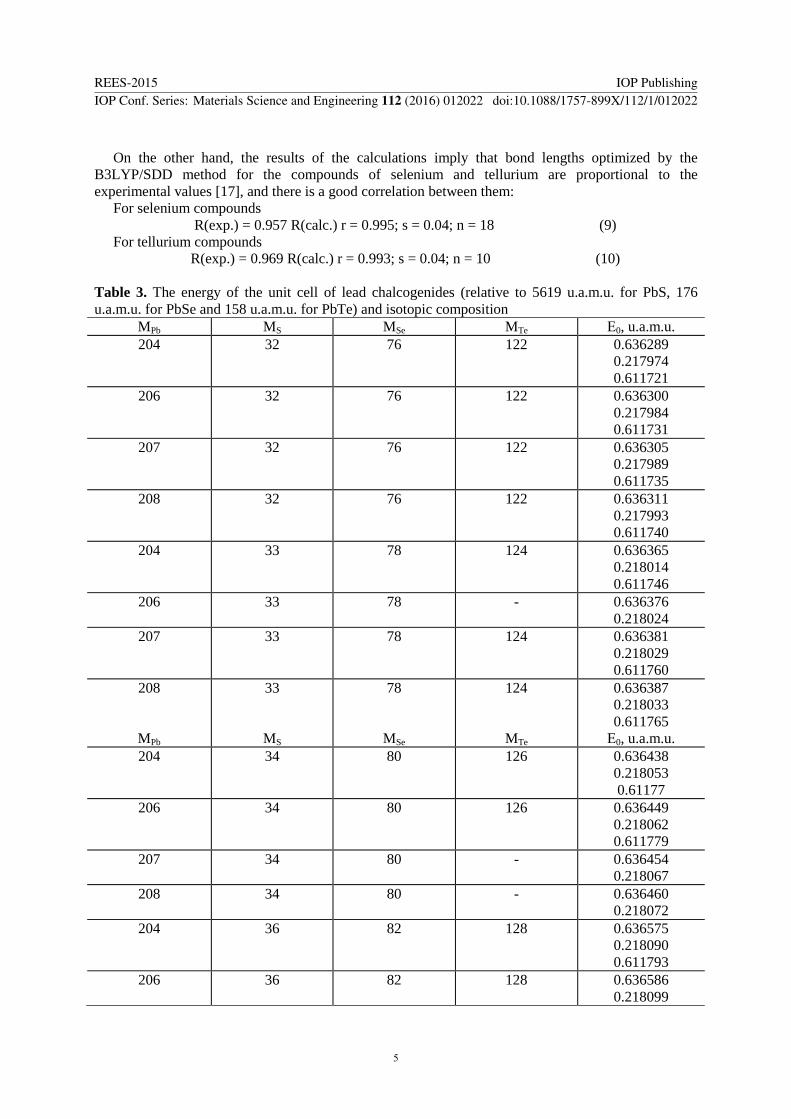
Table 3. The energy of the unit cell of lead chalcogenides (relative to 5619 u.a.m.u. for PbS, 176
u.a.m.u. for PbSe and 158 u.a.m.u. for PbTe) and isotopic composition
MPb MS MSe MTe Е0, u.a.m.u.
204 32 76 122 0.636289
0.217974
0.611721
206 32 76 122 0.636300
0.217984
0.611731
207 32 76 122 0.636305
0.217989
0.611735
208 32 76 122 0.636311
0.217993
0.611740
204 33 78 124 0.636365
0.218014
0.611746
206 33 78 - 0.636376
0.218024
207 33 78 124 0.636381
0.218029
0.611760
208
MPb
33
MS
78
MSe
124
MTe
0.636387
0.218033
0.611765
Е0, u.a.m.u.
204 34 80 126 0.636438
0.218053
0.61177
206 34 80 126 0.636449
0.218062
0.611779
207 34 80 - 0.636454
0.218067
208 34 80 - 0.636460
0.218072
204 36 82 128 0.636575
0.218090
0.611793
206 36 82 128 0.636586
0.218099
REES-2015 IOP PublishingIOP Conf. Series: Materials Science and Engineering 112 (2016) 012022 doi:10.1088/1757-899X/112/1/012022
5
0.611803
207
(204
for PbTe)
36 82 130 0.636591
0.218104
0.611816
208 36 82 - 0.636597
0.218109
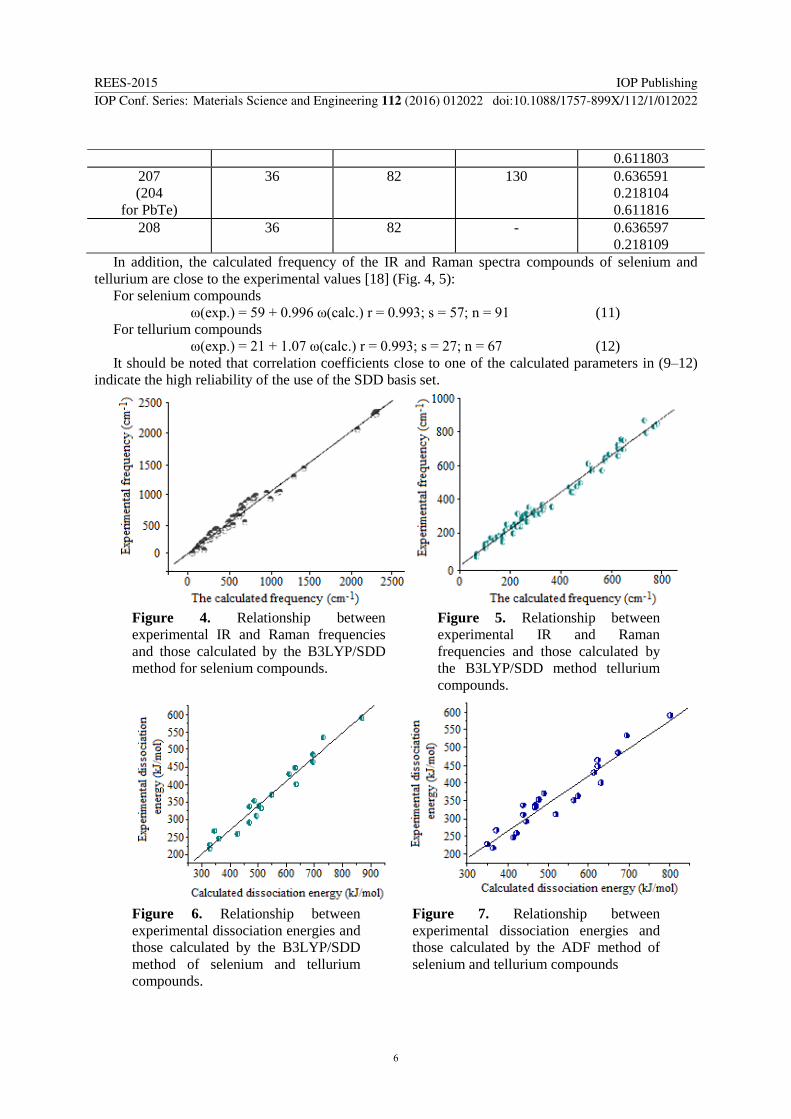
In addition, the calculated frequency of the IR and Raman spectra compounds of selenium and
tellurium are close to the experimental values [18] (Fig. 4, 5):
For selenium compounds
ω(exp.) = 59 + 0.996 ω(calc.) r = 0.993; s = 57; n = 91 (11)
For tellurium compounds
ω(exp.) = 21 + 1.07 ω(calc.) r = 0.993; s = 27; n = 67 (12)
It should be noted that correlation coefficients close to one of the calculated parameters in (9–12)
indicate the high reliability of the use of the SDD basis set.
Figure 4. Relationship between
experimental IR and Raman frequencies
and those calculated by the B3LYP/SDD
method for selenium compounds.
Figure 5. Relationship between
experimental IR and Raman
frequencies and those calculated by
the B3LYP/SDD method tellurium
compounds.
Figure 6. Relationship between
experimental dissociation energies and
those calculated by the B3LYP/SDD
method of selenium and tellurium
compounds.
Figure 7. Relationship between
experimental dissociation energies and
those calculated by the ADF method of
selenium and tellurium compounds
REES-2015 IOP PublishingIOP Conf. Series: Materials Science and Engineering 112 (2016) 012022 doi:10.1088/1757-899X/112/1/012022
6
We have also obtained quite reliable linear correlation (13 and 14), which suggests that the
calculations for compounds of selenium and tellurium by the B3LYP/SDD and BP86/TZ2P+ methods
correctly describe not only the geometry, but also the thermodynamic parameters, in particular the
dissociation energy (D0). The energy of dissociation of selenium and tellurium compounds was
determined as the difference between the energy of the compound and the energies of their constituent
atoms, as amended by the enthalpy of formation. The calculated dissociation energy, relative to the
number of bonds, was compared with the experimental average binding energy of selenium- selenium
and tellurium-tellurium [19] (Table 3).
As a result we obtained a correlation ratio based on the two methods of calculation using the
GAUSSIAN and ADF programs (Fig. 6, 7):
GAUSSIAN:
D (exp.) = -44 +0.77 D (calc.) r = 0.952; s = 30; n = 23 (13)
ADF:
D (exp.) = 6 +0.68 D (calc.) r = 0.982; s = 18; n = 23 (14)
On the basis of optimized structures for PbS, PbSe and PbTe in the gas phase, we have assessed
the effect of different isotopes of sulphur (32
S-34
S), selenium (76
Sе-82
Sе), tellurium (122
Те-130
Те) and
lead (204
PbS-208
Pb) on the spectral and thermodynamic parameters of lead chalcogenides. For the most
intense bands of lattice oscillations in the Raman spectra calculated by the B3LYP/SDD method: (~
120 cm-1
) for the lead sulphide; (~ 68 cm-1
) for lead selenide; and (~ 81 cm-1
) for lead telluride; we
obtained multiple correlation ratios between the calculated Raman frequencies (ω) and the masses of
the isotopes of lead, sulphur, selenium, and tellurium (MPb, MS, MSe, MTe):
ω= 167 – 0,26MS – 0,74MPb; r = 0.980; s = 0.2; n = 11 (15)
ω = 100 – 0,335MSе – 0,027MPb; r = 0.99996; s = 0.017; n = 16 (16)
ω = 121 – 0,25MТе – 0,044MPb; r = 0.999; s = 0.02; n = 12 (17)
For all chalcogenides the error of calculation does not exceed 0.02 %, indicating that the
calculation is correct. For lead chalcogenides we also obtained multiple correlations between the
energy of the unit cell PbS (Se) (Te) with a correction to the energy (E0) and the masses of the isotopes
of lead, sulphur, selenium and tellurium:
Е0 = 0.63 + 7.13·10-5
MS + 5.46·10-6
MPb;
r = 0.999; s = 2.96·10-6
; n = 16 (18)
Е0 = 0.216 + 1.925·10-5
MSе + 4.77·10-6
MPb;
r = 0.9997; s = 8.84·10-7
; n = 16 (19)
Е0 = 0.6 + 1.19·10-5
MТе + 4.77·10-6
MPb;
r = 0.9996; s = 6.46·10-7
; n = 12 (20)
A similar dependence is also observed for a lattice of four elemental isotopes of lead:
Е0 = -48.2 – 1.5·10-5
MPb; r = 0.995; s = 2.9·10-6
; n = 4 (21)
To further examine the effect of the isotopes on the physico-chemical properties, we performed
optimization of the unit cell of PbS, PbSe and PbTe using the PM3 method. The calculated bond
lengths for Pb-S, Pb-Se and Pb-Te totalled 3.5 Å, 3.57 Å and 3,45 Å, close to the experimental values
of 2.97 Å, 3.06 Å and 3.23 Å. It should be noted that our calculation using the FLAPW program for
crystalline PbS, PbSe and PbTe gave the best value of the lattice constants at 6.01 Å, 6.23 Å and 6.57
Å, close to the experimental values of 5.94 Å, 7.1 Å and 6.75 Å, respectively.
One of the most important characteristics of semiconductors is the value of the energy gap. The
calculation in the solid phase for PbS, PbSe and PbTe gave values of 0.5, 0.44 and 0.70 eV and in the
gas phase 0.38, 0.36 and 0.28 eV using the GAUSSIAN program. The experimental width of a single-
crystal PbS is 0.41 eV [17]. Thus, we can assume that the calculations for the gas phase and crystal
lead chalcogenides gave values fairly close to the experimental values for the energy characteristics.
Deviation of the calculated energy gap in gas phase from the FLAPW calculation for PbTe apparently
is due to the inaccuracy of the parameters for Te by the PM3 method.
REES-2015 IOP PublishingIOP Conf. Series: Materials Science and Engineering 112 (2016) 012022 doi:10.1088/1757-899X/112/1/012022
7
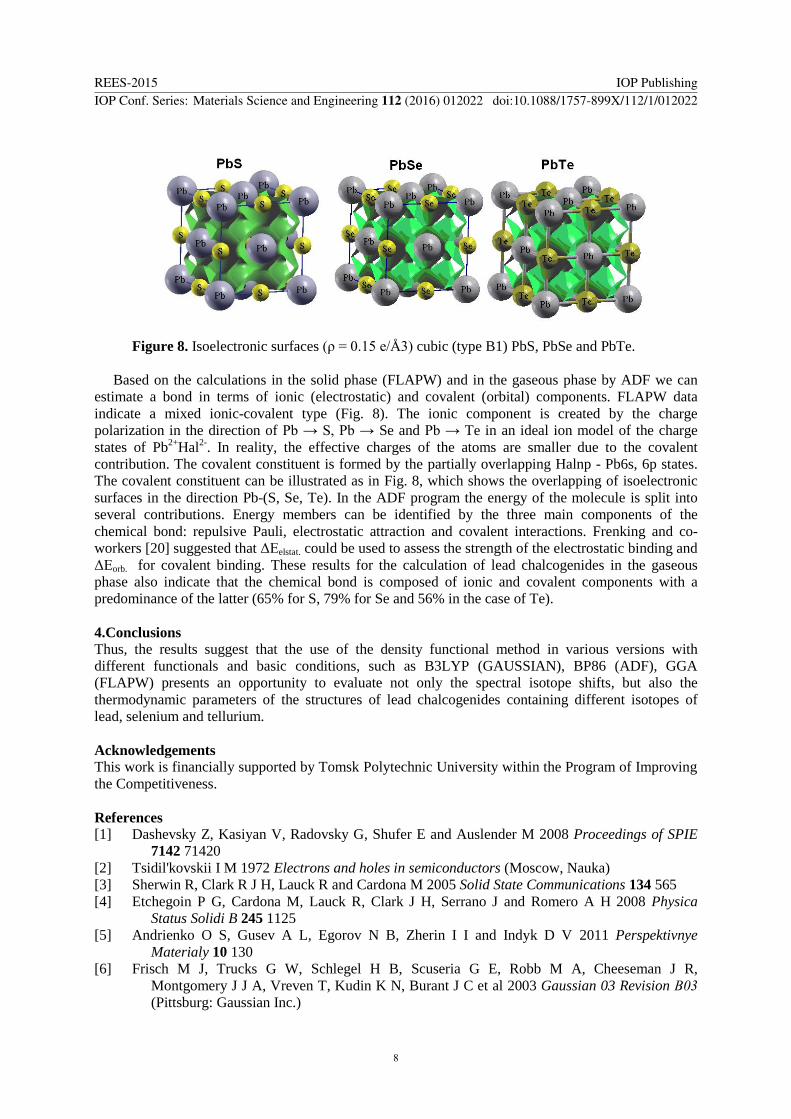
Figure 8. Isoelectronic surfaces (ρ = 0.15 e/Å3) cubic (type B1) PbS, PbSe and PbTe.
Based on the calculations in the solid phase (FLAPW) and in the gaseous phase by ADF we can
estimate a bond in terms of ionic (electrostatic) and covalent (orbital) components. FLAPW data
indicate a mixed ionic-covalent type (Fig. 8). The ionic component is created by the charge
polarization in the direction of Pb → S, Pb → Se and Pb → Te in an ideal ion model of the charge
states of Pb2+
Hal2-
. In reality, the effective charges of the atoms are smaller due to the covalent
contribution. The covalent constituent is formed by the partially overlapping Halnp - Pb6s, 6p states.
The covalent constituent can be illustrated as in Fig. 8, which shows the overlapping of isoelectronic
surfaces in the direction Pb-(S, Se, Te). In the ADF program the energy of the molecule is split into
several contributions. Energy members can be identified by the three main components of the
chemical bond: repulsive Pauli, electrostatic attraction and covalent interactions. Frenking and co-
workers [20] suggested that ΔEelstat. could be used to assess the strength of the electrostatic binding and
ΔEorb. for covalent binding. These results for the calculation of lead chalcogenides in the gaseous
phase also indicate that the chemical bond is composed of ionic and covalent components with a
predominance of the latter (65% for S, 79% for Se and 56% in the case of Te).
4.Conclusions
Thus, the results suggest that the use of the density functional method in various versions with
different functionals and basic conditions, such as B3LYP (GAUSSIAN), BP86 (ADF), GGA
(FLAPW) presents an opportunity to evaluate not only the spectral isotope shifts, but also the
thermodynamic parameters of the structures of lead chalcogenides containing different isotopes of
lead, selenium and tellurium.
Acknowledgements
This work is financially supported by Tomsk Polytechnic University within the Program of Improving
the Competitiveness.
References
[1] Dashevsky Z, Kasiyan V, Radovsky G, Shufer E and Auslender M 2008 Proceedings of SPIE
7142 71420
[2] Tsidil'kovskii I M 1972 Electrons and holes in semiconductors (Moscow, Nauka)
[3] Sherwin R, Clark R J H, Lauck R and Cardona M 2005 Solid State Communications 134 565
[4] Etchegoin P G, Cardona M, Lauck R, Clark J H, Serrano J and Romero A H 2008 Physica
Status Solidi B 245 1125
[5] Andrienko O S, Gusev A L, Egorov N B, Zherin I I and Indyk D V 2011 Perspektivnye
Materialy 10 130
[6] Frisch M J, Trucks G W, Schlegel H B, Scuseria G E, Robb M A, Cheeseman J R,
Montgomery J J A, Vreven T, Kudin K N, Burant J C et al 2003 Gaussian 03 Revision В03
(Pittsburg: Gaussian Inc.)
REES-2015 IOP PublishingIOP Conf. Series: Materials Science and Engineering 112 (2016) 012022 doi:10.1088/1757-899X/112/1/012022
8
[7] Becke A D 1993 Journal Chemical Physics 98 5648
[8] Lee C, Wang Y and Parr R G 1988 Physical Review 37 785
[9] Curtiss L A, Raghavachari K, Redfern P C and Pople J 1997 Journal Chemical Physics 106
1063
[10] Cao X Y and Dolg M 2002 Journal of Molecular Structure 581 139
[11] ADF2004.01. SCM. Theoretical Chemistry (Amsterdam: Vrije Universities)
[12] Velde G, Bickelhaupt F M, Baerends E J, Guerra C, Van Gisbergen S J A, Snijders J G and
Ziegler T 2001 J. Comput.Chem. 22 931
[13] Stewart J J P 1989 J. Comput. Chem. 10 209
[14] Blaha P, Schwarz K, Madsen G K H, Kvasnicka D and Luitz J 2001 WIEN2k, An Augmented
Plane Wave Plus Local Orbitals Program for Calculating Crystal Properties (Vienna:
Vienna University of Technology)
[15] Perdew J P, Burke K and Ernzerhof M 1996 Phys. Rev. Let. 77 3865
[16] Blochl P E, Jepsen O and Anderson O K 1994 Phys. Rev. B 49 16223
[17] Batsanov S S 2000 Structural Chemistry. Facts and Dependences (Moscow: Dialog-MGU)
[18] Nakamoto K 1997 Infrared and raman spectra of inorganic and coordination compounds part 1
(New York: Wiley)
[19] Linstrom P J and Mallard W G 2010 NIST Chemistry WebBook, NIST Standard Reference
Database Number 69 (Gaithersburg: National Institute of Standards and Technology)
[20] Frenking G, Wichmann K, Fronlich K, Loschen C, Lein M, Frunzke J and Rayon V M 2003
Coordination Chem. Rev. 55 23
REES-2015 IOP PublishingIOP Conf. Series: Materials Science and Engineering 112 (2016) 012022 doi:10.1088/1757-899X/112/1/012022
9


![Mixed Lead Halide Passivation of Quantum Dots · displays, and solar energy harvesting.[1–5] CQDs such as metal chalcogenides can be tuned to absorb short-wavelength infrared (IR)](https://img.pdfslide.us/doc/110x75/5fc400b9ffa70b0d2e602108/mixed-lead-halide-passivation-of-quantum-dots-displays-and-solar-energy-harvesting1a5.jpg)