Embed Size (px)
Citation preview

01.11.2011
QuantityWare
Working Paper
Temperature
corrections for biofuel
– mineral fuel/heating
oil mixtures
Which temperature correction
measurement standard can I
apply for my biofuel mixtures?

Biofuel temperature corrections 2/18
Notes
© Copyright 2011 QuantityWare GmbH. All rights reserved.
SAP, R/3, mySAP, mySAP.com, xApps, xApp, SAP NetWeaver, and other SAP products and services mentioned herein as well as their respective logos are trademarks or registered trademarks of SAP AG in Germany and in several other countries all over the world. All other product and service names mentioned are the trademarks of their respective companies.
Microsoft, Windows, SQL-Server, Powerpoint and Outlook are registered trademarks of Microsoft Corporation.
These materials and the information therein are subject to change without notice. These materials are provided by the company QuantityWare GmbH for informational purposes only. There is no implied representation or warranty of any kind, and QuantityWare GmbH shall not be liable for errors or omissions with respect to the materials provided. The only warranties for the products and services of QuantityWare GmbH are those set forth in the express warranty statements accompanying such products and services, if any. No statement within this document should be construed as constituting an additional warranty.

Biofuel temperature corrections 3/18
Contents
QUANTITYWARE WORKING PAPER ........................................................................................ 1
TEMPERATURE CORRECTIONS FOR BIOFUEL – MINERAL FUEL/HEATING OIL
MIXTURES .................................................................................................................................. 1
Notes .............................................................................................................................. 2
Contents ......................................................................................................................... 3
Introduction ..................................................................................................................... 4
Management Summary and Recommendations ............................................................. 5
Experimental Data Analysis – Details ............................................................................. 7
ASTM D1250 Table C – Details .....................................................................................16
References ....................................................................................................................18

Biofuel temperature corrections 4/18
Introduction
During the last decade, the blending of classic petroleum automotive fuel products such as
diesel and gasoline with so-called biofuels (ethanol, RME [Rape seed oil Methyl Ester], SME
[Soy bean oil Methyl Ester] etc.) has been increasingly enforced by various national regulatory
bodies. With respect to quantity conversion calculations and corrections for the effect of
temperature on such products, the oil industry is thus facing a new, complex challenge.
Apparently, there is a lack of global standardization regarding the treatment of such mixed
products, which is causing uncertainty within the oil industry.
In Germany, the PTB (Physikalisch-Technische Bundesanstalt) is investigating the temperature-
density behavior of such mixtures in order to validate legally required temperature conversions.
The first results of this high precision work were published to the public domain in 2010:
Temperature conversion of biofuel-mineral fuel mixtures and biofuel-heating oil mixtures.
Similar measurement series have also been executed by the Energy Institute (EI) in the UK.
The redefinition of currently existing measurement standards allowing the consideration of
biofuel mixtures with respect to temperature changes is still ongoing in various countries. In
order to provide “ad hoc” guidance for QuantityWare customers and other interested parties,
QuantityWare has prepared this working paper.

Biofuel temperature corrections 5/18
Management Summary and Recommendations
In this paper, we compare the PTB’s experimental data with the theoretical results obtained via
several different VCF (Volume Correction Factor)* calculation standard implementations.
Based on the detailed results of our comparison analysis, which we present in subsequent
chapters of this working paper, we recommend, largely also in agreement with / support from
the experts in the responsible German standardization group DIN-FAM, the following approach
in order to choose the relevant volume correction calculation standard:
Ask your national standardization organization which measurement standard should be
used for such mixed products
Confirm with your responsible governmental organization which measurement standard
shall be applied
If no guidance can be given from the above organizations, we recommend application of
ASTM D1250 “Table B” procedures for all biofuel(RME/SME) - heating oil/diesel
mixtures
If no guidance can be given from the above organizations, we recommend application of
ASTM D1250 “Table B” procedures for ethanol-gasoline mixtures with an ethanol
volume % content of 10% or less
If no guidance can be given from the above organizations, we recommend application of
ASTM D1250 “Table C” procedures for ethanol-gasoline mixtures with an ethanol
volume % content of 80% or higher
Alternatively, if you have laboratory measurement data similar to the data provided by
the PTB for your products, you may apply the ASTM D1250-04 calculation procedure
(“Table C”) to calculate your company specific thermal expansion coefficient for any
product. The pragmatic approach utilizing the ASTM D1250 “C Tables” has always
been possible, if buyer and seller agree.
* In 2004, ASTM D1250 replaced VCF with the expression CTL: Correction for the effect of Temperature on the Liquid

Biofuel temperature corrections 6/18
Example: For Gasohol, which the API defines as mixture of gasoline and 10 vol%
ethanol, the API recommends (as defined in the MPMS Chapter 11.1
documentation, page 13 [2]) utilization of a special application table (“C Table”) with
a thermal expansion coefficient at 60 °F of 714.34 10-6
°F-1
For ethanol-gasoline mixtures with ethanol content between 10% and 80%, no
experimental data is publically available. Here, application of ASTM D1250 “Table C” is
recommended as a “safe choice”
These recommendations consider the fact that ASTM D1250 calculation
software is readily available and known within the oil industry and thus
utilization for biofuel mixtures will lead to a minimum financial impact risk.
The definition of the thermal expansion coefficient is given in chapter “ASTM
D1250 Table C – Details”
The determination of a thermal expansion coefficient requires data samples of at least 10
data points as provided by the PTB in reference [1]. Once such data is available, the
determination of is a straightforward ASTM D1250-04 calculation method, which is also
included into QuantityWare BCP 10B. However, the industry will most likely require detailed
guidance on the numerical values of thermal expansion coefficients for common product
groups. Such guidance has been given by the API for gasohol (see example above). Although
QuantityWare presents results for thermal expansion coefficients based on the experimental
PTB data in this paper, no guidance can be given in this paper concerning the exact values to
be utilized for defined product groups. Such guidance requires additional data analysis and
standardization work of national or international standardization working groups, which is
published in updates of existing or new standard documents. It is anticipated that such values
will be included into volume counter calibrations and updates of currently existing
density/metering standards, as they become available. Finally, it shall be noted that new
constants are not only needed for updating the calibration of volume counters. They must also
be in line with corresponding offline measurement procedures in the laboratory.

Biofuel temperature corrections 7/18
Experimental Data Analysis – Details
The data presented in reference [1] provides experimentally obtained density values for
temperature data in the range of 0 °C to 50 °C (diesel mixtures) and -15 °C to 50 °C (gasoline
mixtures), in 5 °C increments for different gasoline and diesel/heating oil mixtures with biofuels.
Using a QuantityWare analysis tool, we calculate the theoretical densities for the given
temperature points, normalized to the experimentally determined base density at 15 °C, using
five different measurement standard models:
ASTM D1250-04, Table 54B
DIN 51757-11, Table 54B (essentially ASTM D1250-80 with “German Rounding” and
wider ranges)
ASTM D1250-04, Table 54C
DIN 51757-11, Table 54Y (essentially representing the ASTM D1250 exponential model
with two free parameters)
EN 14214 (biofuel-diesel/heating oil mixtures only) – linear model
The analysis tool is built on the proven QuantityWare BCP 10B implementation and conversion
group configuration – in global productive use within the industry.
Biofuel temperature corrections 8/18
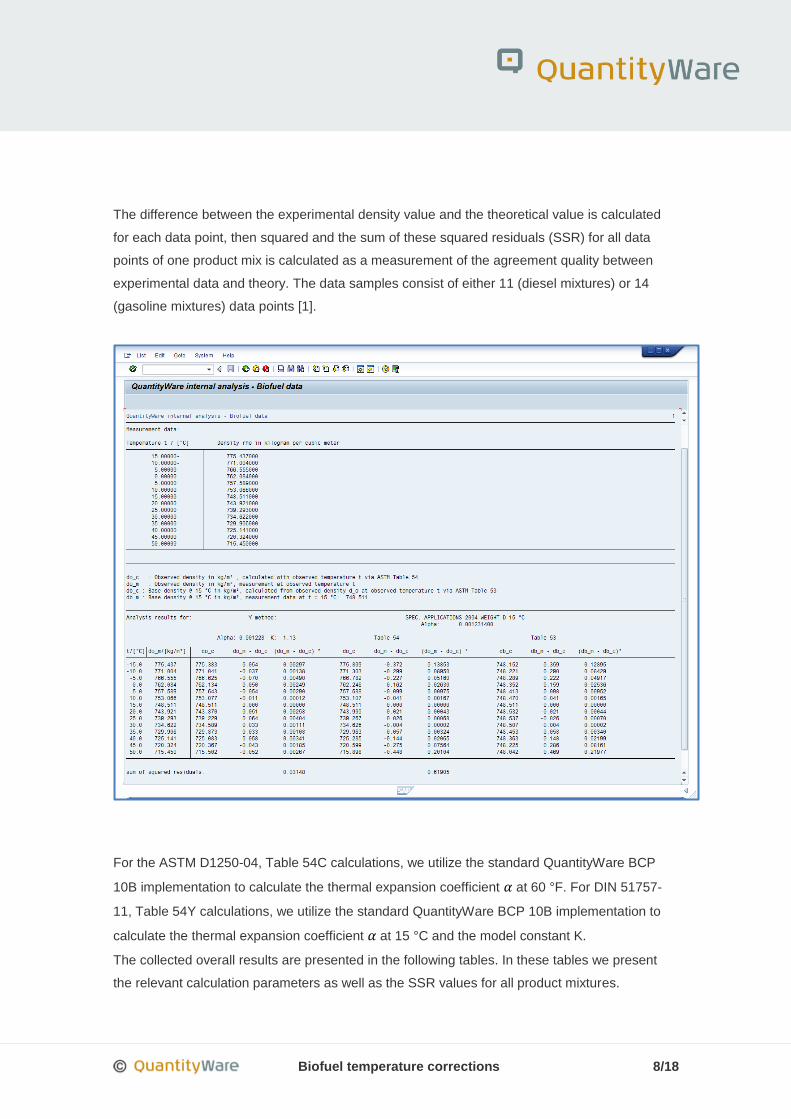
The difference between the experimental density value and the theoretical value is calculated
for each data point, then squared and the sum of these squared residuals (SSR) for all data
points of one product mix is calculated as a measurement of the agreement quality between
experimental data and theory. The data samples consist of either 11 (diesel mixtures) or 14
(gasoline mixtures) data points [1].
For the ASTM D1250-04, Table 54C calculations, we utilize the standard QuantityWare BCP
10B implementation to calculate the thermal expansion coefficient at 60 °F. For DIN 51757-
11, Table 54Y calculations, we utilize the standard QuantityWare BCP 10B implementation to
calculate the thermal expansion coefficient at 15 °C and the model constant K.
The collected overall results are presented in the following tables. In these tables we present
the relevant calculation parameters as well as the SSR values for all product mixtures.

Biofuel temperature corrections 9/18
PTB Product ID DIN 51757-11 54Y ASTM D1250-04
54C
DIN 51757
54B
ASTM D1250-04 54B
(15 °C) K SSR (60 °F) SSR SSR SSR
Product:
Table 1: Summer
Gasoline (Super) 0.001271 0.91 0.01 0.001218 0.09 0.09 0.11
Ethanol(E100) 0.001078 1.04 0.09 0.001080 0.09 70.01 68.34
E5 0.001231 1.11 0.03 0.001234 0.46 1.78 1.70
E10 0.001228 1.13 0.03 0.001231 0.62 2.79 2.84
E80 0.001115 1.07 0.05 0.001118 0.28 47.86 43.78
E85 0.001106 1.01 0.04 0.001109 0.21 59.88 63.25
Table 2: Winter
Gasoline (Super) 0.00124 0.93 0.02 0.001242 0.13 0.15 0.13
Ethanol(E100) 0.001079 0.88 0.04 0.001080 0.84 68.92 67.96
E5 0.001248 1.17 0.05 0.001251 0.52 2.41 2.06
E10 0.001248 1.12 0.04 0.001252 0.70 3.56 3.43
E80 0.001120 1.04 0.03 0.001123 0.28 34.13 30.00
E85 0.001111 0.95 0.07 0.001112 0.23 50.95 48.12
SSR: Sum of Squared Residuals in (kg/m³)² (15 °C) and (60 °F) in 1 / °C are the thermal expansion
coefficients calculated via the respective model function from the data samples
K is a dimensionless model constant
The “best fit” SSR value is highlighted with blue background color in the result
table, the “second best fit” SSR value is highlighted with light blue background
color.

Biofuel temperature corrections 10/18
PTB Product ID DIN 51757-11 54Y ASTM D1250-04
54C
DIN 51757
54B
ASTM D1250-04 54B
BS EN 14214
(15 °C) K SSR (60 °F) SSR SSR SSR SSR
Table 3:
Winter diesel 0.000853 0.68 0.01 0.000851 0.02 2.22 2.23 1.39
B100(RME) 0.000823 0.46 0.02 0.000818 0.05 2.19 2.19 0.06
B5(RME) 0.000854 0.40 0.01 0.000850 0.02 1.58 1.60 1.43
B7(RME) 0.000852 0.57 0.01 0.000849 0.02 1.32 1.38 1.22
B100(SME) 0.000826 0.37 0.02 0.000819 0.05 2.91 2.88 0.17
B5(SME) 0.000853 0.51 0.00 0.000850 0.02 1.55 1.58 1.40
B7(SME) 0.000853 0.45 0.01 0.000849 0.02 1.48 1.34 1.37
Table 4:
Summer diesel 0.000822 0.47 0.01 0.000819 0.03 1.27 1.17 3.22
B100(RME) 0.000825 0.20 0.01 0.000818 0.05 2.12 2.16 0.05
B5(RME) 0.000823 0.36 0.01 0.000819 0.03 1.14 0.91 3.04
B7(RME) 0.000821 0.61 0.01 0.000819 0.03 0.79 0.82 2.49
B100(SME) 0.000825 0.37 0.01 0.000819 0.05 2.86 2.81 0.14
B5(SME) 0.000824 0.44 0.01 0.000819 0.03 1.01 0.90 2.84
B7(SME) 0.000825 0.38 0.01 0.000819 0.03 0.79 0.79 2.51
Table 5:
Heating oil 0.000834 0.60 0.01 0.000831 0.02 1.20 1.50 2.39
B10(RME) 0.000834 0.49 0.01 0.000830 0.02 0.64 0.68 1.98
B20(RME) 0.000833 0.49 0.01 0.000829 0.03 0.33 0.32 1.51
B50(RME) 0.000828 0.48 0.01 0.000825 0.04 0.11 0.10 0.51
SSR: Sum of Squared Residuals in (kg/m³)² (15 °C) and (60 °F) in 1 / °C are the thermal expansion
coefficients calculated via the respective model function from the data samples
K is a second dimensionless model constant

Biofuel temperature corrections 11/18
In order to be able to interpret the SSR values, QuantityWare has analyzed the individual
theoretical and experimental value deviations carefully. The following tables provide a
classification of the SSR values listed above.
Gasoline data:
SSR/ (kg/m³)² Agreement: measurement - calculation
0.0 - 0.1 excellent
>0.1 - 0.5 very good
>0.5 - 2.0 good
>2.0 - 3.5 acceptable for temperatures at or below 40 °C
>3.5 - 5 acceptable for temperatures at or below 35 °C
> 5 not acceptable
Diesel data:
SSR/ (kg/m³)² Agreement: measurement - calculation
0.0 - 0.1 excellent
>0.1 - 0.3 very good
>0.3 – 1.0 good
>1.0 - 2.5 acceptable for temperatures at or below 40 °C
>2.5 - 4 acceptable for temperatures at or below 35 °C
> 4 not acceptable
These two classification matrices have been derived via a careful inspection of all 30 single
product data samples from reference [1], considering the following measurement accuracy
statements:
1) Assuming a statistically even distribution of deviations between measurement data
values and theoretical values, an SSR of e.g. 3.5 (kg/m³)² equals an average residual
for a single data point (11 / 14 data points) of 0.56 kg/m³ / 0.5 kg/m³.
However, all 30 data samples show that for temperatures above 30 °C,
deviations increase exponentially, such that the deviation below 35 °C is
typically 0.4 kg/m³ or less for SSR values below 3.5 (kg/m³)² .

Biofuel temperature corrections 12/18
2) The typical measurement accuracy (repeatability / reproducibility) of density data in the
field may spread globally - depending on the apparatus and method chosen - between
0.1 kg/m³ and 1 kg/m³.
3) The precision statement (95% confidence level) for VCF/CTL calculation values of
ASTM D1250 [2] at 100 °F (approx. 38 °C) is 0.05% , and at 150 °F (approx. 66 °C)
0.15%, which corresponds to absolute density calculation precisions - assuming a
base density of 800 kg/m³ - of approx. 0.4 kg/m³ (38 °C) to 1.2 kg/m³ (66 °C).
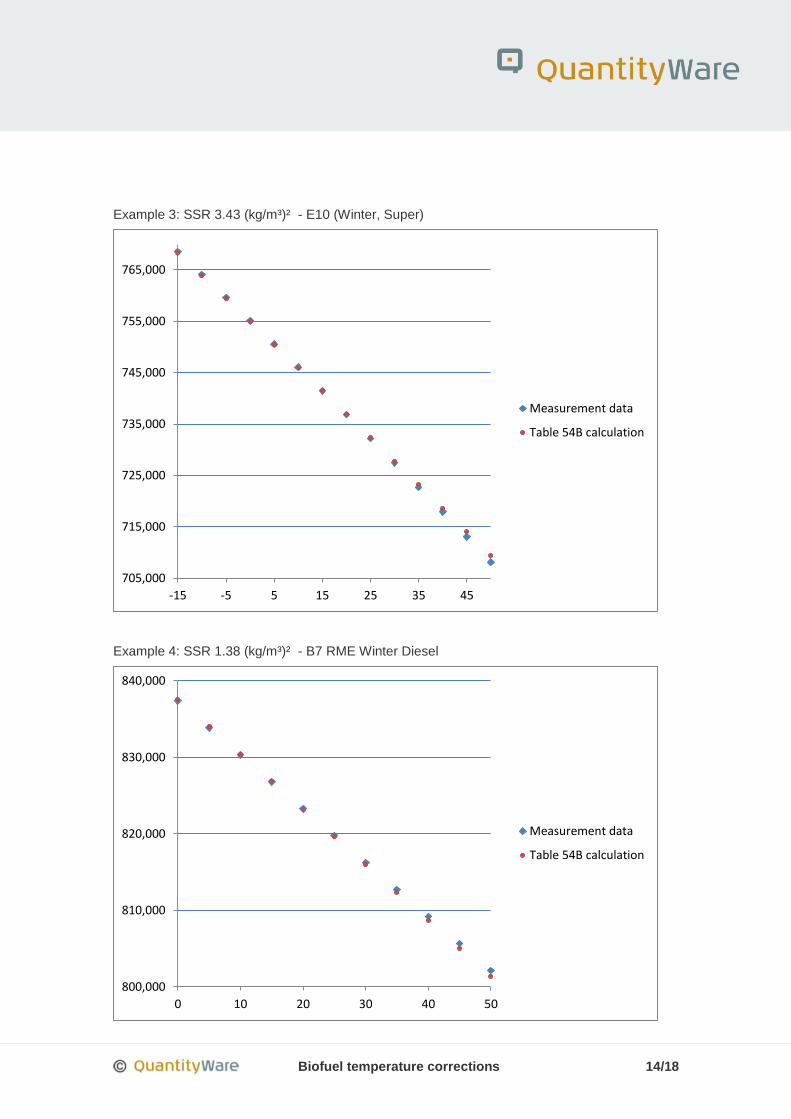
The following four examples provide a graphical representation of the experimental and
theoretical density values for selected data samples. Note that at 15 °C, the theoretical and
experimental values coincide, since the measured base density at 15°C has been taken as a
normalization reference point for the theoretical calculations. Each calculation requires the input
of a base density and an observed temperature, for which a volume correction factor (VCF/CTL)
is calculated. This volume correction factor is then used to calculate the density at observed
temperature. All four examples are ASTM D1250-04 Table 54B calculations.
With ASTM D1250-04, the table nomenclature (e.g. Table 54A, Table 6B, Table
54C …) has been replaced with implementation procedure names. Since many
industry experts are not aware of this and adhere to the “legacy” table
nomenclature, QuantityWare has decided to follow the “legacy” nomenclature in
this paper too.
In all four graphics on the next two pages, the y-axis shows the density values
in kg/m³, the x-axis the temperature values in °C.

Biofuel temperature corrections 13/18
Example 1: SSR 0.11 (kg/m³)² - Gasoline (Summer, Super)
Example 2: SSR 2.84 (kg/m³)² - E10 (Summer, Super)
710,000
720,000
730,000
740,000
750,000
760,000
770,000
-15 -5 5 15 25 35 45
Measurement data
Table 54B calculation
710,000
720,000
730,000
740,000
750,000
760,000
770,000
780,000
-15 -5 5 15 25 35 45
Measurement data
Table 54B calculation
Biofuel temperature corrections 14/18
Example 3: SSR 3.43 (kg/m³)² - E10 (Winter, Super)
Example 4: SSR 1.38 (kg/m³)² - B7 RME Winter Diesel
705,000
715,000
725,000
735,000
745,000
755,000
765,000
-15 -5 5 15 25 35 45
Measurement data
Table 54B calculation
800,000
810,000
820,000
830,000
840,000
0 10 20 30 40 50
Measurement data
Table 54B calculation

Biofuel temperature corrections 15/18
ASTM D1250 Table C calculations always provide a very good to excellent agreement between
measurement and calculation data. However, the determination of a product specific thermal
expansion coefficient requires more effort (laboratory analysis of sample data) compared to
density measurements, thus application of Table C calculations is not as wide-spread within the
industry.
Since DIN 51757-11 Table 54Y calculations are based on a theoretical model with two free
parameters, these results always provide an excellent agreement between measurement and
calculation data.
From an industry point of view, a recommendation concerning the usage of a measurement
standard for biofuel mixtures has to consider any additional effort that such a recommendation
may require. Thus, the guiding principles for our recommendation are:
“Keep it simple”. ASTM D1250 methods are already available, known and accepted
within the industry
If possible, utilize an ASTM D1250 Table B procedure – all required data (density and
temperature) is already known
If Table B procedures cannot be used, use ASTM D1250 Table C procedure, which
require knowledge of the thermal expansion coefficient – this introduces a minor effort
to existing software landscapes, since validated ASTM D1250 implementations already
contain Table C calculation methods
The recommendations in the “Management Summary and Recommendations”
chapter of this working paper have been derived based on the guiding
principles and detailed data presented in this chapter.

Biofuel temperature corrections 16/18
ASTM D1250 Table C – Details
In this chapter we provide a brief overview of the basic equation for temperature corrections of
crude oil and products, with a focus on the “C table” implementations for interested experts.
The fundamental equation for ASTM D1250 calculations has the following mathematical
expression:
where CTL (formerly known as VCF (volume correction factor)) is the correction factor for the
temperature of the liquid, t is the alternate temperature in °F, is the thermal expansion
coefficient at the base temperature of 60 °F in 1/°F and is the difference between the
alternate temperature and base temperature. is the product density at temperature t,
is the density of the product at 60 °F.
Once the thermal expansion coefficient at 60 °F is known for a product, the volume correction
factors can be calculated.
Since it is easier to measure a product density (either at base or any observed temperature),
additional equations have been defined - based on experimental data - to include product
specific calculation models to calculate the thermal expansion coefficient using the base
density of a product. If the density is not known at base temperature, the solution for this
equation is then found via mathematical iteration (ASTM D1250-04 utilizes a modern Newtonian
iteration scheme).
Thus, if oil companies utilize ASTM D1250 Table A, B or D calculations, software
implementations calculate the thermal expansion coefficient at the base temperature of 60 °F
based on “hard coded” product specific constants and additional equations and apply the above
noted fundamental equation. These constants have been derived from experimental data
collected and analyzed roughly between 1970 and 1980. The original developers of the ASTM
D1250 exponential model foresaw that future crude oil and products may show slightly different
thermal expansion behavior and included the Table C calculations into ASTM D1250, so that
companies would have the option to rely on ASTM D1250 Table C calculations for all products,

Biofuel temperature corrections 17/18
if they are willing to work with thermal expansion coefficients for well-defined product groups in
addition to (base) density values and temperatures.
What should also be noted is that the exponential ASTM D1250 model described in this chapter
can be rewritten as a linear equation (Taylor expansion of exponential function:
, considering only the first term, neglecting also the quadratic term of
):
(1 -
This approximation is valid for temperature deviations such that .This fact explains
why linear models may also be utilized to describe the thermal behavior of crude oil and
products, such as EN 14214. The producers of biofuel products have started to apply such
apparently simpler models in their calculations, which has unfortunately lead to uncertainty
within the industry. It is not the aim of this paper to favor either model, both approaches can be
justified; however, considering the fact that the oil industry has invested massive resource into
existing solutions, and that with the ASTM D1250 Table C approach, a universal and future
proof concept is already available and in use within the industry, the recommendations of this
paper are justifiable from both scientific and business standpoint.
If one replaces the constant factor of 0.8 in the fundamental equation above
and introduces a second model constant K, the DIN 51757-11 Table 54Y model
is defined, at base temperature of 15 °C
The overview above is also valid for base temperatures of 15 °C and 20 °C.
While ASTM D1250-80 introduced additional “hard coded” product specific
constants for these temperatures, ASTM D1250-04 internally always performs
calculations at 60 °F and converts results via soft conversions to other base
temperatures. Thus, ASTM D1250-04 Table C calculations always require a
thermal expansion coefficient at 60 °F (either in 1/°C or 1/°F)

Biofuel temperature corrections 18/18
References
[1]: Temperature conversion of biofuel-mineral fuel mixtures and biofuel-heating oil mixtures.
[2]: API MPMS Chapter 11.1, adjunct to ASTM D1250-04


![Petroleum ASTM D1250-04 SP12[1]](https://img.pdfslide.us/doc/110x75/54658f3cb4af9f3f3f8b4fe8/petroleum-astm-d1250-04-sp121.jpg)